

The Performance Analysis of a Novel Sterilizable Trombe Wall Based on the Combined Effect of Heat and UV Light
1
College of Urban Construction, Nanjing Tech University, Nanjing 210009, China
2
Department of Thermal Science and Energy Engineering, University of Science and Technology of China, Hefei 230026, China
*
Author to whom correspondence should be addressed.
Buildings 2024, 14(5), 1210; https://doi.org/10.3390/buildings14051210
Submission received: 28 February 2024
/
Revised: 8 April 2024
/
Accepted: 19 April 2024
/
Published: 24 April 2024
(This article belongs to the Special Issue Energy Efficiency and Sustainability in Construction and Building Materials)
Abstract
:A Trombe wall is a widely applied heating system that has a single function. An interesting thing is that both the solar heat and UV light received by a Trombe wall have an air sterilization effect. Here, the air sterilization and thermal performances of a Trombe wall in different cities were investigated based on an established heat and mass transfer model. The main results were as follows: (1) UV dose accumulation and high temperature were the most important factors that affect the UV and thermal sterilization performance, respectively. The Trombe wall had the thermal characteristics of high accumulation of UV doses in the morning and afternoon and a high temperature level at noon, which was a good match with the UV and thermal sterilization process. (2) A typical sterilization process in a Trombe wall was divided into three areas: the UV inactivation area, UV and thermal inactivation area and UV inactivation area. (3) The weather conditions played an important role in the sterilization performance. UV sterilization was dominant in cloudy weather, and thermal sterilization was dominant in sunny weather. (4) In Nanjing, Shanghai, Xining and Guangzhou, the average daily clean air volumes in heating months were 39.4, 33.5, 32.2 and 39.8 m3/m2, respectively. (5) When the wall height increased from 1.5 m to 3.5 m, the average daily clean air volume in heating months increased from 31.7 to 43.6 m3/m2.
1. Introduction
According to statistics, human beings spend more than 80% of their time indoors, and, thus, people have played more and more attention to the indoor air quality (IAQ) [1]. Based on the demand for energy saving, the airtightness of modern buildings is becoming more and more excellent [2,3]. Furthermore, the humid and warm environment in the buildings’ rooms can easily lead to the rapid growth of bacteria. The bacteria can load on the dust particles and water droplets and then form biological aerosols [4]. Indoor air pollution caused by indoor bacteria has become a major threat to people’s health [5]. Therefore, improving indoor air quality is an urgent problem in the building and environment field [6].
Thermal sterilization technology is realized via the process of the sterilization of bacteria under high-temperature conditions [7]. Thermal sterilization technology is a safe, effective, and environmentally friendly sterilization method [8,9]. Bacteria inhibit the self-repair ability of DNA and RNA at 45 °C [10]. When the ambient temperature is higher than 55 °C, the DNA of bacteria will be destroyed [11]. Jung et al. [12] took E. coli as the research object and exposed it to a high-temperature continuous stream for 0.3 s. The results showed that the sterilization ratio of E. coli increased with the increase in temperature: more than 99.9% of E. coli were inactivated at 160 °C, and the sterilization ratios of the bacteria at 60 °C and 80 °C were 60% and 80%, respectively. E. coli in bioaerosols were exposed to a continuous stream at 210 °C and could be completely inactivated in less than 1 s [13,14].
Ultraviolet (UV) sterilization technology is an efficient sterilization technology, and no pollutants are produced [15]. UV can effectively inactivate bacteria by disrupting DNA replication [16]. Many researchers have studied the effect of UV sterilization performance, as irradiation directly affects the efficiency of bacteria sterilization [17,18,19]. UV sterilization technology can be used in air conditioning systems. Mohamad [20] developed a computational fluid dynamics (CFD) model to simulate the air conditioning system in the spread of bacteria in the air; the performance of UV Germicidal Irradiation (UVGI) for bacteria removal in return air was analyzed. UV sterilization technology is also used in food. Nene et al. [21] simulated pulsed UV to inactivate bacteria on food, and the results showed that the pulsed UV light sterilization of microorganisms in poultry products showed a nonlinear trend. Elisa et al. [22] found that there was a synergistic effect when UV and thermal sterilization technologies were used together to remove bacteria. The temperature at which synergy reaches the maximum synergistic lethal effect and the magnitude of this effect vary between microorganisms and food substrates.
Trombe wall system inevitably possesses certain disadvantages, namely (1) low thermal resistance, which affects its energy efficiency [23]; (2) limited functionality, typically confined to heating and ventilation applications [24]; (3) the use of black paint to enhance the absorptivity of the wall surface, which results in aesthetically unpleasing walls [25]; and (4) excessive heat gain during summer and significant heat loss at night during winter [4]. Consequently, numerous studies have proposed enhancements to the traditional Trombe wall system [25,26,27,28]. They only made improvements to the thermal performance of the system. However, the Trombe wall serves as an effective receiver of solar light and heat, enabling efficient utilization for sterilization purposes [29]. Guo et al. [30] found, in their research, that the temperature difference between the air inlet and outlet of the Trombe wall was 35–45 °C. It was found that the temperature of the Trombe wall air channel can reach 50–80 °C [31,32]. It provides conditions for bacteria to be inactivated in the air passage. Consequently, we proposed a Trombe wall system combining thermal sterilization methods [33]. Through simulations involving five common indoor bacteria (E. coli, L. monocytogenes, L. plantarum, S. senftenberg and S. cerevisiae), our results demonstrated complete sterilization within one day. The total generated volume of clean air was 94.01, 86.51, 100.70, 94.95 and 100.10 m3/(m2·day). Thermal sterilization technology was applied to the PV–Trombe system, and a thermal sterilization PV–Trombe system was proposed [34]. The effect of battery coverage on the comprehensive performance of an air purification–sterilization-type PV–Trombe wall was investigated. With the increase in coverage, bacteria can gradually reduce the heat loss of activity.
The Trombe wall system can enable not only heat sterilization but also ultraviolet sterilization. The sunlight can be irradiated through the glass in the Trombe wall air passage to carry out the ultraviolet sterilization of the air in the flow passage. Our previous study did not consider the role of ultraviolet sterilization. Elisa et al. [22] discovered synergistic effects between thermal and UV sterilization techniques; its bactericidal effect is better than that of heat and UV combined. Therefore, this study innovatively explores combined UV–thermal sterilization using a Trombe wall. Conventional air purifiers and air conditioning systems, on one hand, consume a significant amount of electricity. On the other hand, they can produce pollutants that contribute to indoor secondary pollution. In contrast, the novel sterilizable Trombe Wall utilizes the combined effects of heat and UV light. The sterilizable Trombe Wall harnesses solar energy, eliminating the need for external power sources. Moreover, it offers multiple benefits, including sterilization and heating. This eco-friendly approach to air purification does not generate any pollutants during its operation and boasts a robust purification efficiency. By incorporating the sterilizable Trombe Wall into architectural designs, we can create sustainable and healthier living environments.
In this article, the main steps were the following: (1) established the system thermal and mass transfer model; (2) investigated UV sterilization, thermal sterilization and combined UV and thermal sterilization in different weather conditions in heating months in Nanjing; (3) investigated sterilization performances in different cities; and (4) discussed the influence of wall height on the sterilization performance.
2. System Descriptions
Figure 1 shows a schematic diagram of a novel sterilizable Trombe wall based on the combined effect of thermal and UV light. From the outdoor side to the indoor side, it is composed of a glass cover plate, an air flow path, an absorber layer, a heat storage wall and four vents. In the initial stage of system operation, the air temperature in the flow channel is low and the flow ratio is slow, at which time UV removal is dominant. With the increase in the air temperature in the flow passage, the air velocity increases, and UV and thermal sterilization work together. With the decrease in solar irradiation intensity, the thermal sterilization performance of the system gradually decreases, and UV sterilization plays a dominant role.
Under the condition of solar irradiation, UV can pass through the glass to the air channel; the bacteria in the air undergo ultraviolet irradiation, being exposed for a certain time; and ultraviolet sterilization occurs. Meanwhile, the air channel temperature increases gradually with solar irradiation. The black absorber coating can absorb most of the solar radiation energy, and the absorber coating temperature increases. The air temperature in the flow path is then increased. When the air temperature in the flow channel reaches the temperature at which the bacteria are inactivated, the system can perform thermal sterilization.
As shown in Figure 2, for the summer season, the upper and lower ventilation ports of the composite Trombe wall system are opened during daytime, while the ventilation ports on the interior side remain closed. As the sun’s rays impinge upon the wall, the outdoor air circulates through these ports, effectively sterilizing any bacteria present through a combination of heat and UV inactivation. At night, the upper ventilation port on the exterior side is opened, along with the lower ventilation port on the interior side. Buoyancy forces cause the warm indoor air to rise and exit through the exterior port, facilitating natural ventilation and reducing the load on the building’s cooling systems. This nocturnal exchange of air ensures that the indoor environment remains fresh and well ventilated throughout the summer months.
During the winter heating months, the upper and lower ventilation ports on the interior side are opened during the daytime. The black coating on the wall absorbs solar radiation, heating the air within the air flow channels. As the air is heated, it flows due to buoyancy, allowing warm air to enter the interior, thus providing heating and air circulation. Simultaneously, UV radiation penetrates the glass and irradiates the air within the channels, initiating the UV inactivation process. Concurrently, once the air temperature reaches the activation temperature for bacterial inactivation, thermal disinfection commences, fulfilling the purification function. At night or when solar radiation is low, the composite Trombe wall system operates in keeping-warm mode, with the indoor ventilation ports closed. The sealed channels provide continued warmth, reducing the load on the indoor heating system.
In the winter, due to the lower intensity of solar radiation, the temperature within the air flow channels is lower compared to summer, and so is the intensity of UV. Therefore, studying the purification and thermal performance of the sterilizable Trombe Wall during the winter heating season is of significant research interest. If the purification performance is good during winter, it can be expected to be even better in summer.
3. System Model and Performance Evaluation
As shown in Figure 3, the system’s heat and mass transfer model, thermal sterilization model and UV sterilization model were established. It can be seen from the system diagram that the heat transfer model of the system was mainly made of glass, an air flow channel, a thermal absorber coating and a heat storage wall. Before establishing the model, the following assumptions were made:
- (1)
- The heat transfer process of the glass cover plate could be considered to involve one-dimensional heat transfer, that is, only the heat transfer in the y direction was considered;
- (2)
- The convective heat transfer coefficient in the air flow channel was assumed to have a uniform distribution;
- (3)
- The thermophysical parameters used in the model were assumed to be constant;
- (4)
- There was no transmission loss of bacteria in the process.
3.1. Heat Transfer Model
For the glass part, only heat transfer in the height direction was considered; then, the heat transfer balance equation was as follows:
where T is the temperature/°C and h is the convective heat transfer coefficient W/(m2·K). And the subscripts g, ab, amb, s and a stand for the glass, the absorber layer, the ambient, the sky and the air, respectively. We then calculated the temperature of the sky according to the literature [35]. ρg is the density of the glass. cg is the specific heat capacity. δg is the thickness. λg is the thermal conductivity. αg is the absorptivity of glass to solar radiation.
Tsky is the temperature of the sky, and its expression in reference [35] is as follows:
where hamb,g and hsky,g are the convective heat transfer coefficient between the glass cover plate and the surrounding environment and the radiative heat transfer coefficient between the glass cover plate and the sky, and the expression is as follows:
where uamb is the wind velocity, εg is the emissivity and σ is the Stefan–Boltzmann constant.
For the temperature gradient of air flow channel only considers the height direction, and its governing equation is as follows:
where the subscripts a, ab and g stand for the air, absorber layer and glass, respectively.
λa, ρa and δa represent the thermal conductivity, density and thickness, respectively.
ua is the wind velocity, and it can be calculated via the following formula [25]:
where f is the resistance coefficient along the air passage, and the expression is as follows.
The convective heat transfer coefficient of the air passage is calculated according to the empirical formula of laminar flow and turbulent flow under the condition of natural convection of the vertical plate [36] as follows:
where Ra is the Rayleigh number, β is the coefficient of thermal expansion, α is the coefficient of thermal diffusion, ν is the dynamic viscosity and H is the height of the air passage.
For absorber coatings, the heat transfer model is as follows:
where R is the thermal resistance between the absorber layer and the environment.
For the heat storage wall, the heat transfer model is as follows:
The boundary conditions of the wall are as follows:
where the subscripts w and r stand for the wall and interior.
3.2. Mass Transfer Model
For bacterial sterilization, assuming that the mass transfer process in the air flow channel is one-dimensional, the mass equation can be expressed as follows:
The equation governing mass transfer in the air passage is as follows:
where r is the ratio of bacterial sterilization. For thermal and UV sterilization, the sterilization ratio is the sum of thermal sterilization ratio and UV sterilization ratio.
3.2.1. Thermal Sterilization Kinetic Model
3.2.2. UV Sterilization Kinetic Model
The Lambert–Beer law photochemical sterilization mechanical model can be used to reflect the UV sterilization properties of E. coli. Its expression is as follows:
where N(t) and N0 are the bacterial concentrations at the current moment and the previous moment, CFD/m3. I is the UV intensity, W/m2; is the time s for bacteria to stay under UV, s; and k is the UV sensitivity coefficient of E. coli.
We used the UV sterilization model with a wavelength of 200–280 nm, and the sensitivity coefficient of E. coli was 0.00154. Therefore, the model of the sterilization of Escherichia coli by UV light irradiation [40] is as follows:
The UV radiation dose decides whether the bacteria can be sterilized, and it can be determined based on the UV light intensity and exposure time [41] as follows:
The sterilization ratio of E. coli at a certain temperature can be calculated as follows:
3.3. Performance Evaluation
The system proposed above can provide warm and clean air indoors in winter. Regarding the system’s average thermal efficiency, it can pass from the initial to the final time and solar radiation heat gain points.
During the bacterial sterilization process, the system’s performance was evaluated using the single sterilization ratio and the clean air volume delivery ratio. The single inactivation ratio was determined by comparing the concentrations of bacteria at the inlet and outlet, while the clean air delivery rate (CADR) was calculated as the product of the single inactivation ratio and the air volume.
where Nin and Nout are the concentrations of bacteria at the inlet and outlet of the air passage. The volume of clean air produced can be calculated by CADR, m3/h.
The dimensions of the model are shown in Table 1.
3.4. Model Verification
As shown in Figure 4, we constructed an experimental testing system for the south facade at the University of Science and Technology of China. A list of experimental testing and monitoring equipment is provided in Table 2. The testing parameters included temperature, wind speed and vertical global solar radiation intensity. The temperature measurement points are indicated in Figure 4. Temperature data were recorded at 30-second intervals. An anemometer measured the air velocity inside the cavity every 10 min. The accuracy of the experimental measurement instruments is shown in Table 2. The experiment was conducted from 8:30 am to 4:30 pm on 12 February 2017 [31].
Through a series of experiments, we have evaluated the system’s performance in terms of space heating over the course of a day. The results indicate a maximum temperature difference of 16 °C between the inlet and outlet air temperatures within the channels. Additionally, the system’s instantaneous thermal efficiency typically ranges from 0.2 to 0.6. To validate the thermal model developed for this system, we compared the measured outlet air temperatures with the corresponding calculated values. The simulation data show good agreement with the experimental results for the majority of the time, thereby confirming the accuracy of the thermal model. The heat and mass transfer models established above have been verified, and the root mean square errors were 5.2% and 5.8%, respectively [31]. The thermal sterilization kinetic model and UV sterilization kinetic model are two crucial sub-models within the system model. The performances of both thermal sterilization and UV thermal sterilization are entirely dependent on the temperature and UV dose of the Trombe wall. The thermal sterilization kinetic model has been validated in the literature, with a fitting degree of 0.86 [39]. Similarly, the UV sterilization kinetic model has been experimentally verified in the literature, with a fitting degree of 0.98 [40]. The precision levels of both the thermal model and the mass transfer model ensure the applicability of the bacterial removal model, leading us to believe that the accuracy of our model is indeed good.
4. Results and Discussions
We acquired actual weather data from an official website. We utilized the meteorological parameters for sunny and cloudy weather during the heating months of the period from December 2022 to March 2023 in four cities. Based on the established model, the UV, thermal and UV and thermal inactivation performances of the Trombe wall were calculated separately. According to the national standard, the indoor air conditioning temperature in the winter heating months was set as 20 °C. The concentration of E. coli at the air duct inlet was 3000 CFD/m3, while the system operated for a duration of 7:00–16:00. For the heating months’ sunny days, the solar radiation intensity and outdoor temperature in Nanjing (December 15, January 30, February 20, March 28), Shanghai (December 12, January 11, February 28, March 6) and Xining (December 21, January 31, February 26, March 13) and Guangzhou (December 9, January 7, February 23, March 9) are shown in Figure 5. Moreover, the meteorological parameters of the cloudy weather in the heating months in Nanjing (December 8, January 9, February 16, March 14) are represented in Figure 5. Through numerical simulations, we investigated the performance of the system for various weather conditions, months, geographical locations and system heights. Subsequently, a comparative analysis was conducted to study the novel sterilizable Trombe wall, which utilized the combined effects of heat and UV light. This approach allowed us to evaluate the effectiveness of the proposed system in different scenarios and optimize its design for maximum performance.
4.1. Mechanism of UV and Thermal Sterilization in a Trombe Wall
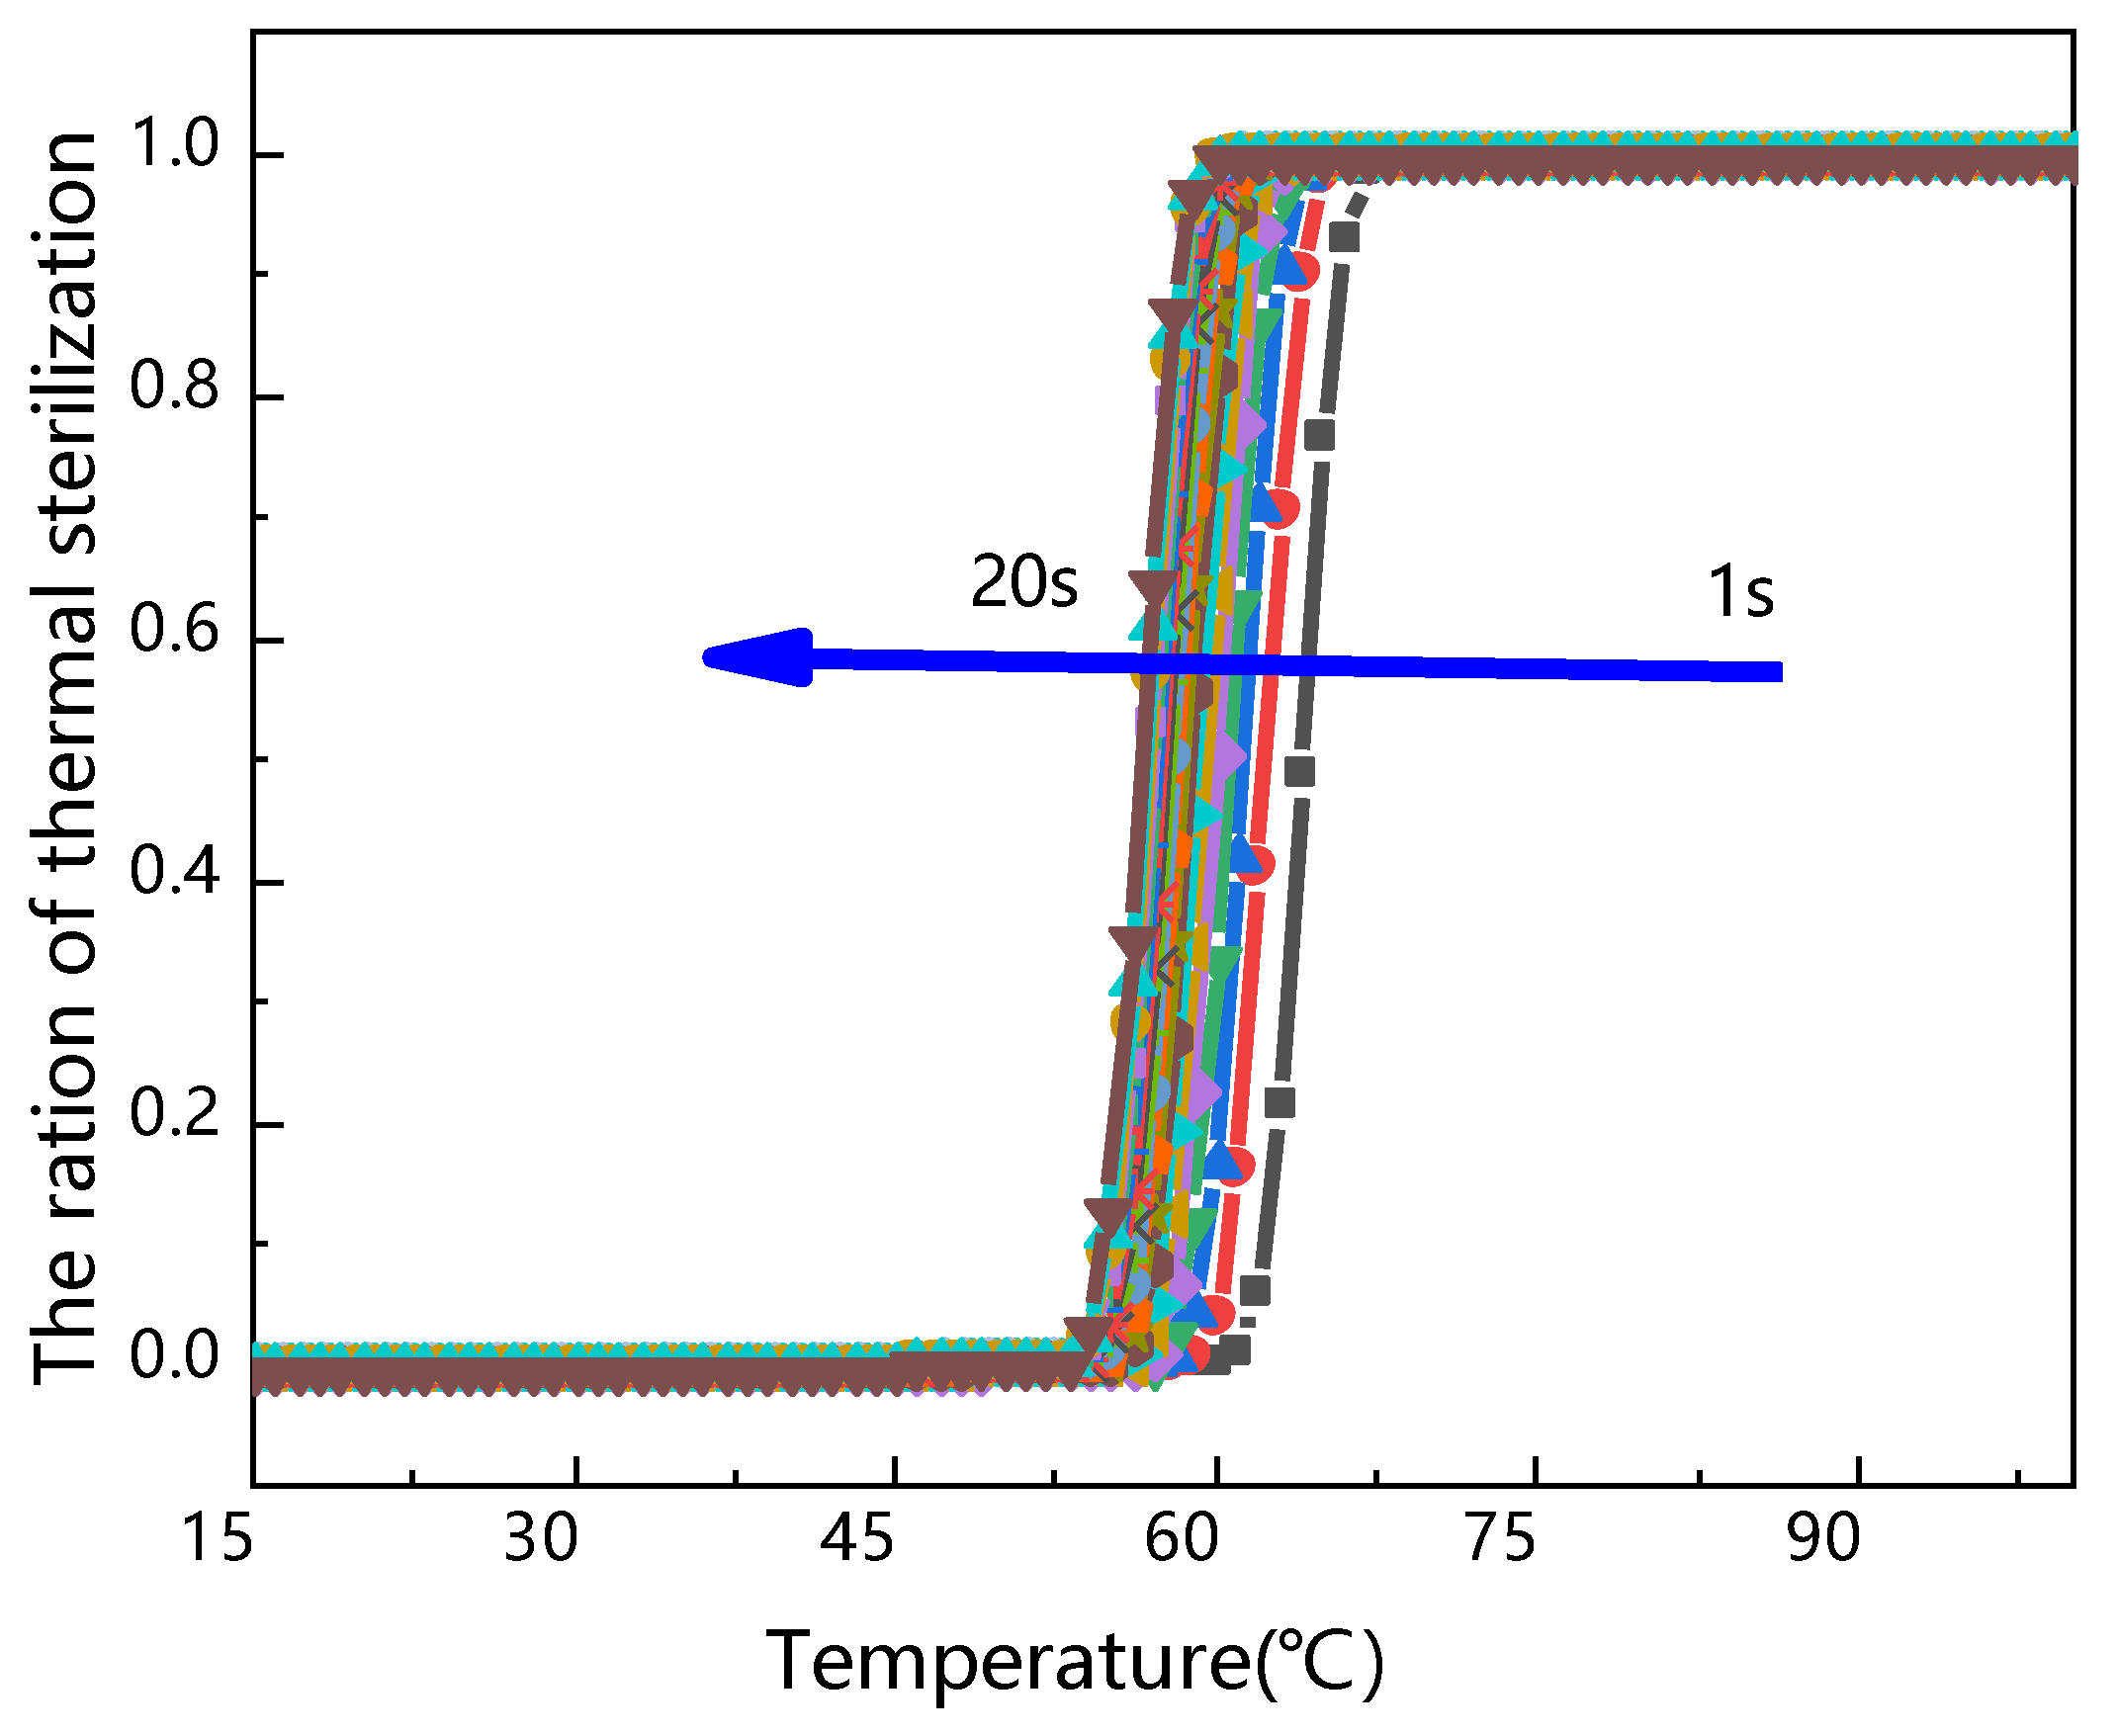
As shown in Figure 6, based on the kinetic model of thermal sterilization, we explored the sensitivity of the inactivation of E. coli to the temperature and residence time. The figure reveals that E. coli demonstrates a narrow temperature response range under residence times ranging from 1 to 20 s. The temperatures and residence times investigated are commonly attained within Trombe walls. E. coli remained viable when the temperature was below 50 °C; however, it was almost completely inactivated when the temperature exceeded 50 °C under any residence time between 1 and 20 s. In conclusion, the thermal inactivation of E. coli was more sensitive to the temperature level than to the residence time.
Also, based on the kinetic model of UV sterilization, we explored the sensitivity of the inactivation of E. coli to the UV light intensity and residence time, which is shown in Figure 7. From the plots, it becomes evident that the efficacy of UV inactivation against E. coli escalates in direct proportion to the augmentation of UV intensity. Remarkably, even at exceedingly low UV intensities, E. coli remains susceptible to inactivation. As the residence time increases, there is a pronounced upsurge in the UV inactivation ratio, which is inextricably linked to the intensity of the UV radiation. When subjected to a consistent UV intensity, the UV inactivation ratio undergoes a significant enhancement as the residence time is extended. In essence, the UV inactivation of E. coli exhibits a heightened sensitivity to both the intensity of the UV light and the duration of exposure, a concept collectively referred to as the UV dose.
By utilizing a kinetic model as a framework, an investigation was conducted to identify the factors influencing the bactericidal efficacy of UV and thermal treatments, including UV dose accumulation, residence time and temperature. Among these factors, UV dose accumulation emerged as the most crucial element affecting UV inactivation performance, while high temperature played a dominant role in thermal inactivation. The Trombe wall could effectively receive solar light and heat. Also, the Trombe wall had the thermal characteristics of high accumulation of the UV dose in the morning and afternoon and a high temperature level at noon, which had a good match with the UV and thermal sterilization process. In order to explore the mechanism of UV sterilization and thermal sterilization in the Trombe wall, the thermal performance of the Trombe wall on a sunny day in March in Nanjing was simulated.
Figure 8 shows the temperature, UV dose and residence time for the Trombe wall. In order to make the UV and thermal disinfection mechanism more obvious, we conducted numerical simulations using the meteorological parameters of a clear day in March in the Nanjing area (the average solar radiation intensity and outdoor temperature were 657.3 W/m2 and 18.6 °C, respectively). The air residence time in the flow channel gradually decreased at first and then increased gradually. In the UV response region, due to the low air flow ratio in the initial flow channel, Escherichia coli remained in the UV region for an extended period. Consequently, the UV dose received by E. coli increased rapidly. However, as the residence time shortened, the bactericidal effectiveness of UV diminished swiftly, and the UV dose plummeted. For thermal response region, in the morning and afternoon, the air temperature in the flow channel is low. The temperature is not high enough to inactivate E. coli. We named this part of the area as the low-temperature area. At noon, the air temperature in flow channel is higher, and we named this part as the high-temperature area.
Accordingly, Figure 9 shows the inactivation ratios under the conditions of the UV sterilization, thermal sterilization and UV and thermal sterilization processes, respectively. In the initial stage of system operation, the air temperature in the flow channel was low, and the flow rate was small. During the initial stage of system operation, the residence time was relatively substantial, ensuring that the UV dose was adequate. Consequently, the UV sterilization process played a dominant role. As the system operation progressed into the second stage, the air temperature within the flow channel rose, reaching the threshold temperature for thermal sterilization. Despite the shorter residence time, the thermal sterilization process now took precedence. Finally, as the decrease in solar radiation intensity occurs, the thermal sterilization performance gradually decreases, and the UV sterilization plays a dominant role. The sterilization process in the Trombe wall throughout the day revealed a “three-stage” sterilization mechanism. As shown in Figure 6, the sterilization process during the day was divided into three areas: the UV inactivation area, UV and thermal inactivation area and UV inactivation area.
4.2. Sterilization Performances in Different Weather Conditions
The weather parameters of sunny days in December, January, February and March were selected for numerical simulation. When the inlet of the air flow channel of the system is continuously introduced with a concentration of 3000 CFU/m3 of E. coli, the results were as shown Figure 10. In December, the thermal sterilization performance of the system was suboptimal. Interestingly, the UV sterilization performance curves exhibited similarities across all four months. In March, the average outdoor temperature reached 19.6 °C, and the mean solar irradiation intensity amounted to 657.3 W/m2. These values surpassed those recorded in the other three months, ultimately culminating in the system’s best thermal sterilization performance occurring during this period. In the numerical simulation of UV and thermal sterilization, the amounts of clean air produced on a sunny day in four months are 35.1, 63.5, 50.8 and 165.8 m3, respectively.
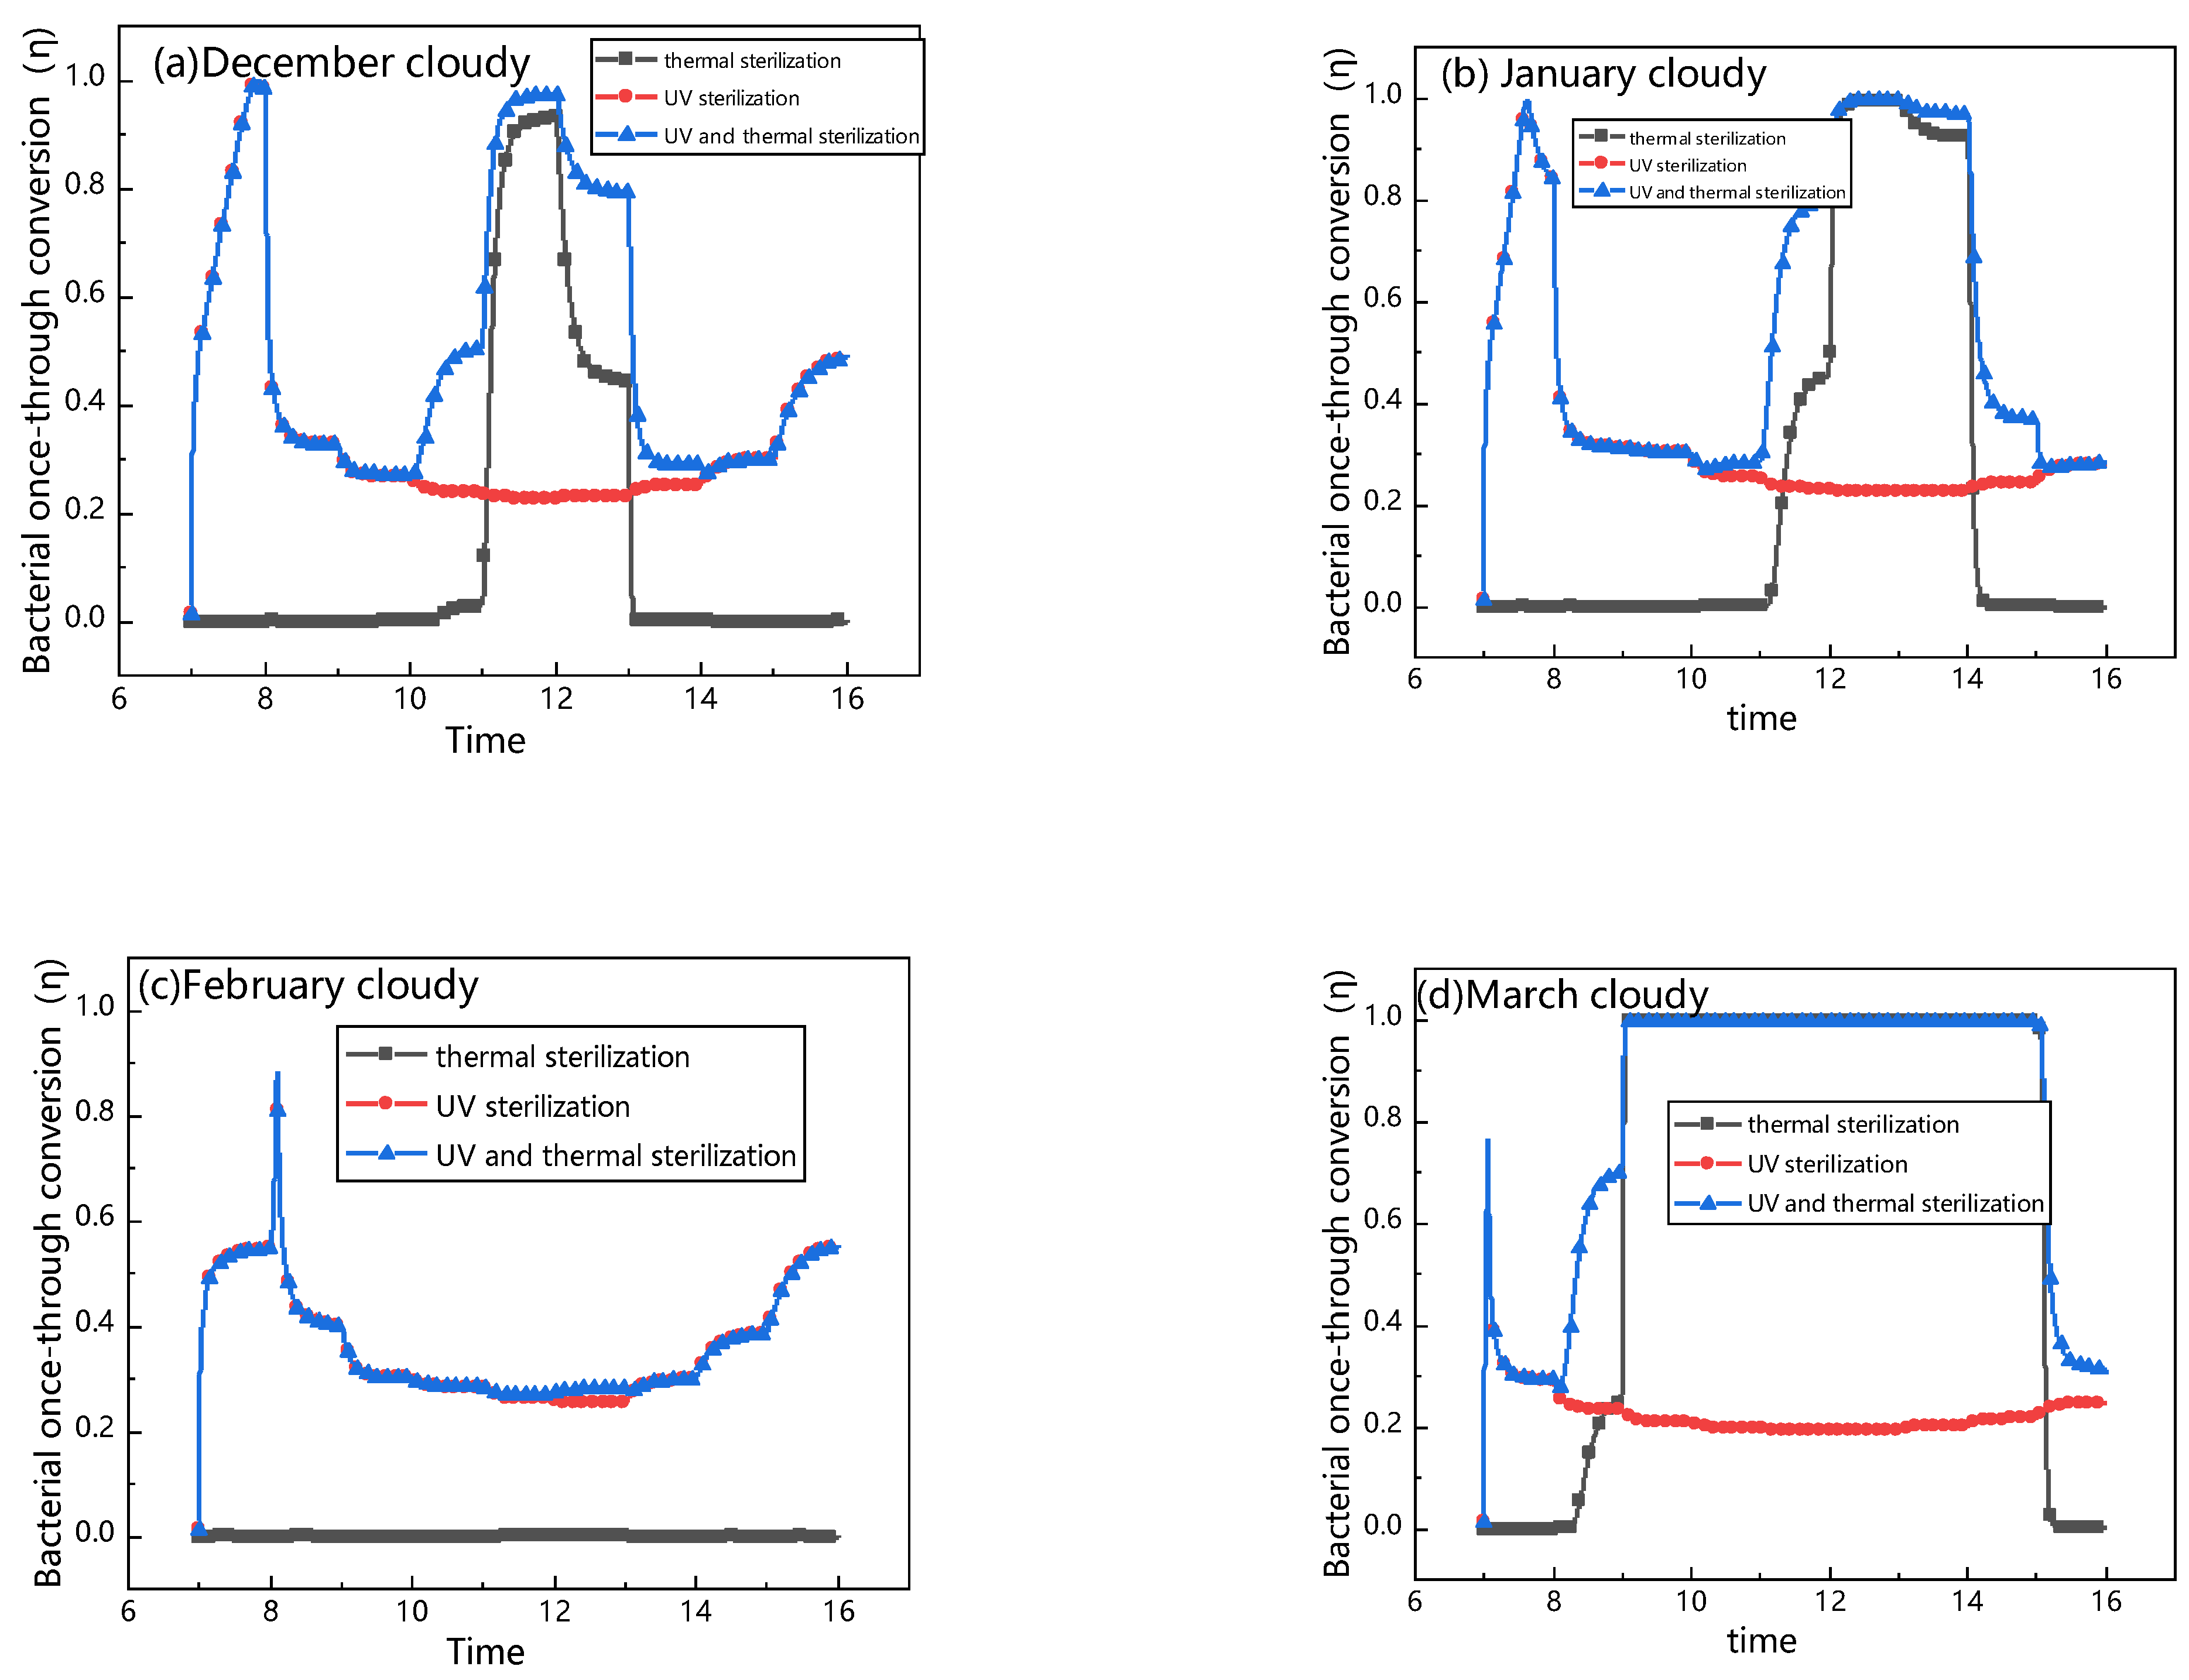
In the climatic conditions prevailing in Nanjing, overcast days account for more than half of each month. Nonetheless, the system wall still receives some sunlight even during cloudy weather. Consequently, we conducted an investigation into the bactericidal performance of the system under overcast conditions during the heating month in Nanjing. The best weather on cloudy days was recorded in March, as the average outdoor temperature was 20 °C and the average outdoor solar irradiation intensity was 634.3 W/m2. As can be seen from Figure 11, in December, January and February, the thermal sterilization performances of the system were poor. The CADR curve produced by the UV and thermal sterilization method almost coincided with the UV sterilization curve. In March, the thermal sterilization performance of the system surpassed that of UV sterilization. In the numerical simulation of the coupling of UV and thermal sterilization, for the cloudy weather in December, January, February and March, the volumes of clean air generated in one day were 36.2, 37.3, 33.2 and 161.6 m3, respectively.
Table 3 presents the key findings from the numerical simulation of the Nanjing city system operating using three sterilization methods. The results indicate that weather conditions have a significant impact on the thermal sterilization performance, while UV sterilization performance remains relatively unaffected. Specifically, the air flow rate within the system was slower during cloudy weather compared to sunny conditions. Despite this difference, the UV dosage received by E. coli in the air flow path remains consistent across different weather conditions. The thermal sterilization performance of the system was profoundly influenced by the outdoor temperature and solar irradiation intensity, regardless of whether it is a sunny or cloudy day. Higher outdoor temperatures and stronger solar irradiation lead to increased air temperatures within the flow channel, which, in turn, enhance the rate of sterilizing E. coli. These findings emphasize the importance of considering meteorological factors when optimizing the system’s design and operational parameters to achieve optimal sterilization efficiency.
4.3. Sterilization Performances in Different Cities
In order to explore the effect of geographical location on the bactericidal performance of the system, meteorological parameters of sunny heating months in Nanjing, Shanghai, Guangzhou and Xining were obtained and numerical simulation was carried out. The thermal and UV sterilization properties of the system were analyzed.
As shown in Figure 12, geographical location exerted a profound influence on the thermal performance of the system. Chief among these factors was the intensity of outdoor solar irradiation. The average outdoor solar radiation intensity values in Shanghai and Guangzhou in March were 570.1 and 434.2 W/m2. The external temperatures were 18.3 and 25.6 °C, respectively. Notwithstanding, the thermal sterilization performance of Shanghai markedly surpassed that of Guangzhou, with average daily sterilization ratios of 0.50 and 0.24, respectively. Secondly, the outdoor temperature affected the thermal sterilization performance. The solar radiation intensity values in Nanjing and Xining were 617.4 and 614.5 W/m2, respectively. The average outdoor temperatures were 18.3 and 8.67 °C. The daily bactericidal ratios in Nanjing and Xining were 0.57 and 0.47. Therefore, the greater the solar radiation intensity and outdoor temperature in the city, the better the thermal sterilization performance. In Nanjing, Shanghai, Xining and Guangzhou, the average daily clean air volumes in heating months were 39.4, 33.5, 32.2 and 39.8 m3/m2, respectively.
Additionally, we investigated the impacts of different cities on the UV sterilization performance of the system. As shown in Figure 13a, the average solar irradiation intensity values of Nanjing, Shanghai, Xining and Guangzhou were 320.6, 385.0, 339.5 and 396.8 W/m2, and the average outdoor temperatures were 10.0, 9.7, −3.2 and 18.5 °C, respectively. The average bactericidal ratios were 0.26, 0.23, 0.23 and 0.22, respectively. Despite the minor difference in outdoor temperatures between Nanjing and Shanghai, and the fact that solar radiation intensity in Nanjing was lower than that in Shanghai, the UV removal ratio in Nanjing was observed to be higher. Similarly, the difference in solar radiation intensity between Shanghai and Xining was insignificant, yet the outdoor temperature in Shanghai was significantly higher than that in Xining. Interestingly, the sterilization ratio remained the same for both cities. During the initial stage of system operation, it was found that the higher the solar irradiation intensity, the higher the UV sterilization ratio of the system. However, as the air in the flow channel absorbed solar energy, the residence time of the air in the channel decreased, leading to a gradual reduction in UV sterilization performance. Consequently, the system exhibited a better average UV sterilization performance under conditions of lower solar irradiation intensity and outdoor temperature. These findings highlight the importance of considering geographical factors when optimizing the design and operation of the system for maximum sterilization efficiency.
4.4. Effect of Wall Height on System Performance
Recognizing the limitations of the heating month system in Nanjing with respect to thermal sterilization performance, we sought to enhance its efficiency by increasing the system height from 2 to 3.5 m. Numerical simulations were conducted to evaluate the impact of this modification. Figure 14 illustrates that as the wall height increased, the system’s average thermal efficiency progressively improved. Furthermore, among the three sterilization methods (thermal sterilization, UV sterilization and UV and thermal sterilization), the volume of clean air produced by the system on sunny days showed a noticeable upward trend. These results confirm that elevating the wall height effectively boosts both the sterilization performance and thermal efficiency of the system, offering an effective strategy for optimizing its design and operation.
The enhancement in performance can primarily be attributed to the increased absorption of solar radiation by the taller wall, which, in turn, raises the air temperatures within the ducts. This improvement not only boosts the thermal sterilization efficiency but also enhances the overall thermal efficiency of the system. Furthermore, the extended retention time of bacteria within the higher-walled systems results in a higher UV dose being received by these microorganisms, thereby increasing the UV sterilization ratios. In March, the Trombe walls with combined heat and UV light effects were able to generate volumes of clean air ranging from 105.6 m3 to 215.4 m3 on sunny days; bacterial concentrations at duct exits decreased from 163.8 CFU/m3 to 412.9 CFU/m3, while the system’s thermal efficiency improved from 0.44 to 0.71.
For large spaces with glass curtain walls, the system’s wall height can be set to 3.5 m. However, for residential buildings in Nanjing, the national standard stipulates a maximum building height of 3.6 m. Therefore, most residents adopt a ventilated wall system with a wall height of 3 m to accommodate air duct vents. As shown in Figure 15, we investigated the performance of UV and thermal sterilization during cloudy weather in Nanjing and found that increasing the wall height to 3 m significantly improves sterilization performance, achieving a sterilization ratio up to the 100% maximum. When the wall height increased from 1.5 m to 3.5 m, the average daily clean air volume in heating months increased from 31.7 to 43.6 m3/m2. Nevertheless, during cloudy weather in February, we did not observe any significant improvement in thermal sterilization performance due to the low solar irradiation intensity. Consequently, the system primarily relied on UV sterilization for the slow-flowing air, highlighting the importance of incorporating thermal and UV sterilization methods to ensure comprehensive air purification under various weather conditions.
Table 4 presented the key findings from the numerical simulation of the Nanjing heating month system with a height of 3 m, comparing three different sterilization methods. The results indicate that increasing the system height from 2 to 3 m led to a significant improvement in the monthly volume of clean air produced by the system. This enhancement underscores the importance of optimizing system design, such as adjusting the height, to maximize its efficiency and effectiveness in providing clean air for the heating months. In terms of thermal sterilization performance, the system sterilization ratio was significantly improved, and the volumes of clean air produced in December, January, February and March were increased from 38.5, 86.4, 66.0 and 1808.2 m3 to 803, 1671.7, 388.4 and 2401.2 m3, respectively. For UV sterilization, the UV of the air in the flow channel was increased due to the elevation, so the sterilization performance was also improved. For December, January, February and March, when the height of the system was increased to 3 m, the monthly clean air volumes generated were 1.40, 1.42, 1.29 and 1.44 of the original system height of 2 m, respectively.
5. Conclusions
In order to solve the problem of the single function of the traditional Trombe wall system, a novel sterilizable Trombe wall based on the combined effect of heat and UV light was proposed based on our previous research on heat and UV light. A heat and mass transfer model was established and verified. The air sterilization and thermal performances of the traditional Trombe wall in different cities were studied. The main results were the following:
(1) Based on the kinetic model, the factors affecting the UV and thermal bactericidal performance were investigated, such as UV dose accumulation, residence time and temperature. The UV dose accumulation and high temperature were the most important factor that affect the UV and thermal sterilization performances, respectively. In contrast, the Trombe wall had the thermal characteristic of high accumulation of UV doses in the morning and afternoon and a high temperature level at noon, which had a good match with the UV and thermal sterilization process.
(2) The sterilization process in the Trombe wall throughout the day revealed a “three-stage” sterilization mechanism. The sterilization process during the day was divided into three areas: the UV inactivation area, UV and thermal inactivation area and UV inactivation area.
(3) The weather conditions played an important role in the sterilization performance. UV sterilization was dominant in cloudy weather, and thermal sterilization was dominant in sunny weather. In the sunny weather occurring during Nanjing’s heating months, the volumes of clean air generated via thermal and UV sterilization were 1.03, 1.86, 1.47 and 4.67 times those of UV sterilization. In the cloudy weather during Nanjing’s heating months, the thermal sterilization performance of the system was poor. The CADR curve for UV and thermal coupled sterilization almost coincides with the UV sterilization curve.
(4) Geographical location had a significant effect on the thermal performance of the system. The main influencing factors were the intensity of outdoor solar radiation and outdoor temperature. For different cities, namely Nanjing, Shanghai, Xining and Guangzhou, the average UV sterilization ratios were in March were 0.26, 0.23, 0.23 and 0.22, respectively. The average daily clean air volumes in heating months were 39.4, 33.5, 32.2 and 39.8 m3/m2, respectively.
(5) When the wall height increased from 1.5 m to 3.5 m, the amount of clean air produced by the system per month was greatly increased, and the system sterilization rate was significantly improved. The thermal efficiency improved from 0.44 to 0.71 and the average daily clean air volume in heating months increased from 31.7 to 43.6 m3/m2, respectively.
Author Contributions
Conceptualization, B.Y.; Methodology, N.L.; Formal analysis, N.L.; Data curation, M.F.; Writing—original draft, M.F.; Writing—review & editing, B.Y.; Supervision, N.L. and B.Y.; Funding acquisition, B.Y. All authors have read and agreed to the published version of the manuscript.
Funding
This study is supported by the National Natural Science Foundation of China (No. 52278111 and No. 52238004) and the Natural Science Foundation of Jiangsu Province (No. BK20221315).
Data Availability Statement
The original contributions presented in the study are included in the article, further inquiries can be directed to the corresponding authors.
Conflicts of Interest
The authors declare no conflict of interest.
Nomenclature
| A | area, m2 |
| c | specific heat capacity, J/(kg·K) |
| f | resistance factor |
| I | solar irradiance, W/m2 |
| H | height, m |
| h | heat transfer coefficient, W/(m2·K) |
| N | bacterial concentration, CFD/m3 |
| Nu | nusslet number |
| Q | volume flow rate, m3/s |
| Ra | Rayleigh number |
| r | sterilization ratio CFD/m3 |
| T | temperature, K |
| t | time, s |
| residence time, s | |
| u | air velocity, m/s |
| V | volume, m3 |
| E | UV radiation dose, J/m3 |
| Greeks | |
| ρ | density, kg/m3 |
| λ | thermal conductivity, W/(m·K) |
| σ | Stefan–Boltzmann constant, W/(m2·K4) |
| α | absorptivity |
| τ | residence time, s |
| η | bacterial once-through conversion |
| β | expansion coefficient, 1/K |
| Subscripts | |
| amb | ambient |
| g | glass cover |
| ab | absorber layer |
| sky | sky |
| a | air |
| w | thermal storage wall |
| r | room |
| in | inlet |
| out | outlet |
| UV | ultraviolet light |
| Abbreviation | |
| CADR | clean air delivery rate |
References
- Pei, J.; Qu, M.; Sun, L.; Wang, X.; Yin, Y. The relationship between indoor air quality (IAQ) and perceived air quality (PAQ)—A review and case analysis of Chinese residential environment. Energy Built Environ. 2022, 5, 230–243. [Google Scholar] [CrossRef]
- Zheng, H.; Long, E.; Cheng, Z.; Yang, Z.; Jia, Y. Experimental exploration on airtightness performance of residential buildings in the hot summer and cold winter zone in China. Build. Environ. 2022, 214, 108848. [Google Scholar] [CrossRef]
- Abdullatif, Y.M.; Sodiq, A.; Al-Ansari, T.; Nassar, N.N.; Amhamed, A.I. Optimizing chemisorption based direct air capture unit efficiency in HVAC systems: A study on the impact of DAC location and adsorption conditions as a response to the climate crisis and indoor air quality. Energy Convers. Manag. 2023, 291, 117280. [Google Scholar] [CrossRef]
- Liu, Z.; Ma, S.; Cao, G.; Meng, C.; He, B.-J. Distribution characteristics, growth, reproduction and transmission modes and control strategies for microbial contamination in HVAC systems: A literature review. Energy Build. 2018, 177, 77–95. [Google Scholar] [CrossRef]
- Paleologos, K.E.; Selim, M.Y.E.; Mohamed, A.-M.O. Chapter 8—Indoor air quality: Pollutants, health effects, and regulations. In Pollution Assessment for Sustainable Practices in Applied Sciences and Engineering; Mohamed, A.-M.O., Paleologos, E.K., Howari, F.M., Eds.; Butterworth-Heinemann: Oxford, UK, 2021; pp. 405–489. [Google Scholar] [CrossRef]
- Wei, G.; Yu, X.; Fang, L.; Wang, Q.; Tanaka, T.; Amano, K.; Yang, X. A review and comparison of the indoor air quality requirements in selected building standards and certifications. Build. Environ. 2022, 226, 109709. [Google Scholar] [CrossRef]
- Liu, Y.; Huo, C.; Wang, X.; Liu, D.; Liu, Y.; Wang, X.; Xu, C.; Li, M.; Lu, D.; Ren, R.; et al. Effects of high hydrostatic pressure sterilisation and thermal sterilisation combined with glutamine transaminase treatment on the properties of yoghurt. Int. Dairy J. 2024, 149, 105808. [Google Scholar] [CrossRef]
- Lewis, M. Chapter 22—Thermal processing: Pasteurisation and sterilisation. In Food Process Engineering Principles and Data; Lewis, M., Ed.; Woodhead Publishing: Sawston, UK, 2023; pp. 197–205. [Google Scholar] [CrossRef]
- Bharti, B.; Li, H.; Ren, Z.; Zhu, R.; Zhu, Z. Recent advances in sterilization and disinfection technology: A review. Chemosphere 2022, 308, 136404. [Google Scholar] [CrossRef] [PubMed]
- McGuigan, K.; Joyce, T.M.; Conroy, R.M.; Gillespie, J.; Elmore-Meegan, M. Solar disinfection of drinking water contained in transparent plastic bottles: Characterizing the bacterial inactivation process. J. Appl. Microbiol. 1998, 84, 1138–1148. [Google Scholar] [CrossRef] [PubMed]
- Jin, Y.; Wang, Y.; Huang, Q.; Zhu, L.; Cui, Y.; Cui, L. The performance and applicability study of a fixed photovoltaic-solar water disinfection system. Energy Convers. Manag. 2016, 123, 549–558. [Google Scholar] [CrossRef]
- Jung, J.H.; Lee, J.E.; Kim, S.S. Thermal effects on bacterial bioaerosols in continuous air flow. Sci. Total Environ. 2009, 407, 4723–4730. [Google Scholar] [CrossRef] [PubMed]
- Zhang, X.; Zhao, X.; Shen, J.; Hu, X.; Liu, X.; Xu, J. Design, fabrication and experimental study of a solar photovoltaic/loop-heat-pipe based heat pump system. Sol. Energy 2013, 97, 551–568. [Google Scholar] [CrossRef]
- Damit, B.; Wu, C.-Y.; Yao, M. Ultra-high temperature infrared disinfection of bioaerosols and relevant mechanisms. J. Aerosol Sci. 2013, 65, 88–100. [Google Scholar] [CrossRef]
- Li, X.; Cai, M.; Wang, L.; Niu, F.; Yang, D.; Zhang, G. Evaluation survey of microbial disinfection methods in UV-LED water treatment systems. Sci. Total Environ. 2019, 659, 1415–1427. [Google Scholar] [CrossRef] [PubMed]
- Wang, C.-P.; Liao, J.-Y. Effect of UV-C LED arrangement on the sterilization of Escherichia coli in planar water disinfection reactors. J. Water Process Eng. 2023, 56, 104399. [Google Scholar] [CrossRef]
- Hwang, G.B.; Jung, J.H.; Jeong, T.G.; Lee, B.U. Effect of hybrid UV-thermal energy stimuli on inactivation of S. epidermidis andB. subtilis bacterial bioaerosols. Sci. Total Environ. 2010, 408, 5903–5909. [Google Scholar] [CrossRef] [PubMed]
- Balamurugan, S.; Zaidi, M.; Arvaj, L.; Pendyala, B.; Gabriel, M.; Farber, J.M.; Sasges, M.; Patras, A. Modeling the UV-C Inactivation Kinetics and Determination of Fluence Required for Incremental Inactivation of Cronobacter spp. J. Food Prot. 2022, 85, 1625–1634. [Google Scholar] [CrossRef] [PubMed]
- Ye, S.; Li, Y.; Huang, H.; Xu, Y.; Du, S.; Wan, F.; Xie, R.; Huang, P.; Liu, B.; Dong, T.; et al. Fast and deep disinfection for face masks recycle using vacuum ultraviolet irradiation. J. Clean. Prod. 2022, 368, 133221. [Google Scholar] [CrossRef]
- Kanaan, M. CFD optimization of return air ratio and use of upper room UVGI in combined HVAC and heat recovery system. Case Stud. Therm. Eng. 2019, 15, 100535. [Google Scholar] [CrossRef]
- Keklik, N.M.; Demirci, A.; Puri, V.M.; Heinemann, P.H. Modeling the Inactivation of Salmonella Typhimurium, Listeria monocytogenes, and Salmonella Enteritidis on Poultry Products Exposed to Pulsed UV Light. J. Food Prot. 2012, 75, 281–288. [Google Scholar] [CrossRef] [PubMed]
- Gayán, E.; Serrano, M.J.; Álvarez, I.; Condón, S. Modeling optimal process conditions for UV-heat inactivation of foodborne pathogens in liquid foods. Food Microbiol. 2016, 60, 13–20. [Google Scholar] [CrossRef] [PubMed]
- Shen, J.; Lassue, S.; Zalewski, L.; Huang, D. Numerical study of classical and composite solar walls by TRNSYS. J. Therm. Sci. 2007, 16, 46–55. [Google Scholar] [CrossRef]
- Omrany, H.; Ghaffarianhoseini, A.; Ghaffarianhoseini, A.; Raahemifar, K.; Tookey, J. Application of passive wall systems for improving the energy efficiency in buildings: A comprehensive review. Renew. Sustain. Energy Rev. 2016, 62, 1252–1269. [Google Scholar] [CrossRef]
- Sun, W.; Ji, J.; Luo, C.; He, W. Performance of PV-Trombe wall in winter correlated with south façade design. Appl. Energy 2011, 88, 224–231. [Google Scholar] [CrossRef]
- Shen, J.; Lassue, S.; Zalewski, L.; Huang, D. Numerical study on thermal behavior of classical or composite Trombe solar walls. Energy Build. 2007, 39, 962–974. [Google Scholar] [CrossRef]
- Saadatian, O.; Sopian, K.; Lim, C.H.; Asim, N.; Sulaiman, M.Y. Trombe walls: A review of opportunities and challenges in research and development. Renew. Sustain. Energy Rev. 2012, 16, 6340–6351. [Google Scholar] [CrossRef]
- Tunç, M.; Uysal, M. Passive solar heating of buildings using a fluidized bed plus Trombe wall system. Appl. Energy 1991, 38, 199–213. [Google Scholar] [CrossRef]
- Yu, B.; Jiang, Q.; He, W.; Hu, Z.; Chen, H.; Ji, J.; Xu, G. The performance analysis of a novel TC-Trombe wall system in heating seasons. Energy Convers. Manag. 2018, 164, 242–261. [Google Scholar] [CrossRef]
- Guo, S.-R.; Jiang, X.-C.; Jia, Y.-H.; Xiang, M.-L.; Liao, Y.-X.; Zhang, W.-T.; Huang, R.-Y.; Long, E.-S. Experimental and numerical study on indoor thermal environment of solar Trombe walls with different air-channel thicknesses in plateau. Int. J. Therm. Sci. 2023, 193, 108469. [Google Scholar] [CrossRef]
- Yu, B.; He, W.; Li, N.; Wang, L.; Cai, J.; Chen, H.; Ji, J.; Xu, G. Experimental and numerical performance analysis of a TC-Trombe wall. Appl. Energy 2017, 206, 70–82. [Google Scholar] [CrossRef]
- Gu, W.; Li, G.; Xiermaimaiti, A.; Ma, T. A review of recent techniques in performance augmentation and evaluation metrics of Trombe walls. Energy Build. 2023, 301, 113693. [Google Scholar] [CrossRef]
- Yu, B.; Li, N.; Xie, H.; Ji, J. The performance analysis on a novel purification-cleaning trombe wall based on solar thermal sterilization and thermal catalytic principles. Energy 2021, 225, 120275. [Google Scholar] [CrossRef]
- Yu, B.; Li, N.; Yan, C.; Liu, X.; Liu, H.; Ji, J.; Xu, X. The comprehensive performance analysis on a novel high-performance air-purification-sterilization type PV-Trombe wall. Renew. Energy 2022, 182, 1201–1218. [Google Scholar] [CrossRef]
- Swinbank, W.C. Long-wave radiation from clear skies. Q. J. R. Meteorol. Soc. 1963, 89, 339–348. [Google Scholar] [CrossRef]
- Pakowski, Z. Fundamentals of Heat and Mass Transfer, Frank P Incropera, David P DeWitt, Theodore L Bergman, Adrienne S Lavine, J. Wiley & Sons, Hoboken NJ (2007), 997 pp. Chem. Eng. Res. Des. 2007, 85, 1683–1684. [Google Scholar] [CrossRef]
- Khalifa, A.J.N.; Marshall, R.H. Validation of heat transfer coefficients on interior building surfaces using a real-sized indoor test cell. Int. J. Heat Mass Transf. 1990, 33, 2219–2236. [Google Scholar] [CrossRef]
- Mastwijk, H.C.; Timmermans, R.A.H.; Van Boekel, M.A.J.S. The Gauss-Eyring model: A new thermodynamic model for biochemical and microbial inactivation kinetics. Food Chem. 2017, 237, 331–341. [Google Scholar] [CrossRef] [PubMed]
- Timmermans, R.A.H.; Mastwijk, H.C.; Nierop Groot, M.N.; Van Boekel, M.A.J.S. Evaluation of the Gauss-Eyring model to predict thermal inactivation of micro-organisms at short holding times. Int. J. Food Microbiol. 2017, 263, 47–60. [Google Scholar] [CrossRef] [PubMed]
- Wang, C.; Lu, S.; Zhang, Z. Inactivation of airborne bacteria using different UV sources: Performance modeling, energy utilization, and endotoxin degradation. Sci. Total Environ. 2019, 655, 787–795. [Google Scholar] [CrossRef] [PubMed]
- Pousty, D.; Hofmann, R.; Gerchman, Y.; Mamane, H. Wavelength-dependent time–dose reciprocity and stress mechanism for UV-LED disinfection of Escherichia coli. J. Photochem. Photobiol. B Biol. 2021, 217, 112129. [Google Scholar] [CrossRef] [PubMed]
Figure 1.
The sterilizable Trombe wall based on the combined effect of heat and UV light.

Figure 2.
The sterilizable Trombe wall running models in summer and winter. (The red color narrow is the direction of air flow).
Figure 2.
The sterilizable Trombe wall running models in summer and winter. (The red color narrow is the direction of air flow).
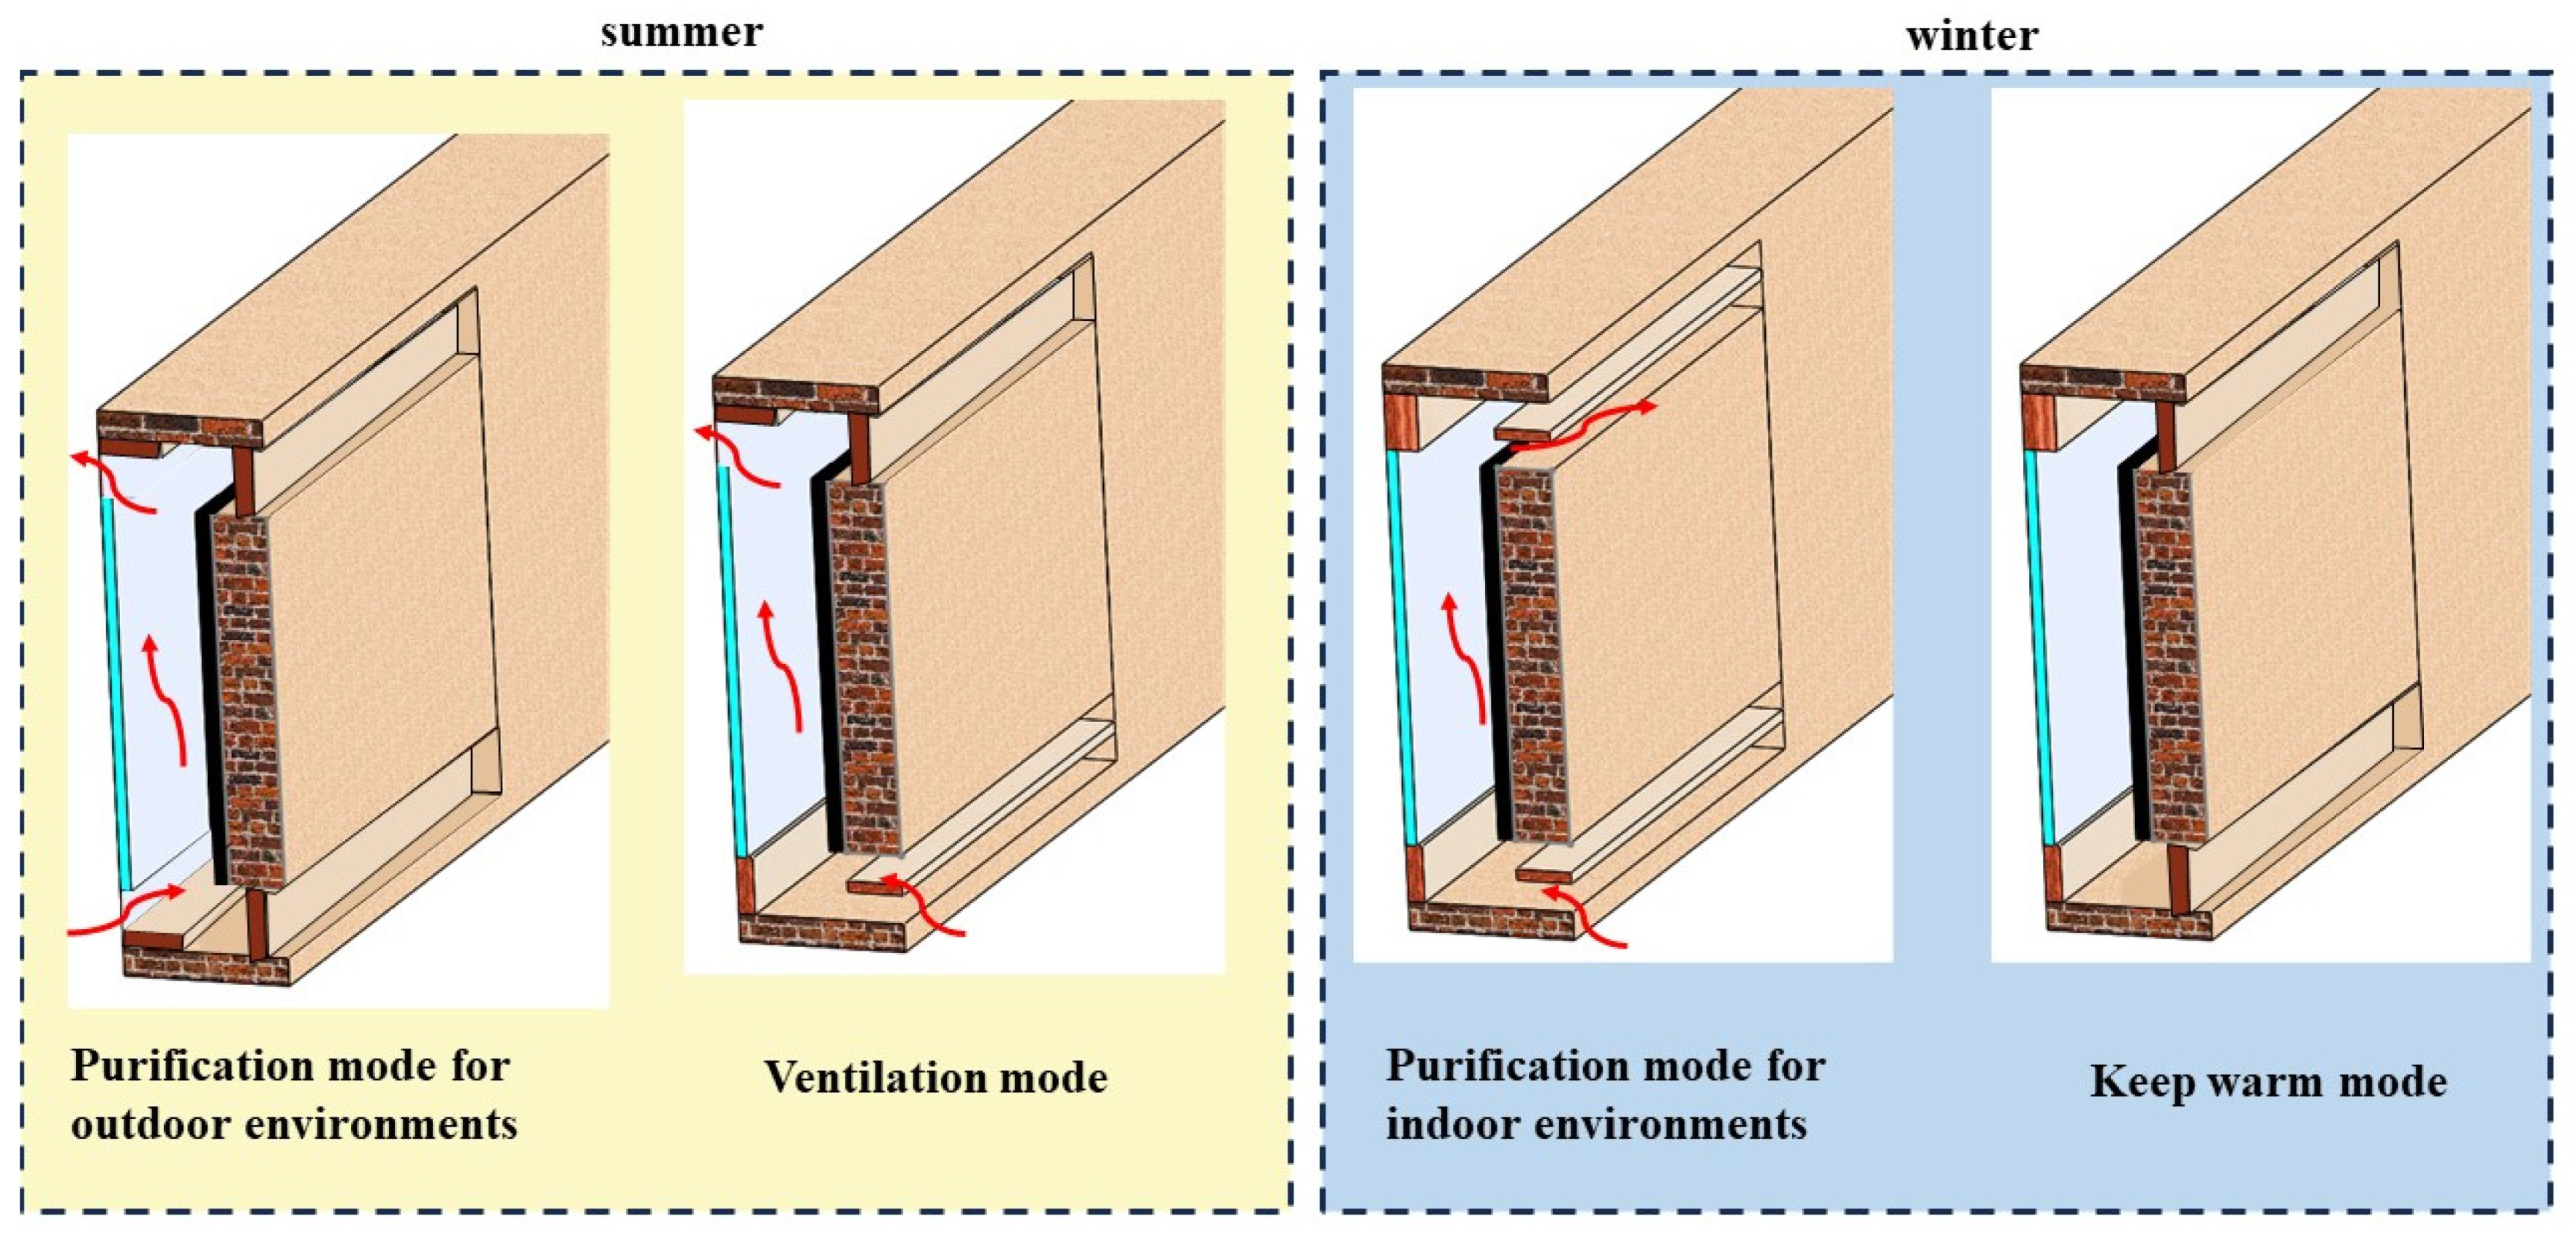
Figure 3.
Schematic of the sterilizable Trombe wall based on the combined effect of heat and UV light.
Figure 3.
Schematic of the sterilizable Trombe wall based on the combined effect of heat and UV light.
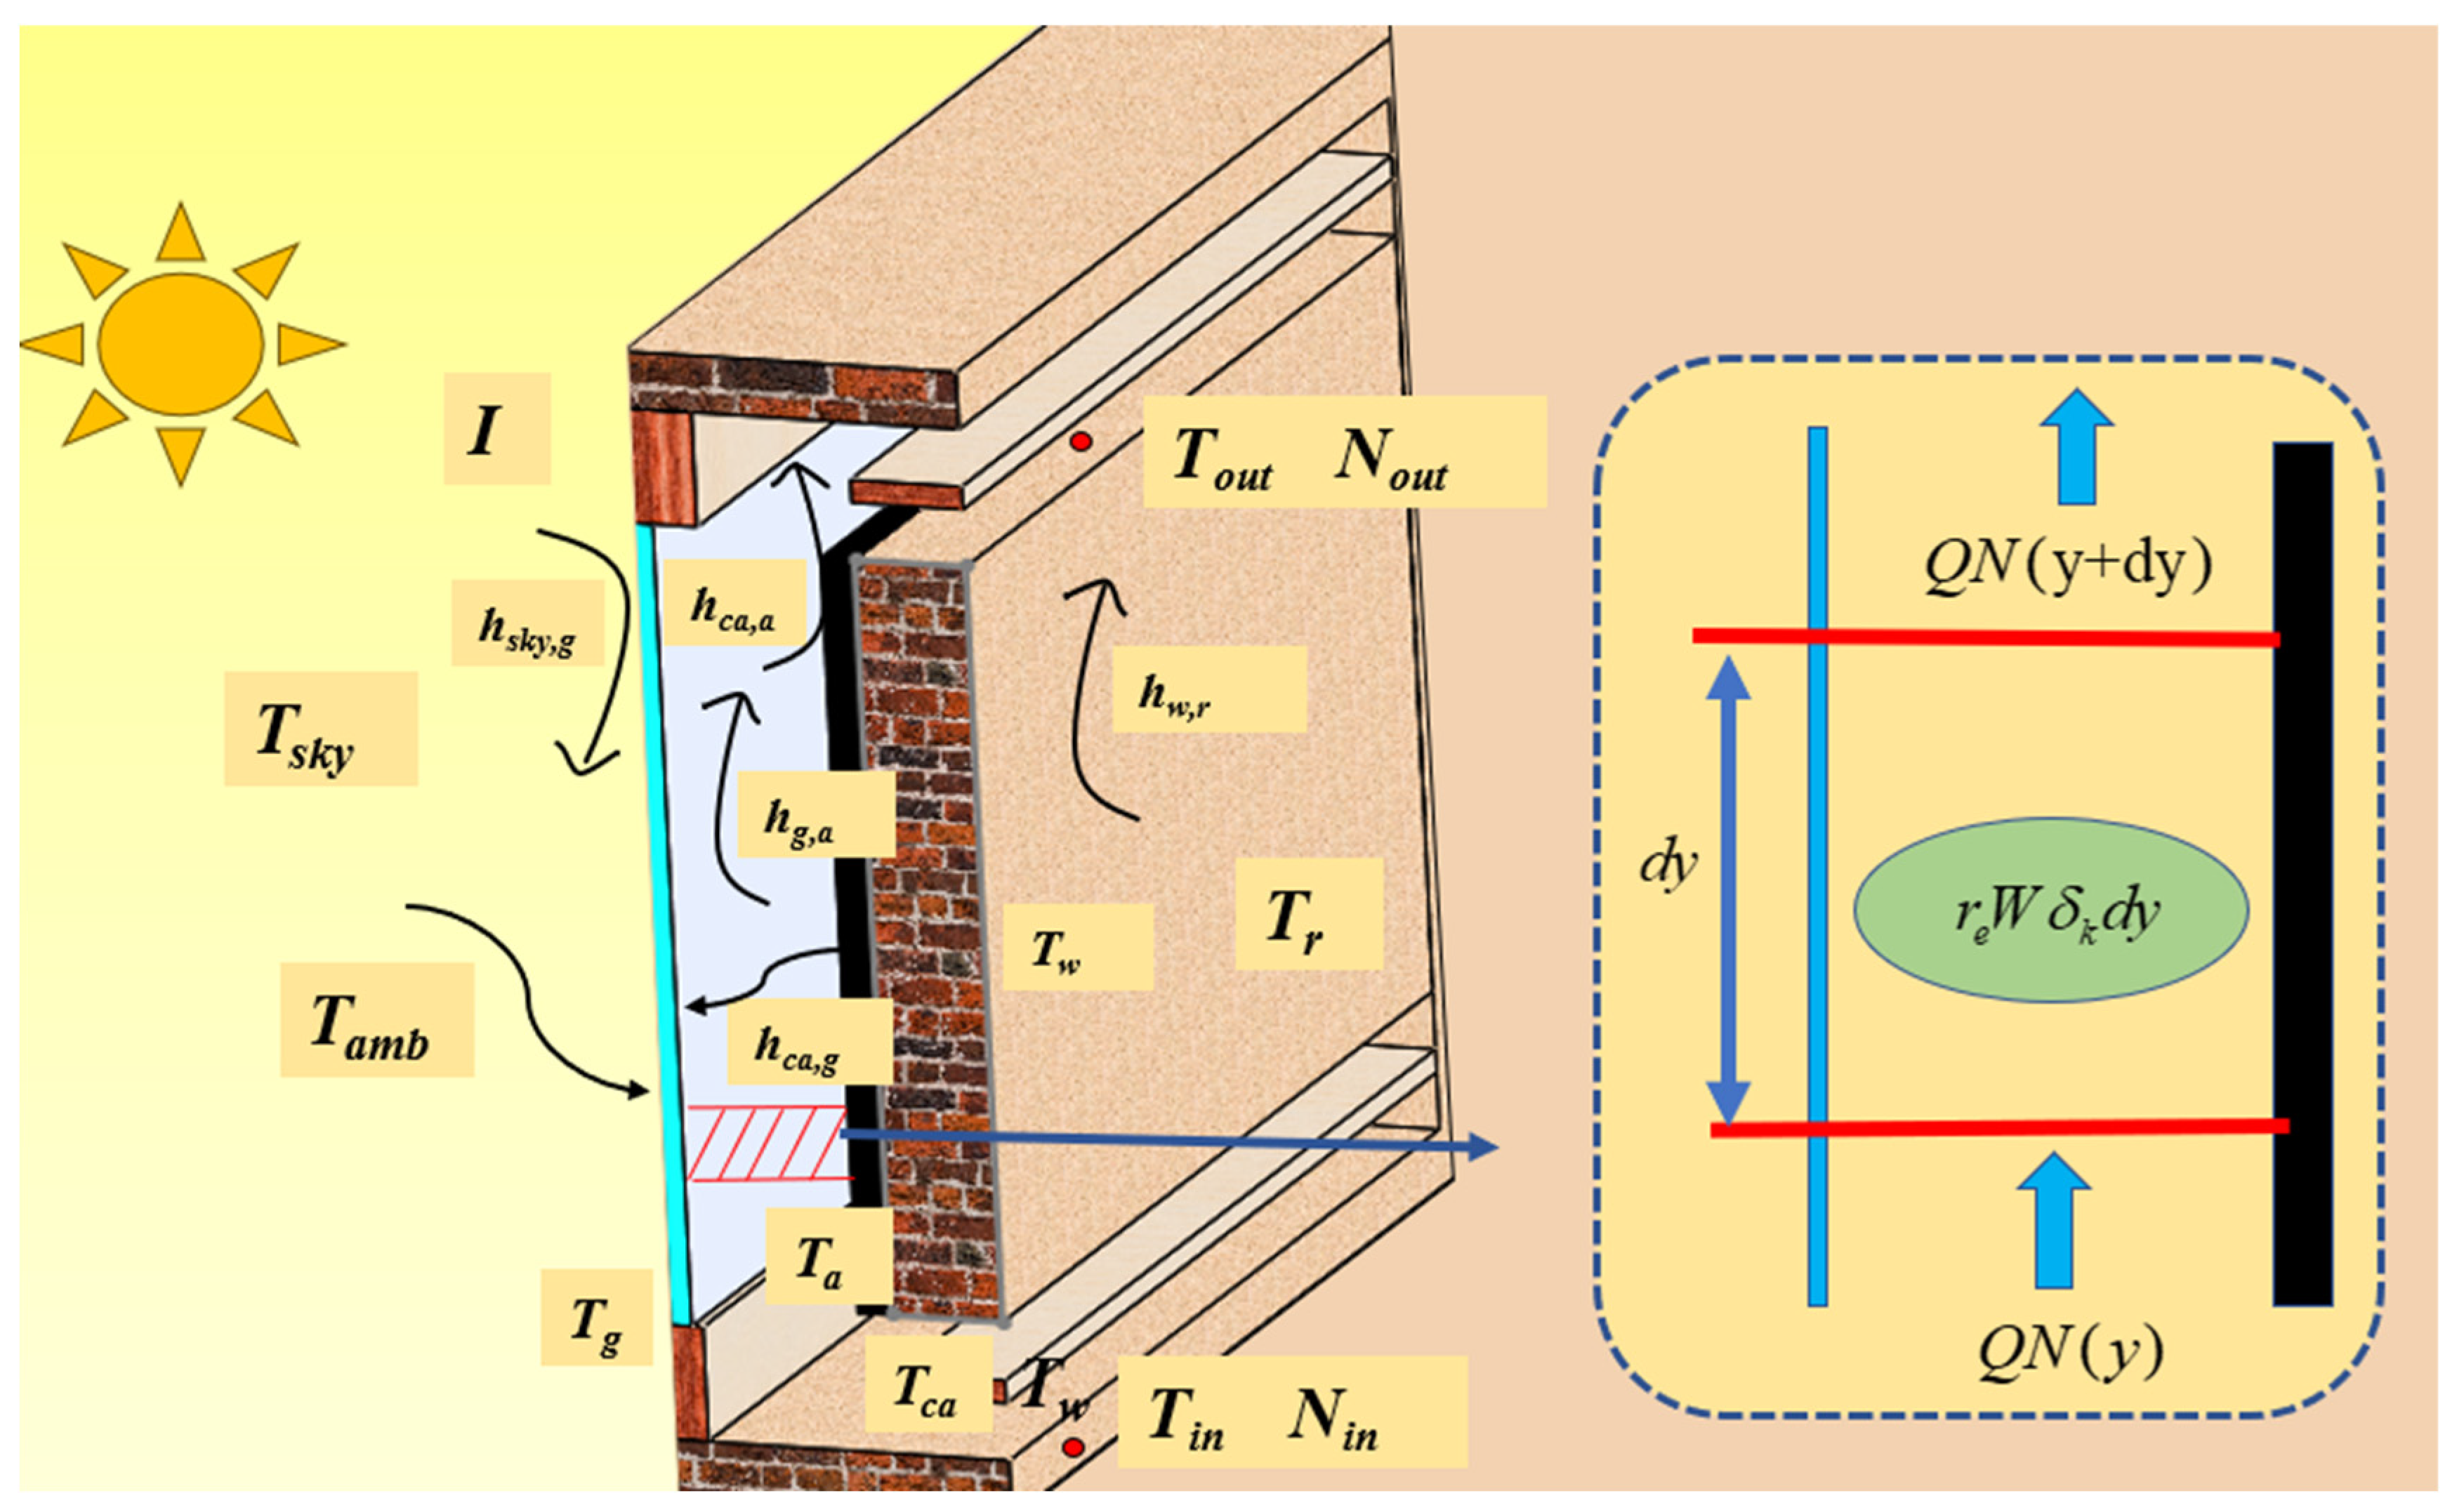
Figure 4.
Schematic diagram of the experimental set-up of the Trombe wall: (1) glazing cover; (2) flow channel; (3) absorber layer; (4) massive wall; (5) data acquisition instrument; (6) computer; (7) air inlet; (8) air outlet; (9) solar pyranometer.
Figure 4.
Schematic diagram of the experimental set-up of the Trombe wall: (1) glazing cover; (2) flow channel; (3) absorber layer; (4) massive wall; (5) data acquisition instrument; (6) computer; (7) air inlet; (8) air outlet; (9) solar pyranometer.

Figure 5.
Solar irradiation intensity levels and outdoor temperatures in Nanjing, Shanghai, Xining and Guangzhou.
Figure 5.
Solar irradiation intensity levels and outdoor temperatures in Nanjing, Shanghai, Xining and Guangzhou.
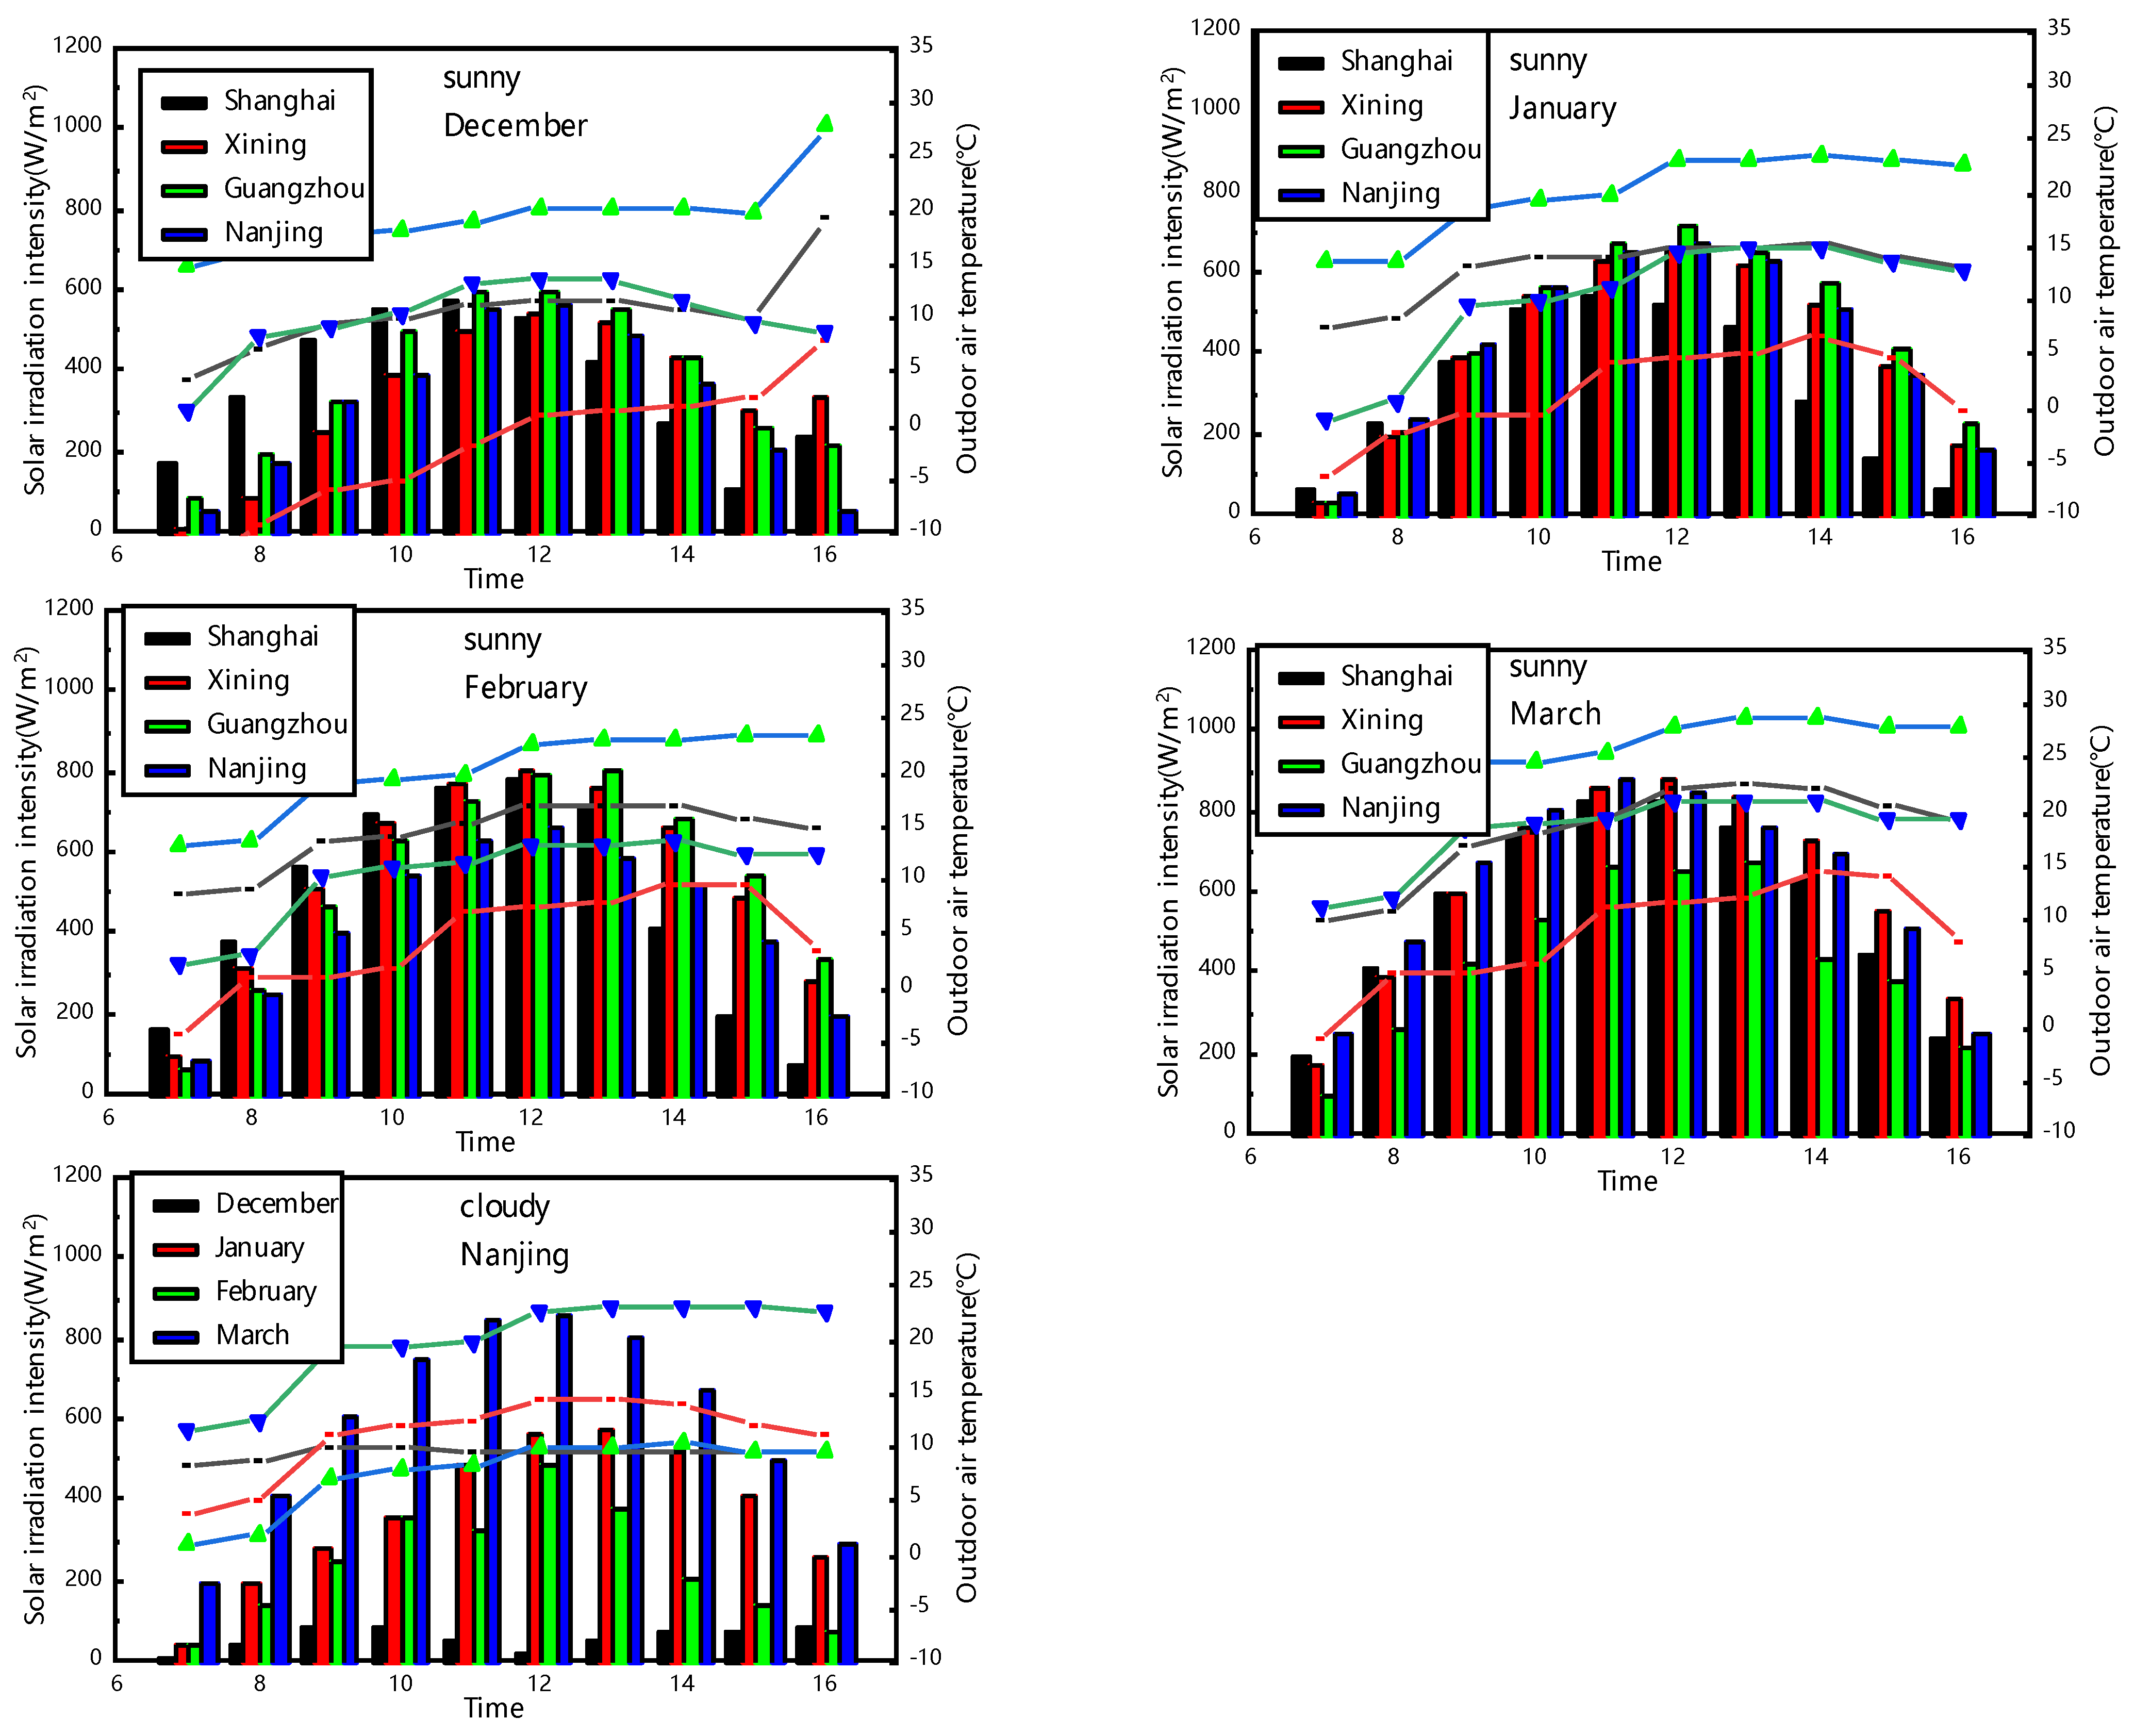
Figure 6.
The plots of the ratio of thermal inactivation of E. coli under different residence times and sterilization temperatures using the Gauss–Eyring model.
Figure 6.
The plots of the ratio of thermal inactivation of E. coli under different residence times and sterilization temperatures using the Gauss–Eyring model.

Figure 7.
The plots of the ratio of UV sterilization of E. coli under different residence times and UV intensities using the Lambert–Beer law.
Figure 7.
The plots of the ratio of UV sterilization of E. coli under different residence times and UV intensities using the Lambert–Beer law.
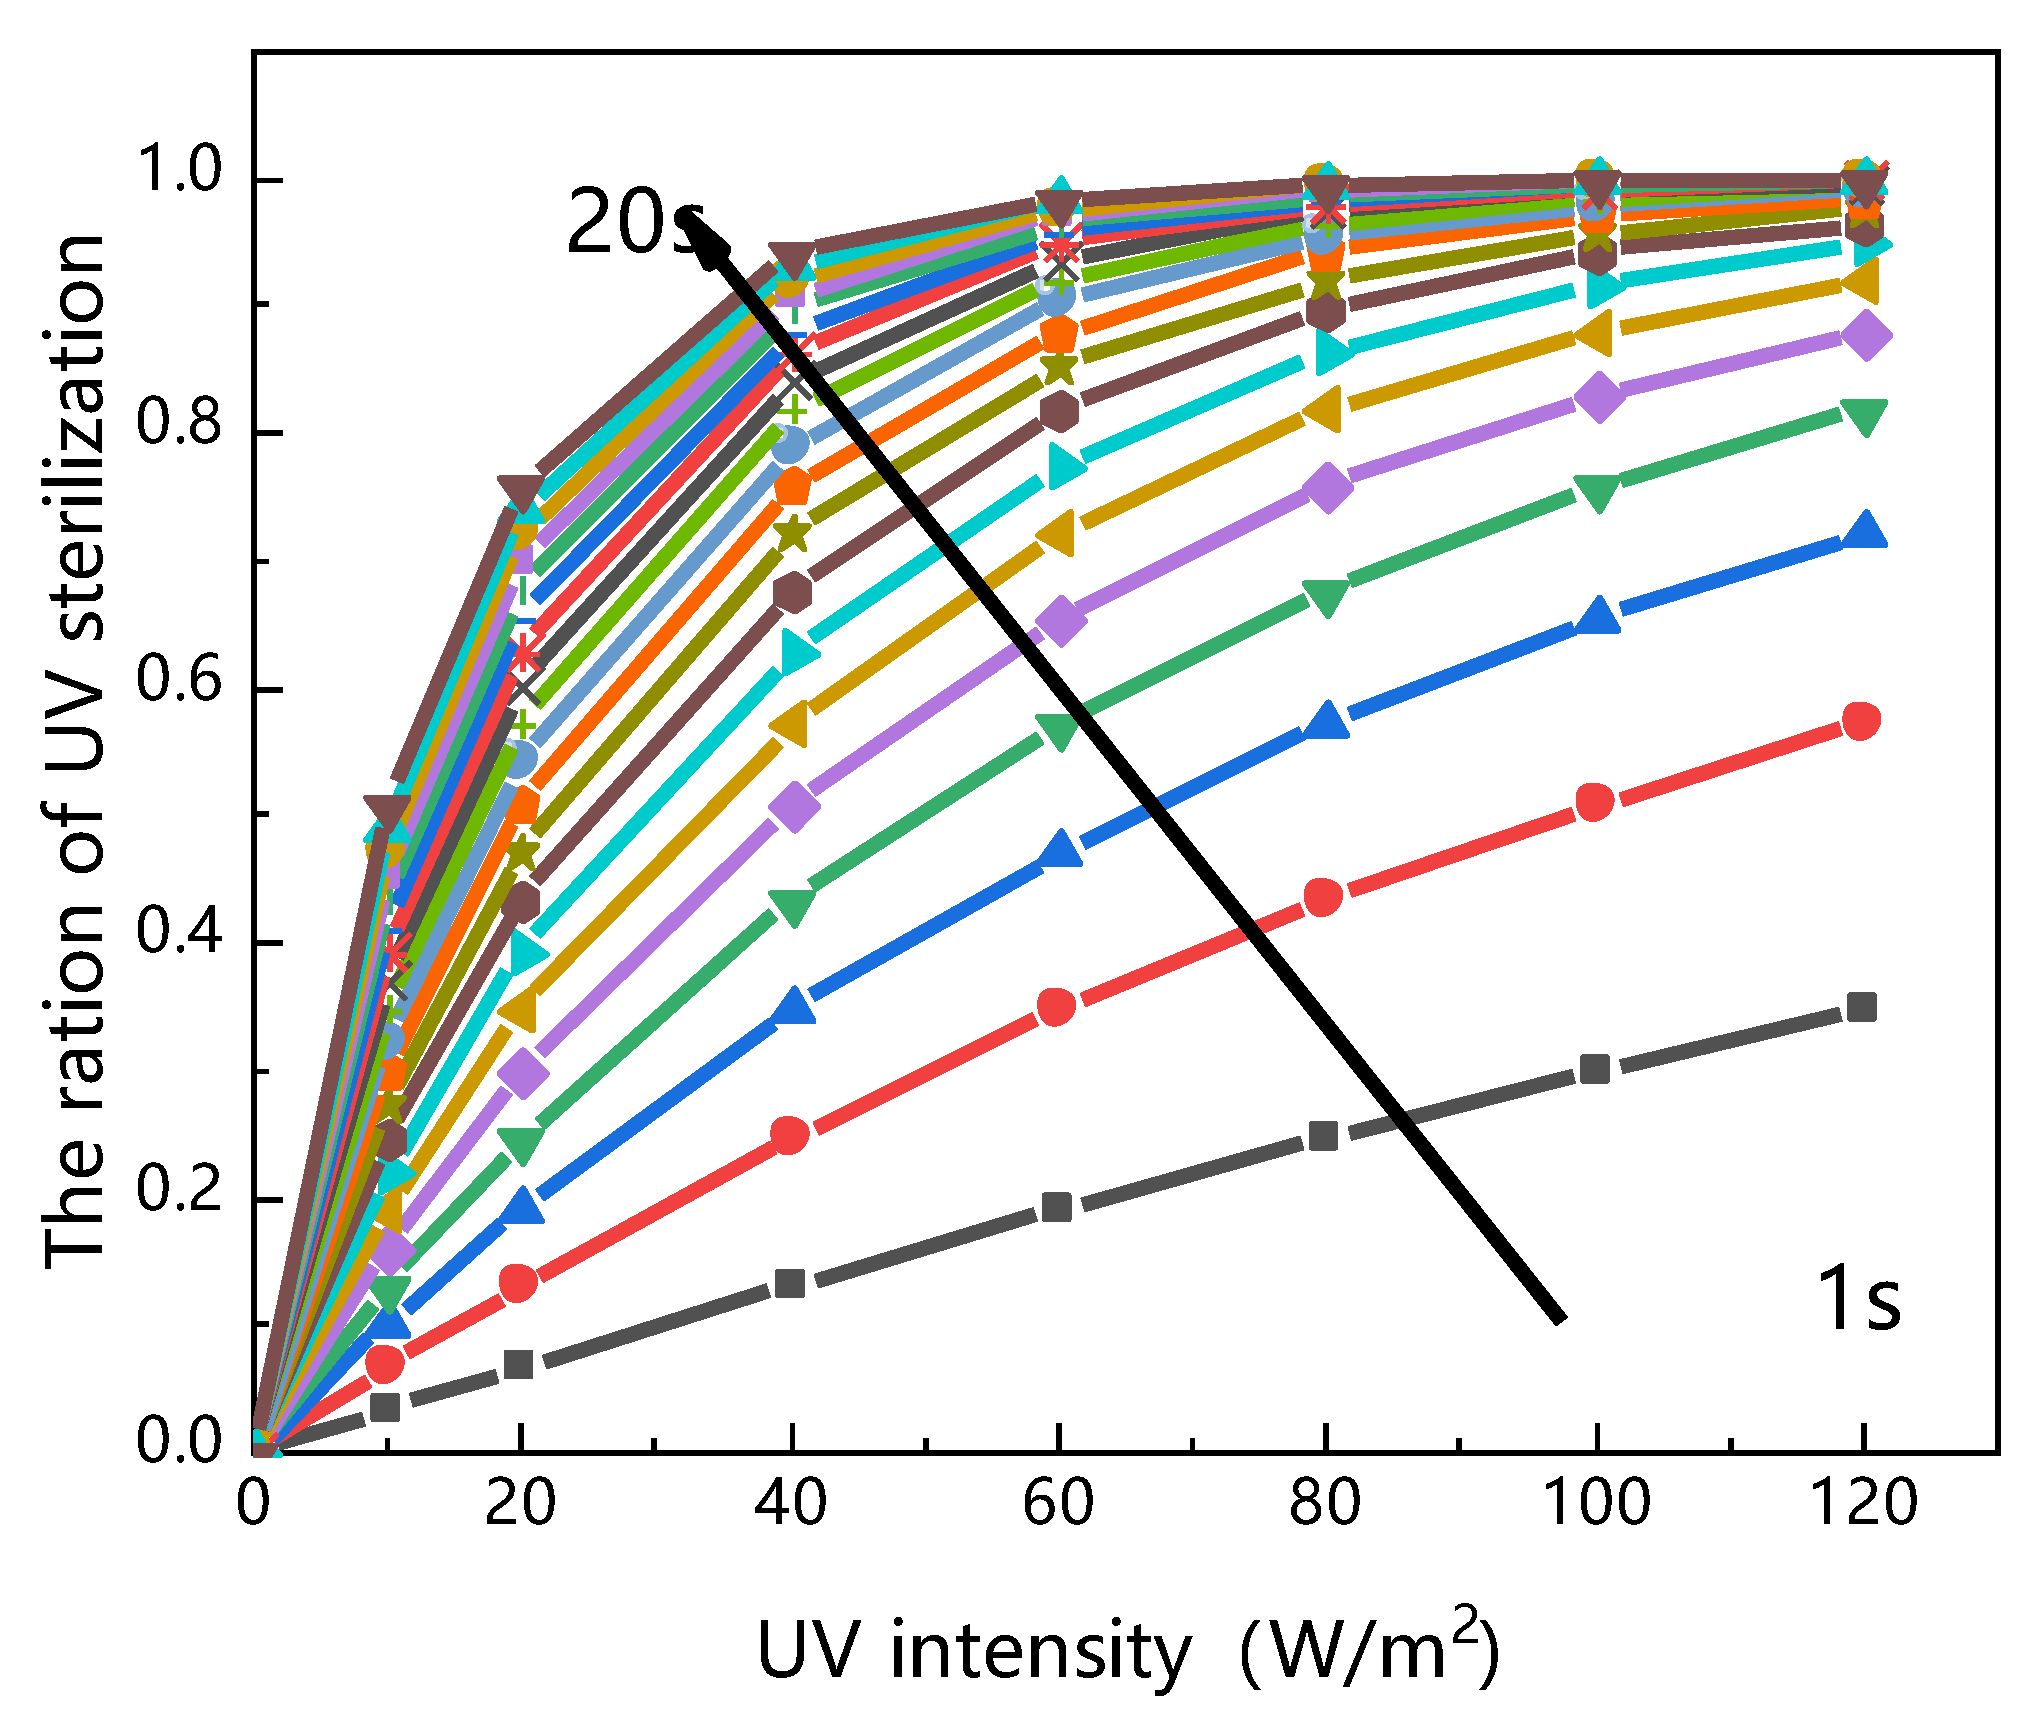
Figure 8.
The temperature, UV dose and residence time in the Trombe wall.

Figure 9.
The sterilization mechanism in the Trombe wall.
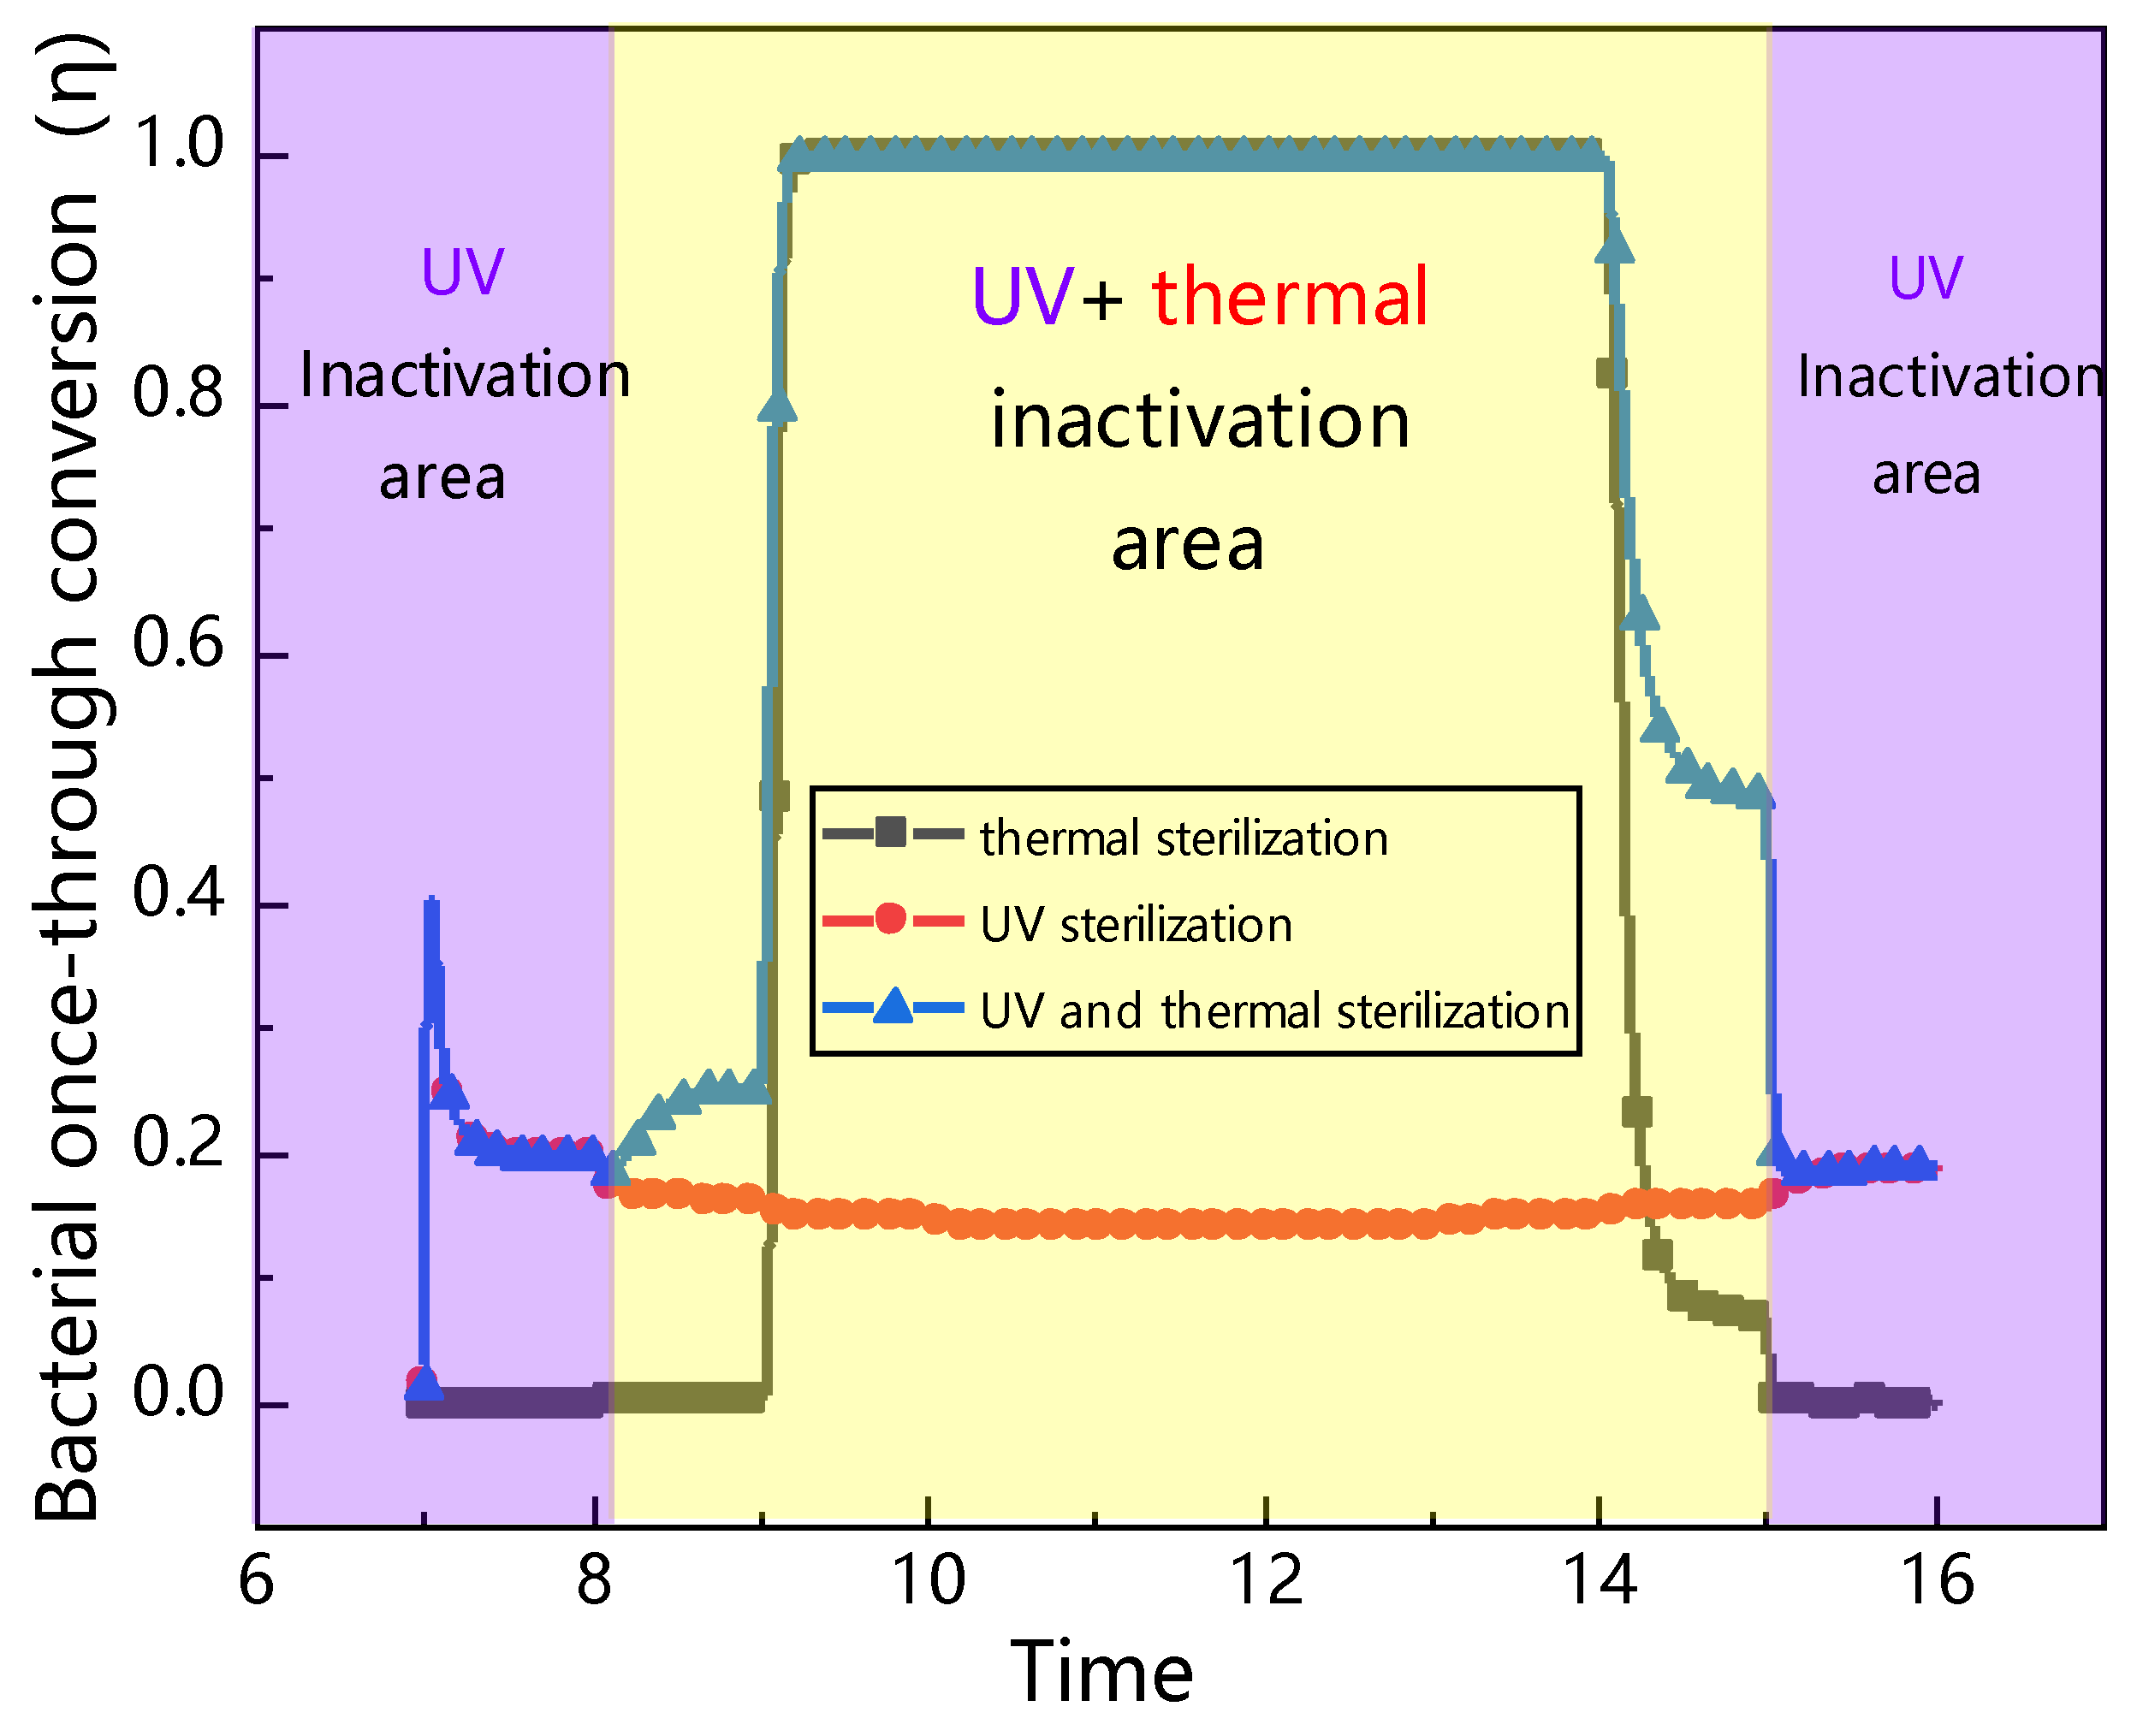
Figure 10.
The outlet of the air flow channel concentration curve of E. coli based on three sterilization methods on sunny days in Nanjing (thermal sterilization, UV sterilization, UV and thermal sterilization).
Figure 10.
The outlet of the air flow channel concentration curve of E. coli based on three sterilization methods on sunny days in Nanjing (thermal sterilization, UV sterilization, UV and thermal sterilization).
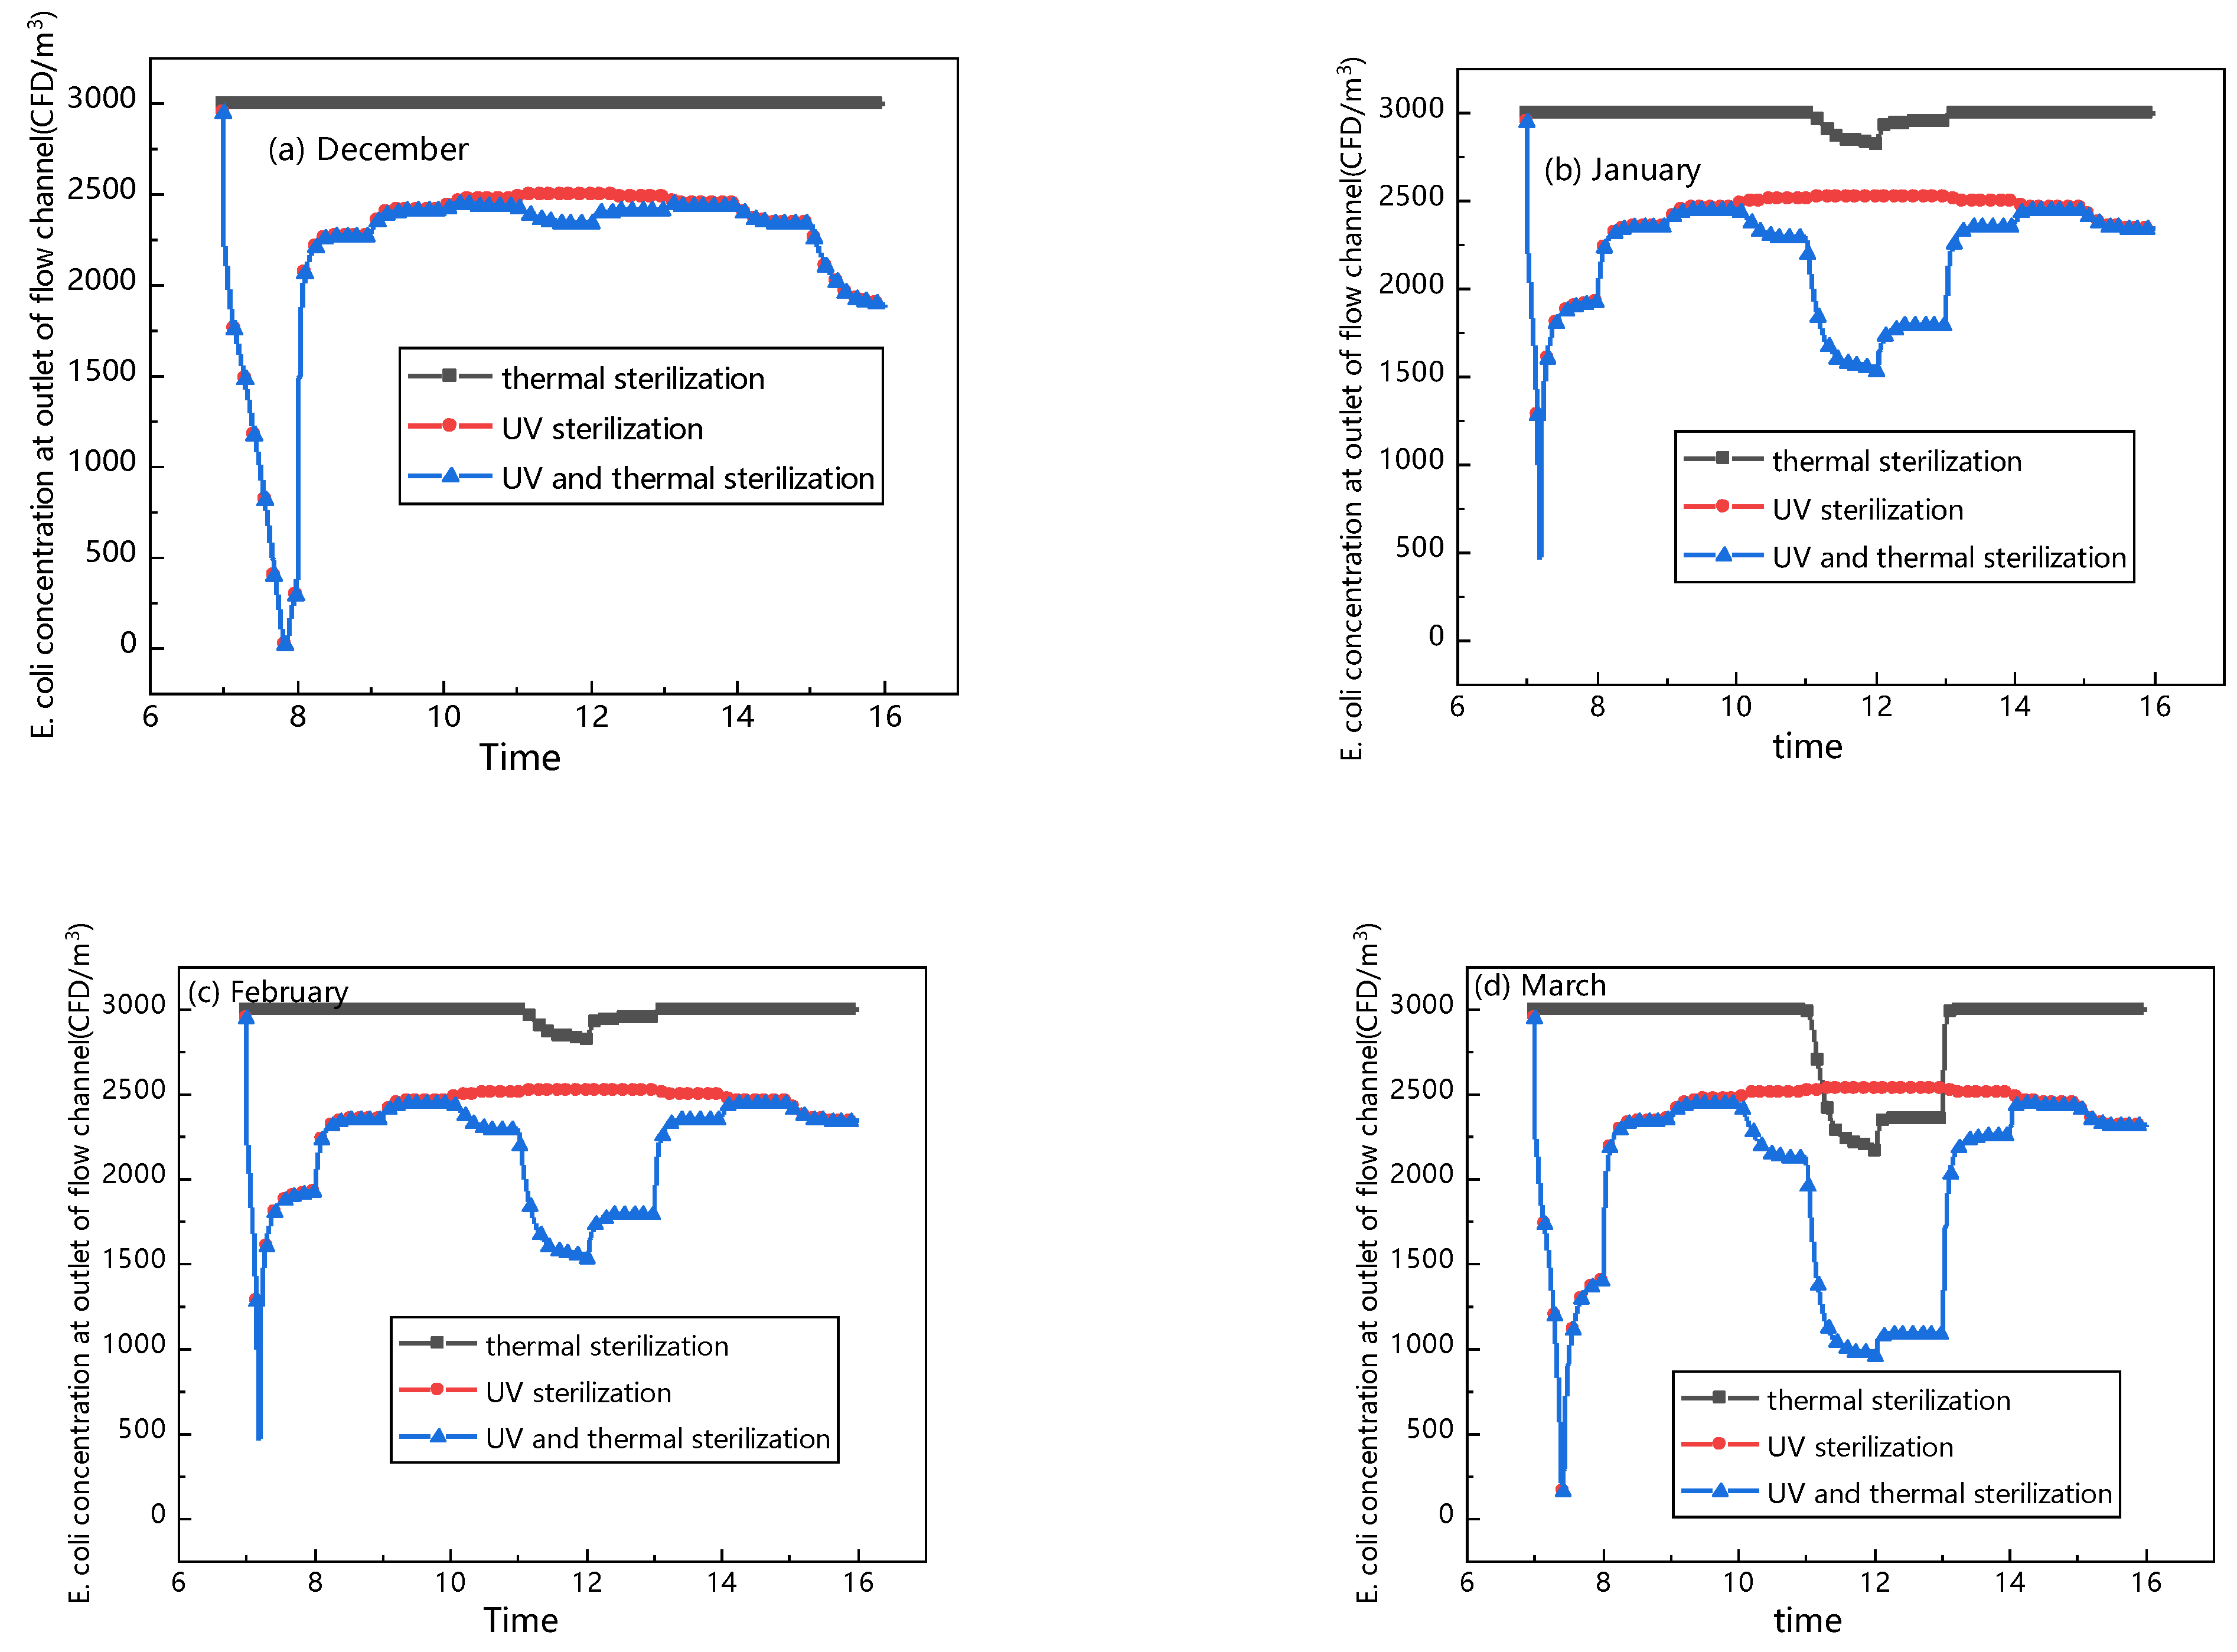
Figure 11.
CADR produced via three sterilization methods (thermal sterilization, UV sterilization, UV and thermal sterilization) in Nanjing under cloudy weather conditions.
Figure 11.
CADR produced via three sterilization methods (thermal sterilization, UV sterilization, UV and thermal sterilization) in Nanjing under cloudy weather conditions.
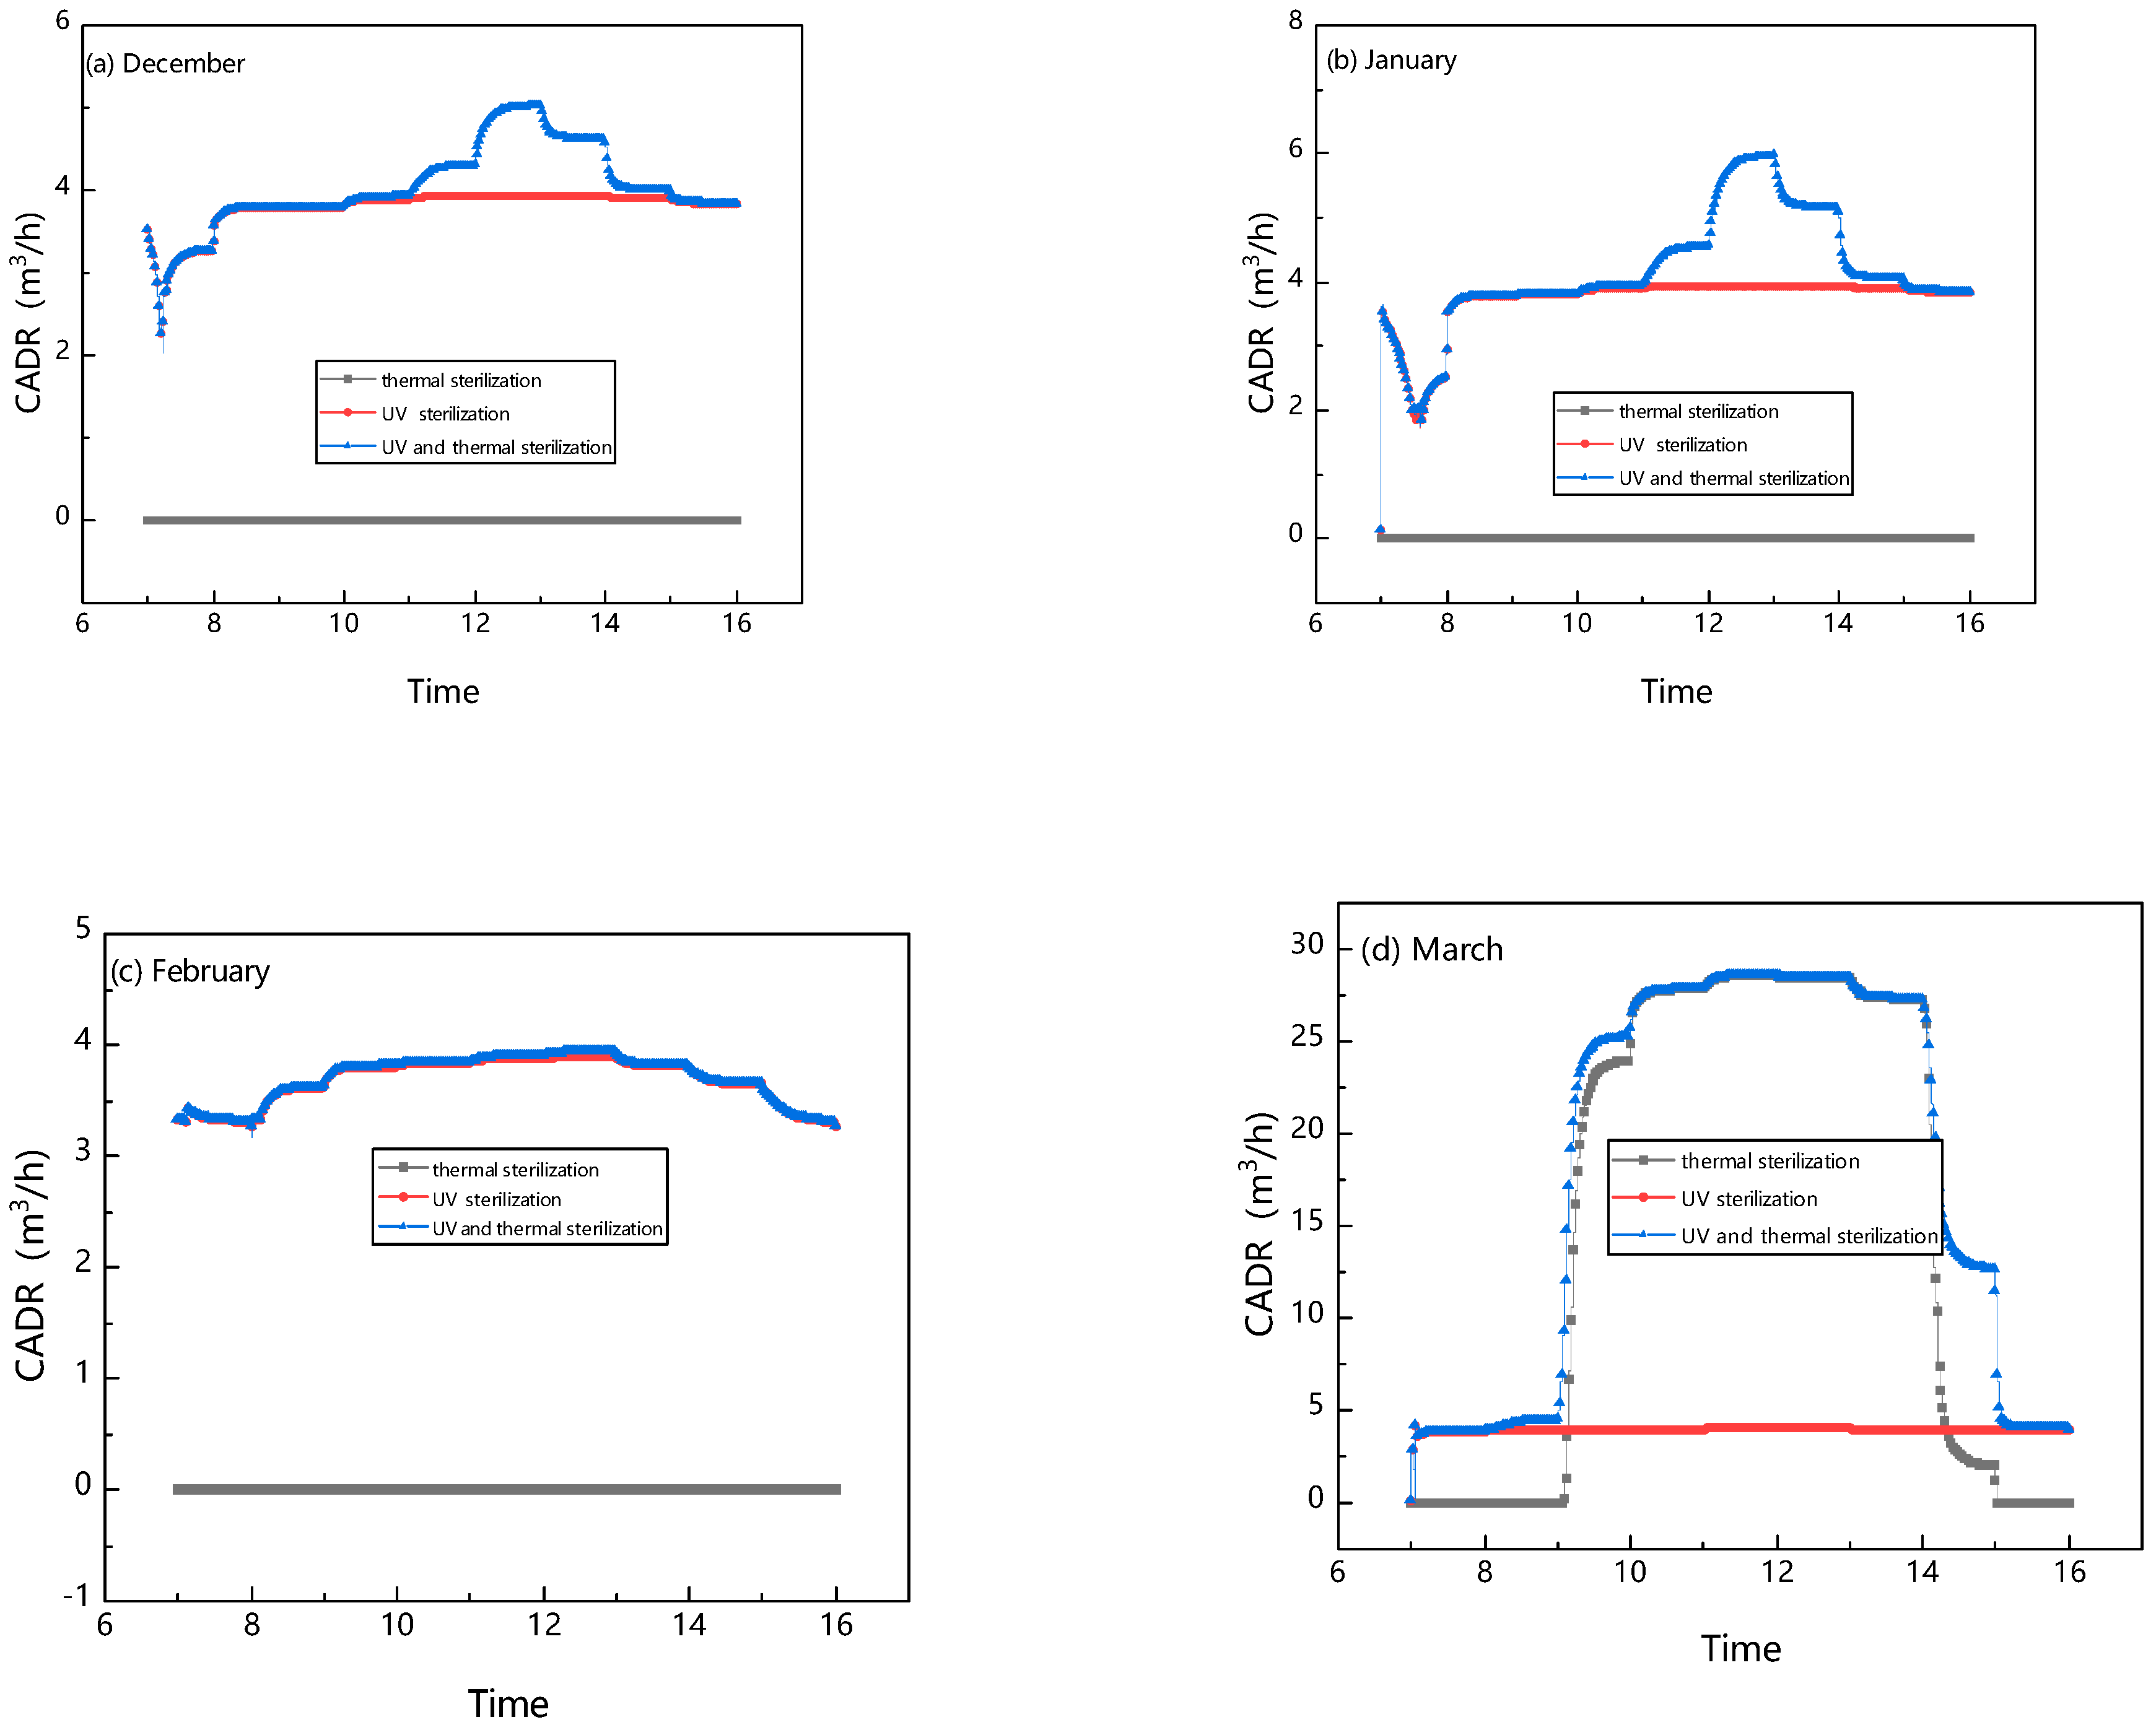
Figure 12.
Curves of the outlet flow channel E. coli concentration based on thermal sterilization in sunny days in four typical cities (Nanjing, Shanghai, Guangzhou, Xining).
Figure 12.
Curves of the outlet flow channel E. coli concentration based on thermal sterilization in sunny days in four typical cities (Nanjing, Shanghai, Guangzhou, Xining).

Figure 13.
Curves of indoor E. coli concentration based on UV sterilization in sunny days in four typical cities (Nanjing, Shanghai, Guangzhou, Xining).
Figure 13.
Curves of indoor E. coli concentration based on UV sterilization in sunny days in four typical cities (Nanjing, Shanghai, Guangzhou, Xining).
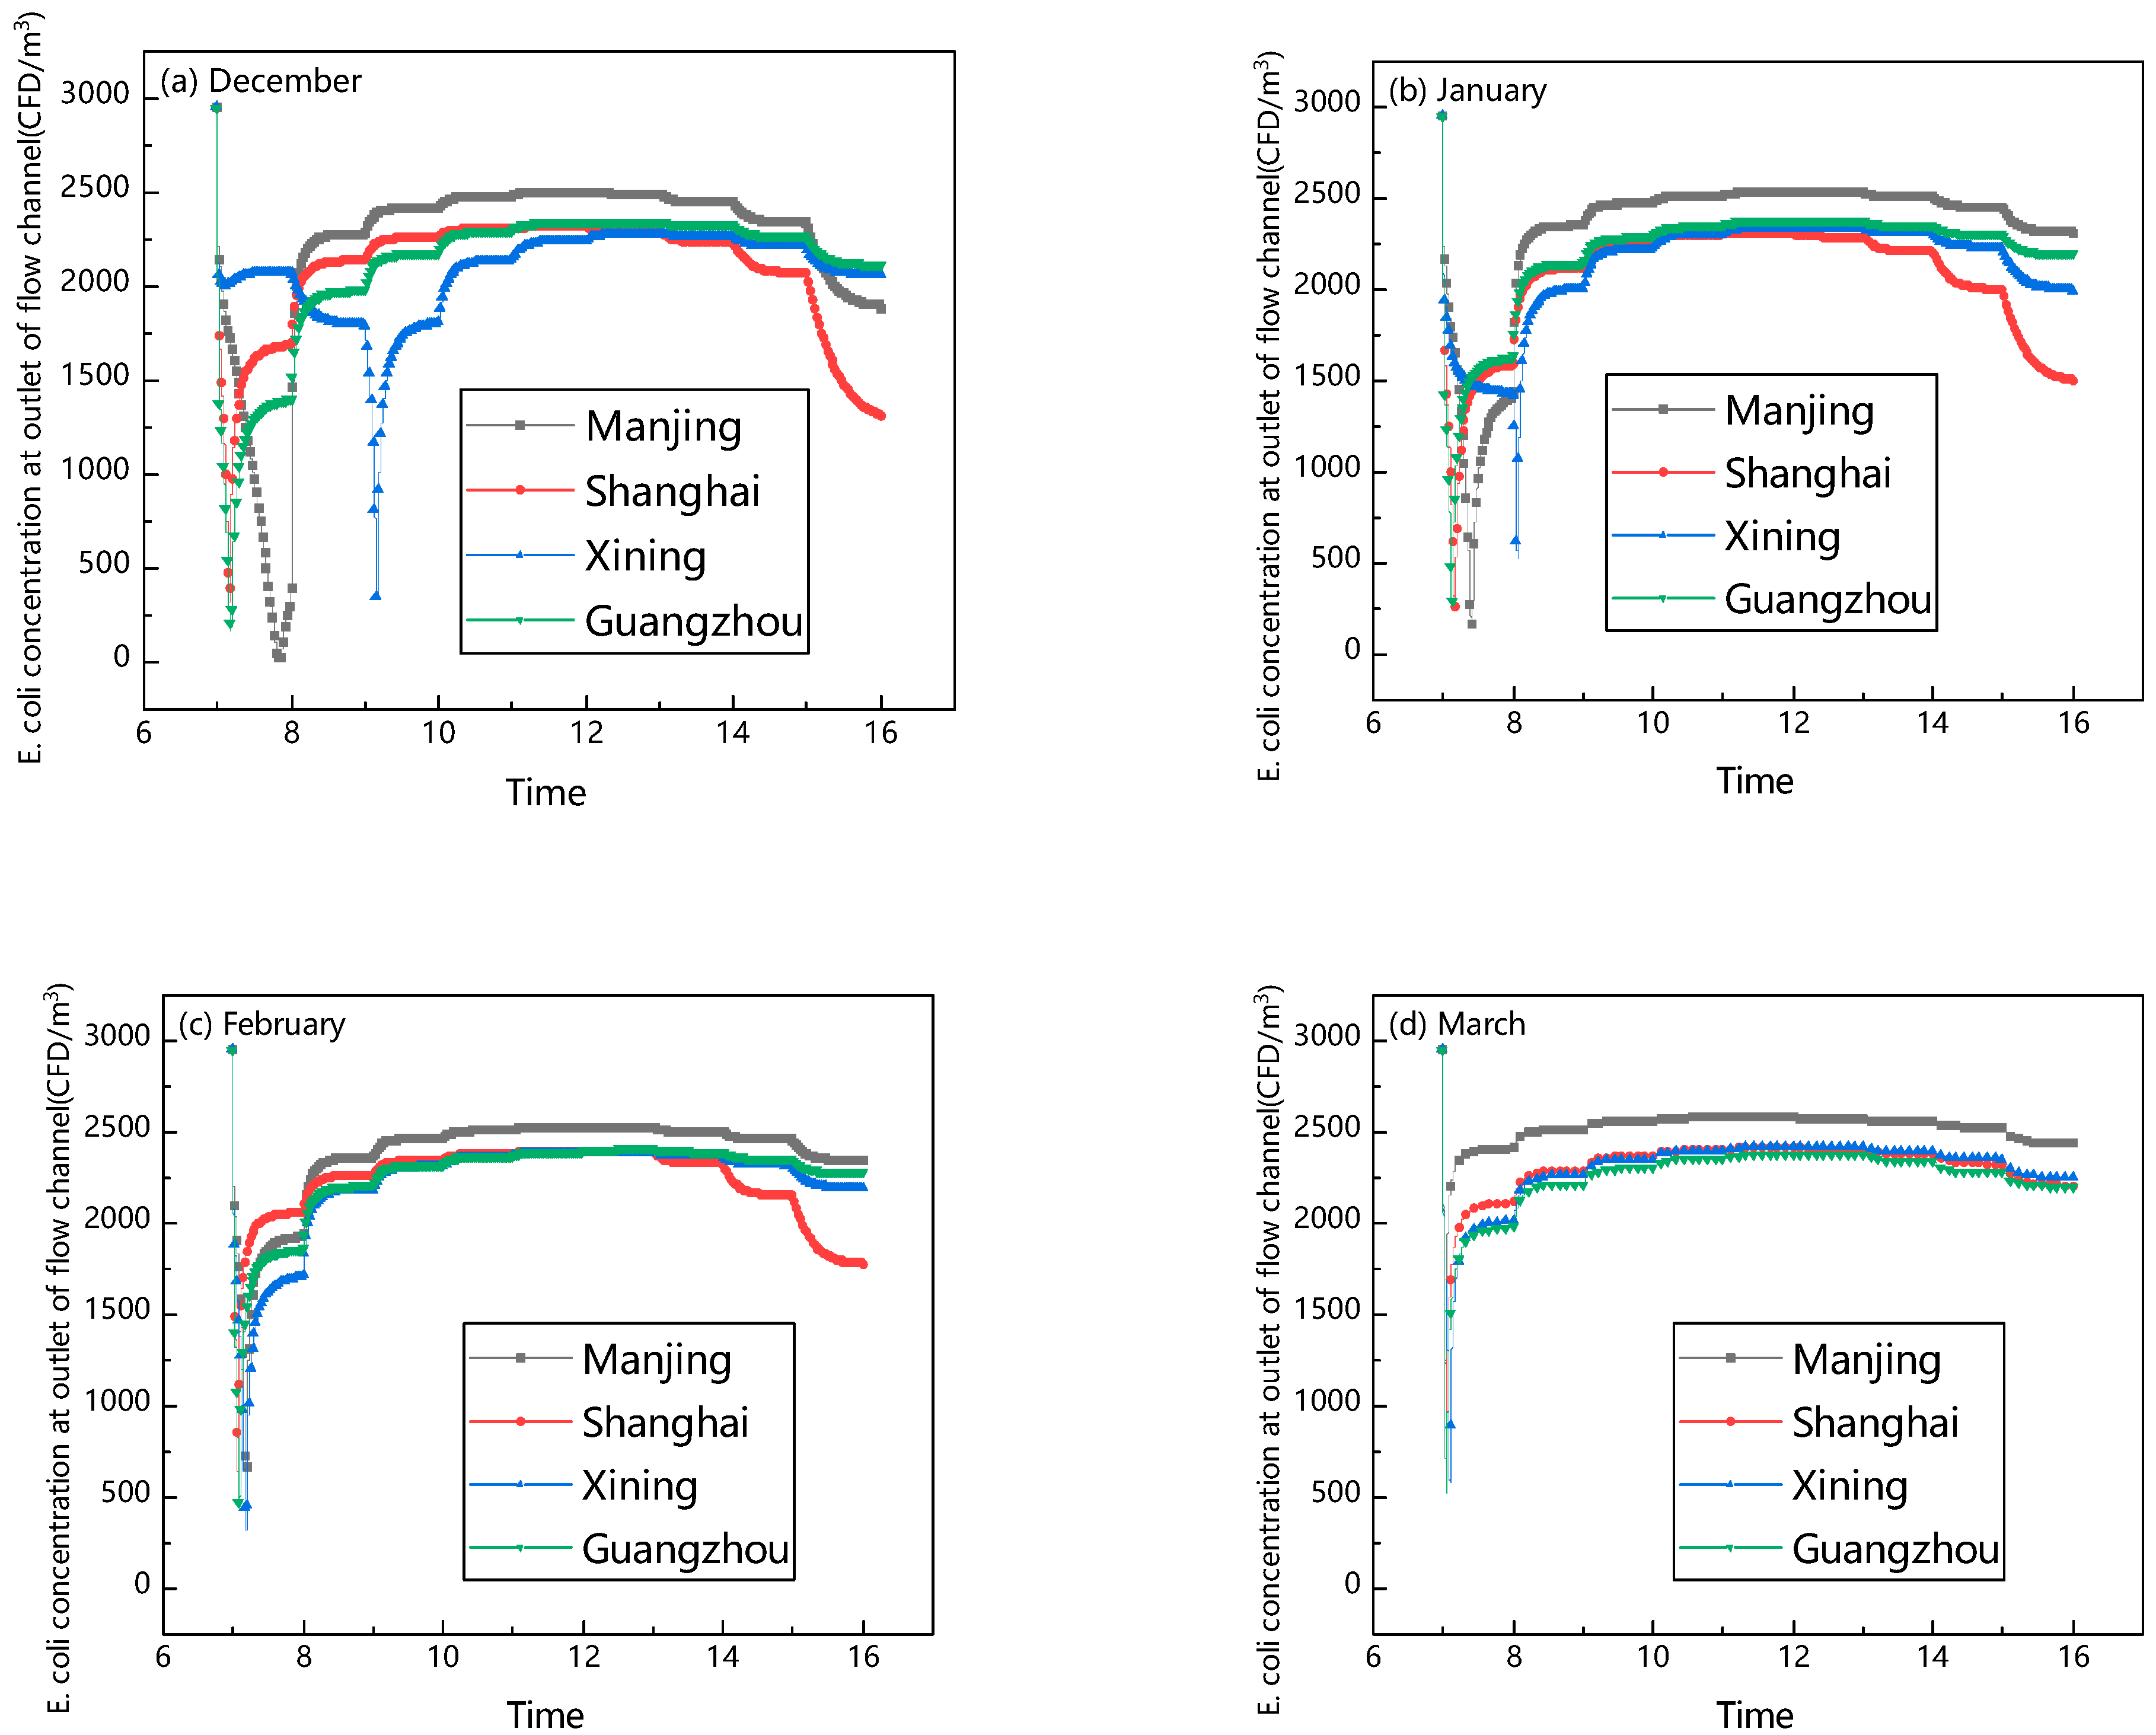
Figure 14.
Comparison of three sterilization methods on sunny days in different months in Nanjing at different wall heights.
Figure 14.
Comparison of three sterilization methods on sunny days in different months in Nanjing at different wall heights.

Figure 15.
Comparison of three sterilization methods on cloudy days in different months in Nanjing when the height is 3 m.
Figure 15.
Comparison of three sterilization methods on cloudy days in different months in Nanjing when the height is 3 m.

Table 1.
Calculation parameters in the thermal model [31].
Table 1.
Calculation parameters in the thermal model [31].
| Part | Symbol | Item | Unit | Value |
|---|---|---|---|---|
| Glass cove | ρg | Density | kg/m3 | 2500 |
| cg | Specific heat capacity | J/(kg·K) | 840 | |
| ag | Emissivity | - | 0.1 | |
| τg | Refractive index | - | 0.9 | |
| εg | Extinction coefficient | - | 0.9 | |
| absorber layer | ρal | Emissivity | kg/m3 | 1287 |
| cal | Refractive index | J/(kg·K) | 900 | |
| λal | Extinction coefficient | W/(m·K) | 112 | |
| αab | Emissivity | - | 0.94 | |
| εab | Refractive index | - | 0.94 | |
| Air flow channel | ρa | Density | kg/m3 | 1.18 |
| ca | Specific heat capacity | J/(kg·K) | 1100 | |
| λa | Thickness | m | 0.04 | |
| νa | Thermal conductivity | W/(m·K) | 0.026 | |
| Massive wall | Density | kg/m3 | 1800 | Massive wall |
| Specific heat capacity | J/(kg·K) | 840 | 9.0 | |
| Thickness | m | 0.3 | 8 |
Table 2.
The accuracy of the experimental measuring apparatus [31].
Table 2.
The accuracy of the experimental measuring apparatus [31].
| Apparatus | Accuracy |
|---|---|
| Hot-wire anemometer KANOMAX | ±0.01 m/s |
| Copper–constantan thermocouple thermometer | ±0.5 °C |
| Solar pyranometer TBQ-2 | ±11.04 μv/(W m2) |
| Data acquisition 34970A | – |
| Air flow meter LZB-3W | ±2.4 mL/min |
Table 3.
Performance comparison of three sterilization methods at a system height of 2 m in different months.
Table 3.
Performance comparison of three sterilization methods at a system height of 2 m in different months.
| Sterilizing Methods | Month | Maximum Daily Once-Through Conversion η (%) | Volume of Clean Air Content Produced by Day (m3/Day) | Volume of Clean Air Content Produced by Month (m3) | ||
|---|---|---|---|---|---|---|
| Sunny | Cloudy | Sunny | Cloudy | |||
| thermal sterilization | December | 0.02 | 0 | 0.002 | 0 | 38.5 |
| January | 28.5 | 0 | 10.8 | 0 | 86.4135 | |
| February | 6.5 | 0 | 1.5 | 0.0 | 66 | |
| March | 100.0 | 100.0 | 142.0 | 136.6 | 1808.2 | |
| UV sterilization | December | 16.5 | 16.60 | 34.0 | 34.0 | 782 |
| January | 15.5 | 16.3 | 34.0 | 33.5 | 774.5 | |
| February | 15.7 | 18.5 | 34.5 | 33.1 | 667.6 | |
| March | 14.3 | 14.2 | 35.5 | 35.4 | 460.8 | |
| UV and thermal sterilization | December | 21.8 | 21.2 | 35.1 | 36.2 | 820.5 |
| January | 68.4 | 24.7 | 63.5 | 37.3 | 1067.5 | |
| February | 49.4 | 18.7 | 50.8 | 33.2 | 734.4 | |
| March | 100.0 | 100.0 | 165.8 | 161.6 | 2126 | |
Table 4.
Performance comparison of three sterilization methods at a system height of 3 m in different months.
Table 4.
Performance comparison of three sterilization methods at a system height of 3 m in different months.
| Sterilizing Methods | Month | Maximum Daily Once-Through Conversion η (%) | Volume of Clean Air Content Produced by Day (m3/Day) | Volume of Clean Air Content Produced by Month (m3) | ||
|---|---|---|---|---|---|---|
| Sunny | Cloudy | Sunny | Cloudy | |||
| thermal sterilization | December | 93.1 | 88.3 | 33.4 | 36.3 | 803 |
| January | 100.0 | 99.6 | 103.4 | 56.3 | 1671.7 | |
| February | 100.0 | 0.0 | 97.1 | 0.0 | 388.4 | |
| March | 100.0 | 100.0 | 193.7 | 177.0 | 2401.2 | |
| UV sterilization | December | 22.8 | 22.7 | 46.6 | 48.3 | 1092.2 |
| January | 21.5 | 22.5 | 48.4 | 47.4 | 1098.2 | |
| February | 21.7 | 25.4 | 49.2 | 41.4 | 859.2 | |
| March | 21.5 | 21.5 | 51.3 | 51.1 | 665.5 | |
| UV and thermal sterilization | December | 97.4 | 95.7 | 84.8 | 91.0 | 2024.8 |
| January | 100.0 | 99.8 | 134.2 | 101.6 | 2597.6 | |
| February | 100.0 | 28.3 | 130.7 | 47.2 | 1278 | |
| March | 100.0 | 100.0 | 207.9 | 199.9 | 2646.7 | |
Disclaimer/Publisher’s Note: The statements, opinions and data contained in all publications are solely those of the individual author(s) and contributor(s) and not of MDPI and/or the editor(s). MDPI and/or the editor(s) disclaim responsibility for any injury to people or property resulting from any ideas, methods, instructions or products referred to in the content. |
© 2024 by the authors. Licensee MDPI, Basel, Switzerland. This article is an open access article distributed under the terms and conditions of the Creative Commons Attribution (CC BY) license (https://creativecommons.org/licenses/by/4.0/).
Share and Cite
MDPI and ACS Style
Fan, M.; Li, N.; Yu, B. The Performance Analysis of a Novel Sterilizable Trombe Wall Based on the Combined Effect of Heat and UV Light. Buildings 2024, 14, 1210. https://doi.org/10.3390/buildings14051210
AMA Style
Fan M, Li N, Yu B. The Performance Analysis of a Novel Sterilizable Trombe Wall Based on the Combined Effect of Heat and UV Light. Buildings. 2024; 14(5):1210. https://doi.org/10.3390/buildings14051210
Chicago/Turabian StyleFan, Miaomiao, Niansi Li, and Bendong Yu. 2024. "The Performance Analysis of a Novel Sterilizable Trombe Wall Based on the Combined Effect of Heat and UV Light" Buildings 14, no. 5: 1210. https://doi.org/10.3390/buildings14051210
Note that from the first issue of 2016, this journal uses article numbers instead of page numbers. See further details here.