Article

Predicting the Compressive Strength of Ultra-High-Performance Concrete Based on Machine Learning Optimized by Meta-Heuristic Algorithm

1
College of Geographical Sciences, Liaoning Normal University, Dalian 116021, China
2
School of Architecture and Civil Engineering, Northeast Electric Power University, Jilin 132012, China
3
School of Information Engineering, Shandong Management University, Jinan 250357, China
4
Key Lab of Electric Power Infrastructure Safety Assessment and Disaster Prevention of Jilin Province, Northeast Electric Power University, Jilin 132012, China
*
Authors to whom correspondence should be addressed.
Buildings 2024, 14(5), 1209; https://doi.org/10.3390/buildings14051209
Submission received: 16 March 2024 / Revised: 18 April 2024 / Accepted: 19 April 2024 / Published: 24 April 2024

Abstract

:
Ultra-high-performance concrete (UHPC) is a recently developed material which has attracted considerable attention in the field of civil engineering because of its outstanding characteristics. One of the key factors in concrete design is the compressive strength (CS) of UHPC. As one of the most potent tools in artificial intelligence (AI), machine learning (ML) can accurately predict concrete’s mechanical properties. Hyperparameter tuning is crucial in ensuring the prediction model’s reliability. However, it is a complex work. The purpose of this study is to optimize the CS prediction method for UHPC. Three ML methods, random forest (RF), support vector machine (SVM), and k-nearest neighbor (KNN), are selected to predict the CS of UHPC. Among them, the RF model demonstrates superior predictive accuracy, with the testing dataset R2 of 0.8506. In addition, three meta-heuristic optimization algorithms, particle swarm optimization (PSO), beetle antenna search (BAS), and snake optimization (SO), are utilized to optimize the prediction model hyperparameters. The R2 values for the testing dataset of SO-RF, PSO-RF, and BAS-RF are 0.9147, 0.8529, and 0.8607, respectively. The results indicate that SO-RF exhibits the highest predictive performance. Furthermore, the importance of input parameters is evaluated, and the findings prove the feasibility of the SO-RF model. This research enriches the prediction method of the CS of UHPC.

1. Introduction

Ultra-high-performance concrete (UHPC) is an innovative engineering material which arises with the requirement of higher bearing capacities and longer service lives for structures. UHPC is characterized by ultra-high CS, high toughness, and ultra-high durability, with the CS typically exceeding 120 MPa [1]. The excellent performance of UHPC is achieved by optimizing particle size distribution, an ultra-low water-to-binder ratio, and adding superplasticizers and fibers [2]. Using supplementary cementitious materials (SCMs) like fly ash, ground granulated blast furnace slag, silica fume, and limestone powder, decreases cement usage and enhances both the economic and environmental characteristics of UHPC [3]. However, various mix parameters may require hundreds of trials to achieve an optimized UHPC mix proportion. It is a time-consuming and labor-intensive task. In recent years, the effective collection and storage of large amounts of data has led to the rapid development of artificial intelligence (AI) technology. Using AI technology to optimize the mix proportion of UHPC can help free researchers from heavy trial-and-error work.
Machine learning (ML) is an essential branch of AI technology, and it can learn from a large number of existing data samples, discover rules of complexity influenced by various factors, and quantify the impact of different factors on predicting future developments [4,5,6]. In recent years, researchers have gradually applied artificial neural network (ANN), support vector machine (SVM), random forest (RF), decision tree, multiple regression, k-nearest neighbor (KNN), and other ML methods in civil engineering for structural optimization design, structural health monitoring, material performance prediction, and mix proportion optimization [4,5,7], specifically in predicting and optimizing concrete’s mechanical properties. Yeh [8,9] developed an ANN model to predict high-strength concrete’s CS and applied the prediction model to predict fly ash concrete’s CS and working performance. Gupta [10] also predicted the CS of high-strength concrete using the SVM algorithm, achieving a high prediction accuracy of 0.996. Topcu [11,12] investigated the potential of using ANN and fuzzy analysis to predict the CS of recycled aggregate concrete. The findings revealed that both methods provide high prediction accuracy, with R2 values of 0.9972 and 0.9986 for ANN and fuzzy analysis, respectively. In addition, they indicate that ML approaches offer notable benefits for predicting material properties and designing novel materials. In contrast, it can reduce the number of tests, save time and resources, improve efficiency, and be beneficial for mining data potential research values.
UHPC is usually mixed with various SCMs, the components are complex, and traditional concrete CS prediction methods, e.g., the maturity degree technique, are not suitable for CS prediction of UHPC due to low prediction accuracy. Numerous ML models have been created to predict the CS of UHPC. Abellán-García [13] developed a four-layer perceptron approach to predict the 28-day CS of UHPC using different combinations of SCMs. Kumar et al. [14] applied six distinct ML algorithms to predict the CS of UHPC, and the results showed that the extra tree regressor model was the most accurate one. In addition, ML methods are also used to predict other performances of UHPC. Soroush et al. [15] proposed an auto-tune learning framework to forecast the CS of UHPC, flexural strength, workability, and porosity. Cesario et al. [16] ensembled RF and KNN techniques to create Performance Density Diagrams that can guide the mix proportion optimization of UHPC. Current research indicates that ML methods can improve prediction accuracy by effectively handling large input variables.
Tuning the hyperparameters of the prediction model is required for ML to predict concrete performance, and reasonable optimization and adjustment of the hyperparameters will improve the prediction accuracy. Commonly used parameter tuning methods in optimization include traditional mathematical model methods, grid search, random search, and other algorithms. Traditional mathematical model methods may struggle with high-dimensional problems [17]. Grid search requires significant computing power and time to optimize a wide range of targets [18], while random searches may get stuck in local optima. In contrast, meta-heuristic optimization algorithms offer more efficient target optimization capabilities [19] which is effective for hyperparameter tuning. Presently, only a few scholars have investigated the hyperparameter optimization of ML algorithms in the field of concrete material property prediction. Zhang et al. [20] utilized the BAS algorithm to optimize the hyperparameters of the RF model for predicting the CS of light-weight aggregate concrete. They found that the optimized model resulted in an improved prediction accuracy, with a correlation coefficient R of 0.9735. Yu et al. [21] proposed an improved cat swarm optimization algorithm to optimize the hyperparameters of the SVM model for predicting the CS of high-strength concrete. Their study showed that after optimization, the model’s determination coefficient R2 significantly increased to 0.9369.
Machine learning models have demonstrated the capability to predict the material features of concrete. However, there exists a research gap in predicting the CS of UHPC and optimizing the parameters of the prediction model. The following are the primary reasons: (1) challenges in data collection due to insufficient research on UHPC material properties; (2) the composition of UHPC materials is complex; (3) hyperparameter optimization is a complex problem, and different algorithms require distinct optimization strategies.
In order to enhance the accuracy of predicting the CS of UHPC and facilitate the investigation of other mechanical properties, this study establishes a database by collecting and constructing information from previous studies on UHPC mix proportion and its corresponding CS. Collecting all kinds of UHPC mix proportions seems to be impossible, this study mainly focuses on the steel fiber reinforced UHPC. The accurate UHPC CS prediction model is optimized by selecting appropriate ML methods and hyperparameter tuning algorithms based on the constructed database. Integrating parameter optimization and regression prediction into one model can realize the automatic optimization of hyperparameters to ensure the reliability of the prediction model. Additionally, the model analyzes and clarifies the significance of various parameters that affect the CS of UHPC.

2. Methodology

The workflow of the dataset construction, prediction model selection, hyperparameter tuning, and importance analysis of input parameters in this study is schematically established in Figure 1, involving mainly four steps: (1) preparing the mix proportion dataset of UHPC; (2) choosing the optimal prediction model for the CS of UHPC among three traditional ML models (RF, SVM, and KNN); (3) performing hyperparameter tuning using the current most popular meta-heuristic algorithms (PSO, BAS, and SO); (4) comparing and evaluating the impact of the input variables on the CS of UHPC. The Python platform is applied to implement ML model prediction and optimization of meta-heuristic algorithms. The following flowchart describes the complete process of predicting the CS of UHPC based on ML optimized by meta-heuristic algorithm (Figure 1).

2.1. Regression Prediction Algorithm

2.1.1. Random Forest (RF)

The RF method is an integrated algorithm based on the decision tree and bagging algorithms [22]. The repeated random sampling method with placement is adopted to obtain multiple sub-sample sets from the training set samples, and each sub-sample set is utilized for training the decision tree model, respectively. The decision tree divides the internal nodes by randomly selecting features and multiple sorted decision trees form an RF. Finally, the output is derived by synthesizing each decision tree’s results. Compared to the simple decision tree algorithm, introducing randomness reduces the risk of overfitting and improves the ability of anti-noise. RF algorithm does not require high data normalization, and it applies to discrete and continuous data so there is no need to normalize the dataset.
Figure 2 depicts the schematic diagram of an RF, whereas Equation (1) describes the results of RF regression prediction.
H x = 1 K i = 1 K ( h i ( x , θ K ) )
where H x is the regression prediction results of an RF; h i is the regression prediction results of the single decision tree; θ K is an independent distributed random variable determining the development direction of a decision tree; K represents the number of decision trees in an RF model.

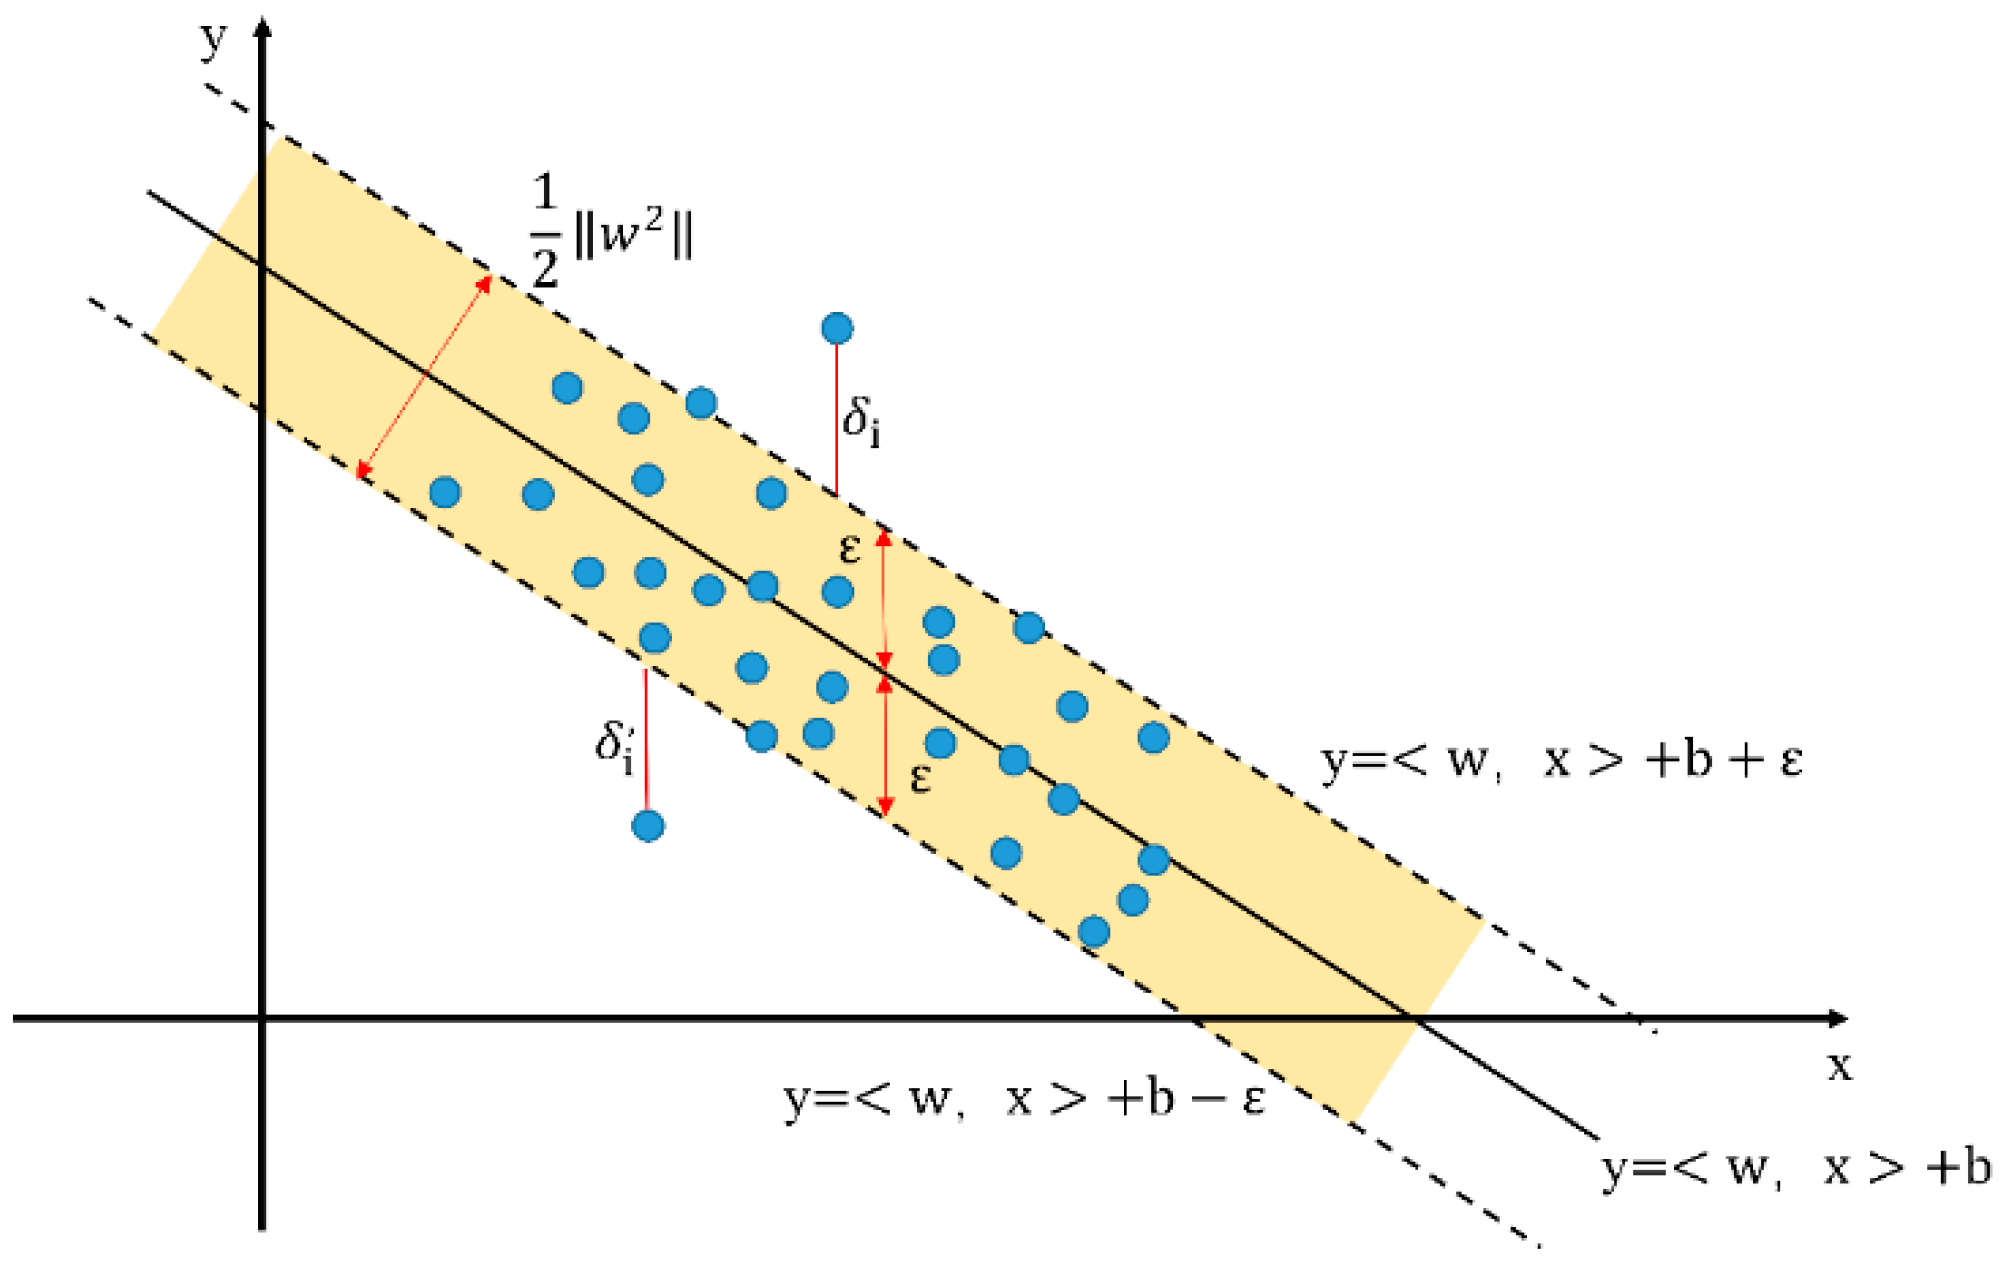
2.1.2. Support Vector Machine (SVM)

The SVM is a supervised ML model derived from the statistical learning theory proposed by Vapnik in 1964 [23] and is used for classification and regression prediction. In support vector regression (SVR), the curve required for fitting data is referred to as a hyperplane, and the data points closest to the hyperplane on both sides are known as the support vectors. Figure 3 depicts the schematic diagram of SVR. The objective of the SVR is to identify a hyperplane function with a sufficiently smooth curve so that the error between all sample data and the function is less than the threshold error tolerance ε [24]. The set loss function penalizes other data for a given tolerance value ε. The smooth hyperplane function of this curve, fitted by SVR, can be expressed as:
f x = < w , x > + b
where w is the weight vector; < w , x > is the point product of the weight vector and support vector in real number; b is bias.
The minimum Euclidean norm of the weight vector w must be determined to obtain a sufficiently smooth hyperplane. The objective function can be described as follows:
R = 1 2 w 2 + C i = 1 N ( δ i + δ i )
The constraints can be identified by:
y i w , x i b ε + δ i w , x i + b y i ε + δ i δ i , δ i 0   i = 1 , 2 , 3 k
where ε is threshold error tolerance; δ i or δ i is relaxation factor, when all data and hyperplane errors are less than ε, relaxation factors are set to 0. The C is the penalty coefficient.
Using a nonlinear mapping function, the input data is converted into a feature space with higher dimensions and then searches for hyperplane functions in this feature space are performed. The Gaussian kernel function is the most commonly utilized nonlinear mapping function. The above-constrained optimization problem is reformulated as a dual problem using Lagrange multipliers, and the final predicted value can be determined by:
y = i = 1 N λ i + λ i k ( x i , x ) + b
k x i , x = e x p x i x 2 2 σ 2
where λ i or λ i is the Lagrange multiplier; σ is the smoothness parameter.

2.1.3. K-Nearest Neighbor (KNN)

KNN is a commonly used supervised ML algorithm, suitable for both classifying and predicting regression. The KNN regression principle is simple, the learning effect is suitable for large amounts of data, and the influence of data noise is minimal. The utilized principle for regression prediction is that for a target sample point to be predicted, K samples closest to the target sample point are selected, and the mean value is the predicted value of the target sample point. Figure 4 shows the principles of the KNN.

2.2. Parameter Tuning Algorithm

2.2.1. Particle Swarm Optimization (PSO)

PSO is a meta-heuristic algorithm, proposed by Eberhart and Kennedy in 1995, inspired by bird predation [25]. When birds hunt in a random area, their searching strategy for food is to search the area around the birds closest to the food. Throughout the entire search process, birds communicate their distance from the food to one another to inform fellow birds of their position and estimate if they have discovered the best solution. Simultaneously, they also share details regarding the best solution with the entire bird group. Finally, the entire bird group can gather around the food source. Hence, they have found the optimal solution.
In each iteration, the particle is a bird in the flock. It is updated by tracking the particle’s optimal fitness value in its path (Pbest) and the optimal fitness value of the group (Gbest). The position and velocity of the particle swarm after iterative updating can be expressed as:
V i k + 1 = ω V i k + c 1 r 1 P i k X i k + c 2 r 2 P g k X i k
X i k + 1 = X i k + V i k + 1
where V i k + 1 and V i k are the velocity of particles after k + 1 and k iterations, respectively, X i k + 1 and X i k are the position of particle individual after k + 1 and k iteration, respectively, P i k and P g k is the extremum of individual particle and particle swarm after k-iteration, respectively, ω is inertia weight, and c 1 or c 2 is learning coefficient, r 1 or r 2 is random number between (0, 1).

2.2.2. Beetle Antenna Search (BAS)

The BAS algorithm was first proposed by Jiang et al. in 2017, and was applied to optimization problems by Deepak [26]. Inspired by the feeding methods of beetles, such as longicorns in nature, a single search algorithm was designed and implemented. In the foraging process, the beetle relies on its two antennae to detect variations in food odor concentration. After moving to the side with a strong odor, the beetle senses the food odor strength again and finally finds food after multiple attempts.
The BAS algorithm parameters include step, eta, d0, and k. Among them, step and d0 are constants which reflect the characteristics of the longicorn beetle used for searching. For beetles with large tentacle spacing, the initial step is longer, and the corresponding step length for each iteration is also larger, so the search is fast but rough. The initial step size of beetles with small tentacle spacing is small, the corresponding step size of each iteration is small, and the search is slow but detailed. The eta represents the change in the proportion of the longicorn beetle’s step size in each iteration. The step length expression for t iterations is shown in Equation (9):
δ t = s t e p   e t a t 1
where δ t is step size for t iterations, step is initial step size; eta is step size change ratio; k is the number of optimization target variables.
The iterative expression is shown in Equation (10):
x t = x t 1 + δ t   b   s i g n ( f ( x r ) f ( x l ) )
where x t is the position of the beetle after t iteration; b is the normalized random unit vector; f ( x ) is the odor concentration felt by the left or right tentacles of the beetle after t − 1 iterations.

2.2.3. Snake Optimization (SO)

The snake optimization (SO) algorithm is the latest achievement of the meta-heuristic optimization method, proposed by Hashim and Hussien in 2022 [27]. Although the SO algorithm is relatively complex, it has performed well in practice. This algorithm mimics the behavior and pattern of snakes in the natural world during predation and reproduction. Food conditions and ambient temperature affect snakes’ feeding and mating reproduction. Snakes focus on finding food and do not mate when food is scarce, regardless of the temperature. When the food is sufficient, the snake will only eat if it cannot reach the temperature suitable for mating. When the temperature is suitable for mating, snakes will mate and lay eggs after searching for a mate. Therefore, according to this snake habit, the SO algorithm model is divided into search and development. The development stage is more complex and can be divided into three modes: feeding, fighting, and mating.
The process begins by initializing the population, defining the initial position, population temperature, and food quantity, and dividing the male and female population according to a 1:1 ratio. The initial position, temperature, and food quantity are defined as:
X i = X m i n + r × ( X m a x + X m i n )
T e m p = e x p ( t T )
Q = c 1 × e x p ( t T T )
where X i is the initial position of the ith snake; X m i n and X m a x are the snake’s position boundary, which is the upper and lower limits of the target to be optimized; r is a random number between (0, 1); T e m p and Q is the snake’s ambient temperature and food quantity, respectively, t and T is the iterations and maximum iterations; c 1 is constant and equals 0.5 by default.
In the search stage, snakes will search for food at any position when food is scarce. At this time, the positions of male and female snakes can be expressed as follows:
X i m t + 1 = X r a n d m t ± c 2 × e x p ( f r a n d m f i m ) × r × X m a x X m i n + X m i n
X i f t + 1 = X r a n d f t ± c 2 × e x p ( f r a n d f f i f ) × r × X m a x X m i n + X m i n
where X i m and X i f is the position of the ith male and female snakes, respectively, X r a n d m and X r a n d f is the random position of male and female snakes, respectively, c 2 is constant equals 0.5 by default. The f r a n d m and f r a n d f is the fitness value of the ith male and female snakes, respectively, where the position of X r a n d m and X r a n d f ; f i m and f i f is the fitness value of the ith male and female snakes, respectively.
In the development stage, the snake eats or mates when there is enough food. Based on the snake’s behavior under different ambient temperature conditions, it can be divided into three modes: eating, combat, and mating.
The feeding mode is the snake’s behavior under the Temp > 0.6. The snake will move toward the food position. At this time, the position of the snake group can be expressed as:
X i , j t + 1 = X f o o d ± c 3 × T e m p × r × X f o o d X i , j t
where X i , j is the position of individual male or female snakes; X f o o d is the best individual position; c 3 is constant equals 2 by default.
When Temp < 0.6, snakes will be in combat or mating mode. The position of the battle-mode snake is shown as follows:
X i m t + 1 = X i m t ± c 3 × e x p ( f b e s t f f i   ) × r × X b e s t f X i m t
X i f t + 1 = X i f t ± c 3 × e x p ( f b e s t m f i   ) × r × X b e s t m X i f t
where X b e s t m and X b e s t f are the position of the best individual in the male and female snake populations, respectively, f b e s t m and f b e s t f are the fitness value of the best individual in the male and female snake populations, respectively, f i   is the fitness value of the whole snake group.
In the mating mode, male and female snakes will mate and lay eggs to create a new snake, replacing the worst individual in the female or male group. The snake’s position in this mode is:
X i m t + 1 = X i m t ± c 3 × e x p f i f f i m   × r × Q × X i f t X i m t
X i f t + 1 = X i f t ± c 3 × e x p ( f b e s t m f i   ) × r × X b e s t m X i f t

2.3. Evaluation Method

Evaluating the model prediction accuracy is usually necessary for the regression prediction model. The selected evaluation indicators of model prediction accuracy in this study are coefficient of determination (R2) and root mean square error (RMSE). The value of R2 ranges from 0 to 1, representing the accuracy of the prediction model. The closer the R2 value to 1, the higher the model prediction accuracy. The calculation of R2 is shown in Equation (21). RMSE represents the error between the predicted and actual model values, ranging from 0 to +∞. The smaller the RMSE value, the higher the prediction accuracy of the model. The RMSE calculation is shown in Equation (22):
R 2 = 1 i n ( y i y i ) 2 i n ( y i y ¯ ) 2
R M S E = 1 n i = 1 n ( y y ) 2
where y i and y i is the actual value and predictive value of the ith data, respectively, y ¯ is the average of actual values.

3. Data Collation and Data Construction

The accuracy of ML in predicting the CS of UHPC depends on the availability of sufficient high-quality data. This is also a crucial requirement for successfully applying all AI techniques. It is not easy to search and sort out the UHPC mix proportion and corresponding CS data since UHPC material is new and has been applied recently. This study established a dataset with 727 groups of UHPC mix proportions after integrating the research on the UHPC mechanical properties [5,28,29,30,31,32,33,34,35,36,37,38,39,40,41,42,43,44,45,46,47,48,49,50,51,52,53,54,55,56]. All data are shown in the Supplementary Materials. These data consist of 12 input characteristic parameters, including cement (C), silica fume (SF), slag (S), fly ash (FA), limestone powder (LP), nano silica (NS), water-to-binder ratio (w/b), quartz powder (QP), sand (Sa), steel fiber (Fi), superplasticizer (SP), and age (Ag). Table 1 illustrates the data characteristics, and Figure 5 shows the data distribution. The dataset is randomly divided into training and testing datasets, with 70% for training and 30% for testing.
Machine learning models require input variables to be as independent as possible when making predictions, thus we use Pearson correlation analysis to eliminate variables with a high correlation and reduce data redundancy, which in turn improves the prediction accuracy of the model. The correlation of the input parameters was analyzed using the correlation heat map to clarify whether the selected input variables were reasonable. The correlation matrix of the input parameters is obtained by calculating the Pearson correlation coefficient R. When |R| exceeds 0.7, it indicates multicollinearity among the input parameters, posing a risk of redundant selection [57]. The correlation analysis of the dataset’s parameters is visually represented in Figure 6, showing no |R| value exceeding 0.7, which demonstrates that there are no potential issues with the repeated selection of input variables.

4. Results and Discussions

4.1. Comparison between the Primary Prediction Algorithm Results

The RF, SVR, and KNN algorithms were employed to predict the CS of UHPC. The prediction results of the training and testing sets are displayed in Table 2 and Figure 7. It illustrates that the RF model has the best prediction for the training set, with R2 and RMSE values of 0.9813 and 0.0234, respectively. The prediction accuracy of the KNN ranks second, with R2 and RMSE values of 0.8018 and 0.4518, respectively. The prediction accuracy of the SVR is the lowest, with R2 and RMSE values of 0.7995 and 0.0765, respectively. It can be observed from the testing set that the RF still performed the best in prediction accuracy, with R2 and RMSE values of 0.8506 and 0.0632, respectively. The SVR ranked second among others. The lowest prediction accuracy was achieved by the KNN, with R2 and RMSE values of 0.6797 and 0.5485, respectively. Previous research [20,58,59] has proven that random forest (RF), as an integrated algorithm, has good performance in regression and classification tasks. The RF algorithm is suitable for predicting mechanical properties based on the concrete mix proportion. The main reason for this is that the randomness of the random forest in the selection process of each decision tree node is very suitable for more discrete data such as the concrete mix proportion. Therefore, RF can show good prediction accuracy and robustness.
The deviation of the prediction performance between the training and the testing set demonstrates that the three algorithms have different degrees of overfitting. Overfitting is a common problem in ML, characterized by good prediction performance in the training set while displaying poor prediction performance in the testing set. Hence, when the model suffers from overfitting issues, the model’s generalization and performance become poor. Therefore, the model’s overfitting degree can be observed from the difference between the evaluation indices of the training and testing sets. Figure 8 shows the overfitting of the RF, SVR, and KNN models. From Figure 8, it demonstrates that SVR has the lowest overfitting degree and RF has the highest.
Although the RF model’s evaluation result is the best, the overfitting degree is the highest, indicating that the RF model should be selected for parameter optimization to reduce its overfitting degree and improve its prediction accuracy.

4.2. Comparison of Results after Parameter Tuning

The PSO, BAS, and SO are selected to tune the parameters of the RF model to obtain a better prediction performance. Set the value range of the two hyperparameters of the random forest step size and decision tree, use the RMSE value of the prediction model as the objective function, and iterate to find the hyperparameters that can make the prediction model have higher accuracy.
Figure 9 depicts the optimization process of the RF model using the three optimization algorithms. It reveals that the PSO achieves convergence first, followed by BAS. However, the rapid convergence of both algorithms can obscure their ability to search for the optimal value in local areas. Therefore, the final fitness results indicate that although SO converges slowly, it can be improved in the later stages of operation to escape local optima. As a result, the SO algorithm yields the best optimization effect.
Figure 10 shows the evaluation results of the prediction performance for the combined algorithms, SO-RF, PSO-RF, and BAS-RF. Table 3 lists the results of the RF model after optimization. From Table 3 and Figure 10, we observe that the SO-RF model exhibits the best prediction performance, the R2 and RMSE values of the training set are 0.9869 and 0.0204, respectively, and the R2 and RMSE values of the testing set are 0.9141 and 0.0579, respectively. Figure 11 depicts the improvement in the prediction performance compared to the original RF model. Figure 11 demonstrates that the prediction performance of the training set and testing set increases to different degrees, indicating that the optimization algorithm’s effect is different. In this regard, the R2 and RMSE of the testing set for the SO-RF model are improved by 7.47% and 8.39%, respectively, which are the highest among the three optimization models, indicating that the SO algorithm is the best to enhance the RF model’s prediction performance. Figure 12 highlights the overfitting issues in the RF model, optimized by three optimization algorithms. It exhibits that the SO-RF model has the lowest degree of overfitting, indicating that the SO algorithm optimizes the RF model and effectively avoids the overfitting problem.
Figure 13 and Figure 14 compare the predicted and tested CS of UHPC values in the training and the testing sets, respectively. From Figure 13 and Figure 14, it can be illustrated that the predicted value aligns well with the tested value. Although there are random errors for individual items, it would not affect the overall trend of superior prediction capacity of the SO-RF model. In other words, the SO-RF model can be utilized to predict the CS of UHPC with various mix proportions and ages, and can also be applied to investigate the impact of the amount of each concrete component on the mechanical properties of UHPC.

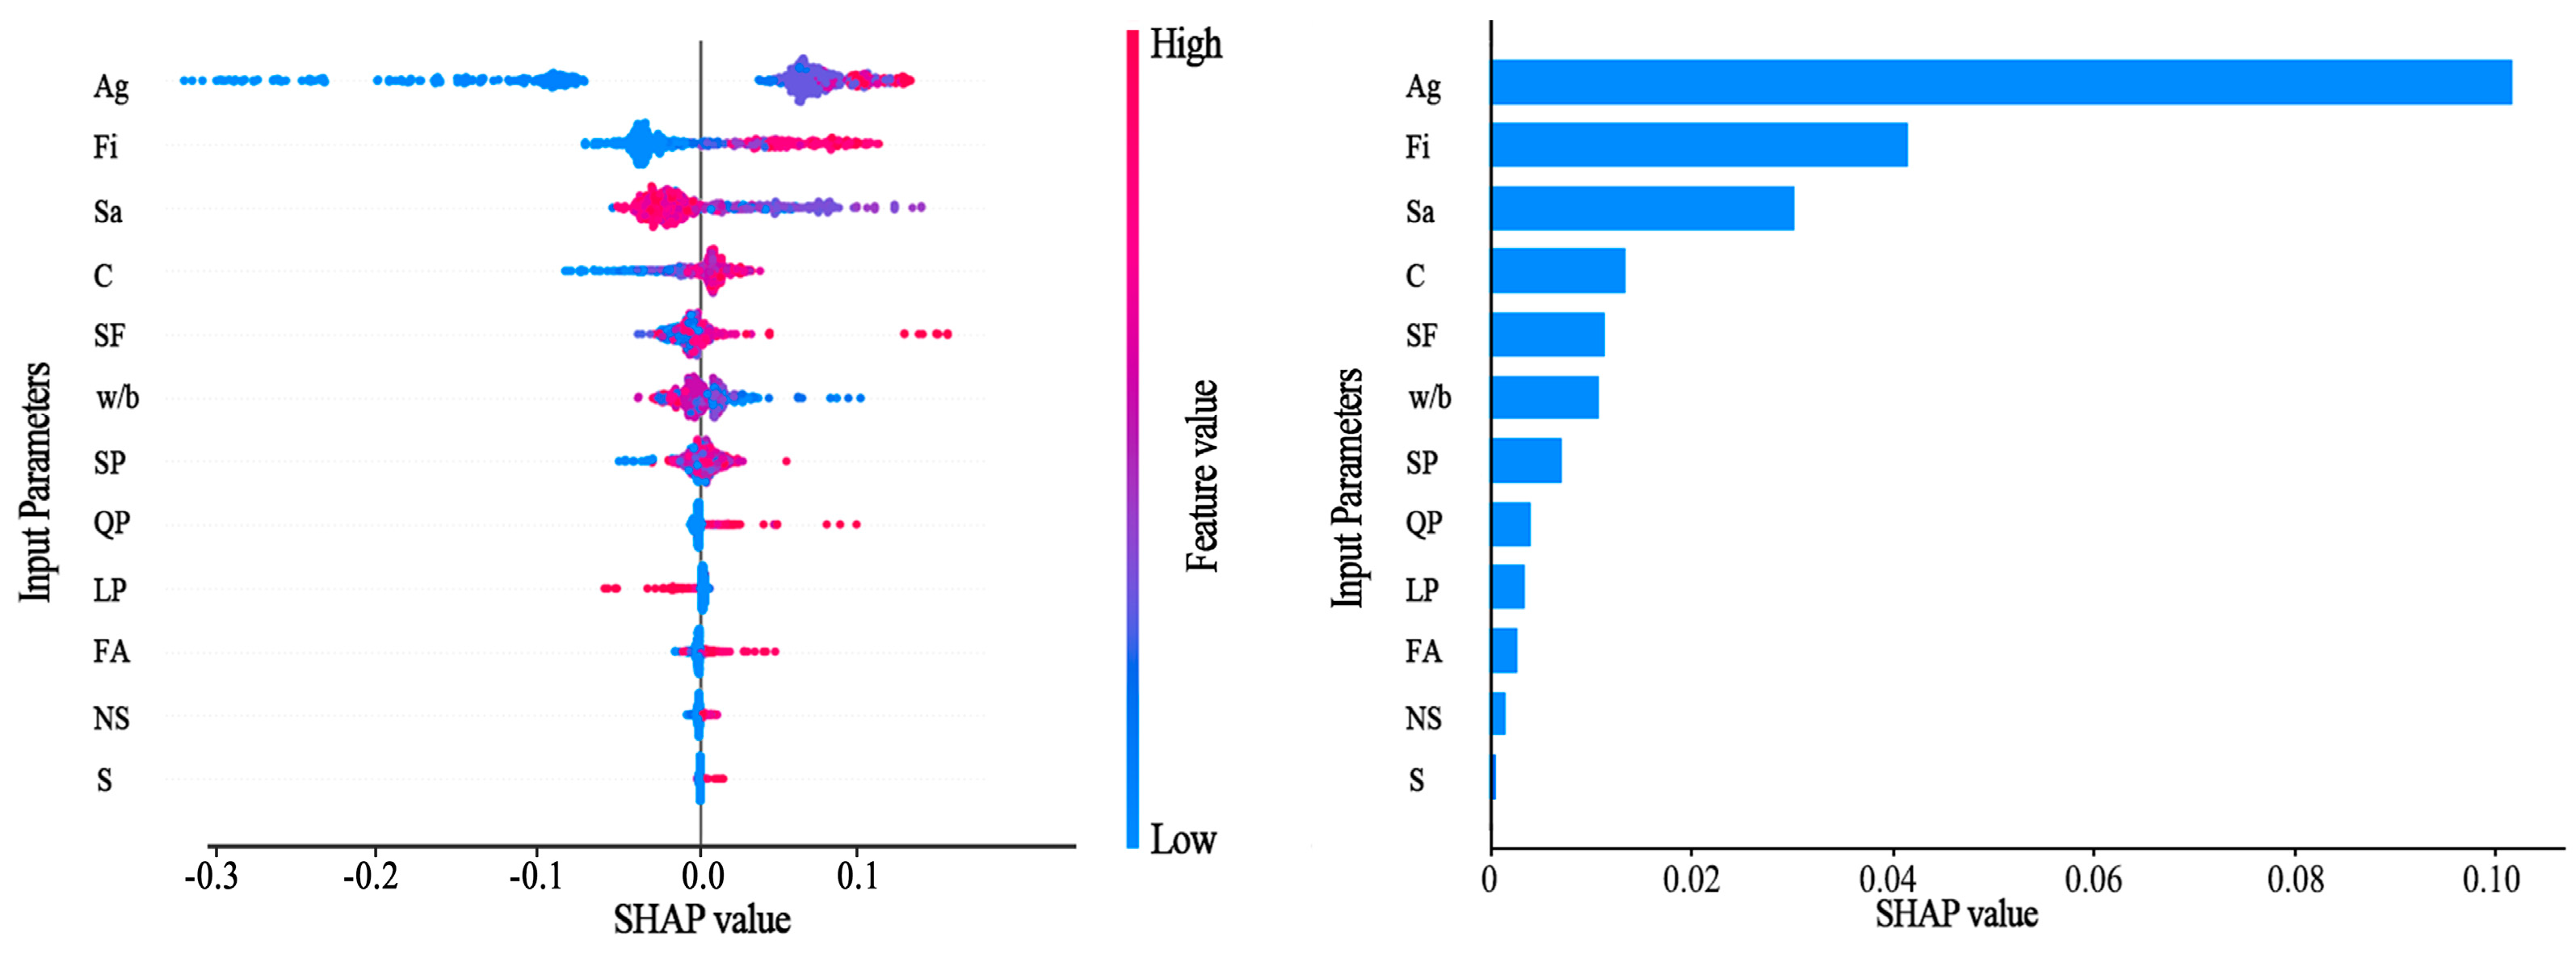
4.3. Importance Analysis and Partial Dependence Plot Analysis of Input Parameters

Clarifying the importance of input parameters is essential to neglecting factors with little influence, reducing dimensions, and improving the model’s training speed. Simultaneously, screening out the input parameters with high importance is beneficial to improving the model’s prediction performance and enhancing the model’s interpretability.
Figure 15 depicts the importance of the input variables derived from the trained SO-RF model using SHapley Additive exPlanation (SHAP) analysis. From Figure 15, we found that the most influential parameters on CS predictions were the age (Ag), steel fiber (Fi), sand (Sa), cement (C), silica fume (SF), and water-to-binder ratio (w/b), respectively. The influence of age on CS showed a significant positive correlation, meaning that with the increase in age, the compressive strength of UHPC increases greatly, which may be attributed to the progress of cement hydration. Then, followed by Fi and Sa. The addition of steel fiber in UHPC could increase its CS by restricting the development of internal cracks [60]. The sand content plays a crucial role in shaping the pore structure of cement mortar [61]. A rise in sand content leads to a decrease in the overall porosity of cement mortar, which results in improving the CS of UHPC. Additionally, the parameters C and w/b also significantly influenced the CS of UHPC. This is primarily because the extent of cement hydration impacts the ultimate CS of UHPC. Regarding silica fume, although the content of SF is not high compared to cement, it still has a significant impact on the CS of UHPC. This is mainly due to its high pozzolanic activity and fine filler effect [62]. Other input parameters such as slag (S) and limestone powder (LP) had minimal influence on the CS.

4.4. Partial Dependence Plot Analysis of the Important Input Parameters

Partial dependence plot analysis can provide a quantitative measure of the influence of specific input parameters on output parameters [63]. In order to improve the robustness of the interpretation results, the data used for the partial dependence plots analysis are 100 randomly selected data from the training set. In conjunction with the evaluation results of the importance of input parameters obtained from Section 4.3, we selected the top six input parameters for partial dependence analysis. The results of this analysis are presented in Figure 16. Each thin blue line in Figure 16 is the individual conditional expectation (ICE) curve of an input variable, while the thick blue line represents the average trend line of all ICE curves.
As illustrated in Figure 16a, the CS of UHPC shows a significant positive correlation with age. From 0–14 days, notable increases in CS with age are observed, followed by a steady increase until the age exceeds 75 days. Then, the CS tends to be stable. This agrees well with the experimental results obtained by Xu et al. [64]. Figure 16b indicates that the CS can be enhanced with the increase in steel fiber contents. A fiber content higher than 80 kg/m3 is recommended to achieve a more stable high strength. Figure 16c shows that there is an optimized sand content of 700–850 kg/m3 for obtaining higher CS of UHPC. When the density of UHPC remains relatively stable, a higher proportion of sand may reduce the dosage of cementitious materials, which is detrimental to improving the CS of UHPC. From Figure 16d, it can be observed that the impact of increasing cement content on CS is more significant within the 0–850 kg/m3 range when compared to values above 850 kg/m3. The limited effect of higher cement content on CS may be attributed to the incomplete hydration in the low w/b environment, resulting in the minimal enhancement of the CS of UHPC. Additionally, Figure 16e demonstrates that an increase in silica fume content up to 50 kg/m3 significantly affects the CS. However, when the silica fume content exceeds 200 kg/m3, the effect on the CS diminishes. Figure 16f illustrates a negative correlation between the w/b and the CS of UHPC. The lower the w/b, the higher the CS. However, a w/b between 0.16 and 0.2 is recommended for preparing UHPC.
Figure 16 shows the variation in CS, resulting from changes in the important components of the mix proportion of UHPC. Thus, the preliminary design of the UHPC mix proportion can be achieved by utilizing the findings from partial dependence plots (PDP).

5. Conclusions

This study proposes an optimized machine learning model, utilizing the meta-heuristic optimization algorithm to predict the CS of UHPC. A model with a better prediction performance is obtained. With the help of the existing UHPC mix proportion data, an accurate CS prediction is achieved using 12 input parameters, and the input parameters’ importance is evaluated and analyzed. The following conclusions can be drawn:
  • The RF model was used to predict the CS of the UHPC, and the R2 of the testing set was 0.85. However, there were some overfitting issues observed. The RF model has the potential to improve the prediction performance.
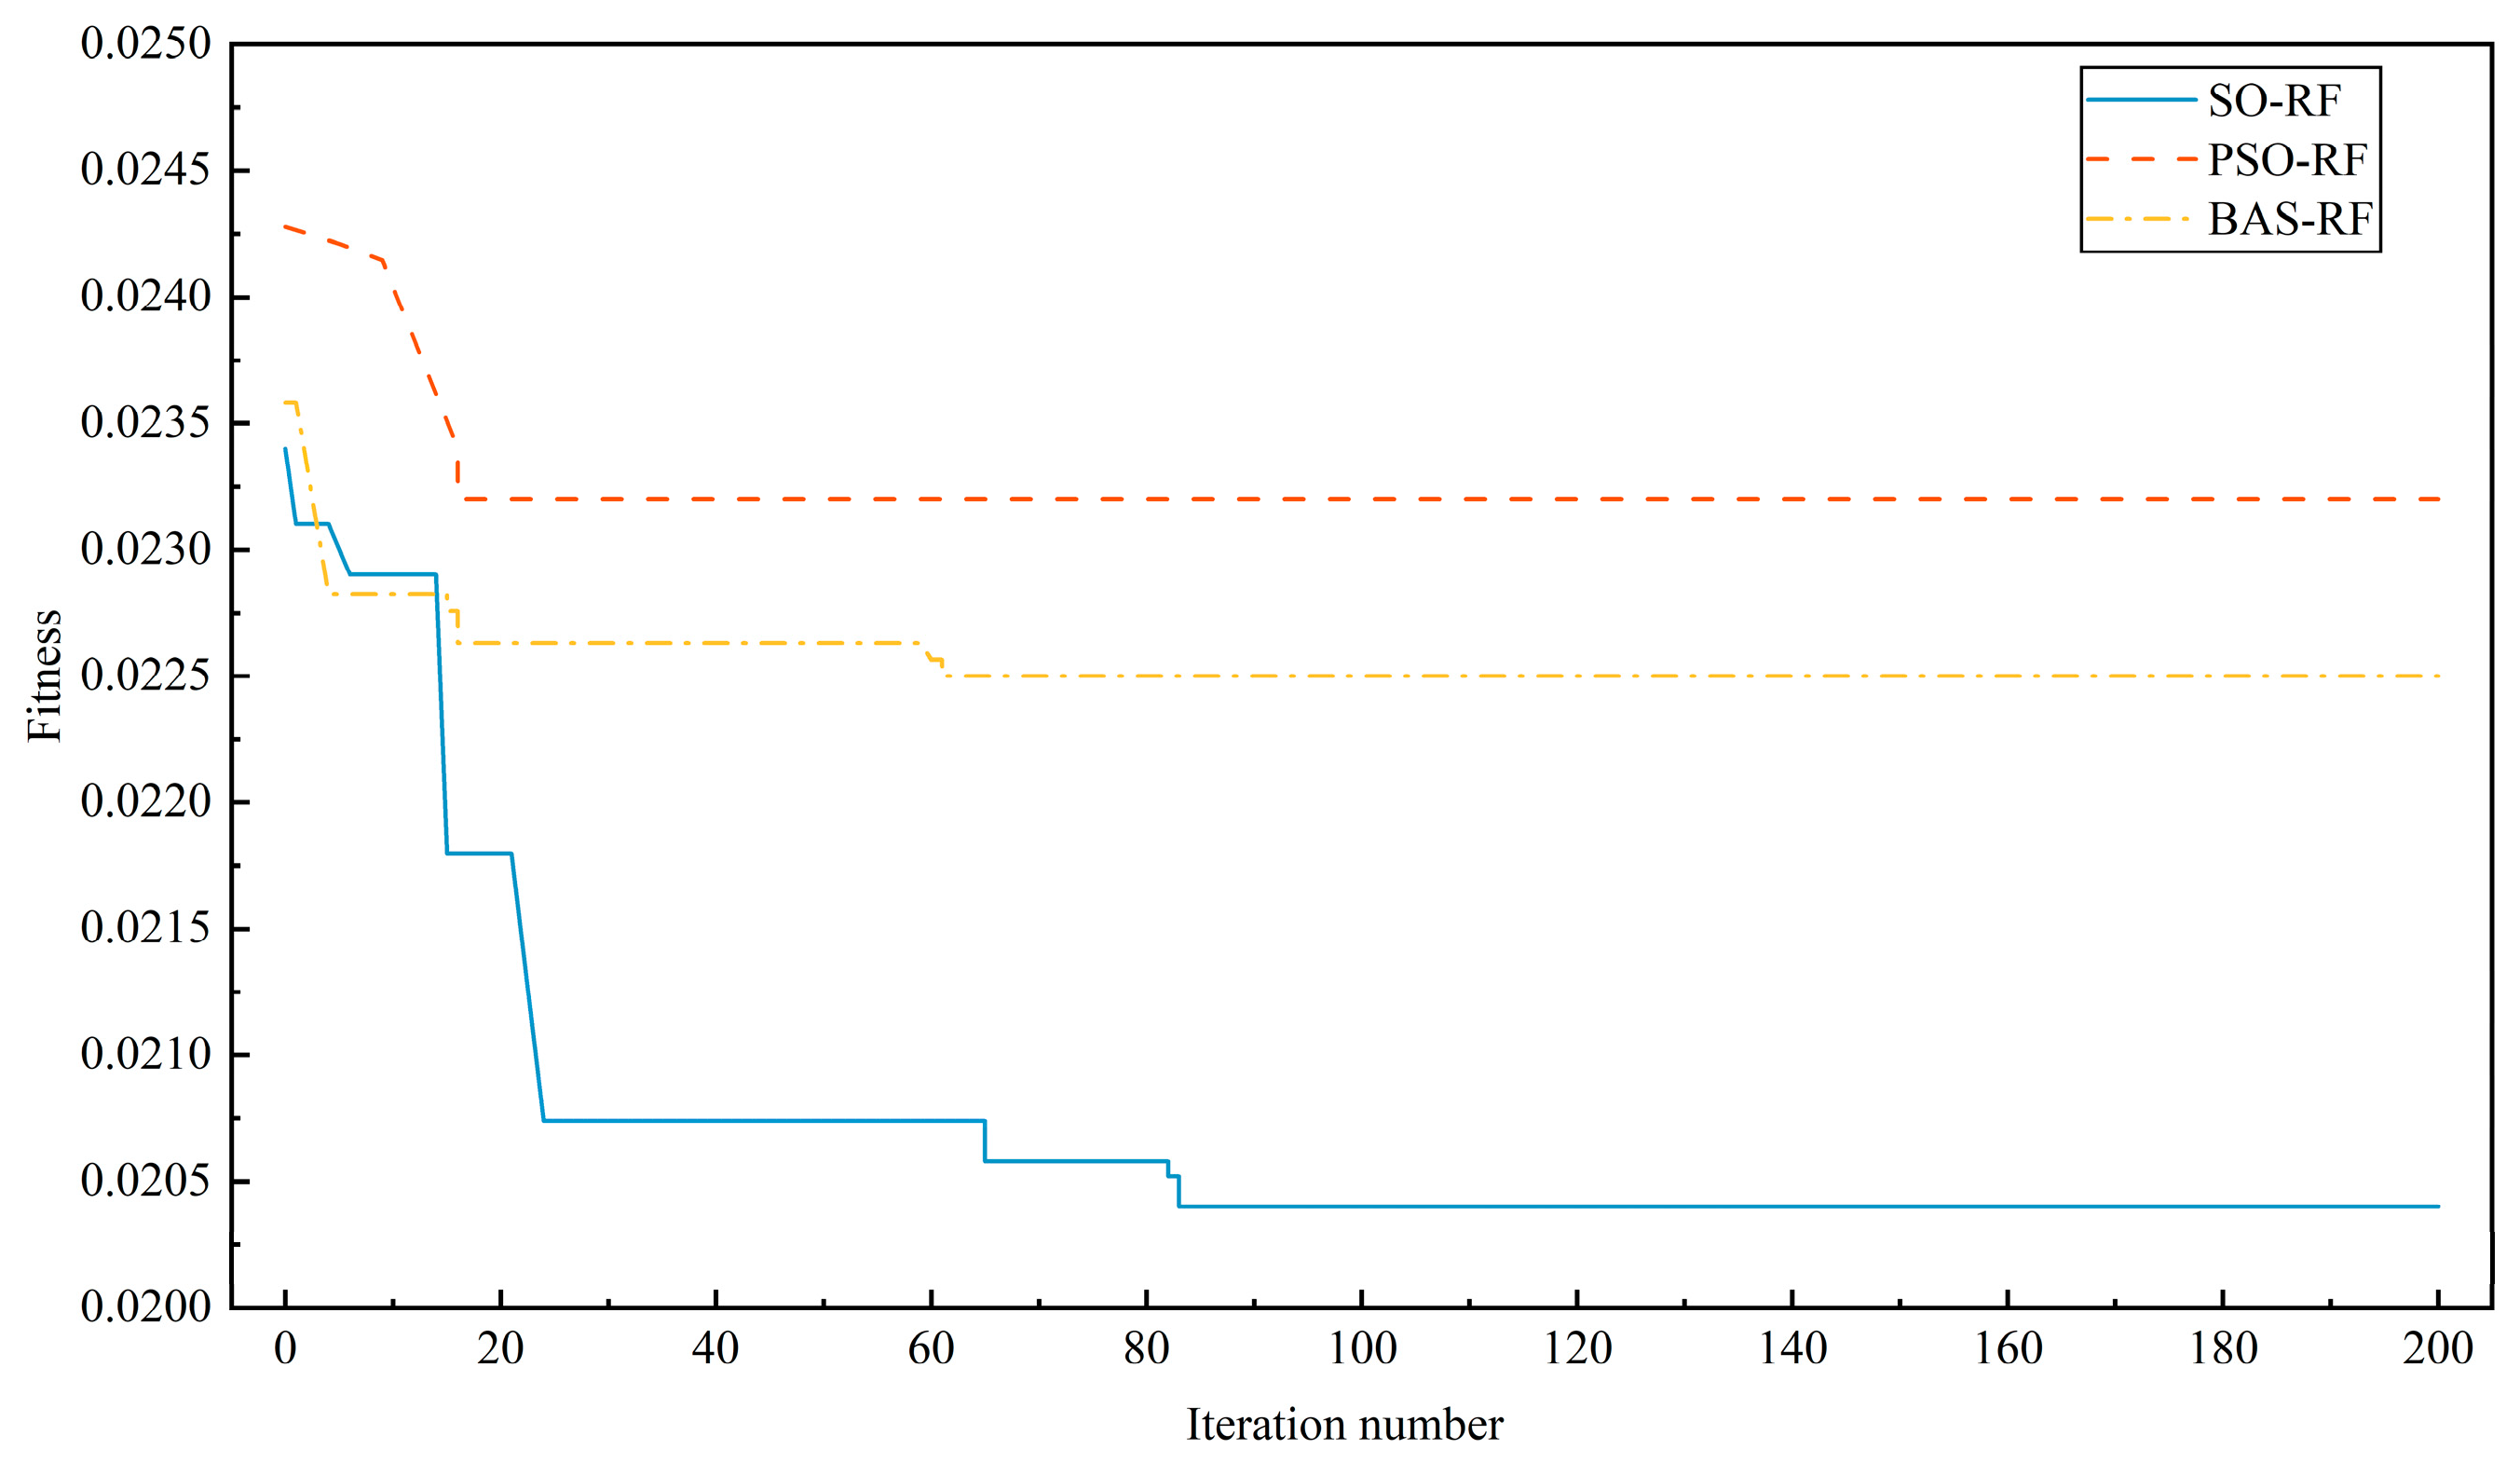
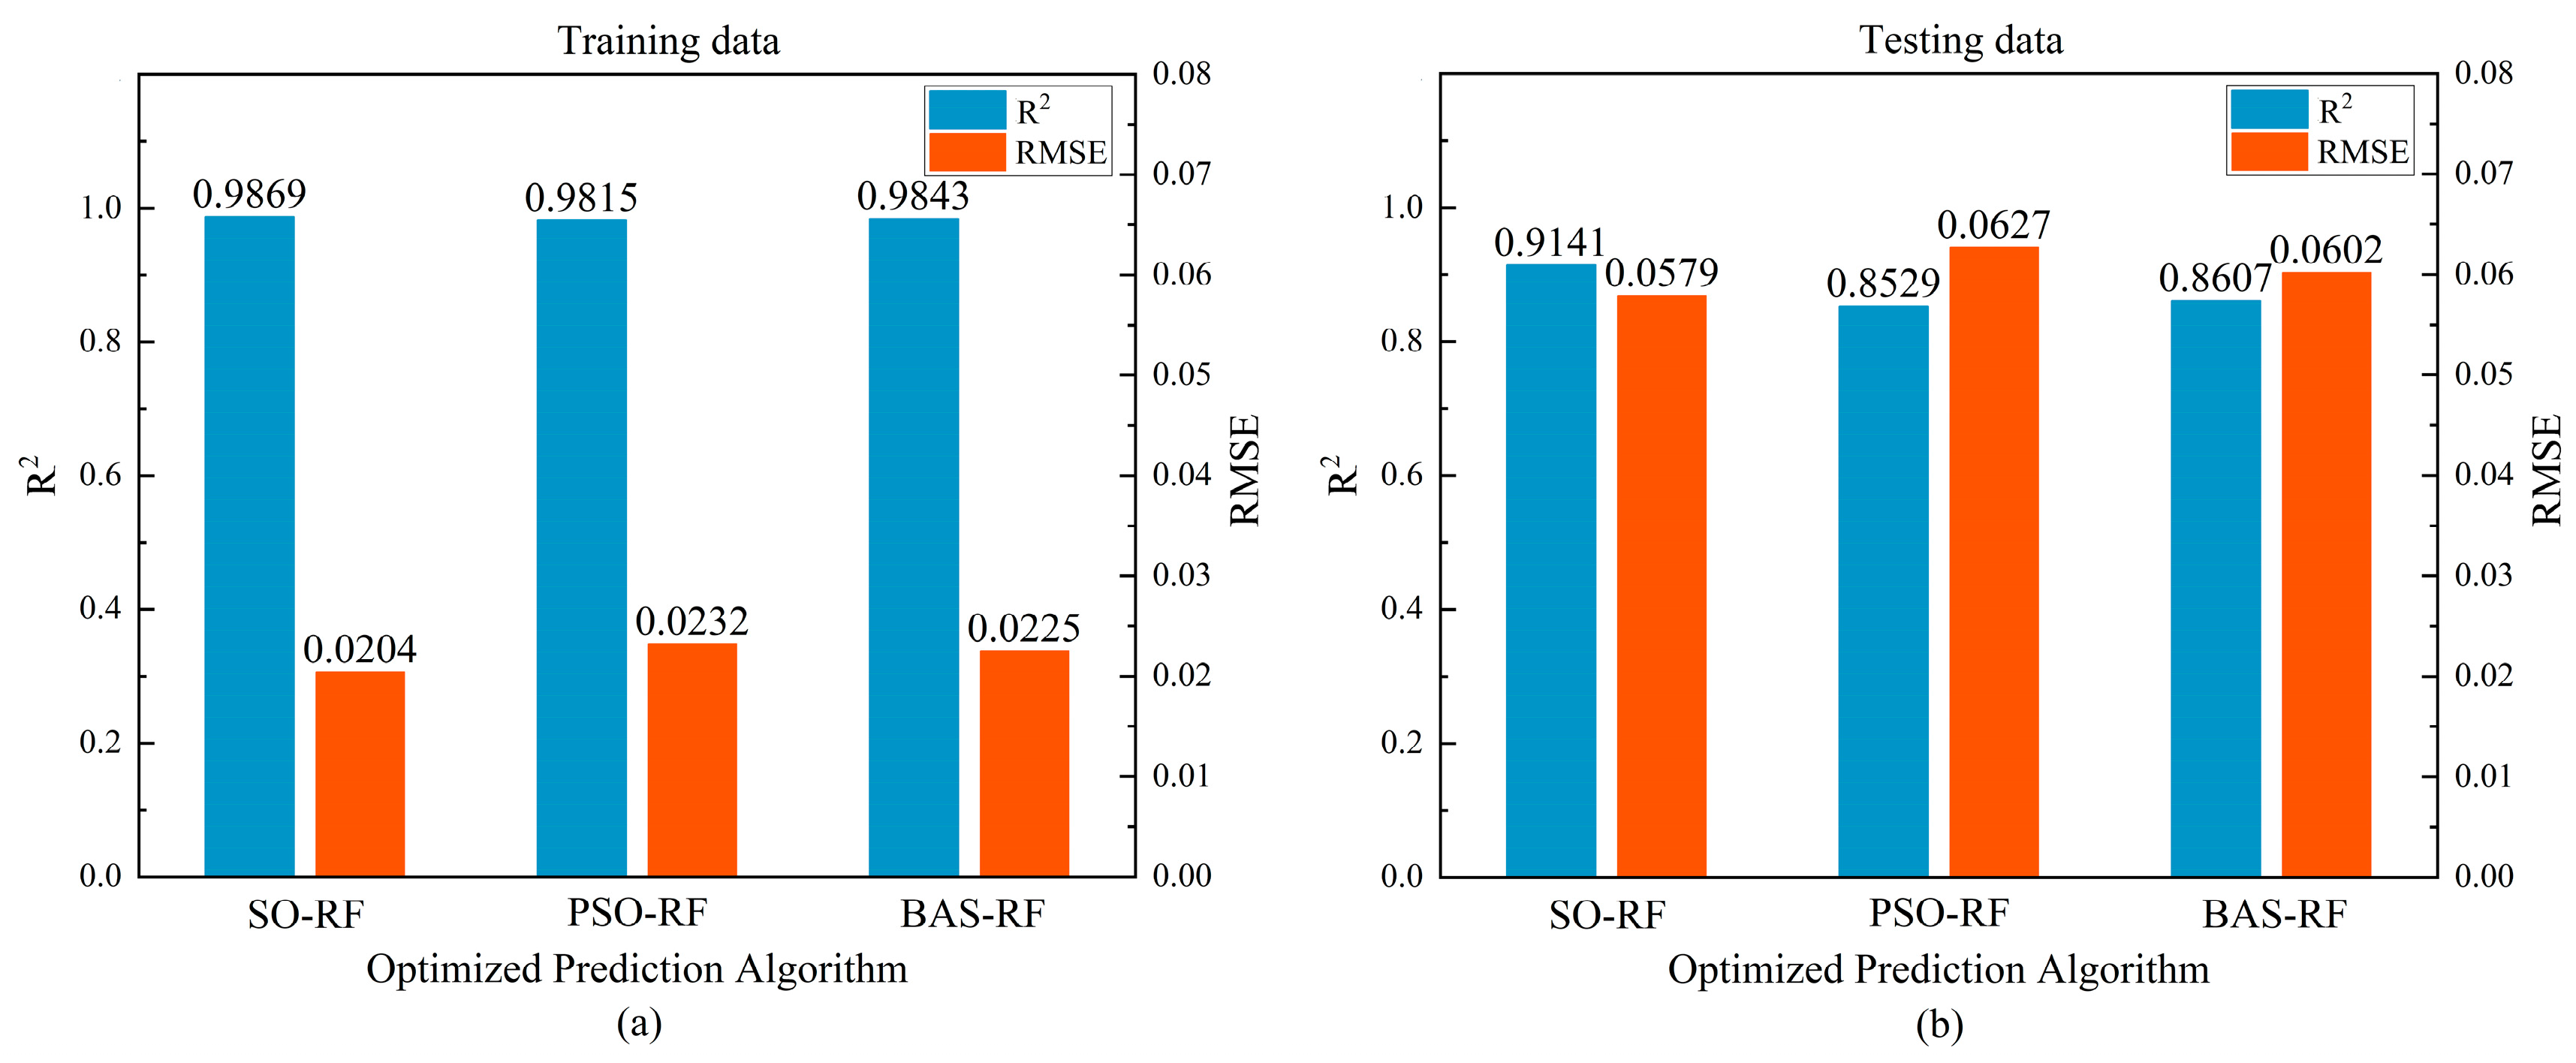
  • It is necessary to tune the hyperparameters of the prediction model. The model’s prediction performance can be improved to varying degrees by using different meta-heuristic algorithms to optimize the prediction model’s hyperparameters. The SO algorithm’s optimization improvement is the most obvious, in which the R2 and RMSE were enhanced by 7.47% and 8.39%, respectively.
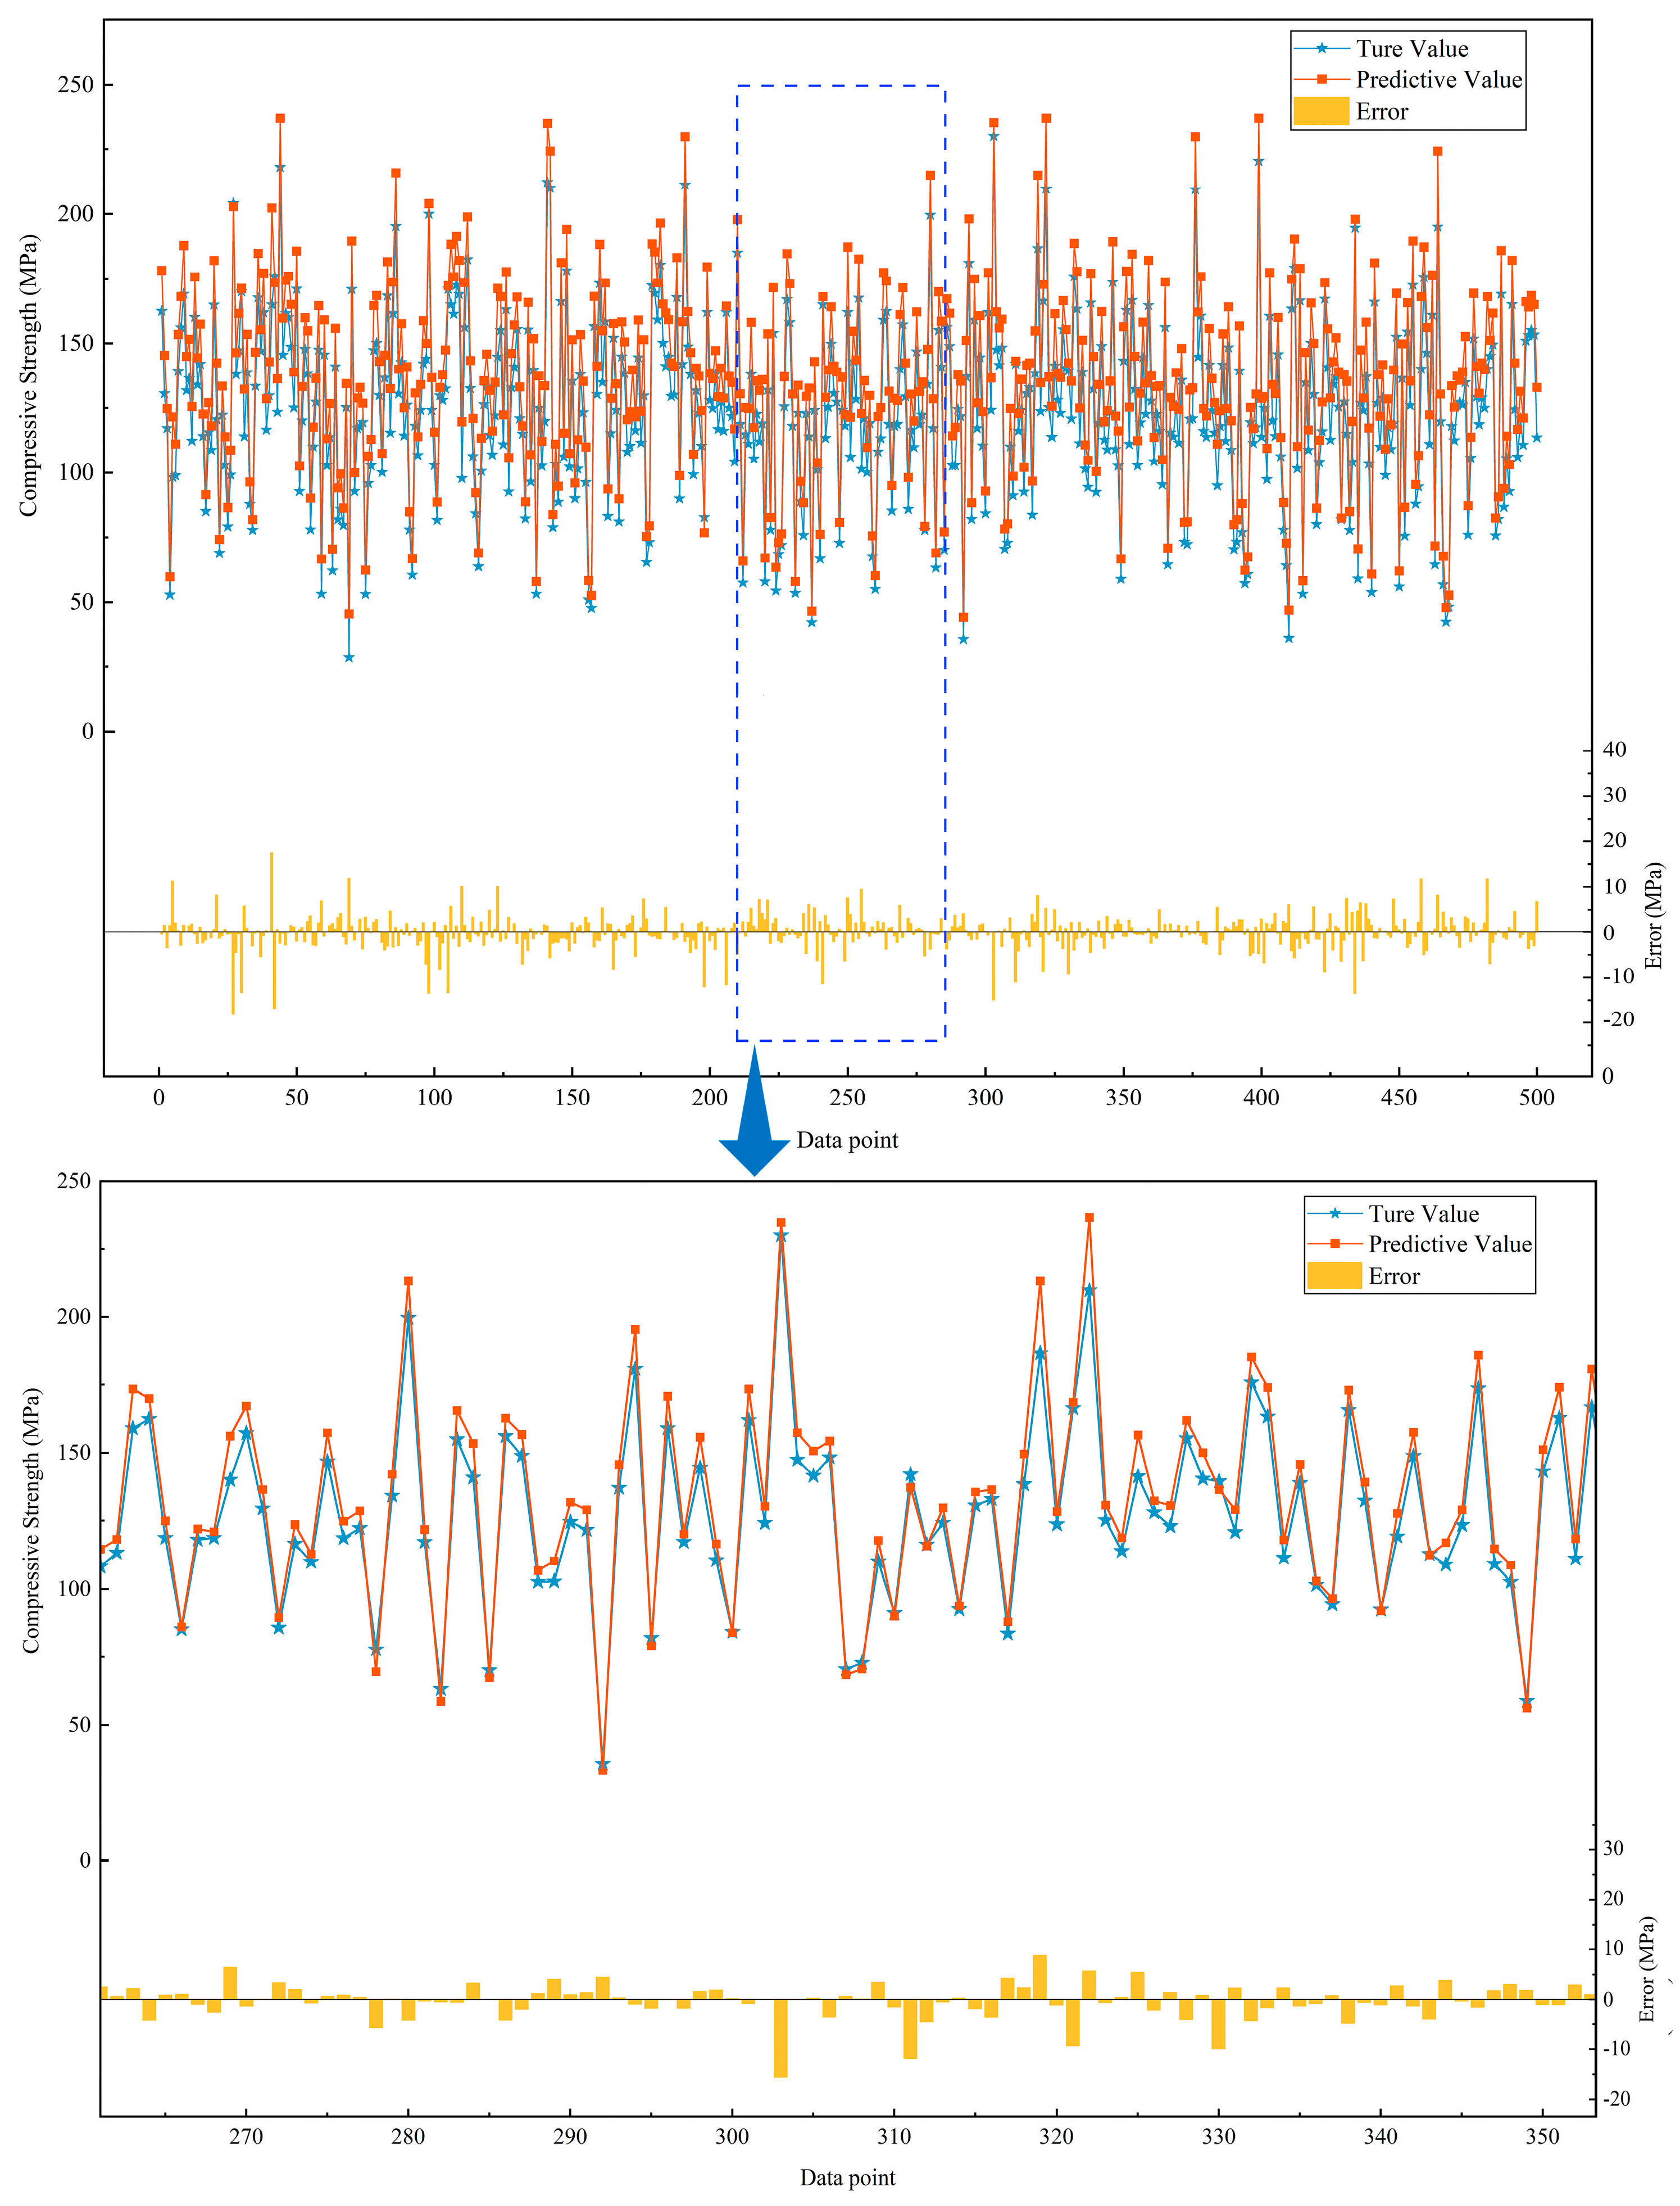
  • The SO algorithm realizes the RF model’s optimization, reduces the overfitting degree of the RF model, and improves its prediction performance. The R2 of the training and testing sets was 0.9869 and 0.9141, respectively, which shows that the SO-RF model proposed in this paper has the best prediction performance and can achieve accurate UHPC CS prediction.
  • Based on the parameters’ importance, obtained from the SO-RF model analysis, age has the greatest impact on the CS of UHPC, followed by the amount of silica fume. These observations are consistent with the existing research results.
  • Partial dependence plots analysis highlighted the influence of the parameters on the predicted CS of UHPC and provided a reference for the mix proportion design of UHPC.
This study may have limitations due to its small dataset size and insufficient consideration of factors such as curing conditions and aggregate size range. In the future, it is possible to increase the data volume in the database, which will further enhance the predictive performance of the model. At the same time, predictive models can be developed to estimate other performance factors of UHPC, including bending strength, flowability porosity, and early shrinkage. Additionally, these metaheuristic optimization algorithms can be utilized to optimize UHPC mix proportions based on the desired compressive strength.

Supplementary Materials

The following supporting information can be downloaded at: https://www.mdpi.com/article/10.3390/buildings14051209/s1.

Author Contributions

Conceptualization, X.N., X.Y. and Y.L.; methodology, Y.L., C.R., L.W. and X.Y.; software, Y.L., X.Y., L.W. and C.R.; validation, Y.L., X.Y., C.R. and X.N.; formal analysis, X.Y. and X.N.; investigation, Y.L., L.W. and X.Y.; resources, Y.L. and X.Y.; data curation, X.Y. and X.N.; writing—original draft preparation, Y.L. and X.Y.; writing—review and editing, Y.L. and X.N.; visualization, Y.L. and X.Y.; supervision, Y.L. and X.N.; project administration, X.N.; funding acquisition, X.N. All authors have read and agreed to the published version of the manuscript.

Funding

This research was funded by the National Natural Science Foundation of China (grant number 51608100), Natural Science Fund project of Jilin Province Science and Technology Department (grant number 20230101331JC) and Science and Technology Project of Jilin Province Education Department (grant number JJKH20220121KJ).

Data Availability Statement

The data presented in this study are available on reasonable request from the corresponding author.

Conflicts of Interest

The authors declare no conflicts of interest.

References

  1. Yu, K.-Q.; Lu, Z.-D.; Dai, J.-G.; Shah, S.P. Direct tensile properties and stress–strain model of UHP-ECC. J. Mater. Civ. Eng. 2020, 32, 04019334. [Google Scholar] [CrossRef]
  2. Solhmirzaei, R.; Salehi, H.; Kodur, V.; Naser, M. Machine learning framework for predicting failure mode and shear capacity of ultra high performance concrete beams. Eng. Struct. 2020, 224, 111221. [Google Scholar] [CrossRef]
  3. Wang, X.; Wu, D.; Zhang, J.; Yu, R.; Hou, D.; Shui, Z. Design of sustainable ultra-high performance concrete: A review. Constr. Build. Mater. 2021, 307, 124643. [Google Scholar] [CrossRef]
  4. Aldwaik, M.; Adeli, H. Advances in optimization of highrise building structures. Struct. Multidiscip. Optim. 2014, 50, 899–919. [Google Scholar] [CrossRef]
  5. Shahin, M.A. State-of-the-art review of some artificial intelligence applications in pile foundations. Geosci. Front. 2016, 7, 33–44. [Google Scholar] [CrossRef]
  6. Sun, B.; Cui, W.; Liu, G.; Zhou, B.; Zhao, W. A hybrid strategy of AutoML and SHAP for automated and explainable concrete strength prediction. Case Stud. Constr. Mater. 2023, 19, e02405. [Google Scholar] [CrossRef]
  7. Salehi, H.; Burgueño, R. Emerging artificial intelligence methods in structural engineering. Eng. Struct. 2018, 171, 170–189. [Google Scholar] [CrossRef]
  8. Yeh, I.-C. Modeling of strength of high-performance concrete using artificial neural networks. Cem. Concr. Res. 1998, 28, 1797–1808. [Google Scholar] [CrossRef]
  9. Yeh, I.-C. Design of high-performance concrete mixture using neural networks and nonlinear programming. J. Comput. Civ. Eng. 1999, 13, 36–42. [Google Scholar] [CrossRef]
  10. Gupta, S. Support vector machines based modelling of concrete strength. Int. J. Intel. Technol. 2007, 3, 12–18. [Google Scholar]
  11. Topcu, I.B.; Sarıdemir, M. Prediction of compressive strength of concrete containing fly ash using artificial neural networks and fuzzy logic. Comput. Mater. Sci. 2008, 41, 305–311. [Google Scholar] [CrossRef]
  12. Topçu, İ.B.; Sarıdemir, M. Prediction of mechanical properties of recycled aggregate concretes containing silica fume using artificial neural networks and fuzzy logic. Comput. Mater. Sci. 2008, 42, 74–82. [Google Scholar] [CrossRef]
  13. Abellán-García, J. Four-layer perceptron approach for strength prediction of UHPC. Constr. Build. Mater. 2020, 256, 119465. [Google Scholar] [CrossRef]
  14. Kumar, R.; Rai, B.; Samui, P. A comparative study of prediction of compressive strength of ultra-high performance concrete using soft computing technique. Struct. Concr. 2023, 24, 5538–5555. [Google Scholar] [CrossRef]
  15. Mahjoubi, S.; Meng, W.; Bao, Y. Auto-tune learning framework for prediction of flowability, mechanical properties, and porosity of ultra-high-performance concrete (UHPC). Appl. Soft Comput. 2022, 115, 108182. [Google Scholar] [CrossRef]
  16. Tavares, C.; Wang, X.; Saha, S.; Grasley, Z. Machine learning-based mix design tools to minimize carbon footprint and cost of UHPC. Part 1: Efficient data collection and modeling. Clean. Mater. 2022, 4, 100082. [Google Scholar] [CrossRef]
  17. Bergstra, J.; Bengio, Y. Random search for hyper-parameter optimization. J. Mach. Learn. Res. 2012, 13, 281–305. [Google Scholar]
  18. Bao, Y.; Liu, Z. A fast grid search method in support vector regression forecasting time series. In Proceedings of the Intelligent Data Engineering and Automated Learning–IDEAL 2006: 7th International Conference, Burgos, Spain, 20–23 September 2006; pp. 504–511. [Google Scholar]
  19. Li, X.; Ma, H.; Zhang, C. Embedded Bionic Intelligent Optimization Scheme for Complex Systems. In Proceedings of the 2006 IEEE International Conference on Information Acquisition, Veihai, China, 20–23 August 2006; pp. 1359–1363. [Google Scholar]
  20. Zhang, J.; Ma, G.; Huang, Y.; Aslani, F.; Nener, B. Modelling uniaxial compressive strength of lightweight self-compacting concrete using random forest regression. Constr. Build. Mater. 2019, 210, 713–719. [Google Scholar] [CrossRef]
  21. Yu, Y.; Li, W.; Li, J.; Nguyen, T.N. A novel optimised self-learning method for compressive strength prediction of high performance concrete. Constr. Build. Mater. 2018, 184, 229–247. [Google Scholar] [CrossRef]
  22. Liaw, A.; Wiener, M. Classification and regression by randomForest. R News 2002, 2, 18–22. [Google Scholar]
  23. Vapnik, V.N. A note on one class of perceptrons. Automat. Rem. Control 1964, 25, 821–837. [Google Scholar]
  24. Smola, A.J.; Schölkopf, B. A tutorial on support vector regression. Stat. Comput. 2004, 14, 199–222. [Google Scholar] [CrossRef]
  25. Kennedy, J.; Eberhart, R. Particle swarm optimization. In Proceedings of the ICNN’95-International Conference on Neural Networks, Perth, WA, Australia, 27 November 1995–1 December 1995; pp. 1942–1948. [Google Scholar]
  26. Jiang, X.; Li, S. BAS: Beetle antennae search algorithm for optimization problems. Int. J. Robot. Control 2018, 1, 1–5. [Google Scholar] [CrossRef]
  27. Hashim, F.A.; Hussien, A.G. Snake Optimizer: A novel meta-heuristic optimization algorithm. Knowl.-Based Syst. 2022, 242, 108320. [Google Scholar] [CrossRef]
  28. Wang, C.; Yang, C.; Liu, F.; Wan, C.; Pu, X. Preparation of ultra-high performance concrete with common technology and materials. Cem. Concr. Compos. 2012, 34, 538–544. [Google Scholar] [CrossRef]
  29. Ghafari, E.; Costa, H.; Júlio, E.; Portugal, A.; Durães, L. The effect of nanosilica addition on flowability, strength and transport properties of ultra high performance concrete. Mater. Des. 2014, 59, 1–9. [Google Scholar] [CrossRef]
  30. Randl, N.; Steiner, T.; Ofner, S.; Baumgartner, E.; Mészöly, T. Development of UHPC mixtures from an ecological point of view. Constr. Build. Mater. 2014, 67, 373–378. [Google Scholar] [CrossRef]
  31. Yu, R.; Spiesz, P.; Brouwers, H. Effect of nano-silica on the hydration and microstructure development of Ultra-High Performance Concrete (UHPC) with a low binder amount. Constr. Build. Mater. 2014, 65, 140–150. [Google Scholar] [CrossRef]
  32. Yu, R.; Spiesz, P.; Brouwers, H. Mix design and properties assessment of ultra-high performance fibre reinforced concrete (UHPFRC). Cem. Concr. Res. 2014, 56, 29–39. [Google Scholar] [CrossRef]
  33. Yu, R.; Spiesz, P.; Brouwers, H. Development of Ultra-High Performance Fibre Reinforced Concrete (UHPFRC): Towards an efficient utilization of binders and fibres. Constr. Build. Mater. 2015, 79, 273–282. [Google Scholar] [CrossRef]
  34. Janković, K.; Stanković, S.; Bojović, D.; Stojanović, M.; Antić, L. The influence of nano-silica and barite aggregate on properties of ultra high performance concrete. Constr. Build. Mater. 2016, 126, 147–156. [Google Scholar] [CrossRef]
  35. Wu, Z.; Shi, C.; Khayat, K.H.; Wan, S. Effects of different nanomaterials on hardening and performance of ultra-high strength concrete (UHSC). Cem. Concr. Compos. 2016, 70, 24–34. [Google Scholar] [CrossRef]
  36. Hassan, M.; Wille, K. Experimental impact analysis on ultra-high performance concrete (UHPC) for achieving stress equilibrium (SE) and constant strain rate (CSR) in Split Hopkinson pressure bar (SHPB) using pulse shaping technique. Constr. Build. Mater. 2017, 144, 747–757. [Google Scholar] [CrossRef]
  37. Jang, H.-O.; Lee, H.-S.; Cho, K.; Kim, J. Experimental study on shear performance of plain construction joints integrated with ultra-high performance concrete (UHPC). Constr. Build. Mater. 2017, 152, 16–23. [Google Scholar] [CrossRef]
  38. Shafieifar, M.; Farzad, M.; Azizinamini, A. Experimental and numerical study on mechanical properties of Ultra High Performance Concrete (UHPC). Constr. Build. Mater. 2017, 156, 402–411. [Google Scholar] [CrossRef]
  39. Wu, Z.; Shi, C.; He, W.; Wang, D. Static and dynamic compressive properties of ultra-high performance concrete (UHPC) with hybrid steel fiber reinforcements. Cem. Concr. Compos. 2017, 79, 148–157. [Google Scholar] [CrossRef]
  40. Kang, S.-H.; Jeong, Y.; Tan, K.H.; Moon, J. The use of limestone to replace physical filler of quartz powder in UHPFRC. Cem. Concr. Compos. 2018, 94, 238–247. [Google Scholar] [CrossRef]
  41. Sadrmomtazi, A.; Tajasosi, S.; Tahmouresi, B. Effect of materials proportion on rheology and mechanical strength and microstructure of ultra-high performance concrete (UHPC). Constr. Build. Mater. 2018, 187, 1103–1112. [Google Scholar] [CrossRef]
  42. Song, Q.; Yu, R.; Shui, Z.; Wang, X.; Rao, S.; Lin, Z. Optimization of fibre orientation and distribution for a sustainable Ultra-High Performance Fibre Reinforced Concrete (UHPFRC): Experiments and mechanism analysis. Constr. Build. Mater. 2018, 169, 8–19. [Google Scholar] [CrossRef]
  43. Wu, Z.; Shi, C.; Khayat, K.H.; Xie, L. Effect of SCM and nano-particles on static and dynamic mechanical properties of UHPC. Constr. Build. Mater. 2018, 182, 118–125. [Google Scholar] [CrossRef]
  44. Kang, S.-H.; Hong, S.-G.; Moon, J. The use of rice husk ash as reactive filler in ultra-high performance concrete. Cem. Concr. Res. 2019, 115, 389–400. [Google Scholar] [CrossRef]
  45. Li, Y.; Tan, K.H.; Yang, E.-H. Synergistic effects of hybrid polypropylene and steel fibers on explosive spalling prevention of ultra-high performance concrete at elevated temperature. Cem. Concr. Compos. 2019, 96, 174–181. [Google Scholar] [CrossRef]
  46. Yoo, D.-Y.; Kim, M.-J. High energy absorbent ultra-high-performance concrete with hybrid steel and polyethylene fibers. Constr. Build. Mater. 2019, 209, 354–363. [Google Scholar] [CrossRef]
  47. Zhang, H.; Ji, T.; He, B.; He, L. Performance of ultra-high performance concrete (UHPC) with cement partially replaced by ground granite powder (GGP) under different curing conditions. Constr. Build. Mater. 2019, 213, 469–482. [Google Scholar] [CrossRef]
  48. Zhang, X.; Zhao, S.; Liu, Z.; Wang, F. Utilization of steel slag in ultra-high performance concrete with enhanced eco-friendliness. Constr. Build. Mater. 2019, 214, 28–36. [Google Scholar] [CrossRef]
  49. Alsalman, A.; Dang, C.N.; Prinz, G.S.; Hale, W.M. Evaluation of modulus of elasticity of ultra-high performance concrete. Constr. Build. Mater. 2017, 153, 918–928. [Google Scholar] [CrossRef]
  50. Ahmad, S.; Mohaisen, K.O.; Adekunle, S.K.; Al-Dulaijan, S.U.; Maslehuddin, M. Influence of admixing natural pozzolan as partial replacement of cement and microsilica in UHPC mixtures. Constr. Build. Mater. 2019, 198, 437–444. [Google Scholar] [CrossRef]
  51. Gesoglu, M.; Güneyisi, E.; Asaad, D.S.; Muhyaddin, G.F. Properties of low binder ultra-high performance cementitious composites: Comparison of nanosilica and microsilica. Constr. Build. Mater. 2016, 102, 706–713. [Google Scholar] [CrossRef]
  52. Yang, R.; Yu, R.; Shui, Z.; Gao, X.; Xiao, X.; Zhang, X.; Wang, Y.; He, Y. Low carbon design of an Ultra-High Performance Concrete (UHPC) incorporating phosphorous slag. J. Clean. Prod. 2019, 240, 118157. [Google Scholar] [CrossRef]
  53. Rajasekar, A.; Arunachalam, K.; Kottaisamy, M. Assessment of strength and durability characteristics of copper slag incorporated ultra high strength concrete. J. Clean. Prod. 2019, 208, 402–414. [Google Scholar] [CrossRef]
  54. Gesoglu, M.; Güneyisi, E.; Muhyaddin, G.F.; Asaad, D.S. Strain hardening ultra-high performance fiber reinforced cementitious composites: Effect of fiber type and concentration. Compos. Part B-Eng. 2016, 103, 74–83. [Google Scholar] [CrossRef]
  55. Yoo, D.-Y.; Shin, H.-O.; Yang, J.-M.; Yoon, Y.-S. Material and bond properties of ultra high performance fiber reinforced concrete with micro steel fibers. Compos. Part B-Eng. 2014, 58, 122–133. [Google Scholar] [CrossRef]
  56. Marani, A.; Jamali, A.; Nehdi, M.L. Predicting ultra-high-performance concrete compressive strength using tabular generative adversarial networks. Materials 2020, 13, 4757. [Google Scholar] [CrossRef] [PubMed]
  57. Tabachnick, B.G.; Fidell, L.S.; Ullman, J.B. Using Multivariate Statistics; Pearson: Boston, MA, USA, 2013; Volume 6. [Google Scholar]
  58. DeRousseau, M.; Laftchiev, E.; Kasprzyk, J.; Rajagopalan, B.; Srubar, W.J.C., III; Materials, B. A comparison of machine learning methods for predicting the compressive strength of field-placed concrete. Constr. Build. Mater. 2019, 228, 116661. [Google Scholar] [CrossRef]
  59. Abellan-Garcia, J.; Guzmán-Guzmán, J.S. Random forest-based optimization of UHPFRC under ductility requirements for seismic retrofitting applications. Constr. Build. Mater. 2021, 285, 122869. [Google Scholar] [CrossRef]
  60. Nguyen, D.L.; Thai, D.K.; Nguyen, H.T.; Tran, N.T.; Phan, T.D.; Kim, D.J. Mechanical behaviors and their correlations of ultra-high-performance fiber-reinforced concretes with various steel fiber types. Struct. Concr. 2023, 24, 1179–1200. [Google Scholar] [CrossRef]
  61. Bu, J.; Tian, Z.; Zheng, S.; Tang, Z. Effect of sand content on strength and pore structure of cement mortar. J. Wuhan Univ. Technol.-Mater. Sci. Ed. 2017, 32, 382–390. [Google Scholar] [CrossRef]
  62. Chang, W.; Zheng, W. Effects of key parameters on fluidity and compressive strength of ultra-high performance concrete. Struct. Concr. 2020, 21, 747–760. [Google Scholar] [CrossRef]
  63. Hilloulin, B.; Tran, V.Q. Using machine learning techniques for predicting autogenous shrinkage of concrete incorporating superabsorbent polymers and supplementary cementitious materials. J. Build. Eng. 2022, 49, 104086. [Google Scholar] [CrossRef]
  64. Xu, D.; Tang, J.; Hu, X.; Zhou, Y.; Yu, C.; Han, F.; Liu, J. Influence of silica fume and thermal curing on long-term hydration, microstructure and compressive strength of ultra-high performance concrete (UHPC). Constr. Build. Mater. 2023, 395, 132370. [Google Scholar] [CrossRef]
Figure 1. Flowchart of the predicting the CS of UHPC, based on ML optimized by meta-heuristic algorithm.
Buildings 14 01209 g001
Figure 2. Schematic diagram of random forest (RF).
Buildings 14 01209 g002
Figure 3. Schematic diagram of support vector regression.
Buildings 14 01209 g003
Figure 4. Schematic diagram of K-Nearest Neighbor (KNN).
Buildings 14 01209 g004
Figure 5. Histogram distributions of parameters in the dataset: (a) cement; (b) silica fume; (c) slag; (d) fly ash; (e) limestone powder; (f) nano silica; (g) w/b; (h) quartz powder; (i) sand; (j) fiber; (k) superplasticizer; (l) age; (m) compressive strength (CS).
Buildings 14 01209 g005aBuildings 14 01209 g005bBuildings 14 01209 g005c
Figure 6. Pearson correlation of all features and compressive strength.
Buildings 14 01209 g006
Figure 7. Predicted results of RF, SVR, and KNN (a) training data; (b) testing data.
Buildings 14 01209 g007
Figure 8. Overfitting degrees of RF, SVR, and KNN.
Buildings 14 01209 g008
Figure 9. Fitting value versus iteration number for SO-RF, PSO-RF, and BAS-RF.
Buildings 14 01209 g009
Figure 10. Predicted results of SO-RF, PSO-RF, and BAS-RF (a) training data; (b) testing data.
Buildings 14 01209 g010
Figure 11. Prediction performance improvement of SO-RF, PSO-RF, and BAS-RF (a) training data; (b) testing data.
Buildings 14 01209 g011
Figure 12. Overfitting degree of SO-RF, PSO-RF, and BAS-RF.
Buildings 14 01209 g012
Figure 13. Comparison of the predicted and tested values of the CS of UHPC in the training dataset.
Buildings 14 01209 g013
Figure 14. Comparison of the predicted and tested values of the CS of UHPC in the testing dataset.
Buildings 14 01209 g014
Figure 15. SHAP value (importance of the input parameters) by SO-RF model.
Buildings 14 01209 g015
Figure 16. PDP analysis of the important input parameters effect on compressive strength by SO-RF model: (a) age; (b) steel fiber; (c) sand; (d) cement; (e) silica fume; (f) w/b.
Buildings 14 01209 g016
Table 1. Statistical description of the dataset.
VariableC
(kg·m−3)
SF
(kg·m−3)
S
(kg·m−3)
FA
(kg·m−3)
LP
(kg·m−3)
NS
(kg·m−3)
w/b
Maximum1600433.73753561058.247.50.27
Minimum325.30 00000.1
Average777.34150.0416.3029.9139.913.65 0.19
Median784178 00 000.2
Standard deviation198.76100.6562.8570.63135.558.130.03
VariableQP
(kg·m−3)
Sa
(kg·m−3)
Fi
(kg·m−3)
SP
(kg·m−3)
Ag
(d)
CS
(MPa)
Maximum750170043088.09180230
Minimum0000128.51
Average28.111063.0158.0931.1728.77122.85
Median01079 030.5228123.05
Standard deviation79.11273.9974.9313.8230.9533.89
Table 2. Basic prediction algorithm results.
Training DataTesting Data
R2RMSER2RMSE
RF0.98130.02340.85060.0632
SVR0.79950.07650.72520.0857
KNN0.80180.45080.67970.5485
Table 3. Results of the RF model after optimization.
Training DataTesting Data
R2RMSER2RMSE
SO-RF0.98690.02040.91410.0579
PSO-RF0.98150.02320.85290.0627
BAS-RF0.98430.02250.86070.0602
Disclaimer/Publisher’s Note: The statements, opinions and data contained in all publications are solely those of the individual author(s) and contributor(s) and not of MDPI and/or the editor(s). MDPI and/or the editor(s) disclaim responsibility for any injury to people or property resulting from any ideas, methods, instructions or products referred to in the content.

