Article

Accurate Prediction of Punching Shear Strength of Steel Fiber-Reinforced Concrete Slabs: A Machine Learning Approach with Data Augmentation and Explainability

1
Chongqing Wukang Technology Co., Ltd., Chongqing 404000, China
2
School of Research and Graduate Studies, Arcada University of Applied Sciences, Jan-Magnus Jansson Aukio 1, 00560 Helsinki, Finland
3
State Key Laboratory of Mountain Bridge and Tunnel Engineering, Chongqing Jiaotong University, Chongqing 400074, China
*
Authors to whom correspondence should be addressed.
Buildings 2024, 14(5), 1223; https://doi.org/10.3390/buildings14051223
Submission received: 28 March 2024 / Revised: 17 April 2024 / Accepted: 23 April 2024 / Published: 25 April 2024
(This article belongs to the Section Building Structures)

Abstract

:
Reinforced concrete slabs are widely used in building structures due to their economic, durable, and aesthetic advantages. The determination of their ultimate strength often hinges on punching shear strength. Presently, methods such as closed hoops, steel bending, and fiber reinforcement are employed to enhance punching shear strength, with fiber reinforcement gaining popularity due to its ease of implementation and efficacy in improving concrete durability. This study introduces a novel approach employing six machine learning algorithms rooted in decision trees and decision tree-based ensemble learning to predict punching shear strength in steel fiber-reinforced concrete slabs. To overcome experimental data limitations, a data augmentation approach based on the Gaussian mixture model is employed. The validation of the data augmentation is conducted through “synthetic training—real testing” and “real training—real testing”. Additionally, the best machine learning model is analyzed for explainability using Shapley Additive exPlanation (SHAP). Results demonstrate that the proposed data augmentation method effectively captures the original data distribution, enhancing the robustness and accuracy of the machine learning model. Moreover, SHAP provides better insights into the features influencing punching shear strength. Thus, the proposed data enhancement model offers a reliable approach for modeling small experimental datasets in structural engineering.

1. Introduction

Nowadays, reinforced concrete and its combined structures are widely used [1,2,3]. Reinforced concrete slabs are widely employed in construction for their superior structural strength and excellent durability [4,5]. Compared to traditional construction materials and methods, utilizing reinforced concrete flat slabs accelerates construction timelines, diminishes uncertainties, and lowers risks during the construction process [6,7]. In addition, utilizing these slabs offers greater flexibility in building design, empowering designers to fulfill diverse innovative and functional requirements [8,9]. Studies indicate that the ultimate strength of reinforced concrete flat slabs typically hinges on the punching shear strength at the slab-column joint [10]. Following punching, the residual strength of the slab significantly decreases compared to the punching load, potentially leading to progressive building collapse if one column shears, causing adjacent columns to rapidly overload and fail in punching shear [11]. Currently, several methods exist to enhance shear resistance, including closed hoops, steel bending, shear studs, or post-shear reinforcement. Recently, researchers have delved into leveraging fiber-reinforced concrete (FRC) to increase the punching shear resistance. Numerous studies affirm that FRC slabs exhibit improved strength and ductility in punching shear. Among various fibers, steel fibers stand out for their widespread application in reinforced concrete slabs, owing to their superior strength, toughness, and punching shear resistance [12,13].
Current codes for slab-column connections, such as ACI 318-11, JSCE, and fib Model Code 2010, were developed for plain concrete structures [14,15,16,17]. However, the cracking and punching shear strength of steel fiber concrete (SFRC) structures diverge significantly from that of conventional ones. Therefore, there is an urgent need to introduce a punching shear strength prediction-tailored model for SFRC structures. Narayanan and Darwish proposed a design equation considering various factors such as the compression zone strength above the inclined crack, pull-out shear on the fibers along the inclined crack, and shear forces from dowel pins and film action to evaluate punching shear strength [18]. Harajli et al. introduced a best-fit linear regression model for SFRC slab-column connections, incorporating empirical design equations for punching shear strength based on concrete and fiber coupling contributions [19]. Choi et al. conducted a theoretical study and proposed a design equation based on the FRC failure criteria for thin slabs with large spans and thicknesses. The equation considers the contribution of compressive and tensile zones in the critical section and assumes that the punching shear strength of these two zones is controlled by tensile cracking rather than compressive crushing [20]. Higashiyama et al. proposed a design equation based on the JSCE to evaluate the punching shear strength of plain concrete slab-column connections, considering factors such as fiber pull-out strength and critical section perimeter based on fiber properties [21]. In addition, Maya et al. proposed a design equation for SFRC punching shear strength based on the critical shear crack theory and verified its superiority over existing models of Narayanan and Darwish, Harajli et al., and Higashiyama et al. through experimental data analysis [22]. While these models advanced SFRC punching shear strength studies, some issues persist. For example, the empirical models by Narayanan and Darwish, Harajli et al., and Higashiyama et al. lack consistency with the methodology adopted in the current code, and the model of Maya et al. risks overestimating SFRC punching shear capacity with room for accuracy enhancement. Recently, Hoang developed a shear capacity prediction model using multiple linear regression and artificial neural networks based on experimental data [23], showcasing machine learning’s potential in SFRC shear strength prediction. However, the model’s generalization and explainability warrant improvement. Given these challenges, there is a crucial need for a highly accurate, generalizable, and explainable model for SFRC punching shear strength assessment.
In recent years, ensemble learning combined with SHapley Additive exPlanation (SHAP) has been widely used in structural engineering due to its high accuracy and explainability. Wang et al. used four standalone learning models and two ensemble learning models to predict the bond strength between steel sections and concrete. The results show that the ensemble learning model is much better than the standalone model [24]. Cakiroglu et al. used Extreme Gradient Boosting, Light Gradient Boosting Machine, Random Forest, and Categorical Boosting to predict the splitting tensile strength of concrete reinforced with basalt fibers [25]. Feng et al. predicted the creep behavior of recycled aggregate concrete using ensemble learning combined with SHAP and performed feature importance analysis [26]. Nguyen et al. predicted the compressive strength of cement-based mortar containing metakaolin using Categorical Gradient Boosting and investigated the features using SHAP [27].
The above study demonstrates the power of ensemble learning and SHAP in structural engineering. The aim of this study is to develop a model that accurately predicts the punching shear strength of SFRC slabs while ensuring generalizability and explainability. To achieve this objective, data are sourced from the published literature and augmented using the Gaussian mixture model (GMM). Subsequently, SFRC punching shear strength prediction models are developed employing six machine learning algorithms rooted in decision trees and decision tree-based ensemble learning. The efficacy of the augmented data in enhancing the robustness and accuracy of the models is evaluated through the “synthetic training-real testing” and “real training-real prediction” methodologies. Finally, the SHAP technique is employed to delve into the explainability of the top-performing algorithms within the ensemble learning model. This research not only aims to deliver precise predictions of SFRC punching shear strength but also underscores the potential of data augmentation techniques, particularly GMM, in machine learning modeling using small experimental datasets in structural engineering.

2. Workflow

The workflow for this study, as depicted in Figure 1, consists of the following four main components:
Data collection: It involved gathering 140 instances, comprising the following features: slab depth (h), the effective depth of the slab (d), length or radius of the loading pad or column (bc), concrete strength (f’c), the reinforcement ratio (ρ), the fiber volume (ρf), and punching shear strength (V).
Data augmentation: The GMM is utilized to generate 500 datasets. The distribution of the generated data is evaluated based on the probability density curve to ensure it accurately captures the distribution of the original data.
Model development and evaluation: Six machine learning algorithms are employed to develop modes for punching shear strength in steel fiber-reinforced concrete slabs. The models are evaluated using metrics such as goodness of fit.
Model explainability: SHapley Additive exPlanations is employed to provide global and local explanation.

3. Methodology

3.1. Gaussian Mixture Model

The Gaussian Mixture Model (GMM) operates under the assumption that multiple multivariate normal distributions exist, each with a probability of generating a data point, and collectively their probabilities sum up to 1. The process of solving the GMM essentially involves estimating the likelihood of observing the data. The model assumes the existence of several multivariate normal distribution generators, each with an associated weight, and the total weights sum up to 1. Based on this data generation process and the observed sample set, the likelihood equation can be formulated. The unknown parameters in this equation include the mean vector and covariance matrix of each multivariate normal distribution, and the probability associated with each generator producing a sample. After solving for the model parameters, it becomes possible to discern from which multivariate normal distribution the samples were likely generated [28].
Let the GMM contain M multivariate normally distributed generators, then the probability that this GMM generates a sample x is:
p x i | θ = m = 1 M α m x | θ m ,
m = 1 M α m = 1 ,     α m 0 ,
x | θ m = 1 2 π n Σ m 1 2   exp 1 2 x μ m T m 1 x μ m ,
where α m is the probability that the m th multivariate normal distribution generates a sample, and x | θ m is the probability density function of the m th multivariate normal distribution θ m = μ m ,   m , where μ m denotes the mean vector of the m th multivariate normal distribution component, and m denotes the covariance matrix of the m th multivariate normal distribution.
To ascertain from which multivariate normal distribution a given sample originates in the model, the parameters of the GMM need to be computed from the dataset, and the model must effectively fit the training set to make the most accurate determination. GMM is inherently a probabilistic model, and the typical approach to solving for its parameters involves maximizing the likelihood function. For a data set with m samples, the likelihood function of a Gaussian mixture model is:
L θ = L x 1 ,   ,   x m ; θ = i = 1 m p x i | θ ,
where x 1 ,   ,   x m are m data in the sample, p x i | θ is the probability that the model generates a given sample, and θ denotes all the parameters of the model. Due to the complexity of the likelihood equation, directly solving the optimal parameters is challenging and is typically addressed through the expectation-maximization method.

3.2. Ensemble Learning

The study employed ensemble learning techniques, utilizing decision trees as the foundational model. In this field, two main approaches are prominent: bagging and boosting. Bagging, short for Bootstrap Aggregating, entails training multiple instances of DTs on various subsets of the training data, employing bootstrap sampling where some instances may be selected multiple times while others may not be chosen at all. The predictions from each model are then combined, typically through averaging for regression tasks or voting for classification tasks, to reduce variance and mitigate overfitting, particularly beneficial for complex models like decision trees. On the other hand, boosting sequentially trains decision trees, with each subsequent model focusing on correcting errors made by its predecessors. Initially, each data instance is assigned equal weight, but misclassified instances receive higher weights in subsequent iterations, allowing subsequent models to prioritize them. By iteratively refining the model’s fit to the data, boosting aims to reduce bias and improve overall predictive performance [29]. In this study, DT and DT-based ensemble learning methods are utilized, including Random Forest from bagging, GBDT, XGBoost, LightGBM, and CatBoost from boosting [27,29,30,31,32,33]. These methods are adopted for solving complex civil engineering problems [34,35].

3.3. SHAP

SHAP (Shapley Additive explanation) is one of the most popular model-agnostic methods available for enhancing the explainability of machine learning models [36]. Grounded in cooperative game theory, SHAP assigns feature importance using Shapley values. The Shapley value for a feature j v a l is computed as the weighted sum of its marginal contributions across all possible feature subsets as shown in the equation below:
j v a l = S 1 , , p j S ! p S 1 ! p ! v a l S j v a l S ,
where S is a feature subset, x   is the feature vector, and p   is the number of features. v a l x S represents the prediction for feature values in set S marginalized over features not included in set S :
v a l x S = f ^ x 1 ,   , x p d p x S E x f ^ x .
Averaging the absolute Shapley values across various instances, as illustrated in the equation below, yields a more dependable measure of feature importance ( I j ). This approach offers a thorough assessment of each feature’s impact on the model’s predictions, emphasizing features with higher absolute Shapley values as more impactful in the prediction process.
I j = 1 n i = 1 n ϕ j i .

4. Parameter Selection and Database Construction

4.1. Data Collection and Analysis

A total of 140 sets of experimental data were collected from seven studies [37,38,39,40,41,42,43], encompassing the following features: slab depth (h), the effective depth of the slab (d), length or radius of the loading pad or column (bc), concrete strength (f’c), the reinforcement ratio (ρ), and the fiber volume (ρf) and punching shear strength. The punching shear strength (V) is designated as the target feature, while the other features serve as input features for analysis. The distribution of each input feature is shown in Table 1, and the correlation coefficients between the parameters are shown in Figure 2. The Pearson correlation coefficient is used to measure the degree of linear correlation between continuous variables, and the Spearman correlation coefficient is used to measure the degree of monotonic correlation between two variables. Figure 2 indicates that the correlation between the input features and the target feature is generally weak, with the exception of h and d, which exhibit relatively strong correlations with the target variable. Despite their strong correlations, h and d are retained as significant parameters influencing V.

4.2. Data Augmentation

The distribution of each parameter before and after enhancement is shown in Figure 3. The statistical characteristics of the generated data are shown in Table 2. It is evident from Figure 3 that GMM has learned the distribution of the original parameters well, with the distribution of the augmented data closely resembling that of the data before augmentation.

5. Model Construction and Evaluation

5.1. Model Construction

Both the original data and the augmented data were utilized for modeling, employing two distinct approaches: M1 and M2. In M1, 80% of the original real values were utilized for the training set and 20% were allocated for testing. On the other hand, M2 utilized the generated values for training and real values for testing. The machine learning algorithms were trained using the six models rooted in the decision tree and decision tree-based ensemble learning introduced in Section 3.2, with the optimal hyperparameters of each algorithm determined through grid search with five-fold cross-validation.

5.2. Data Augmentation Validation

The training and test performance of all the models under M1 and M2 are depicted in Figure 4 and Figure 5, respectively.
From Figure 4, it can be noticed that there is a large difference in the performance of the model on the training and test sets. Conversely, Figure 5, highlights a significant improvement in the R2 of each machine learning model on the test set under M2. Figure 6 presents the distribution of the deviations of each algorithm under M1 and M2, offering insights into their robustness. In general, a deviation centered at 0 and normally distributed indicates a model with good robustness. In Figure 6A, it is evident that under M1, DT, GBDT, and XGBoost models exhibit robustness on both training and test sets, with a more uniform deviation distribution. RF, LightGBM, and CatBoost show better robustness on the training set, but their deviation distribution is less stable on the test set, indicating poorer robustness. Conversely, Figure 6B, illustrates the six machine learning models demonstrate good robustness on both the training and test sets, with deviation distributions approximating normality. In addition, DT and GBDT outperform the other models significantly on the test set. This figure underscores the improvement in model robustness with data augmentation (M2).
To further evaluate the model accuracy, Figure 7 examines the models under M1 and M2 using standard deviation and coefficient of variation. In Figure 7a, for the training set, the standard deviation of each model under M2 is lower than M1, except for DT. Similarly, for the test set, the standard deviation of all machine learning models under M2 is lower than M1. In Figure 7b, for the training set, the coefficients of variation of all machine learning models under M2 are lower than M1, except for LightGBM. In addition, for the test set, the coefficients of variation of all models under M2 are lower than M1. In conclusion, the data augmentation method proposed in this work enhances the robustness and accuracy of the machine learning models.

5.3. Model Performance Evaluation

The robustness and accuracy of the data-augmented models were verified in Section 5.2. The performance of the machine learning models is further evaluated in this section to identify the most suitable algorithms for this research. The performance of each machine learning model is assessed using standard deviation (SD), root mean square deviation (RMSD), and goodness-of-fit (R2), visualized through a Taylor diagram, as seen in Figure 8. The radial axis indicates the standard deviation of the model. The angle indicates the correlation or agreement between the model predictions and the observations. A smaller angle means that the model predictions are closer to the observations. In addition, a bluer color indicates a smaller root mean square deviation.
As depicted in Figure 8a, for the training set, XGBoost, GBDT, and CatBoost exhibit significantly better performance compared to LightGBM, RF, and DT, with XGBoost having the smallest SD and RMSD and the largest R2. In Figure 8b, on the test set, LightGBM demonstrates the best performance, followed by CatBoost and XGBoost, while DT performs the worst. Considering the performance of the models on both the training and test sets, XGBoost emerges as the most suitable model for this study.

5.4. Model Explainability

As observed in Section 5.3, XGBoost demonstrates the most balanced performance on both the training and test sets. Therefore, SHAP is employed for the explainability of XGBoost. This plot combines feature importance with feature effects for each instance. Each point on the plot represents a SHAP value associated with a feature and an instance. The y-axis denotes the feature, while the x-axis represents the SHAP value. The color of the points corresponds to the feature value, ranging from low to high. As observed in Figure 9, the order of importance of the features on the punching shear strength of steel fiber-reinforced concrete slabs is as follows: h, d, bc, f’c, ρf, and ρ. Additionally, it is evident that for all features, except d and bc, higher magnitudes result in positive SHAP values, indicating a positive impact on the prediction of punching shear strength of steel fiber-reinforced concrete slabs. Conversely, lower magnitudes of these features adversely affect the prediction.
In Figure 9, the global interpretation of features reveals the overall impact on punching shear strength, yet individual feature effects can vary across samples. For instance, considering the fifth specimen with a real punching shear strength of 402 KN, the SHAP waterfall plot in Figure 10 illustrates that the values of concrete strength (f’c), slab depth (h), the effective depth of the slab (d), fiber volume (ρf), and reinforcement ratio (ρ) are all positive (shown in red), indicating that they have a positive effect on the punching shear strength. Among them, the SHAP value of concrete strength is the largest, indicating that it has the greatest effect for the fifth specimen, while the length or radius of the loading pad or column (bc) has a negative impact (shown in blue). Notably, the minimal value of bc for this specimen, as seen in Figure 10, correlates with more negative SHAP values, indicating its adverse effect on prediction. Furthermore, the XGBoost model’s prediction of 399.412 KN for the fifth specimen aligns closely with its true value of 402 KN, showcasing high prediction accuracy.

6. Conclusions

This study introduces a data augmentation method employing the Gaussian mixture model to expand small experimental datasets, with the goal of enhancing the performance of machine learning models. Subsequently, SFRC punching shear strength prediction models are developed using six algorithms rooted in decision trees and decision tree-based ensemble learning models. The SHAP technique is then applied to comprehensively elucidate the significance and dependencies within the best-performing model. The following conclusions were reached:
(1)
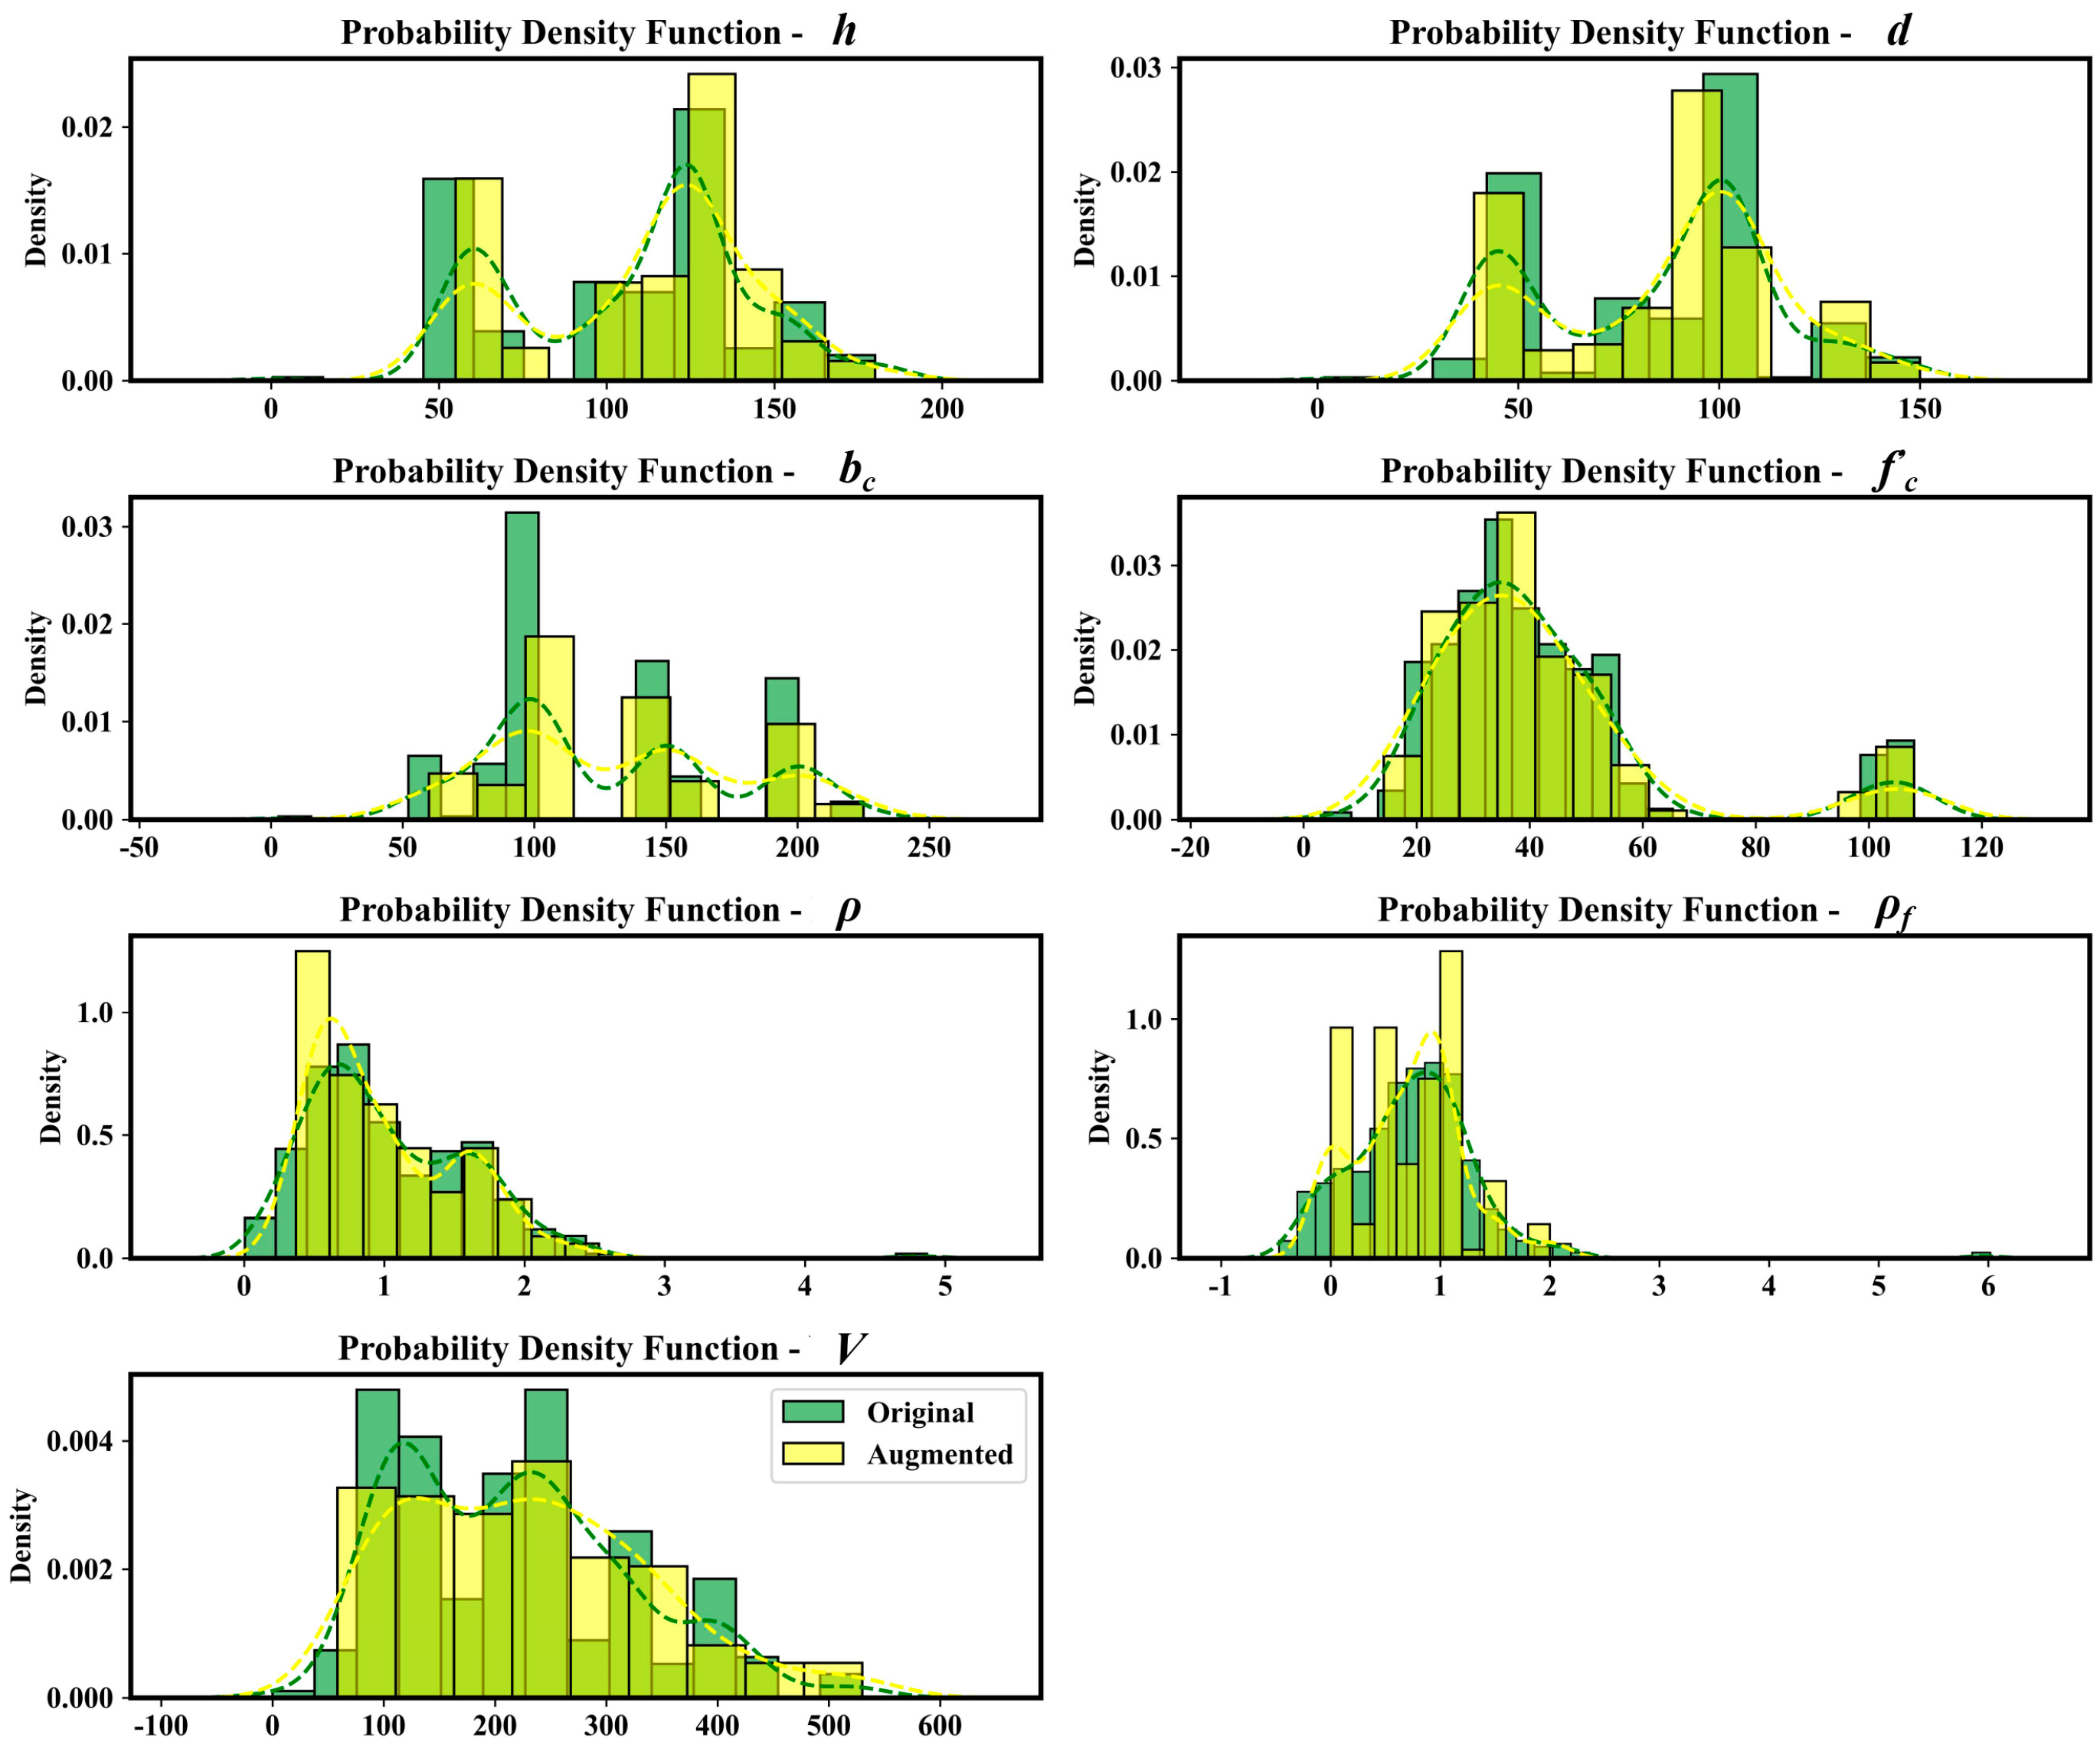
The adopted Gaussian mixture model effectively captures the distribution of features in the dataset, with the probability density function curves of the generated data closely aligning with those of the original data.
(2)
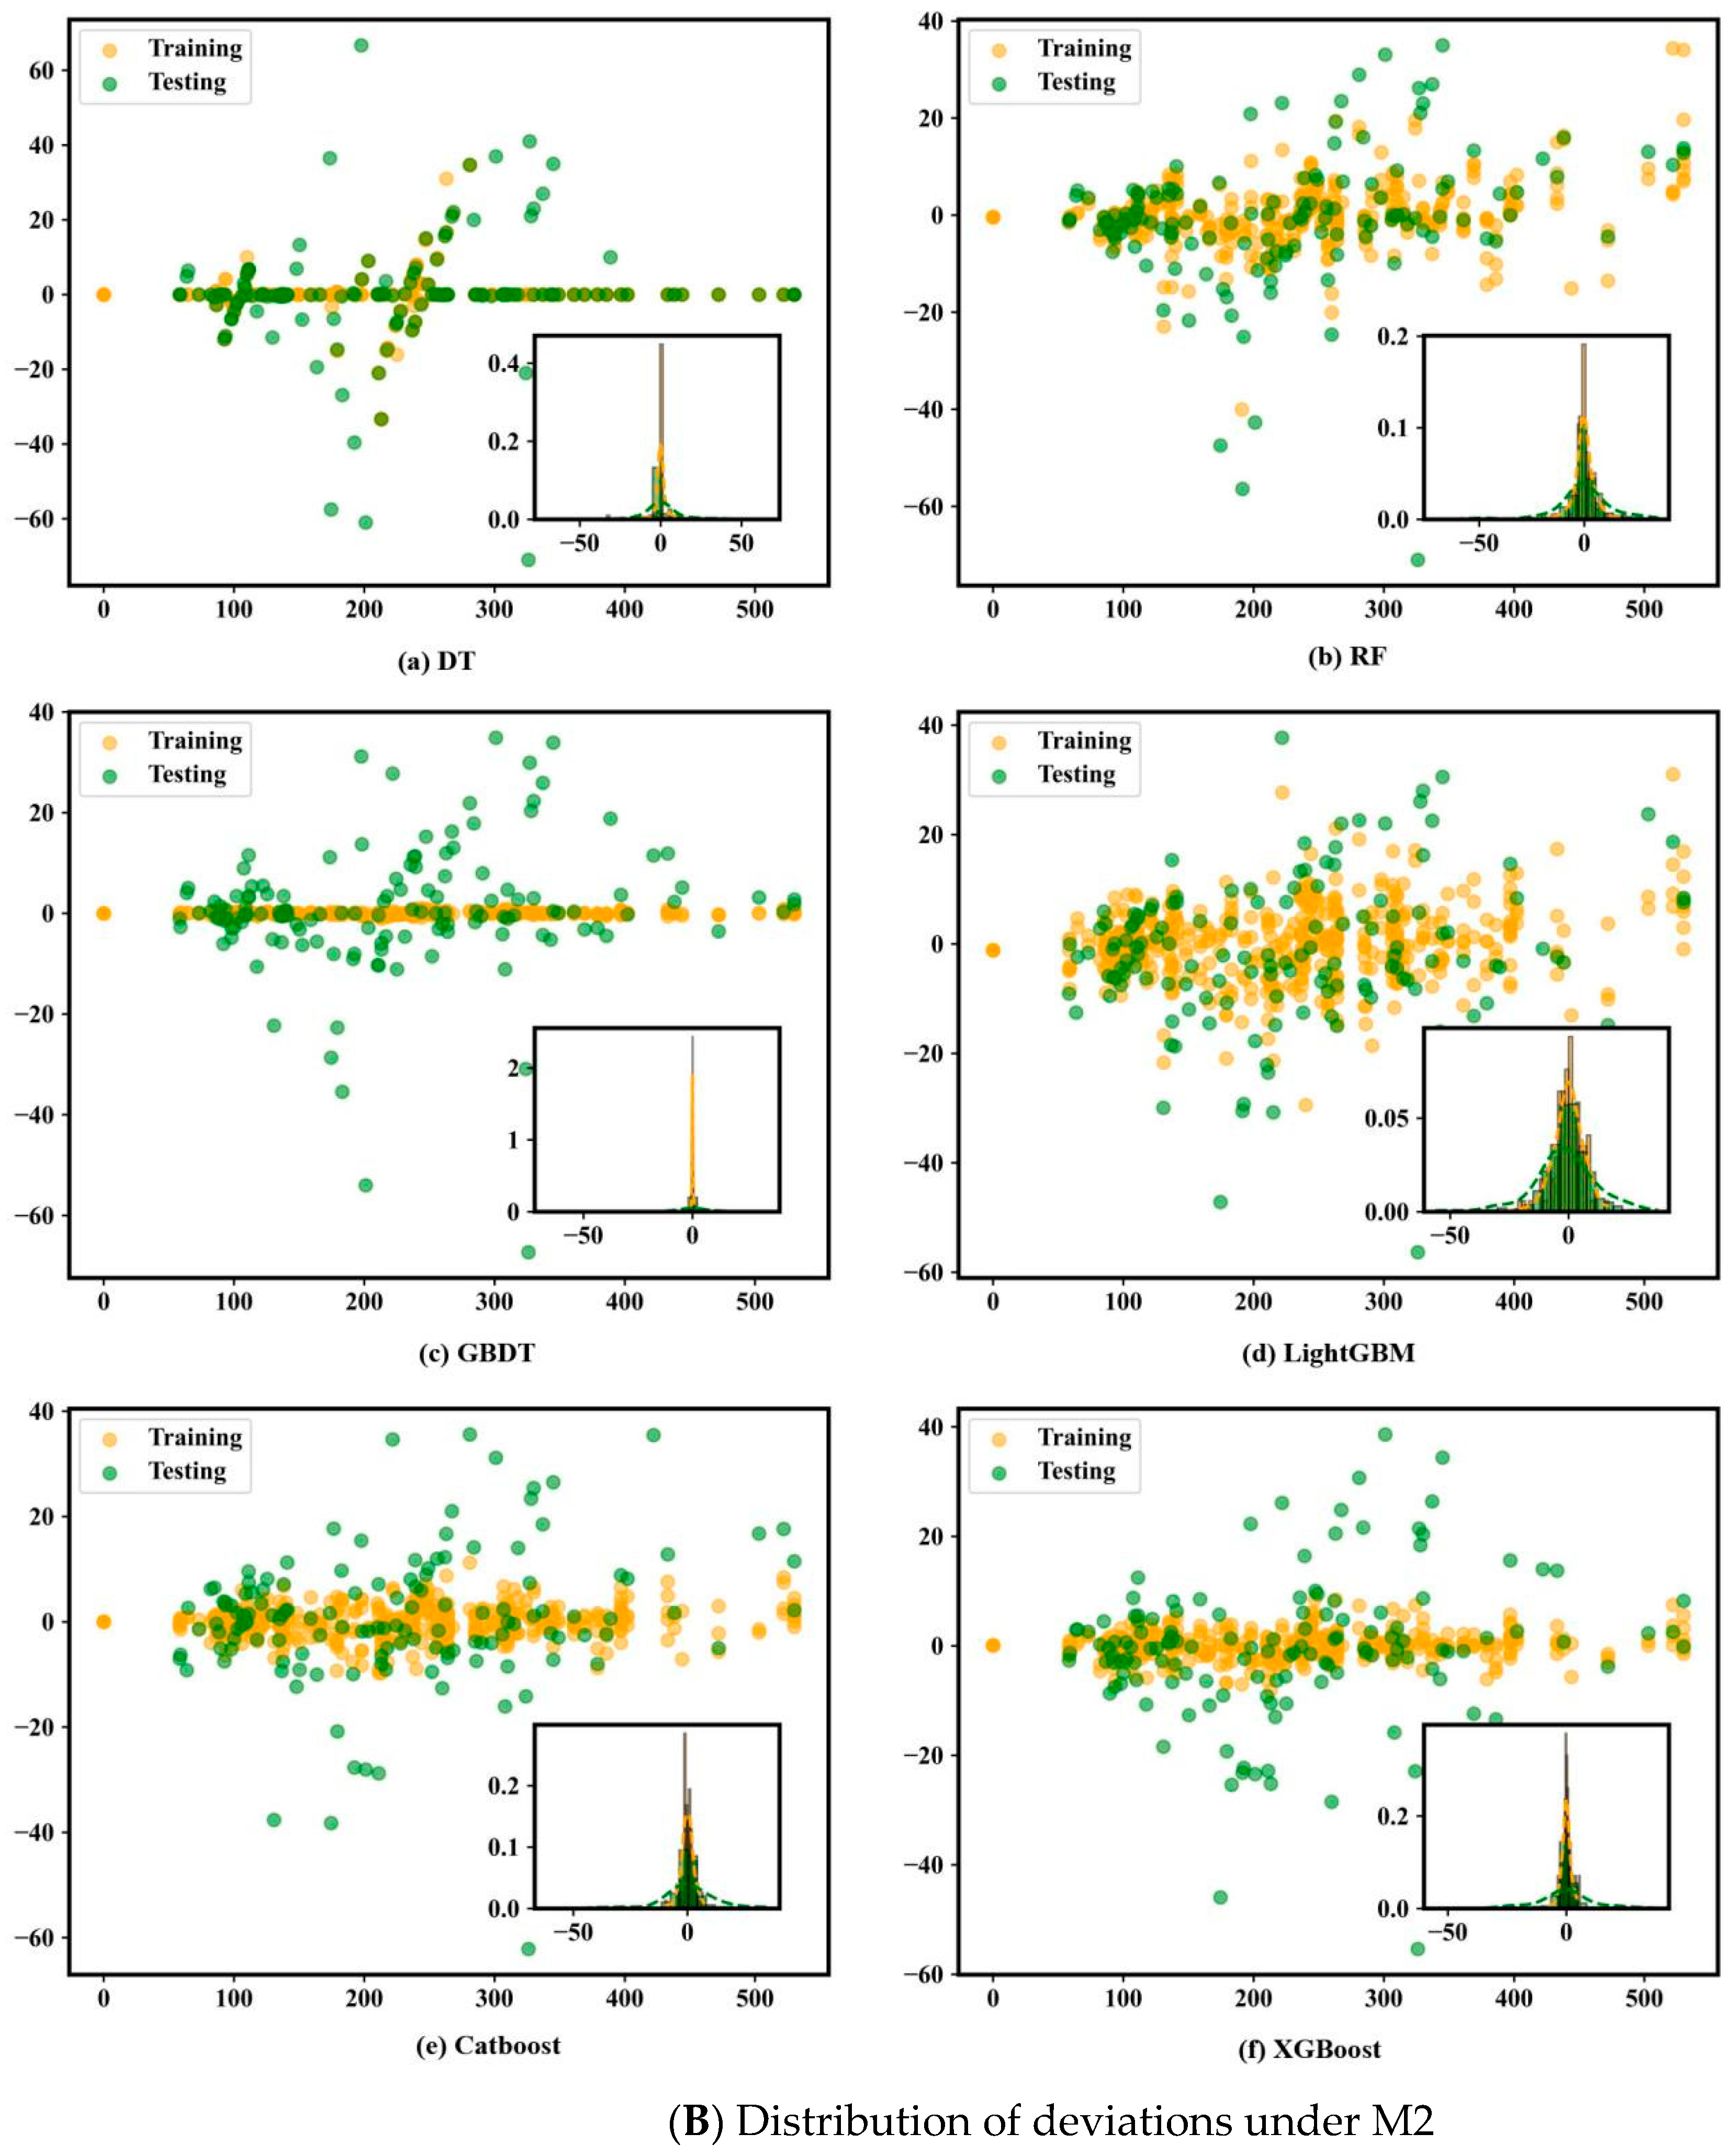
When subjected to the “synthetic training-real testing” condition, the machine learning models demonstrate significantly enhanced accuracy and robustness are compared to the “real training-real prediction” scenario. Notably, XGBoost exhibits the most balanced performance between the training and test sets.
(3)
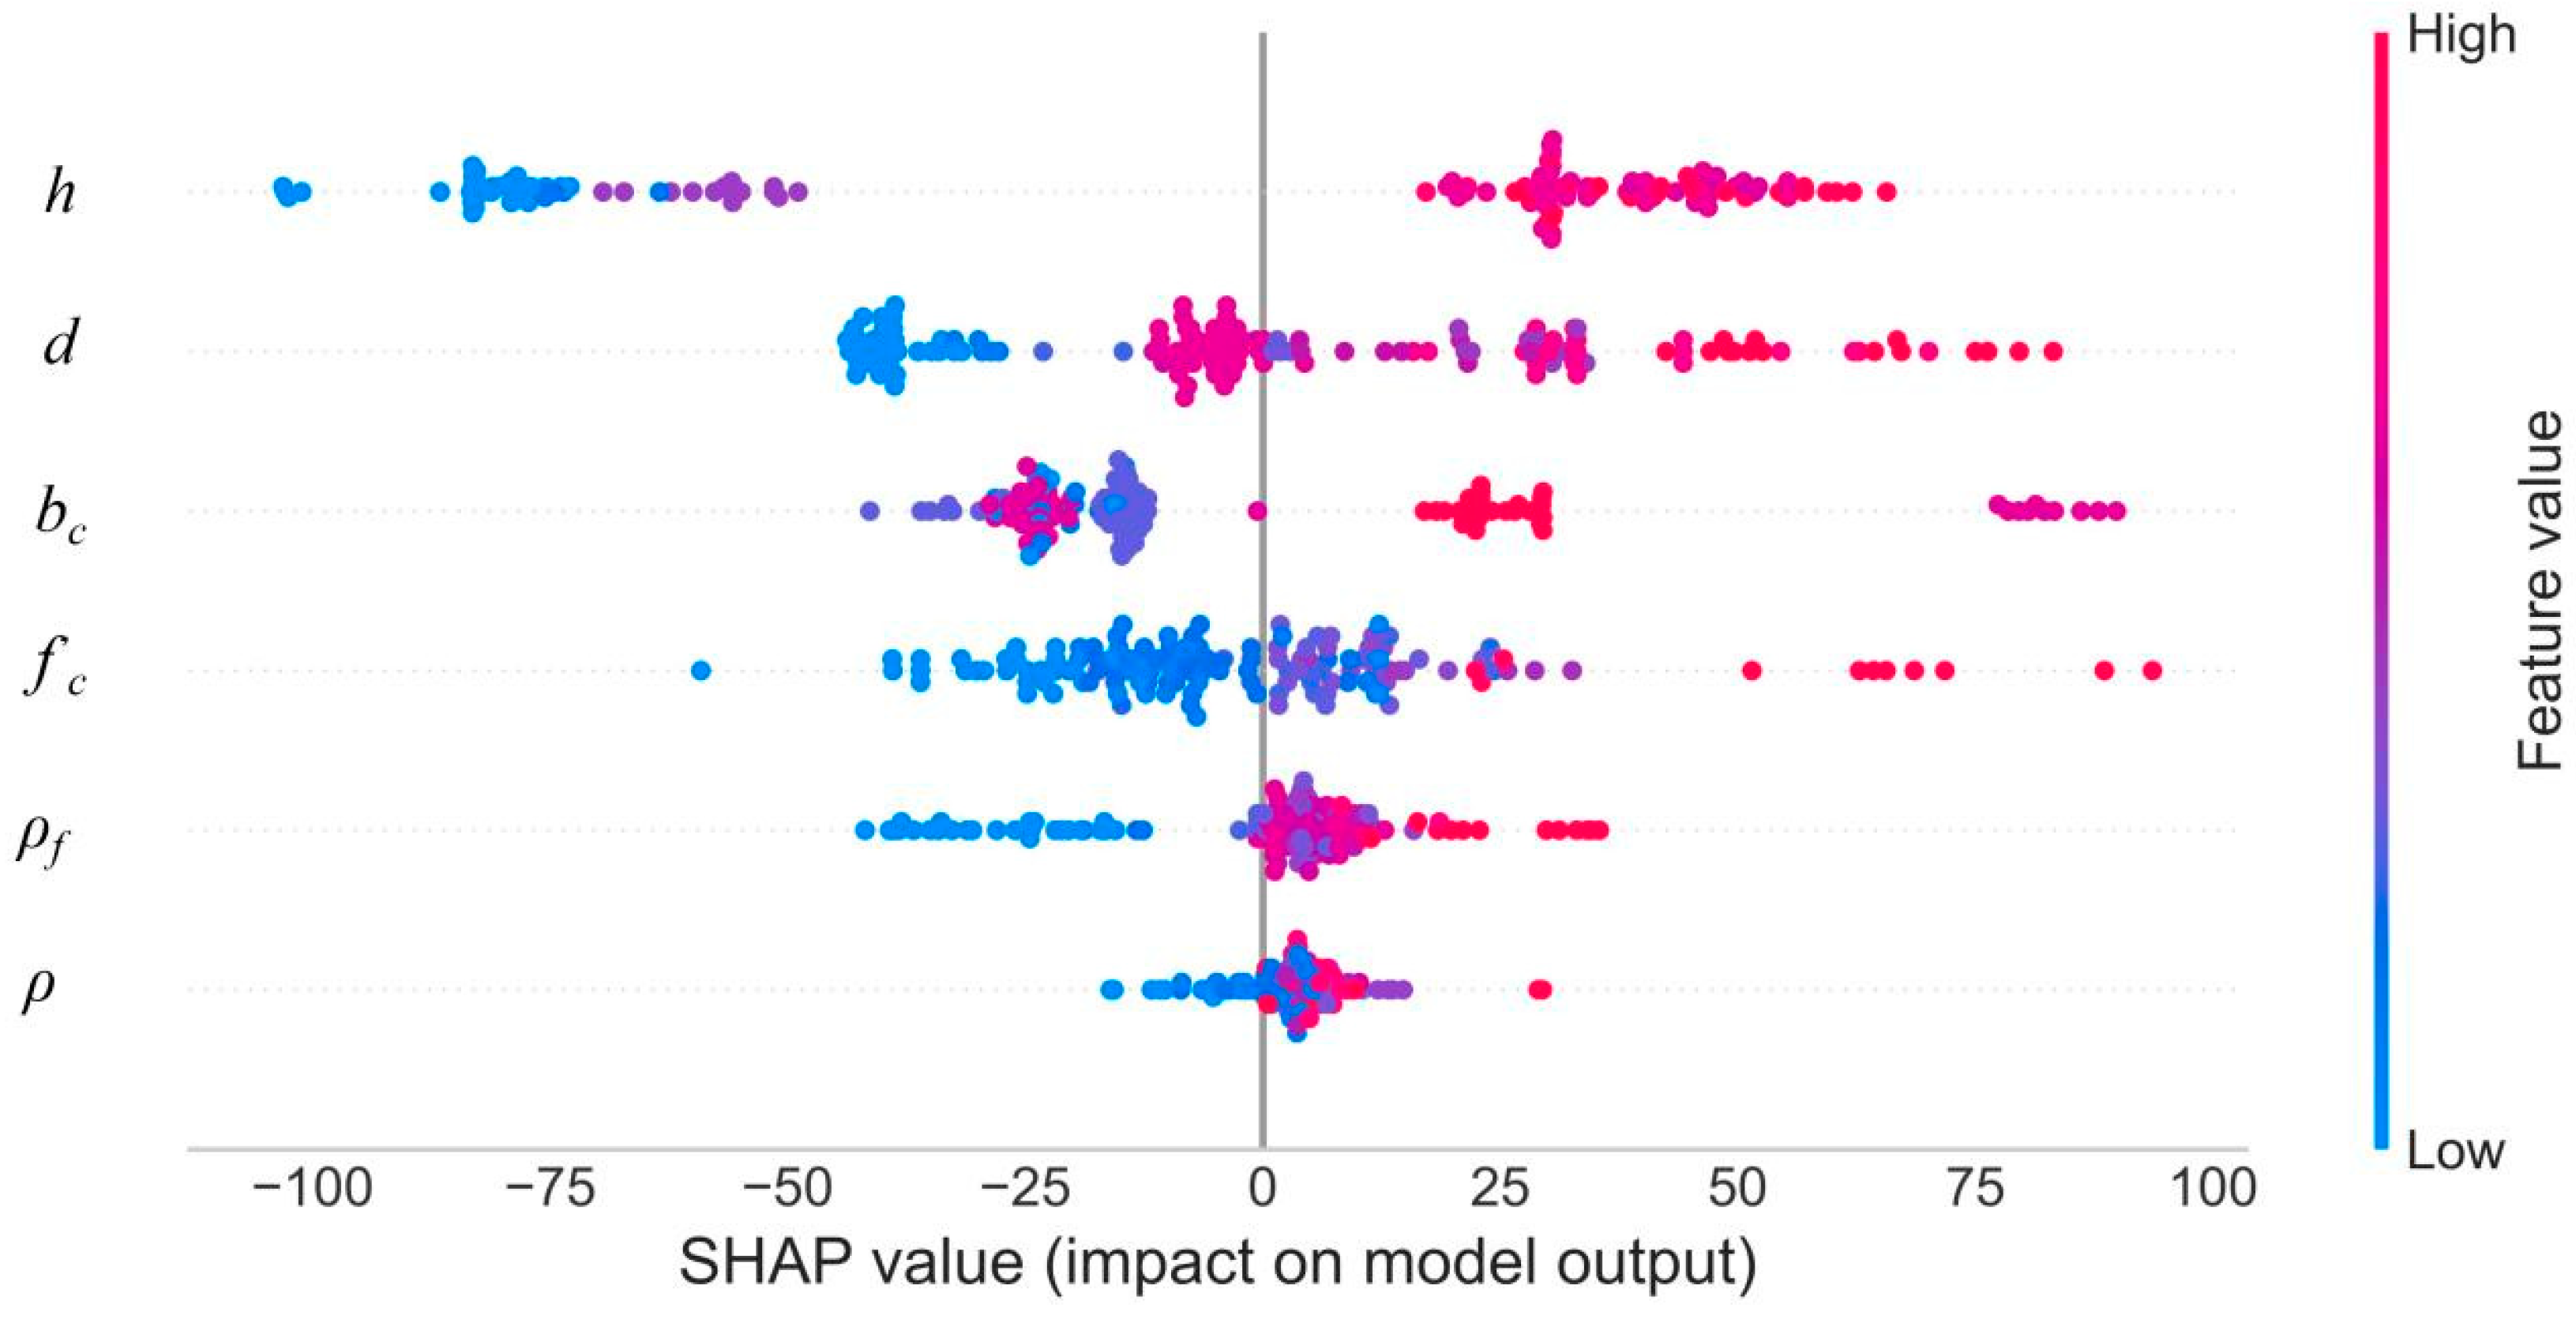
The SHAP analysis revealed that feature importance rankings are: h, d, bc, f’c, ρf, and ρ. Most features demonstrate a positive correlation with punching shear strength. Additionally, visualizing SHAP values through various plots provides a comprehensive understanding of the overall feature importance in the model’s predictions.

Author Contributions

Conceptualization, C.C.; Data curation, C.C.; Funding acquisition, W.Z.T. and T.H.; Investigation, C.C.; Methodology, C.C.; Software, C.C.; Supervision, W.Z.T. and T.H.; Validation, C.C.; Visualization, C.C.; Writing—original draft, C.C.; Writing—review & editing, W.Z.T. and T.H. Conceptualization, methodology, software, validation, Writing-original draft, Writing, C.C.; supervision, funding acquisition, writing, W.Z.T.; supervision, funding acquisition, writing T.H. All authors have read and agreed to the published version of the manuscript.

Funding

This research received no external funding.

Data Availability Statement

The original contributions presented in the study are included in the article, further inquiries can be directed to the corresponding author.

Conflicts of Interest

Author Cheng Cheng was employed by the company Chongqing Wukang Technology Co., Ltd. The remaining authors declare that the research was conducted in the absence of any commercial or financial relationships that could be construed as a potential conflict of interest.

References

  1. Wu, Y.; Wang, X.; Fan, Y.; Shi, J.; Luo, C.; Wang, X. A Study on the Ultimate Span of a Concrete-Filled Steel Tube Arch Bridge. Buildings 2024, 14, 896. [Google Scholar] [CrossRef]
  2. Wei, J.; Ying, H.; Yang, Y.; Zhang, W.; Yuan, H.; Zhou, J. Seismic performance of concrete-filled steel tubular composite columns with ultra high performance concrete plates. Eng. Struct. 2023, 278, 115500. [Google Scholar] [CrossRef]
  3. Li, H.; Yang, Y.; Wang, X.; Tang, H. Effects of the position and chloride-induced corrosion of strand on bonding behavior between the steel strand and concrete. Structures 2023, 58, 105500. [Google Scholar] [CrossRef]
  4. Pérez Caldentey, A.; Diego, Y.G.; Santos, A.P.; López, L.; Chiquito, M.; Castedo, R. Robustness of Reinforced Concrete Slab Structures: Lessons Learned from Two Full-Scale Tests. Buildings 2024, 14, 558. [Google Scholar] [CrossRef]
  5. Awad, R.; Al Ateyat, A.; Junaid, M.T.; Al-Sadoon, Z.; Altoubat, S.; Maalej, M.; Barakat, S. Punching shear capacity of fiber-reinforced concrete suspended slabs: Database analysis and models assessments. J. Build. Eng. 2024, 83, 108433. [Google Scholar] [CrossRef]
  6. Wang, X.; Li, L.; Xiang, Y.; Wu, Y.; Wei, M. The influence of basalt fiber on the mechanical performance of concrete-filled steel tube short columns under axial compression. Front. Mater. 2024, 10, 1332269. [Google Scholar] [CrossRef]
  7. Singh, A.; Wang, Y.; Zhou, Y.; Sun, J.; Xu, X.; Li, Y.; Liu, Z.; Chen, J.; Wang, X. Utilization of antimony tailings in fiber-reinforced 3D printed concrete: A sustainable approach for construction materials. Constr. Build. Mater. 2023, 408, 133689. [Google Scholar] [CrossRef]
  8. Genikomsou, A.S. Seismic Damage Assessment of Reinforced Concrete Slab-Column Connections—Review of Test Data, Code Provisions and Analytical Models. Buildings 2024, 14, 465. [Google Scholar] [CrossRef]
  9. Al-Zahrani, M.M.; Rahman, M.K.; Fasil, M.; Al-Abduljabbar, S.; Nanni, A.; Al-Osta, M.A.; Najamuddin, S.K.; Al-Gahtani, H.J. Punching shear capacity of GFRP bar-reinforced concrete slabs-on-ground. Eng. Struct. 2023, 289, 116285. [Google Scholar] [CrossRef]
  10. Fernández Ruiz, M.; Mirzaei, Y.; Muttoni, A. Post-punching behavior of flat slabs. ACI Struct. J. 2013, 110, 801–812. [Google Scholar]
  11. Swamy, R.N.; Ali, S.A.R. Punching shear behavior of reinforced slab-column connections made with steel fiber concrete. J. Proc. 1982, 79, 392–406. [Google Scholar]
  12. ALlexander, S.D.B.; Simmonds, S.H. Punching shear tests of concrete slab-column joints containing fiber reinforcement. Struct. J. 1992, 89, 425–432. [Google Scholar]
  13. McHarg, P.J.; Cook, W.D.; Mitchell, D.; Yoon, Y.S. Benefits of concentrated slab reinforcement and steel fibers on performance of slab-column connec-tions. Struct. J. 2000, 97, 225–234. [Google Scholar]
  14. ACI Committee 318. ACI 318-19: Building Code Requirements for Structural Concrete and Commentary; American Concrete Institute: Farmington Hills, MI, USA, 2019. [Google Scholar]
  15. JSCE. Standard Specifications for Concrete Structures-2007, Design; Japan Society of Civil Engineers: Tokyo, Japan, 2007. [Google Scholar]
  16. Fédération Internationale du Béton (FIB). Model Code 2010-First Completedraft; Fédération Internationale du Béton, Bulletin 55: Lausanne, Switzerland, 2010; Volume 1. [Google Scholar]
  17. Fédération Internationale du Béton (FIB). Model Code 2010-First Completedraft; Fédération Internationale du Béton, Bulletin 55: Lausanne, Switzerland, 2010; Volume 2. [Google Scholar]
  18. Narayanan, R.; Darwish, I.Y.S. Punching shear tests on steel-fibre-reinforced micro-concrete slabs. Mag. Concr. Res. 1987, 39, 42–50. [Google Scholar] [CrossRef]
  19. Harajli, M.; Maalouf, D.; Khatib, H. Effect of fibers on the punching shear strength of slab-column connections. Cem. Concr. Compos. 1995, 17, 161–170. [Google Scholar] [CrossRef]
  20. Choi, K.K.; Taha, M.M.R.; Park, H.G.; Maji, A.K. Punching shear strength of interior concrete slab–column connections reinforced with steel fibers. Cem. Concr. Compos. 2007, 29, 409–420. [Google Scholar] [CrossRef]
  21. Higashiyama, H.; Ota, A.; Mizukoshi, M. Design equation for punching shear capacity of SFRC slabs. Int. J. Concr. Struct. Mater. 2011, 5, 35–42. [Google Scholar] [CrossRef]
  22. Maya, L.; Ruiz, M.F.; Muttoni, A.; Foster, S. Punching shear strength of steel fibre reinforced concrete slabs. Eng. Struct. 2012, 40, 83–94. [Google Scholar] [CrossRef]
  23. Hoang, N.-D. Estimating punching shear capacity of steel fibre reinforced concrete slabs using sequential piecewise multiple linear regression and artificial neural network. Measurement 2019, 137, 58–70. [Google Scholar] [CrossRef]
  24. Wang, X.; Chen, A.; Liu, Y. Explainable ensemble learning model for predicting steel section-concrete bond strength. Constr. Build. Mater. 2022, 356, 129239. [Google Scholar] [CrossRef]
  25. Cakiroglu, C.; Aydın, Y.; Bekdaş, G.; Geem, Z.W. Interpretable predictive modelling of basalt fiber reinforced concrete splitting tensile strength using ensemble machine learning methods and shap approach. Materials 2023, 16, 4578. [Google Scholar] [CrossRef] [PubMed]
  26. Feng, J.; Zhang, H.; Gao, K.; Liao, Y.; Yang, J.; Wu, G. A machine learning and game theory-based approach for predicting creep behavior of recycled aggregate concrete. Case Stud. Constr. Mater. 2022, 17, e01653. [Google Scholar] [CrossRef]
  27. Nguyen, N.-H.; Tong, K.T.; Lee, S.; Karamanli, A.; Vo, T.P. Prediction compressive strength of cement-based mortar containing metakaolin using explainable Categorical Gradient Boosting model. Eng. Struct. 2022, 269, 114768. [Google Scholar] [CrossRef]
  28. Nguyen, T.M.; Wu, Q.J.; Zhang, H. Bounded generalized Gaussian mixture model. Pattern Recognit. 2014, 47, 3132–3142. [Google Scholar] [CrossRef]
  29. Taffese, W.Z.; Zhu, Y.; Chen, G. Ensemble-learning model based ultimate moment prediction of reinforced concrete members strengthened by UHPC. Eng. Struct. 2024, 305, 117705. [Google Scholar] [CrossRef]
  30. Yu, B.; Xie, L.; Yu, Z.; Cheng, H. Classification method for failure modes of RC columns based on class-imbalanced datasets. Structures 2023, 48, 694–705. [Google Scholar] [CrossRef]
  31. Garg, A.; Mukhopadhyay, T.; Belarbi, M.; Li, L. Random forest-based surrogates for transforming the behavioral predictions of laminated composite plates and shells from FSDT to Elasticity solutions. Compos. Struct. 2023, 309, 116756. [Google Scholar] [CrossRef]
  32. Wakjira, T.G.; Ebead, U.; Alam, M.S. Machine learning-based shear capacity prediction and re-liability analysis of shear-critical RC beams strengthened with inorganic composites. Case Stud. Constr. Mater. 2022, 16, e01008. [Google Scholar]
  33. Alabdullah, A.A.; Iqbal, M.; Zahid, M.; Khan, K.; Amin, M.N.; Jalal, F.E. Prediction of rapid chloride penetration resistance of metakaolin based high strength concrete using light GBM and XGBoost models by incorporating SHAP analysis. Constr. Build. Mater. 2022, 345, 128296. [Google Scholar] [CrossRef]
  34. Taffese, W.Z.; Abegaz, K.A. Prediction of compaction and strength properties of amended soil using machine learning. Buildings 2022, 12, 613. [Google Scholar] [CrossRef]
  35. Taffese, W.Z.; Espinosa-Leal, L. Multitarget regression models for predicting compressive strength and chloride resistance of concrete. J. Build. Eng. 2023, 72, 106523. [Google Scholar] [CrossRef]
  36. Taffese, W.Z.; Espinosa-Leal, L. Unveiling non-steady chloride migration insights through ex-plainable machine learning. J. Build. Eng. 2024, 82, 108370. [Google Scholar] [CrossRef]
  37. Cheng, M.Y.; Parra-Montesinos, G.J. Evaluation of steel fiber reinforcement for punching shear resistance in slab-column con-nections-Part I: Monotonically increased load. ACI Struct. J. 2010, 107, 101–109. [Google Scholar]
  38. Theodorakopoulos, D.D.; Swamy, N. Contribution of steel fibers to the strength characteristics of lightweight concrete slab-column connections failing in punching shear. ACI Struct. J. 1993, 90, 342–355. [Google Scholar]
  39. De Hanai, J.B.; Holanda, K.M.A. Similarities between punching and shear strength of steel fiber reinforced concrete (SFRC) slabs and beams. Ibracon Struct. Mater. J. 2008, 1, 1–16. [Google Scholar]
  40. Suter, R.; Moreillon, L. Punching Shear Strength of High Performance Fiber Reinforced Concrete Slabs; 3rd FIB International Congress: Washington, DC, USA, 2010. [Google Scholar]
  41. Nguyen-Minh, L.; Rovňák, M.; Tran-Quoc, T. Punching shear capacity of interior SFRC slab-column connections. J. Struct. Eng. 2012, 138, 613–624. [Google Scholar] [CrossRef]
  42. Yaseen, A. Punching Shear Strength of Steel Fiber High Strength Reinforced Concrete Slabs. Master’s Thesis, College of Engineering University of Salahaddin, Erbil, Iraq, 2006; p. 107. [Google Scholar]
  43. Wang, X.W.; Tian, W.L.; Huang, Z.Y.; Zhou, M.J.; Zhao, X.Y. Analysis on punching shear behavior of the raft slab reinforced with steel fibers. Adv. Concr. Struct. 2009, 400, 335–340. [Google Scholar] [CrossRef]
Figure 1. Workflow of the study.
Buildings 14 01223 g001
Figure 2. Correlation coefficients of parameters. (a) Pearson’s correlation coefficient; (b) Spearman’s correlation coefficient.
Buildings 14 01223 g002
Figure 3. Data distribution before and after augmentation.
Buildings 14 01223 g003
Figure 4. Predicted vs. real values under M1.
Buildings 14 01223 g004
Figure 5. Predicted vs. real values under M2.
Buildings 14 01223 g005
Figure 6. Distribution of deviations in machine learning models.
Buildings 14 01223 g006aBuildings 14 01223 g006b
Figure 7. Standard deviation and coefficient of variation of the model.
Buildings 14 01223 g007
Figure 8. Performance of each machine learning model.
Buildings 14 01223 g008
Figure 9. SHAP summary plot.
Buildings 14 01223 g009
Figure 10. SHAP waterfall plot.
Buildings 14 01223 g010
Table 1. Statistical distribution of parameters.
hdbcfcρρfV
Min55396014.20.37058.3
Max1801502251082.532530
Average110.887.05131.9641.650.990.71228.19
Skew−0.37−0.30.311.920.810.240.60
Table 2. Statistical distribution of the augmented parameters.
hdbcfcρρfV
Min4025725.60.42043.2
Max1801502251084.874530
Average107.4684.18128.2242.101.030.75216.51
Skew−0.23−0.150.371.861.010.450.60
Disclaimer/Publisher’s Note: The statements, opinions and data contained in all publications are solely those of the individual author(s) and contributor(s) and not of MDPI and/or the editor(s). MDPI and/or the editor(s) disclaim responsibility for any injury to people or property resulting from any ideas, methods, instructions or products referred to in the content.

