
Morphological and Position Factors of Vertical Surface Light Source Affecting Discomfort Glare Perception


1
School of Architecture, Tianjin University, Tianjin 300072, China
2
Tianjin Key Laboratory of Architectural Physics and Environmental Technology, Tianjin 300072, China
3
Beijing Third Branch of North China Municipal Engineering Institute, Beijing 100080, China
*
Author to whom correspondence should be addressed.
Buildings 2024, 14(5), 1227; https://doi.org/10.3390/buildings14051227
Submission received: 21 March 2024
/
Revised: 11 April 2024
/
Accepted: 21 April 2024
/
Published: 25 April 2024
(This article belongs to the Section Building Energy, Physics, Environment, and Systems)
Abstract
:Distinguished from conventional lighting, the LED vertical surface light source (VSLS) is directly exposed to human view, and the effects of which form it takes on visual perception are non-negligible. In the current discomfort glare evaluation system, the solid angle and the position index, which represent the relative relation between the glaring light source and human visual field, are not completely applicable for large-area VSLS, and hence are awaiting supplementation and modification. In this study, a physical experimental setup was established to conduct an evaluation experiment on discomfort glare, employing an LED display and white translucent frosted film to simulate vertical surface light sources (VSLS). The experiments were arranged with 21 VSLS shapes (comprising 3 areas and 7 length-to-width ratios) and 11 mounting positions. Subjective ratings and four eye-movement data parameters—namely, the change rate of pupil diameter (CRPD), mean saccadic amplitude (SA), blinking frequency (BF), and saccadic speed (SS)—were collected from 24 participants under each working condition using the Boyce Evaluation Scale and eye tracking techniques. The main results of this study are the following: (a) CRPD is the most appropriate eye-movement index for characterizing VSLS glare perception; (b) The area of the VSLS is the primary shape element influencing discomfort glare. Furthermore, with the same surface area, the lateral view angle (LaVA) and the longitudinal view angle (LoVA) perceived by the human eye also impact glare perception; (c) A functional equation between the VSLS area, LaVA, and LoVA to the borderline luminance between comfort and discomfort (BCD luminance) is fitted; (d) Based on the eccentric angle and the azimuthal angle, a modified position index P’ is proposed to represent the relative position of the VSLS in the visual field, and the ratio function of BCD luminance of the VSLS at non-central positions and the central position is fitted.
1. Introduction
Through two development stages—the provision of uniform illumination over a horizontal plane and the provision of illuminance suited to human needs—the third stage of development aims at the lighting quality promotion target of enhancing the overall quality of a visual environment and promoting people’s physiological and mental health [1,2]. LED VSLS refers to the surface light source form (Figure 1) installed over vertical structures (walls, cylindrical surfaces, etc.), which has the attributes of both a light source and an interface [3]. Typically, a human’s line of sight arrives at the vertical surface before the top surface of space and, therefore, an LED VSLS not only illuminates the visual environment but, as a spatial visual factor, has direct contact with human’s line of sight. In current discomfort glare studies [4,5,6], light sources (installed at the ceiling of buildings) have been isolated beyond the visual field visible to direct sight for a long time. Therefore, the effects of the VSLS on lighting quality involve not only the consideration that the ambient light parameters provided by the VSLS should be “comfortable” (or called “non-discomfortable”), but also consideration of the effects of apparent factors of light-emitting surfaces on human vision [7]. In the case of the rectangular VSLS, for example, in the apparent elements of the luminous surfaces, the main considerations in the design are their dimensions, proportionality, and installation position.
Discomfort glare evaluation is the basics of indoor healthy illumination studies [8]. Current studies have reached a basic consensus on the evaluation of discomfort glare perception. According to the universality of existing models, Boyce [9] generalized the discomfort glare evaluation of single glaring light sources in Formula (1), where there are two variables representing the light source and the variables relative to human visual field—the solid angle ω and the position index P. ω denotes the relative size of the glaring light source within the observer’s visual field, i.e., the functional relation between the light source area and viewing distance, as shown in Figure 2a. The longer the distance between the glaring light source and the line of sight, the lower the degree of discomfort glare perception [10,11]. However, this leaves out of consideration the effect of the shape of the light source within the observer’s visual field. P denotes the relative position relation between the glaring light source and a human’s line of sight. This was derived by M. Luckiesh and S. K. Guth [12], using their flicker-glare experiment in the upper visual field (UVF) under specific settings (light source size 0.0011 sr and background luminance 34.3 cd/m2), including the elevation angle (hereinafter referred to as the eccentric angle, EA) from the line of sight, in the vertical plane, up to the source and the azimuthal angle (AA) from the line of sight, in the horizontal plane, over to the source, as shown in Figure 2b. Despite the modified research on light sources beneath the visual field by multiple scholars [13,14,15], the size of light sources adopted in this experiment remains small (0.0011 and 0.0038 sr). Compared to light sources isolated beyond the line of sight for long distances, the LED VSLS is completely exposed within human’s visual field due to the characteristics of a large area and a short distance. Further studies have yet to be conducted as to whether the solid angle ω and the position index P parameters remain applicable to quantifying the relative relation between the light source and the visual field.
where: is the luminance of the glare source(s) [cd/m2]; ω is the solid angle subtending each source [sr]; is the background luminance [cd/m2]; P is the Guth position index for each source; is apparent area of the glare source(s) [m2]; is area of the glare source(s) [m2]; r is the distance from the observation target to the eye [m]; α is the angle between the light source and the horizontal line of sight.
Therefore, the research question of this paper is: What morphological and positional elements influence the discomfort glare of the VSLS, and can they also be articulated in terms of solid angle and Guth positional index? Based on this research question, we conducted experiments to assess the discomfort glare, with the three primary visual form elements—size, length-to-width ratio, and position of the VSLS—as independent variables. What is crucial for measuring the perception of glare itself is the direct assessment by observers. Presently, our primary reliance is on questionnaire feedback, which necessitates observers to evaluate glare perception using rating scales [18]. We have opted for the Boyce scale, as its semantic order aligns more closely with the evaluation tendencies of Chinese observers.
With the development of science and technology, on the basis of subjective evaluation, researchers have added objective measurements to establish the relationship between discomfort glare and lighting conditions and physiological responses. One of the widely employed methods is eye-tracking technology. Existing studies indicate that [8,19,20,21,22], among eye-movement data, the pupil diameter (PD), blinking frequency (BF), and saccadic speed (SS) have strong correlations with discomfort glare evaluation. Meanwhile, participants’ eye-movement indexes were collected to explore the correspondence between glare perception and physiological reaction.
The object of this study is a uniform, single brightness VSLS. Combining the visual characteristics of human eyes, the morphological and position factors characterizing the relative relation between the VSLS and a human’s visual field are extracted, and the law of effects of these indexes on glare perception are analyzed to provide a design basis for the application of a VSLS in an indoor illumination. The contributions of this manuscript are therefore:
- (1)
- extracting the parameters that can characterize the morphology and position of the VSLS;
- (2)
- obtaining the law of the influence of the morphology of the VSLS on the borderline luminance between comfort and discomfort (BCD luminance);
- (3)
- obtaining the law of the influence of the position of the VSLS on BCD luminance.
2. Experimental Settings
2.1. Experimental and Operating Conditions
The experimental space of dimensions—3.0 m × 5.0 m × 3.0 m—was set up at the comprehensive laboratory bench for changeable architectural space of Tianjin University. A wall with a length of 5 m and height of 3 m was installed and covered with a full-color LED screen (4.8 m × 2.88 m), whose pixel pitch was 4 mm and resolution was 40,000 points per m2. The luminance in the white balance state could reach 5500 cd/m2, and the adjustable range of the correlated color temperature was 3000–6500 K. The outer side of the screen was installed with a white translucent frosted film, with light transmittance of 41% and lambertian transmittance properties. Using LEDVISION 6.9 software, flexible control was implemented on the position, size, luminance, correlated color temperature and other conditions of the light-emitting units to meet the need of recurrence of the vertical light-emitting surface, as shown in Figure 3.
Given that the independent variables in this study are the visual form of the VSLS, referring to Iwata’s [14] experimental setup, the space was set in a darkroom environment to preclude the interference of ambient luminance. The wall was paved with black velvet cloth and the floor with black PVC plastic flooring, with the boundary reflectance smaller than 0.01 and the vertical light-emitting surface being the only light source in the room. Also, the correlated color temperature was set to 4000 K. In the glare calculation formula for the unified glare rating (UGR), the solid angle and position of the glaring light source are two mutually independent indexes, hence two separate experiments were carried out on the VSLS form (area and ratio) and position.
The LED screen was used in this study to display neutral-color material pictures to set the form, position, and luminance of VSLS. The form and position were adjusted by the options “Window Size” and “Position” in LEDVISION, whereas luminance was controlled by the brightness of the material pictures. Five luminance grades were set for each of the surface light sources in the experiment. The design luminance and corresponding brightness values for each grade are shown in Table 1. To obtain different luminance levels, we created achromatic images in Photoshop with a brightness range of 0–255. We used the Konica Minolta handheld luminance meter LS-100 (Konica Minolta (China) Investment Ltd., Shanghai, China) to measure the luminance value corresponding to each picture. The relationship between the brightness of the picture and the measured luminance value was well documented in our previous research [7]. In this study, we chose images corresponding to the design values of luminance. According to the luminance perceptibility threshold result [7] and the pre-experiment evaluation, the error between design luminance and actual luminance would not be perceived by participants if it fell below the perceptibility threshold.
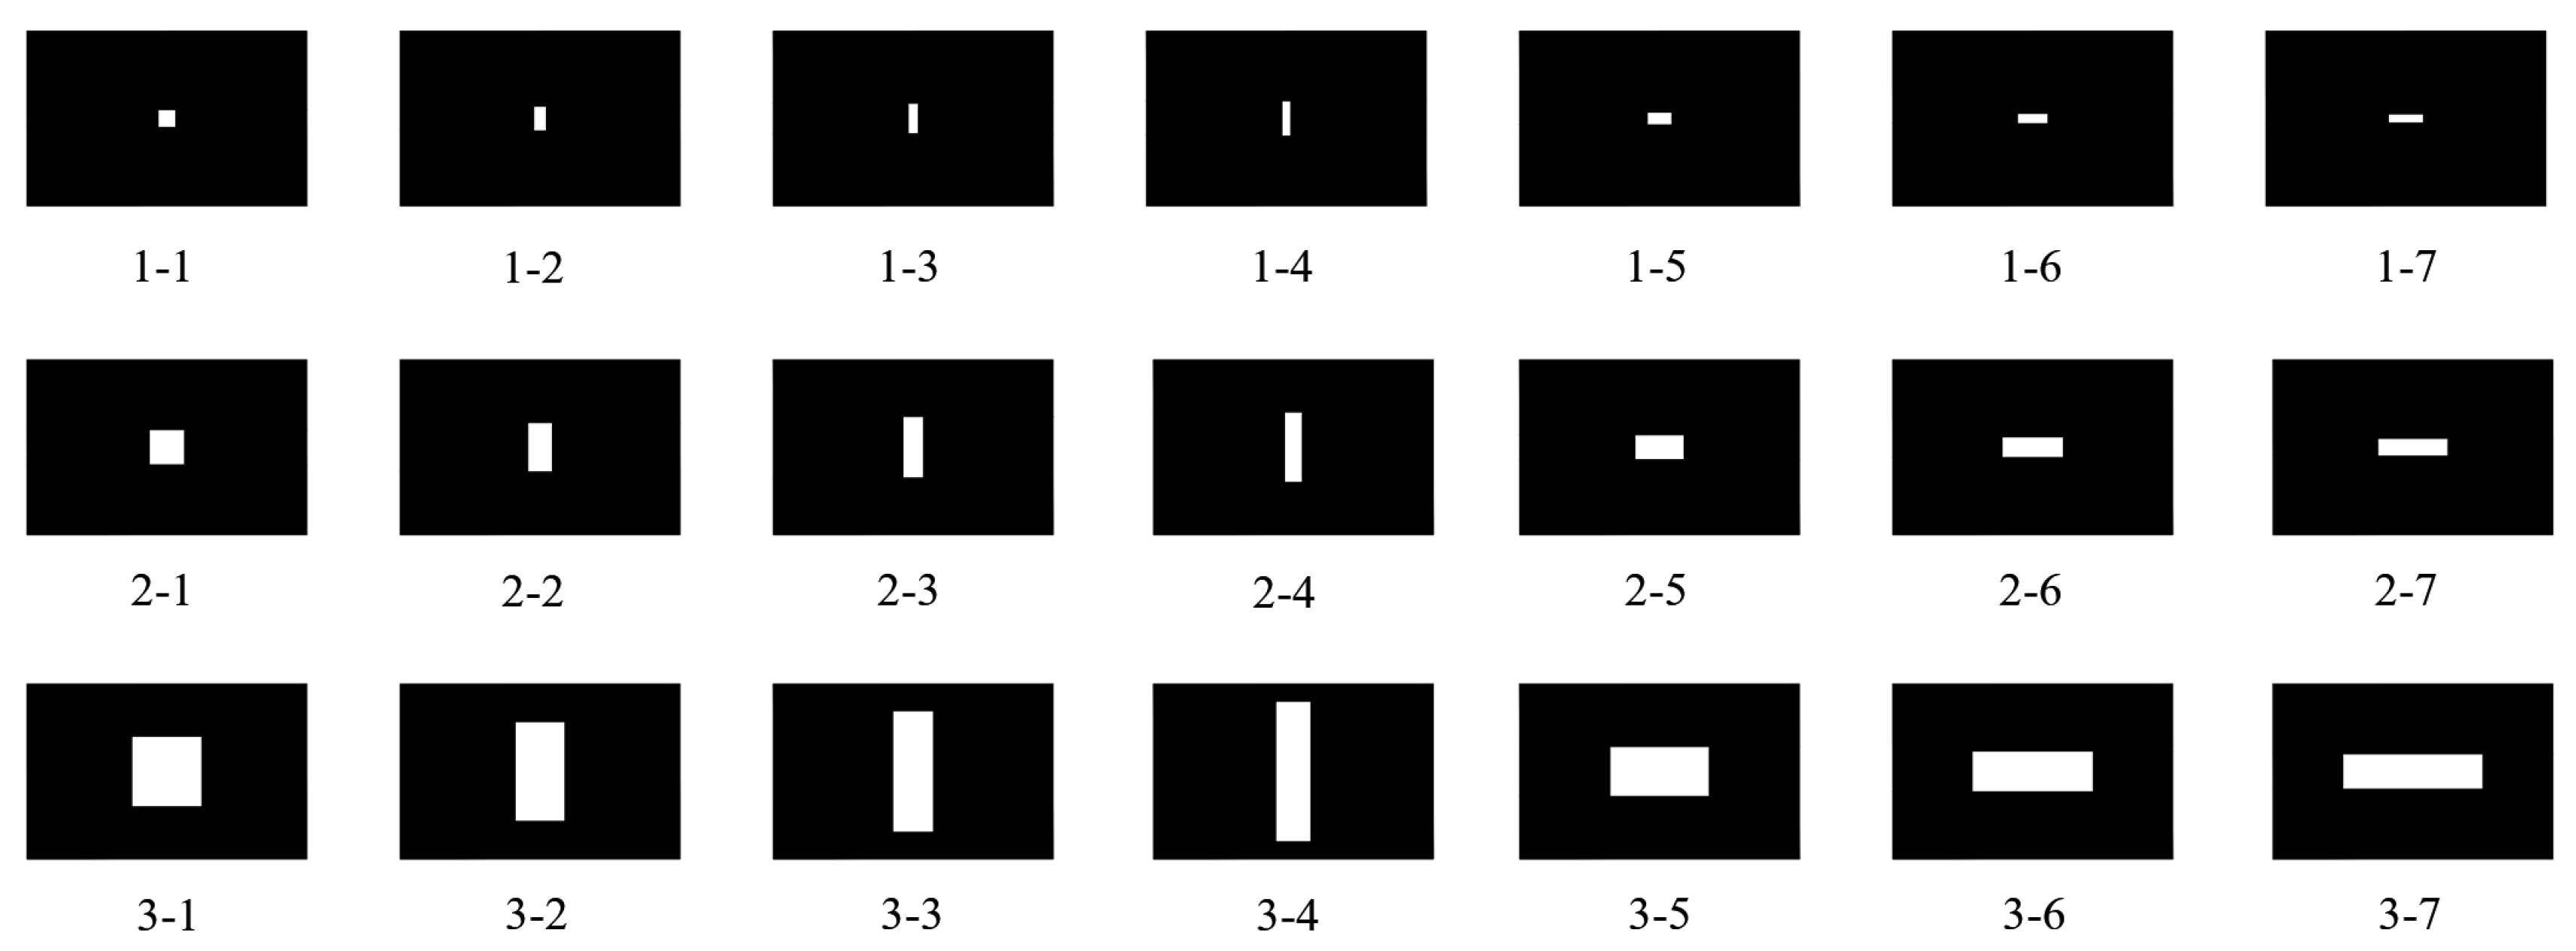
Experimental group (EG)#1: VSLS form. Whether the shape of light sources located in the induced human visual field makes a difference to discomfort glare evaluation is another issue to explore in this study. Therefore, the length-to-width ratio of light sources has been added to the solid angle related variables to research the effect of the relative size of the glaring light source in the visual field on discomfort glare perception. The experimental variables are shown in Table 2, including a total of 3 areas × 7 length-to-width ratios = 21 VSLS forms. The forms of light-emitting surfaces are shown in Figure 4. Five luminance values were set for each VSLS form, and the two viewing distances were set to be 1.5 m and 3.0 m, respectively.
Experimental group (EG)#2: VSLS position. The experiment was carried out by sifting one VSLS form from the operating conditions of experiment #1. To ensure that a large enough area of whatever light source was displayable at multiple positions, the square VSLS with an area of 0.36 m2 was selected. The operating condition settings are shown in Table 3. Against the visual center (C), five orientations were set to be the upper visual field (UVF), the right-upper visual field (RUVF), the right visual field (RVF), the right-lower visual field (RLVF), and the lower visual field (LVF), for each of which two EAs were set, hence 11 operating conditions in total, as shown in Figure 5. Likewise, in this experimental group, two viewing distances and five luminance values of light sources were also set.
2.2. Participants
Participants were recruited as per the following requirements:
- (1)
- that they be in good physical health, free of eye diseases, and without any history of ophthalmic surgery;
- (2)
- that they have an uncorrected visual acuity of 1.0 or above or a corrected visual acuity up to the equivalent eyesight and keep their eyeglasses or contact lens removed throughout the experiment;
- (3)
- that, to ensure eye tracking in normal process, they not wear overly dense false eyelashes or smear overly heavy mascara creams on the day of experiment, and not have implanted eyelashes;
- (4)
- that the complete irises be visible when their eyes are looking straight ahead, without the palpebrae superior occluding the pupils.
Participants were recruited through social media and campus announcements and contacted the research team to register for participation if they met the inclusion criteria. This study has been approved by the Institutional Review Board of our institution, ensuring the protection of participants’ rights throughout the research process, and obtaining informed consent from all participants. Due to the particularity of the eye-movement experiment, participants were informed prior to the experiment that the experimenters would access their eye-movement data for data analysis and visualization. Finally, a total of 24 participants aged 18~31 (mean = 24.27 and standard deviation = 3.78) were recruited in the experiment, with a male-to-female ratio of 1:1.
2.3. Experimental Method and Procedure
2.3.1. Experimental Method
Subjective scale evaluation: The participants were asked to score each light-emitting surface according to their subjective feeling. At present, there exist multiple subjective scales evaluating the discomfort glare, among which the scale proposed by de Boer [23] and that by Boyce et al. [24] are the two most widely used for the moment. De Boer’s scale has nine grades in total, and the higher the scores, the weaker the glare. Moreover, the scale gives a semantic description of odd grades, with the glare perception of even grades lying between the glare perception intensities described by two conjoining odd grades. Boyce’s scale has seven grades in total, and the higher the scores—each of which has been presented with a corresponding description—the stronger the corresponding glare perception. It was found through interview that the semantic order of Boyce’s scale conforms better to Chinese observers’ evaluation habits, hence being selected finally as the scoring scale in this study (Table 4). Specific to the characteristics of this paper, the description of the light source “overhead” is deleted from the explanation.
Objective eye-movement data: This study adopted the eyeglass-type eye tracker aSee Glasses and the program aSeeStudio of China 7iNVENSUN Technology Co., Ltd. (Beijing, China) to record the eye-movement indexes of the participants under each experimental operating conditions, whose fixation state could be monitored anytime during the experimental process.
2.3.2. Experimental Procedure
The experimental procedure is shown in Figure 6. To counteract possible practice effects, the forms of light sources were presented to the participants in a random order. To shorten the time of repeated dark and bright adaptations and visual recovery for the participants, Subsequent luminance stimuli were rendered in the smallest-to-largest order, and the interval between two stimuli was set to be 15 s to reduce the mutual interference between the passing and upcoming light stimuli.
- (i)
- Before entering the darkroom, let the participants read through the experimental description and watch the pre-recorded experimental scenarios and voice prompts, and familiarize themselves with the experimental procedure and cautions.
- (ii)
- After being seated at the first viewing position, let the participants adjust the seat height independently and place their chin on a chinrest so that their point of sight keeps consistent with what is being marked (the central position) on the LED screen when their line of sight is horizontal.
- (iii)
- Assist the participants in wearing the eye tracker and, via the display interface of aSeeStudio, remind them to adjust the seat height to ensure that their point of sight falls at the central position. After the adjustment is complete, perform binocular calibration up to a degree of above 80 for both eyes to ensure the validity of collected data.
- (iv)
- At the official start of the experiment, the participants first undergo a 5 min dark adaptation, during which the baseline collection of pupil data and eye-movement data is performed. Afterwards, the participants open and close their eyes and give their subjective scoring according to the voice prompts. Throughout the experiment, remind the participants all the time to keep their line of sight horizontal by observing their point of fixation on the interface of aSeeStudio. Require the participants to try their best to avoid squinting and active blinking behaviors unless having non-opposing reactions.
- (v)
- As has been set, display the VSLS for EG#1 and, for each VSLS form, render five luminance states in turn, each maintained for 15 s. The participants rate the glare grades of the light-emitting surfaces according to their subjective feeling. After displaying the luminance of each VSLS form, let the participants take an eye-closed rest for 1 min. It will 46 min 15 s in total until all 21 VSLS forms are completed.
- (vi)
- The participants take a 15 min rest/activity and change their viewing position. Repeat steps (ii) through (v), except for the calibration.
The experiment was over on the first day. The participants were involved in the second group of experiment on the next day, following the same steps as above.
2.4. Data Analysis
First, the subjective evaluation scores and the eye-movement data normal distribution hypothesis were tested. The eye-movement data used in this study include pupil diameter (binocular mean data), saccade, and blink, which were processed by a mapping approach and collected through AOI region assignment in aSeeStudio. In addition, to preclude the effects of individual differences on the research results, the CRPD index has been added in the follow-up analysis.
The correlation between the VSLS discomfort glare and eye-movement indexes was analyzed in SPSS 26. Then, the BCD luminance under each operating condition was calculated using the MATLAB R2023a spline interpolation method, and, in combination with multifactor analysis of variance (ANOVA), correlation analyses (Pearson and Spearman), nonlinear regression analysis, etc. of SPSS to sift the morphological and position factors that can characterize the VSLS discomfort glare.
3. Experimental Results
Through the Shapiro–Wilk test, and by observing the normal P-P plot and the detrended normal P-P plot, it was found that the subjective evaluation scores, CRPD, SS, mean saccadic amplitude (SA) and BF data all obey normal distribution.
3.1. Experimental Data Description
3.1.1. EG#1: VSLS Forms
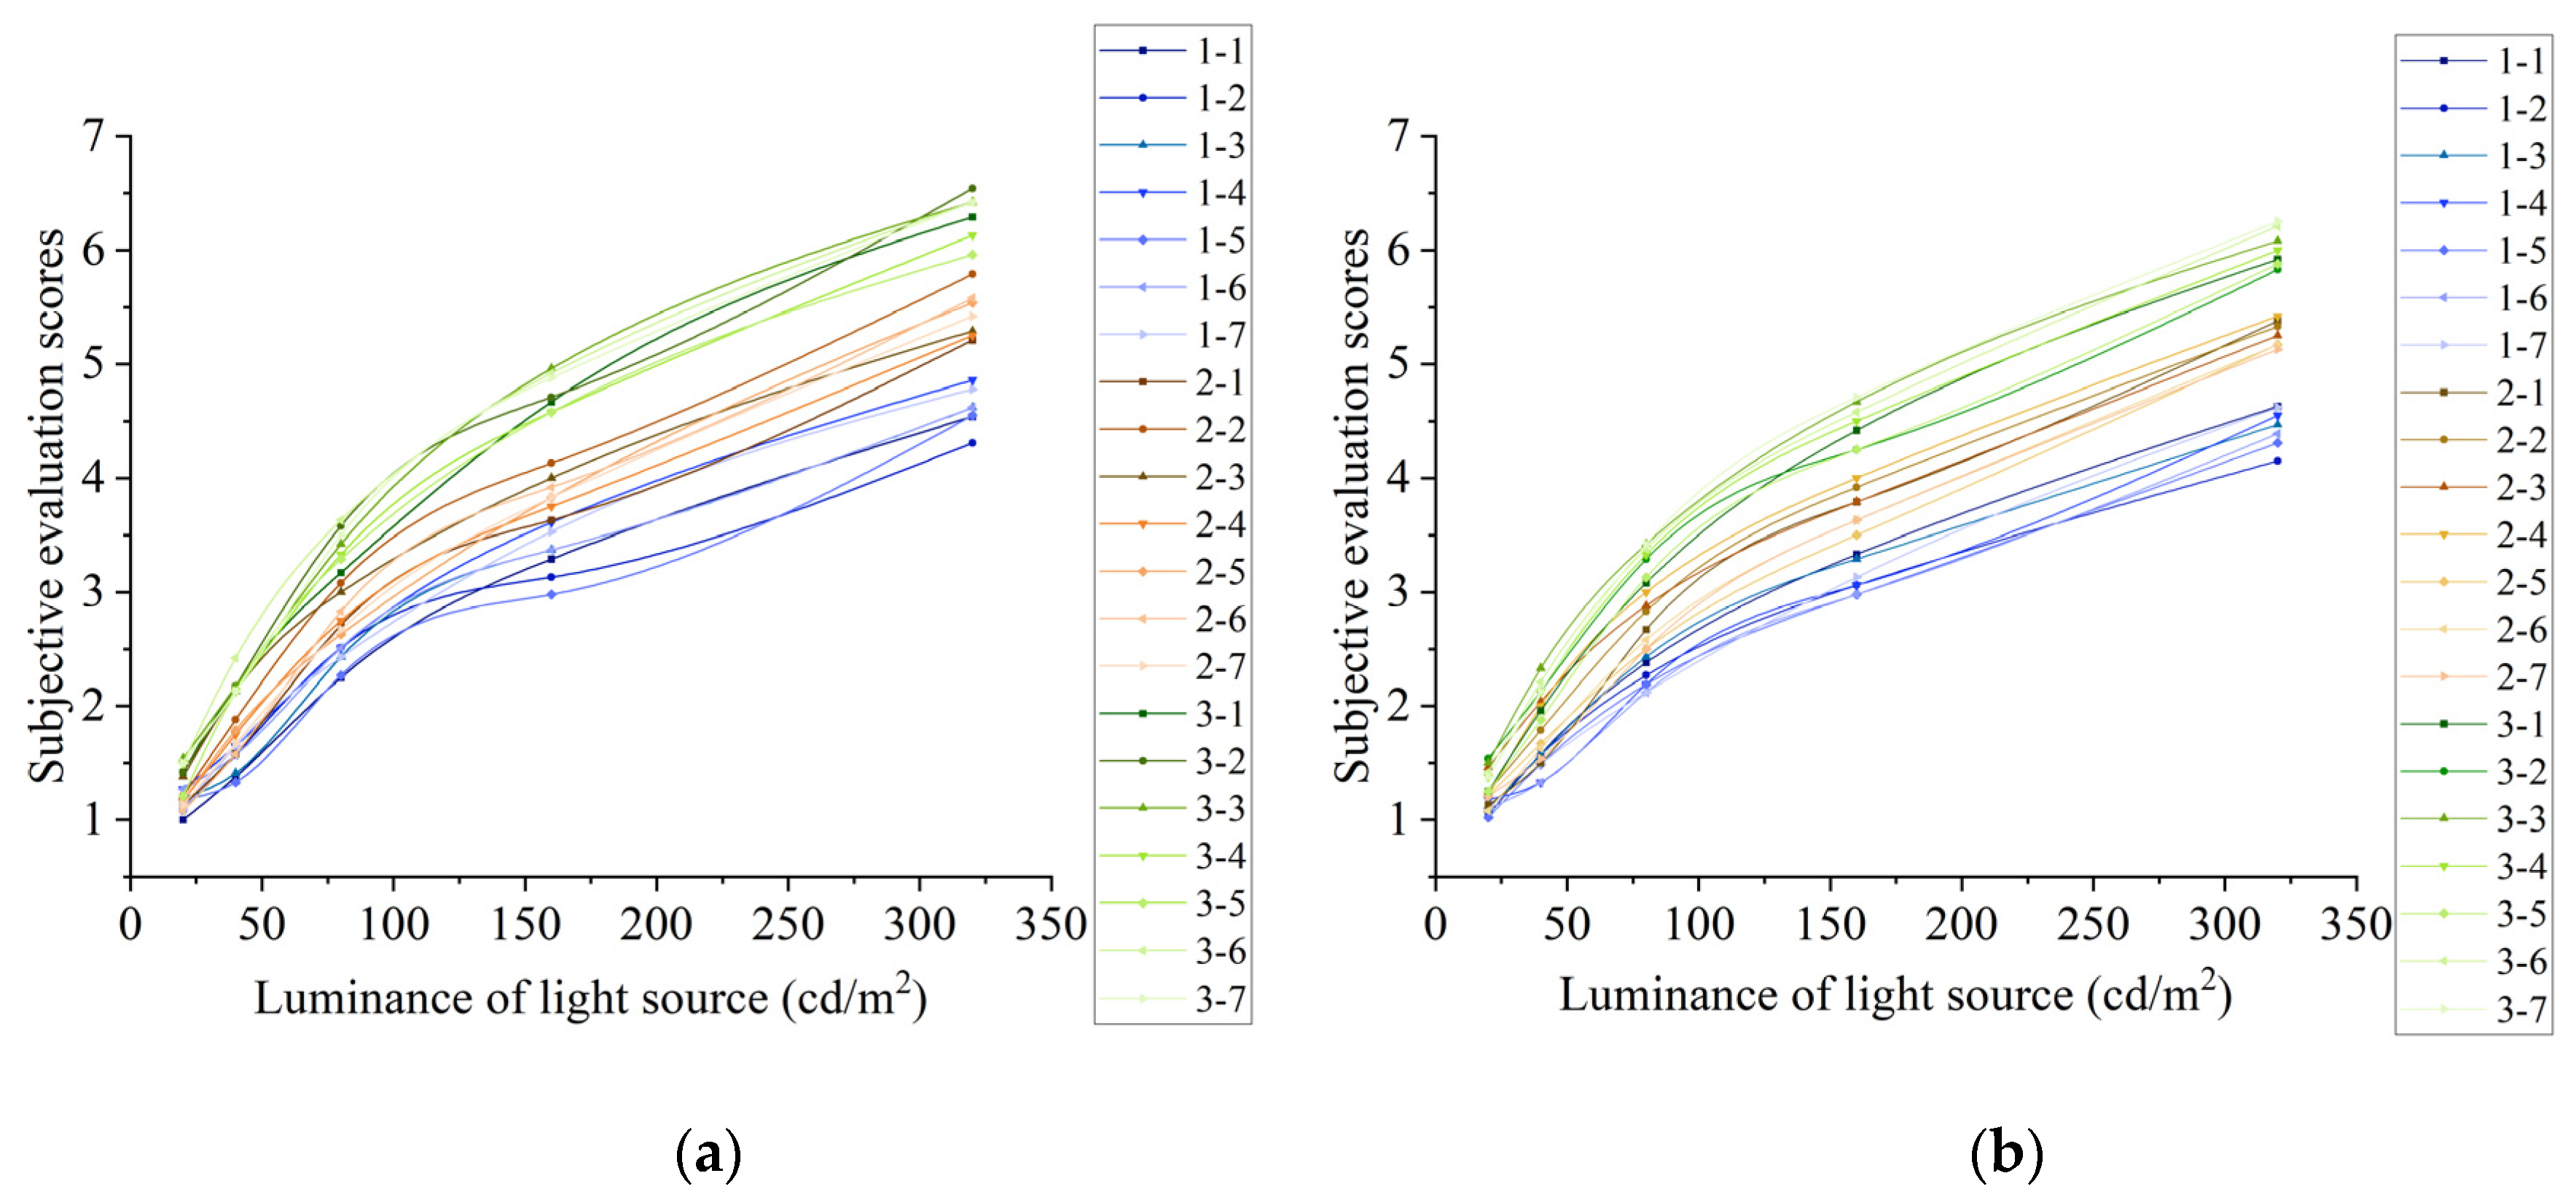
The subjective evaluation results are shown in Figure 7, rendering similar regularities under the two viewing distances. Under each operating condition, the subjective scores on glare perception increase with the increase in luminance, complying with the Weber–Fechner law. The Weber–Fechner law describes a nonlinear property in human perception, i.e., the ratio of the relative change in perception to the absolute change in the stimulus is constant. As the luminance increases, the effect of the same luminance change on subjective evaluation scores diminishes. This is because the nonlinear nature of perception makes it more difficult to detect changes in luminance at high luminance levels [25]. As light source area varies, the subjective evaluation scores exhibit significant differences: the larger the area, the higher the subjective evaluation scores on glare perception. This agrees with the conclusion in glare evaluation models that the greater the solid angle, the higher the degree of glare. Given the same light source area, I.e., equal solid angles, as the proportional relation of light sources varies, the subjective scores also exhibit certain differences but no marked regularities.
The results of CRPD are shown in Figure 8. Under the two viewing distances, CRPD takes on the same trend as subjective evaluation scores, constantly within the range of 20%~60%. CRPD increases gradually with the increase in luminance, though at a flattening rate. Similarly, the larger the light source area, the greater the value of CRPD at an equal luminance; given the same light source area with a varying length-to-width ratio, CRPD also exhibits certain differences.
No significant regularity has been observed between SA, the mean SS, BF and luminance of light source. See Supplementary Materials, Figures S1–S3 for relevant data.
3.1.2. EG#2: VSLS Position
The VSLS position versus the subjective evaluation scores results are shown in Figure 9. The subjective evaluation scores exhibit no significant differences under each operating condition at the two viewing distances, both rising with the increase in the luminance of the light source and at relatively high rates in the low-luminance ranges, whereafter the growth trends of the subjective scores flatten gradually. At an equal EA, the light source in RLVF receives the highest subjective scores, that is, it causes the strongest glare perception at equal luminance. Next, in LVF and at two distinct EAs, the subjective evaluation scores are both higher than at the visual center. For the light-emitting surfaces deflecting from the RVF and UVF, the subjective evaluation scores are the lowest. The farther the light source deflects from the visual center, the lower people’s subjective evaluation scores.
The VSLS position versus the CRPD results are shown in Figure 10. At the two viewing distances, CRPD increases with the increase in the luminance of light sources, and the growth trend slows down gradually after 150 cd/m2. Different from the subjective evaluation scores, CRPD is always greatest at all luminance values for the light-emitting surface at the central position, and the farther the visual center is deflected from, the smaller the resultant change of pupil diameter. Given the same EA, CRPD is always the greatest as a result of the light-emitting surface being located in RLVF. When the EA (11°, at 1.5 m viewing distance and 22° EA/3.0 m viewing distance) of the light-emitting surface is small, CRPD is the smallest as a result of the light-emitting surface being located in RVF; when the EA (22°, at 1.5 m viewing distance and 39° EA/3.0 m viewing distance) of the light-emitting surface is great, CRPD is the smallest as a result of the light-emitting surface being located in UVF.
No significant regularity has been observed between SA, the mean SS, BF, and luminance of light sources. See Supplementary Materials, Figures S4–S6 for relevant data.
3.2. Correlation between Subjective Evaluation Scores and Eye-Movement Indexes
From the above results, some eye-movement indexes show consistent trends with the subjective evaluation scores on glare perception. In SPSS, Pearson correlation analysis was performed with respect to the four items of eye-movement data—subjective evaluation scores on discomfort glare, CRPD, SA, and mean SS—under the two sorts of experimental variables. The results are shown in Table 5.
It can be concluded that the subjective evaluation scores on glare perception (p < 0.001) and CRPD (p < 0.001) bear significant correlations to the luminance of light sources, which are both strongly positive, as indicated by the coefficients of correlation (0.70~0.99). By the same token, the correlation between SA (p = 0.033 < 0.05 and p < 0.001, respectively) is weakly positive.
In the experiment on the relation between the VSLS shape and discomfort glare perception, the correlation between CRPD (p < 0.001) and subjective evaluation is significant and strongly positive (r = 0.874); the correlation between SA (p = 0.033 < 0.05) and subjective evaluation is significant and weakly positive (r = 0.135). In the experiment on the relation between the VSLS position and discomfort glare perception, the correlations between CPRD (p < 0.001) and SA (p = 0.033 < 0.05) and subjective evaluation are significant and moderately positive (r = 0.414 and 0.430, respectively). Therefore, in follow-up analyses of the experimental results and the regularities of how the light source form affects discomfort glare perception, this study is based on the subjective evaluation results and supplemented with CRPD, i.e., subjective–objective combination.
3.3. Light Source form Factors Affecting BCD Luminance
Due to differences between personal preferences, observers have hardly concurred on the definitions of different degrees of comfort and discomfort [26], which would trigger certain disputes over the degree of discomfort glare. Therefore, in his study, Guth used a single perception occurring on the borderline between comfort and discomfort, i.e., the BCD perception, as the criterion. In reference to this criterion, denote the luminance value corresponding to 3.5 points of scores (just uncomfortable) under each operating condition as BCD luminance. The scores per operating condition were processed by spline interpolation in MATLAB to obtain the BCD luminance values, as shown in Table 6.
The Shapiro–Wilk normality test indicates p = 0.107 > 0.05. Combined with the Q-Q plot, it can be concluded that the BCD luminance obeys normal distribution. The results of the Pearson correlation analysis are shown in Table 7. BCD luminance bears a significant correlation to the light source area (p < 0.001) but insignificant correlations to viewing distance (p = 0.128 > 0.05) and length-to-width ratio of light sources (p = 0.857 > 0.05).
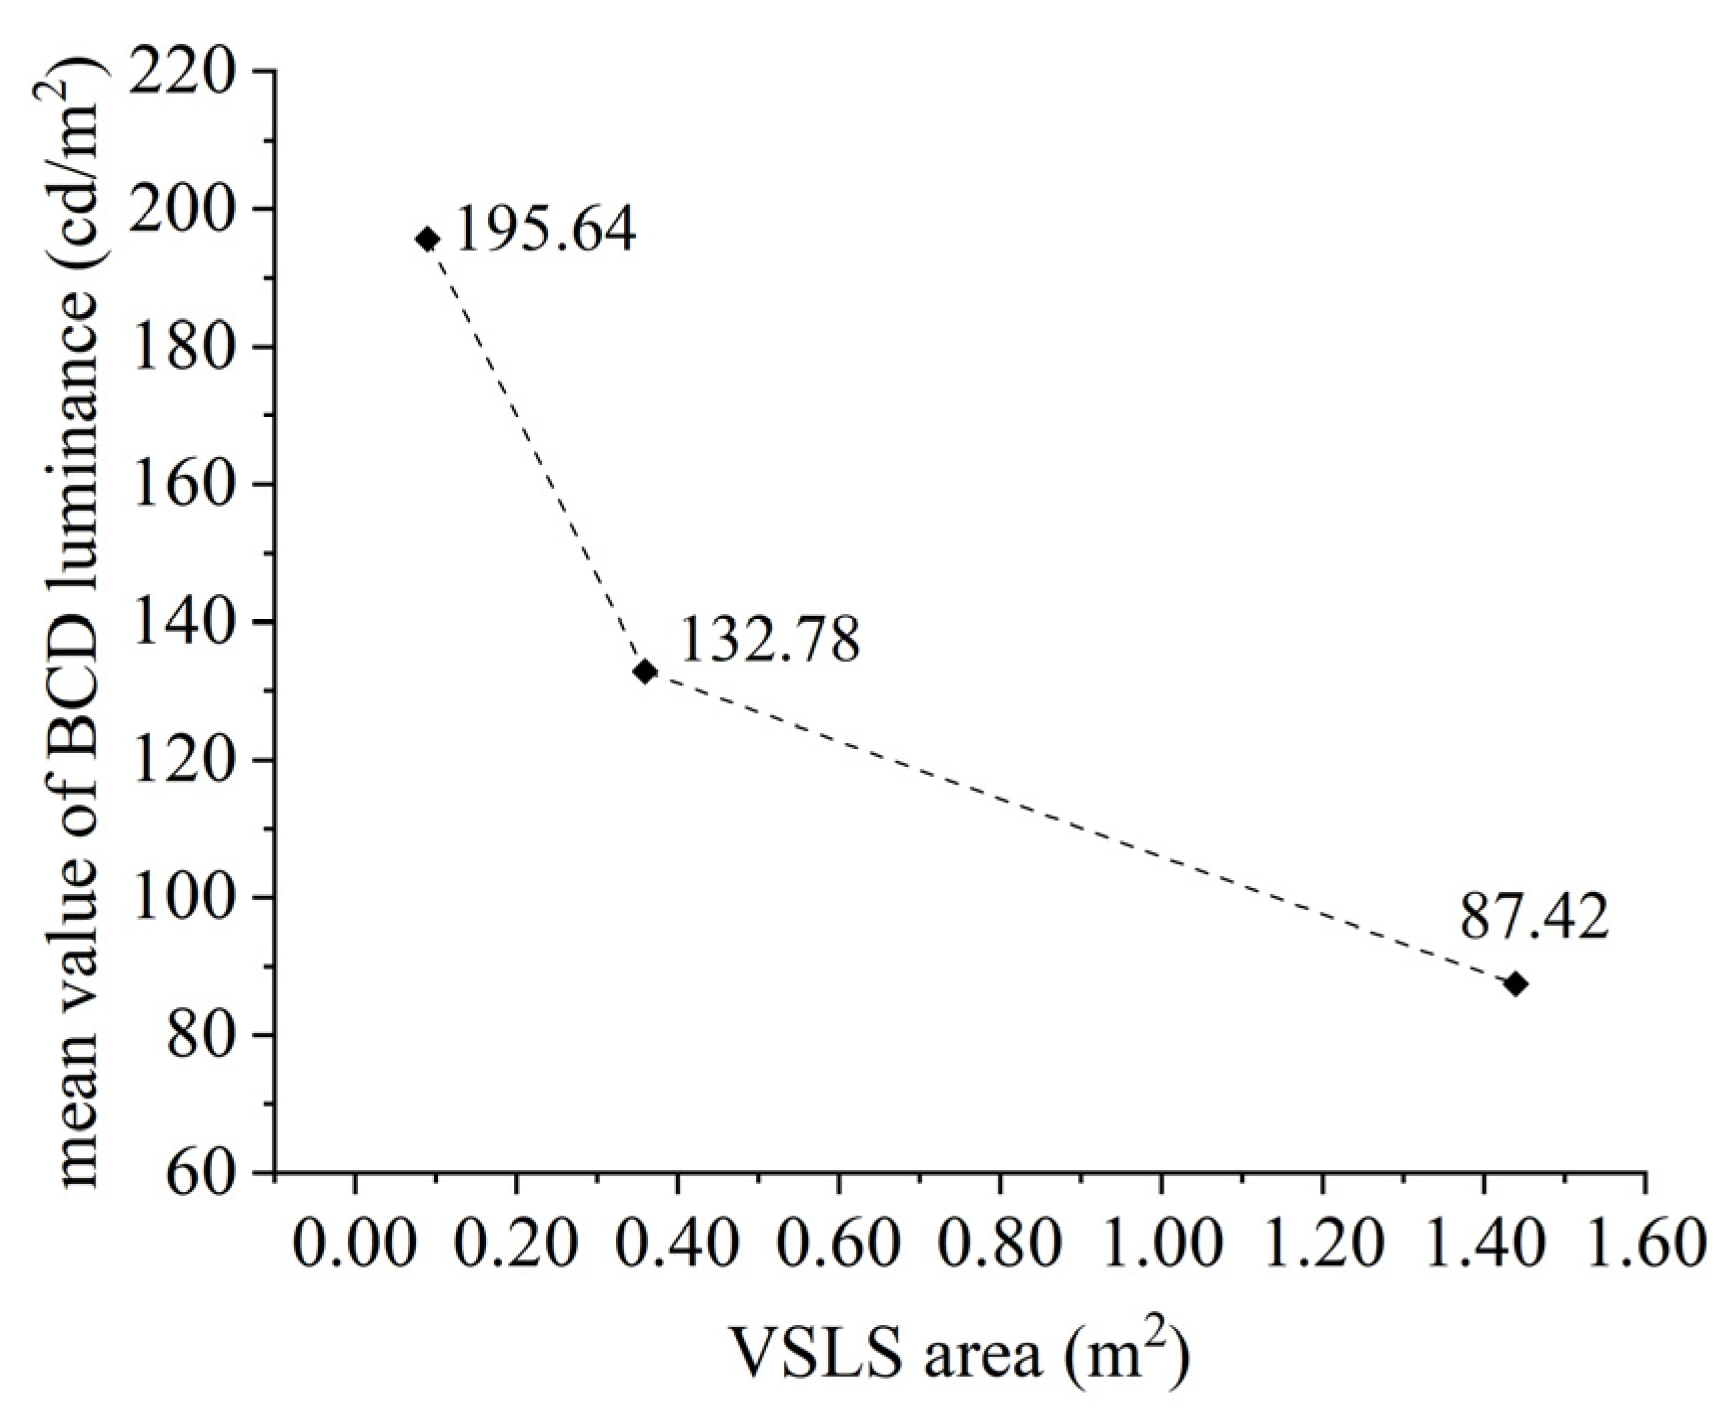
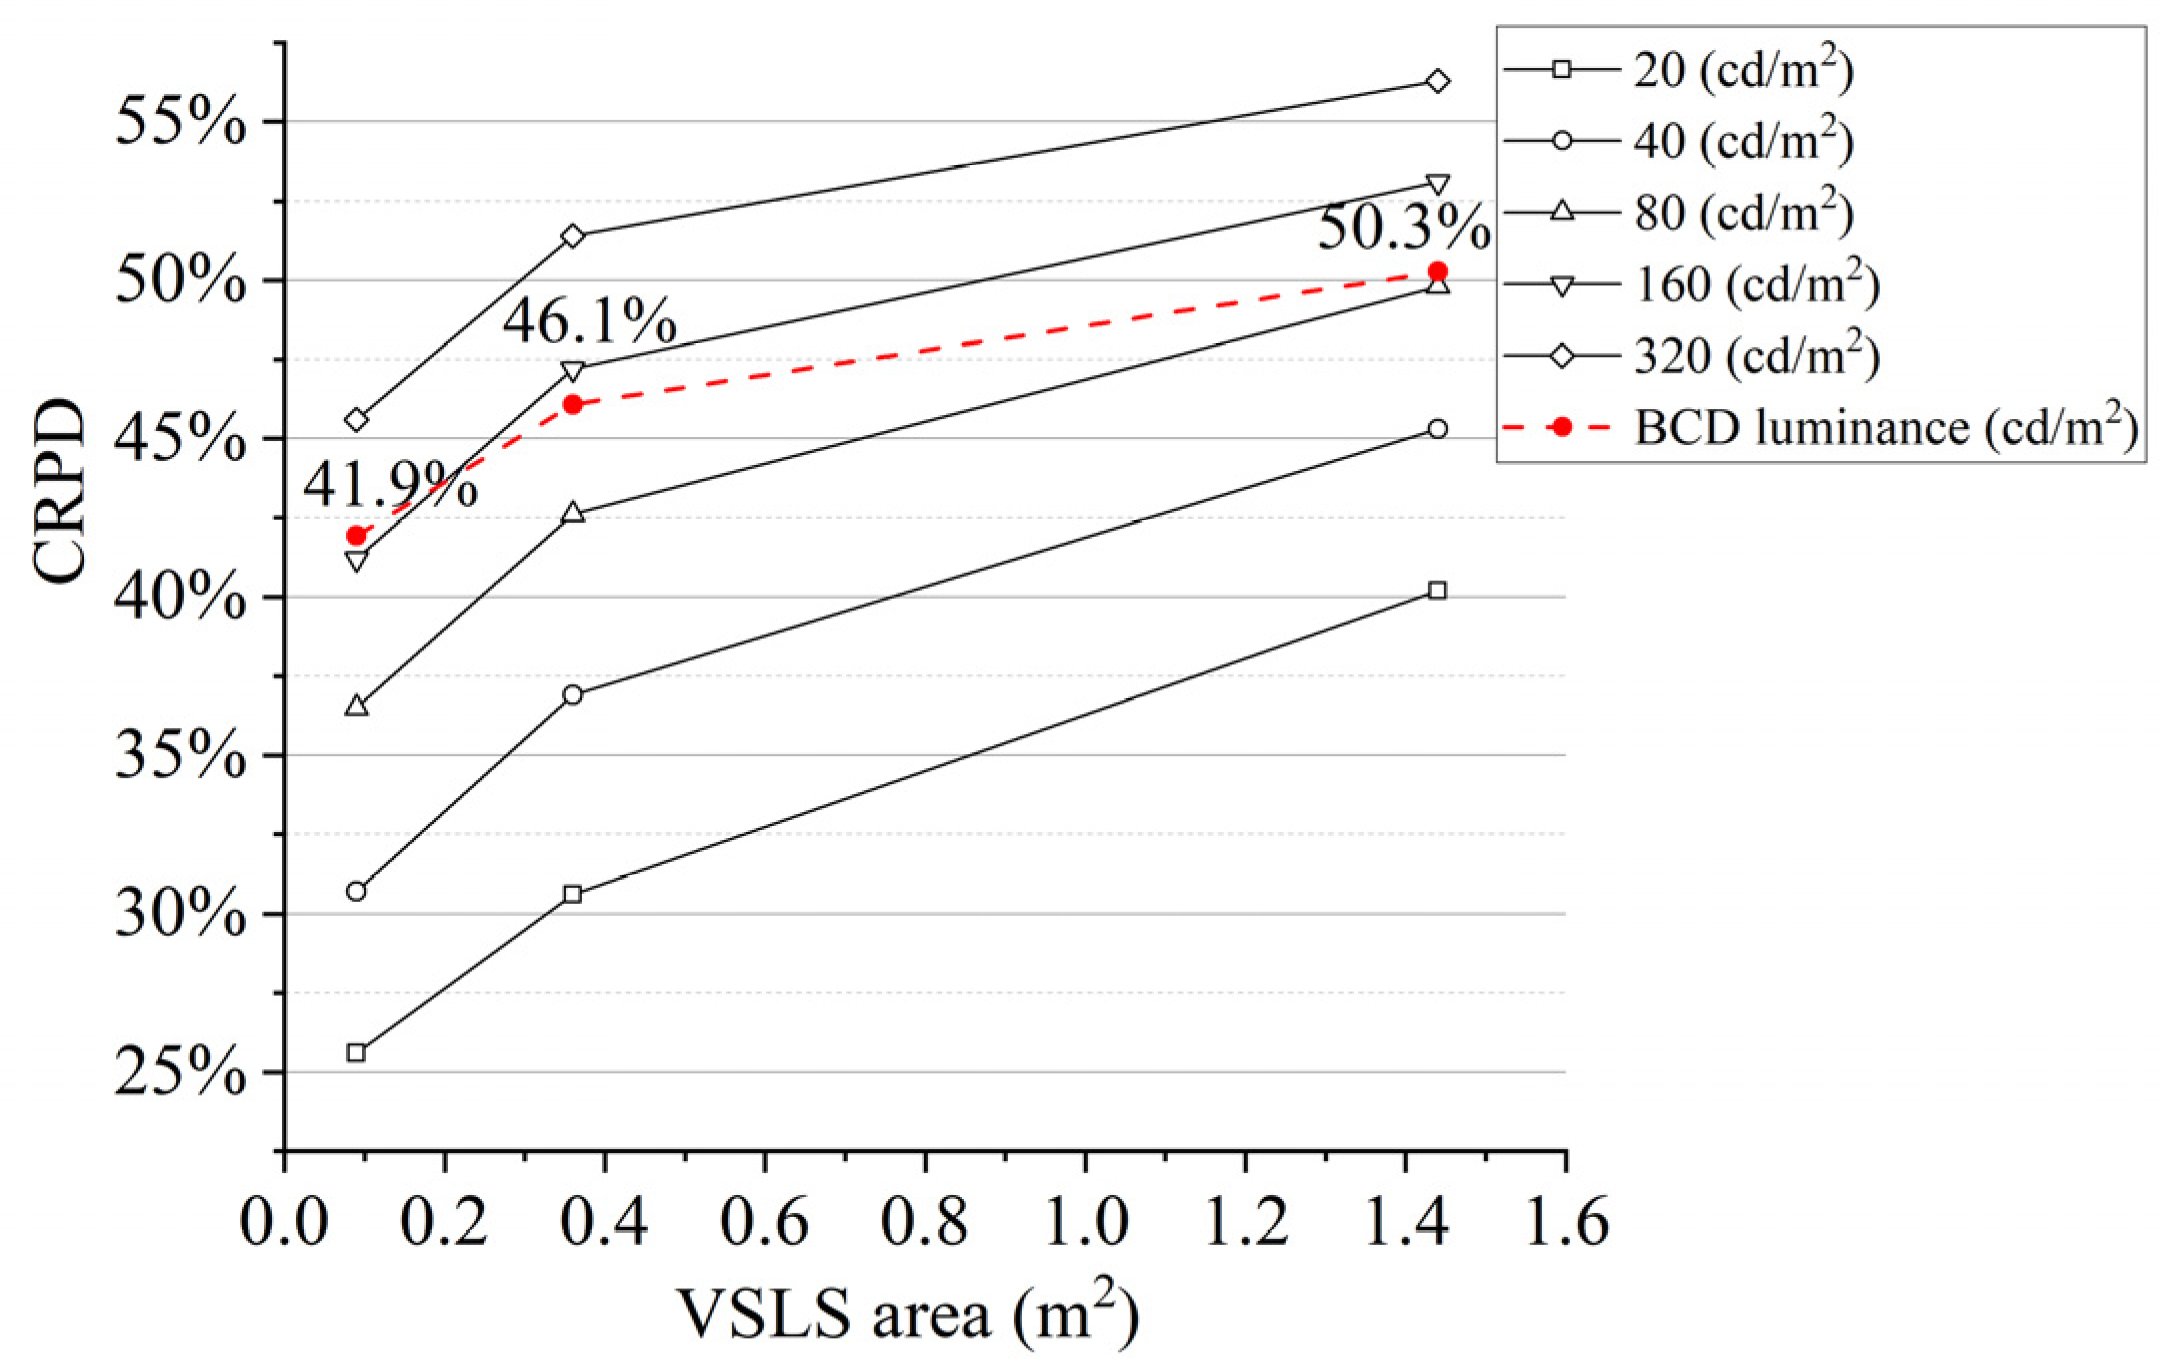
A variance analysis into the light source area was performed, and a homogeneity test of variance indicated heteroscedasticity. Hence, a corrected F-test was adopted, and it turned out that p < 0.001 and F = 143.797, showing that the between-group differences are statistically significant and that the overall difference is significant. In the follow-up step, the Games-Howell test was taken for multiple comparisons. It turned out that the p values are all smaller than 0.05, suggesting that the difference in BCD luminance is significant at the three levels of the vertical surface, and the greater the area, the lower the BCD luminance, as shown in Figure 11. Furthermore, CRPD also differs by VSLS area, as shown in Figure 12. Given the same luminance, the greater the VSLS area, the greater the CRPD. At the BCD value of luminance, CRPD = 41.9% when VSLS area = 0.09 m2; CRPD = 50.3% when VSLS area = 1.44 m2.
The results of the correlation analysis on the length-to-width ratio of light sources disagrees with the feedback provided by the participants in the experiment. A paired t-test was performed on the BCD luminance under different light source shapes. The results are shown in Table 8. When the light source area is 0.36 m2, the viewing distance is 3.0 m, and the light source ratio is 1:4 and 4:1, there is a significant difference in BCD luminance; when the light source area is 1.44 m2, the viewing distance is 1.5 m, and the light source ratio is 1:2 and 2:1, there is a significant difference in BCD luminance. In other words, the same solid angle and different shapes of light sources will actually lead to differences in discomfort glare.
Despite the fact that light-emitting surfaces with the same area make the same solid angle in human eyes, the visual field of human eyes differs in horizontal and vertical directions. Therefore, it is guessed that the degree of sensitivity to glare perception differs as the light source makes distinct angles with respect to lateral and longitudinal visual fields. The relationship between the light source and human visual field is represented in terms of LaVA and LoVA (Figure 13). Through correlation analysis, it can be concluded that the BCD luminance is significantly correlated to LaVA (r = −0.588, p < 0.001) and LoVA r = −0.633, p < 0.001).
From the scatterplots about LaVA/LoVA-BCD luminance relations, one can find that light source area, LaVA, and LoVA all bear nonlinear correlations to BCD luminance. The results of the curve estimation in SPSS show that the power function form between each variable and the dependent variable yields the highest degree of fitting compared to the quadratic and logarithmic functions., with the adjusted values of R2 being 0.892, 0.489, and 0.519, respectively, hence selected for nonlinear regression analysis. Set the model expression as
where is BCD luminance, is light source area, α is LaVA, β is LoVA, and a, c, d and e are constants.
The optimal solution was found with R2 = 0.882, showing that this model can explain 88.2% of the change in the dependent variable with satisfactory fitting results. Therefore, the final regression equation is given in Formula (5). It can be concluded that BCD luminance is most significantly affected by the light source area, followed by LoVA, and least significantly affected by LaVA.
where is BCD luminance, is the light source area, α is LaVA, β is LoVA.
Based on this, we propose the effective area () to characterize the shape of the vertical glare light source. The purpose is to convert a certain light source into a square VSLS with the same BCD luminance. The following equation is obtained:
where, is BCD luminance (cd/m2), is effective area of VSLS (m2), is the horizontal distance between observer and VSLS (m).
3.4. The Light Source Position Factors Affecting BCD Luminance
In the formula for discomfort glare evaluation, the position index acts the role of converting the light source luminance in peripheral visual field into the light source luminance in central line of sight with the same effect. At the BCD level, it represents the ratio of BCD luminance in the peripheral visual field to BCD luminance in the central line of sight [27]. Based on the subjective evaluation scores results, the scores per operating condition were processed by spline interpolation in MATLAB R2023a to obtain the BCD luminance values under different installation positions, as shown in Table 9.
Looking up the table in reference [16], one can find: when the viewing distance = 1.5 m, PUVF-1 = 2.35, PUVF-2 = 5.00, PRVF-1 = 1.32, and PRVF-2 = 1.82; when the viewing distance = 3.0 m, PUVF-1 = 1.53, PUVF-2 = 2.35, PRVF-1 = 1.12, and PRVF-2 = 1.32. A comparative analysis against the BCD luminance obtained from the experiment was conducted, as shown in Table 10. The results show that the BCD luminance calculated according to the current position index P is higher than the measured value. Note that the position index is defined only in UVF and cannot be used to evaluate the discomfort glare in LVF. Studies show that the luminance perceptibility threshold value differs between the point and surface light sources [7]. Moreover, a large-area VSLS may occupy both UVF and LVF regions at the same time, and different parts are endowed with different weights via the position factor, so the glare perception differs between the UVF and LVF [14]. The current position index value does not apply to the glare evaluation of the VSLS and, therefore, this paper corrects the original position index relation to accurately express the relative relation between the VSLS and human visual field.
First, a Shapiro–Wilk normality test on BCD luminance was conducted under the position variables, indicating p < 0.001. Combined with the Q-Q plot, it can be concluded that the BCD luminance does not obey normal distribution, so Spearman’s method was adopted for correlation analysis, with the results shown in Table 11. The BCD luminance of the VSLS is significantly correlated to both EA and AA (p < 0.001); therefore, the two key parameters expressing positions remain useful, but their weighting relation should be reconsidered when it comes to the large-area VSLS, relative to the center of visual field.
According to the connotation of the position index, based on the BCD luminance at the central position of vision, the position index P’ of VSLS in this experiment was calculated to obtain the relations between P’ and EA and AA of VSLS, as shown in Figure 14. When VSLS is located in UVF and RUVF, the greater the EA, the greater the BCD luminance, and the BCD luminance is always higher than at the visual center; when VSLS is located in RLVF and LVF, the BCD luminance varies little by EA and is always lower than at the visual center. In other words, given the same luminance, the vertical light-emitting surface in LVF is more likely to cause the discomfort glare.
Because the independent variables were the same as their basic laws, we refitted the original formula. So based on Formula (2), nonlinear regression was performed in SPSS, with the model expression set as:
where P′ is the position index of VSLS, τ denotes the AA at the geometrical center of VSLS relative to the visual center, σ denotes the angle between the line of sight and the line from the observer to the geometrical center of VSLS, i.e., EA, and a~h are constants. Through multiple iterations, the optimal solutions of a~h were obtained with R2 = 0.671, indicating a satisfactory fitting degree. See Formula (9) for the final model.
4. Discussion
Hamedani et al. [8] overviewed the physiological reactions measuring visual discomforts objectively in illumination research. In visual perception experiments, PD is a key evaluation parameter. Consistent with their study, in this experiment, the correlation between CRPD and subjective evaluation scores on discomfort glare perception is strong, with PD shrinking with the increase in luminance [28]. However, in the experimental results of VSLS position, the result orientations of subjective evaluation and CRPD are slightly different (Figure 9c and Figure 10c). CRPD is the highest when the light source is located at the visual center, while the subjective evaluation scores are the highest when the light source is located in LVF/ULVF, according to the subjective evaluation scores results. Such a discrepancy may stem from the reason that the subjective evaluation scores are based on participants’ intuitive perception of light sources and subjective feedbacks on the current ambience, which may be subject to personal preferences, physiological and psychological states, environmental, and other factors [29]. Affective state and empirical cognition could make the participants more susceptible to the light source [30,31], while these factors are not directly correlated with PD and other physiological indexes. SA, mean SS, and BF are common parameters evaluating visual fatigue [8], among which SA bears a weak correlation to subjective evaluation, but vague correlations to luminance, area, and position in this study. The causes of saccadic amplitude are complex. In addition to visual stimulus characteristics, it can be influenced by auditory stimuli, cognitive factors, and physiological states [32]. This probably has something to do with the degree of participants’ tolerance to operating condition switchover, the ambience, and other factors in the experimental process.
The combination of subjective evaluation with objective measurement of physiological indexes is a more mainstream approach in the current glare studies [8,33]. However, the interaction of multiple factors has led to some differences between subjective evaluation and objective measurement. At present, the physiological influence mechanisms remain under active exploration in all disciplines. Therefore, studies on discomfort glare at the current stage remain based on subjective evaluation to sift shape and position parameters suited for the VSLS discomfort glare in combination with CRPD.
The solid angle is a physical quantity in current evaluation models which is used to characterize the relative size of glaring sources within the line of sight. Through field investigation, it turns out that an indoor VSLS is typically at a close distance from th observer. At such a near distance, the discomfort glare perception of the VSLS is highly correlated to area (r = 0.87), while distance is no longer a main influential factor. Relative to point and line light sources, surface light sources have differences in shape and ratio. For the same solid angle, there were differences in subjective ratings when the light source length-to-width ratio was 1:4 and 4:1. Therefore, when the light-emitting surface is large and located on the wall, the apparent size of the light source cannot be characterized by the solid angle alone. Considering observer’s visual characteristics, this study also discusses how discomfort glare perception differs by the length-to-width ratio of light sources. The results show that, with respect to LaVA and LoVA of human eyes, the VSLS has affected the discomfort glare perception, agreeing with the theory that the sensitivity of human eyes exhibits difference in horizontal and vertical kens and central and peripheral visual fields [34].
Observer’s perception difference (slight or appreciable) in different visual fields is related to the direction of stimuli, and is called the anisotropy of VF [30,31]. Due to the difference between low- and high-order cognition, luminance perception differs somewhat in the peripheral visual field, with people showing higher sensitivity and tolerance to light changes in UVF [35,36]. Therefore, the discomfort glare perception is stronger when the VSLS is located in LVF. Additionally, it turns out through verification that the current position index does not apply to the VSLS. According to Figure 14. and the correlation results, BCD luminance is still affected mainly by EA and AA. Thus, refitting has given the expression of the new position index P’. In the DGI calculation formula, Ω is the corrected solid angle, which involves weighting coefficients windowing different regions, depending on the direction of the line of sight relative to the observer. We attempted to add into the position relation the parameters of view angles made by a large-area VSLS with respect to human eyes. However, the correlation analysis results indicate the correlation between LaVA/LoVA and the BCD luminance due to position is insignificant (p > 0.05).
Since the VSLS was played randomly, interference with the post-image did occur in some of the working conditions. This is a weakness in the experiment. In the follow-up research, we will give the participants enough time to relieve themselves by increasing the rest duration, rationalizing the sequence of working conditions, or other methods. In addition, the random playback of different luminance will cause the pupil diameter to contract and dilate back and forth, which will bring about visual fatigue, and since the human eye undergoes the process of bright adaptation faster than dark adaptation, the luminance stimuli of the present experiment were presented sequentially from small to large. This may bring about an anchoring bias caused by the initial luminance, but the results based on the rate of change of pupil diameter do not affect the elements and the law of influence in the results of this experiment. In the next glare threshold study, we will refine the evaluation process to reduce or avoid the impact of anchoring bias. In the research by Takase et al. [27], the effects of the solid angle and EA of light sources on BCD luminance were explored to validate the necessity of interpreting visual characteristics from both perspectives of light source size and the effect of position on discomfort glare. Considering the field angle made by the large-area VSLS with respect to human eyes, in future studies, we will make further exploration on the interaction between the VSLS shape and position and discomfort glare.
5. Conclusions
With the area, length-to-width ratio, and position of a rectangular VSLS, the three key factors of visual form and as the independent variables in the study, a subjective evaluation experiment on glare and an objective measurement of eye-movement data was conducted to acquire the key morphological and position factors characterizing the relative relation between the VSLS and human visual field. The main conclusions are drawn below:
- (1)
- The subjective evaluation scores on the correlation between CRPD and discomfort glare are the highest and can be regarded as an objective characterization index; as the light source area augments from 0.09 m2 to 1.44 m2, the BCD luminance is 195.64, 132.78, and 87.42 cd/m2 in turn, corresponding to CRPD of 41.9%, 46.1%, and 50.3%, respectively.
- (2)
- The area of the rectangular VSLS and the LaVA and LoVA made by its length and width dimensions with respect to human eyes are the main morphological factors affecting glare perception.
- (3)
- A functional equation is fitted between BCD luminance and the VSLS area, LaVA and LoVA; the VSLS area has the greatest bearing on BCD luminance (r = −0.871), LoVA has the second greatest (r = −0.633), and LaVA has the least bearing on BCD luminance (r = −0.588).
- (4)
- EA and AA at the geometrical center of the vertical surface are essential position factors affecting glare perception. Guth position index has been corrected as P’, which has been proposed to indicate the relative position of VSLS in the visual field, according to the experimental results.
The position index represents the ratio of BCD luminance at non-central positions to BCD luminance at the center, while the BCD luminance at the center can be determined by the equation fitted in Section 3.3. Therefore, the conclusion of this paper can preliminarily estimate the BCD luminance of arbitrarily positioned and shaped VSLS. Nevertheless, this study has separated the discussion of shape and position, the two essential factors. In the future, we will try to introduce the field angle made by the large-area VSLS with respect to human eyes to explore how the interaction between the shape and position of VSLS affects discomfort glare perception and continue to consummate the VSLS glare evaluation methodology.
Supplementary Materials
The following supporting information can be downloaded at: https://www.mdpi.com/article/10.3390/buildings14051227/s1, Figure S1: Relation between light source form and SA; Figure S2: Relation between light source form and Mean SS; Figure S3: Relation between light source form and BF; Figure S4: Relation between light source position and SA; Figure S5: Relation between light source position and Mean SS; Figure S6: Relation between light source position and BF.
Author Contributions
Conceptualization, G.K. and L.W.; Methodology, G.K., P.C. and L.W.; Investigation, G.K., P.C., S.W. and F.M.; Resources, G.K. and L.W.; Data curation, G.K., F.M. and S.W.; Writing—original draft preparation, G.K.; Writing—review and editing, G.K., P.C., S.W. and F.M.; Visualization, G.K., P.C. and F.M.; Supervision, L.W. and P.C. All authors have read and agreed to the published version of the manuscript.
Funding
This study was funded by National Natural Science Foundation of China (52278120).
Data Availability Statement
The data presented in this study are available on request from the corresponding author.
Conflicts of Interest
The authors declare no conflict interest.
Abbreviations
| AA | azimuthal angle |
| BF | blinking frequency |
| CRPD | change rate of pupil diameter |
| EA | elevation angle |
| SA | mean saccadic amplitude |
| SS | saccadic speed |
| LaVA | lateral view angle |
| LoVA | longitudinal view angle |
| LVF | the lower visual field |
| RLVF | the right-lower visual field |
| RVF | the right visual field |
| RUVF | the right-upper visual field |
| UVF | the upper visual field |
| VSLS | vertical surface light source |
References
- Cuttle, C. Towards the third stage of the lighting profession. Light. Res. Technol. 2010, 42, 73–93. [Google Scholar] [CrossRef]
- Cuttle, C. Extending the lighting design objectives procedure for holistic lighting solutions. Light. Res. Technol. 2022, 54, 631–656. [Google Scholar] [CrossRef]
- Zhao, J.; Chun, Y.; Wang, S.; Luo, T. Technological trends of luminous environment improvement. Build. Sci. 2022, 38, 14–19. [Google Scholar] [CrossRef]
- Suk, J.Y.; Schiler, M.; Kensek, K. Investigation of existing discomfort glare indices using human subject study data. Build. Environ. 2017, 113, 121–130. [Google Scholar] [CrossRef]
- Wang, L.; Kong, G.; Juan, L.; Yu, J.; Wu, Y. Effects of lighting environment on vision and cognition of interactive reading. J. Harbin Inst. Technol. 2022, 54, 67–77. [Google Scholar] [CrossRef]
- Jin, L.; Xue, P.; Zhang, L.; Wang, J.; Shi, J.; Liang, Q.; Cao, X.; Xu, N.; Liao, J. Visual and non-visual effects of integrated lighting based on spectral information. Build. Environ. 2023, 242, 110617. [Google Scholar] [CrossRef]
- Kong, G.; Chen, P.; Wang, L.; Chen, S.; Yu, J.; Chen, Z. Calibration of brightness of virtual reality light sources based on user perception in the real environment. J. Build. Eng. 2023, 78, 107702. [Google Scholar] [CrossRef]
- Hamedani, Z.; Solgi, E.; Skates, H.; Hine, T.; Fernando, R.; Lyons, J.; Dupre, K. Visual discomfort and glare assessment in office environments: A review of light-induced physiological and perceptual responses. Build. Environ. 2019, 153, 267–280. [Google Scholar] [CrossRef]
- Boyce, P.R. Human Factors in Lighting, 3rd ed.; CRC Press: London, UK, 2014; p. 703. [Google Scholar]
- Yang, Y.; Luo, M.R.; Ma, S.N. Assessing glare. Part 2: Modifying unified glare rating for uniform and nonuniform led luminaires. Light. Res. Technol. 2017, 49, 727–742. [Google Scholar] [CrossRef]
- Chen, R.; Jia, K.; Zhao, X.; Qi, Q.; Zhu, J. Introduction of using Unified Glare Rating for visual comfort evaluation considering the brightness difference between VDT and its ambience. In Proceedings of the IEEE 7th Global Conference on Consumer Electronics (GCCE), Nara, Japan, 9–12 October 2018; pp. 433–436. [Google Scholar] [CrossRef]
- Luckiesh, M.; Guth, S.K. Brightness in visual field at Borderline between Comfort and Discomfort (BCD). Illum. Eng. 1949, 44, 650–670. [Google Scholar]
- Sasaki, Y.; Muroi, N. Relationships between the position of the glare source and BCD brightness under the uniform field brightness. J. Illum. Eng. Inst. Jpn. 1979, 63, 542–548. (In Japanese) [Google Scholar] [CrossRef] [PubMed]
- Iwata, T.; Tokura, M. Position Index for a glare source located below the line of vision. Light. Res. Technol. 1997, 29, 172–178. [Google Scholar] [CrossRef]
- Kim, W.; Han, H.; Kim, J.T. The position index of a glare source at the borderline between comfort and discomfort (BCD) in the whole visual field. Build. Environ. 2009, 44, 1017–1023. [Google Scholar] [CrossRef]
- Ministry of Housing and Urban-Rural Development of the People’s Republic of China. GB 50034-2013 Standard for Lighting Design of Buildings; China Architecture and Building Press: Beijing, China, 2013.
- Rea, M.S. IESNA Lighting Handbook, 9th ed.; Illuminating Engineering Society of North America: New York, NY, USA, 2000. [Google Scholar]
- Allan, A.C.; Garcia-Hansen, V.; Isoardi, G.; Smith, S.S. Subjective assessments of lighting quality: A measurement review. Leukos 2019, 15, 115–126. [Google Scholar] [CrossRef]
- Lin, Y.; Fotios, S.; Wei, M.; Liu, Y.; Guo, W.; Sun, Y. Eye movement and pupil size costriction under discomfort glare. Investig. Ophthalmol. Vis. Sci. 2015, 56, 1649–1656. [Google Scholar] [CrossRef] [PubMed]
- Tyukhova, Y.; Waters, C.E. Subjective and pupil responses to discomfort glare from small, high-luminance light sources. Light. Res. Technol. 2019, 51, 592–611. [Google Scholar] [CrossRef]
- Hamedani, Z.; Solgi, E.; Hine, T.; Skates, H. Revealing the relationships between luminous environment characteristics and physiological, ocular and performance measures—An experimental study. Build. Environ. 2020, 172, 106702. [Google Scholar] [CrossRef]
- Veitch, J.A.; Miller, N.J. Effects of Temporal Light Modulation on Individuals Sensitive to Pattern Glare. Leukos 2024, 1–37. [Google Scholar] [CrossRef]
- De Boer, J.B.; Schreuder, D.A. Glare as a criterion for quality in street lighting. Light. Res. Technol. 1967, 32, 117–135. [Google Scholar] [CrossRef]
- Ngai, P.; Boyce, P. The effect of overhead glare on visual discomfort. J. Illum. Eng. Soc. 2000, 29, 29–38. [Google Scholar] [CrossRef]
- Seim, T.; Valberg, A. A neurophysiologically-based analysis of lightness and brightness perception. Color Res. Appl. 2016, 41, 339–351. [Google Scholar] [CrossRef]
- Luckiesh, M.; Holladay, L.L. Glare and visibility. Trans. Illumin. Eng. Soc. 1925, 20, 221–252. [Google Scholar] [CrossRef]
- Takase, K.; Hara, N. The Relationship between Solid Angle, Eccentric Angle, and Luminance of Glare Source under the BCD Condition to Understand the Effect of Visual Characteristics on Discomfort Glare. J. Sci. Technol. Light. 2021, 44, 17–24. [Google Scholar] [CrossRef]
- Zhang, Y.; Li, S.; Wang, J.; Wang, P.; Tu, Y.; Li, X.; Wang, P. Pupil size estimation based on spatially weighted corneal flux density. IEEE Photonics J. 2019, 11, 2948223. [Google Scholar] [CrossRef]
- Pierson, C.; Wienold, J.; Bodar, M. Review of Factors Influencing Discomfort Glare Perception from Daylight. Leukos 2018, 14, 111–148. [Google Scholar] [CrossRef]
- Istiqomah, N.; Kinzuka, Y.; Minami, T.; Nakauchi, S. Brightness Perception in World-Centered Coordinates Assessed by Pupillometry. Behav. Sci. 2023, 13, 60. [Google Scholar] [CrossRef] [PubMed]
- Istiqomah, N.; Suzuki, Y.; Kinzuka, Y.; Minami, T.; Nakauchi, S. Anisotropy in the peripheral visual field based on pupil response to the glare illusion. Heliyon 2022, 8, e09772. [Google Scholar] [CrossRef] [PubMed]
- Yamagishi, S.; Furukawa, S. Factors influencing saccadic reaction time: Effect of task modality, stimulus saliency, spatial congruency of stimuli, and pupil size. Front. Hum. Neurosci. 2020, 14, 571893. [Google Scholar] [CrossRef]
- Fotios, S. Correspondence: New methods for the evaluation of discomfort glare. Light. Res. Technol. 2018, 50, 489–491. [Google Scholar] [CrossRef]
- Domdei, N.; Reiniger, J.L.; Holz, F.G.; Harmening, W.M. The relationship between visual sensitivity and eccentricity, cone density and outer segment length in the human foveola. Investig. Ophthalmol. Vis. Sci. 2021, 62, 31. [Google Scholar] [CrossRef]
- Portengen, B.L.; Roelofzen, C.; Porro, G.L.; Imhof, S.M.; Fracasso, A.; Naber, M. Blind spot and visual field anisotropy detection with flicker pupil perimetry across brightness and task variations. Vis. Res. 2021, 178, 79–85. [Google Scholar] [CrossRef] [PubMed]
- Mccourt, M.E.; Blakeslee, B.; Padmanabhan, G. Lighting direction and visual field modulate perceived intensity of illumination. Front. Psychol. 2013, 4, 983. [Google Scholar] [CrossRef] [PubMed]
Figure 1.
Examples of light-emitting surfaces applied to vertical walls: (a) Stanley coffee, Hangzhou, China; (b) ZIPLAB cross-border e-commerce offline experience store, Guangzhou, China; (c) OPPO flag store, Shanghai, China; (image source: https://www.gooood.cn, accessed on 10 January 2024).
Figure 1.
Examples of light-emitting surfaces applied to vertical walls: (a) Stanley coffee, Hangzhou, China; (b) ZIPLAB cross-border e-commerce offline experience store, Guangzhou, China; (c) OPPO flag store, Shanghai, China; (image source: https://www.gooood.cn, accessed on 10 January 2024).

Figure 2.
(a) Diagram of solid angle coordinates with observer’s position as the Origin [16]; (b) Diagram for position index calculation [17], where τ denotes the angle between the line of sight and the light source contained vertical plane (AA); σ denotes the angle between the line of sight and the observer-to-light source line (EA).

Figure 3.
Diagram of the relationship between the experimental space and the control system.

Figure 4.
Schematic of the VSLS forms.

Figure 5.
Schematic of VSLS positions.

Figure 6.
Diagram of the experimental procedure, where X represents the last experimental operating condition, which is 21 for EG#1 and 11 for EG#2; the time marked in the time axis is the time spent by EG#1.
Figure 6.
Diagram of the experimental procedure, where X represents the last experimental operating condition, which is 21 for EG#1 and 11 for EG#2; the time marked in the time axis is the time spent by EG#1.

Figure 7.
Relation between the light source form and subjective evaluation. (a) viewing distance = 1.5 m. (b) viewing distance = 3.0 m.
Figure 7.
Relation between the light source form and subjective evaluation. (a) viewing distance = 1.5 m. (b) viewing distance = 3.0 m.

Figure 8.
Relation between the light source form and CRPD. (a) viewing distance = 1.5 m; (b) viewing distance = 3.0 m.
Figure 8.
Relation between the light source form and CRPD. (a) viewing distance = 1.5 m; (b) viewing distance = 3.0 m.

Figure 9.
Relation between the light source position and subjective evaluation. (a) viewing distance = 1.5 m; (b) viewing distance = 3.0 m; (c) Boxplot of light source position versus subjective evaluation results.
Figure 9.
Relation between the light source position and subjective evaluation. (a) viewing distance = 1.5 m; (b) viewing distance = 3.0 m; (c) Boxplot of light source position versus subjective evaluation results.

Figure 10.
Relation between the light source position and CRPD. (a) viewing distance = 1.5 m; (b) viewing distance = 3.0 m (c) Boxplot of light source position versus CRPD.
Figure 10.
Relation between the light source position and CRPD. (a) viewing distance = 1.5 m; (b) viewing distance = 3.0 m (c) Boxplot of light source position versus CRPD.

Figure 11.
Relation between the VSLS area and BCD luminance.

Figure 12.
Relation between the VSLS area and CRPD.

Figure 13.
Schematic of LaVA and LoVA.

Figure 14.
Relation between P’ and VSLS position.


Table 1.
Luminance settings.
| Design Luminance (cd/m2) | 20 | 40 | 80 | 160 | 320 |
|---|---|---|---|---|---|
| achromatic images |  |  |  |  |  |
| Brightness values | 18 | 36 | 66 | 95 | 127 |
| Actual luminance (cd/m2) | 19.75 | 40.20 | 79.97 | 161 | 320.6 |
| Error | 1.25% | 0.50% | 0.04% | 0.63% | 0.19% |
Table 2.
Operating condition settings for EG#1.
| NO. | Area (m2) | Ratio | Size (m × m) | NO. | Area (m2) | Ratio | Size (m × m) | NO. | Area (m2) | Ratio | Size (m × m) |
|---|---|---|---|---|---|---|---|---|---|---|---|
| 1-1 | 0.09 | 1:1 | 0.300 × 0.300 | 2-1 | 0.36 | 1:1 | 0.600 × 0.600 | 3-1 | 1.44 | 1:1 | 1.200 × 1.200 |
| 1-2 | 1:2 | 0.215 × 0.420 | 2-2 | 1:2 | 0.420 × 0.840 | 3-2 | 1:2 | 0.850 × 1.700 | |||
| 1-3 | 1:3 | 0.173 × 0.519 | 2-3 | 1:3 | 0.350 × 1.050 | 3-3 | 1:3 | 0.695 × 2.080 | |||
| 1-4 | 1:4 | 0.150 × 0.600 | 2-4 | 1:4 | 0.300 × 1.200 | 3-4 | 1:4 | 0.600 × 2.400 | |||
| 1-5 | 2:1 | 0.420 × 0.215 | 2-5 | 2:1 | 0.840 × 0.420 | 3-5 | 2:1 | 0.170 × 0.850 | |||
| 1-6 | 3:1 | 0.519 × 0.173 | 2-6 | 3:1 | 1.050 × 0.350 | 3-6 | 3:1 | 2.080 × 0.695 | |||
| 1-7 | 4:1 | 0.600 × 0.150 | 2-7 | 4:1 | 1.200 × 0.300 | 3-7 | 4:1 | 2.400 × 0.600 | |||
| Solid angle: 0.04/0.01 sr * | Solid angle: 0.15/0.04 sr | Solid angle: 0.55/0.15 sr | |||||||||
Notes: * denote the solid angles at viewing distances of 1.5 and 3.0 m, respectively.
Table 3.
Operating condition settings for EG#2.
| Viewing Distance | AA | C | UVF | RUVF | RVF | RLVF | LVF | |
|---|---|---|---|---|---|---|---|---|
| EA | — | 0° a | 45° | 90° | 135° | 180° | ||
| 1.5 m | 1: 22° | (0, 0) b | (0, 22) | (22, 22) | (22, 0) | (22, −22) | (0, −22) | |
| 2: 39° | — | (0, 39) | (9, 39) | (39, 0) | (39, −39) | (0, −39) | ||
| 3.0 m | 1: 11° | (0, 0) | (0, 11) | (11, 11) | (11, 0) | (11, −11) | (0, −11) | |
| 2: 22° | — | (0, 22) | (22, 22) | (22, 0) | (22, −22) | (0, −22) | ||
Notes: a. It is specified that the AA right above C be 0° increases clockwise progressively; b. is the angular coordinates of the geometrical center of VSLS, specified to be positive where the geometrical center deflects from RVF and UVF of C and negative where it is located in LVF.
Table 4.
Boyce’s glare evaluation scale.
| Category | 1 | 2 | 3 | 4 | 5 | 6 | 7 |
|---|---|---|---|---|---|---|---|
| Name | Imperceptible | Just perceptible | Noticeable | Just uncomfortable | Uncomfortable | Just intolerable | Intolerable |
Table 5.
Correlation analysis results.
| Subjective Evaluation | CRPD | SA | Mean SS | BF | |||
|---|---|---|---|---|---|---|---|
| EG#1 | Luminance | Coefficient of correlation | 0.919 ** | 0.703 ** | −0.119 * | −0.079 | 0.107 |
| Significance | <0.001 | <0.001 | 0.033 | 0.214 | 0.091 | ||
| Subjective evaluation | Coefficient of correlation | 1 | 0.874 ** | 0.135 * | 0.059 | −0.030 | |
| Significance | - | <0.001 | 0.033 | 0.349 | 0.639 | ||
| EG#2 | Luminance | Coefficient of correlation | 0.920 ** | 0.407 ** | −0.336 ** | −0.091 | −0.041 |
| Significance | <0.001 | <0.001 | <0.001 | 0.346 | 0.672 | ||
| Subjective evaluation | Coefficient of correlation | 1 | 0.414 ** | −0.430 ** | −0.094 | −0.040 | |
| Significance | - | <0.001 | <0.001 | 0.329 | 0.676 | ||
Notes: ** and * indicate the correlation is significant at the 0.01 and 0.05 levels, respectively.
Table 6.
BCD luminance calculation results for different light source forms.
| NO. | Area (m2)/Length-to-Width Ratio | BCD Luminance (cd/m2) | |
|---|---|---|---|
| Viewing Distance = 1.5 m | Viewing Distance = 3.0 m | ||
| 1-1 | 0.09/1:1 | 181.89 | 177.96 |
| 1-2 | 0.09/1:2 | 218.82 | 219.14 |
| 1-3 | 0.09/1:3 | 175.25 | 185.32 |
| 1-4 | 0.09/1:4 | 149.78 | 216.27 |
| 1-5 | 0.09/2:1 | 239.64 | 224.36 |
| 1-6 | 0.09/3:1 | 175.72 | 223.03 |
| 1-7 | 0.09/4:1 | 157.25 | 194.63 |
| 2-1 | 0.36/1:1 | 146.36 | 134.70 |
| 2-2 | 0.36/1:2 | 106.92 | 123.94 |
| 2-3 | 0.36/1:3 | 115.16 | 130.90 |
| 2-4 | 0.36/1:4 | 136.48 | 115.08 |
| 2-5 | 0.36/2:1 | 135.37 | 160.00 |
| 2-6 | 0.36/3:1 | 123.94 | 148.19 |
| 2-7 | 0.36/4:1 | 133.34 | 148.51 |
| 3-1 | 1.44/1:1 | 94.88 | 100.28 |
| 3-2 | 1.44/1:2 | 76.20 | 93.61 |
| 3-3 | 1.44/1:3 | 82.94 | 83.84 |
| 3-4 | 1.44/1:4 | 88.11 | 88.76 |
| 3-5 | 1.44/2:1 | 89.85 | 101.39 |
| 3-6 | 1.44/3:1 | 74.38 | 86.06 |
| 3-7 | 1.44/4:1 | 80.00 | 83.56 |
Table 7.
Correlation analysis results.
| Viewing Distance | Area | Length-to-Width Ratio | ||
|---|---|---|---|---|
| BCD luminance | Coefficient of correlation | 0.128 | −0.843 ** | −0.029 |
| Significance | 0.420 | <0.001 | 0.857 | |
Note: ** indicates the correlation is significant at the 0.01 level.
Table 8.
Results of paired t-test for BCD luminance.
| BCD Luminance—Viewing Distance: 1.5 m | BCD Luminance—Viewing Distance: 1.5 m | ||||
|---|---|---|---|---|---|
| t | p | t | p | ||
| S1 0.09 m2 | 1:2-2:1 | −0.326 | 0.751 | 0.581 | 0.574 |
| 1:3-3:1 | 0.716 | 0.491 | −0.124 | 0.904 | |
| 1:4-4:1 | −0.953 | 0.363 | −0.417 | 0.686 | |
| S2 0.36 m2 | 1:2-2:1 | −1.698 | 0.103 | −1.663 | 0.110 |
| 1:3-3:1 | 0.093 | 0.926 | −1.245 | 0.226 | |
| 1:4-4:1 | 0.037 | 0.971 | −2.397 | 0.025 ** | |
| S3 1.44 m2 | 1:2-2:1 | −2.081 | 0.049 ** | −0.530 | 0.601 |
| 1:3-3:1 | 0.602 | 0.553 | −0.215 | 0.832 | |
| 1:4-4:1 | 0.286 | 0.778 | 1.791 | 0.087 | |
Note: ** indicates the correlation is significant at the 0.01 level.
Table 9.
BCD luminance calculation results at different positions.
| Operating Condition NO. | VSLS Position | BCD Luminance (cd/m2) | Ratio of BCD Luminance at Light Source Position to That at Central Position | ||
|---|---|---|---|---|---|
| Viewing Distance = 1.5 m | Viewing Distance = 3.0 m | Viewing Distance = 1.5 m | Viewing Distance = 3.0 m | ||
| 1 | C | 106.50 | 118.53 | 1.00 | 1.00 |
| 2 | UVF-1 | 108.05 | 138.70 | 1.01 | 1.17 |
| 3 | UVF-2 | 231.34 | 233.30 | 2.17 | 1.97 |
| 4 | LVF-1 | 85.97 | 87.77 | 0.81 | 0.74 |
| 5 | LVF-2 | 73.68 | 84.86 | 0.69 | 0.72 |
| 6 | RVF-1 | 93.01 | 99.36 | 0.87 | 0.84 |
| 7 | RVF-2 | 164.30 | 207.73 | 1.54 | 1.75 |
| 8 | RUVF-1 | 114.87 | 134.19 | 1.08 | 1.13 |
| 9 | RUVF-2 | 208.86 | 206.46 | 1.96 | 1.74 |
| 10 | RLVF-1 | 66.80 | 82.69 | 0.63 | 0.70 |
| 11 | RLVF-2 | 137.18 | 108.46 | 1.29 | 0.92 |
Table 10.
Comparison between measured BCD luminance and theoretical BCD luminance.
| Viewing Distance 1: BCD Luminance (cd/m2) | Viewing Distance 2: BCD Luminance (cd/m2) | |||
|---|---|---|---|---|
| Measured | Theoretical | Measured | Theoretical | |
| C | 106.50 | 106.50 | 118.53 | 118.53 |
| UVF-1 | 108.05 | 250.28 | 138.70 | 181.35 |
| UVF-2 | 231.34 | 532.50 | 233.30 | 278.54 |
| RVF-1 | 93.01 | 140.58 | 99.36 | 132.75 |
| RVF-2 | 164.30 | 193.83 | 207.73 | 156.50 |
Table 11.
Correlation analysis results.
| EA | AA | View Distance | ||
|---|---|---|---|---|
| BCD luminance | Coefficient of correlation | 0.703 ** | −0.653 ** | 0.107 |
| Significance | <0.001 | <0.001 | 0.6423 | |
Note: ** indicates the correlation is significant at the 0.01 level.
Disclaimer/Publisher’s Note: The statements, opinions and data contained in all publications are solely those of the individual author(s) and contributor(s) and not of MDPI and/or the editor(s). MDPI and/or the editor(s) disclaim responsibility for any injury to people or property resulting from any ideas, methods, instructions or products referred to in the content. |
© 2024 by the authors. Licensee MDPI, Basel, Switzerland. This article is an open access article distributed under the terms and conditions of the Creative Commons Attribution (CC BY) license (https://creativecommons.org/licenses/by/4.0/).
Share and Cite
MDPI and ACS Style
Kong, G.; Wang, L.; Chen, P.; Wang, S.; Ma, F. Morphological and Position Factors of Vertical Surface Light Source Affecting Discomfort Glare Perception. Buildings 2024, 14, 1227. https://doi.org/10.3390/buildings14051227
AMA Style
Kong G, Wang L, Chen P, Wang S, Ma F. Morphological and Position Factors of Vertical Surface Light Source Affecting Discomfort Glare Perception. Buildings. 2024; 14(5):1227. https://doi.org/10.3390/buildings14051227
Chicago/Turabian StyleKong, Guangyan, Lixiong Wang, Peng Chen, Shuo Wang, and Fengrui Ma. 2024. "Morphological and Position Factors of Vertical Surface Light Source Affecting Discomfort Glare Perception" Buildings 14, no. 5: 1227. https://doi.org/10.3390/buildings14051227
Note that from the first issue of 2016, this journal uses article numbers instead of page numbers. See further details here.