
Barriers to Older Adults Adapting Smart Homes: Perceived Risk Scale Development
1
Academy of Arts & Design, Tsinghua University, Beijing 100084, China
2
School of Design, Kyushu University, Fukuoka 8158540, Japan
3
School of Art, RMIT University, Melbourne, VIC 3001, Australia
*
Author to whom correspondence should be addressed.
Buildings 2024, 14(5), 1226; https://doi.org/10.3390/buildings14051226
Submission received: 5 February 2024
/
Revised: 8 April 2024
/
Accepted: 23 April 2024
/
Published: 25 April 2024
(This article belongs to the Special Issue Indoor Environment Quality: Smart Technology in Thermal Comfort, Ventilation, Humidity, Hygiene, Lighting, Acoustics and Water Supply)
Abstract
:The 21st century has marked the dawn of an aging population. China’s aging process ranks first worldwide. The country has recognized the gravity of this demographic shift and implemented strategies to address it at the national level. A vast majority of elderly Chinese individuals (approximately 90%) aspire to age in their own homes. Smart homes, endowed with cutting-edge digital technologies, such as AI, the Internet of Things, and big data, hold vast potential for enabling this vision. However, acceptance of smart home products and services among elderly individuals in China remains low. The main reason is that the related products and services fail to effectively alleviate the perceived risk of this population in the R&D process of related products and services, and there is a lack of effective measurement methods. To holistically assess the potential obstacles faced by elderly individuals using smart home products and services, this study targeted individuals aged 45–60 years in China. This study aimed to develop a comprehensive perceived risk scale specific to smart homes for this demographic. Initially, this study identified key risk dimensions and corresponding measurement items through a rigorous literature review, user interviews, and expert consultations. Subsequently, it ensured the reliability and validity of each dimension and its corresponding observation variables through preliminary research, exploratory factor analysis, and confirmatory factor analysis. This approach allowed for a comprehensive understanding of the challenges faced by future elderly individuals when utilizing smart home products and services, thus enabling the development of more effective solutions. The scale encompassed ten factors and seventy measurement items, including Privacy and Security Risk (seven items), Physical Risk (seven items), Technological Risk (nine items), Performance Risk (seven items), Service Risk (nine items), Financial Risk (five items), Psychological Risk (seven items), Industry and Market Risk (six items), Social Support Risk (six items), and Policy and Legal risk (seven items). The measurement scale developed in this study represents a groundbreaking first attempt to create a systematic scale for assessing the perceived risks associated with smart homes for the elderly in China. It not only enables professionals, businesses, and manufacturers to avoid or reduce barriers in the R&D process of related products and services, facilitating smart home industry growth and enhancing user adoption, but also serves as a universal reference for the potential obstacles that digital technology may encounter in addressing aging-related issues, which has significant theoretical value and practical importance.
1. Introduction
The 21st century is a century of aging populations [1]. According to reports from the World Health Organization (WTO), the size and proportion of the elderly population are growing in every country in the world. In 2022, the global population aged 65 and above surged to 771 million, representing nearly 10% of the world’s total inhabitants. By 2030, one out of every six individuals worldwide will be 60 years or older. Concurrently, the number of individuals aged 60 and over will climb from 1 billion in 2020 to 1.4 billion in 2030. By 2050, this demographic will comprise 16% of the world’s population, rising to a staggering 24% by 2100. The response to this problem of the aging population is related to the overall development of various countries, the well-being of billions of people, human civilization, and social progress. China ranks first in the world in terms of an aging society [2]. According to data from the National Bureau of Statistics, the elderly population in China in 2023 will be approximately 270 million. It is expected that by 2050, the total elderly population will exceed 400 million and the aging level will reach over 30%. Elderly people aged 80 years and above account for 21.78% of the elderly population. From 2051 to 2100, we will enter a stable stage of severe aging. By 2051, the elderly population in China will reach a peak of 437 million. The large number of elderly people imposes a heavy burden on Chinese society [3]. According to a survey, 90% of elderly people in China hope to age at home as they become older [4]. However, as age increases and physical and social functions decline, it becomes difficult to ensure independence and safety in daily life and activities for the elderly in traditional home environments [5]. Smart homes, also known as home automation, are platforms that utilize comprehensive cabling, network communication, security prevention, automatic control, and audio and video technologies to integrate facilities related to home life [6]. They aim to establish an efficient management system for residential facilities and household schedule affairs, enhancing home safety, convenience, comfort, and artistry while achieving an environmentally friendly and energy-saving living environment [7]. In essence, a smart home is a technological system that integrates the management of various devices in the home, providing automation and intelligence [8]. Smart home systems equipped with sensors and advanced digital technologies such as artificial intelligence, the Internet of Things, and big data have significant potential for assisting elderly individuals aging in place [9]. However, the acceptance of smart home products and services among the elderly in China is generally low [10]. The fundamental reason for this is the failure of related products and services to effectively mitigate the perceived risks among this demographic during the development process coupled with a lack of effective measurement methods. This study aimed to develop a forward-looking smart home perceived risk scale specifically tailored to the elderly in China. Its objective was to assess the potential obstacles that they may encounter while utilizing smart home products and services comprehensively and systematically. By doing so, we constructed a scale that can assist designers, developers, and researchers in related industries to identify, address, and mitigate the risks perceived by the elderly during the product and service R&D phase. The target object of this study was the future elderly aged 45–60 in China, driven by three key reasons. Firstly, the development and maturation of digital technology, as well as the marketing and cultivation of user groups, require time. Secondly, individuals aged 45–60 in China possess more practical experience with Internet technology compared to those over 60, resulting in a higher acceptance of smart technologies. Thirdly, the aging of society is a process with a strong temporal attribute, and China’s most severe aging period is anticipated to occur in the middle of this century. Therefore, developing a smart home perceived risk scale for this prospective elderly population holds significant economic value and societal importance. Given that smart homes encompass a comprehensive intelligent living environment system and subsystems related to food, clothing, housing, transportation, medical care, and entertainment, the perceived risk scale developed in this study holds universal relevance for the application of digital technology among the elderly population. The scale developed in this study possesses strong theoretical and practical value, offering insights that can be widely referenced and applied.
The remainder of this paper is structured as follows. Section 2 introduces the research methods. Section 3 defines the concept and dimensions of the perceived risk of smart homes for older adults. In Section 4, we first analyze 2110 articles from authoritative databases, including the Web of Science, Scopus, and IEEE Xplore. After scanning the titles, abstracts, and full-text content, we narrowed the pool to 64 core articles. Keywords related to perceived risk were extracted from these articles. Next, we conducted user interviews to compile a preliminary measurement project library for perceived risk. Subsequently, expert interviews were conducted to analyze the rationality of all projects, refine project expressions, and refine the relevant content. Optimized measurement projects were then used to develop the questionnaires. Finally, we conducted preliminary research to ensure that the questions and answers were meaningful. In Section 5, we first present a final questionnaire on the perceived risks of smart homes for the elderly that we developed based on the analysis results of previous research. The questionnaire was modified and adjusted to ensure accuracy and reliability. The final questionnaire was used for the main survey, encompassing both data collection and analysis. For the first round of data analysis, we conducted exploratory factor analysis using SPSS 25.0. This analysis helped us to extract the factors and test the effectiveness of their factor loadings. For the second round of data, we conducted confirmatory factor analysis using AMOS 25.0. Based on the data analysis results, we optimized the measurement items of the corresponding factors until all model-fitting indicators met the standard threshold. Finally, we determined the constituent factors and measurement items that satisfied the threshold values for all model-fitting indicators, resulting in the final scale. Section 6 summarizes our findings and discusses the implications of our research.
2. Research Method
This study followed the standard scale development and validation process [11,12,13]. The main research methods included literature review, expert interviews, user interviews, questionnaire surveys, and statistical analysis methods. The research steps were as follows: First, through literature research and user interviews, a preliminary pool of measurement items of perceived risk was formed. Second, an expert interview was conducted to analyze the rationality of all items, the item expressions were optimized, and the relevant contents were refined. Third, a questionnaire was formulated using the optimized measurement items and a pre-study was conducted to ensure that the questions and answers were meaningful. Fourth, the final questionnaire on the perceived risk of smart homes for the elderly was developed after modification and adjustment according to the analysis results of the pre-study. Fifth, the final questionnaire was used to conduct the main investigation, which included data collection and analysis of the two rounds. The first-round data were used for exploratory factor analysis; SPSS 25.0 was applied to extract factors and test the validity of relevant factor loading. Second-round data were used for confirmatory factor analysis using AMOS 25.0. According to the data analysis results, the measurement items of the corresponding factors were optimized until all model fit indices reached the standard threshold. Finally, the constituent factors and measurement items that satisfied all model fit index thresholds were output to form the final scale.
3. Defining the Perceived Risk of Smart Homes for Older Adults
Perceived risk refers to the probability estimated by customers at the time of purchase that a product will not meet their expectations [14]. Bauer first proposed the concept of perceived risk in 1960 [15]. He pointed out that perceived risk includes two connotations: the uncertainty probability of the result and the severity of the consequences if a decision is wrong. In 1967, Bauer further pointed out that individual perceived risk and actual risk are completely different concepts. Perceived risk refers to an individual’s subjective judgment of the risk of things; actual risk is the objective risk obtained after rigorous scientific evaluation [16]. Cox defined perceived risk as a function of two factors. The first is that the individual estimates the probability that the purchase behavior may lead to adverse consequences before the purchase behavior occurs. The second is the degree of loss felt by the individual when adverse consequences occur after the purchase behavior [17]. Cunninghan continued to make further modifications to Cox’s function and tested it with empirical research, further typifying six dimensions: performance, financial, opportunity/time, safety, and social and psychological loss [18]. Jacoby and Kaplan divided individual shopping risks into five categories: social, health, psychological, performance, and financial [19]. Many studies have shown that an individual’s perceived risk variables are multidimensional. In summary, based on the results of various studies, perceived risk can be categorized into seven types: health, psychological, financial, social, performance, time, and privacy risks [20,21,22].
Considering the development status of China’s smart home industry and the physical and psychological characteristics of the elderly in China, this study expands the basis of perceived risk collected from the relevant literature and identifies the preliminary risk dimensions and their corresponding measurement items of smart homes for the elderly. The definition of each risk dimension is as follows:
- Privacy and Security risk: “Privacy and Security risk” refers to the non-autonomy, possible leakage, or abuse of users’ personal information and data due to system running or security issues in the process of monitoring user activities, health status, and home environments.
- Physical risk: “Physical risk” refers to the potential personal safety hazards and accidents caused by smart home systems. It is mainly reflected in possible theft or robbery, blackmail and extortion, incorrect or untimely feedback of emergency, invisible health problems caused by electromagnetic radiation, accidental injuries caused by equipment, physical materials, and shapes, etc.
- Technological risk: “Technological risk” refers to the risk of immaturity, instability, inflexibility, and incompatibility with smart home technology. This is mainly reflected in low accuracy in recognizing and conducting user commands, low system stability, system failures, false alarms, low expansion capability, incompatibility between different products and operating systems, and poor data management and treatment ability.
- Performance risk: “Performance risk” refers to the function design, appearance design, interaction design, user experience design, etc. of the smart home system and does not fully consider the actual needs, operating habits, life routines, and individual feelings of elderly users. It is mainly reflected in unitary and poor usability, obstruction or impediment of devices, aesthetic incongruence with the home environment, low accessibility and non-user-friendly operation, interference with daily activities, etc.
- Service risk: “Service risk” refers to smart home services that cannot meet the demands of the elderly and present low service quality. This is mainly reflected in low service reliability, no timely response, insufficient quality assurance, no consistency in commercial promise, and unprofessional and incompetent service staff.
- Financial risk: “Financial risk” refers to the pressure and uncertainty that users feel regarding financial costs during the processes of purchasing, using, and maintaining smart home products and services. It is mainly reflected in relevant products and services that are beyond the affordability of the elderly, non-essential financial expenditure, products and services that are low value for money, and so on.
- Psychological risk: “Psychological risk” refers to the pressure of external opinions and internal psychological barriers that users experience during the process of purchasing and using a smart home system. It is mainly reflected in blame and incomprehension of important persons, unhealthy reliance on automation technology and loss of autonomy, persistent reminders about self-frailty, and so on.
- Industry and Market risk: “Industry and market risk” refers to the risk of immature and irregular market and industry development of smart homes for the elderly. This is mainly reflected in low market penetration that is far from mass adoption, no consistency in industry standardization and regulation, no eligibility criteria for the quality of products and services, poor compatibility of different brands and products, etc.
- Social support risk: “Social support risk” mainly exists when the implementation of smart home products and systems requires relevant social resources and forces, such as family support, peer support, community support, neighborhood assistance, institutional assistance, telemedicine services, and emergency response; the lack of such support brings relevant social support risks.
- Policy and law risk: “Policy and law risk” refers to the government or relevant public departments and authorities that have not promulgated or issued effective policies and laws to regulate the smart home industry and provide guarantees for serving consumers. This is mainly reflected in the lack of a legal framework, standards, and guidance as well as an immature policy and law conduct and supervision environments.
4. Preliminary Works
4.1. Item Generation
To provide a convincing and systematic review of the risks and barriers of smart homes for the elderly. The author searched global mainstream literature databases, including Web of Science, Scopus, and IEEE Xplore with the keywords “smart home”, “older adult”, and “perception” and their synonyms. In total, 2110 articles were collected. The search results are shown in Table 1.
Among the 2110 articles, 852 duplicate articles were deleted, 59 were deleted, and the remaining 1199 articles were screened by title, abstract, and full text. Finally, 64 articles were selected for the literature review. From existing articles, we refined and summarized keywords for the perceived risk of smart homes for the elderly. After deleting and merging synonyms, as well as adding new keywords, the author obtained Table 2. The table shows the key components of the perceived risk of smart homes for the elderly, and synonyms are placed in brackets for similar components. Based on this, initial measurement items for each dimension were generated. The author randomly selected 15 future elderly people aged 45–60 and asked them about their understanding of the generated measurement items, as well as other possible risks that were not reflected or fully reflected in the existing variables and measurement items. According to their understanding and reflections, the language expression and content of each item were modified and optimized. New items and content were added. Through the literature review and user interviews, the item pool of the perceived risk of smart homes for the future elderly was formed.
4.2. Refinement and Item Reduction
The item pool formed for perceived risk through the literature review and user interviews contained 78 items. Among them, there were 8 items for Privacy and Security risk, 8 for Physical Risk, 12 for Technological Risk, 8 for Performance Risk, 10 for Service Risk, 5 for Financial Risk, 8 for Psychological Risk, 6 for Industry and Market risk, 10 for Social Support Risk, 6 for Policy and Law risk, and 80 in total. After acquiring the item pool, an expert interview was conducted to evaluate the rationality of each dimension and measurement item of perceived risk. Ten experts participated in this research, including four PhD candidates, three professors, and three employees engaged in the smart home industry. For the selection of experts, the criteria were that they had more than 3 years of research or work experience in a related field, had relatively high recognition for their work, and were still engaged in the work and research of the pension industry. We used remote interviews through Tencent Conference and ZOOM to ask experts to present their opinions on the rationality, suitability, and validity of each perceived risk dimension and relevant measurement items. Simultaneously, the expression and meaning delivery of each item were also emphasized. We invited each expert to perform one of the following six actions to each item, namely, “reserve”, “modify”, “merge”, “adjust”, “delete”, or “supplement”. First, “reserve” referred to whether the item should be included in the evaluation scale. Second, “modify” referred to whether the statement of the item was appropriate, and if not, how to revise it. Third, “merge” referred to whether the item overlapped with other items and needed to be merged. Fourth, “adjust” referred to whether an item needed to be changed to other dimensions. Fifthly, “delete” referred to whether the content of the item was inconsistent with its associated dimension and needed to be deleted. Sixth, “supplement” referred to whether there were any observation items of perceived risk that are of great importance but did not appear in the current scale. If there were, experts were asked to help supplement them. Based on their suggestions and advice, the author made modifications to all the items, considering keeping, adding, deleting, merging, revising, or making dimensional adjustments. The final items for perceived risk were 7 for Privacy and Security risk, 7 for Physical Risk, 10 for Technological Risk, 8 for Performance Risk, 9 for Service Risk, 5 for Financial Risk, 7 for Psychological Risk, 6 for Industry and Market risk, 10 for Social Support Risk, 6 for Policy and Law risk, and 76 in total. The detailed measurement items are listed in Table 3.
4.3. Questionnaire Design
After clarifying the dimensions of perceived risk and generating relevant measurement items, the author compiled a questionnaire that included all the generated items. The questionnaire consisted of two parts. The first part was the demographic information of the survey respondents, including age, gender, occupation, monthly income, and marital status; the second part was the perceived risk scale of smart homes for the future elderly. For the scale development and empirical research, the Likert scale is a widely utilized tool, encompassing three distinct variations: grade 5, grade 7, and grade 9. Given the substantial quantity of questions involved and the target population aged 45–60, we opted for the five-grade Likert scale to minimize the cognitive load on our subjects. All the questions were measured on a 5-point Likert scale, for which “1” was “strongly disagree”, “2” was “disagree”, “3” was “general”, “4” was “agree”, and “5” was “strongly agree”. Additionally, we prefixed each observed variable description with “When I am old” to assist our subjects in anticipatively entering the mindset of old age, thereby facilitating their consideration and evaluation of the relevant items.
4.4. Pre-Study
Before starting the large-scale investigation, a pre-study was conducted to check the consistency, clarity, and reliability of the questionnaire. The scale was formatted on a 5-point Likert scale, and 68 participants aged 45–60 were recruited through the online questionnaire platform “Wenjuanxing” in China for the pilot study. They came from different provinces, cities, and regions and their geographical affiliation was random. The tested results were generally representative of China. Depending on the data results, some confusing questions and long statements were modified accordingly. Accordingly, SPSS 25.0 was used to evaluate the consistency and reliability of the questionnaire. The Cronbach’s alpha of the pilot study was 0.897, which was greater than 7 and considered reliable.
5. Scale Development and Factor Analysis
This section attempts to identify the measurement items of the perceived value scale and examine the reliability and validity of different constructs and measurements. Specifically, all 76 items for perceived risk were gathered to form a questionnaire, and all items were measured on a 5-point Likert scale. Participants responded to each item on a scale from 1 = strongly disagree to 5 = strongly agree. SPSS25.0 and AMOS 25.0 for Windows were used to conduct statistical analysis, and exploratory factor analysis (EFA) and confirmatory factor analysis (CFA) were used to test the distinctive constructs and model fit indices of the theoretical structure.
5.1. Exploratory Factor Analysis
Exploratory factor analysis (EFA) was conducted to reduce dimensionality and explore the appropriate structure of the perceived risk scale.
5.1.1. Respondents
The author conducted an online questionnaire survey through Wenjuanxing, a famous Chinese questionnaire survey platform, to obtain data for exploratory factor analysis. The age of the participants was limited to 45–60 and 344 responses were collected. Specifically, 178 (51.7%) participants were male and 166 (48.3%) were female. Regarding age, 128 (37.2%) were between 45 and 50 years, 125 (36.3%) were between 51 and 55 years, and 91 (26.5%) were between 56 and 60 years. Education level, marital status, income, and occupation information were also clarified, as shown in Table 4.
5.1.2. Exploratory Factor Analysis of Perceived Risk
Principal axis factoring analysis with varimax orthogonal rotation was conducted. For the exploratory factor analysis of the perceived benefit scale, the results showed that the Kaiser–Meyer–Olkin (KMO) measure of sampling was 0.914 and the Bartlett’s test (Chi-square) value was 17,620.868 (p = 0.000), suggesting that it was suitable for factor analysis [56]. Each construct was examined and determined in terms of eigenvalues and scree plots. In terms of item selection for the eight factors, all items were singly loaded onto one factor with a coefficient greater than 0.50 [57]. The factor loadings with varimax rotation are presented in Table 5.
5.2. Confirmatory Factor Analysis
Based on the results of the exploratory factor analysis, a confirmatory factor analysis (CFA) was used to evaluate the perceived risk scale, which included 76 items.
5.2.1. Respondents
A similar data collection method using exploratory factor analysis was applied. The online questionnaire survey through Wenjuanxing was conducted with an age limitation of 45–60 years for the participants. In total, 590 responses were obtained. Specifically, 321 (54.5%) participants were male and 269 (45.6%) were female. Regarding age, 234 (39.7%) were between 45 and 50 years, 210 (35.6%) were between 51 and 55 years, and 146 (24.7%) were between 56 and 60 years. Education level, marital status, income, and occupation information was also clarified, as shown in Table 6.
5.2.2. Confirmatory Factor Analysis of Perceived Risk
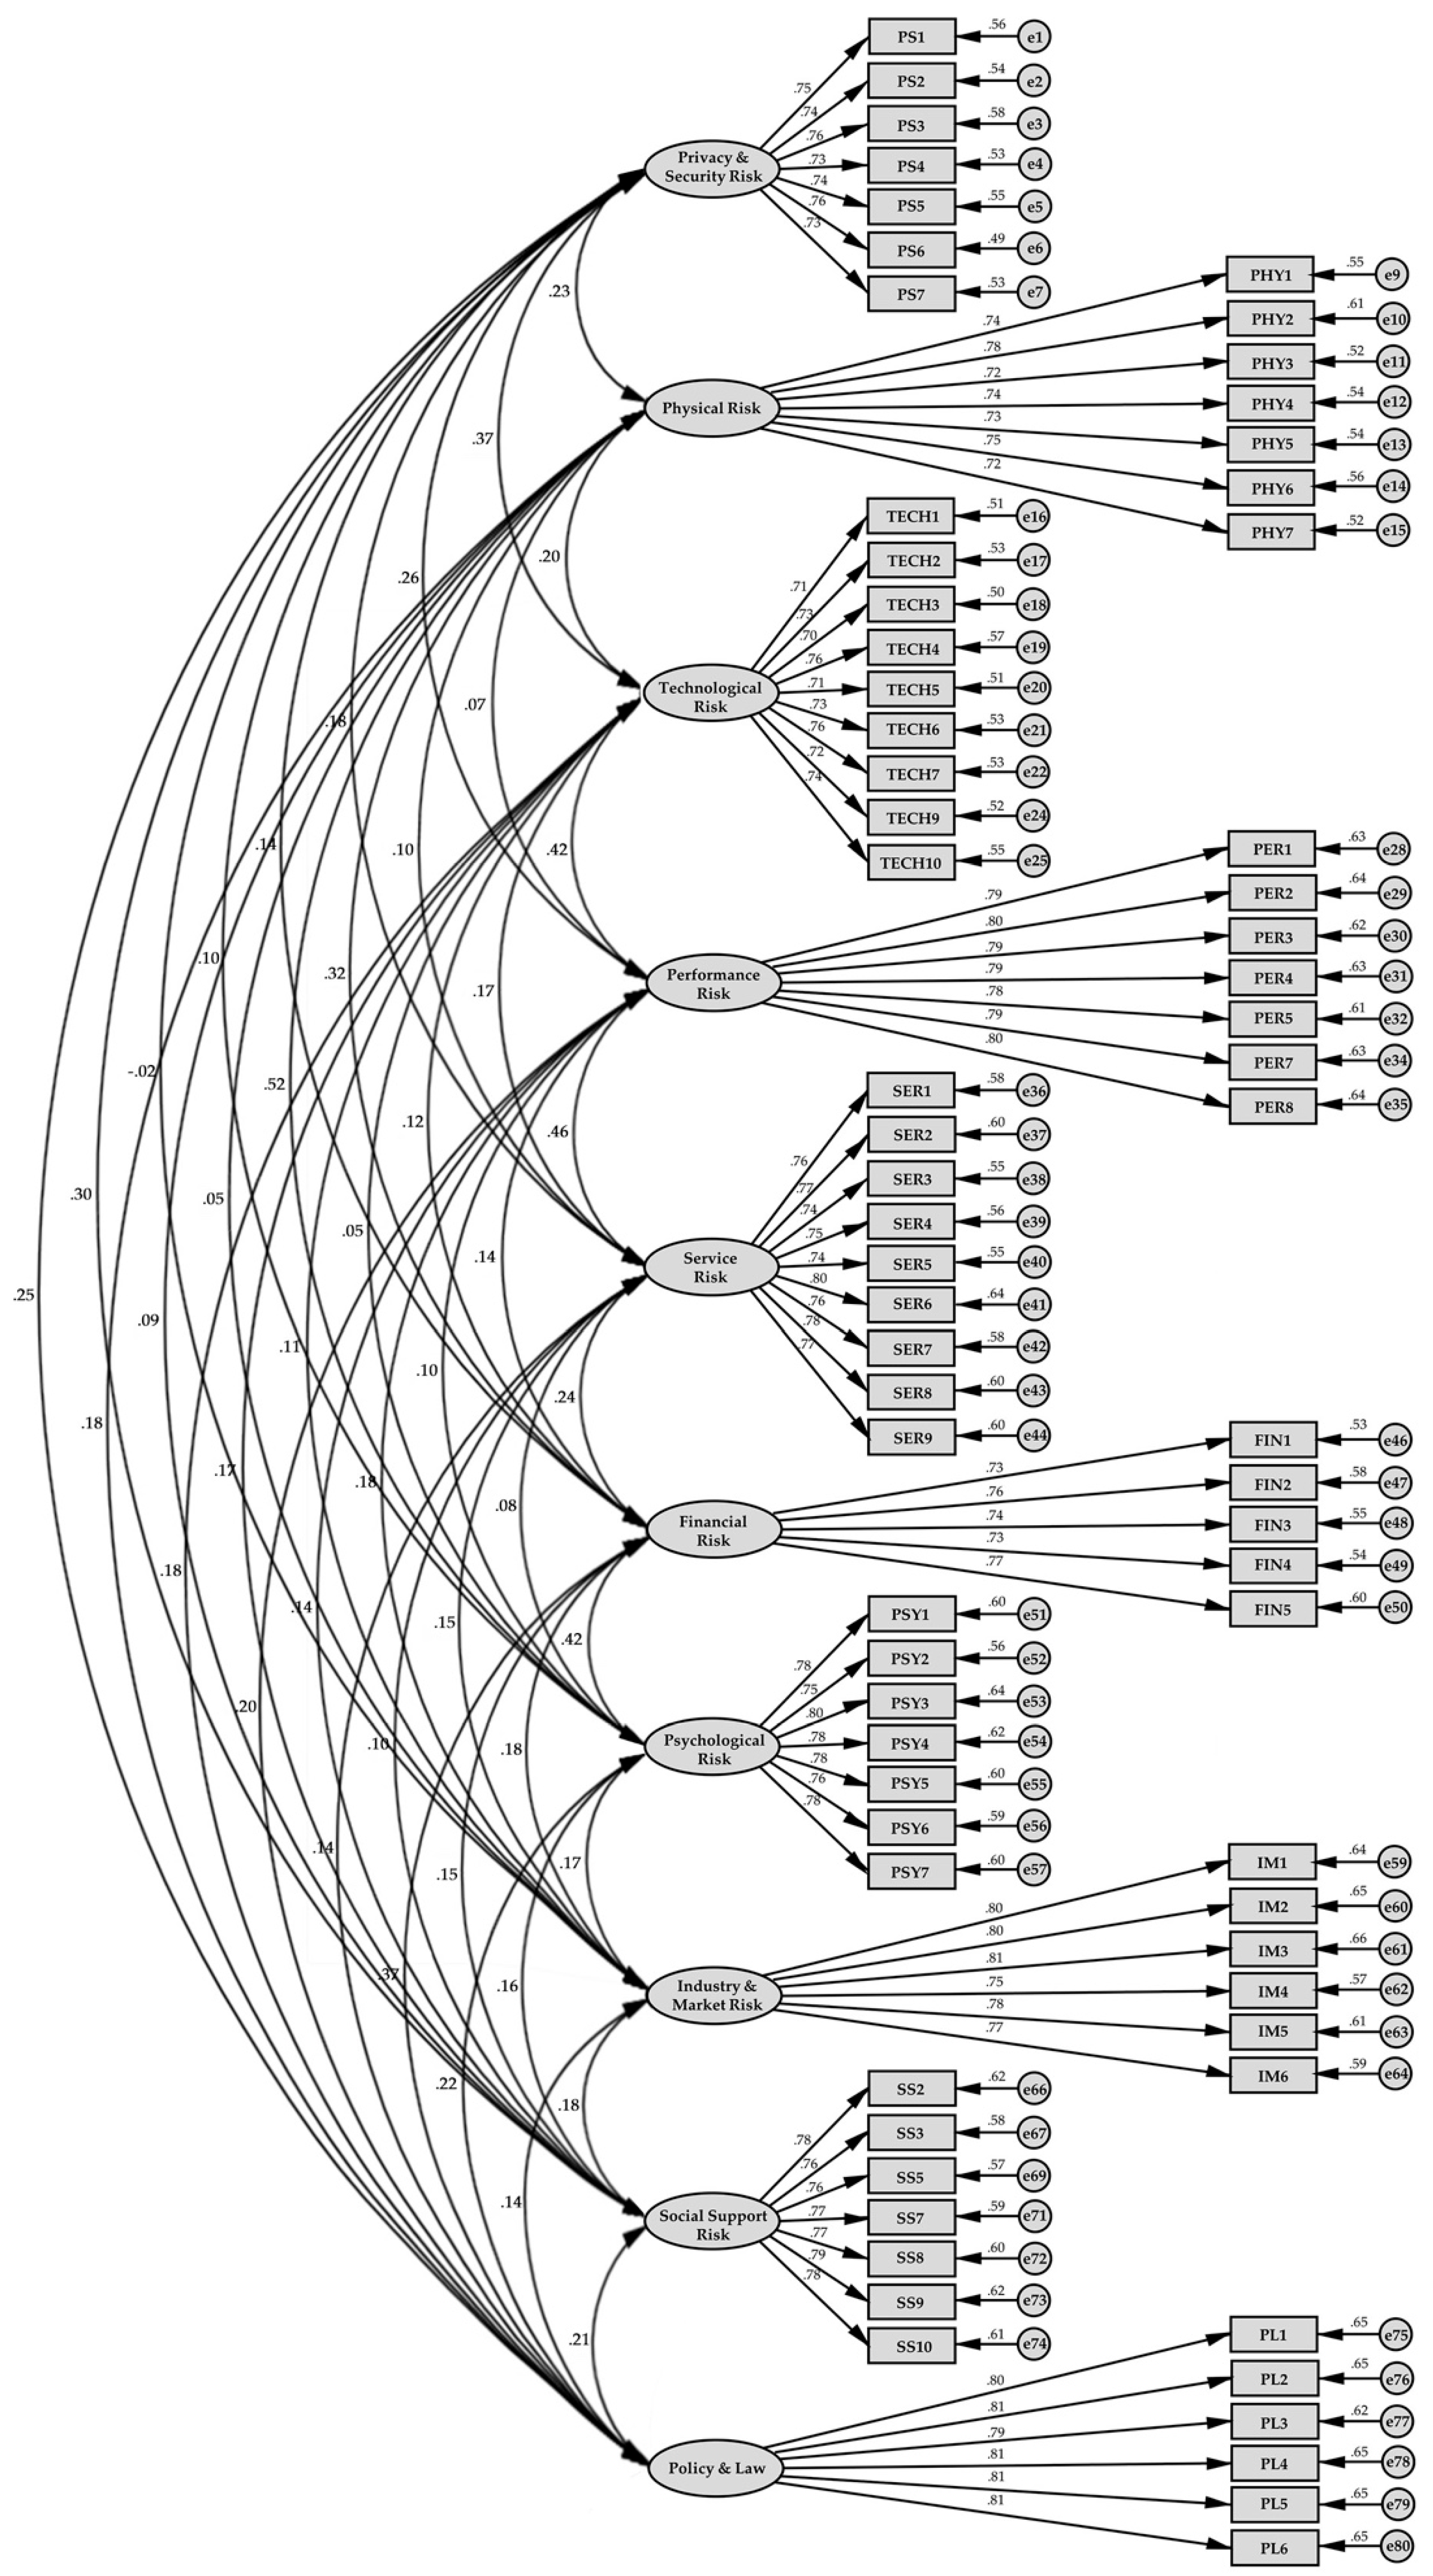
The results showed that the original model did not provide adequate model fit (X2 = 2777.023; p = 0.000; SRMR = 0.027; RMSEA = 0.005; CFI = 0.998; NFI = 0.902; IFI = 0.998; TLI = 0.998; GFI = 0.894). Following the suggestions of Woosnam and Norman, reasonable modifications were introduced based on correlated residuals and cross-loadings, producing a good model fit [58]. The first modified model contained 43 items, producing a better fit for the data (X2 = 2547.373; p = 0.000; SRMR = 0.027; RMSEA = 0.005; CFI = 0.999; NFI = 0.905; IFI = 0.999; TLI = 0.999; GFI = 0.898). However, the vital indices NFI and GFI still did not reach the threshold, so a second modification was conducted. The second modified model contained 38 items based on the first revision, and all the model fit index thresholds were reached (X2 = 2326.904; p = 2303; SRMR = 0.026; RMSEA = 0.004; CFI = 0.999; NFI = 0.908; IFI = 0.999; TLI = 0.999; GFI = 0.903). Table 7 presents the model fit indices of the original and revised models. Figure 1 shows the path diagram of the second model modification of the perceived risk scale of smart homes for the elderly.
5.3. Convergent and Discriminant Validity
Confirmatory factor analysis was conducted to determine the convergent and discriminant validity of the perceived risk scale. For convergent validity, the standardized factor loadings needed to be above the threshold of 0.5 or above; C.R. (t-value) needed to be above the threshold of 2 or above; and the averaged variances expected (AVE) value needed to also be above the threshold of 0.5 or above [59]. Table 8 shows that the C.R. (t-value), standardized factor loadings, and AVE achieved adequate values.
The correlation coefficients, maximum shared variance (MSV), and average shared variance (ASV) were used to assess discriminant validity. The threshold for the MSV and ASV values needed to be less than the AVE value [59]. The results in Table 9 show that, in the current study, all AVE values were above the MSV and ASV values, suggesting that the four constructs achieved satisfactory discriminant validity.
6. Discussion
This research conducted a comprehensive scale development and validation study to assess the perceived risks of smart homes for older adults. The variables and corresponding measurement items proposed in this study were validated through questionnaire surveys and data analysis. Below, we provide a detailed discussion of each perceived risk factor and the content of the observed variables that were included and validated:
- Privacy and Security Risk: For “Privacy and Security Risk”, the final observed variables included seven items. On the one hand, the elderly did not like the sense of surveillance brought about by smart homes and sharing their personal lives and privacy with others, even their family members. For example, some seniors may not want to share their sensitive health information with their important persons, such as couples or children, to avoid increasing unnecessary worries; on the other hand, for platforms, service providers, work staff, and related stakeholders of elderly service enterprises, “What kind of extent should the data and personal information be opened to them to support the implementation of related system functions and services as well as avoiding the sense of privacy invasion” is a topic of significant concern. Moreover, the elderly also worry about their personal information and privacy data being exposed to unauthorized third parties without permission or stolen by hackers for illegal purposes. Thus, smart homes for the elderly should emphasize the protection of their privacy and security, give them sufficient autonomy and control over their personal information and data, and try to find a balance between protecting their privacy and providing them with high-quality services.
- Physical Risk: For “Physical Risk”, the final observed variables included seven items. Because the personal information and daily life data of the elderly can be collected by a sensor system while using smart homes, there may be some hidden risk of fraud, theft, robbery, blackmail, and extortion due to information leakage. In addition, with the increase in age, the physical ability of the elderly will go through an obvious decline. Thus, the physical materials of smart home devices or equipment may cause physical harm to the elderly, such as being too sharp or hard or the surface friction being too small. For example, if the friction of the bathroom floor is too low, this may cause a fall. Moreover, some accidental injuries may occur owing to the execution of incorrect commands and incorrect or untimely feedback from the system. Finally, electromagnetic radiation from a smart system may lead to potential health problems. Therefore, data security should receive specific attention during its usage. Simultaneously, the material and physical form of smart home devices should also cater to the physical and psychological characteristics of the elderly, such as rounded corners and anti-skid treatment. System reliability should be optimized to ensure the accuracy of information delivery and command transmission, and timely responsiveness should also be guaranteed. Finally, related technologies should be rigorously tested before they are applied in many applications to avoid potential health harm to the elderly.
- Technological Risk: For “Technological Risk”, the final observed variables included nine items. They mainly included low accuracy in command identification, malfunction, system failures, error alarms, instability, low expansion capability, lack of interoperability among different devices and heterogeneous systems, inflexibility, low intelligence, inability to customize services for users, and insufficient data processing and management capabilities (collection of records, storage, treatment, compression, delivery). For smart home systems, technology is the basis for the development of relevant intelligent products and services that deserve long-term emphasis. Advancements in technology can solve a number of existing problems, such as improving the accuracy of command identification and execution, reducing system failures and errors, and improving compatibility between different products and operating systems. For individual customized services, smart recommendations and active behavioral responses can also be realized via deep learning and data training of a large amount of user behavior data.
- Performance Risk: For “Performance Risk”, the final observed variables included seven items. Current smart development attaches importance to “intelligence” and “high-tech”, which are mostly aimed at young groups, and there is a lack of concern for meeting the physical, psychological, and cognitive needs of the elderly from a user-centered perspective. In addition, it does not fully consider the operating habits of the elderly and ignores their characteristics, which makes it difficult for the elderly to operate and results in low accessibility. Therefore, the design and development of related products and services should take the core demands of the elderly as the starting point and improve usability and ease of use according to the features of the elderly. Moreover, many smart home devices are aesthetically incongruent, cannot be integrated into the house environment of the elderly, and obstruct or impede space, making seniors feel uncomfortable at home. Therefore, the hardware and software design of smart home products should consider these issues. Finally, while some smart home products bring comfort and convenience to the elderly, they may also affect and disrupt their normal life routines. In view of this, designers and developers should start from the functions, appearance, materials, operation, and software of related smart home products and services and consider the characteristics of the elderly in all aspects to minimize the corresponding risks and optimize user experience.
- Service Risk: For “Service Risk”, the final observed variables included nine items. They were unreliability, lack of timely response, lack of service guarantee, inconsistent business promises from service providers, incompetent service staff, and inability to provide customized services according to different individual needs. As we can see, the service risk sources were not only non-human factors, such as system stability, but also service deliverers. If service deliverers have bad manners, have low neatness and cleanliness standards, are unable to understand elders’ specific needs, and have low empathy, there is no possibility that the service quality will be at a high level. In response to these issues, smart home services for the elderly should integrate the special physical and psychological needs of the elderly and comprehensively improve the reliability, responsiveness, security, and professionalism of humans and non-humans to deliver high-quality services.
- Financial Risk: For “Financial Risk”, the final observed variables included five items. This was mainly reflected in the purchase of related smart home products and services exceeding the elderly’s affordability or making them feel that the value benefits they receive are not worth the high prices, the use of some products and services requiring continuous payment, and unnecessary expenses that may bring financial pressure. Based on these problems, the design and development of smart home products and services for the elderly should try to reduce development and production costs as much as possible to meet the affordability of the majority of the aging group and provide the elderly with value beyond their expectations. At the same time, we should also consider maximizing the use of the existing or easily acquired resources of the elderly to reduce their financial expenditure, such as selling sensors and controllers to make the non-smart products in the home environment intelligent and using existing smart devices (phone, tablet, laptop, TV, etc.) as service carriers instead of developing new media and products.
- Psychological Risk: For “Psychological Risk”, the final observed variables included seven items. Older people are more psychologically sensitive than youths. When using smart home products and services, they worry about family members’ blame, care about friends’ opinions, and consider burdening co-living people. At the same time, the elderly are afraid of being treated as old. For example, some products have strong psychological hints of aging in appearance, which makes the elderly feel disappointed all the time and hurts their self-esteem. On the one hand, the powerful functions of smart products give people a sense of spiritual oppression. This kind of oppression is even more serious for older adults compared to young adults and makes them psychologically produce pessimistic and negative resistance. On the other hand, powerful functions may also cause the elderly to over-rely on intelligent technology, which may passively reduce their interpersonal communication and cause social isolation. These issues need to be considered seriously in the design and development of smart home products for the elderly.
- Industry and Market Risk: For “Industry and Market Risk”, the final observed variables included six items. It was mainly reflected in smart homes for the elderly currently lacking a comprehensive market environment, existing smart products and services for the elderly being incomplete, no consistent industry standardization and regulation making the compatibility between products and systems of different brands poor, service quality lacking a unified qualification standard certification, and a shortage of service personnel in the relevant elderly care service industry. These problems reflect the immaturity of the smart home market for the elderly population. In response to these problems, it is necessary to set up an industry organization to propose unified standards and rules for products, services, technologies, and talent qualification certification in related industries; improve the product and system compatibility of different brands; and promote the construction of an overall service team in the industry.
- Social Support Risk: For “Social Support Risk”, the final observed variables included seven items. It referred to the implementation of products and system functions of smart homes that need to be supported by relevant social forces, such as family members (children and partners), relatives, neighbors, communities, social organizations, and institutions, as well as related service personnel groups, such as nurses, clinical staff, and medical experts. The lack of support or relevant service personnel will create risks and obstacles to the realization of the relevant functions of the smart home system for the elderly. Therefore, a smart home system providing a full sense of happiness to the elderly requires a strong social support network, which makes the construction of this social support network of crucial significance.
- Policy and Law Risk: For “Policy and Law Risk”, the final observed variables included six items. It referred to the government or relevant authorities that have not promulgated and issued relevant policies and laws to regulate the development of the smart home industry, improve service quality, or provide legal guarantees for consumers’ rights. It mainly included the lack of policy and law formulation, implementation, interpretation, and supervision. When consumers’ rights are violated due to negligence, defects, and non-professionalism of the smart home system and its service providers, there is no relevant law to provide guarantees and assistance. Therefore, to guide and regulate the market, improve the service level of service personnel, and provide consumers with assurances of rights and interests, the formulation, promulgation, and implementation of government policies and related laws are urgently needed.
7. Conclusions
To comprehensively assess the perceived risks of smart homes for the future elderly, this research developed a measurement scale focused on individuals aged 45–60 in China who are at the forefront of aging. Through a literature review, user interviews, and expert consultations, this study identified key perceived risk dimensions and corresponding measurement items for smart homes. Furthermore, preliminary research, exploratory factor analysis, and confirmatory factor analysis were conducted to evaluate the reliability and validity of each dimension and its corresponding observational variables. The resulting scale comprised 10 factors and 70 measurement items, including Privacy and Security Risk (seven items), Physical Risk (seven items), Technological Risk (nine items), Performance Risk (seven items), Service Risk (nine items), Financial Risk (five items), Psychological Risk (seven items), Industry and Market Risk (six items), Social Support Risk (six items), and Policy and Law Risk (seven items). In summary, the widespread adoption of smart home systems holds immense importance in serving the elderly, enabling them to enjoy home-based care, and mitigating the gravity of aging-related social issues. The measurement scale developed in this study represents a groundbreaking first attempt to create a systematic scale for assessing the perceived risks associated with smart homes for the elderly in China. This scale offers immense value to industry professionals, businesses, and manufacturers as it enables them to identify and address potential risks and obstacles in a user-centered manner. This approach allows for the avoidance or reduction of barriers during the research and development process, thereby facilitating the growth of the smart home industry, catering to the elderly, and enhancing users’ willingness to adopt and utilize relevant products and services. In the future, we aim to delve deeper into several key aspects of our research. Firstly, our focus is on the specific population aged 45–60 in China. Given that elderly individuals from diverse regions, cultures, socio-economic backgrounds, and technological proficiency levels may have vastly different risk perceptions, our current findings may have limited applicability to other demographic groups. Therefore, we plan to conduct comparative analyses across regions or countries to understand how cultural differences affect perceived risk. Secondly, our current research predominantly targets middle-aged and elderly urbanites who are proficient in internet usage. However, we intend to broaden our sample to include those residing in urban suburbs and remote rural areas to explore the potential of smart home systems in helping them age in place. Thirdly, we are exploring collaborations with enterprises specializing in smart home products and services. Our goal is to jointly develop forward-thinking aging product service systems, thereby enhancing the industrial value of our theoretical advancements. Fourthly, there are certain perceived risk variables, such as policy and legal risks, that play a pivotal role in the development, application, promotion, and popularization of smart homes for the elderly. These are worthy of further study and discussion in the future. Overall, our research conclusions, processes, and methodologies will serve as a robust reference for the implementation of smart homes in aging societies. Additionally, they hold extensive significance for future explorations and investigations in this domain.
Author Contributions
Conceptualization, methodology, software, validation, formal analysis, investigation, resources, data curation, writing—original draft preparation, visualization, project administration, funding acquisition, Y.L.; writing—original draft preparation, L.X.; writing—review and editing, supervision, R.T. All authors have read and agreed to the published version of the manuscript.
Funding
This research was funded by the China Postdoctoral Science Foundation (grant number: 2023M742017).
Data Availability Statement
The data presented in this study are available on request from the corresponding author on reasonable request. The data are not publicly available due to privacy policies.
Acknowledgments
The present work should acknowledge the China Postdoctoral Science Foundation for funding support. We would like to express our special gratitude to Kyushu University in Japan for providing academic guidance and support during the research process.
Conflicts of Interest
The authors declare no conflicts of interest.
References
- Harper, S. Ageing 2000—Questions for the 21st Century. Ageing Soc. 2000, 20, 111–122. [Google Scholar] [CrossRef]
- Feng, W.; Mason, A. Population Aging in China: Challenges, Opportunities, and Institutions. In Population in China at the Beginning of the 21st Century; Citeseer: Philadelphia, PA, USA, 2007; pp. 177–196. [Google Scholar]
- Banister, J.; Bloom, D.E.; Rosenberg, L. Population Aging and Economic Growth in China. In The Chinese Economy: A New Transition; Springer: Berlin/Heidelberg, Germany, 2012; pp. 114–149. [Google Scholar]
- Liu, J.-E.; Tian, J.-Y.; Yue, P.; Wang, Y.-L.; Du, X.-P.; Chen, S.-Q. Living Experience and Care Needs of Chinese Empty-Nest Elderly People in Urban Communities in Beijing, China: A Qualitative Study. Int. J. Nurs. Sci. 2015, 2, 15–22. [Google Scholar] [CrossRef]
- Demiris, G.; Hensel, B.K.; Skubic, M.; Rantz, M. Senior Residents’ Perceived Need of and Preferences for “Smart Home” Sensor Technologies. Int. J. Technol. Assess. Health Care 2008, 24, 120–124. [Google Scholar] [CrossRef]
- Alam, M.R.; Reaz, M.B.I.; Ali, M.A.M. A Review of Smart Homes—Past, Present, and Future. IEEE Trans. Syst. Man Cybern. C (Appl. Rev.) 2012, 42, 1190–1203. [Google Scholar] [CrossRef]
- Yi, H. Research on Interior Design of Smart Home. In Proceedings of the Frontier Computing: Theory, Technologies and Applications (FC 2018), Kuala Lumpur, Malaysia, 3–6 July 2018; Springer: Berlin/Heidelberg, Germany, 2019; Volume 7, pp. 1793–1800. [Google Scholar]
- Chan, M.; Estève, D.; Escriba, C.; Campo, E. A Review of Smart Homes—Present State and Future Challenges. Comput. Methods Programs Biomed. 2008, 91, 55–81. [Google Scholar] [CrossRef]
- Morris, M.; Adair, B.; Miller, K.; Ozanne, E.; Hansen, R.; Pearce, A.; Santamaria, N.; Viega, L.; Long, M.; Said, C. Smart-Home Technologies to Assist Older People to Live Well at Home. J. Aging Sci. 2013, 1, 101. [Google Scholar] [CrossRef]
- Pal, D.; Papasratorn, B.; Chutimaskul, W.; Funilkul, S. Embracing the Smart-Home Revolution in Asia by the Elderly: An End-User Negative Perception Modeling. IEEE Access 2019, 7, 38535–38549. [Google Scholar] [CrossRef]
- Churchill, G.A., Jr. A Paradigm for Developing Better Measures of Marketing Constructs. J. Mark. Res. 1979, 16, 64–73. [Google Scholar] [CrossRef]
- DeVellis, R.F.; Thorpe, C.T. Scale Development: Theory and Applications; Sage: Thousand Oaks, CA, USA, 2021; ISBN 1544379358. [Google Scholar]
- Gerbing, D.W.; Anderson, J.C. An Updated Paradigm for Scale Development Incorporating Unidimensionality and Its Assessment. J. Mark. Res. 1988, 25, 186–192. [Google Scholar] [CrossRef]
- Mitchell, V. Consumer Perceived Risk: Conceptualisations and Models. Eur. J. Mark. 1999, 33, 163–195. [Google Scholar] [CrossRef]
- Bauer, R.A. Consumer Behavior as Risk Taking. In Proceedings of the 43rd National Conference of the American Marketing Assocation, Chicago, IL, USA, 15–17 June 1960; American Marketing Association: Chicago, IL, USA, 1960. [Google Scholar]
- Smith, D.; Riethmuller, P. Consumer Concerns about Food Safety in Australia and Japan. Int. J. Soc. Econ. 1999, 26, 724–742. [Google Scholar] [CrossRef]
- Engel, J.F. Risk Taking and Information Handling in Consumer Behavior. J. Mark. 1968, 32, 111. [Google Scholar]
- Featherman, M.S.; Pavlou, P.A. Predicting E-Services Adoption: A Perceived Risk Facets Perspective. Int. J. Hum. Comput. Stud. 2003, 59, 451–474. [Google Scholar] [CrossRef]
- Jacoby, J.; Kaplan, L.B. The Components of Perceived Risk. Proc. Annu. Conf. Assoc. Consum. Res. 1972, 10, 382–393. [Google Scholar]
- Mitchell, V.; Harris, G. The Importance of Consumers’ Perceived Risk in Retail Strategy. Eur. J. Mark. 2005, 39, 821–837. [Google Scholar] [CrossRef]
- Cunningham, L.F.; Gerlach, J.H.; Harper, M.D.; Young, C.E. Perceived Risk and the Consumer Buying Process: Internet Airline Reservations. Int. J. Serv. Ind. Manag. 2005, 16, 357–372. [Google Scholar] [CrossRef]
- Ching Biu Tse, A. Factors Affecting Consumer Perceptions on Product Safety. Eur. J. Mark. 1999, 33, 911–925. [Google Scholar] [CrossRef]
- Kudzai, M.; Cilliers, L. Mitigating the Elderly’s Privacy Concerns When Making Use of Mobile Monitoring and Care Systems. In Proceedings of the 2016 IST-Africa Week Conference, Durban, South Africa, 11–13 May 2016; IEEE: New York, NY, USA, 2016; pp. 1–9. [Google Scholar]
- Zhang, Q.; Li, M.Y.; Wu, Y.J. Smart Home for Elderly Care: Development and Challenges in China. BMC Geriatr. 2020, 20, 318. [Google Scholar] [CrossRef] [PubMed]
- Peeka, S.T.M.; Aartsa, S.; Woutersa, E.J.M. Can Smart Home Technology Deliver on the Promise of Independent Living? In Handbook of Smart Homes, Health Care and Well-Being; Springer International Publishing: Cham, Switzerland, 2015. [Google Scholar]
- Dewsbury, G.; Clarke, K.; Rouncefield, M.; Sommerville, I.; Taylor, B.; Edge, M. Designing Acceptable ‘Smart’Home Technology to Support People in the Home. Technol. Disabil. 2003, 15, 191–199. [Google Scholar] [CrossRef]
- Taiwo, O.; Gabralla, L.A.; Ezugwu, A.E. Smart Home Automation: Taxonomy, Composition, Challenges and Future Direction. In Proceedings of the Computational Science and Its Applications—ICCSA 2020, Cagliari, Italy, 1–4 July 2020; Part VI. Volume 12254, pp. 878–894. [Google Scholar]
- Lê, Q.; Nguyen, H.B.; Barnett, T. Smart Homes for Older People: Positive Aging in a Digital World. Future Internet 2012, 4, 607–617. [Google Scholar] [CrossRef]
- Wilkowska, W.; Ziefle, M. User Diversity as a Challenge for the Integration of Medical Technology into Future Smart Home Environments. In User-Driven Healthcare: Concepts, Methodologies, Tools, and Applications; IGI Global: Hershey, PA, USA, 2013; pp. 553–582. [Google Scholar]
- Ghorayeb, A.; Comber, R.; Gooberman-Hill, R. Older Adults’ Perspectives of Smart Home Technology: Are We Developing the Technology That Older People Want? Int. J. Hum. Comput. Stud. 2021, 147, 102571. [Google Scholar] [CrossRef]
- Satpathy, L.; Mathew, A.P. “Smart” Housing for the Elderly: Understanding Perceptions and Biases of Rural America. In Proceedings of the 2007 Annual Conference of the Association for Computer Aided Design in Architecture (ACADIA); Dalhousie University School of Architecture and NSCAD University: Princeton, NJ, USA, 2007; pp. 1–11. [Google Scholar]
- Kirchbuchner, F.; Grosse-Puppendahl, T.; Hastall, M.R.; Distler, M.; Kuijper, A. Ambient Intelligence from Senior Citizens’ Perspectives: Understanding Privacy Concerns, Technology Acceptance, and Expectations. In Proceedings of the 12th European Conference, AmI 2015, Athens, Greece, 11–13 November 2015; Volume 9425, pp. 48–59. [Google Scholar]
- Zimmermann, V.; Gerber, P.; Marky, K.; Böck, L.; Kirchbuchner, F. Assessing Users’ Privacy and Security Concerns of Smart Home Technologies. I-COM 2019, 18, 197–216. [Google Scholar] [CrossRef]
- Coughlin, J.F.; D’Ambrosio, L.A.; Reimer, B.; Pratt, M.R. Older Adult Perceptions of Smart Home Technologies: Implications for Research, Policy & Market Innovations in Healthcare. In Proceedings of the 2007 29th Annual International Conference of the IEEE Engineering in Medicine and Biology Society, Lyon, France, 22 October 2007; IEEE: New York, NY, USA, 2007; pp. 1810–1815. [Google Scholar]
- Zwierenberg, E.; Finnema, E.; Dijkstra, A.; Hagencloor, M.; Sanderman, R. Diffusion of Assistive Technology among Older People: A Case of the House of the Present. Gerontechnology 2017, 16, 227–233. [Google Scholar] [CrossRef]
- Grace, S.L.; Taherzadeh, G.; Chang, I.S.J.; Boger, J.; Arcelus, A.; Mak, S.; Chessex, C.; Mihailidis, A. Perceptions of Seniors with Heart Failure Regarding Autonomous Zero-Effort Monitoring of Physiological Parameters in the Smart-Home Environment. Heart Lung 2017, 46, 313–319. [Google Scholar] [CrossRef] [PubMed]
- Offermann-van Heek, J.; Ziefle, M. Nothing Else Matters! Trade-Offs Between Perceived Benefits and Barriers of AAL Technology Usage. Front. Public Health 2019, 7, 463758. [Google Scholar] [CrossRef] [PubMed]
- Singh, D.; Psychoula, I.; Kropf, J.; Hanke, S.; Holzinger, A. Users’ Perceptions and Attitudes towards Smart Home Technologies. In Proceedings of the Smart Homes and Health Telematics, Designing a Better Future: Urban Assisted Living: 16th International Conference, ICOST 2018, Singapore, 10–12 July 2018; Proceedings 16. Springer: Berlin/Heidelberg, Germany, 2018; pp. 203–214. [Google Scholar]
- Liu, N.; Purao, S.; Tan, H.-P. Value-Inspired Service Design in Elderly Home-Monitoring Systems. In Proceedings of the 2016 IEEE International Conference on Pervasive Computing and Communication Workshops (PerCom Workshops), Sydney, NSW, Australia, 14–18 March 2016; IEEE: New York, NY, USA, 2016; pp. 1–6. [Google Scholar]
- Schroeter, C.; Mueller, S.; Volkhardt, M.; Einhorn, E.; Huijnen, C.; van den Heuvel, H.; van Berlo, A.; Bley, A.; Gross, H.M. Realization and User Evaluation of a Companion Robot for People with Mild Cognitive Impairments. In Proceedings of the 2013 IEEE International Conference on Robotics and Automation, Karlsruhe, Germany, 6–10 May 2013; IEEE: New York, NY, USA, 2013; pp. 1153–1159. [Google Scholar]
- Stefanov, D.H.; Bien, Z.; Bang, W.-C. The Smart House for Older Persons and Persons with Physical Disabilities: Structure, Technology Arrangements, and Perspectives. IEEE Trans. Neural Syst. Rehabil. Eng. 2004, 12, 228–250. [Google Scholar] [CrossRef] [PubMed]
- Jusob, F.R.; George, C.; Mapp, G. Exploring the Need for a Suitable Privacy Framework for MHealth When Managing Chronic Diseases. J. Reliab. Intell. Environ. 2017, 3, 243–256. [Google Scholar] [CrossRef]
- Hensel, B.K.; Demiris, G.; Courtney, K.L. Defining Obtrusiveness in Home Telehealth Technologies: A Conceptual Framework. J. Am. Med. Inform. Assoc. 2006, 13, 428–431. [Google Scholar] [CrossRef]
- Majumder, S.; Aghayi, E.; Noferesti, M.; Memarzadeh-Tehran, H.; Mondal, T.; Pang, Z.; Deen, M.J. Smart Homes for Elderly Healthcare-Recent Advances and Research Challenges. Sensors 2017, 17, 2496. [Google Scholar] [CrossRef]
- Ding, D.; Cooper, R.A.; Pasquina, P.F.; Fici-Pasquina, L. Sensor Technology for Smart Homes. Maturitas 2011, 69, 131–136. [Google Scholar] [CrossRef]
- Sánchez, V.G.; Taylor, I.; Bing-Jonsson, P.C. Ethics of Smart House Welfare Technology for Older Adults: A Systematic Literature Review. Int. J. Technol. Assess. Health Care 2017, 33, 691–699. [Google Scholar] [CrossRef] [PubMed]
- Pal, D.; Triyason, T.; Funilkul, S. IEEE Smart Homes and Quality of Life for the Elderly: A Systematic Review. In Proceedings of the 2017 IEEE International Symposium on Multimedia (ISM), Taichung, Taiwan, 11–13 December 2017; pp. 413–419. [Google Scholar]
- Bouma, H.; Rialle, V.; Duchene, F.; Noury, N.; Bajolle, L.; Demongeot, J.; Fisk, M.J.; Harper, R.; Charness, N.; Scaie, K.W. Technologies for an Aging Society: A Systematic Review of “Smart Home” Applications. Yearb. Med. Inform. 2008, 17, 33–40. [Google Scholar]
- Mittelstadt, B. Ethics of the Health-Related Internet of Things: A Narrative Review. Ethics Inf. Technol. 2017, 19, 157–175. [Google Scholar] [CrossRef]
- Marikyan, D.; Papagiannidis, S.; Alamanos, E. A Systematic Review of the Smart Home Literature: A User Perspective. Technol. Forecast. Soc. Chang. 2019, 138, 139–154. [Google Scholar] [CrossRef]
- Peruzzini, M.; Germani, M. Design of a Service-Oriented Architecture for AAL. Int. J. Agil. Syst. Manag. 2016, 9, 154–178. [Google Scholar] [CrossRef]
- Kowalski, J.; Jaskulska, A.; Skorupska, K.; Abramczuk, K.; Biele, C.; Kopeć, W.; Marasek, K. Older Adults and Voice Interaction: A Pilot Study with Google Home. In Proceedings of the Extended Abstracts of the 2019 CHI Conference on Human Factors in Computing Systems, Glasgow, UK, 4–9 May 2019; pp. 1–6. [Google Scholar]
- Etemad-Sajadi, R.; Dos Santos, G.G. The Impact of Connected Health Technologies on the Quality of Service Delivered by Home Care Companies: Focus on Trust and Social Presence. Health Mark. Q. 2021, 38, 287–296. [Google Scholar] [CrossRef] [PubMed]
- Lee, E.J.; Park, S.J. A Framework of Smart-Home Service for Elderly’s Biophilic Experience. Sustainability 2020, 12, 8572. [Google Scholar] [CrossRef]
- Astell, A.J.; McGrath, C.; Dove, E. “That’s for Old so and so’s!”: Does Identity Influence Older Adults’ Technology Adoption Decisions? Ageing Soc. 2020, 40, 1550–1576. [Google Scholar] [CrossRef]
- Tabachnick, B.G.; Fidell, L.S.; Ullman, J.B. Using Multivariate Statistics; Pearson: Boston, MA, USA, 2013; Volume 6. [Google Scholar]
- Gratz, K.L.; Roemer, L. Multidimensional Assessment of Emotion Regulation and Dysregulation: Development, Factor Structure, and Initial Validation of the Difficulties in Emotion Regulation Scale. J. Psychopathol. Behav. Assess. 2004, 26, 41–54. [Google Scholar] [CrossRef]
- Woosnam, K.M.; Norman, W.C. Scale Development and Factor Structure Confirmation of Constructs within Durkheim’s Theoretical Framework of Emotional Solidarity. Travel Tour. Res. Assoc. Adv. Tour. Res. Glob. 2016, 34. Available online: https://scholarworks.umass.edu/ttra/2009/Presented_Papers/34 (accessed on 2 April 2024).
- Fornell, C.; Larcker, D.F. Evaluating Structural Equation Models with Unobservable Variables and Measurement Error. J. Mark. Res. 1981, 18, 39–50. [Google Scholar] [CrossRef]
Figure 1.
The path diagram of the perceived risk scale.

Table 1.
Database, search terms, and hits.
| Database | Search Terms | Hits |
|---|---|---|
| Web of Science | (“smart home” OR “smart-home” OR “smart house” OR “remote house” OR “intelligent home” OR “intelligent house” OR “home automation system” OR “house automation system” OR “automated home” OR “automated house”) AND (“older adult” OR “Elderly” OR “senior” OR “elder” OR “older person” OR “older people” OR “aged” OR “aging” OR “middle-aged”) AND (“perception” OR “Adoption” OR “acceptance” OR “acceptability” OR “need” OR “demand” OR “requirement” OR “attitude” OR “behavior” OR “awareness” OR “willingness” OR “barrier” OR “difficulty” OR “assessment” OR “evaluation” OR “measurement” OR “measure”) | 473 |
| Scopus | 1354 | |
| IEEE Xplore | 283 |
Table 2.
Measurement item categories, keywords, and references.
| Perceived Risks | Statements | Source |
|---|---|---|
| Privacy and Security Risk (PS) | Surveillance (Feeling of surveillance, Continuous monitoring), Personal daily life activities (Person detection and tracking, Violation of personal space), Poor health status ignorance (Avoidance of shame), Data accessibility and invisibility (Access control, Accessibility of data, System visibility to others, Personal health information, Privacy of information/data, Access control, Anonymity, Invasion of personal information, Unauthorized access, Informed consent, Potential transfer of personal information to third parties without proper consent, Forwarding data to third parties), Data ownership (Disclosure risks, Encryption, Confidentiality, Ownership), Data misuse (Information misuse/abuse, Consent and uncertainty of H-IoT data), Loopholes, Data autonomy (Loss of autonomy, Loss control) | [8,23,24,25,26,27,28,29,30,31,32,33,34,35,36,37,38,39,40,41,42,43,44,45,46,47,48,49,50] |
| Physical Risk (PHY) | Theft, Robbery, Blackmail and extortion, Physical hurt, Wrong command for harm, No timely help, Unexpected health problems (Decontextualization of health and well-being, Becoming less physically active) | [8,31,32,33,35,39,44,46,47] |
| Technology Risk (TECH) | Low accuracy (Wrong command, False alarm, Technical failure, Accuracy and performance, Inaccurate measurement, Authentication), Fear of malfunction (Malfunction concerns), Inflexibility (Stubbornness, Modularity), Feasibility (Architecture issues, Pattern recognition issues, Perceived hassle factor, Restriction in distance or time away from home, Complexity assessment,), Low compatibility (Incompatibility of devices, Integration issues, Compatible devices, Lack of interoperability, Lack of interoperability among heterogeneous systems), Insufficient system reliability (Reliability, Lack of reliability in the sensor system, Loss connection, Sensor uncertainty management, Long-term reliability, Lack of continuous monitoring), Expansion capability, Stability (Robustness, General system stability, Risk of old-fashioned system), Lack of information to organize programs for the elderly (Continuous learning, Prediction, Recommendation and decision (AI-driven)), Data management (Volume of data collection, Recording and storage of data, Data handling capability and compression techniques, Real-time data analysis, Salient summary generation from large amounts of sensory data) | [8,24,26,27,28,30,33,34,36,37,38,39,40,43,44,45,46,51,52] |
| Performance Risk (PER) | Usability (Perception of lack of usefulness, Poor usability, Usefulness, Functional dependence, Fully functional and comprehensive smart home, Additional demands, Adjustment to changing needs, Concern about future needs and abilities), Intrusiveness (Obstruction or impediment in space), Inconspicuousness (Accommodate differences across individuals and households, Feelings of comfort with the design, Aesthetics, Aesthetic incongruence, Attractive design, Obtrusiveness), Accessibility (Subjective personalization issues, Difficulty of introducing technology into the lives of the elderly), Ease of use (Account for front-end interfaces for elderly people and back-end interfaces for younger stakeholders, Lack of user-friendliness or accessibility, Discomfort or strain, Excessive noise, Lack of general user involvement, Difficulties operating general technology currently used at home), Daily activities and routine disruption (Interference with daily activities, Disrupts daily routines, Acquisition of new rituals, Impact of information on lifestyle), | [8,26,27,28,29,31,32,33,34,36,43,44,45,46] |
| Service Risk (SER) | Reliability (Unreliable services), Responsiveness (Lack of human response, No timely response, Lack of human response in emergencies), No assurance, Inconsistent services, Unsuitable services and products (Non-professional care, Inappropriate care, Unsuitable services and products, Insufficient demand, Lack of perceived need, Comfortability, Gap between designers and service provider), Personalized service, Incompetence (Bad manners, Low neatness and cleanness, Empathy, Communication) | [24,26,30,49,53,54] |
| Financial Risk (FIN) | Affordability (Financial accessibility, Beyond affordability, High acquisition costs), Low value (Cost-effectiveness), Continuous money investment, Non-essential luxuries (Luxury market-oriented business models), Sustainability (Energy efficiency, Save money), Financial pressure | [24,26,27,28,30,32,33,34,35,36,37,38,41,43,44,45,46,47,48,49,50,51,52,55] |
| Psychological Risk (PSY) | Family blame (Couple, Children, Relatives), Friends’ opposition (Impact on relationships, Detrimental effects on relationships), Cause of embarrassment or stigma, Burden to others, Social isolation (Isolation, Social stigmatization, Social isolation due to an increased dependence on technology, Reduction in social relationships and interaction, Reduction in human contact, Threat to replace in-person visits), Over-reliance on technology (Fear of too much reliance, Increased dependence on technology, Replacing human care by technology), Autonomy (Loss of autonomy, Anxiety of being controlled, Lack of control over autonomously operating systems, Lose control of housekeeping, Personal autonomy, Stigma and autonomy), Reinforcing an image of being “old” (Hurt self-esteem, Dignity, Symbol of loss of independence), Resistance to using innovative technology (Exclusion, Mistrust, Uncertainty) | [25,28,30,32,33,35,36,37,38,43,45,46,47,48,49,50,52,55] |
| Industry and Market Risk (IM) | Absence of a comprehensive market (Immaturity, Disordered development, Constant assurance, Little maintenance), No consistency in standardization and regulation (Lack of standardization, Newest technical standard, Uncertainty with regulation conflicts between smart home service providers and users), Fast updates (Obsolescence), Eligibility criteria (Approved manufacturer’s label, Seal of quality, Lack of trust in the manufacturer or provider of the system), Low compatibility, Shortage of service labor | [24,29,33,34,36,47,48,50,51] |
| Social Support Risk (SS) | Healthcare providers, Caregivers (Increase dependency for caregivers, Degree to which smart homes lessen the sense of personal responsibility on the part of users or their caregivers must be weighed against associated benefits), Medical staff (Nurses, Clinicians), Medical experts (Increase dependence on outside experts), Family, Relatives, Friends, Neighborhood, Community, Organization and institution | [38,48,49] |
| Policy and Law Risk (PL) | Lack of policies and legal framework, Lack of policy and law conduct environment (Lack of comprehensive reimbursement policies), Lack of policy and law supervision environment, Lack of policy and law to provide right assurance, Lack of legal responsibilities and professional competence, Lack of legal aid | [34,46,50] |
Table 3.
Perceived risk scale items.
| Perceived Risk | Label | Items |
|---|---|---|
| Privacy and Security Risk (PS) | PS1 | I don’t like the feeling of surveillance. |
| PS2 | I don’t like to share my personal daily life activities with others. | |
| PS3 | I don’t like to share my sensitive personal health information (PHI) data with my important person. | |
| PS4 | I am worried about the ownership of my personal data and information. | |
| PS5 | I am worried that the service provider of smart homes will misuse my personal data and information without my permission. | |
| PS6 | I am worried about the unauthorized access to my personal data and information and for what purposed it is being used. | |
| PS7 | I am worried that the smart home system has loophole and might be attacked by hacker. | |
| PS8 | I feel I will lose the control and autonomy over my private space if I make use of smart homes. | |
| Physical Risk (PHY) | PHY1 | I am worried that using smart home will increase the risk for theft. |
| PHY2 | I am worried that using smart home will increase the risk for robbery. | |
| PHY3 | I am worried that using smart home will increase the risk for blackmail and extortion. | |
| PHY4 | I am worried that some devices or equipment may be lack of reliable physical quality and hurt me. | |
| PHY5 | I am worried that the smart home may provide me wrong information or conduct wrong command and bring harm to me. | |
| PHY6 | I am worried that when I encounter emergency problems the smart home could not provide timely response and help. | |
| PHY7 | I am worried that the usage and radiation of smart homes will bring unexpected health problems. | |
| Technology Risk (TECH) | TECH1 | I am worried that the smart home system could not identify or conduct my command accurately. |
| TECH2 | I am worried that the smart home may have malfunction or suboptimal performance. | |
| TECH3 | I am worried that the smart home may lack of reliability in the system. | |
| TECH4 | I am worried that the smart home will deliver wrong messages to related people or service stuffs. | |
| TECH5 | I am worried that the smart home devices and systems may have low expansion capability. | |
| TECH6 | I am worried that the smart home may lack of interoperability among different devices and heterogeneous systems. | |
| TECH7 | I am worried that the smart home technology update too fast and old-fashioned system may have low stability. | |
| TECH8 | I am worried that the smart home is inflexibility. | |
| TECH9 | I am worried that the smart home should conduct continuous machine learning and may lack of data to organize programmes for me. | |
| TECH10 | I am worried that the data management (record, storage, handle capability and compression) techniques are immature. | |
| TECH11 | I am worried that the smart home lack of continuous monitoring of the elderly people. | |
| TECH12 | I am worried that the smart home may give the false alarm. | |
| Performance Risk (PER) | PER1 | I am worried that the smart home function is too unitary and may have poor usability. |
| PER2 | I am worried that the smart home devices are obstruction or impediment in space and make me feel uncomfortable at home. | |
| PER3 | I am worried that the smart home devices are aesthetic incongruence which can not integrate with my house environment. | |
| PER4 | I am worried that the smart home devices and systems have low accessibility and are hard to use. | |
| PER5 | I am worried that the smart home interface and interaction is lack of user friendliness for elderly people. | |
| PER6 | I am worried that the smart home function could not meet my needs and demand as time goes by. | |
| PER7 | I am worried that the smart home has interference with my daily activities. | |
| PER8 | I am worried that the smart home may disrupt my daily routines. | |
| Service Risk (SER) | SER1 | I am worried that the smart home services are not reliable. |
| SER2 | I am worried that the smart home services could not give me timely response. | |
| SER3 | I am worried that the smart home services do not have assurance. | |
| SER4 | I am worried that the smart home services could not provide the consistency services according to their promise. | |
| SER5 | I am worried that the smart home services could not provide suitable and professional services. | |
| SER6 | I am worried that the smart home services could not provide personalized services I want. | |
| SER7 | I am worried that the smart home services stuff could not treat me in a good manner. | |
| SER8 | I am worried that the smart home services stuff is in low neatness and cleanness | |
| SER9 | I am worried that the smart home services stuff could not understand my specific needs. | |
| SER10 | I am worried that the smart home services stuff could not competent with their works | |
| Financial Risk (FIN) | FIN1 | I am worried that the cost of smart home products and services are beyond my affordability. |
| FIN2 | I am worried that the money I pay for smart home doesn’t deserve its value. | |
| FIN3 | I am worried that I will spend more money for its affordable services if I use smart home. | |
| FIN4 | I am worried that smart home may bring me some non-essential financial expenditure. | |
| FIN5 | I am worried that smart home may increase my financial pressure. | |
| Psychological Risk (PSY) | PSY1 | I am worried that my family will blame me on the usage of smart homes. |
| PSY2 | I am worried that my friends will think I am strange if I use smart homes. | |
| PSY3 | I am worried that smart home may cause of embarrassment or stigma when people visit my house. | |
| PSY4 | I am worried that smart home devices may be a burden to the people who live with me. | |
| PSY5 | I am worried that smart home may replace or diminish my human contact and result in social isolation. | |
| PSY6 | I am worried that the smart home will result in my reliance on automation technology and loss of autonomy. | |
| PSY7 | I am worried that the smart home devices will always be perceived as reinforcing an image of being ”old” for me. | |
| PSY8 | I am worried that the smart home devices will always give a persistent reminder of my frailty. | |
| Industry and Market Risk (IM) | IM1 | I am worried that there is an absence of a comprehensive market. |
| IM2 | I am worried that there is no consistency standardization and regulation of the smart home industry. | |
| IM3 | I am worried that the product update too fast and the products I brought would be obsolete soon. | |
| IM4 | I am worried that there is no eligibility criteria about the enterprises and service providers quality and level. | |
| IM5 | I am worried that the compatibility of different brand, system, device is bad. | |
| IM6 | I am worried that there is a shortage of service labor in related aging industry. | |
| Social Support Risk (SS) | SS1 | I am worried that if there is not enough support from healthcare providers. |
| SS2 | I am worried that there is not enough support from caregivers. | |
| SS3 | I am worried that there is not enough support from medical staffs. | |
| SS4 | I am worried that there is not enough support from medical experts. | |
| SS5 | I am worried that there is not enough support from my family. | |
| SS6 | I am worried that there is not enough support from my relatives. | |
| SS7 | I am worried that there is not enough support from my friends. | |
| SS8 | I am worried that there is not enough support from my neighborhood. | |
| SS9 | I am worried that there is not enough support from my community. | |
| SS10 | I am worried that there is not enough support from organization and institution. | |
| Policy and Law Risk (PL) | PL1 | I am worried that there is a lack of policy or legal framework to give the standards and guidance. |
| PL2 | I am worried that there is a lack of policy & law conduct environment. | |
| PL3 | I am worried that there is a lack of policy & law supervision environment. | |
| PL4 | I am worried that there is a lack of policy & law to provide right assurance. | |
| PL5 | I am worried that there is a lack of legal responsibilities and professional competence of service provider and caregivers. | |
| PL6 | I am worried that there is a lack of legal aid if some accidence happened due to the technology or service problems. |
Table 4.
Demographic information for exploratory factor analysis.
| Attribute | Value | Freq. | % | Attribute | Value | Freq. | % |
|---|---|---|---|---|---|---|---|
| Gender | Male | 178 | 51.7 | Monthly Income (RMB) | <1000 | 33 | 9.6 |
| Female | 166 | 48.3 | 1000–3000 | 88 | 25.6 | ||
| Age | 45–50 | 128 | 37.2 | 3000–5000 | 91 | 26.5 | |
| 51–55 | 125 | 36.3 | 5000–7000 | 86 | 25.0 | ||
| 56–60 | 91 | 26.5 | 7000–10,000 | 21 | 6.1 | ||
| Education | <High school | 131 | 38.0 | 10,000+ | 25 | 7.3 | |
| High school | 44 | 12.8 | Occupation | Teacher | 19 | 5.5 | |
| Associate | 63 | 18.3 | Civil servant | 17 | 4.9 | ||
| Bachelor | 64 | 18.6 | IT company staff | 16 | 4.7 | ||
| Master | 31 | 9.0 | Non-IT company staff | 108 | 31.4 | ||
| Doctor | 11 | 3.2 | Private entrepreneur | 19 | 5.5 | ||
| Marital status | Single | 50 | 14.5 | Freelancer | 21 | 6.1 | |
| Married | 254 | 73.8 | Worker | 86 | 25.0 | ||
| Divorced | 22 | 6.4 | Farmer | 22 | 6.4 | ||
| Widowed | 28 | 5.2 | Others | 36 | 10.4 |
Table 5.
Varimax rotation method for the perceived risk scale for ten factors.
| Items | Factor 1 | Factor 2 | Factor 3 | Factor 4 | Factor 5 | Factor 6 | Factor 7 | Factor 8 | Factor 9 | Factor 10 |
|---|---|---|---|---|---|---|---|---|---|---|
| SS8 | 0.834 | 0.017 | 0.045 | 0.040 | −0.001 | 0.022 | 0.017 | 0.061 | 0.016 | 0.081 |
| SS2 | 0.817 | 0.071 | 0.073 | 0.057 | 0.006 | 0.059 | −0.015 | 0.093 | 0.134 | 0.066 |
| SS7 | 0.792 | 0.065 | 0.021 | 0.079 | 0.065 | 0.049 | 0.044 | 0.112 | 0.163 | −0.022 |
| SS5 | 0.792 | 0.021 | 0.052 | −0.008 | 0.020 | 0.097 | 0.009 | 0.094 | 0.014 | 0.065 |
| SS9 | 0.792 | 0.004 | 0.135 | 0.036 | 0.002 | 0.048 | 0.028 | 0.038 | 0.112 | −0.032 |
| SS10 | 0.790 | 0.003 | 0.093 | −0.054 | 0.025 | 0.047 | 0.059 | 0.122 | 0.088 | 0.050 |
| SS1 | 0.784 | 0.044 | 0.117 | 0.015 | −0.068 | −0.021 | −0.005 | 0.076 | 0.021 | −0.002 |
| SS3 | 0.783 | −0.069 | 0.016 | 0.056 | −0.015 | 0.089 | 0.085 | 0.137 | 0.106 | 0.017 |
| SS4 | 0.775 | 0.001 | 0.083 | 0.011 | 0.053 | 0.021 | 0.062 | 0.115 | 0.093 | −0.043 |
| SS6 | 0.771 | 0.034 | 0.076 | 0.045 | 0.033 | −0.005 | −0.058 | 0.129 | 0.167 | 0.033 |
| SER6 | 0.024 | 0.812 | 0.069 | 0.144 | 0.037 | 0.029 | −0.032 | 0.088 | 0.096 | 0.053 |
| SER9 | 0.031 | 0.798 | 0.069 | 0.183 | 0.012 | 0.005 | 0.124 | 0.098 | 0.048 | 0.025 |
| SER2 | 0.031 | 0.791 | 0.090 | 0.154 | 0.049 | 0.019 | 0.096 | −0.019 | 0.039 | −0.003 |
| SER5 | −0.037 | 0.791 | 0.033 | 0.116 | 0.029 | −0.004 | 0.044 | 0.056 | 0.059 | 0.113 |
| SER8 | 0.037 | 0.789 | 0.117 | 0.177 | 0.017 | 0.027 | 0.025 | 0.025 | 0.050 | 0.008 |
| SER1 | 0.078 | 0.778 | 0.100 | 0.200 | −0.038 | 0.070 | −0.003 | 0.027 | −0.046 | 0.048 |
| SER7 | 0.045 | 0.772 | 0.036 | 0.186 | 0.097 | 0.007 | 0.071 | 0.066 | 0.025 | 0.030 |
| SER4 | −0.029 | 0.768 | 0.122 | 0.184 | −0.002 | −0.038 | 0.069 | 0.037 | 0.001 | 0.050 |
| SER3 | 0.009 | 0.748 | 0.090 | 0.158 | −0.020 | −0.032 | 0.000 | 0.030 | 0.051 | 0.129 |
| TECH10 | 0.103 | 0.089 | 0.780 | 0.066 | 0.047 | −0.005 | 0.085 | 0.046 | 0.011 | 0.097 |
| TECH7 | 0.037 | 0.052 | 0.768 | 0.120 | 0.125 | 0.000 | 0.026 | 0.138 | 0.035 | −0.013 |
| TECH6 | 0.038 | 0.053 | 0.750 | 0.206 | 0.040 | 0.045 | 0.055 | 0.067 | 0.038 | −0.044 |
| TECH2 | 0.108 | 0.084 | 0.749 | 0.042 | 0.073 | 0.016 | 0.028 | 0.107 | 0.058 | 0.021 |
| TECH4 | 0.060 | 0.104 | 0.733 | 0.204 | 0.049 | 0.025 | 0.071 | 0.113 | 0.081 | 0.072 |
| TECH8 | 0.057 | 0.130 | 0.729 | 0.132 | 0.073 | 0.000 | 0.061 | 0.133 | −0.028 | −0.002 |
| TECH1 | 0.080 | 0.065 | 0.718 | 0.188 | 0.064 | −0.068 | −0.017 | 0.149 | 0.017 | 0.084 |
| TECH9 | 0.086 | 0.010 | 0.717 | 0.268 | 0.103 | 0.033 | 0.029 | 0.094 | −0.023 | −0.046 |
| TECH3 | 0.057 | 0.084 | 0.716 | 0.133 | 0.092 | 0.087 | 0.040 | 0.099 | 0.007 | −0.065 |
| TECH5 | 0.114 | 0.079 | 0.694 | 0.114 | −0.024 | 0.038 | −0.009 | 0.173 | 0.091 | 0.070 |
| PER6 | −0.010 | 0.182 | 0.135 | 0.782 | 0.034 | −0.018 | −0.049 | 0.145 | 0.050 | −0.049 |
| PER8 | 0.064 | 0.235 | 0.207 | 0.771 | 0.025 | −0.070 | 0.082 | 0.001 | 0.066 | 0.030 |
| PER3 | 0.077 | 0.175 | 0.170 | 0.752 | 0.027 | 0.061 | 0.031 | 0.052 | 0.054 | 0.078 |
| PER4 | 0.057 | 0.254 | 0.174 | 0.748 | −0.002 | 0.019 | 0.024 | 0.057 | 0.117 | 0.001 |
| PER7 | −0.051 | 0.213 | 0.263 | 0.737 | 0.028 | 0.055 | 0.060 | 0.063 | 0.085 | −0.013 |
| PER1 | 0.084 | 0.211 | 0.221 | 0.719 | 0.037 | 0.112 | 0.045 | 0.073 | 0.111 | 0.005 |
| PER5 | 0.067 | 0.229 | 0.186 | 0.717 | 0.000 | 0.134 | 0.029 | 0.059 | 0.097 | 0.092 |
| PER2 | −0.009 | 0.288 | 0.260 | 0.678 | 0.081 | −0.001 | 0.050 | 0.024 | −0.012 | 0.121 |
| PHY2 | −0.023 | 0.029 | 0.039 | 0.029 | 0.767 | 0.162 | 0.083 | 0.051 | −0.060 | 0.159 |
| PHY1 | −0.022 | −0.023 | 0.093 | 0.010 | 0.764 | 0.176 | 0.003 | 0.063 | −0.011 | 0.073 |
| PHY7 | 0.033 | −0.050 | 0.149 | 0.003 | 0.751 | 0.157 | −0.055 | 0.118 | 0.031 | 0.076 |
| PHY6 | −0.044 | 0.103 | 0.047 | −0.046 | 0.747 | 0.208 | 0.107 | 0.025 | 0.025 | 0.052 |
| PHY8 | 0.037 | 0.029 | 0.053 | 0.081 | 0.741 | 0.117 | 0.125 | −0.010 | 0.046 | −0.015 |
| PHY4 | 0.002 | −0.021 | 0.005 | 0.023 | 0.716 | 0.236 | 0.060 | 0.028 | −0.021 | 0.109 |
| PHY3 | 0.069 | 0.039 | 0.074 | 0.037 | 0.708 | 0.217 | 0.015 | 0.021 | 0.037 | 0.132 |
| PHY5 | 0.042 | 0.086 | 0.183 | 0.063 | 0.679 | 0.275 | 0.009 | 0.005 | −0.004 | 0.114 |
| PSY3 | 0.045 | 0.010 | 0.031 | 0.050 | 0.211 | 0.809 | 0.085 | 0.007 | −0.012 | 0.141 |
| PSY4 | 0.053 | 0.059 | 0.044 | 0.050 | 0.192 | 0.786 | 0.118 | 0.038 | −0.034 | 0.154 |
| PSY6 | 0.038 | −0.030 | 0.034 | 0.026 | 0.196 | 0.785 | 0.114 | 0.015 | 0.005 | 0.163 |
| PSY7 | 0.061 | 0.000 | −0.069 | 0.007 | 0.293 | 0.758 | 0.060 | 0.038 | 0.068 | 0.118 |
| PSY1 | 0.046 | −0.001 | 0.029 | 0.047 | 0.294 | 0.756 | 0.118 | 0.094 | 0.059 | 0.142 |
| PSY5 | 0.103 | 0.000 | −0.006 | 0.086 | 0.243 | 0.748 | 0.170 | 0.004 | 0.073 | 0.128 |
| PSY2 | 0.079 | 0.025 | 0.086 | 0.000 | 0.279 | 0.745 | 0.037 | 0.002 | 0.090 | 0.101 |
| PL5 | 0.046 | 0.061 | 0.030 | 0.050 | 0.164 | 0.090 | 0.828 | 0.008 | 0.024 | 0.130 |
| PL6 | 0.018 | 0.082 | 0.081 | 0.032 | 0.069 | 0.108 | 0.828 | 0.002 | 0.049 | 0.091 |
| PL4 | 0.035 | 0.062 | 0.026 | 0.040 | −0.001 | 0.088 | 0.819 | 0.074 | 0.059 | 0.144 |
| PL3 | 0.067 | 0.038 | 0.001 | 0.009 | 0.049 | 0.069 | 0.807 | 0.112 | 0.016 | 0.173 |
| PL1 | −0.010 | 0.054 | 0.111 | 0.052 | 0.044 | 0.104 | 0.800 | 0.086 | 0.040 | 0.137 |
| PL2 | 0.048 | 0.058 | 0.086 | 0.026 | 0.017 | 0.150 | 0.798 | 0.121 | 0.032 | 0.154 |
| PS3 | 0.146 | 0.048 | 0.116 | 0.108 | 0.111 | −0.005 | 0.059 | 0.770 | −0.063 | 0.017 |
| PS4 | 0.059 | 0.032 | 0.102 | 0.095 | 0.075 | 0.001 | 0.058 | 0.766 | −0.026 | 0.073 |
| PS1 | 0.143 | 0.001 | 0.148 | 0.030 | 0.067 | 0.055 | 0.035 | 0.762 | −0.054 | 0.034 |
| PS5 | 0.145 | 0.052 | 0.155 | 0.073 | −0.018 | 0.096 | 0.020 | 0.759 | −0.024 | −0.013 |
| PS7 | 0.137 | 0.001 | 0.190 | 0.044 | 0.018 | −0.008 | 0.080 | 0.756 | −0.034 | 0.046 |
| PS6 | 0.154 | 0.094 | 0.173 | 0.021 | 0.014 | 0.019 | 0.065 | 0.747 | 0.060 | 0.043 |
| PS2 | 0.148 | 0.157 | 0.137 | 0.032 | 0.018 | 0.015 | 0.088 | 0.715 | 0.003 | 0.049 |
| IM2 | 0.120 | 0.073 | 0.076 | −0.004 | −0.003 | −0.025 | 0.053 | −0.068 | 0.827 | 0.047 |
| IM3 | 0.134 | 0.076 | 0.035 | 0.051 | 0.012 | −0.006 | 0.032 | −0.045 | 0.822 | −0.003 |
| IM1 | 0.161 | 0.062 | 0.054 | 0.081 | 0.012 | 0.043 | 0.042 | 0.014 | 0.811 | 0.084 |
| IM5 | 0.107 | 0.085 | 0.042 | 0.088 | 0.012 | 0.086 | 0.051 | 0.011 | 0.807 | −0.010 |
| IM6 | 0.161 | 0.031 | 0.030 | 0.122 | 0.002 | 0.050 | 0.019 | −0.011 | 0.802 | 0.020 |
| IM4 | 0.123 | −0.035 | 0.008 | 0.110 | 0.012 | 0.046 | 0.018 | −0.036 | 0.784 | 0.051 |
| FIN3 | 0.089 | 0.048 | −0.001 | 0.087 | 0.123 | 0.194 | 0.168 | 0.021 | 0.038 | 0.797 |
| FIN4 | −0.018 | 0.072 | 0.013 | 0.050 | 0.145 | 0.131 | 0.232 | 0.085 | 0.054 | 0.769 |
| FIN5 | 0.033 | 0.108 | 0.048 | 0.056 | 0.126 | 0.199 | 0.265 | 0.052 | 0.035 | 0.757 |
| FIN2 | 0.060 | 0.148 | 0.041 | −0.009 | 0.177 | 0.241 | 0.172 | 0.103 | 0.079 | 0.752 |
| FIN1 | 0.046 | 0.116 | 0.057 | 0.028 | 0.184 | 0.226 | 0.145 | 0.021 | 0.018 | 0.744 |
Notes: Rotation method: varimax. Extraction method: principal axis factoring. The rotation converged in seven iterations, with loading values greater than 0.5.
Table 6.
Demographic information for confirmatory factor analysis.
| Attribute | Value | Freq. | % | Attribute | Value | Freq. | % |
|---|---|---|---|---|---|---|---|
| Gender | Male | 321 | 54.4 | Monthly Income (RMB) | <1000 | 59 | 10.0 |
| Female | 269 | 45.6 | 1000–3000 | 25.6 | 25.6 | ||
| Age | 45–50 | 234 | 39.7 | 3000–5000 | 26.8 | 26.8 | |
| 51–55 | 210 | 35.6 | 5000–7000 | 25.1 | 25.1 | ||
| 56–60 | 146 | 24.7 | 7000–10,000 | 5.6 | 5.6 | ||
| Education | <High school | 219 | 37.5 | 10,000+ | 6.9 | 6.9 | |
| High school | 84 | 14.2 | Occupation | Teacher | 28 | 4.7 | |
| Associate | 109 | 18.5 | Civil servant | 31 | 5.3 | ||
| Bachelor | 108 | 18.3 | IT company staff | 32 | 5.4 | ||
| Master | 51 | 8.6 | Non-IT company staff | 182 | 30.8 | ||
| Doctor | 17 | 2.9 | Private entrepreneur | 31 | 5.3 | ||
| Marital status | Single | 92 | 15.6 | Freelancer | 30 | 5.1 | |
| Married | 434 | 73.6 | Worker | 162 | 27.4 | ||
| Divorced | 41 | 6.9 | Farmer | 34 | 5.8 | ||
| Widowed | 23 | 3.9 | Others | 60 | 10.1 |
Table 7.
Model fit for the perceived risk scale.
| Models | X2 | d.f. | X2/d.f. | SRMR | RMSEA | CFI | NFI | IFI | TLI | GFI |
|---|---|---|---|---|---|---|---|---|---|---|
| Item 76 | 2777.023 | 2732 | 1.016 | 0.027 | 0.005 | 0.998 | 0.902 | 0.998 | 0.998 | 0.894 |
| Item 73 | 2547.373 | 2513 | 1.014 | 0.027 | 0.005 | 0.999 | 0.905 | 0.999 | 0.999 | 0.898 |
| Item 70 | 2326.904 | 2303 | 1.010 | 0.026 | 0.004 | 0.999 | 0.908 | 0.999 | 0.999 | 0.903 |
Note: SRMR, standardized root mean square residual; RMSEA, root mean square error of approximation; CFI, comparative fit index; NFI, normal fit index; IFI, incremental fit index; TLI represents Tucker–Lewis Index; GFI, goodness of fit.
Table 8.
Convergent and discriminant validity of the perceived risk scale.
| Construct | Cronbach’s Alpha | Variable | Mean | Standard Deviation | Standardized Factor Loading | C.R. (t-Value) | SMC | AVE | Composite Reliability |
|---|---|---|---|---|---|---|---|---|---|
| Privacy And Security Risk | 0.892 | PS1 | 3.97 | 0.777 | 0.745 | - | 0.555 | 0.540 | 0.891 |
| PS2 | 3.96 | 0.797 | 0.725 | 17.592 | 0.541 | ||||
| PS3 | 3.94 | 0.799 | 0.761 | 18.222 | 0.579 | ||||
| PS4 | 3.97 | 0.811 | 0.731 | 17.509 | 0.534 | ||||
| PS5 | 3.96 | 0.799 | 0.740 | 17.892 | 0.548 | ||||
| PS6 | 3.95 | 0.790 | 0.703 | 16.798 | 0.494 | ||||
| PS7 | 3.98 | 0.784 | 0.727 | 17.483 | 0.529 | ||||
| Physical Risk | 0.896 | PHY1 | 3.88 | 0.949 | 0.742 | - | 0.551 | 0.548 | 0.894 |
| PHY2 | 3.86 | 0.971 | 0.779 | 18.908 | 0.607 | ||||
| PHY3 | 3.84 | 0.917 | 0.718 | 17.215 | 0.516 | ||||
| PHY4 | 3.92 | 0.880 | 0.738 | 17.714 | 0.545 | ||||
| PHY5 | 3.86 | 0.950 | 0.733 | 17.510 | 0.537 | ||||
| PHY6 | 3.87 | 0.957 | 0.749 | 18.038 | 0.561 | ||||
| PHY7 | 3.88 | 0.921 | 0.720 | 17.315 | 0.518 | ||||
| Technological Risk | 0.912 | TECH1 | 3.32 | 0.845 | 0.712 | - | 0.507 | 0.531 | 0.911 |
| TECH2 | 3.31 | 0.873 | 0.725 | 16.982 | 0.525 | ||||
| TECH3 | 3.34 | 0.828 | 0.704 | 16.457 | 0.495 | ||||
| TECH4 | 3.34 | 0.849 | 0.756 | 17.013 | 0.572 | ||||
| TECH5 | 3.34 | 0.860 | 0.714 | 16.592 | 0.510 | ||||
| TECH6 | 3.34 | 0.896 | 0.729 | 16.985 | 0.531 | ||||
| TECH7 | 3.34 | 0.870 | 0.758 | 17.656 | 0.575 | ||||
| TECH9 | 3.27 | 0.857 | 0.721 | 16.905 | 0.519 | ||||
| TECH10 | 3.30 | 0.851 | 0.739 | 17.256 | 0.547 | ||||
| Performance Risk | 0.928 | PER1 | 3.93 | 0.878 | 0.791 | - | 0.625 | 0.627 | 0.922 |
| PER2 | 3.88 | 0.883 | 0.797 | 20.957 | 0.635 | ||||
| PER3 | 3.88 | 0.890 | 0.786 | 20.674 | 0.617 | ||||
| PER4 | 3.89 | 0.870 | 0.795 | 20.916 | 0.632 | ||||
| PER5 | 3.87 | 0.897 | 0.782 | 20.535 | 0.612 | ||||
| PER6 | 3.93 | 0.855 | 0.793 | 20.951 | 0.629 | ||||
| PER7 | 3.90 | 0.909 | 0.799 | 21.060 | 0.638 | ||||
| Service Risk | 0.926 | SER1 | 3.97 | 0.863 | 0.762 | - | 0.581 | 0.583 | 0.926 |
| SER2 | 3.98 | 0.838 | 0.773 | 19.523 | 0.598 | ||||
| SER3 | 4.00 | 0.848 | 0.738 | 18.499 | 0.545 | ||||
| SER4 | 3.88 | 0.883 | 0.750 | 18.837 | 0.563 | ||||
| SER5 | 4.00 | 0.823 | 0.741 | 18.507 | 0.549 | ||||
| SER6 | 3.96 | 0.869 | 0.798 | 20.293 | 0.637 | ||||
| SER7 | 3.98 | 0.823 | 0.760 | 19.107 | 0.577 | ||||
| SER8 | 4.00 | 0.864 | 0.777 | 19.586 | 0.603 | ||||
| SER9 | 3.98 | 0.860 | 0.773 | 19.473 | 0.598 | ||||
| Financial Risk | 0.861 | FIN1 | 3.63 | 0.855 | 0.725 | - | 0.526 | 0.558 | 0.863 |
| FIN2 | 3.72 | 0.782 | 0.762 | 17.009 | 0.581 | ||||
| FIN3 | 3.66 | 0.824 | 0.739 | 16.544 | 0.546 | ||||
| FIN4 | 3.62 | 0.816 | 0.734 | 16.476 | 0.539 | ||||
| FIN5 | 3.65 | 0.797 | 0.773 | 17.170 | 0.598 | ||||
| Psychological Risk | 0.913 | PSY1 | 3.73 | 0.866 | 0.776 | - | 0.601 | 0.601 | 0.913 |
| PSY2 | 3.76 | 0.847 | 0.746 | 19.067 | 0.556 | ||||
| PSY3 | 3.77 | 0.874 | 0.801 | 20.593 | 0.641 | ||||
| PSY4 | 3.76 | 0.864 | 0.785 | 20.013 | 0.616 | ||||
| PSY5 | 3.76 | 0.835 | 0.775 | 19.852 | 0.601 | ||||
| PSY6 | 3.80 | 0.841 | 0.765 | 19.529 | 0.585 | ||||
| PSY7 | 3.72 | 0.888 | 0.777 | 19.887 | 0.603 | ||||
| Industry and Market Risk | 0.908 | IM1 | 3.03 | 0.988 | 0.797 | - | 0.636 | 0.617 | 0.906 |
| IM2 | 3.08 | 0.954 | 0.804 | 21.505 | 0.647 | ||||
| IM3 | 3.03 | 0.961 | 0.810 | 21.753 | 0.656 | ||||
| IM4 | 3.16 | 0.964 | 0.753 | 19.781 | 0.567 | ||||
| IM5 | 3.00 | 0.950 | 0.783 | 20.798 | 0.613 | ||||
| IM6 | 3.04 | 0.951 | 0.766 | 20.041 | 0.586 | ||||
| Social Support Risk | 0.912 | SS2 | 3.50 | 0.919 | 0.785 | - | 0.616 | 0.598 | 0.912 |
| SS3 | 3.51 | 0.862 | 0.764 | 19.797 | 0.583 | ||||
| SS4 | 3.49 | 0.860 | 0.755 | 19.494 | 0.570 | ||||
| SS5 | 3.51 | 0.870 | 0.770 | 20.021 | 0.593 | ||||
| SS8 | 3.48 | 0.895 | 0.773 | 20.124 | 0.597 | ||||
| SS9 | 3.53 | 0.898 | 0.786 | 20.588 | 0.618 | ||||
| SS10 | 3.51 | 0.897 | 0.780 | 20.221 | 0.609 | ||||
| Policy and Law Risk | 0.912 | PL1 | 3.58 | 1.035 | 0.805 | - | 0.648 | 0.645 | 0.916 |
| PL2 | 3.57 | 1.021 | 0.807 | 21.645 | 0.651 | ||||
| PL3 | 3.56 | 1.066 | 0.788 | 20.864 | 0.620 | ||||
| PL4 | 3.57 | 1.026 | 0.806 | 21.648 | 0.650 | ||||
| PL5 | 3.57 | 1.028 | 0.809 | 21.833 | 0.654 | ||||
| PL6 | 3.54 | 0.991 | 0.805 | 21.499 | 0.649 |
Table 9.
Correlation and discriminant validity of the perceived risk scale.
| Construct | CR | AVE | MSV | ASV | PS | PHY | TECH | PER | SER | FIN | PSY | IM | SS | PL |
|---|---|---|---|---|---|---|---|---|---|---|---|---|---|---|
| PS | 0.891 | 0.540 | 0.137 | 0.052 | 0.735 | |||||||||
| PHY | 0.894 | 0.548 | 0.266 | 0.058 | 0.226 *** | 0.740 | ||||||||
| TECH | 0.911 | 0.531 | 0.180 | 0.053 | 0.370 *** | 0.204 *** | 0.729 | |||||||
| PER | 0.922 | 0.627 | 0.211 | 0.065 | 0.256 *** | 0.065 *** | 0.424 *** | 0.804 | ||||||
| SER | 0.926 | 0.583 | 0.211 | 0.044 | 0.179 *** | 0.103 *** | 0.170 *** | 0.459 *** | 0.764 | |||||
| FIN | 0.863 | 0.558 | 0.175 | 0.065 | 0.141 *** | 0.323 *** | 0.116 *** | 0.141 *** | 0.239 *** | 0.747 | ||||
| PSY | 0.913 | 0.601 | 0.266 | 0.063 | 0.099 *** | 0.516 *** | 0.052 *** | 0.096 *** | 0.084 *** | 0.418 *** | 0.775 | |||
| IM | 0.906 | 0.617 | 0.034 | 0.020 | −0.017 *** | 0.050 *** | 0.108 *** | 0.180 *** | 0.153 *** | 0.180 *** | 0.167 *** | 0.785 | ||
| SS | 0.912 | 0.598 | 0.091 | 0.032 | 0.301 *** | 0.092 *** | 0.171 *** | 0.143 *** | 0.102 *** | 0.147 *** | 0.162 *** | 0.185 *** | 0.773 | |
| PL | 0.916 | 0.645 | 0.139 | 0.048 | 0.255 *** | 0.185 *** | 0.175 *** | 0.196 *** | 0.138 *** | 0.373 *** | 0.217 *** | 0.136 *** | 0.206 *** | 0.803 |
Note: PS, Privacy and Security Risk; PHY, Physical Risk; TECH, Technological Risk; PER, Performance Risk; SER, Service Risk; FIN, Financial Risk; PSY, Psychological Risk; IM, Industry and Market Risk; SS, Social Support Risk; PL, Policy and Law Risk; *** p < 0.01.
Disclaimer/Publisher’s Note: The statements, opinions and data contained in all publications are solely those of the individual author(s) and contributor(s) and not of MDPI and/or the editor(s). MDPI and/or the editor(s) disclaim responsibility for any injury to people or property resulting from any ideas, methods, instructions or products referred to in the content. |
© 2024 by the authors. Licensee MDPI, Basel, Switzerland. This article is an open access article distributed under the terms and conditions of the Creative Commons Attribution (CC BY) license (https://creativecommons.org/licenses/by/4.0/).
Share and Cite
MDPI and ACS Style
Liu, Y.; Tamura, R.; Xiao, L. Barriers to Older Adults Adapting Smart Homes: Perceived Risk Scale Development. Buildings 2024, 14, 1226. https://doi.org/10.3390/buildings14051226
AMA Style
Liu Y, Tamura R, Xiao L. Barriers to Older Adults Adapting Smart Homes: Perceived Risk Scale Development. Buildings. 2024; 14(5):1226. https://doi.org/10.3390/buildings14051226
Chicago/Turabian StyleLiu, Yuqi, Ryoichi Tamura, and Liang Xiao. 2024. "Barriers to Older Adults Adapting Smart Homes: Perceived Risk Scale Development" Buildings 14, no. 5: 1226. https://doi.org/10.3390/buildings14051226
Note that from the first issue of 2016, this journal uses article numbers instead of page numbers. See further details here.