1. Introduction
Daylighting is a design parameter that allows for the configuration of different indoor atmospheres with low energy consumption [
1]. Activities with side-lit spaces are very common. It is one of the most ancient lighting applications owing to easy, practical, and nearby aperture on the façade. Usually, this light is provided by a façade and is complemented by an outside view. This kind of view could be called a side-view. On the one hand, in an office open-plan environment, it is proven that occupants generally want a visual connection to the outdoors [
2]. In addition, daylighting and outdoor views increase efficiency in activity and provide stress relief [
3]. Moreover, according to some psychological studies, it is easier to concentrate if there are fewer objects to pay attention to [
4]. Therefore, if occupants are not comfortable, energy consumption will tend to rise, increasing electric lighting demand [
5,
6].
On the other hand, tasting, chatting, and having an outside view are very common activities involved in the restaurant industry. In restaurants, the visual quality of an atmosphere is important. However, not all façade designs can achieve a balanced concentration level on these particular aforementioned activities. In these activities of tourist areas, visual discomfort is socially tolerated. Cultural habits affect a user’s perception, but conditions without well-being are often accepted [
7]. Intimacy is important for a calm and reserved atmosphere and provides an ideal atmosphere for thinking, reflecting, and meditating [
8].
In the modern age with new materials for building structures as metal and concrete, façades ceased to be bearing walls of stone. In addition, electric lighting, HVAC systems, and control over physical environments have facilitated the glazing of façades [
9]. At the same time, interest in landscapes and cityscapes has increased the demand for glazed façades.
In recent decades, outdoor views at restaurants have increased [
10]. Cityscapes, landscapes, and seascapes as scenery have become valuable. In addition, the gastronomic sector has evolved considerably; as a result, the dining experience has become a part of our social lives [
11]. Often, these two activities are shown to be integrated. Therefore, restaurant-goers prefer sitting where they are provided with an exterior side-view.
Highly glazed buildings are often designed to provide great access to the view and to admit daylight. However, in high luminance environments (i.e., midday), it tends to be difficult to attain clear outside views without disturbance owing to glare [
12]. These environments also tend to provide high information content, related to spatial contrast, potentially causing a decrease in concentration levels for particular activities [
13]. In addition, not all of the transparent surface is used to provide views and light, causing privacy loss.
Daylight glare methods have been used in office activities [
14]. Although outside views are in high demand in the hotel industry, food light intensity, color, and lighting effects have not been studied much at restaurants.
This research proposes a quality atmosphere analysis for future daylighting designs in any outdoor location in midday high luminance contexts, keeping comfort with a low amount of energy [
15]. This study tends to be indicative for the design of all new buildings, including restaurants. It is not intended for a particular restaurant case study. The suggestions made herein are for outside midday high luminance contexts, owing to common outside conditions throughout the year in Spain. This time point is common, because snacks such as tapas and pinchos are often eaten outside with high luminance. The sun position at this time is high enough to avoid direct sunlight, but it is possible to have very high luminance on some surfaces (with high amounts of light reflection). In addition, the specific goal is to optimize skins according to the outside view and concentrate on the internal ambiance for comfortable eating and chatting. Furthermore, the final objective is to provide recommendations on glazed façades for restaurants (see
Figure 1) and to take this into account for the possible integration of restaurant façades with overall building envelope designs [
16]. Consequently, whether classical glare methods are useful for restaurants is tested. Accordingly, two restaurants from Spain with glazed façades are selected, one with a southeast orientation and one with a north orientation, to check glare probability and spatial contrast.
2. Material and Methods
2.1. Selected Cases
Selected case studies are related to an activity where the concentration of outside vision, taste, and chatting with daylighting is required [
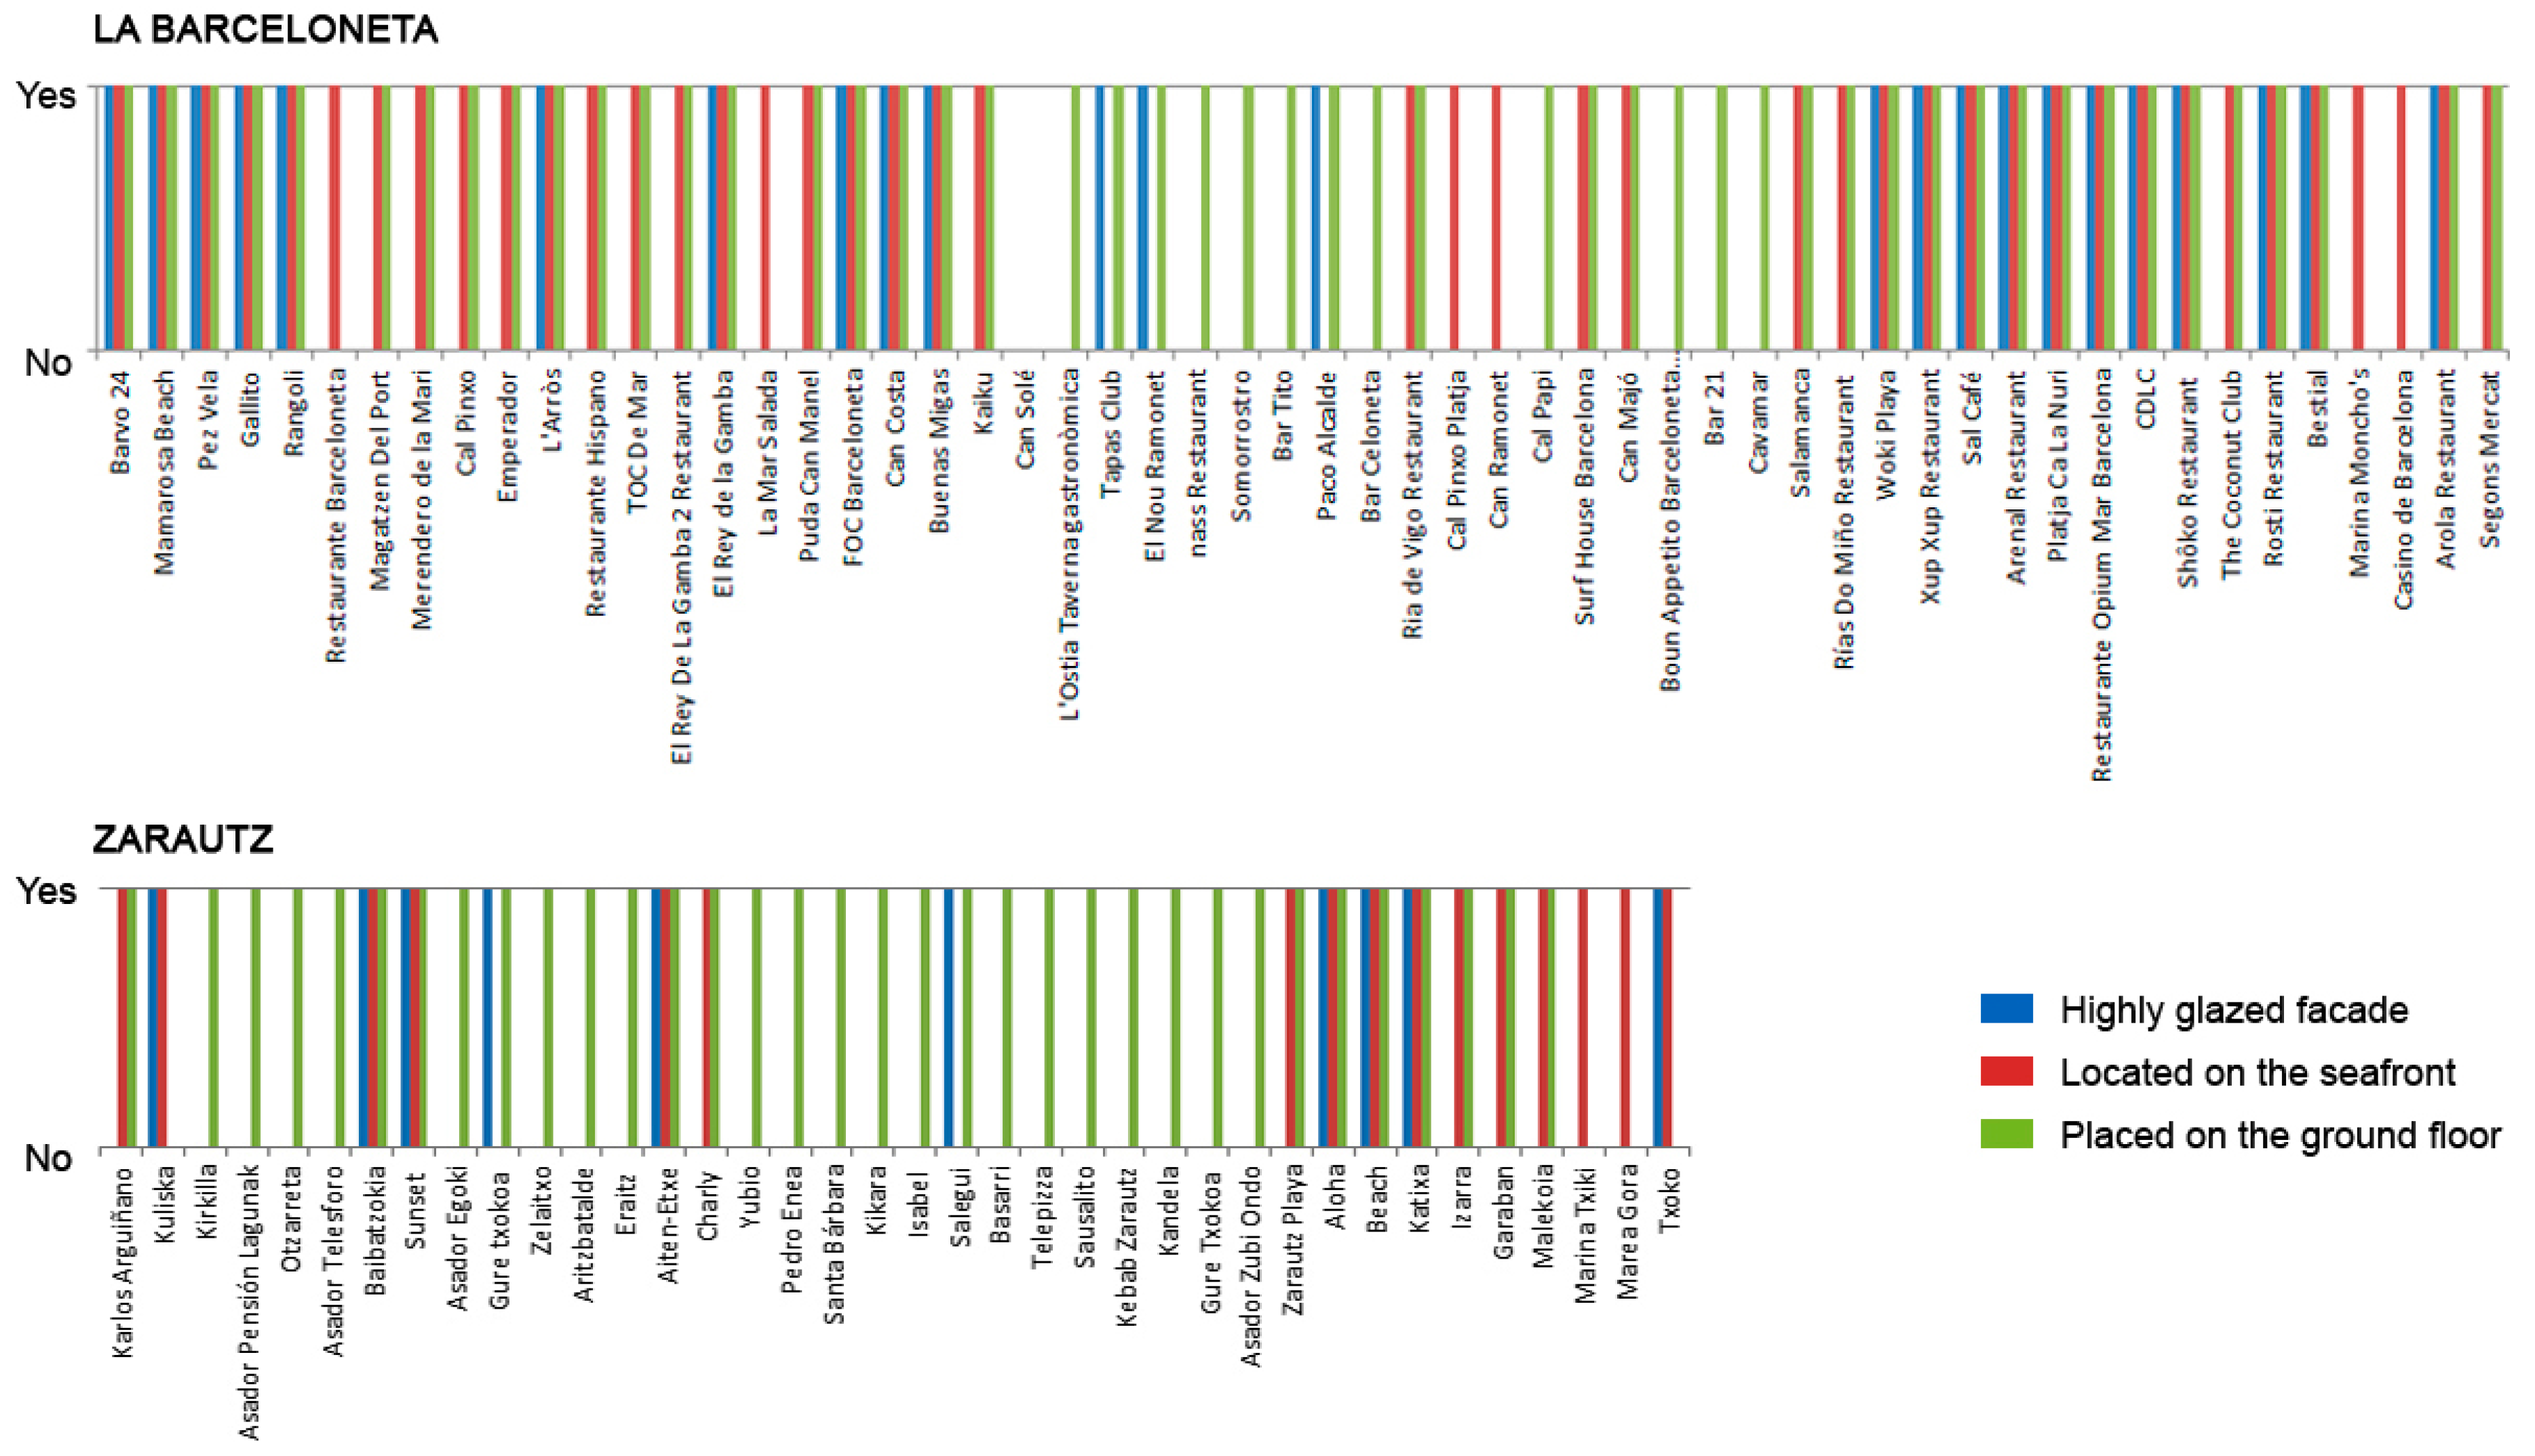
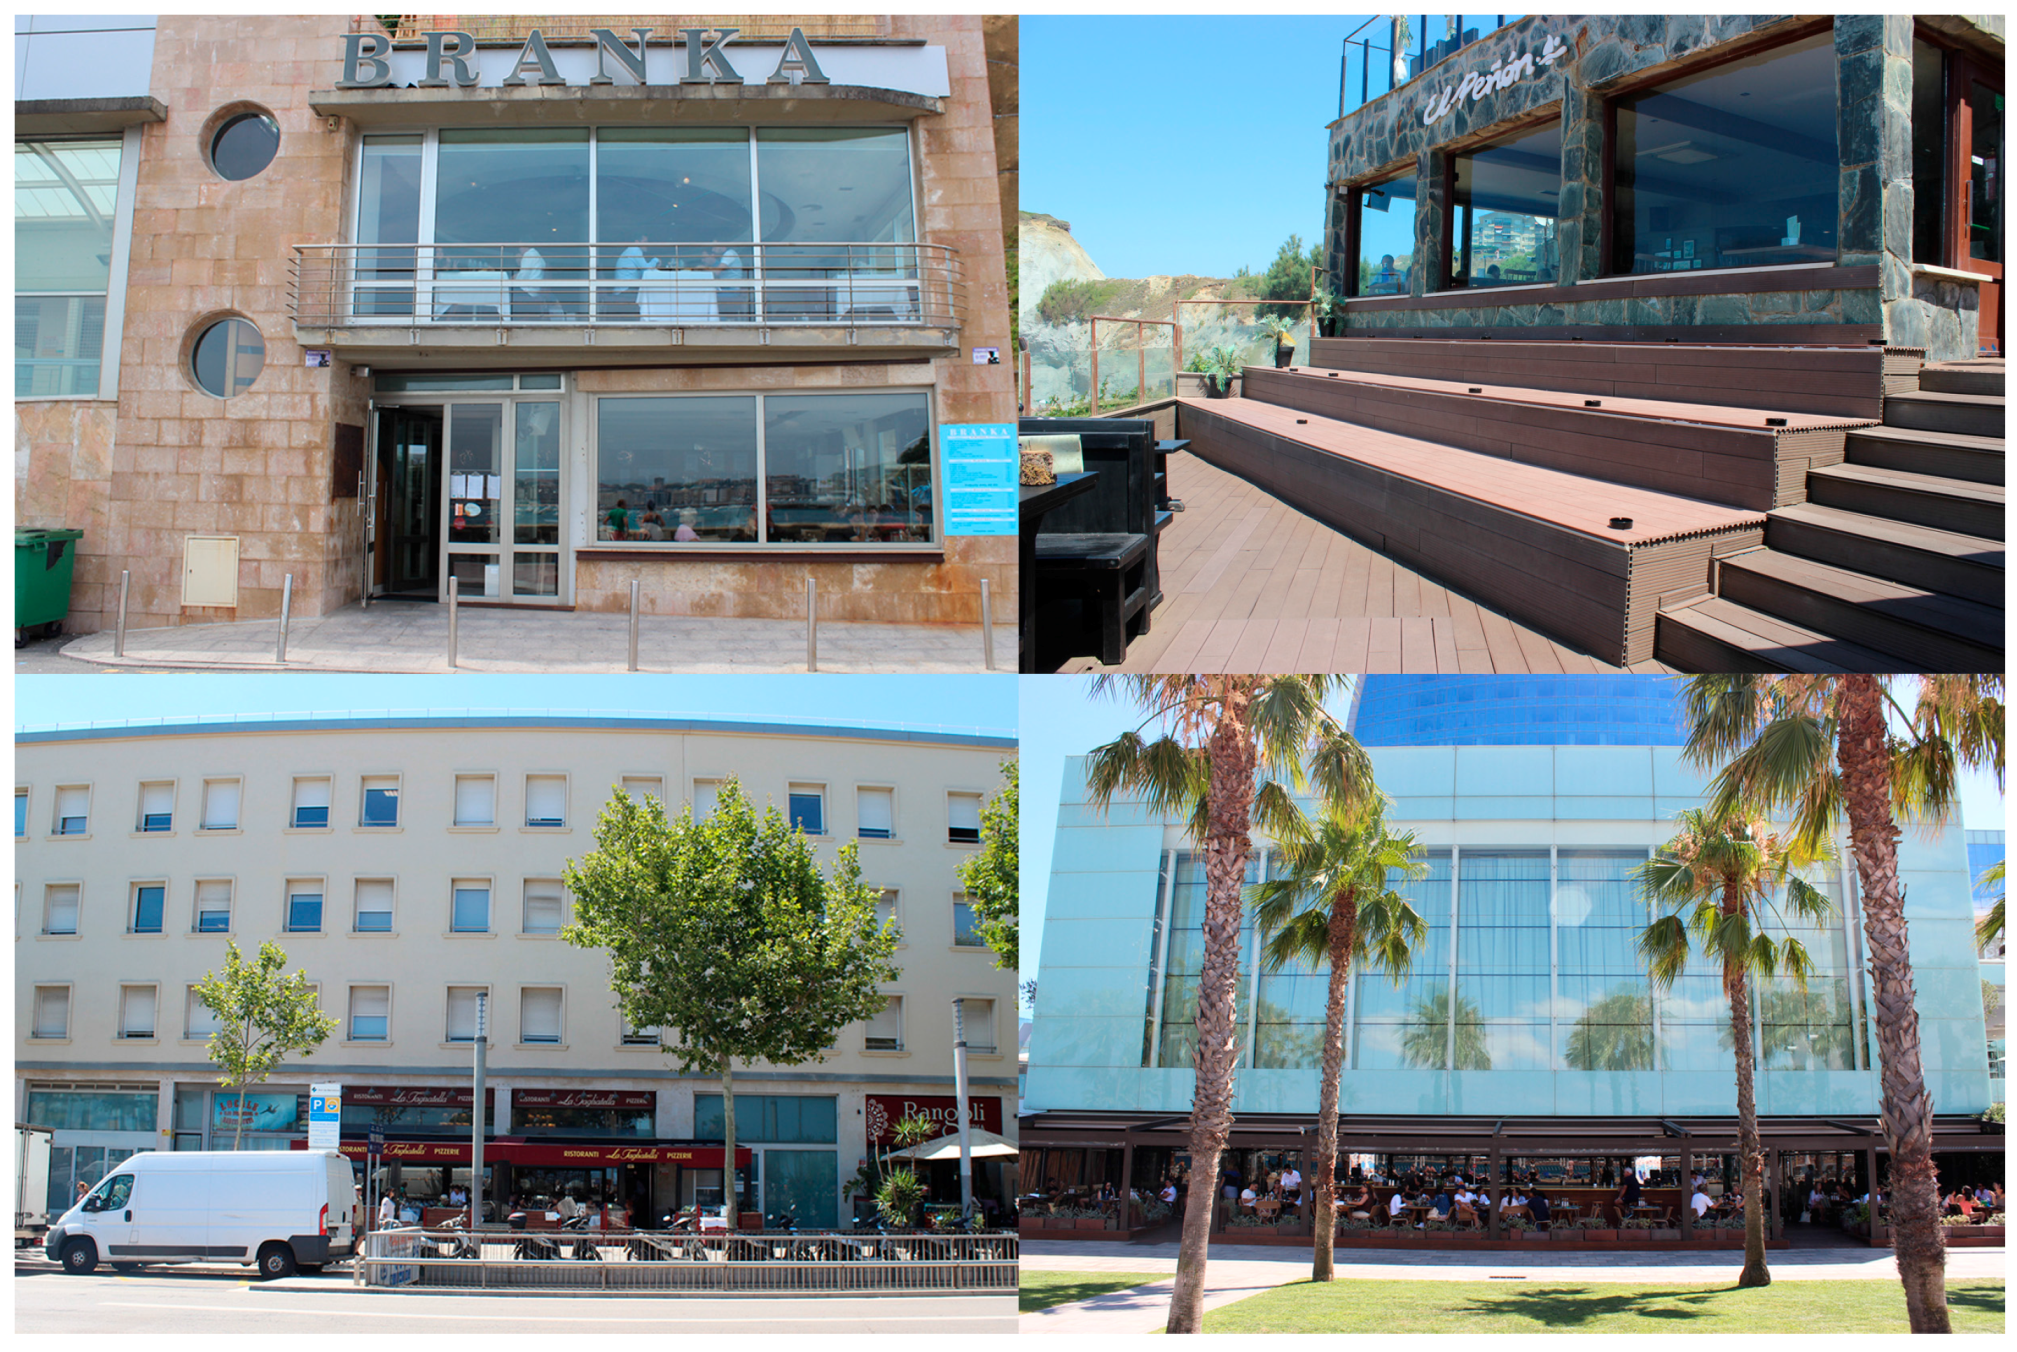
17]. Before analyzing the two restaurants selected, several other restaurants in La Barceloneta, a neighbourhood of Barcelona, and Zarautz, a town next to Bilbao (both in Spain), were studied to observe the most common patterns. The location, the position, and the façade were considered for each restaurant.
In La Barceloneta, almost half of the façades analyzed are highly glazed, almost all of them are located on the seafront (facing approximately south), and all of them are on the ground floor. In Zarautz, nearly half of the façades analyzed are highly glazed, almost all of them are located on the seafront (facing approximately north), and most of them are on the ground floor (see
Figure 2).
Accordingly, many restaurants have glazed façades, are on the seafront, and are on the ground floor. The two restaurants selected follow this description, which is the most common pattern among all restaurants analyzed. Thus, they are representative of the restaurants that provide outside views and place value on activities such as tasting and chatting. Pictures and scene recognition tools have been used to ensure that the restaurants selected are representative.
2.2. Measuring Instruments
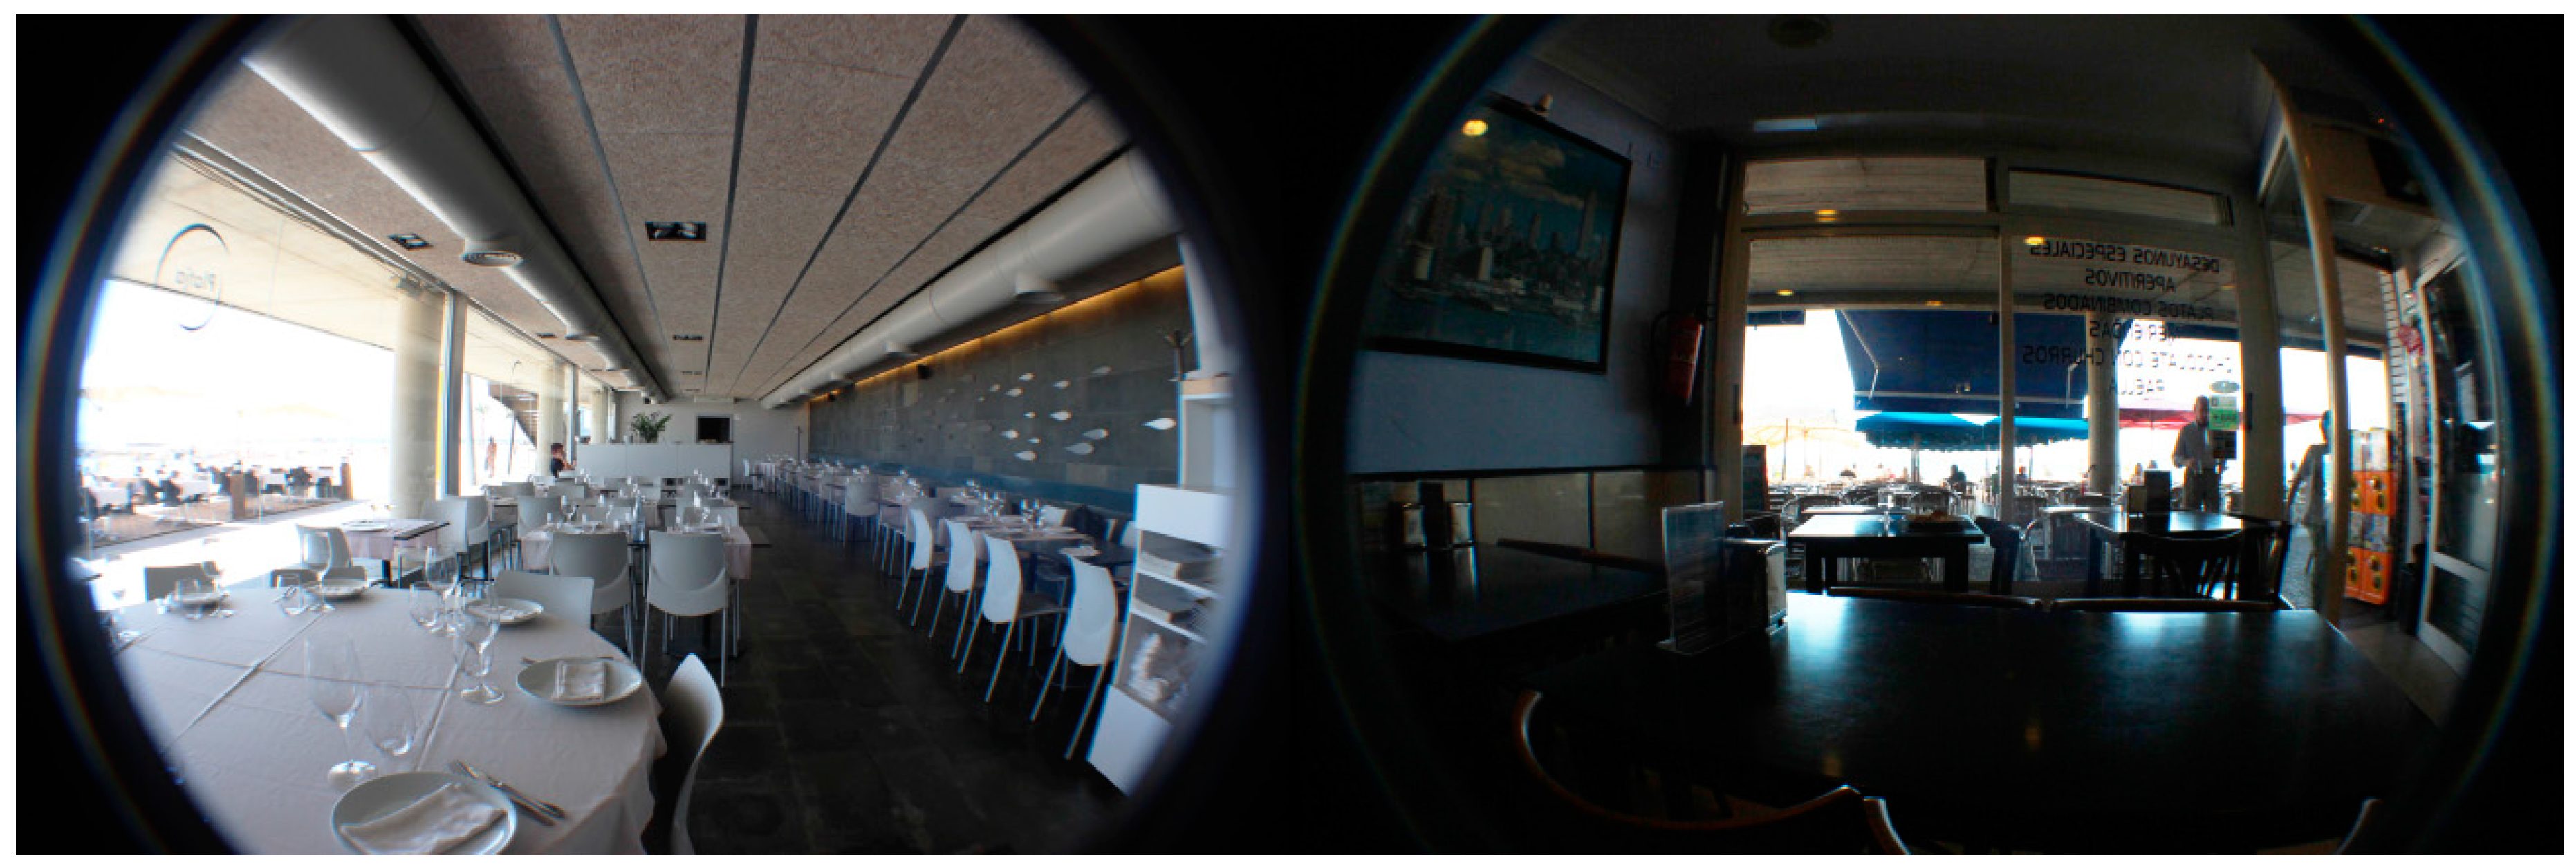
We used two measuring instruments. The first is a digital camera (Canon EOS 600D, with Canon objective EFS 18–55mm, Canon, Tokyo, Japan) fitted with a circular fisheye lens (Gloxy; Front Filter Size, 67 mm; conversion factor, 0.42×; thread Size, 46 mm, Gloxy, Tokyo, Japan). The second instrument is a device to measure the illumination level (the Hagner Digital Photometer TP200, B.Hagner AB, Solna, Sweden). The measuring range is 0.1–200,000 Ix, and the accuracy is ±3% (±1 in last digit). The luminance meter (cd/m
2) acceptance angle is approximately 1/30°. The limits are sufficient to verify the measurements taken in our study, as the margins have not been exceeded in any case (see
Figure 3).
2.3. Methodology
The methodology aims to demonstrate that the pictures are identify the restaurant, that there is a probability of glare, that there is a high spatial contrast, and that there might be an uncomfortable light atmosphere in the restaurant. The steps of this process are indicated in
Table 1.
The most common preference when dining in restaurants is next to the window having a view. The two pictures of the frontal view for each restaurant have been added to an online application, the MIT Scene Recognition Demo [
18], to confirm that the selected pictures are recognized as a restaurant and if they could be assumed as representative of other restaurants.
Basic glare metrics (CIE glare index (CGI), Daylight glare index (DGI), Unified glare rating (UGR), Visual comfort probability (VCP), and Daylight glare probability (DGP)) are intended for differentiating glare from daylight: Daylight glare index (DGI) [
19,
20] and Daylight Glare Probability (DGP). However, only DGP incorporates vertical eye illuminance as a non-contrast-based aspect of the metric. As the daylight performance is provided by a highly glazed façade, there should be a correlation between the vertical illuminance and the visual luminance. Therefore, the DGP index results could make sense [
21]. The DGP is defined as [
22]
where:
: vertical eye illuminance (lx)
: luminance of source (cd/m2)
: solid angle of source (−)
: position index (−)
; ; ;
The possible scaling of glare obtained by the DGP value can be stated as follows:
Imperceptible: DGP ≤ 0.35
Perceptible: 0.35 < DGP ≤ 0.40
Disturbing: 0.40 < DGP ≤ 0.45
Intolerable: DGP ≥ 0.45
Evalglare, a Radiance-based tool for glare evaluation, was used to calculate the above index. In addition, with this tool, there is an option of attaining a glare source image to check the glaring surfaces of the scene.
The three fields that are involved in the activity have been calculated to detect whether there is appreciable glare [
23]. In addition, we have correlated all results to ensure the overall glare perception.
The spatial contrast calculates the difference in brightness between each pixel and its four neighboring pixels. It takes an average of local contrast values across the composition and measures the cumulative sum of the local contrast values [
24].
As indicated, eight people were polled for the satisfaction survey. Each person had normal vision (some myopia was the only visual impairment for two people). All had university degrees. Six questions were asked to each participant. All of them were done under aforementioned context, eating and chatting activities next to the façade with outside view.
3. Calculation
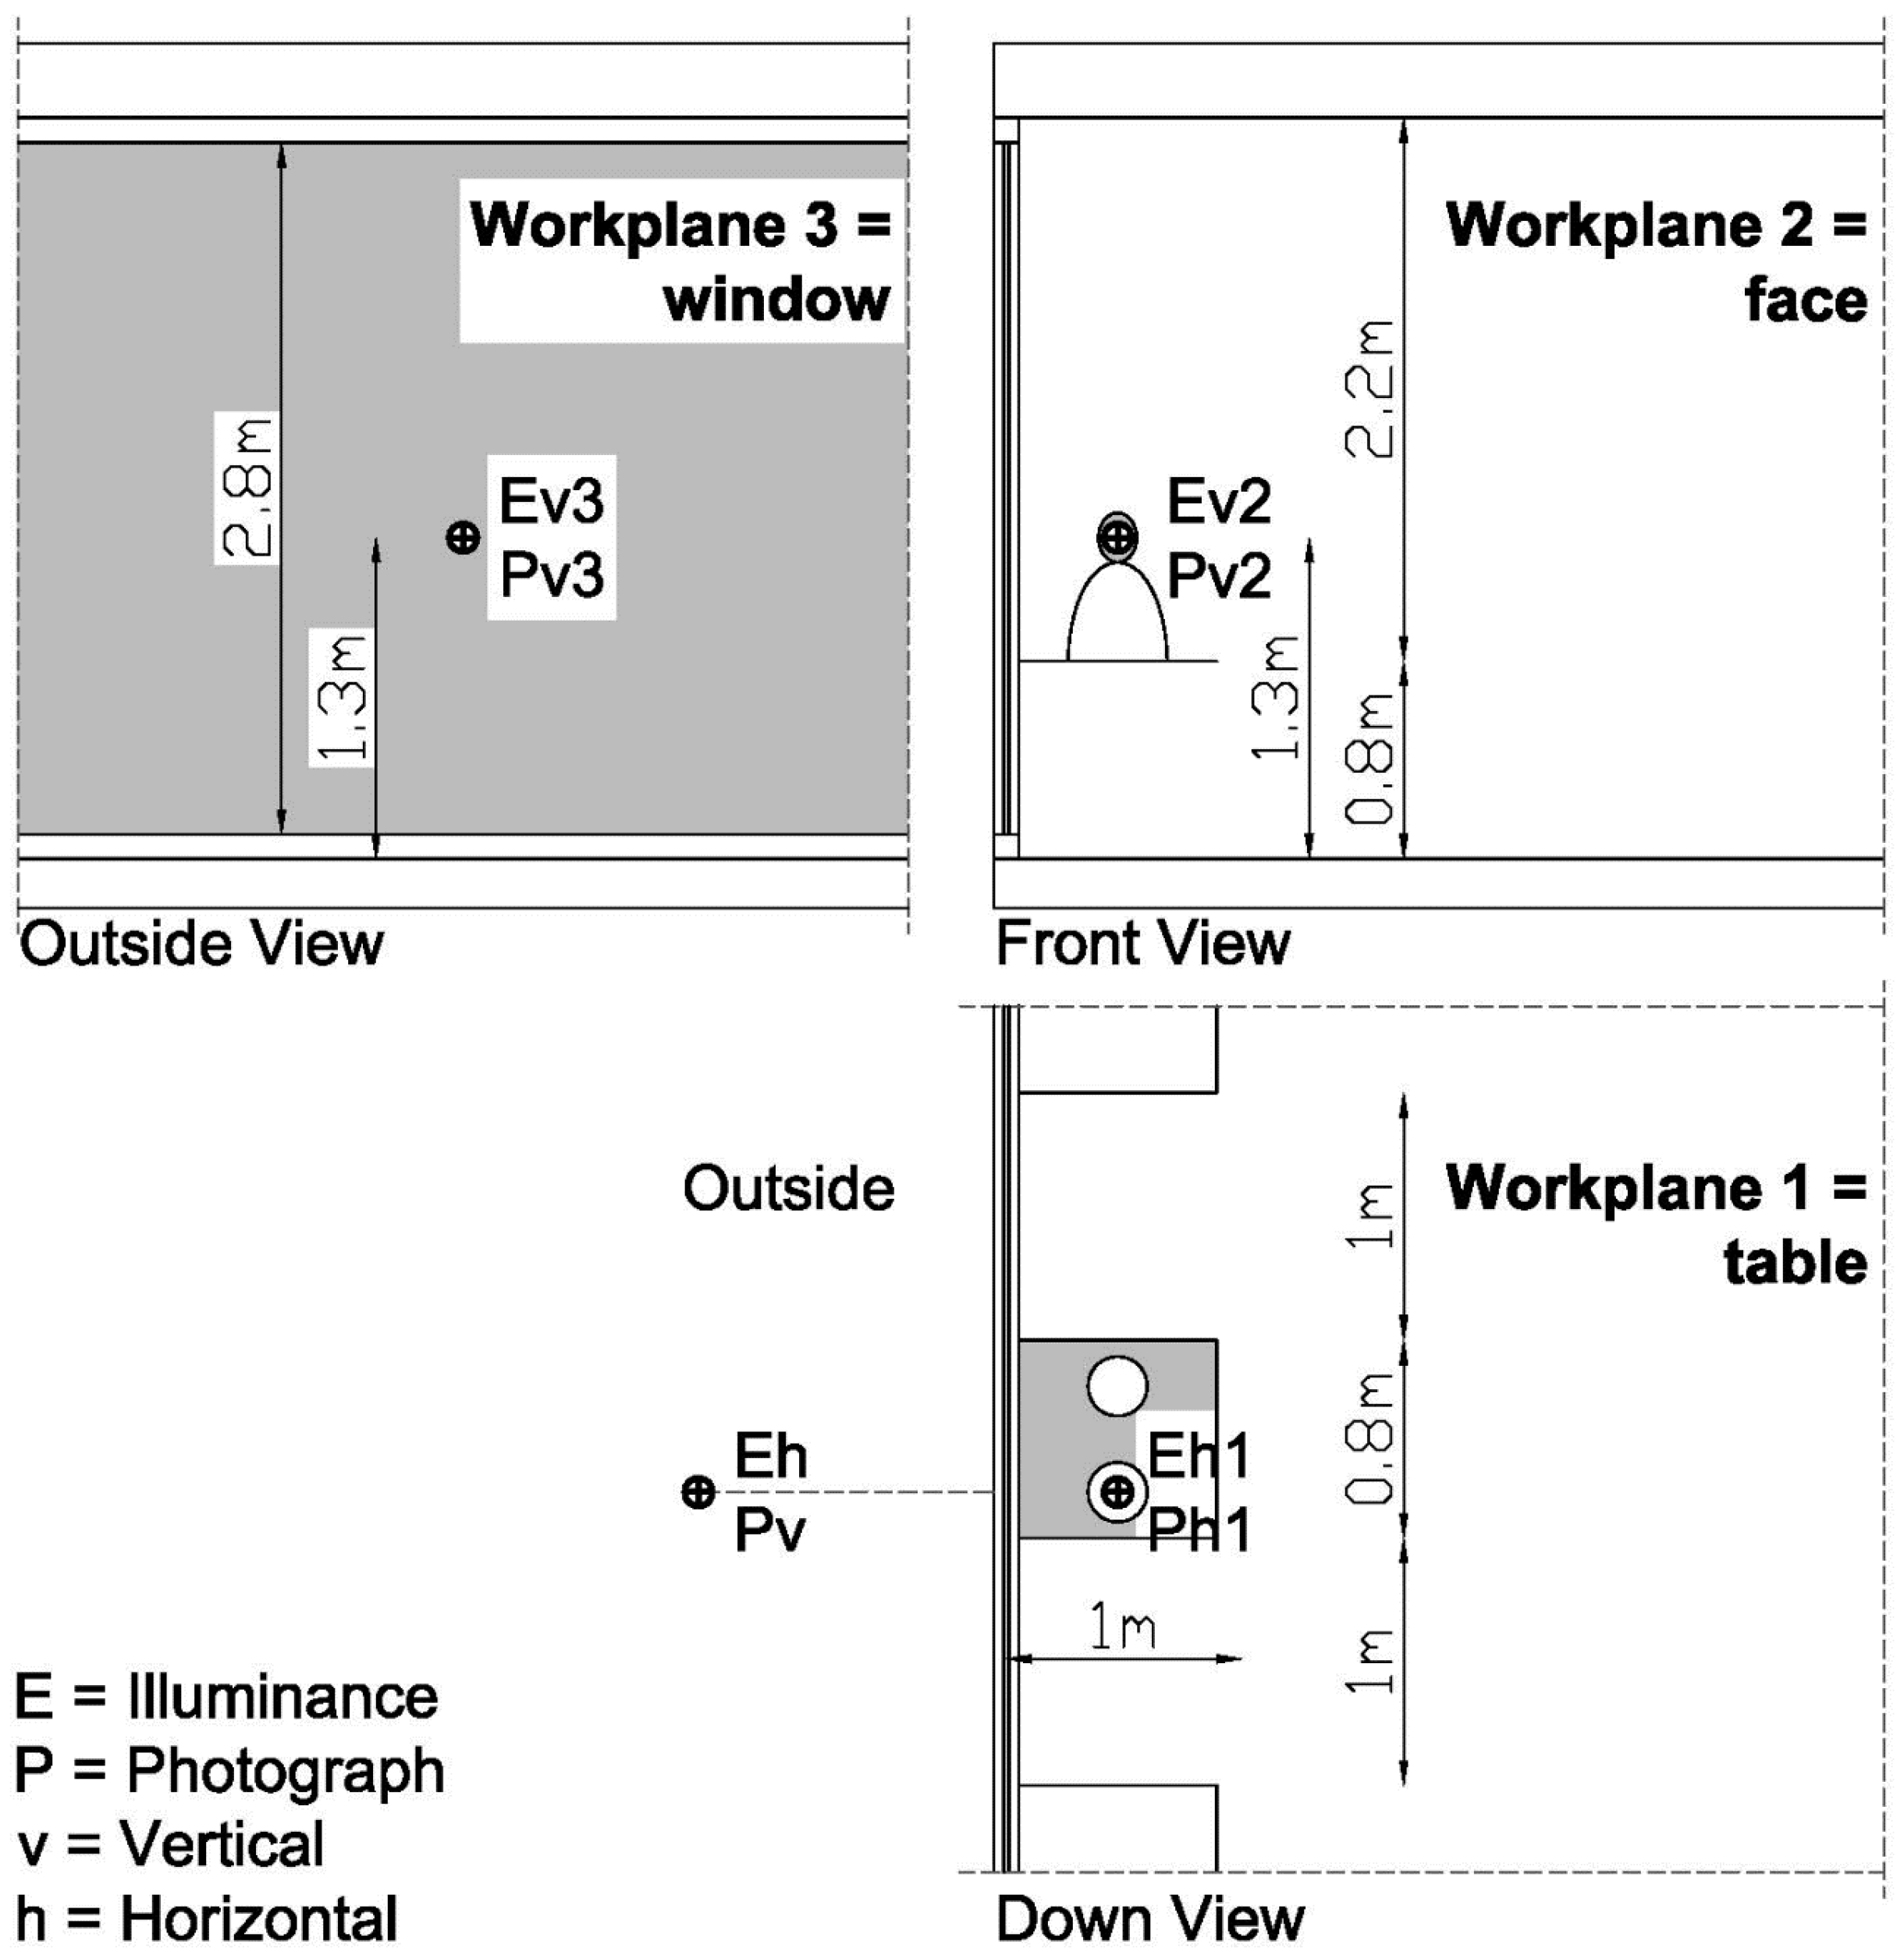
In reference to the workplanes, the relevance of the definition of the most representative local visual fields that contribute to the overall visual field is important to add. According to the managers of restaurants, almost all customers prefer an outside view. Tables adjacent to the façade are the most requested [
25], and tables for two people usually have outside views, glare probability, a front view, spatial contrast, a need for concentration on tasting and chatting, and privacy. Accordingly, tables for two people that are adjacent to glazed façades are chosen (see
Figure 4).
Describing the work scene with three workplanes is a better representation of reality. The visual field is better described by taking into account different workplanes rather than only one. Usually, the human brain works by contrasting values, not with absolute values. Thus, analyzing only extreme views as outside or down is not practical because the perception of the luminance level is affected by the previous vision.
Therefore, the extreme window or table luminance values are smoothed by intermediate face view, in contrast to the classical method of the luminance source against the background luminance [
26]. The adaptation of the vision and mind is important. Thus, it could be interesting and more practical to add an earlier workplane’s luminance data to the glaring methods. Dynamic state methods can approximate the overall real visual field more so than steady state methods [
27,
28].
Finally, the illuminance measurements were taken in each workplane (see
Figure 3). In addition, outside horizontal and vertical illuminance data were measured. Vertical illuminance data (see
Table 2) was used as reference data for the DGP index [
29].
3.1. Recognition
As the front view, i.e., the face, is the picture that better describes the overall vision field, showing parts of the three workplanes, the intermediate workplane of each restaurant is selected to test if the information content of the picture is representative of the restaurant and what information has been used as identification data.
After adding the front view workplane, i.e., the face, of each restaurant to the MIT Scene Recognition Demo online application, the results of Ca La Nuri show the following: it has an indoor environment; it has Restaurant Kitchen (0.12), Restaurant (0.12), Airport Terminal (0.09) Cockpit (0.07) and Gallery (0.07) semantic categories; and it has Enclosed Areas, Man-made, No Horizon, Cloth, Electric Indoor Lighting, Working, Semi-Enclosed Area, Research, Stressful, and Socializing SUN (Scene UNderstanding) scene attributes. In addition, the results of the Beach restaurant show the following: it has an indoor environment; it has Coffee Shop (0.19), Restaurants Kitchen (0.13), Restaurant (0.11), Bar (0.09) and Ice Cream Parlor (0.08) semantic categories; and it has the following scene attributes: Man-made, No Horizon, Enclosed Area, Cloth, Working, Glass, Semi-Enclosed Area, Electric Indoor Lighting, Natural Light, and Glossy SUN scene attributes.
3.2. DGP
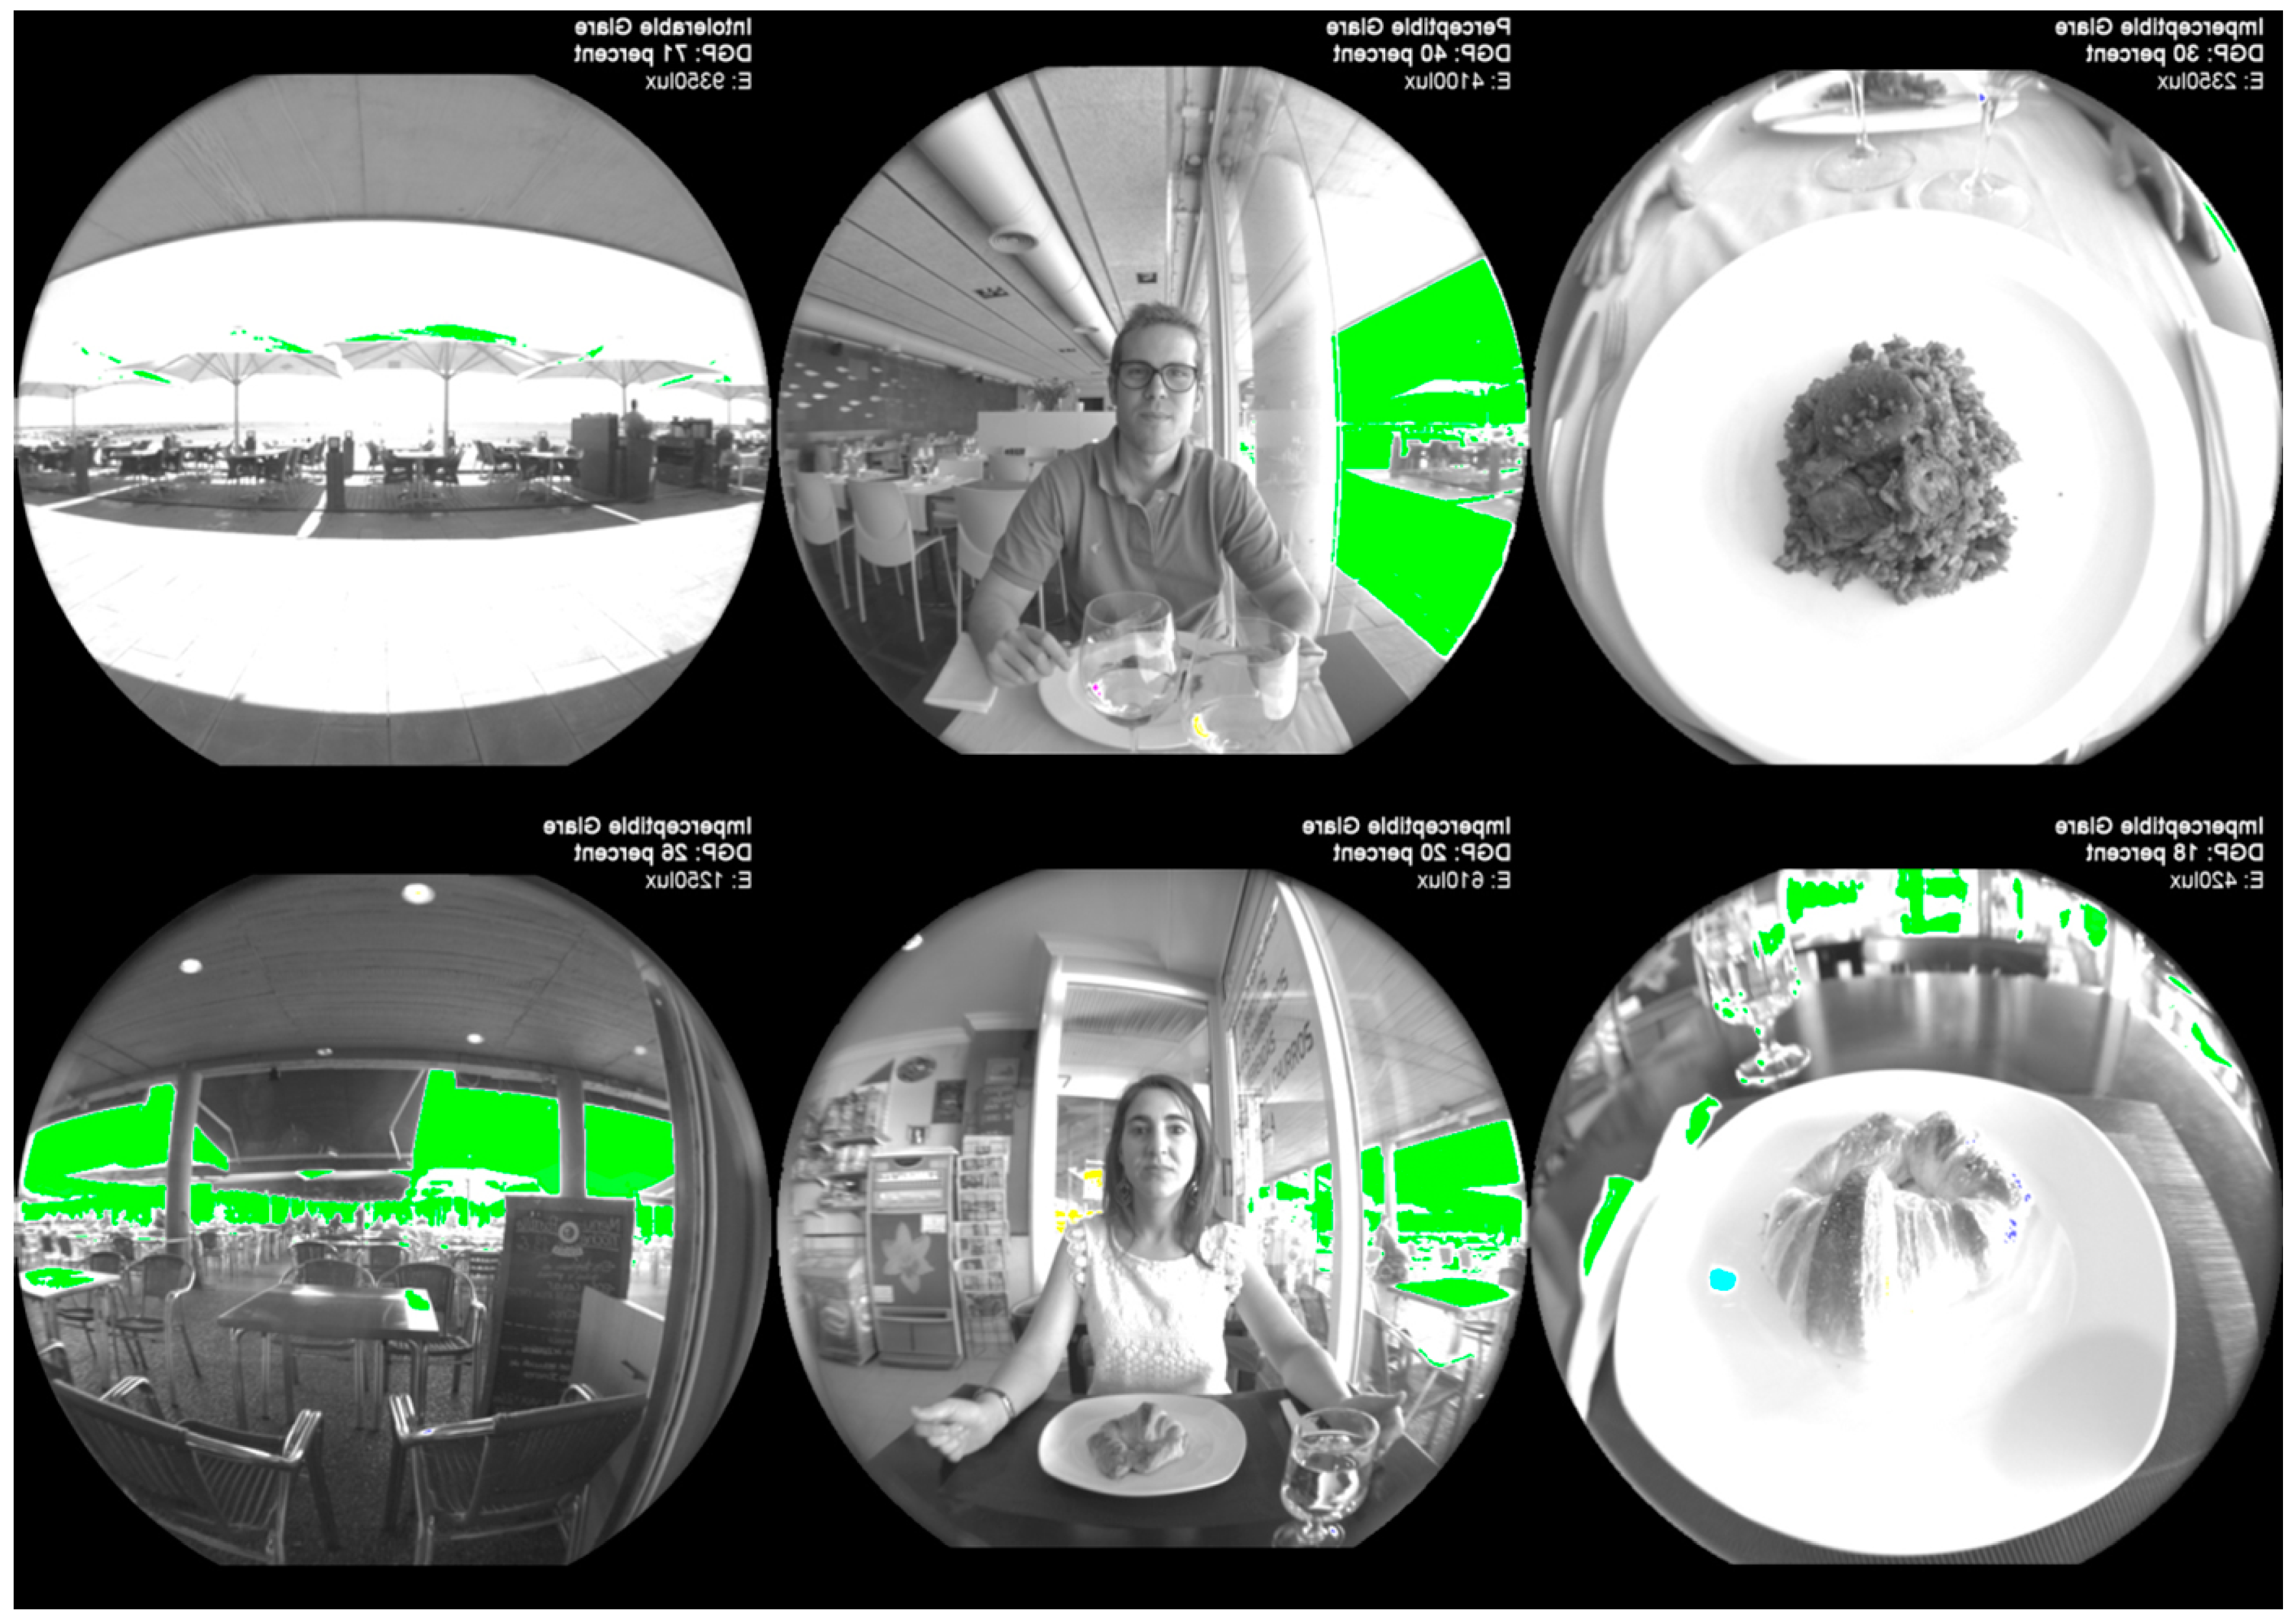
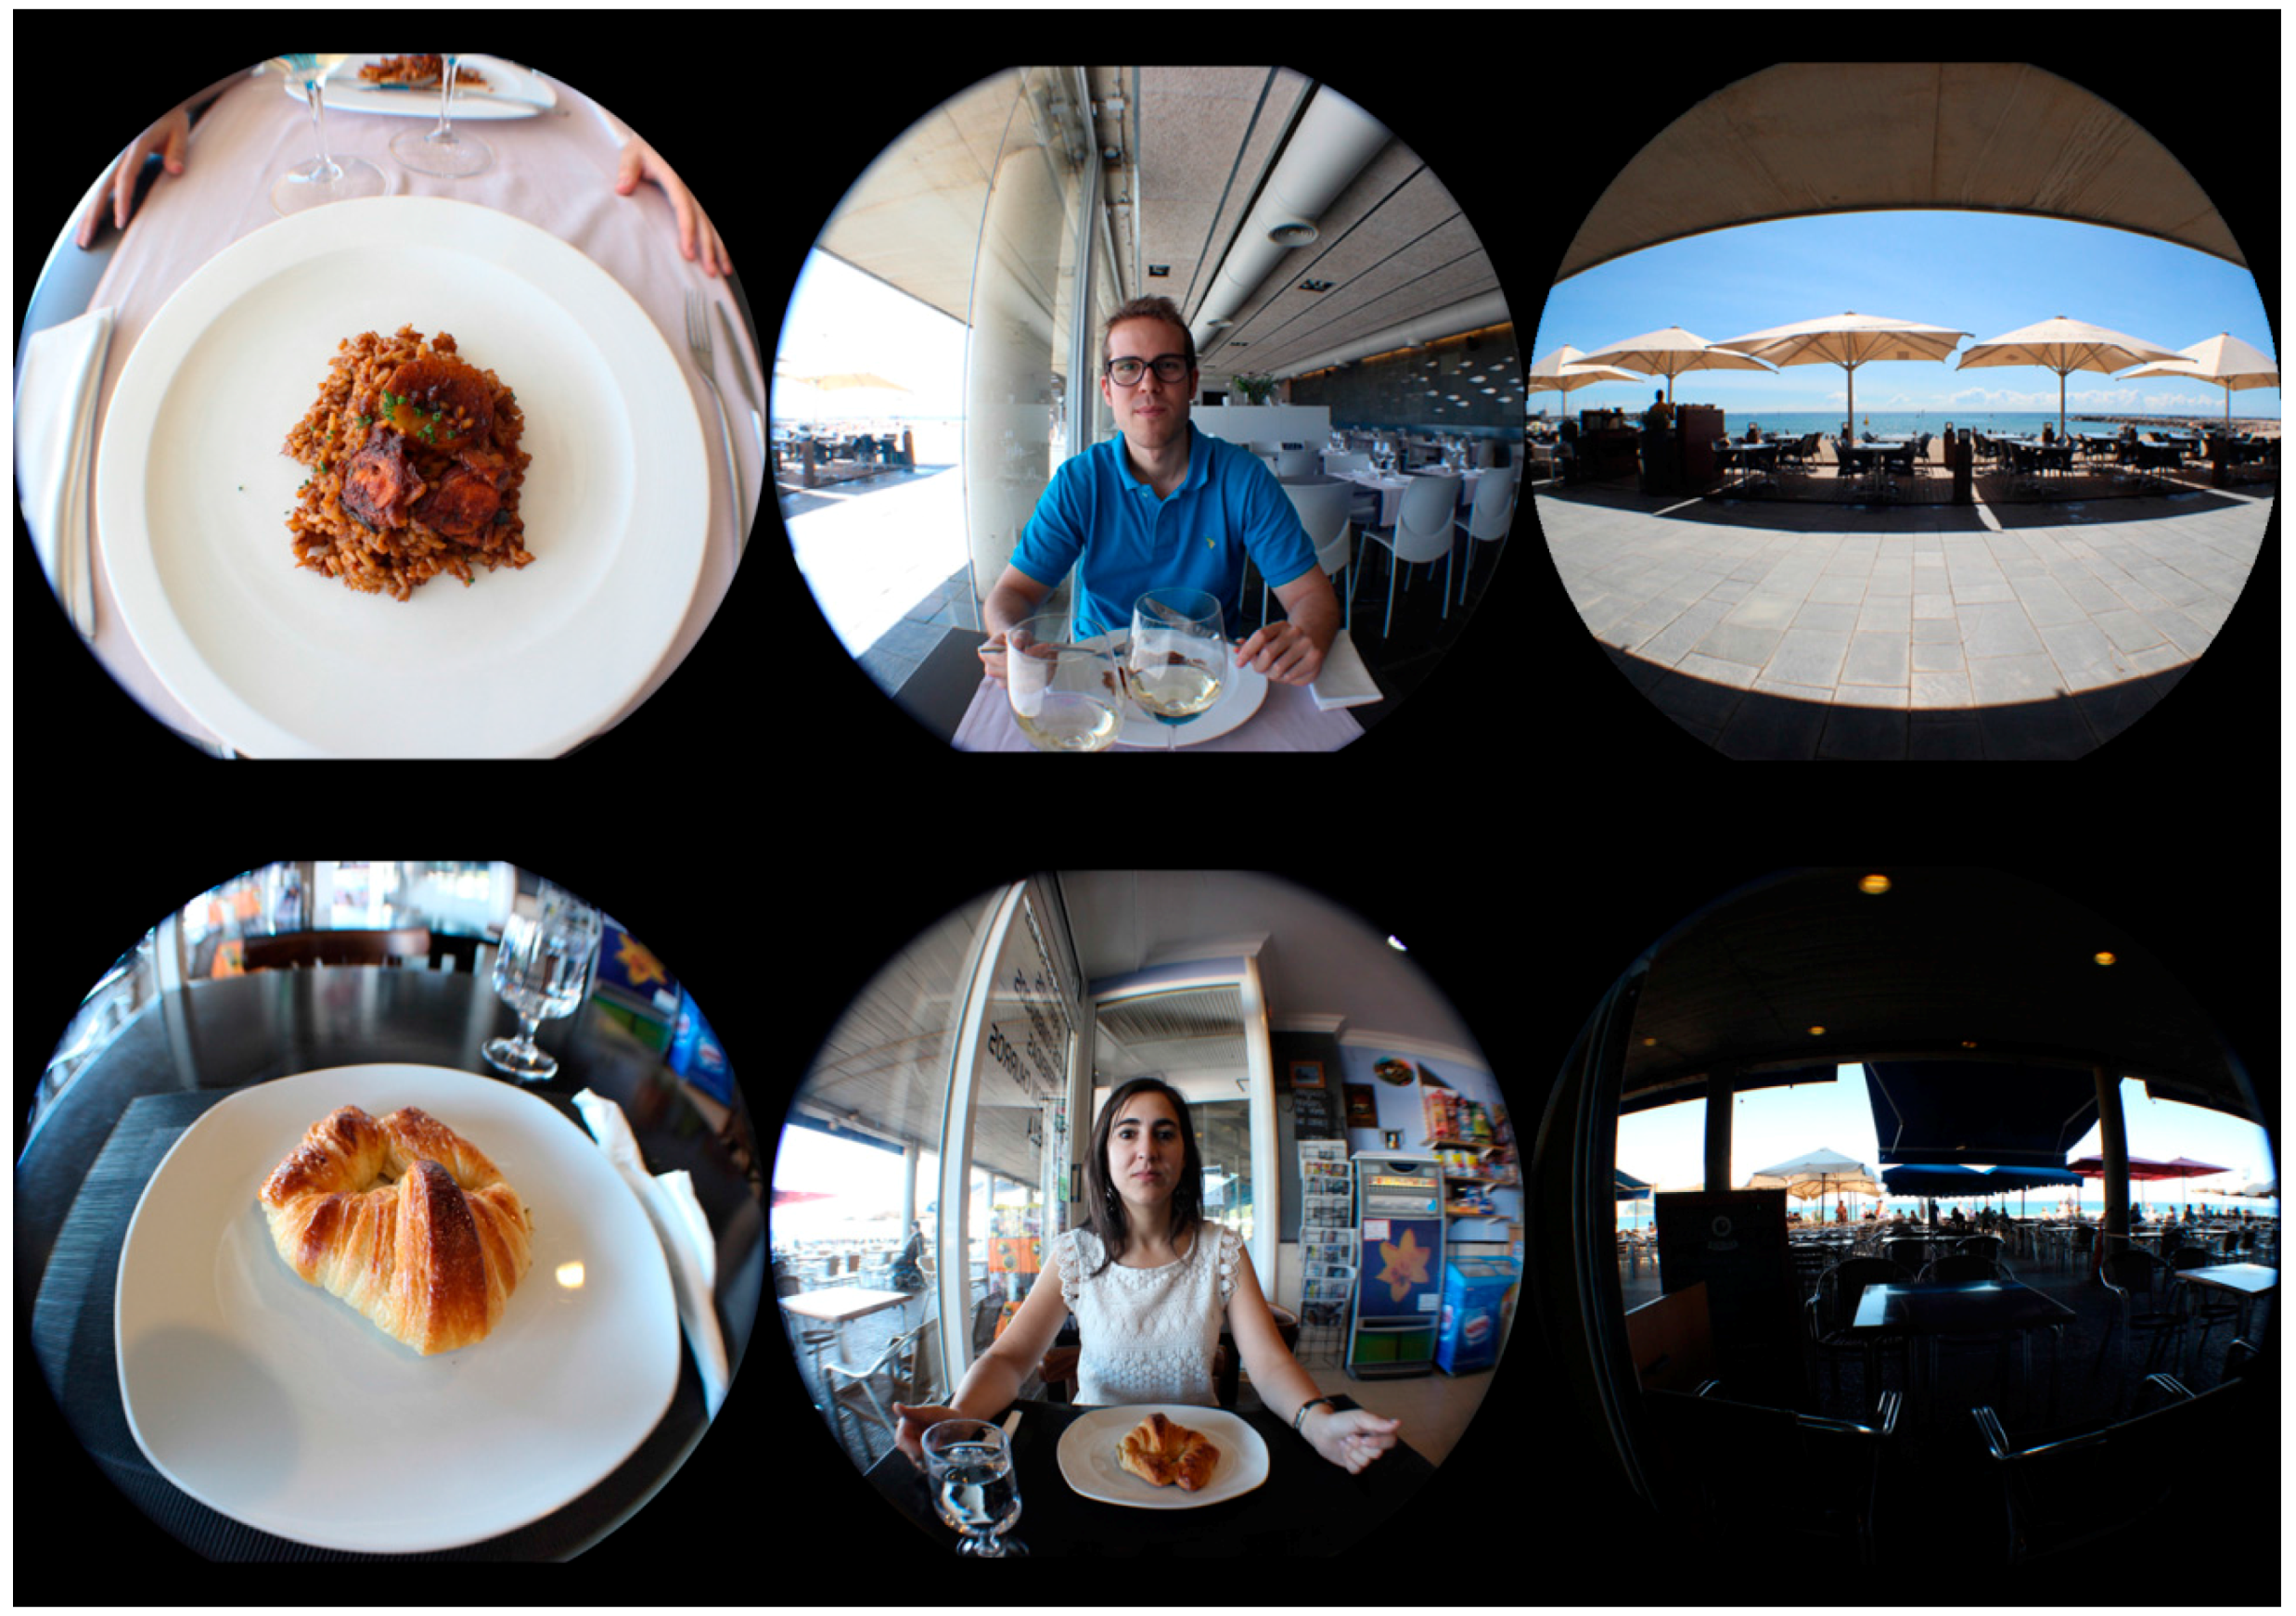
Three pictures have been analyzed as representative for each restaurant; in the first row, the Ca La Nuri restaurant (pictures taken in 21 July 2014 at 10:00 Solar Time with Clear Sky, lat. 41.3° N long. 2° E), and in the next row, the Beach restaurant (pictures taken in 8 September 2015 at 10:00 Solar Time with Clear Sky, lat. 43° N long. 2° W). Each picture corresponds to each workplane (see
Figure 5); the left ones to the first workplane, the table through the down view; the middle ones to the second workplane, the face through the front view; and the right ones to the third workplane, the window through the outside side-view.
The three workplanes, i.e., the table, the face, and the window of each restaurant have been tested with Evalglare, a Radiance-based tool for glare evaluation [
30]. Vertical illuminance data (in lx) of each workplane has been used as reference data. The DGP index of each view has been compared to attain the overall glare perception. Note that the window workplane DGP value tends to be slightly overestimated because the DGP index is used for an indoor luminance range.
Finally, for each photograph glaring source surfaces are detected, which were used to obtain the DGP index and to show which surfaces need to be studied for glaring (see
Table 3 and
Figure 5).
3.3. Spatial Contrast
The bright contrast of one scene, as illuminance data on surfaces, is another parameter that contributes to glaring. However, the geometry and dimension of this contrast in the space have different perception results. The spatial contrast describes the local contrast according to pixel number and contrasting neighboring pixels.
Sometimes the classical high contrast perception concept [
32] is not as disturbing as many high local bright contrasts. This means that many different brightness details can bring a higher perception of disturbance [
33]. As a consequence, the spatial contrast could work as an information content indicator in the area.
Therefore, the front view has been selected because it is the scene that better sums up the workspace. The front picture of each restaurant is divided into three horizontal equal parts, the bottom part, the central part, and the top part. From each part, the relation between the pixel brightness was studied, as described in
Table 4.
3.4. Indicative Survey
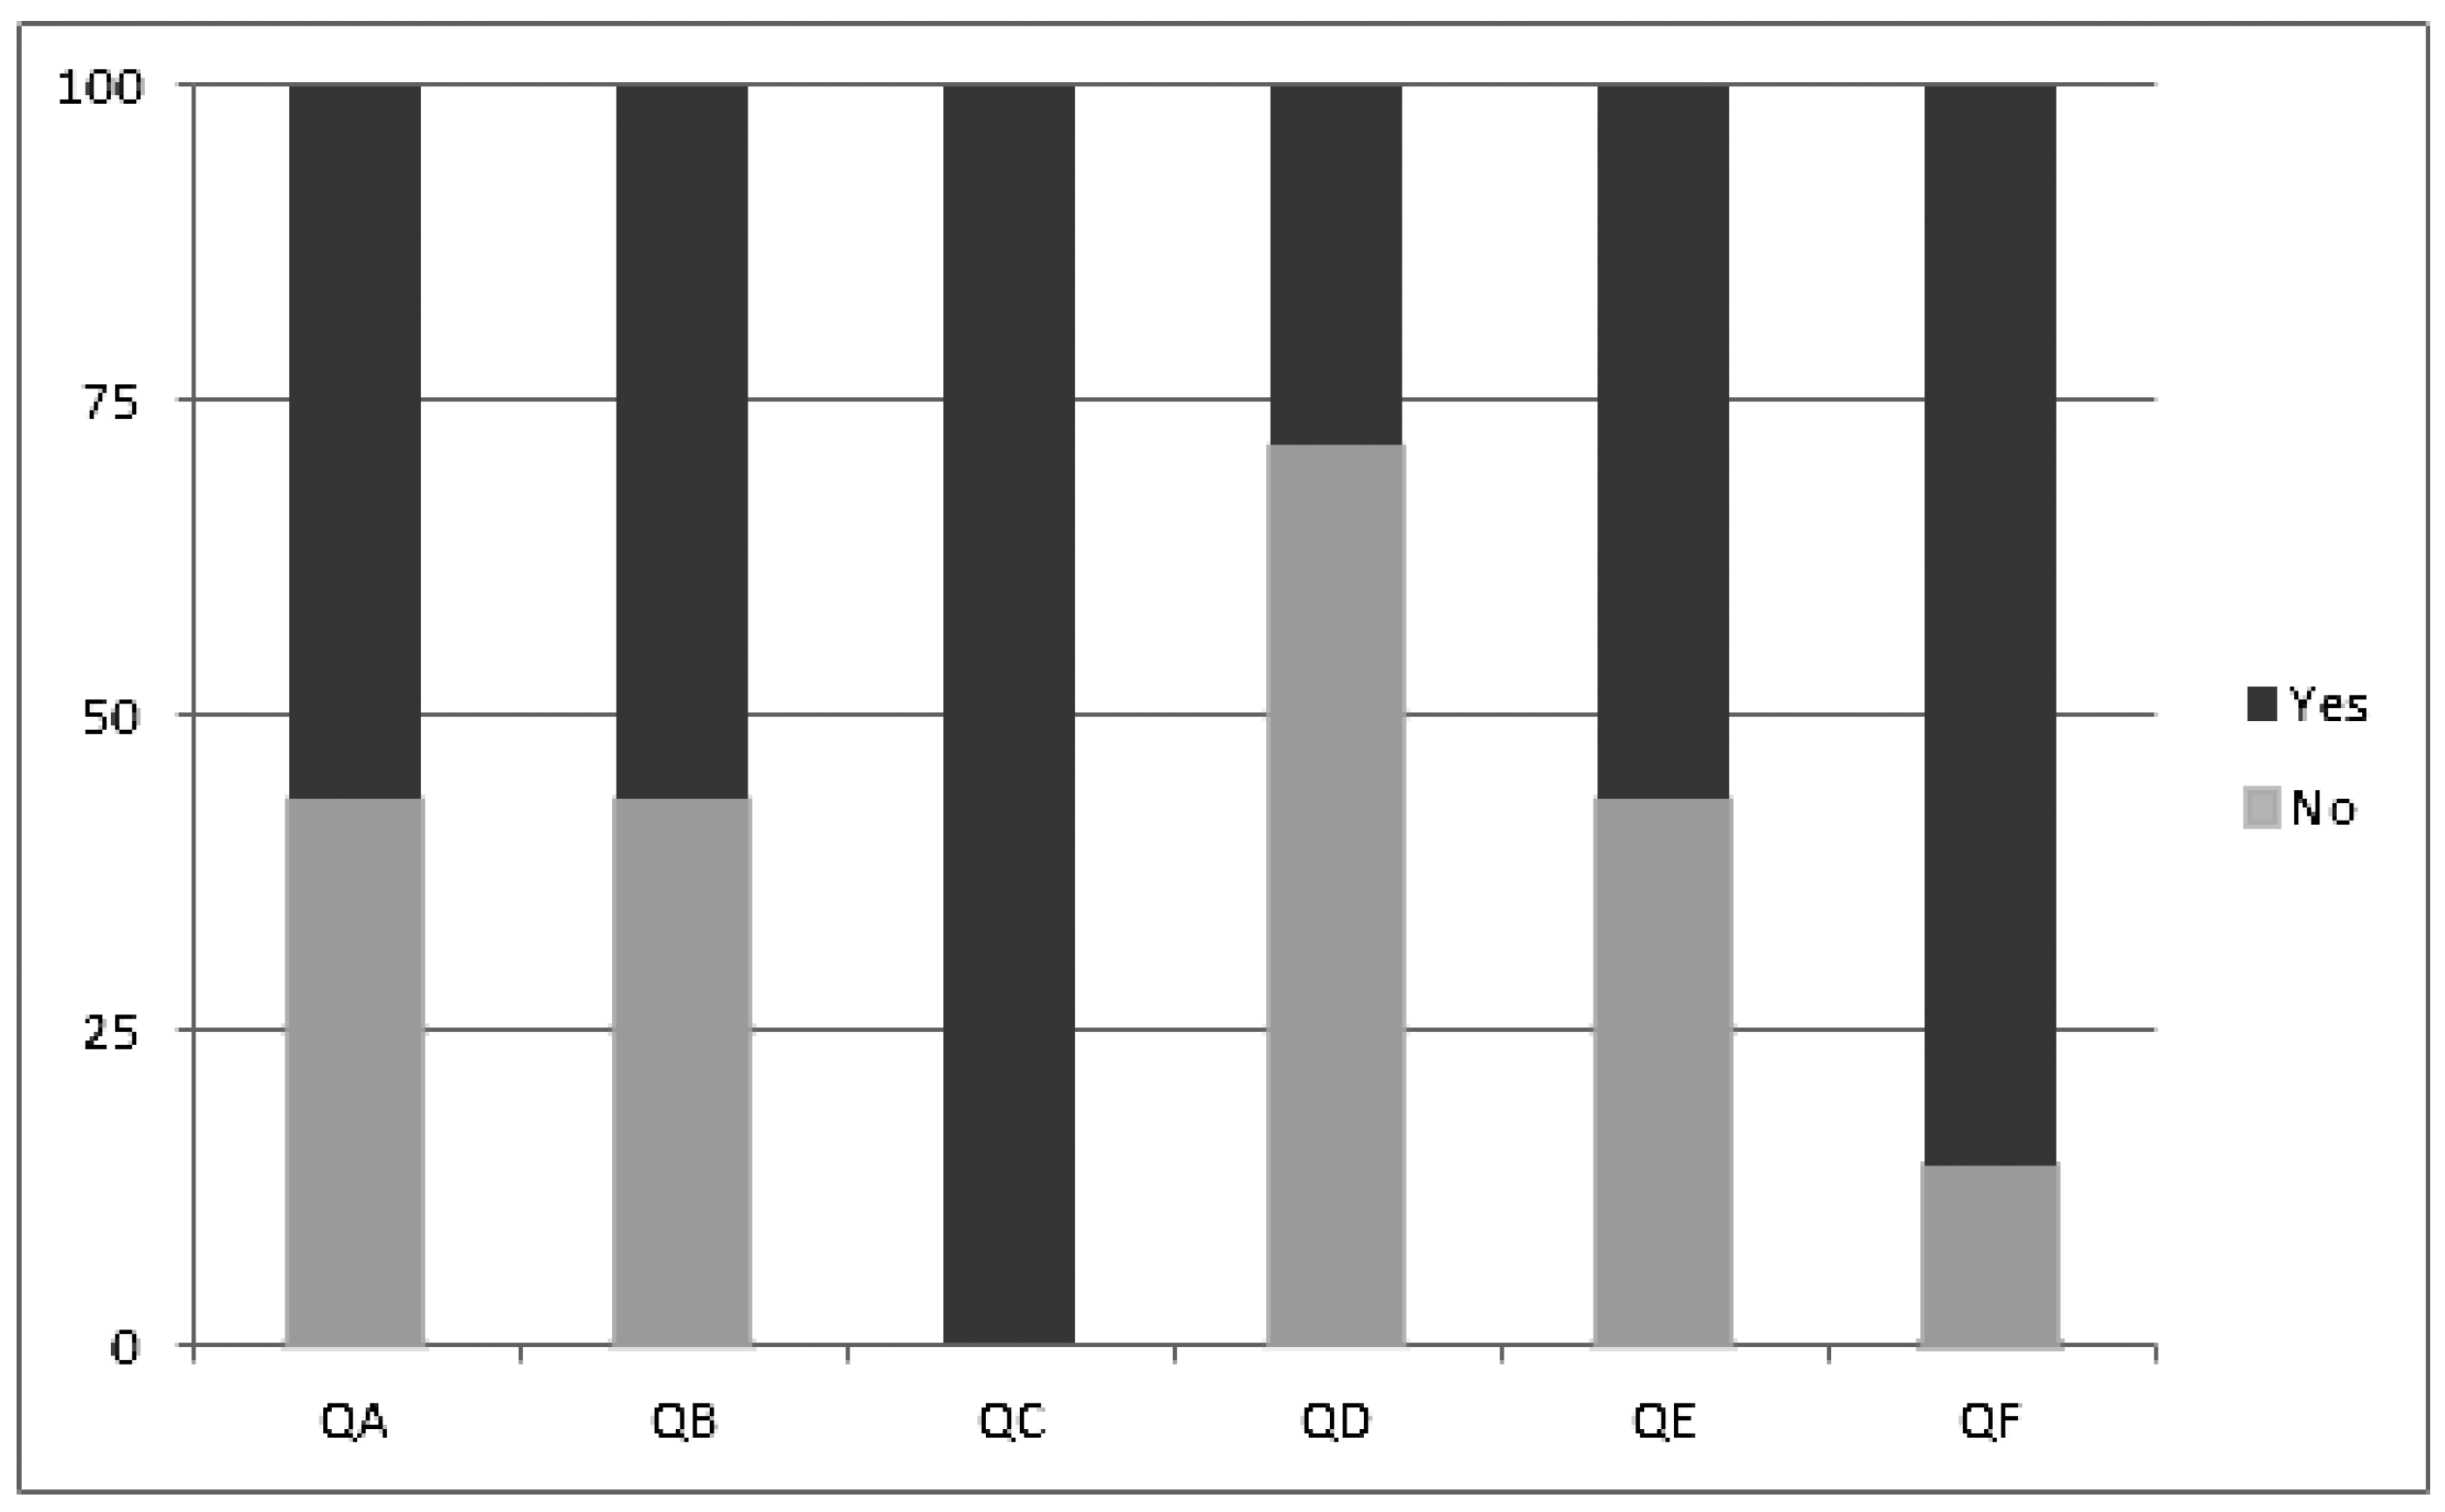
As a precursory survey, eight people were polled at the restaurants; four women aged 25–35, and four men, two aged 30–35 and two aged 50–55. The surveyed were seated at a table next to the glazed façade, in the same position and with the workplanes defined previously. They were asked the following questions: QA: Does the outside view disturb you? QB: Does the front and outside view interaction disturb you? QC: Is there a high contrast between outside and inside lighting? QD: Are you able to see a clear outside view? QE: Are there undesirable visual elements in the outside view? QF: Do you think you would have more concentration and privacy with a less outside luminance (brightness) and fewer visual elements? (see
Figure 6)
4. Results
The explanation of the results will follow in the preceding steps: recognition, DGP index and glare sources, spatial contrast, and surveys.
Both case studies are recognized as restaurants. In addition, accoding to MIT Scene Recognition Demo online application the analysed pictures have the following SUN scene attributes: working, research, stressful, socializing, glass, and natural light. Thus, they are related to the workplanes selected, the DGP, and the spatial contrast. The most information content used by the tool is gathered from the central part of the pictures.
Regarding the DGP index, although it was made for other purposes such as offices and indoor luminance ranges, the index works to obtain the trend of glare prediction in restaurants. First, the DGP results of the Ca La Nuri workplanes are as follows: table: imperceptible glare; face: perceptible glare; window: intolerance glare (see
Figure 5). Thus, on the one hand, in the front view there is a low probability of glare. However, if a person moves toward the window, the glare probability will increase. On the other hand, the outside view is glaring. This makes sense because a high concentration level is required to define the atmosphere of the area. However, taking into account the adaptation from the front view, the perception of glare is significantly lower. Note that the cultural habits increase glaring tolerance. Accordingly, considering workplane combinations, the glaring prediction is approximates more to the glaring perception (see
Table 3). Therefore, in the overall visual field, there is a probability of glare (mean DGP 47%, disturbing), due to many large outside luminous surfaces. The main glare sources are the sky and reflections from the ground outside, although only the umbrellas are selected (see
Figure 5). Second, the DGP of the Beach workplanes are as follows: table: imperceptible glare; face: imperceptible glare; window: imperceptible glare (see
Table 3). Thus, there is a low probability of glare (mean DGP 21%, imperceptible). However, if there were less shading elements, the outside view would have some glaring probability as would the front view. In this case, the glare sources are also the sky and the ground outside (see
Figure 5).
With reference to spatial contrast, in both restaurants, at the central part of the picture of the second workplane according to the front view (see
Figure 5), there is more spatial contrast (see
Table 4). This means that it is the most heterogeneous part; as a result, that part has more information content. However, the standard deviation of the luminance is higher at the bottom part. Thus, the contrast is higher, but it is the most homogeneous part. There are large surfaces; the outdoor luminous ground and the indoor dark ground, with very different luminance values. It has a high contrast, but a low amount of information content. Finally, the top part has a low contrast between the clear sky and the luminous ceiling, as well as a low amount of information content.
As for the survey, taking into account that it is a preliminary pool, the results indicate that there is a high contrast between inside and outside lighting, causing glare probability. In addition, they demonstrate that there are undesirable visual elements. Lastly, people think that with less outside luminous surfaces and visual elements, they will have more concentration on activity and in consequence more privacy (see
Figure 6).
5. Discussion
The side-view could be an interesting aspect to take into account in daylighting studies in any location because it is part of the most common visual atmospheres of different activities.
The results of the recognition tool show that the atmosphere could be stressful, and it has features of working, researching, and socializing. These features do not seem to include quality concentration on the outside view, tasting, and chatting. In addition, the “glass” and “natural light” features are related to the studied context.
In the future, it will be interesting to test the following: first, regarding glaring methods, if glare methods are valid for side-views in the hotel industry and if adding an initial illuminance value and a required concentration level on the activity improves dynamic visual perception. There are some results about experimental researches on discomfort glare produced by daylight that discrepancies between comfort indexes [
34]. Second, if spatial contrast as the geometry and the dimensions of surface parameters and information content affect glaring, visual comfort, and thus concentration level. Third, to confirm if there is a quantitative relation between the central spatial contrast and the bottom and top parts according to the studied context, the table view, the face view, the window view, the glazed façade, the clear outdoor ground, the dark indoor ground, the clear ceiling, and the dining equipment. Fourth, confirm if there is a quantitative relation between the bottom luminance deviation and the top and central parts. Finally, if the glazed façades at restaurants can be split by separating the outside view from the lighting [
35] with the combination of windows and Complex Fenestration Systems [
36,
37,
38]. In order to achieve a balance between spatial contrast and light level. So, a balance between outside view, glare probability, spatial contrast, light level and concentration level on tasting and chatting [
39].
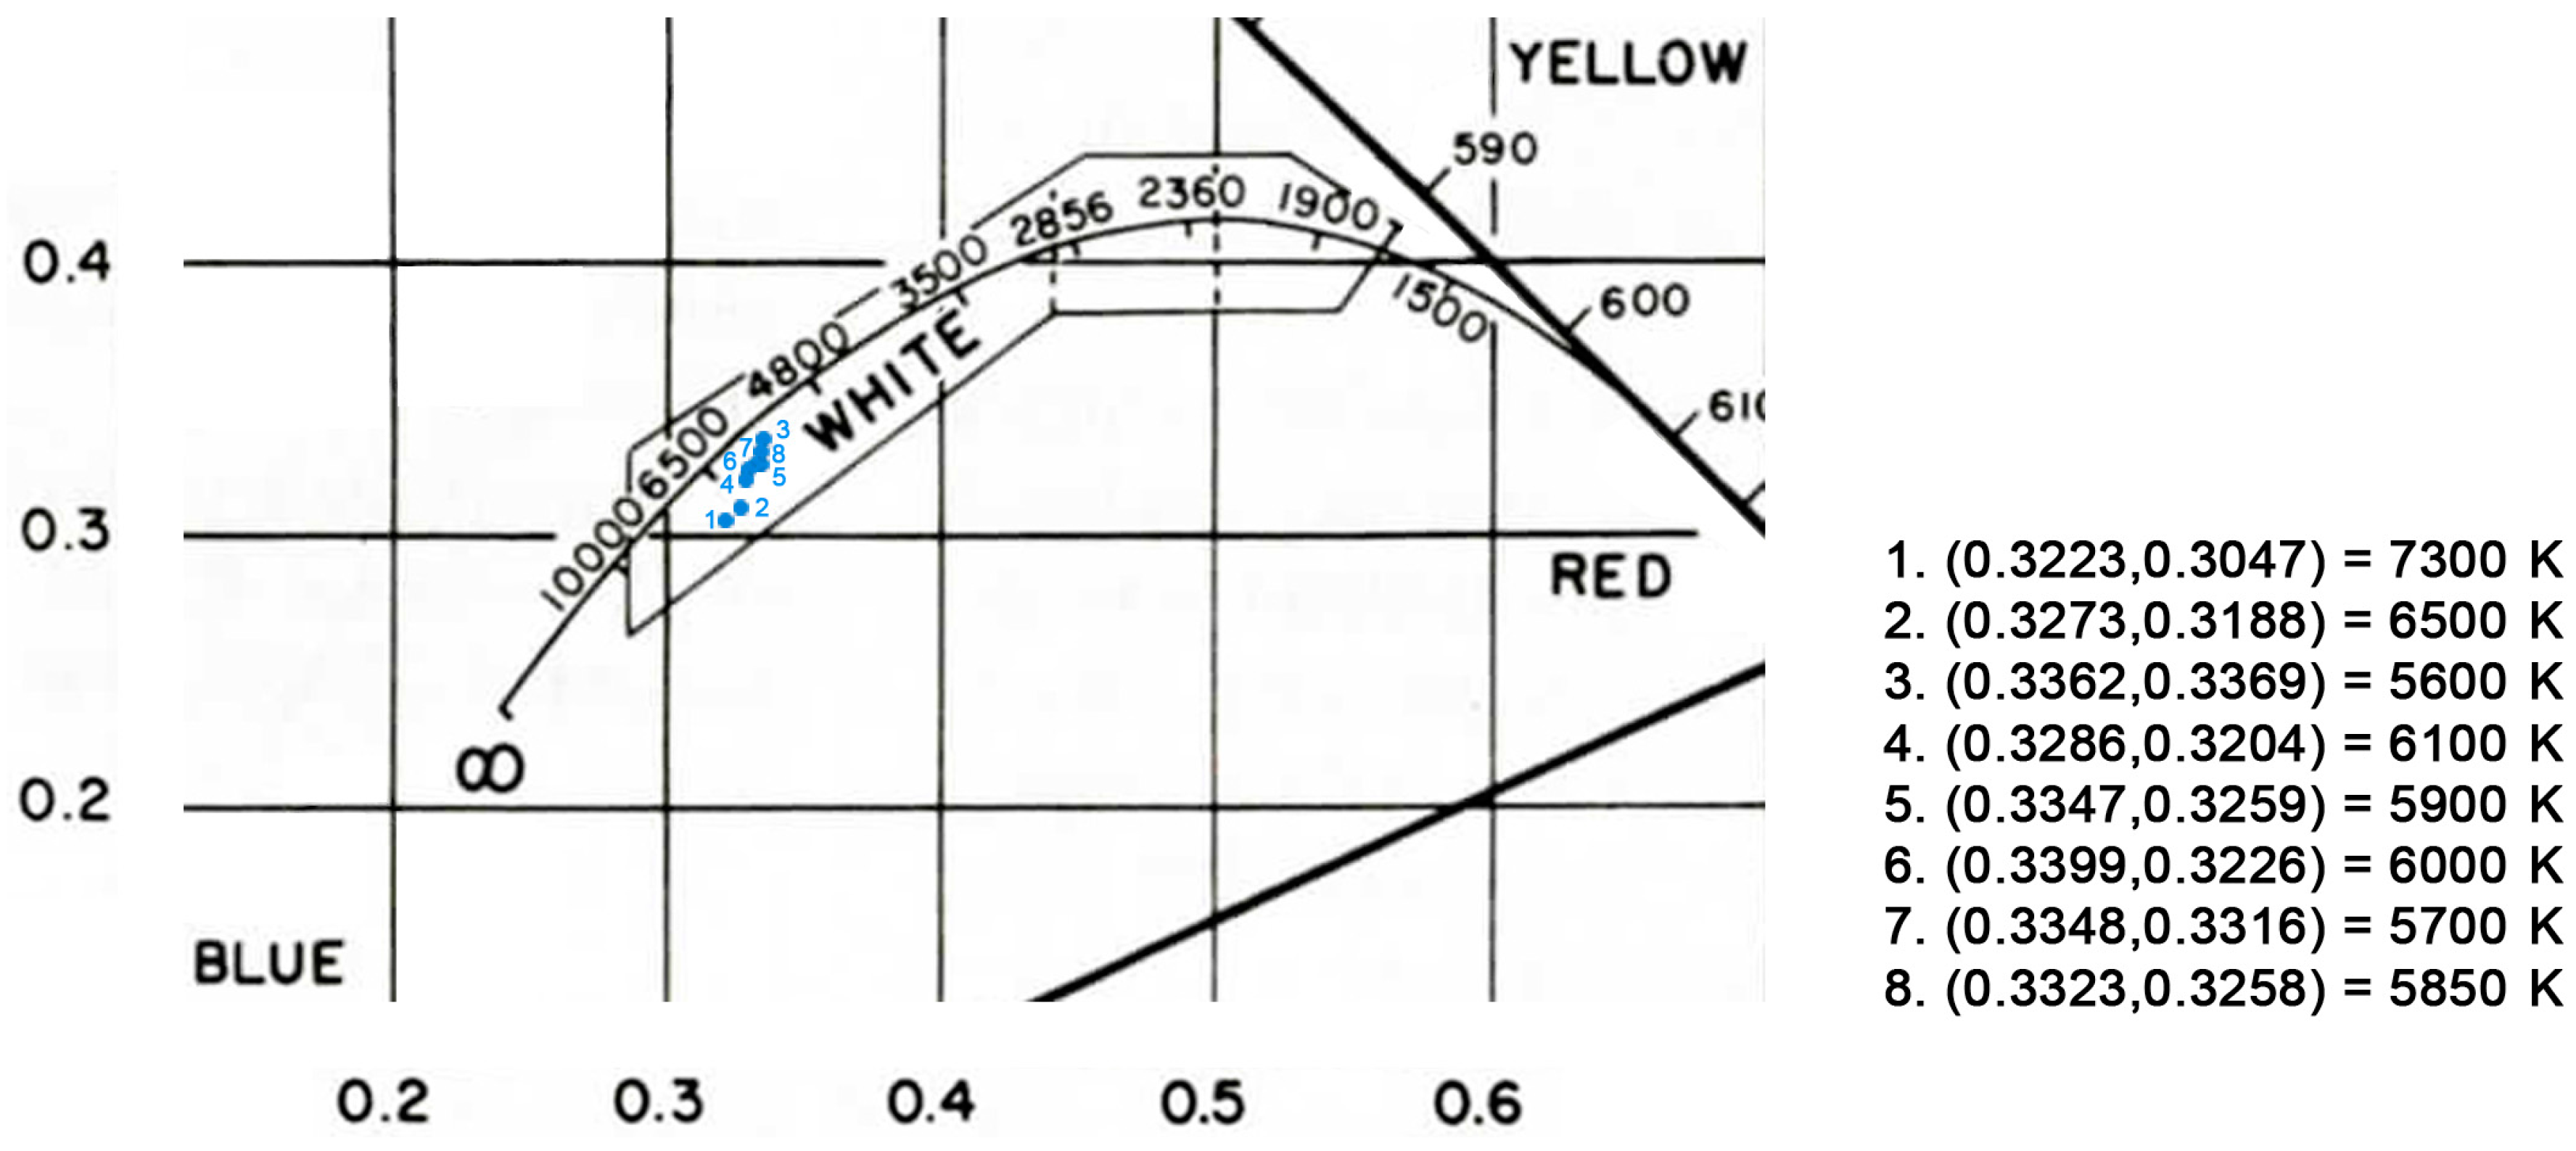
Add that apart of indoor and outdoor luminance contrast the color temperature of the light is another parameter that contributes to vision comfort [
40]. Usually with side-lighting without redirecting systems, the inside light perception is darker than the view through the window. Sometimes, with enough daylight level, users want to switch the electric lighting. However, it is not to increase the light level, it is insignificant compared with the daylight flux, but it is significant for the inside atmosphere (reddish). If inside facings are cool (bluish), as it is at midday, the daylighting color temperature is “bluish,” and the inside is dark, there can be no comfort vision according to Kruithof’s curve [
41,
42,
43]. In
Table 5, the mean RGB based on 255 and their CIE xy chromaticity values of the front view pictures are shown. The color temperature is obtained according to Planckian black-body radiators and the Planckian locus (see
Figure 7).
All CIE xy values are in the white color region with a mean of approximately 6150 K, and this colour temperature could be not comfortable for the Beach restaurant, although it is at the limit, with 420 lux at the table’s set point, but, for the Ca La Nuri restaurant, the ambience could be pleasant with 2350 lux according to the Kruithof curve. However, the comfort vision remains uncomfortable according to the background luminance, because the indoor dark depths could cause [
21] the perception of a gloomy atmosphere. In addition, in deep areas, the light level tends to be low, and, according to Kruithof’s curve, a low light level requires warm light for a comfortable appearance. Warming the overall space could be achieved with a more comfortable visual perception. In addition, it seems that customers like a more warm food color [
45]. However, in other particular contexts, the cool color of the food could be ordered. Thus, color management could give users satisfaction and vision comfort with low energy consumption [
46,
47]. Thus, in the future, it will be interesting to analyze this parameter. Other wider surveys could help to test the visual perception results of the used methodology with more accuracy.
6. Conclusions
In any location, in an outdoor midday high luminance context, according to the spatial recognition results, the additional test of a recognition tool shows indications that the pictures have a “working” semantic category and a “stressful” scene attribute. Therefore, studied highly glazed façades could tend to provide fraught atmospheres. It would be useful for some stimulating activities; however, for calm restaurants, which offer tasting menus with quality food, it seems that the studied highly glazed façades may not be very suitable. The information content could be an interesting aspect to consider in future studies. The formal composition of building façades, including restaurant façades and other activities, should take this into account, i.e., a recommendation for the design aspects of highly glazed façades emerge from here.
The daylight glare probability index could be useful for glare prediction in the hotel industry. In the studied context, there is a correlation between vertical illuminance and visual luminance owing to the highly glazed façade light performance. Therefore, the DGP results cohere. On the one hand, next to the south glazed façade, there is a high probability of glare, whereas, in the north orientation, there is a lower glare probability. In both, the exterior horizontal surfaces, the outside ground, and the sky are the most probable glare sources (see
Figure 5). On the other hand, in both climates, there is notable spatial contrast (see
Table 4) and, as a result, a high content information probability. According to the results of the recognition tool, the central part of the pictures contains the most relevant information.
Regarding perception, taking into account the activity of users, with the adoption of three workplanes, the overall glare perception could change; as a result, glare probability tended to be lower. According to mean DGP, the perception of intolerant glare probability for the third workplane of the outside view through the window in the Ca La Nuri restaurant is reduced. The mean DGP is close to the disturbing glare probability, due to the contribution of the intermediate front view workplane’s DGP. In spite of a high demand from the hotel industry, the tolerance for light comfort is relatively high. A dining atmosphere with a highly glazed façade seems that it does not very properly offer an optimal visual comfort with a clear outside view and an adequate concentration level on tasting and chatting. In conclusion, the required concentration level on the activity, the initial luminance value and thus the initial illuminance data, and the spatial contrast could be interesting indicators to consider in daylight glare methods. This study could be useful for other activities that require three workplanes, namely, a down view (e.g. tablet/paper), a front view (e.g. person), and a far view (e.g. entrance).
It seems that, as a next step, a side-window that provides a framed outdoor side-view and fewer outdoor luminous surfaces could decrease glare probability, undesirable elements, spatial contrast, and information content, and could increase the concentration level probability and privacy. Complex fenestration systems could increase indoor light levels and decrease the light contrast. Less but better distributed light, providing an accurate illuminance value to each workplane, would help to improve the indoor atmosphere. Color temperature could improve visual comfort as well. The three systems could help to keep comfort with low energy consumption. For future studies, a split façade could provide an accurate atmosphere with a side-view under outdoor midday high luminance and a lower probability of glare. Note that the bounded side-view could cause a greater local contrast due to an unchanged high outdoor luminance. However, an accurate side-view size and direction, according to the user’s point of view, could provide a nice outdoor view and a light and comfortable atmosphere and maintain a good concentration level.
Acknowledgments
The authors are grateful to the teams of the MIT Space Recognition in line demo software, the WebHDR online software, and the DGP index for facilitating access to the tools. U. U. acknowledges M. Bodart and C. Cauwerts of the Architecture et Climat research team of the Université Catholique de Louvain for hosting and offering the means for many of the calculations. Thanks are given to the Restaurant Association and to the cooperation of the analyzed restaurants. This work has been supported by the PhD training program of the Basque Government and the Spanish MICINN under project ENE2009-11540. Part of this work is part of the PhD. Thesis of U.U.
Author Contributions
All the authors contributed equally to the article. J.L.Z., R.J.H., and U.U. designed the study of patterns at restaurants; U.U. performed the study, took the pictures, calculated the Daylight Glare Probability, and conducted the survey; A.I. calculated spatial contrast, chromaticity values, and considered scene recognition software; U.U. wrote the article and extracted the conclusions in collaboration with all other authors.
Conflicts of Interest
The authors declare no conflict of interest.
References
- González, J.; Fiorito, F. Daylight design of office buildings: optimisation of external solar shadings by using combined simulation methods. Buildings 2015, 5, 560–580. [Google Scholar] [CrossRef]
- Konis, K. Evaluating daylighting effectiveness and occupant visual comfort in a side-lit open-plan office building in San Francisco, California. Build. Environ. 2013, 59, 662–677. [Google Scholar] [CrossRef]
- Silvester, J.; Konstantinou, E. Lighting, Well-Being and Performance at Work; Centre for Performance at Work, City University London: London, UK, 2010. [Google Scholar]
- Taylor, S.E.; Fiske, S.T. Salience, attention, and attribution: top of the head phenomena. Adv. Exp. Soc. Psychol. 1978, 11, 249–288. [Google Scholar]
- Fontoynont, M.; Ramananarivo, K.; Soreze, T.; Guldhammer, S.K. Economic feasibility of maximising daylighting of a standard office building with efficient electric lighting. Energy Build. 2016, 110, 435–442. [Google Scholar] [CrossRef] [Green Version]
- Irulegi, O.; Torres, L.; Serra, A.; Mendizabal, I.; Hernández, R. The Ekihouse: An energy self-sufficient house based on passive design strategies. Energy Build. 2014, 83, 57–69. [Google Scholar] [CrossRef]
- Zumthor, P. Atmospheres: Architectural Environments, Surrounding objects; Birkhäuser: Basel, Switzerland, 2006. [Google Scholar]
- Caminada, G.A. Cul Zuffel e L’aura Dado; Quart Luzern: Luzern, Switzerland, 2005. [Google Scholar]
- Byrd, H. Post-occupancy evaluation of green buildings: The measured impact of over-glazing. Archit. Sci. Rev. 2012, 55, 206–212. [Google Scholar] [CrossRef]
- Heung, V.; Gu, T. Influence of restaurants atmospherics on patron satisfaction and behavioral intentions. Int. J. Hosp. Manag. 2012, 31, 1167–1177. [Google Scholar] [CrossRef]
- Ariffin, H.F.; Bibon, M.F.; Abdullah, R.P.S.R. Restaurant’s atmospheric elements: What the customer wants. Procedia–Soc. Behav. Sci. 2012, 38, 380–387. [Google Scholar] [CrossRef]
- Young, S.J.; Young, Y.G.; Tai, K.J. View types and luminance effects on discomfort glare assessment from windows. Energy Build. 2012, 46, 139–145. [Google Scholar]
- Altomonte, S.; Ken, M.G.; Tregenza, P.R.; Wilson, R. Visual task difficulty and temporal influences in glare response. Build. Environ. 2016, 95, 209–226. [Google Scholar] [CrossRef]
- Wienold, J. Daylight Glare in Offices. Ph.D. Thesis, Universität Karlsruhe, Karlsruhe, Germany, 2009. [Google Scholar]
- Napier, J. Climate based façade design for business buildings with examples from central London. Buildings 2015, 5, 16–38. [Google Scholar] [CrossRef]
- Trubiano, F. Performance based envelopes: A theory of spatialized skins and the emergence of the integrated design professional. Buildings 2013, 3, 689–712. [Google Scholar] [CrossRef]
- Wardono, P.; Hibino, H.; Koyama, S. Effects of interior colors, lighting and decors on perceived sociability, emotion and behavior related to social dining. Procedia–Soc. Behav. Sci. 2012, 38, 362–372. [Google Scholar] [CrossRef]
- MIT Scene Recognition Demo. Available online: http://places.csail.mit.edu/demo.html (accessed 24 March 2016).
- Hopkinson, R.G. Glare for daylighting in buildings. Appl. Ergon. 1972, 3, 206–215. [Google Scholar] [CrossRef]
- Chauvel, P.; Collins, J.B.; Dogniaux, R.; Longmore, J. Glare from windows: current views of the problem. Light.Res. Technol. 1998, 30, 89–93. [Google Scholar] [CrossRef]
- Hirning, M.B.; Isoardi, G.L.; Garcia-Hansen, V.R. Prediction of discomfort glare from windows under tropical skies. Build. Environ. 2016. [Google Scholar] [CrossRef]
- Wienold, J.; Christoffersen, J. Evaluation methods and development of a new glare prediction model for daylight environments with the use of CCD cameras. Energy Build. 2006, 38, 743–757. [Google Scholar] [CrossRef]
- Uriarte, U.; Hernández, R.J.; Zamora, J.L. Light and outside vision at restaurants. In Proceedings of the 10th Conference on Advanced Building Skins, Bern, Switzerland, 3–4 November 2015.
- Rockcastle, S.; Andersen, M. Measuring the dynamics of contrast and daylighting variability in architecture: A proof-of-concept methodology. Build. Environ. 2014, 84, 320–333. [Google Scholar] [CrossRef]
- Aguilar, A.; Uriarte, U.; Isalgue, A.; Coch, H.; Serra, R. Luminances and vision related to daylighting. In Proceedings of the World Renewable Energy Forum (WREF), Denver, CO, USA, 13–17 May 2012.
- Ruggiero, F.; Serra, R.; Dimundo, A. Re-interpretation of traditional architecture for visual comfort. Build. Environ. 2009, 44, 1886–1891. [Google Scholar] [CrossRef]
- Einhorn, H.D. A new method for the assessment of discomfort glare. Light.Res. Technol. 1969, 1, 235–247. [Google Scholar] [CrossRef]
- Yamin Garretón, J.A.; Rodriguez, R.G.; Ruiz, A.; Pattini, A.E. Degree of eye opening: A new discomfort glare indicator. Build. Environ. 2015, 88, 142–150. [Google Scholar] [CrossRef]
- Karlsen, L.; Heiselberg, P.; Bryn, I.; Johra, H. Verification of simple illuminance based measures for indication of discomfort glare from windows. Build. Environ. 2015, 92, 615–626. [Google Scholar] [CrossRef]
- Reinhart, C.F.; Wienold, J. The daylighting dashboard—A simulation based design analysis for daylit spaces. Build. Environ. 2011, 46, 386–396. [Google Scholar] [CrossRef]
- WebHDR. Available online: http://www.jaloxa.eu/webhdr/index.shtml (accessed on 29 January 2016).
- Osterhaus, W.K.E. Discomfort glare assessment and prevention for daylight applications in office environments. Sol. Energy 2005, 79, 140–158. [Google Scholar] [CrossRef]
- Kim, W.; Tae, A.H.; Tai, K.J. A first approach to discomfort glare in the presence of non-uniform luminance. Build. Environ. 2008, 43, 1953–1960. [Google Scholar] [CrossRef]
- Bellia, L.; Fragliasso, F.; Stefanizzi, E. Daylit offices: A comparison between measured parameters assessing light quality and users’ opinions. Build. Environ. 2016. [Google Scholar] [CrossRef]
- Konis, K.; Lee, E.S. Measured daylighting potential of a static optical louver system under real sun and sky conditions. Build. Environ. 2015, 92, 347–359. [Google Scholar] [CrossRef]
- Ruck, N.; Aschehoug, O.; Aydinli, S.; Christoffersen, J.; Edmonds, I.; Jakobiak, R.; Kischkoweit-Lopin, M.; Klinger, M.; Lee, E.; Courret, G.; et al. Daylight in Buildings: A Source Book on Daylighting Systems and Components; A Report of IEA SHC Task 21; ECBCS Annex 29: Berkeley, CA, USA, 2000. [Google Scholar]
- Linhart, F.; Scartezzini, J.-L. Minimizing lighting power density in office rooms equipped with anidolic daylighting systems. Sol. Energy 2010, 84, 587–595. [Google Scholar]
- Selkowitz, S.; Lee, E.S. Advanced Fenestration Systems for Improved Daylight Performance. In Proceedings of the Daylighting’ 98 Conference, Ottawa, ON, Canada, 10–13 May 1998.
- Hoffmann, S.; Lee, E.S.; McNeil, A.; Fernandes, L.; Vidanovic, D.; Thanachareonkit, A. Balancing daylight, glare, and energy-efficiency goals: An evaluation of exterior coplanar shading systems using complex fenestration modeling tools. Energy Build. 2016, 112, 279–298. [Google Scholar] [CrossRef]
- Bodart, M.; Peñaranda, R.; Deneyer, A.; Flamant, G. Photometry and colorimetry characterisation of materials in daylighting evaluation tools. Build. Environ. 2008, 43, 2046–2058. [Google Scholar] [CrossRef]
- Kruithof, A.A. Tubular luminescence lamps for general illumination. Philips Tech. Rev. 1941, 6, 65–96. [Google Scholar]
- Viénot, F.; Durand, M.-L.; Mahler, E. Kruithof’s rule revisited using LED illumination. J. Mod. Opt. 2009, 56, 1433–1446. [Google Scholar] [CrossRef]
- Talotte, C.; Ségrétain, S.; Gonac’h, J.; Le Rohellec, J. Improvement of lighting ambience on board trains: Experimental results on the combined effect of light parameters and seat colours on perception. In Proceedings of the 9th World Conference on Railway Research (WCRR), Lille, France, 22–26 May 2011.
- Wyszecki, G.; Stiles, W.S. Color Science: Concepts and Methods, Quantitative Data and Formulae; John Wiley & Sons, Inc.: New York, NY, USA, 1982. [Google Scholar]
- Okuda, S.; Okajima, K.; Arce-Lopera, C. Visual palatability of food dishes in color appearance, glossiness and convexo-concave perception depending on light source. J. Light Vis. Environ. 2015, 39, 1–7. [Google Scholar] [CrossRef]
- López-Besora, J.; Isalgué, A.; Coch, H.; Crespo, I.; Alonso, C. Yellow is green: An opportunity for energy savings through colour in architectural spaces. Energy Build. 2014, 78, 105–112. [Google Scholar] [CrossRef]
- Bodart, M.; De Herde, A. Global energy savings in offices buildings by the use of daylighting. Energy Build. 2002, 34, 421–429. [Google Scholar] [CrossRef]
© 2016 by the authors; licensee MDPI, Basel, Switzerland. This article is an open access article distributed under the terms and conditions of the Creative Commons Attribution (CC-BY) license (http://creativecommons.org/licenses/by/4.0/).


