Evaluation of Suitability of a Parametrically Controlled Louvers for Various Orientations throughout a Year Comparing to an Existing Case

Department of Architecture and Built Environment, University of Nottingham, University Park, Nottingham NG7 2RD, UK
*
Authors to whom correspondence should be addressed.
Buildings 2017, 7(4), 109; https://doi.org/10.3390/buildings7040109
Submission received: 31 August 2017
/
Revised: 11 October 2017
/
Accepted: 19 October 2017
/
Published: 29 November 2017
(This article belongs to the Special Issue Building Design and Daylighting Performance)
Abstract
:Nowadays, daylighting systems and shading devices are controlled automatically to achieve their optimum benefits. For more comprehensive accuracy, parametric control was recently used to manage complex parameters with more accuracy. Such a system was proposed and investigated in a previous research to provide steadier and more uniform daylight illuminance during the day and reduce more than 80% of the electricity consumption. This study is examining the daylighting performance by using the parametric system in different orientations and comparing with the conventional ones. Furthermore, the study will evaluate the suitability of the parametric system throughout the year during the working hours in a typical office room.
1. Introduction
Daylighting play an important role in our life, where it has a great influence on our health, moreover, it has a substantial effect on the energy consumption [1]. Daylight has an essential influence in saving energy especially the electrical lighting. For the human being, daylight has a clear leverage on our body clock and metabolism, and therefore it can affect our circadian cycle [2]. Accordingly, the availability of daylight can keep the occupants healthy and effective in their works. As well as for buildings, daylighting is a primary source of lighting and a special element in enhancing architecture [3], which is improved recently by using advanced tools, software, and innovative daylighting systems [4]. Such new systems are using several methods [5,6] based on different criteria, such as type of building, location, orientation, and climate changes [7].
Former studies and literatures investigated enhancing the daylight inside the buildings using static and automated tools [5,8]. These tools were dramatically based on redirecting sunlight inside the buildings, such as light-shelves [9] and Optical Louver System (OLS) [10], which is usually assembled in the clearstory windows and known as static systems. On the other hand, other systems were using dynamic tools to optimize the use of daylight via reacting to the sun movement in a Hilotropic response [11]. Such systems were responding to the sun movement to collect as much solar radiation as possible and deliver it inside the building [4], such as Himawari and SunPortal. Other systems were using mirrored tools, such as automated blinds, which also responding to the sun movement and redirecting the beams to specific targets over the ceiling [12,13], then the ceiling works as a source of light. Moreover, the automated blinds were investigated to optimize daylighting [8] and enhance thermal performance simultaneously, by controlling the rotation angles of the blinds with response to the sun movement [14]. Further researches investigated fenestration systems for the sake of providing diffuse light and redirection [15], for instance, perforated sheets were used for scattering the daylight, likewise, translucent materials [16] and prismatic panels [17]. These fenestration systems depend on distributing the daylight based on penumbra effect [18], scattering the daylight via using diffusing materials and redirecting attributes via using prismatic properties [19].
Our study will investigate the capability of providing daylight in an office room in different circumstances, by using a compatible daylighting system based on parametric control. Such system was investigated previously in a South oriented room in Egypt [8], and succeeded in providing more than 80% of daylight during the working hours. The current study will examine the performance of such system by using different orientations, and then investigate the efficiency of this system throughout the year during the working hours in the UK territory. The compatible daylighting system consists of three main tools; mirrored automated blinds for redirecting sake [20], electrochromic window for providing diffuse light [21] and the design of the ceiling.
The method of this study is based on parametric control by using an algorithmic software, known as Grasshopper [9], based on Rhinoceros 3D [10]. Grasshopper is a flexible algorithmic software that can deal with complex geometries. These geometries are connected together in a canvas shape, which controlled parametrically and simultaneously influenced by each other. Several softwares can be attached within Grasshopper as plugins. In our study, the plugins Ladybug and Honeybee were used as an engine for the well-known daylighting software RADIANC, DAYSIM, and EnergyPlus, which are connected together in a formula to perform the simulation. The imported data can have an influence on the whole parameters inside the formula, such as sun movement, orientation, time, and date, etc. The study will focus on the efficiency of provided daylighting by using this compatible system via analyzing multiple comparisons, which can reveal the amount of energy saved.
2. Methodology
The methodology depends on a comparison between the efficiency of two different systems; automated louvers based on parametric control and conventional louvers. The study aims to find the efficiency of the automated system regarding daylight performance and energy saving. The system was controlled parametrically using Grasshopper as a software based on Rhinoceros 3D. The daylight simulation was generated using Ladybug and Honeybee [11] as plugins in Grasshopper, where they are used as an engine for RADIANCE, DAYSIM, and EnergyPlus.
The system was assumed to be applied in Birmingham in the UK by using the EnergyPlus Weather (EPW) file, and comparing it with a conventional system in a standard office room. The conventional system is a static system that consists of external aluminum slats known as “louvers”, which arrayed vertically in a fixed sequence with zero tilt angle, where the distance between each slat is 15 cm with 1 cm thickness and 15 cm depth, and assembled outside of the window. The room dimensions are 18 m length and 8 m depth with 4 m height finish to finish. Global horizontal radiation was used for the examination as a source of solar radiation and Climate Based Sky was used for the sky type to create the real condition of the ambient, where, the sky is not expected to be clear during the year in this type of territory. The proposed system depends on two main sources of light; firstly, the direct light, which is coming from sun light with clear sky that should be exploited by the reflective louvers, and secondly, the diffused light coming from the sky dome and clouds that should be exploited by the window. While these all of these parameters are amenable, therefore, the whole system is responding parametrically to the climate changes aiming to achieve the optimum use of the daylight.
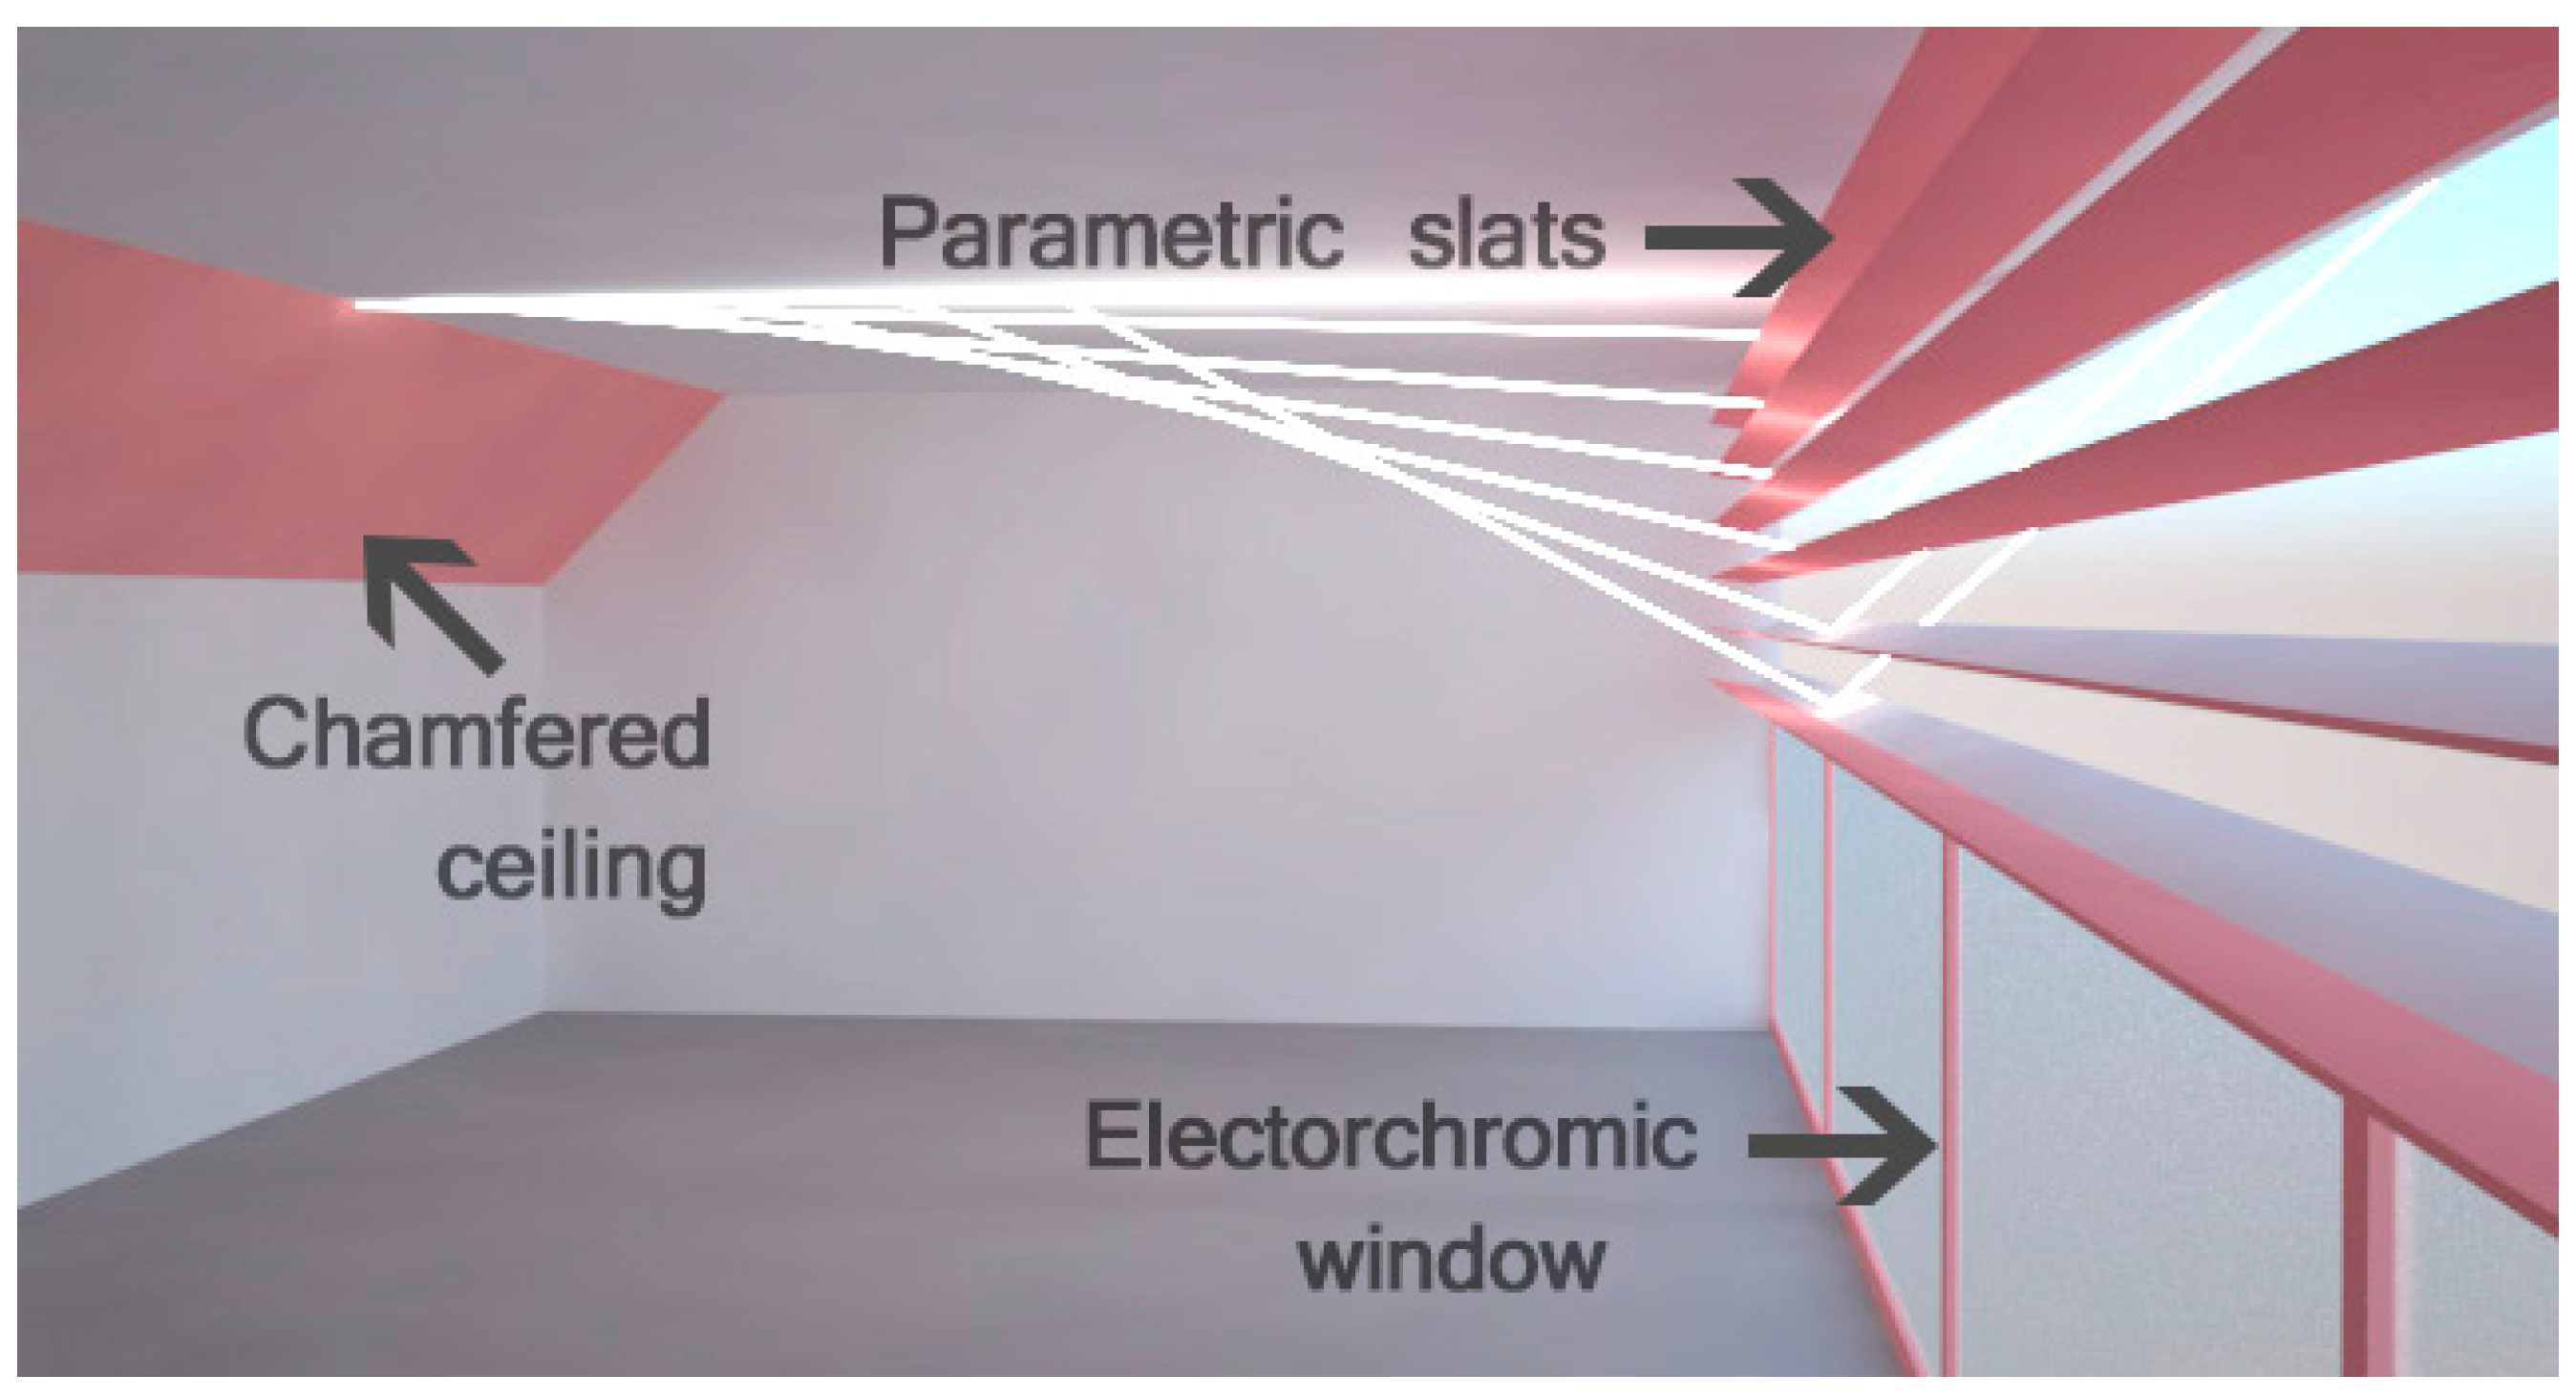
The proposed parametric system is using three main tools based on a previous study [8]. The first tool is the “mirrored louvers” with 75% reflectivity, which are used to redirect the sun light inside the deep room into specific targets over the ceiling, then the ceiling works as a source of light. The louvers respond parametrically to the sun movement during the daytime with a specific rotation angle for each single slat [20], which is the so-called parametric control. The louvers are located at the upper part of the window from the outside, with 2.2 m height from the floor. The second tool is the electrochromic window [22], located at the lower part of the window that is also controlled parametrically, based on the intensity of solar radiation [8] and used to provide the room with the needed diffuse light, valued between 300 and 500 lux. The diffuse light coming from the electrochromic window was amended by controlling the translucency value by using “Radiation Trans Material” as a component in Honeybee [23]. The last tool is the design of the ceiling [24] at the end of the room, which has a chamfered shape with 45° tilt angle. This chamfered ceiling was designed to redirect the reflected light from the louvers, in order to enhance the performance of daylight at the deep area of the room [8], see Figure 1.
Number of louvers were set to 10, with fixed distance between each base on the threshold height of 2.2 m. Each slat is 15 cm depth, 1 cm thickness, and 16 m width to cover the room façade. The system’s inclination angle was set vertically during the year. In some latitude ranges, in territories such as Egypt the whole system should be tilted in summer, where the sun in June at its zenith time reaches 83° which is almost vertical [25]. Therefore, in order to collect the sun rays, the whole system should be tilted 15° to achieve its convenience with the sun rays [20], see Figure 2. The system was fixed by two vertical rods with an upper rotation axis, which controlled by using automated mechanism. The reflected light over the ceiling were set to fixed targets where the closest target is 3 m away from the window and the farthest target is 7.4 m away from the window.
At the territory of the UK, when comparing to Egyptian territories, sun reaches its zenith on 21 June at 60.9° altitude, which is equal to September time in Egypt, as shown in Figure 2. Therefore, sunrays can be collected with no need to be tilted and thus can be kept in its vertical state.
In Section 3.3, the office room will be examined in different five orientations; on the West, Southwest, South, Southeast, and East by using unified criteria, as shown in Figure 3. The daylight performance test will be occurred on each orientation during the working hours from 9 a.m. to 5 p.m., on 21 of June, September and December, respectively. The test will measure the average coverage of daylight over the whole room area each hour in percentage, by using a 1 m2 grid of test points as a sensor at the desk level height 0.75 m, The experiment was set to count the test points which can reach a range between 300 and 500 lux in order to meet the human visual comfort [26]. Regarding to Chartered Institution of Building Services Engineers (CIBSE), a professional institution for lighting guide in the UK, which investigated the standards of daylighting levels, recommends a range of 300~500 lux for offices spaces [27]. A previous research [28] claims that due to occupants’ survey; the lighting level between 100 and 2000 lux can meet their comfort. However, our study will focus on using the lighting level standard of 300~500 lux, putting in consideration the potential effect of the contrast level and glare. Meanwhile, if we consider 100–2000 lux as a useful range for occupants, our study should be in the safe side.
In Section 3.4, the test will be occurred during the working hours from 9 a.m. to 5 p.m. throughout the year on the South orientation, by using parametric systems. The test will clarify the illumination average per unit area by using the radiation metrics Wh/m2. Then, the results will be compared to the standard radiation needed for the office room by using EnergyPlus capabilities, which calculates 4.8 Wh/m2 for the selected office room within the applied conditions.
3. Comparison Studies and Results
3.1. Daylight Coverage Analysis
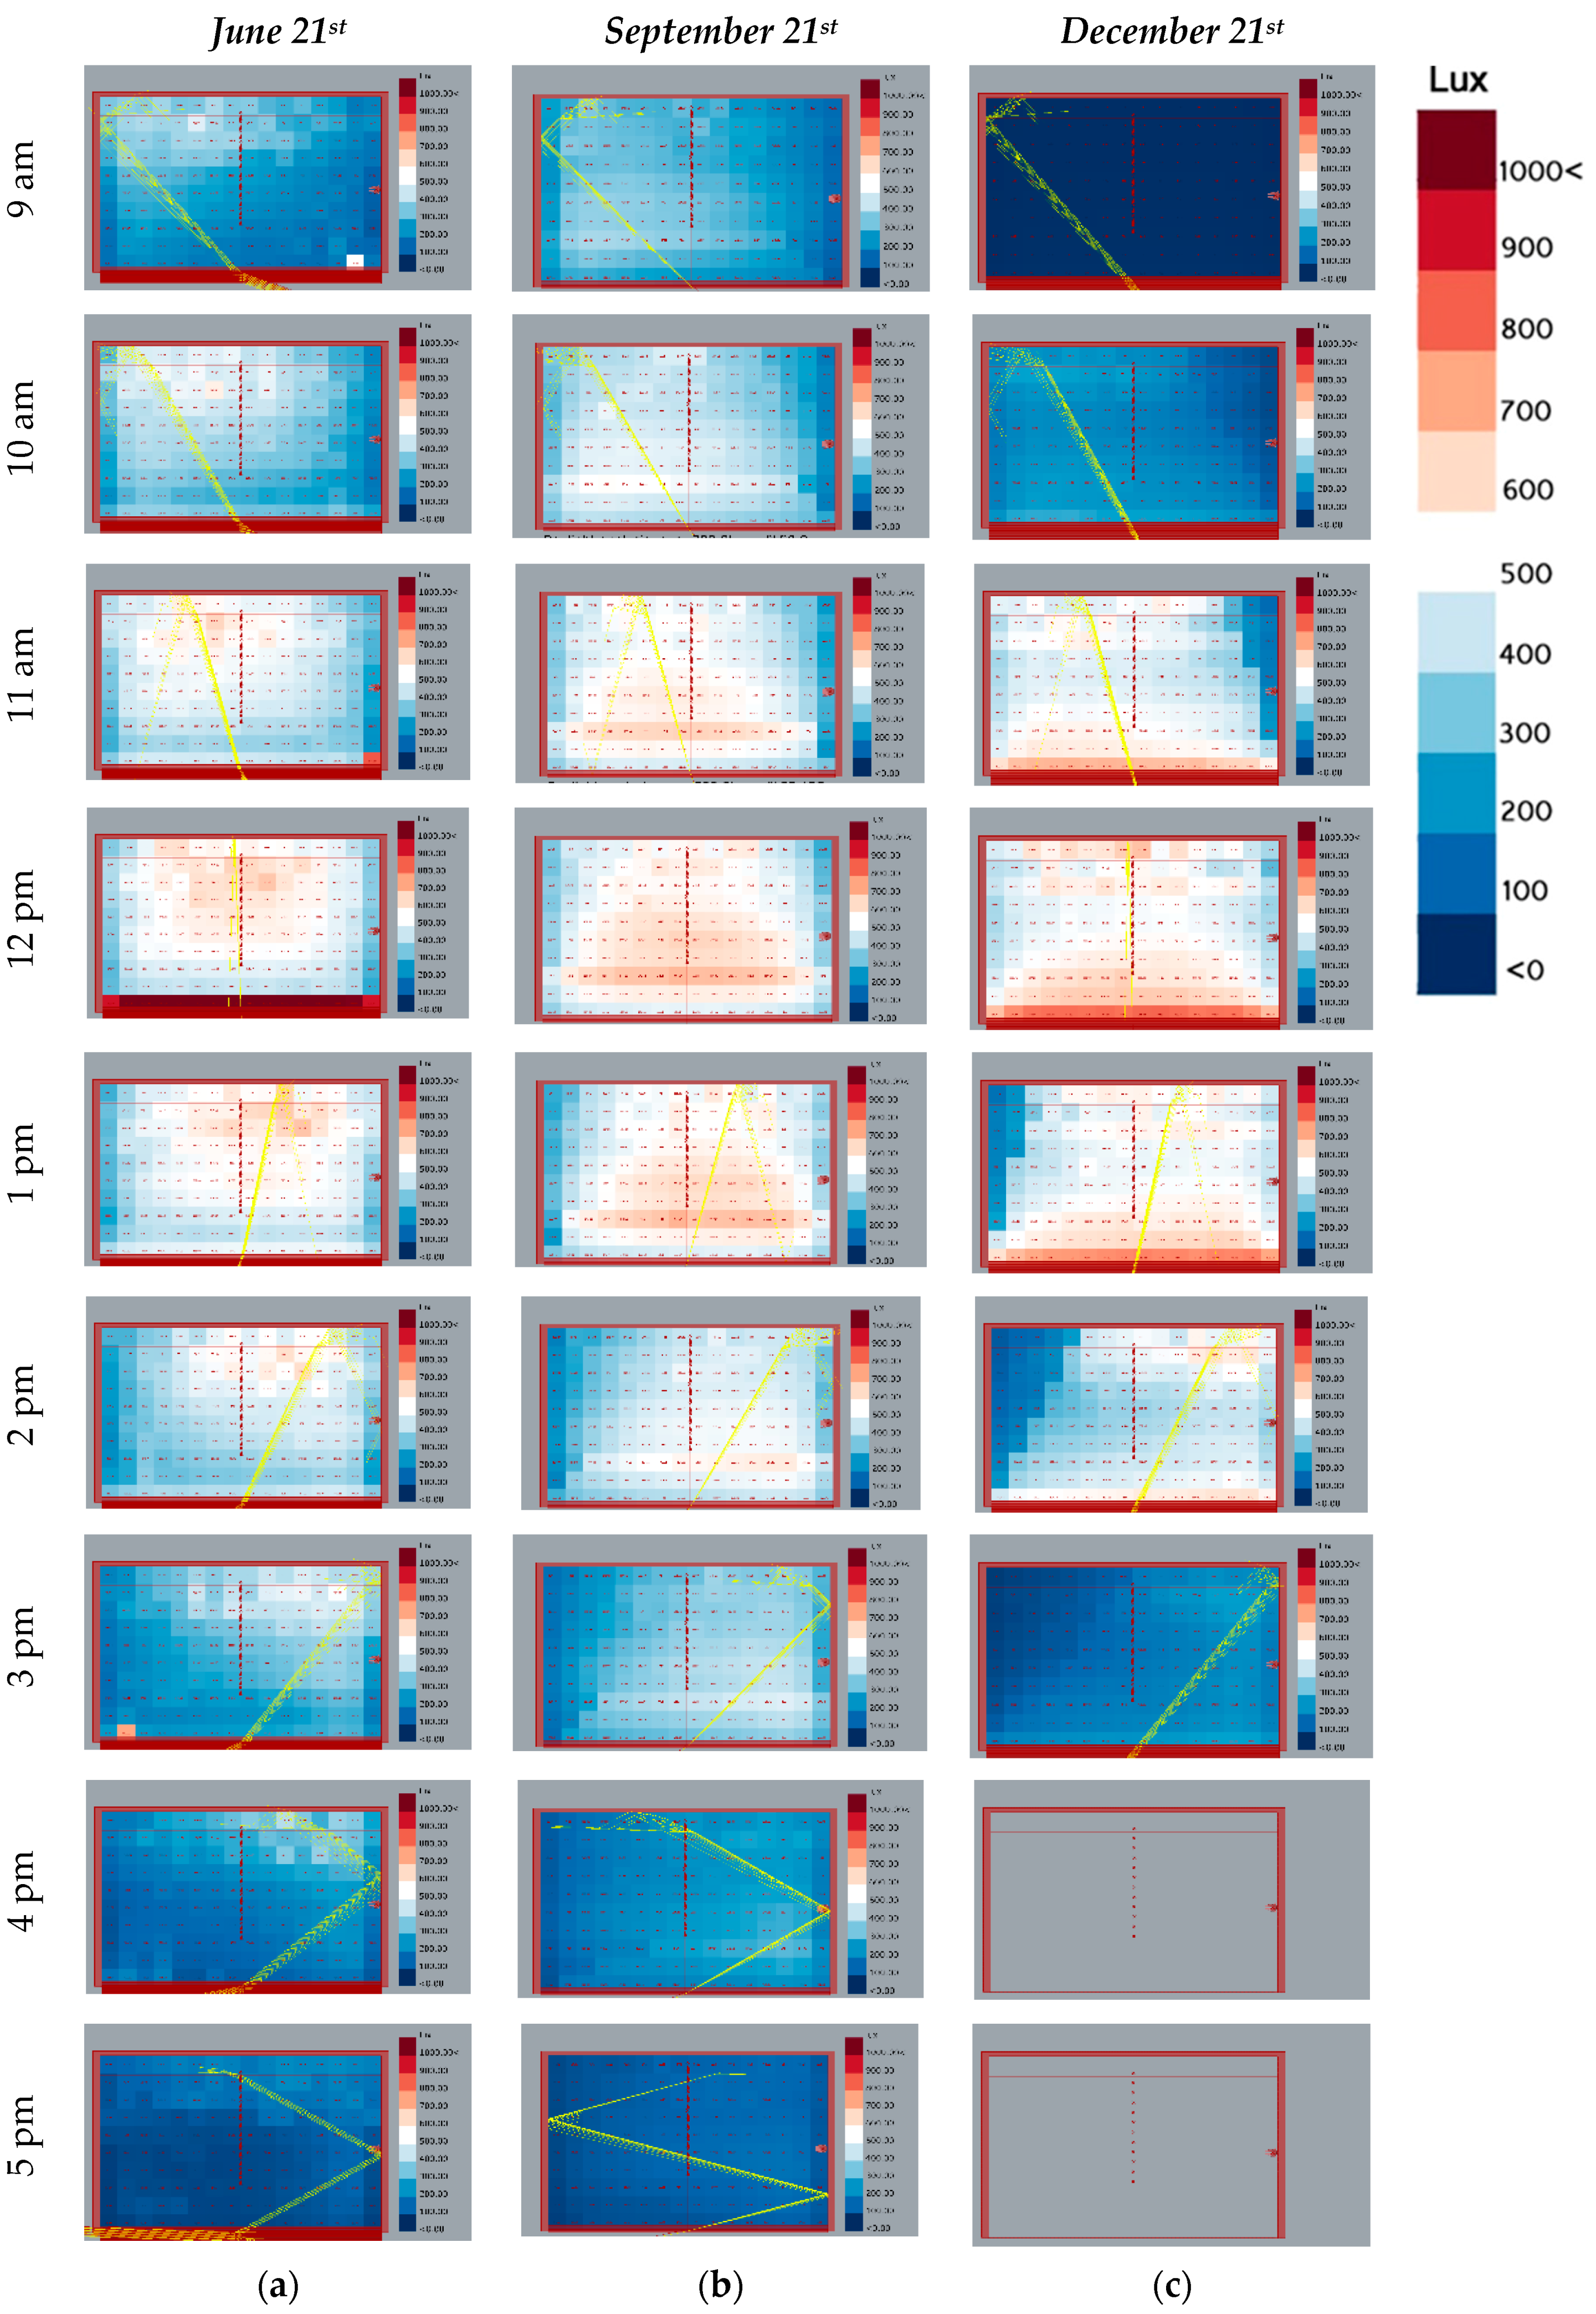
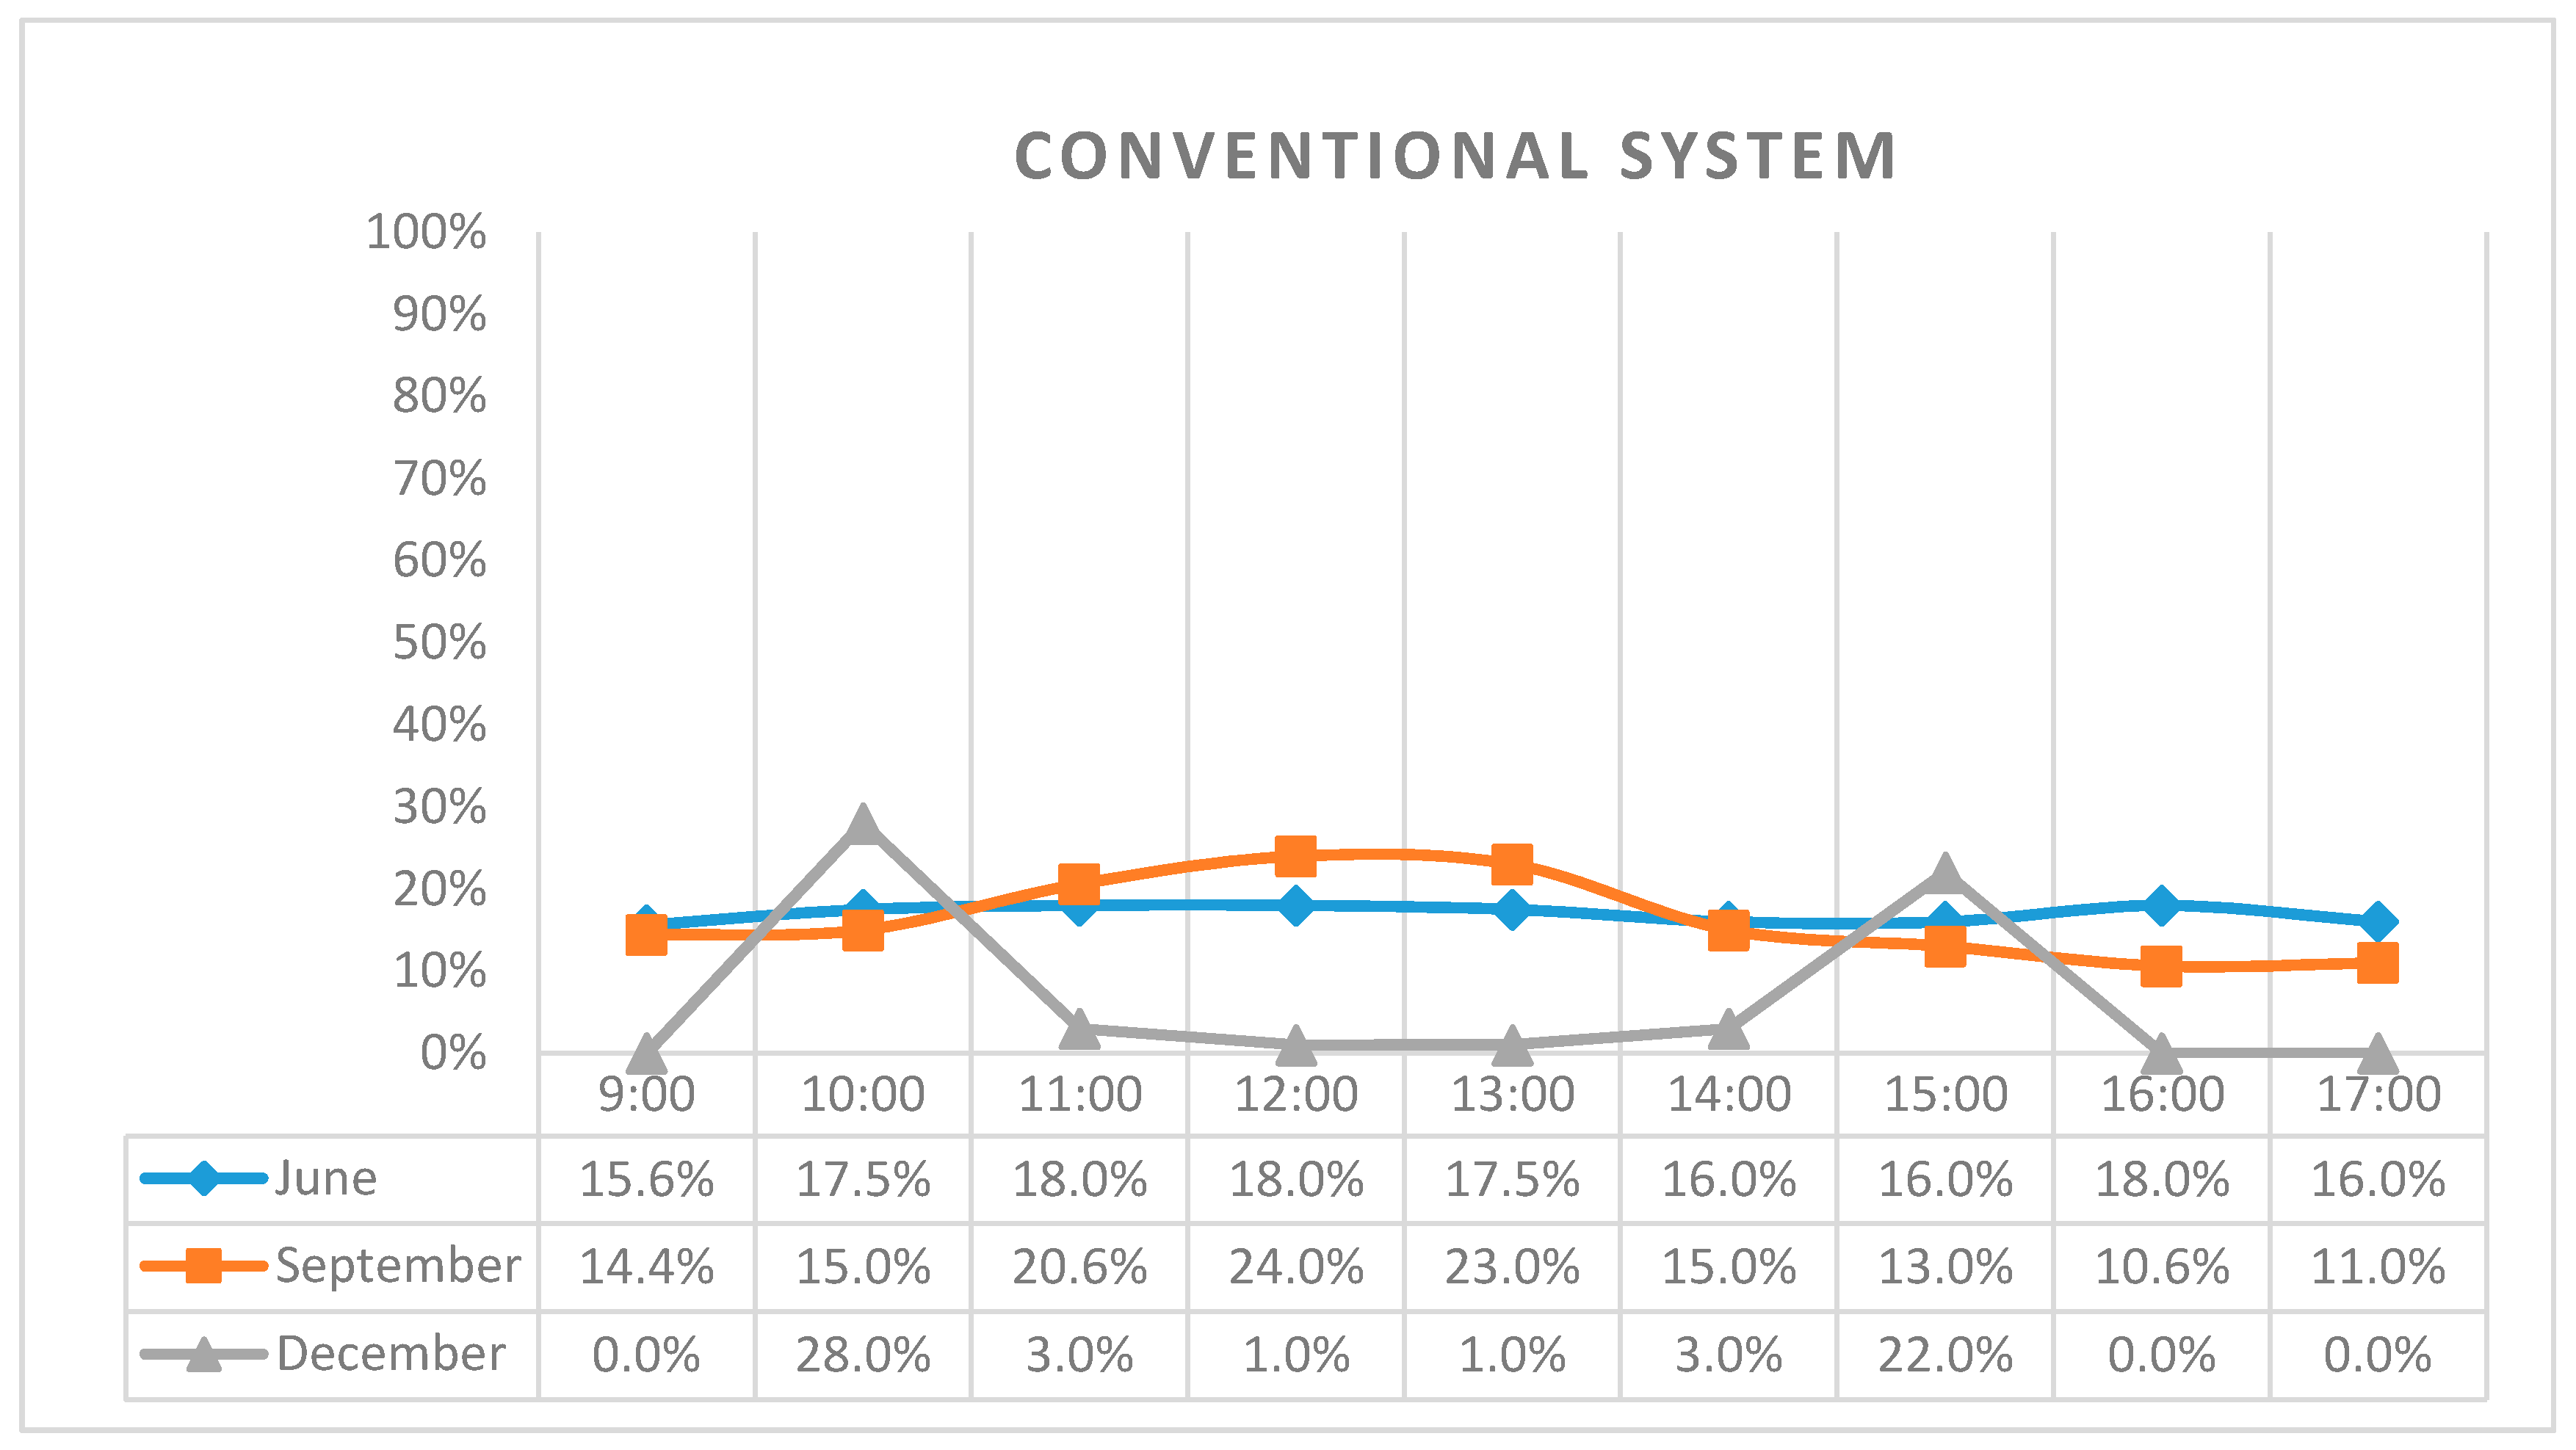
The next comparison is showing daylight coverage analysis for the south oriented room during the working hours from 9 a.m. to 5 p.m., in June, September and December using a conventional daylighting system. The accepted range should be between 300 and 500 lux for human visual comfort.
The next comparison is showing daylight coverage analysis for the south orientated room during the working hours from 9 a.m. to 5 p.m., in June, September and December, using parametric daylighting system (A calibration study). The accepted range should be between 300 and 500 lux for human visual comfort.
The calibration test was occurred on the South oriented office room to clarify the simulation process and to understand the difference in coverage range between the two systems, as shown in Figure 4 and Figure 5. The daylight coverage by using the two systems were summarized in the next diagrams. As seen in Figure 6, by using the conventional system the daylight coverage within 300~500, lux did not exceed 28% during the daytime in June, September and December. However, as shown in Figure 7, by using the parametric system, the daylight coverage reached 90% within the same criteria.
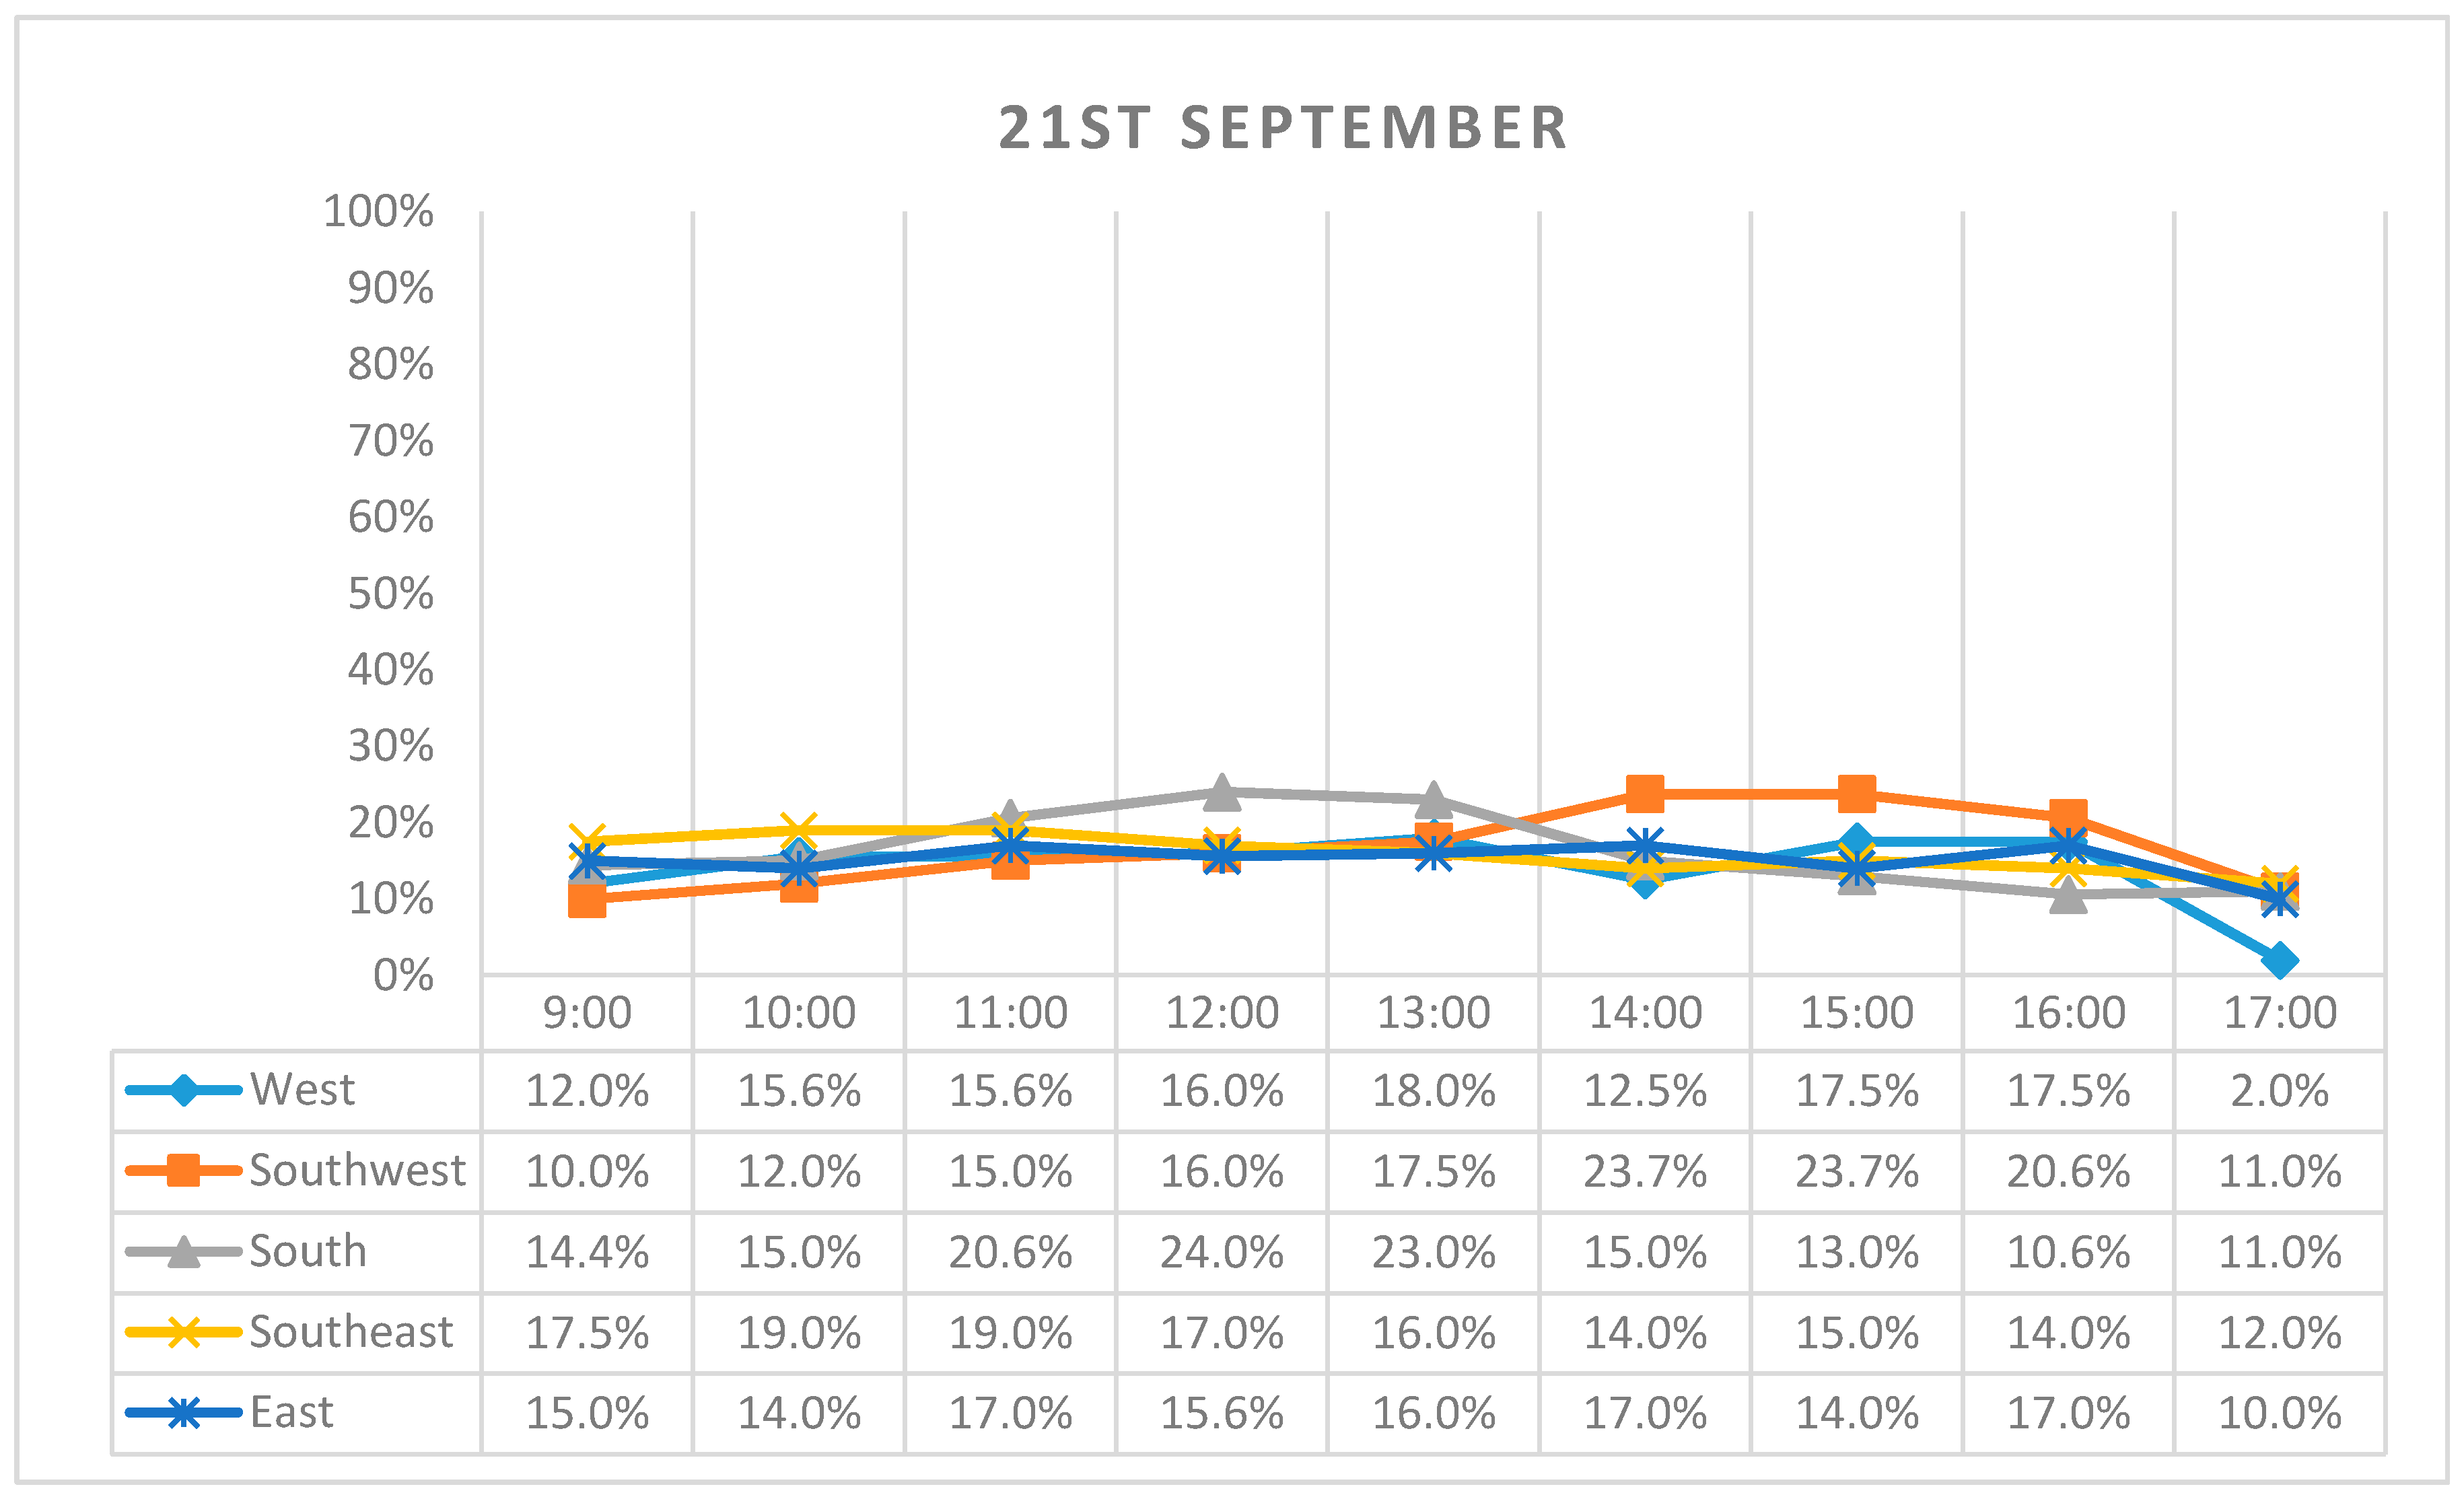
3.2. Daylight Coverage Percentage by the Conventional System in Different Orientations
The next graphs are showing the coverage percentage during the working hours in June, September and December, respectively, by using the conventional daylighting system.
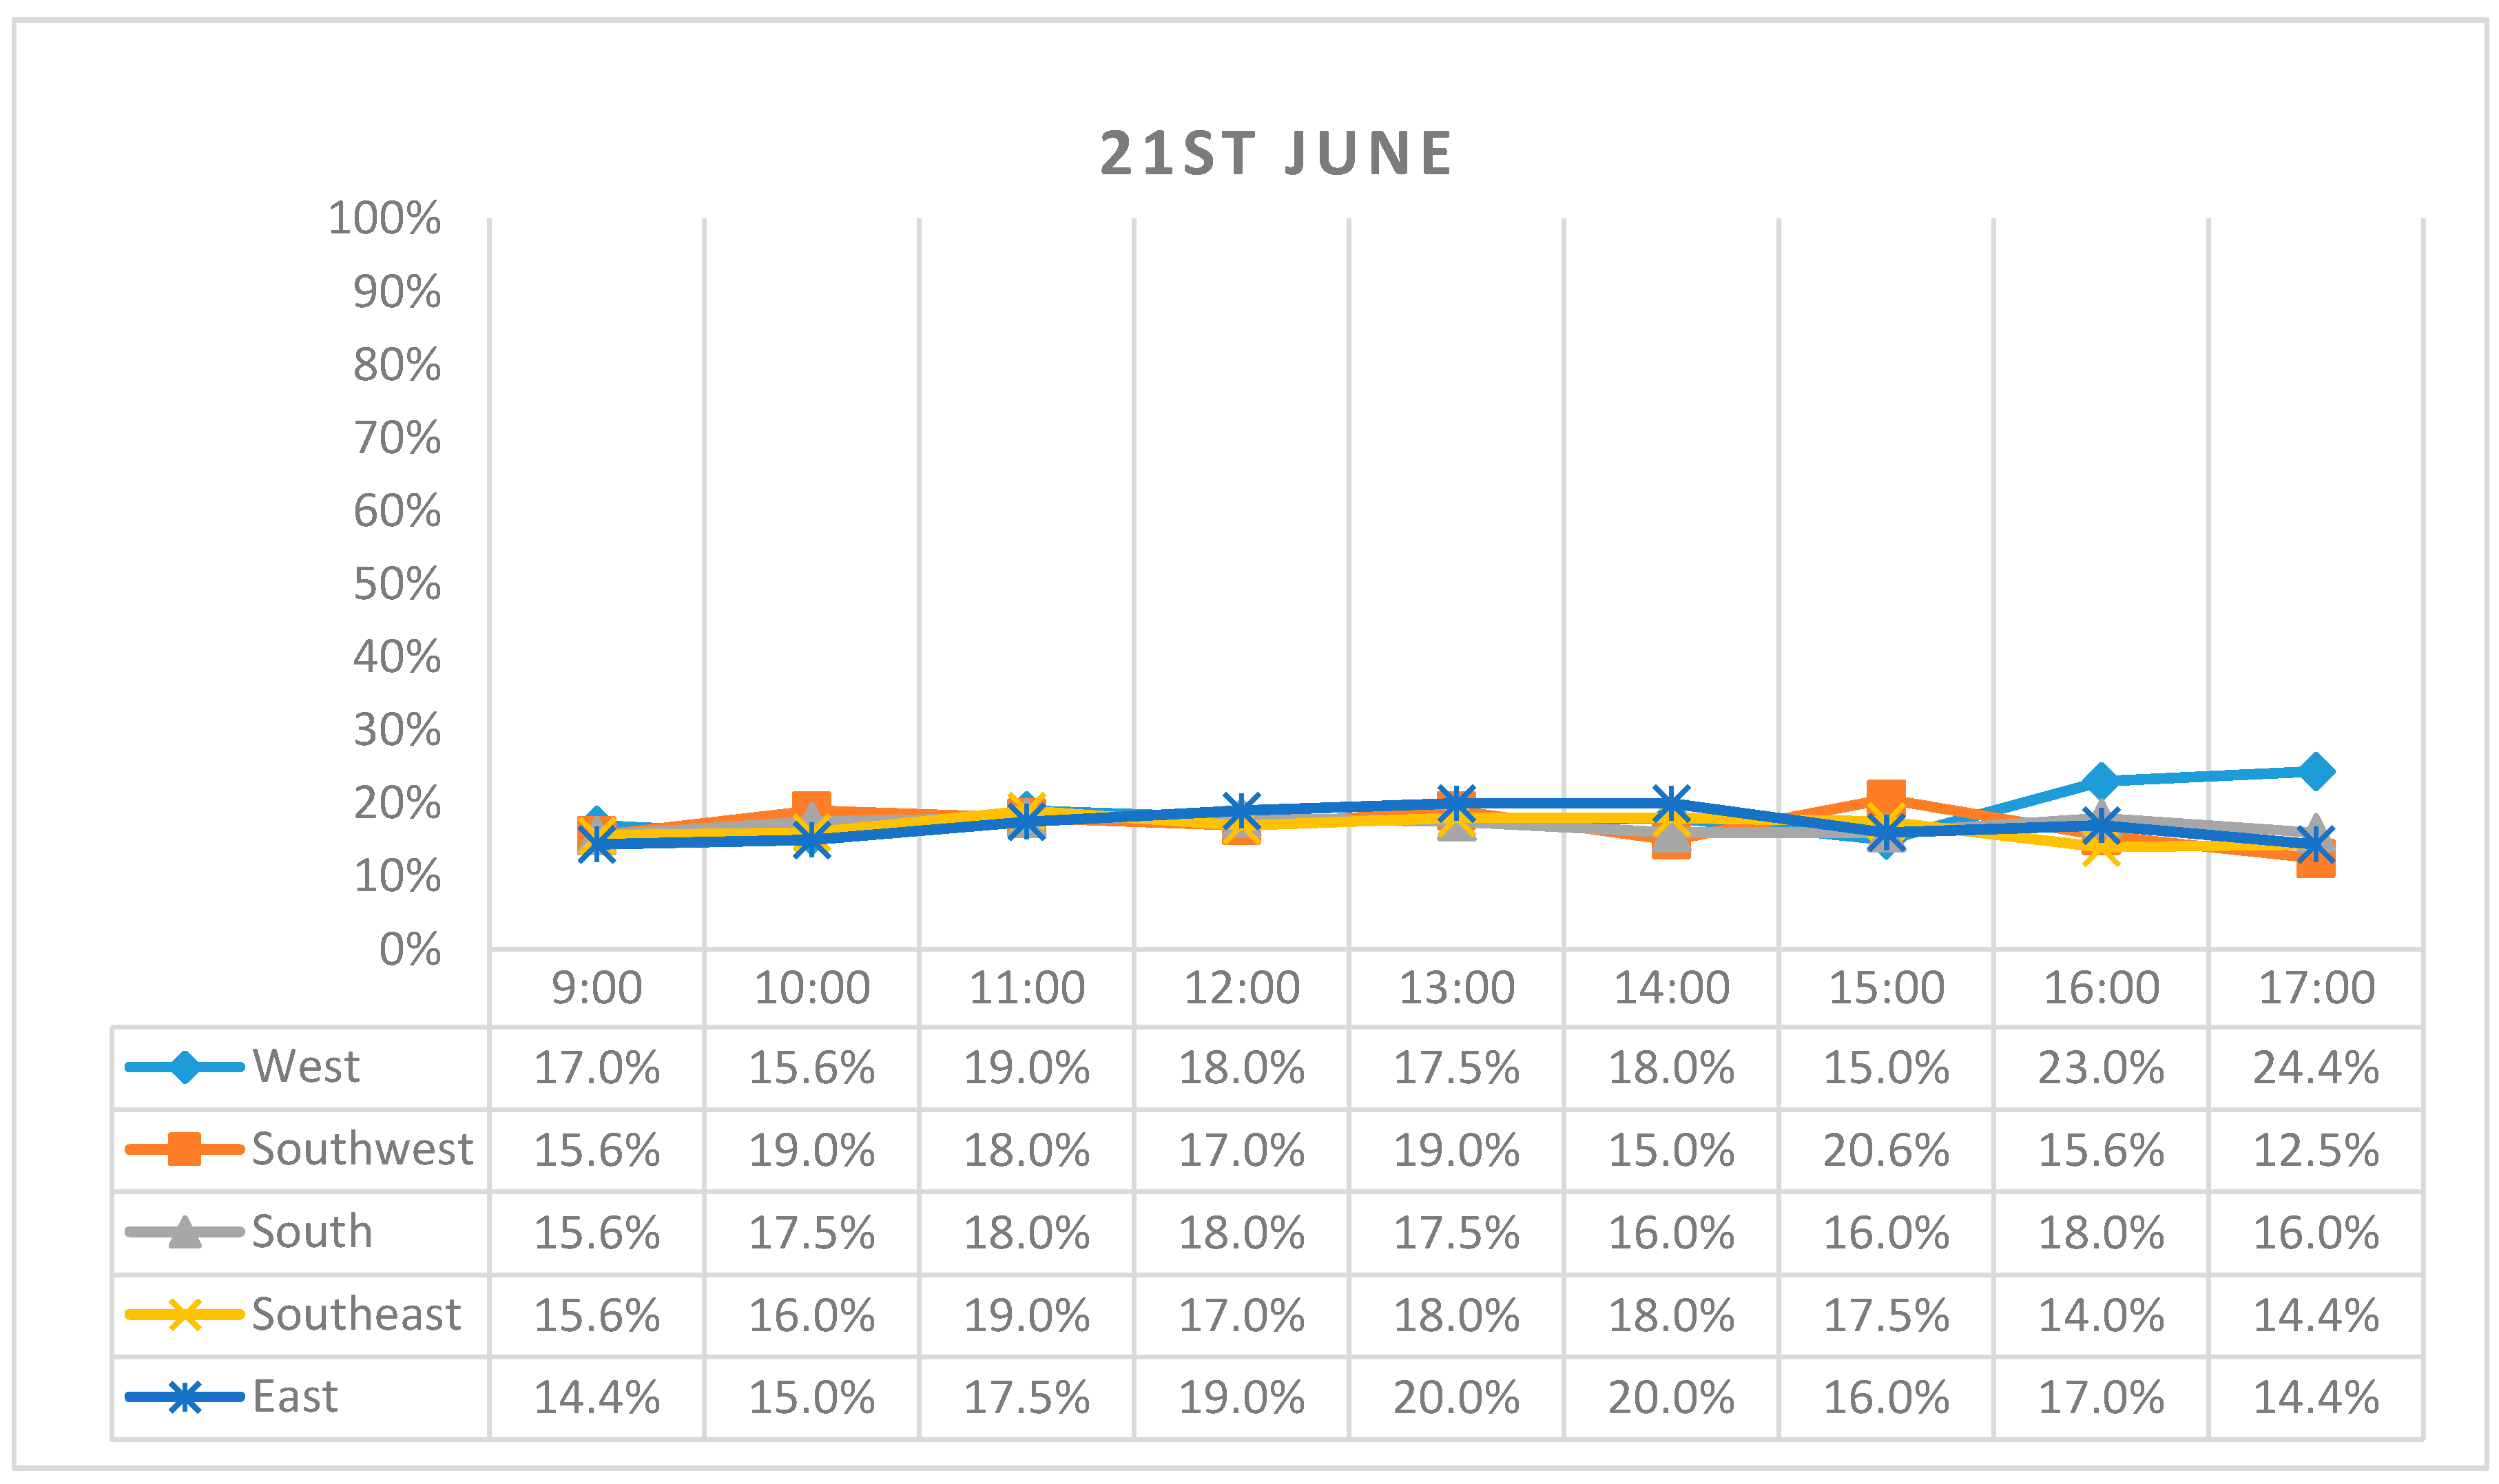
It can be observed in Figure 8 and Figure 9 that the conventional system does not exceeding 25% coverage in June and September, however, it reaches 38% coverage on December at its peak due to the low inclination of the sun altitude, as shown in Figure 10, where it can reach deep coverage inside the room. In addition to the previous point, we can observe that the illumination coverage is relatively constant during the daytime in June and September, while there is a notable variation during the daytime in December.
We can observe in Figure 11 that the coverages percentage in all of the orientations are almost equal with few variations due to climate changes, which means that these orientations has no effect on conventional system.
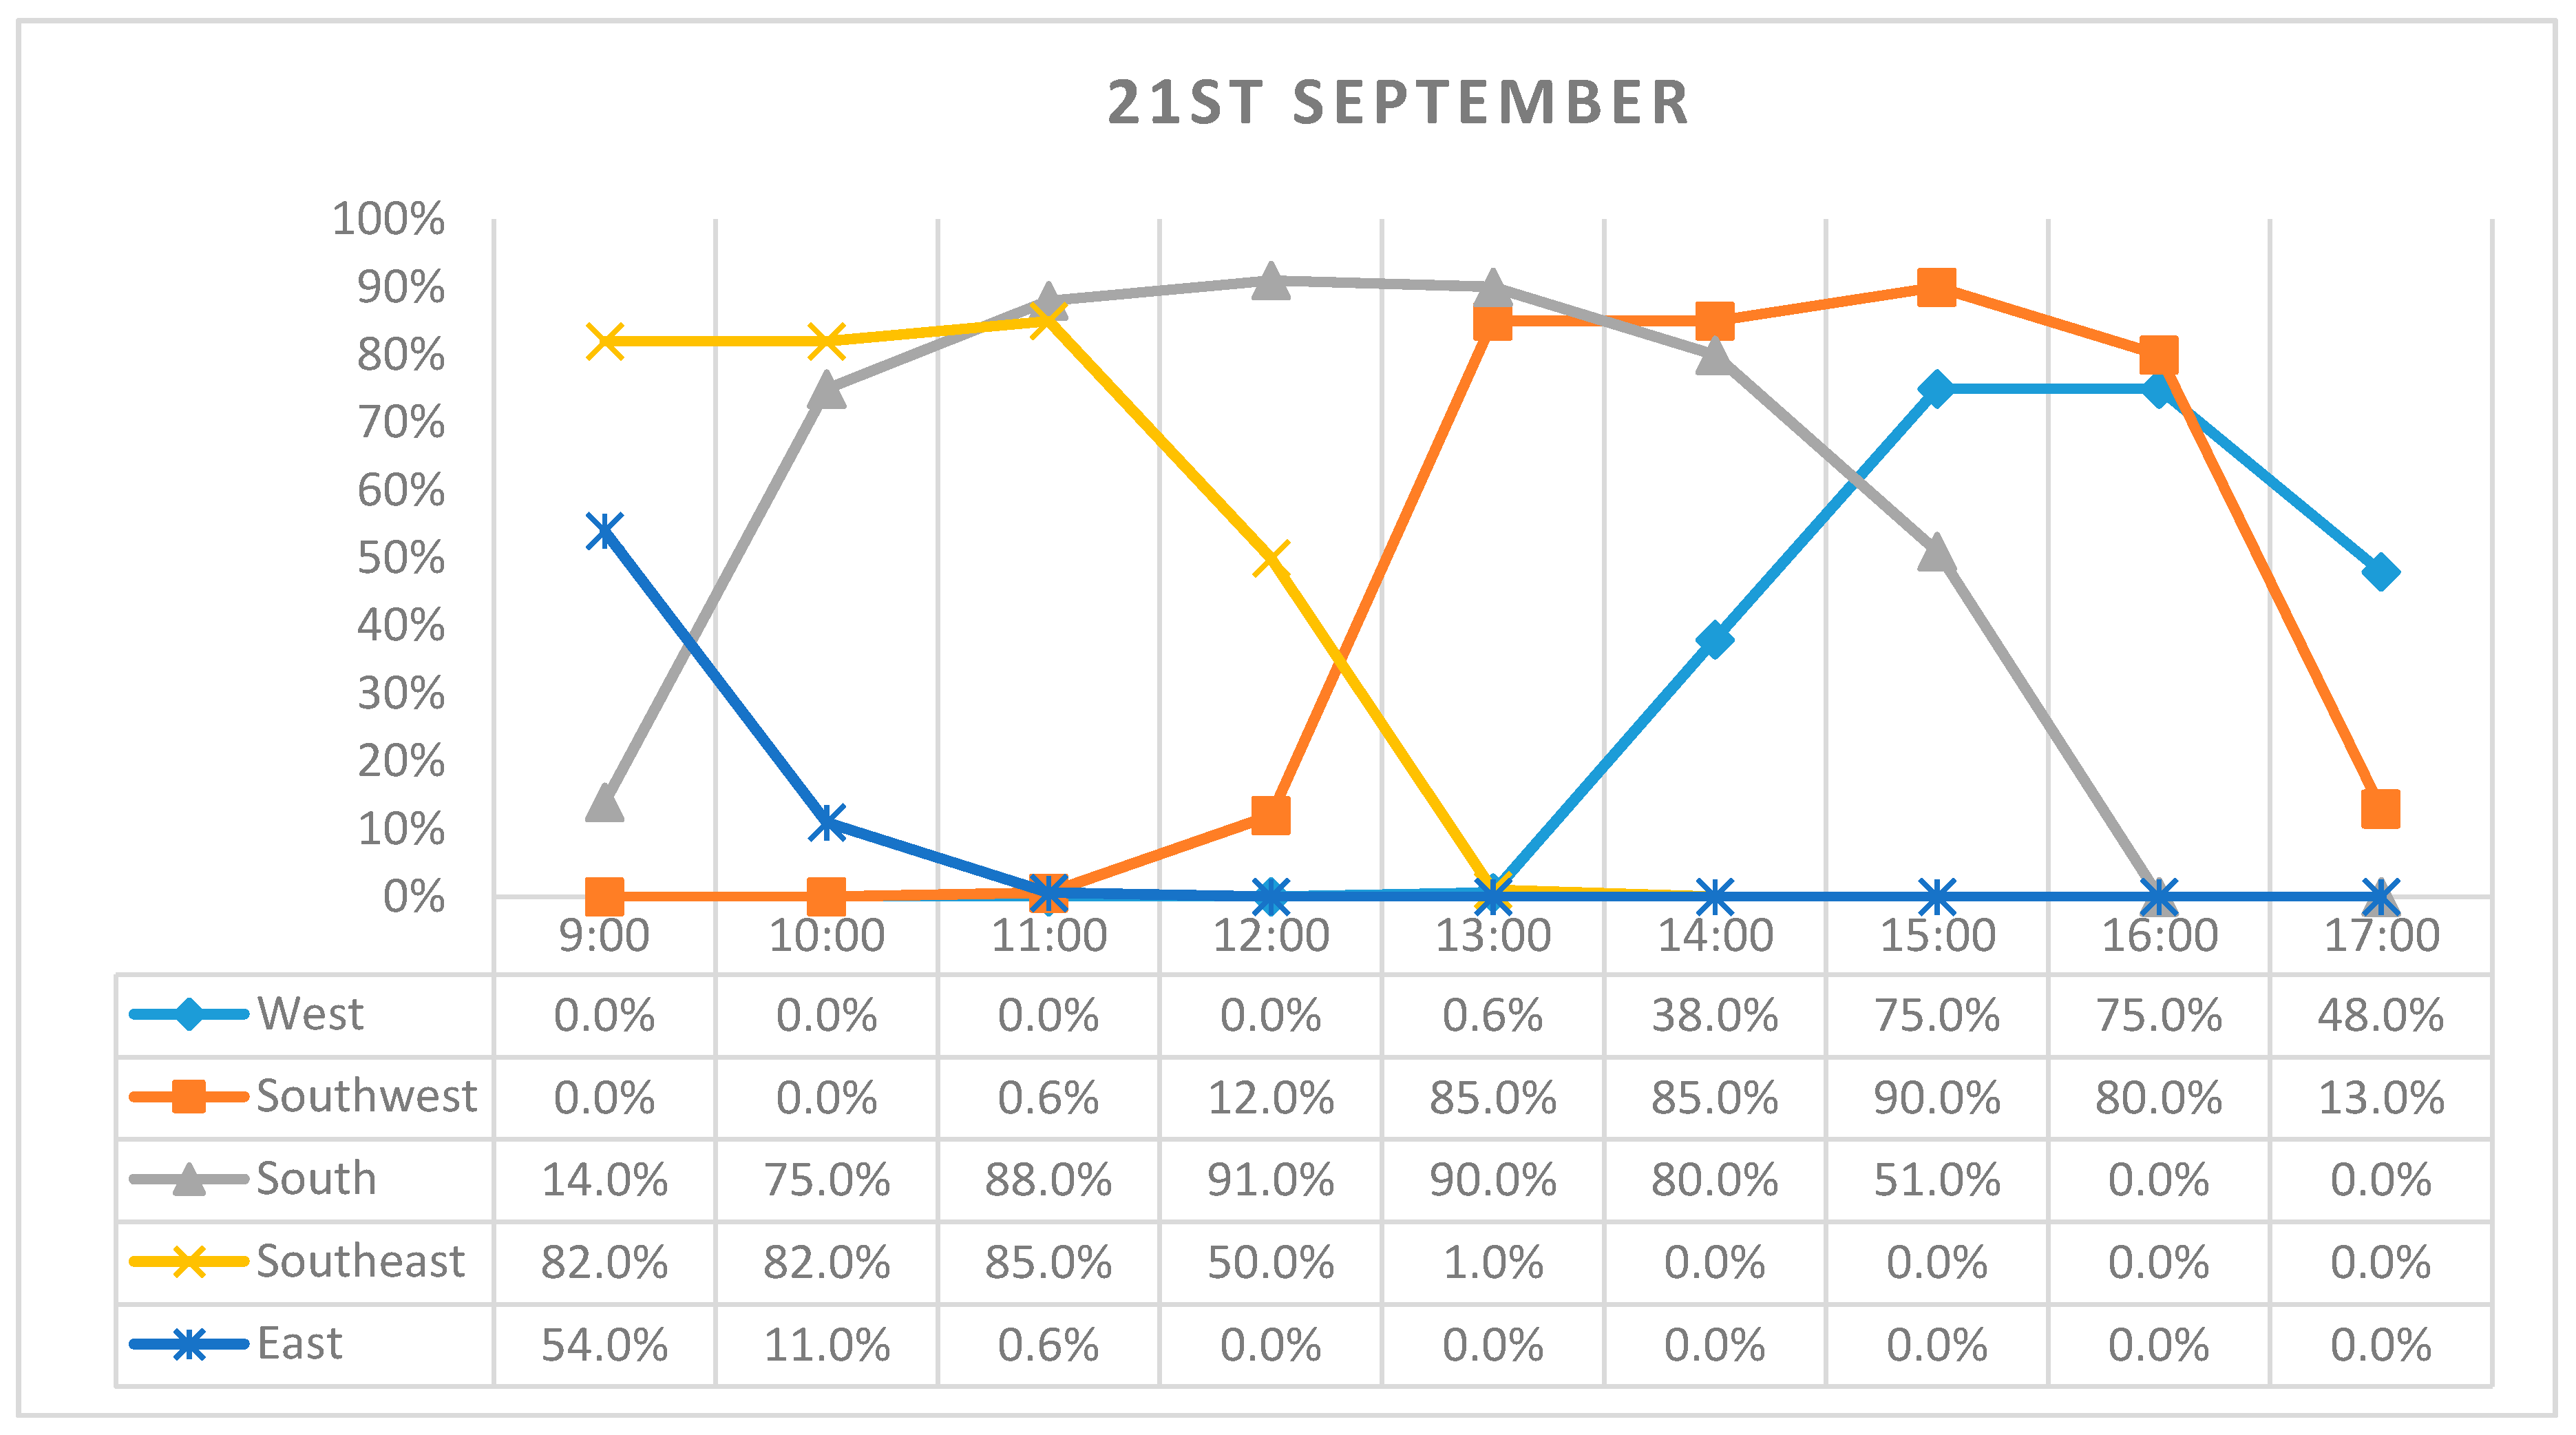
3.3. Daylight Coverage Percentage by the Parametric System in Different Orientations
The following graphs revealing the coverage percentage during the working hours in June, September, and December, respectively, by using parametric system.
When applying the parametric system, we can observe that daylighting coverage achieves more than 90% in all of the orientations with some fluctuations due to the difference in directions, see Figure 12, Figure 13 and Figure 14. It is worth to be mentioned that the South and the Southwest orientations are giving the best daylight coverage when comparing to other orientations in all of the seasons. It can be observed in Figure 14 that the South orientation is giving the best performance from 11 a.m. to 2 p.m. only. The reason of that is that the daytime is relatively short in December at this specific territory, where the sun altitudes at the morning and the evening are low and probably have the risk of blocking by trees or surrounding buildings.
In Figure 15 we can see noticeable variations between the five orientations when using the parametric system, especially with the South and the Southwest orientations, while they are giving the highest daylight coverage when comparing to the other orientations. This means that these two orientations can be put in considerations for the decision makers for better energy saving when using the proposed parametric system.
3.4. Energy Saving Potential of the Proposed Parametric Daylighting System throughout the Year
In the annual analysis section it is important to bear in mind that we have two main criteria should be considered in our study; firstly, the accepted illuminance range 300~500 lux which considered as a visual comfort criterion. Secondly, the electrical energy saved when the provided daylight is above 300 lux regardless the maximum level 500 lux, which considered as an energy saving criterion. That means, whenever the available daylight is over 300 lux at any part of the room, the electrical light in this part will automatically turn off, and vice versa, whenever the available light is less than 300 lux the electrical light will automatically turn on. The succeeded system should achieve the two criteria simultaneously of providing visual comfort and saving energy.
For instance, on 21 June at 11 a.m., by using the parametric system, 70% of the room is provided with daylight and simultaneously the available daylight within the needed range 300~500 lux, which means that the system achieved the two criteria of saving 70% of electrical energy and reaching the visual comfort, see Figure 5. Accordingly, the electrical light will turn on automatically at the dimming part of the room and the electrical energy consumption at this time should be 1.35 Wh/m2. On the other hand, on the same date, by using the conventional system, the accepted coverage average for visual comfort is only 18%, although, 70% of the room is provided with daylight and only 30% of the electrical light will turn on. However, this system was not succeeded to achieve the two criteria due to the issue of visual comfort.
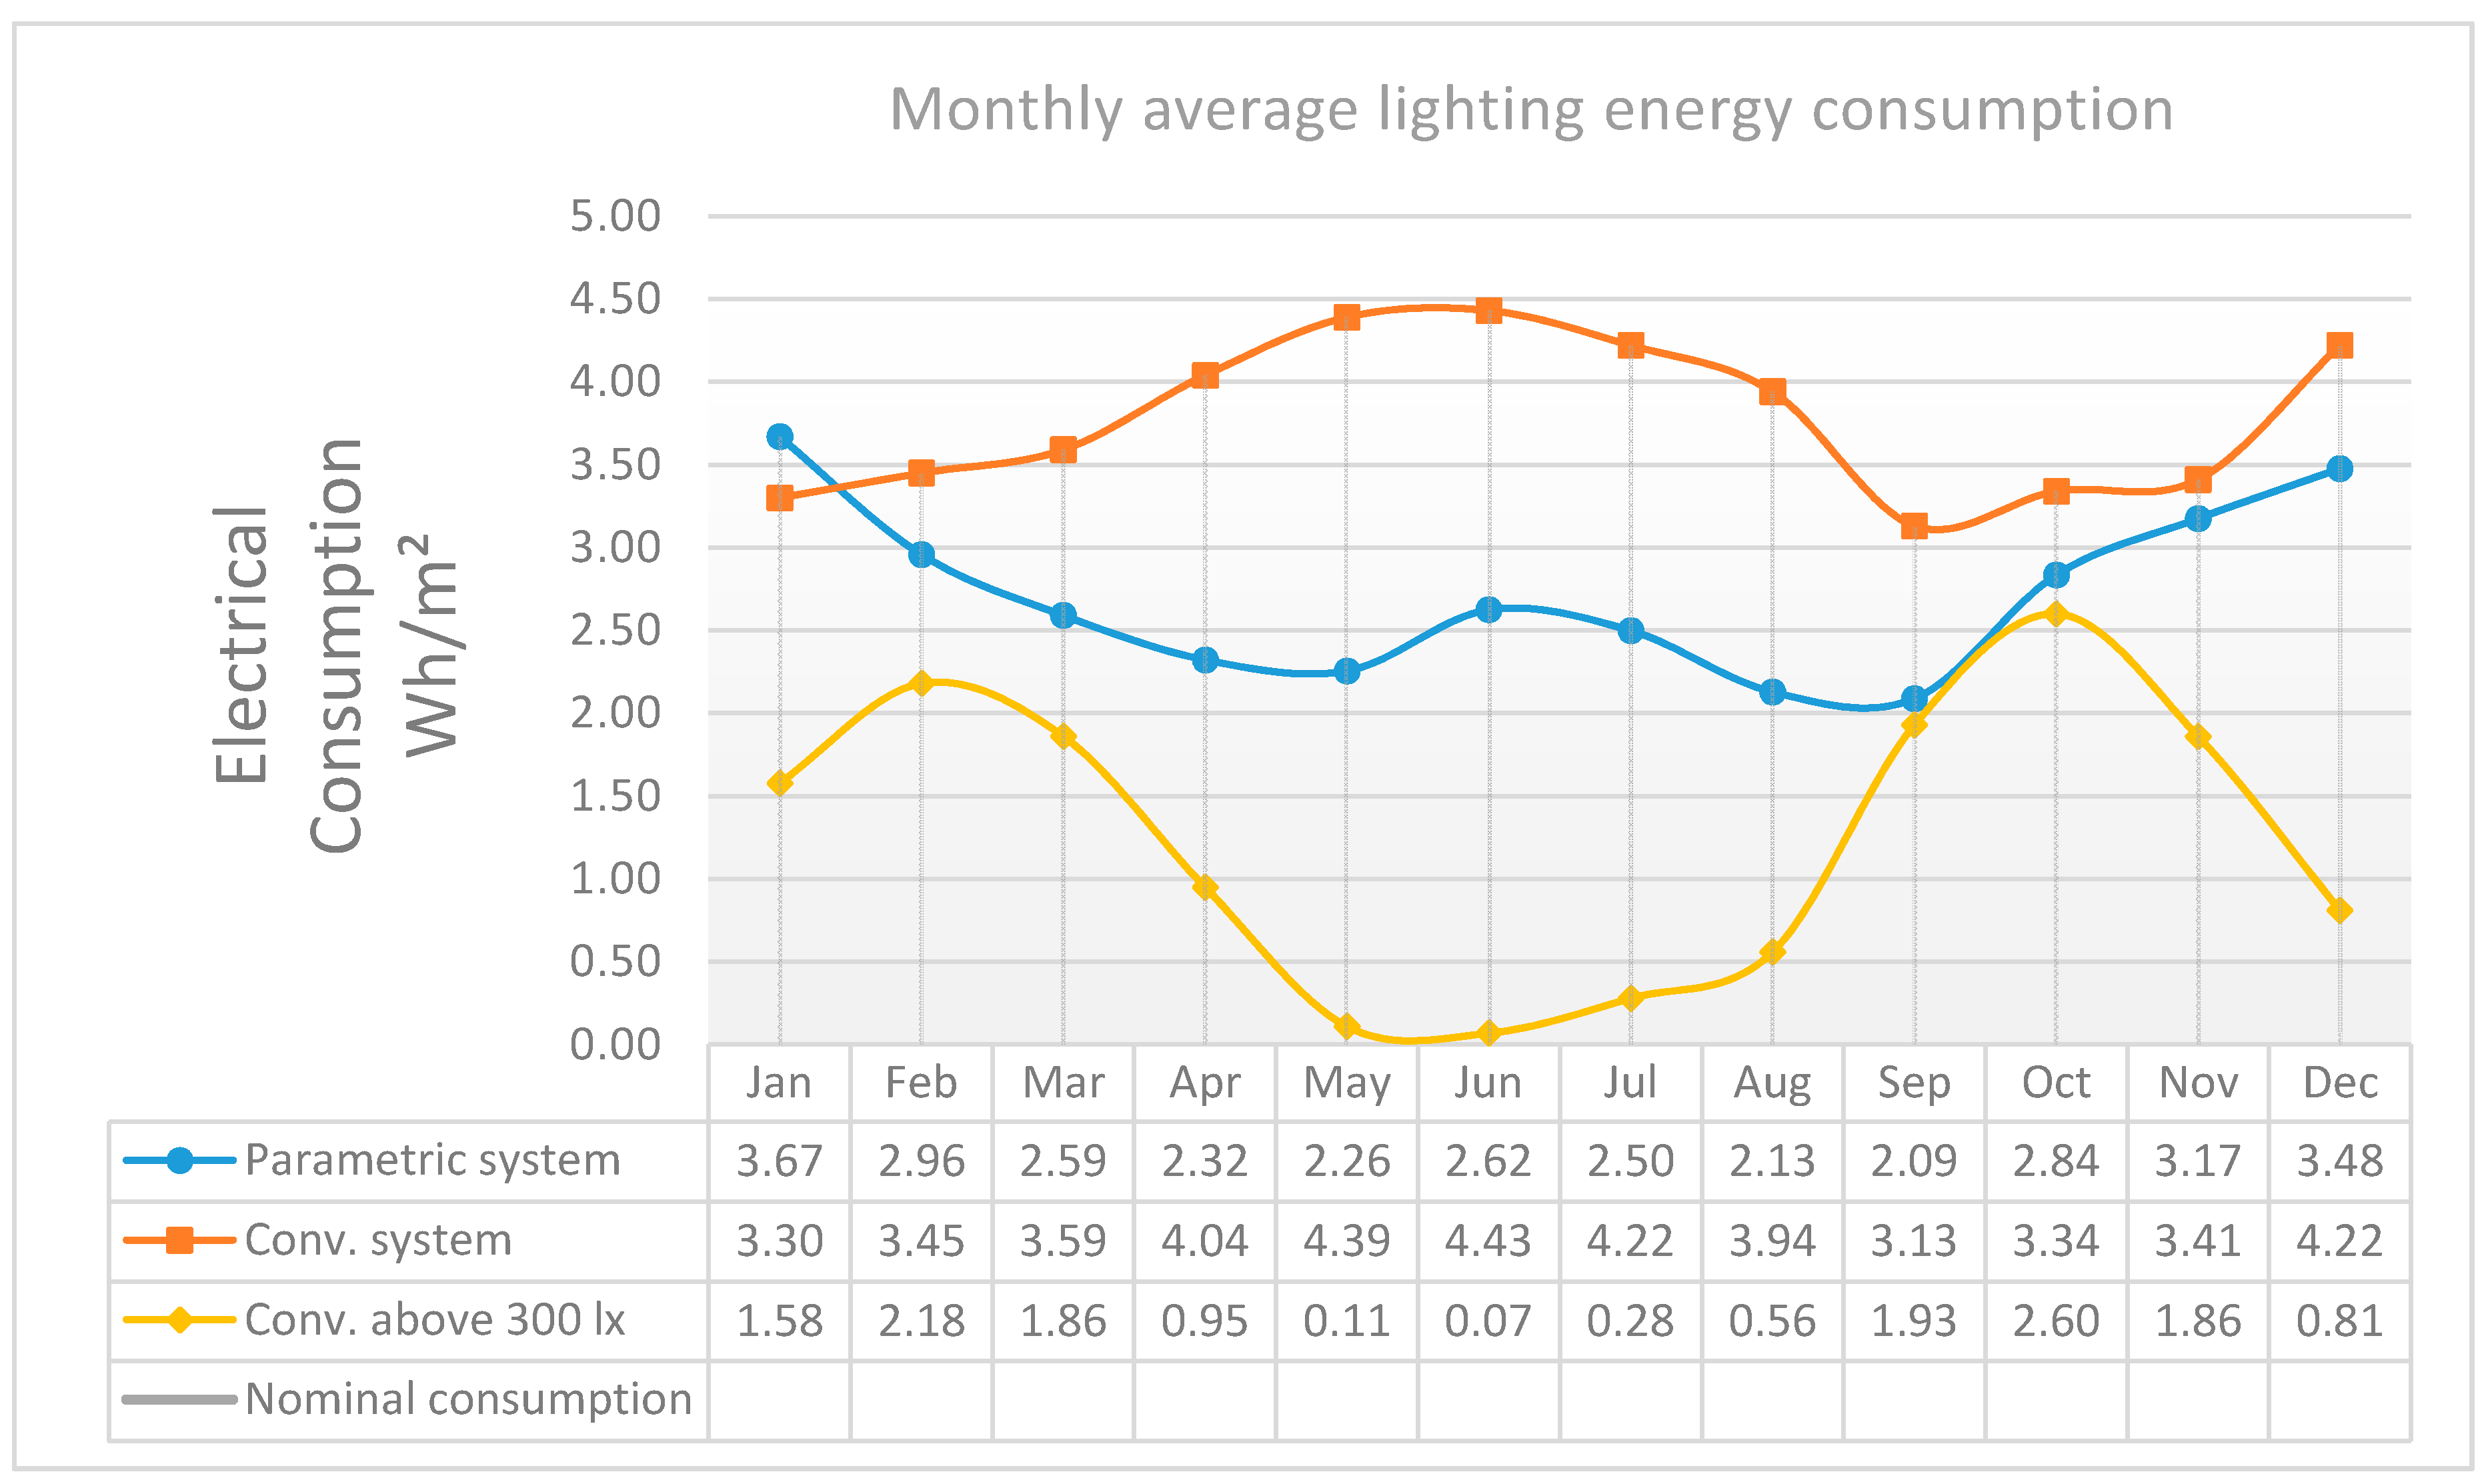
In our case, potential electrical lighting consumption can be achieved by applying the proposed parametric system in the selected office room, as shown in Table 1. The test points inside the office room recorded the daily average electrical lighting consumption during the working hours throughout the year, putting in consideration for the two days’ vacation during the week, which were not accounted. The monthly averaged from daily electric lighting energy consumption are also included at the bottom of the table and shown in Figure 16 both the parametrically controlled system and the conventional system, by using the two mentioned criteria. The results in Table 1 occurred from parametric system were using the two criteria simultaneously, however, the conventional system were using the two criteria separately. The nominal energy consumption of electric lighting corresponds to the electric lighting level at 500 lux. For the selected office room, DAYSIM gave a value 4.5 Wh/m2 as the nominal electric lighting energy consumption.
The next graph is revealing the monthly consumed electrical lighting by using the parametric system and the conventional system, comparing to the standard electrical consumption. It can be observed in Figure 16 that the conventional system (colored in yellow) is giving the better electrical energy saving during the year comparing to the parametric system, however, such system is not achieving the other criteria of visual comfort. Therefore, this system (in yellow color) cannot be considered as an advantageous system. On the other hand, when comparing the performance of parametric system (in blue color) with the conventional system (in orange color) while they were achieving the both criteria, we can observe that the parametric system was saving more energy and better performance, in addition to the well distributed daylight as shown in Figure 5 comparing to Figure 4.
Table 2 is showing the potential daylight coverage achieved by using the parametric louver system during the working hours in the selected office room. The test points inside the office room recorded the daily average daylighting coverage percentage during the working hours throughout the year, putting in consideration the two days’ vacation during the week, which were not accounted. The monthly averaged from daily daylighting coverage percentages are revealed at the end of the table and in Table 2.
For the parametric system, we can observe in Figure 16 relatively higher lighting energy consumption in November, December and January comparing to the other months, due to the poor weather conditions in winter in addition to the lower solar altitude, which causes weak solar radiation and the daytime becomes very short especially in such a territory like the UK. On the other hand, regarding the conventional system, we can observe an interference with the parametric system in January due to the availability of diffuse light (horizontal light) in this month which relatively reduces the amount of electrical energy consumption. Putting in consideration that our proposed system focused on providing as much as possible of constant and distributed daylight which mainly depends on direct solar radiation, which is dramatically not available in this specific month in this territory. Moreover, we can see the conventional system in a yellow line is consuming lower energy comparing to the parametric system, this system is not achieving the other criterion of the accepted range 300~500 lux, which means that such system is not succeeded as mentioned previously.
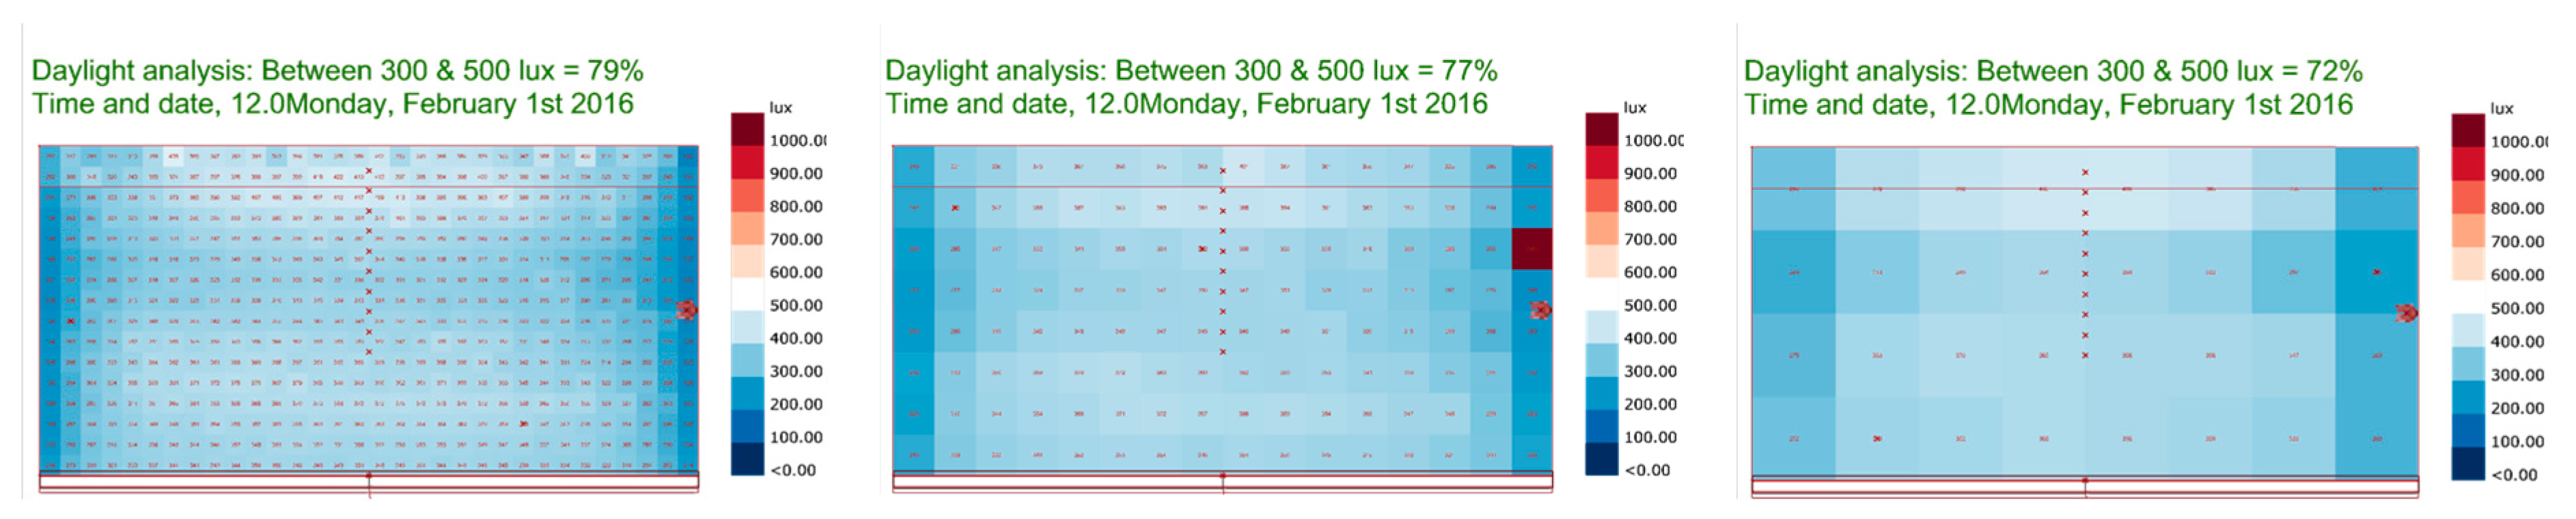
It is remarkable to bear in mind that the calculated daylight coverage was considered only for the daylight illuminance range of 300~500 lux, however, for some dates in some cases the daylight illuminance may exceed this level or even less than 300 lux, which consequently not accounted in the calculation, therefore resulting in lower coverage values, see Figure 17. The simulation results of RADIANCE/DAYSIM may be largely affected by the chosen number of bounces and test points to control the radiation quality, which can be adjusted from the “rad Parameters” component in the simulation settings. Putting in consideration that this may take longer time for running the simulation in addition to the used computer performance. Accordingly, this influences on the analysis quality and the results accuracy. While this article was investigating the annual daylight performance based on hourly analysis, therefore, the simulation settings were set to the standard level in order to save time. Therefore, it worth to mention that the proposed system can achieve better performance regardless the time consuming and computer performance, in order to achieve the required illuminance level 500 lux. Figure 18 is revealing the difference between the analysis accuracy levels for the office room on 1 February at 12 p.m., where our study was using the middle level.
4 Conclusions
Daylighting can be utilized in different ways to achieve better energy saving and enhance occupants’ visual comfort. This article investigated an advanced daylighting system using parametric control, aiming to optimize the daylighting performance in the office spaces. The methodology of this study depends on controlling different parameters such as automated louvers and electrochromic window, which are responding parametrically to the sun movement. The proposed system was examined previously in a South oriented office room for a specific date and achieved 80% of energy saving. The current study has examined the suitability of the system for installation in five orientations. The proposed system produced the highest results for the two orientations (South, Southwest) which records better coverage of daylight during the day in June, September and December comparing to other orientations.
The proposed parametric system was evaluated throughout the year in the territory of the UK and revealing a promising results comparing a conventional system. Regarding the nature of the selected territory and due to the regular climate changes, the study found that the use of parametrically controlled system can achieve an average 40% saving in electric lighting energy consumption when it is applied throughout the year. A future study will focus on validation analysis and system accuracy control which probably influence on the analysis results.
Acknowledgments
Thanks to the Egyptian Government for their financial support for a full scholarship, and thanks to Helwan University in Egypt for their help and support for their nomination for this scholarship.
Author Contributions
Ahmad Eltaweel and Yuehong Su conceived and designed the experiments; Ahmad Eltaweel performed the experiments; Ahmad Eltaweel and Yuehong Su analyzed the data; Yuehong Su contributed analysis tools; Ahmad Eltaweel wrote the paper.
Conflicts of Interest
The authors declare no conflict of interest.
References
- Nasrollahi, N.; Shokri, E. Daylight illuminance in urban environments for visual comfort and energy performance. Renew. Sustain. Energy Rev. 2016, 66, 861–874. [Google Scholar] [CrossRef]
- Boubekri, M. Daylighting, Architecture and Health; Taylor & Francis: Didcot, UK, 2008. [Google Scholar]
- Li, W.D.H.; Tsang, E.K.W. An analysis of daylighting performance for office buildings in Hong Kong. Build. Environ. 2008, 43, 1446–1458. [Google Scholar] [CrossRef]
- Mayhoub, M.S. Innovative daylighting systems’ challenges: A critical study. Energy Build. 2014, 80, 394–405. [Google Scholar] [CrossRef]
- Konstantoglou, M.; Tsangrassoulis, A. Dynamic operation of daylighting and shading systems: A literature review. Renew. Sustain. Energy Rev. 2016, 60, 268–283. [Google Scholar] [CrossRef]
- Eltaweel, A.; Su, Y. Parametric design and daylighting: A literature review. Renew. Sustain. Energy Rev. 2017, 73, 1086–1103. [Google Scholar] [CrossRef]
- Petersen, J.F.; Sack, D.; Gabler, R.E. Physical Geography; Cengage Learning: Boston, MA, USA, 2016. [Google Scholar]
- Eltaweel, A.; Yuehong, S. Using integrated parametric control to achieve better daylighting uniformity in an office room: A multi-Step comparison study. Energy Build. 2017, 152, 137–148. [Google Scholar] [CrossRef]
- Davidson, S.G. Algorithmic Modeling for RhinO [Modelling Software]. 2017. Available online: http://www.grasshopper3d.com/ (accessed on 6 August 2017).
- Associates, R.M. Rhinoceros. Rhino 5. 2017. Available online: https://www.rhino3d.com/ (accessed on 6 August 2017).
- Europe, M. food4Rhino. Apps for Rhino and Grasshopper. Available online: http://www.food4rhino.com/ (accessed on 8 August 2017).
- Kontadakis, A.; Tsangrassoulis, A.; Doulos, L.; Topalis, F. An active sunlight redirection system for daylight enhancement beyond the perimeter zone. Build. Environ. 2017, 113, 267–279. [Google Scholar] [CrossRef]
- Dogan, T.; Stec, P. Prototyping a façade-mounted, dynamic, dual-axis daylight redirection system. Light. Res. Technol. 2016. [Google Scholar] [CrossRef]
- Olbina, S.; Hu, J. Daylighting and thermal performance of automated split-controlled blinds. Build. Environ. 2012, 56, 127–138. [Google Scholar] [CrossRef]
- McNeil, A.; Lee, E.S.; Jonsson, J.C. Daylight performance of a microstructured prismatic window film in deep open plan offices. Build. Environ. 2017, 113, 280–297. [Google Scholar] [CrossRef]
- Lee, E.S.; Stephen, E.S.; Robert, D.C.; Dennis, L.D.; Joseph, H.K.; Luis, L.F.; Gregory, J.W.; Vorapat, I.; Mehry, Y. Advancement of Electrochromic Windows; Lawrence Berkeley National Laboratory: Berkeley, CA, USA, 2006.
- Mashaly, I.A.; Nassar, K.; El-Henawy, S.I.; Mohamed, M.W.N.; Galal, O.; Darwish, A.; Hassan, O.N.; Safwat, A.M.E. A prismatic daylight redirecting fenestration system for southern skies. Renew. Energy 2017, 109, 202–212. [Google Scholar] [CrossRef]
- Salazar Trujillo, J.H. Calculation of the shadow-penumbra relation and its application on efficient architectural design. Sol. Energy 2014, 110, 139–150. [Google Scholar] [CrossRef]
- Vlachokostas, A.; Madamopoulos, N. Liquid filled prismatic louver façade for enhanced daylighting in high-rise commercial buildings. Opt. Express 2015, 23, A805–A818. [Google Scholar] [CrossRef] [PubMed]
- Eltaweel, A.; Su, Y. Controlling venetian blinds based on parametric design; via implementing Grasshopper’s plugins: A case study of an office building in Cairo. Energy Build. 2017, 139, 31–43. [Google Scholar] [CrossRef]
- Sbar, N.L.; Podbelski, L.; Yang, H.M.; Pease, B. Electrochromic dynamic windows for office buildings. Int. J. Sustain. Built Environ. 2012, 1, 125–139. [Google Scholar] [CrossRef]
- Li, Z.; Ju, J.; Xu, W. Daylighting Control Performance and Subject Responses to Electrochromic Windows in a Meeting Room. Procedia Eng. 2015, 121, 27–32. [Google Scholar] [CrossRef]
- Mead, D. Trans Materials Modeling and Specifying a Next Generation. 2010. Available online: http://radiance-online.org/community/workshops/2010-freiburg/PDF/DavidMead.pdf (accessed on 19 July 2017).
- Freewan, A.A. Maximizing the lightshelf performance by interaction between lightshelf geometries and a curved ceiling. Energy Convers. Manag. 2010, 51, 1600–1604. [Google Scholar] [CrossRef]
- Peel, M.C.; Finlayson, B.L.; McMahon, T.A. Updated world map of the Köppen-Geiger climate classification. Hydrol. Earth Syst. Sci. Discuss. 2007, 4, 439–473. [Google Scholar] [CrossRef]
- Staff, Z. The Lighting Handbook; Zumtobel: Dornbirn, Austria, 2004. [Google Scholar]
- Kellwood Led Lighting. 2017. Available online: https://www.kellwood.co.uk/led-lighting/technical/cibse-recommended-lux-levels (accessed on 15 July 2017).
- Nabil, A.; Mardaljevic, J. Useful daylight illuminances: A replacement for daylight factors. Energy Build. 2006, 38, 905–913. [Google Scholar] [CrossRef]
Figure 1.
The proposed parametric daylighting system, showing the three main tools (Rendered in V-Ray for 3D MAX).
Figure 1.
The proposed parametric daylighting system, showing the three main tools (Rendered in V-Ray for 3D MAX).

Figure 2.
Vertical louvers and tilted louvers for different ranges of solar altitude.
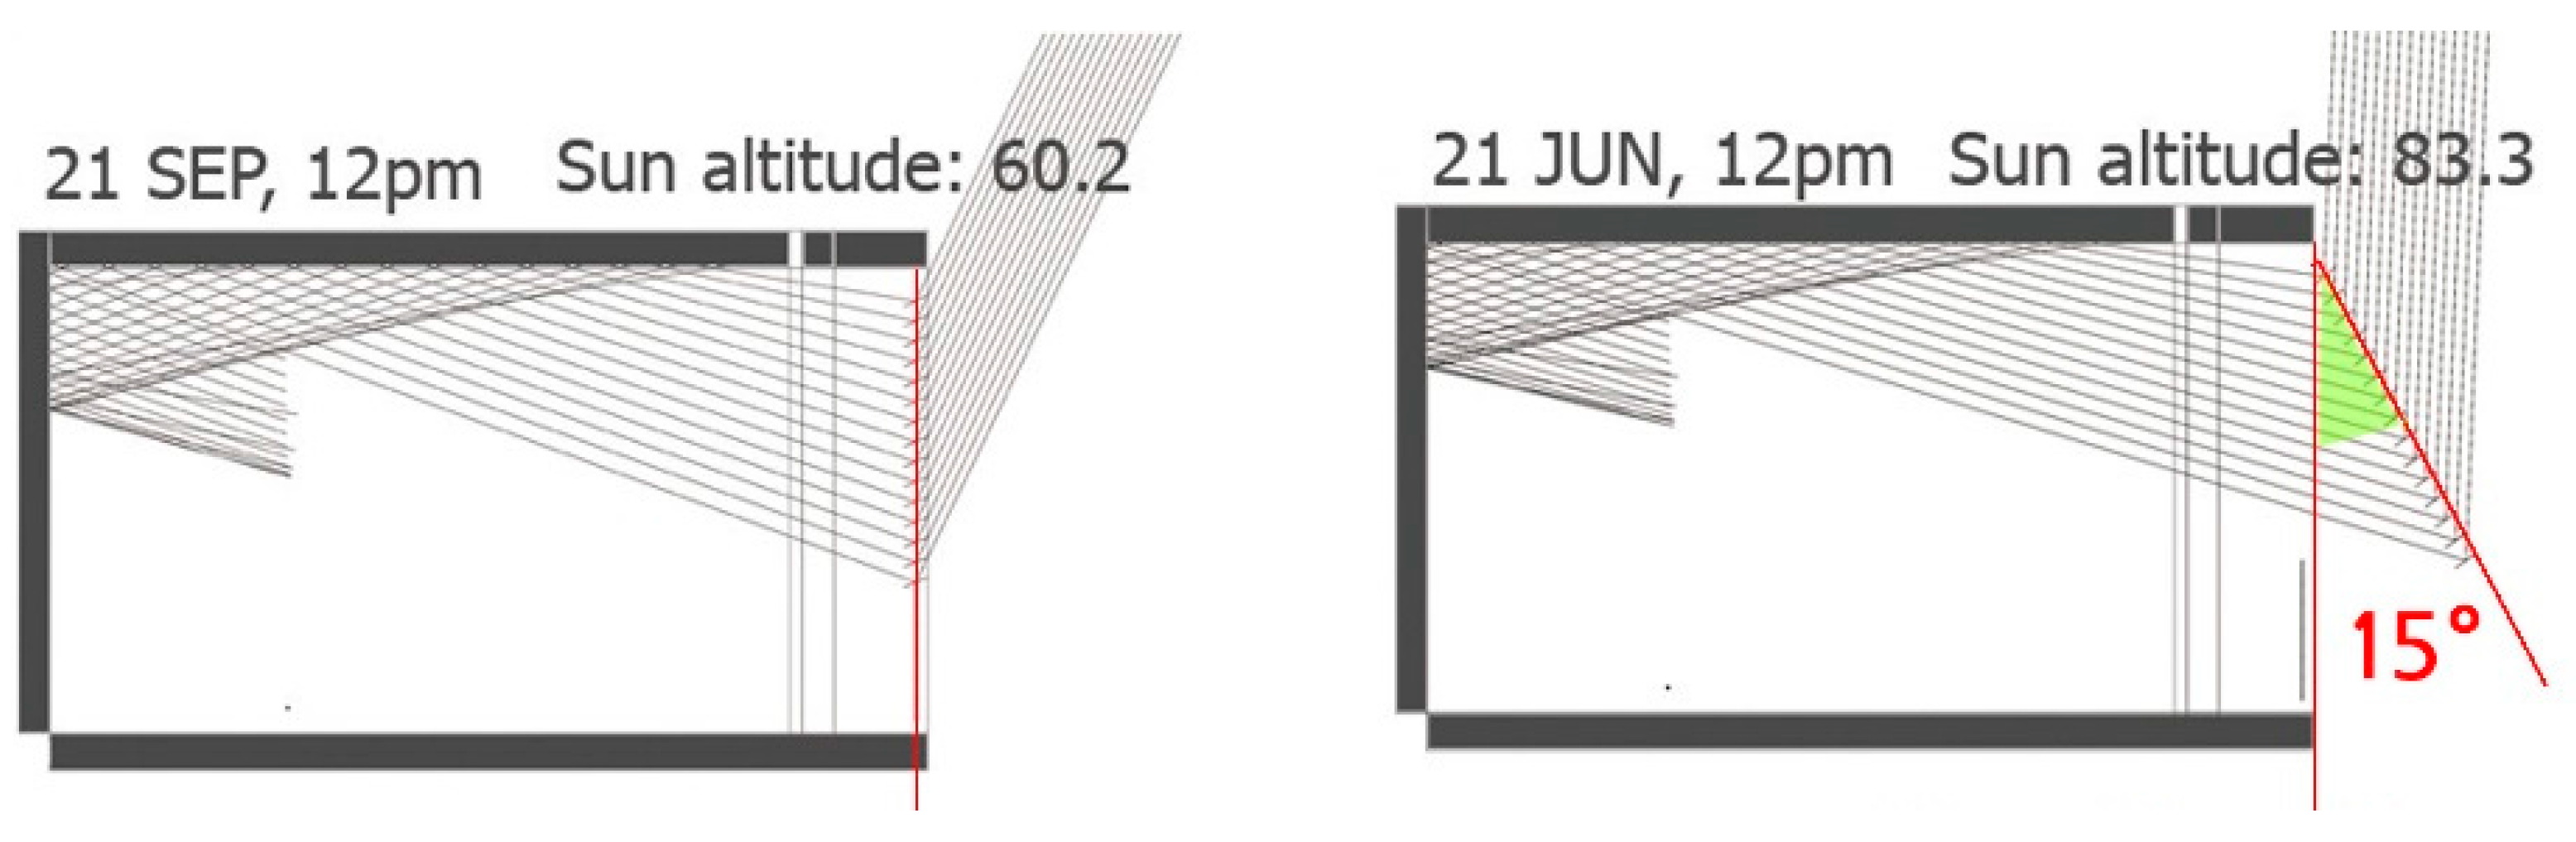
Figure 3.
The five different orientations of the office room.
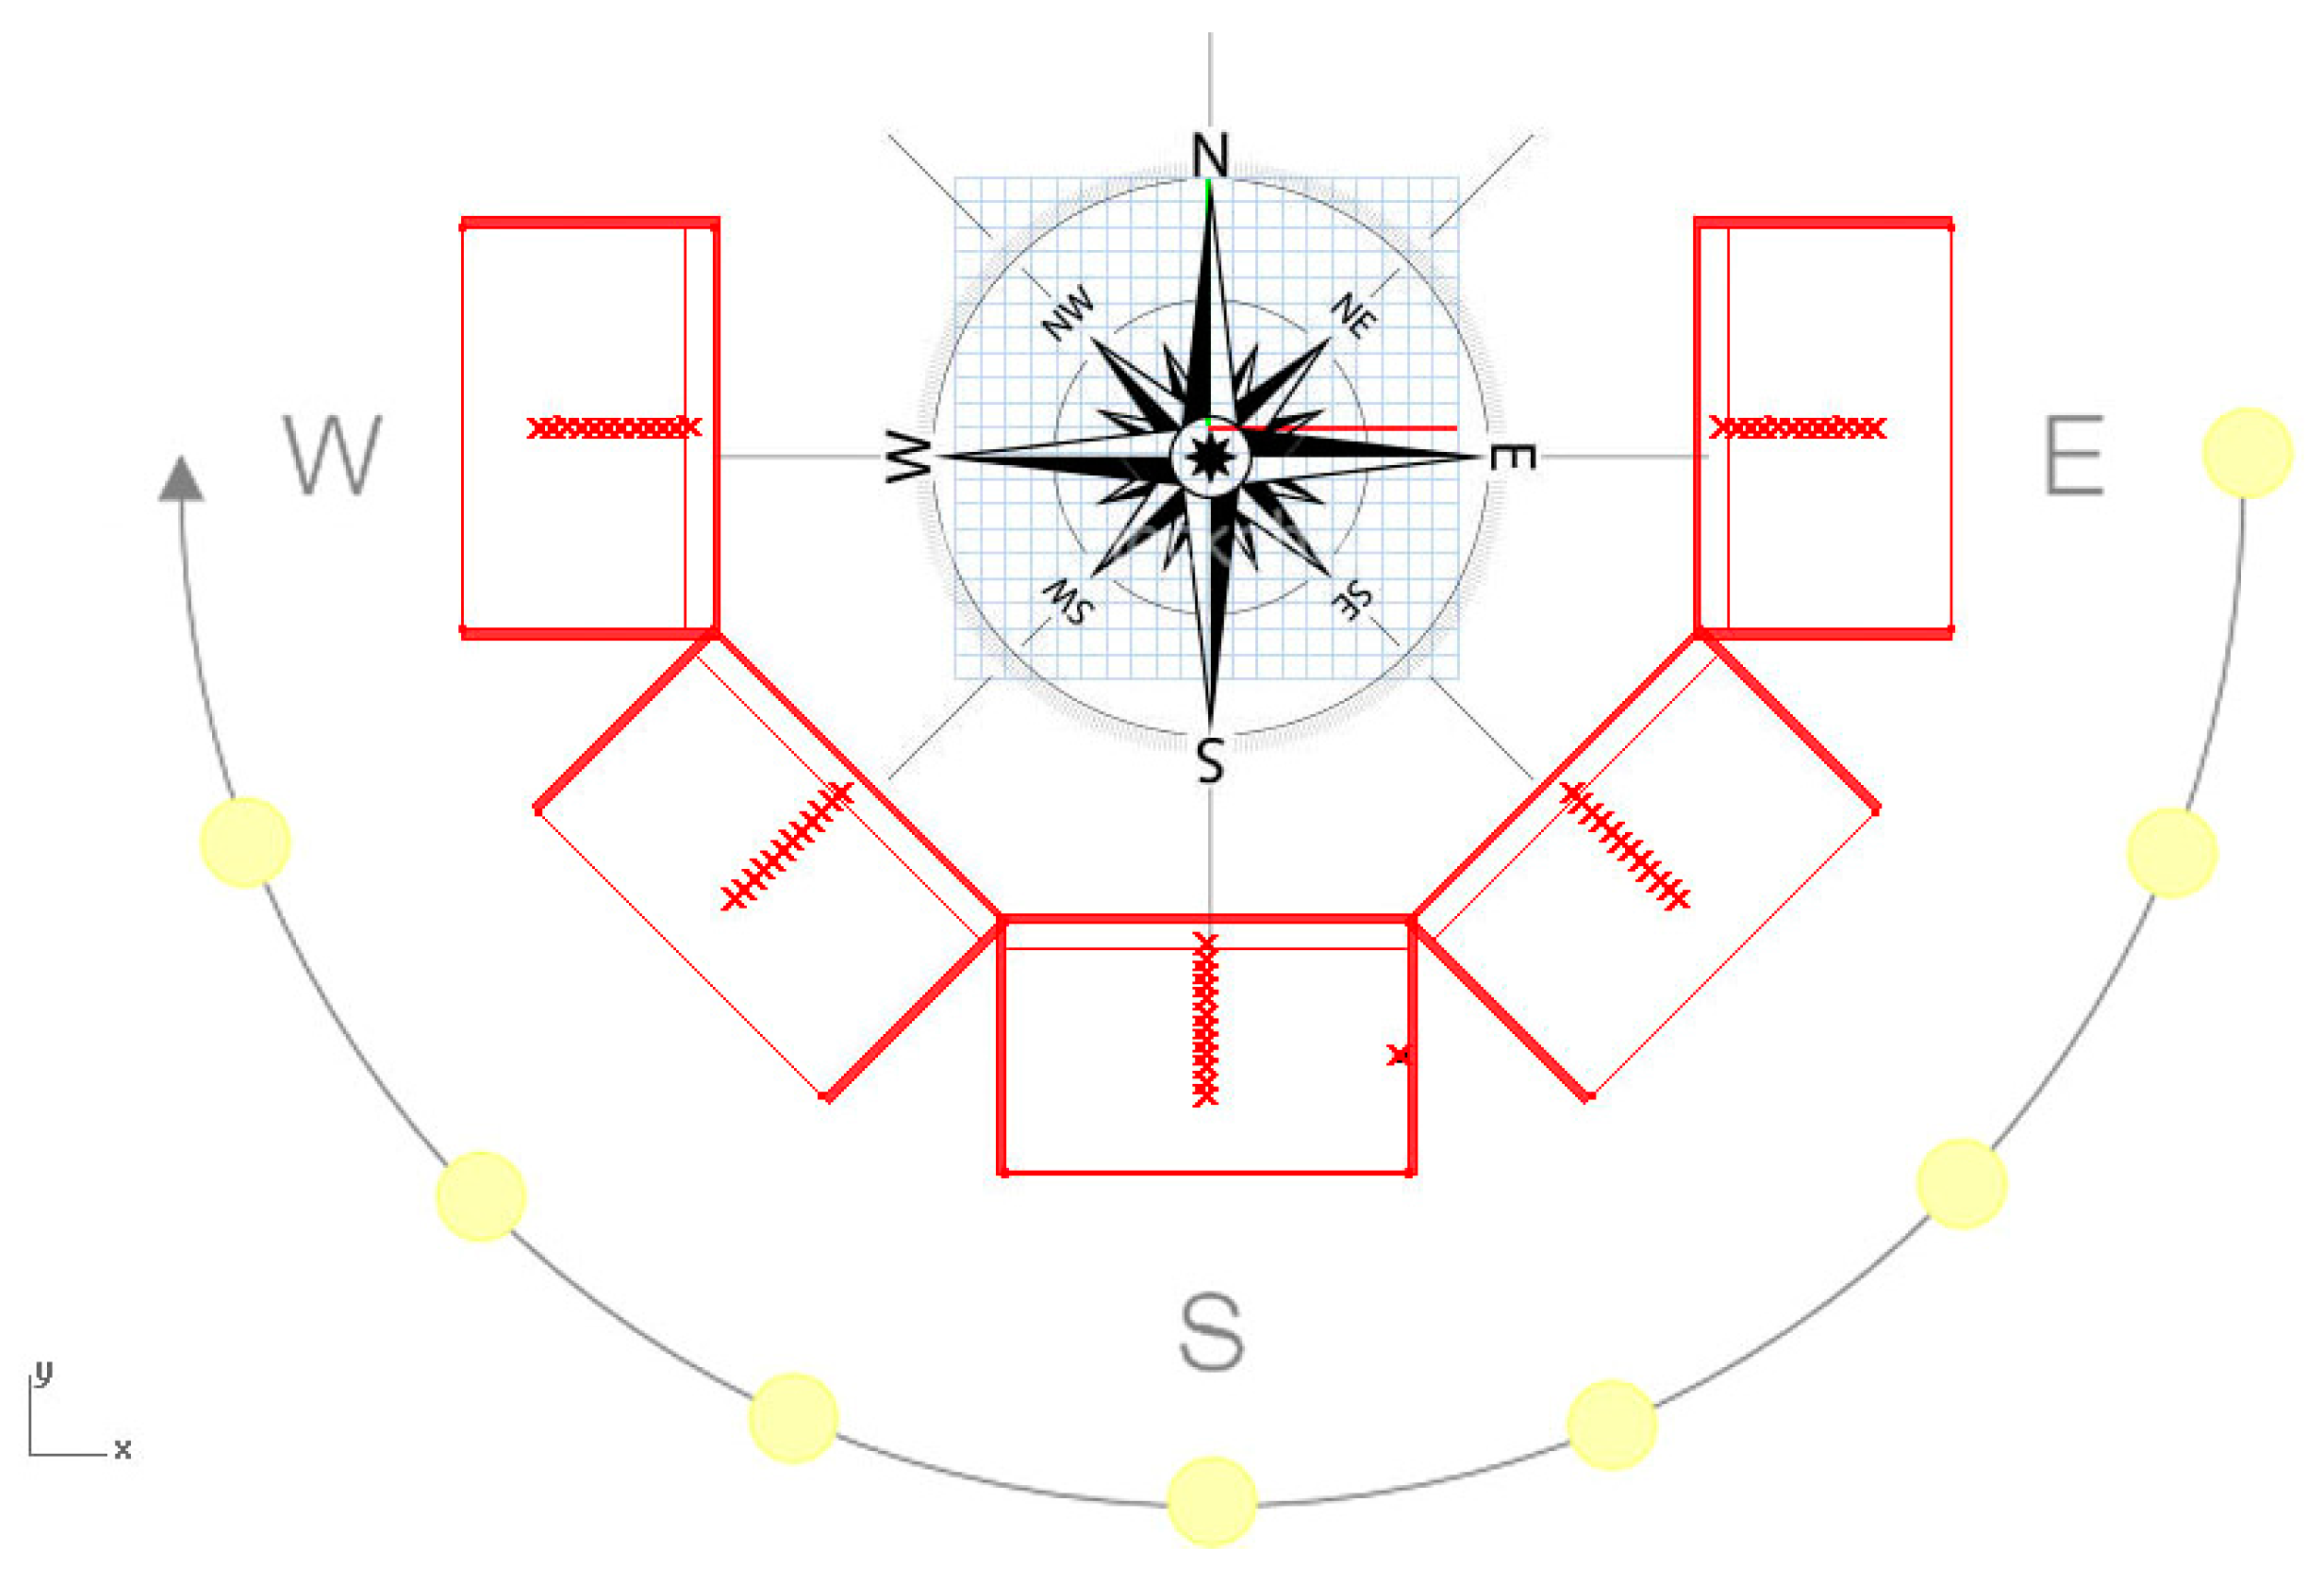
Figure 4.
Daylight coverage analysis during the working hours using conventional system for a south oriented office room on 21 June (a); September (b); and December (c).
Figure 4.
Daylight coverage analysis during the working hours using conventional system for a south oriented office room on 21 June (a); September (b); and December (c).

Figure 5.
Daylight coverage analysis during the working hours using parametric system for a south oriented office room on 21 June (a); September (b); and December (c).
Figure 5.
Daylight coverage analysis during the working hours using parametric system for a south oriented office room on 21 June (a); September (b); and December (c).

Figure 6.
Coverage percentage between 300 and 500 lux during the working hours in 21 June, September and December by using the conventional system for the South oriented room.
Figure 6.
Coverage percentage between 300 and 500 lux during the working hours in 21 June, September and December by using the conventional system for the South oriented room.

Figure 7.
Coverage percentage between 300 and 500 lux during the working hours in 21 June, September and December by using the parametric system for the South oriented room.
Figure 7.
Coverage percentage between 300 and 500 lux during the working hours in 21 June, September and December by using the parametric system for the South oriented room.
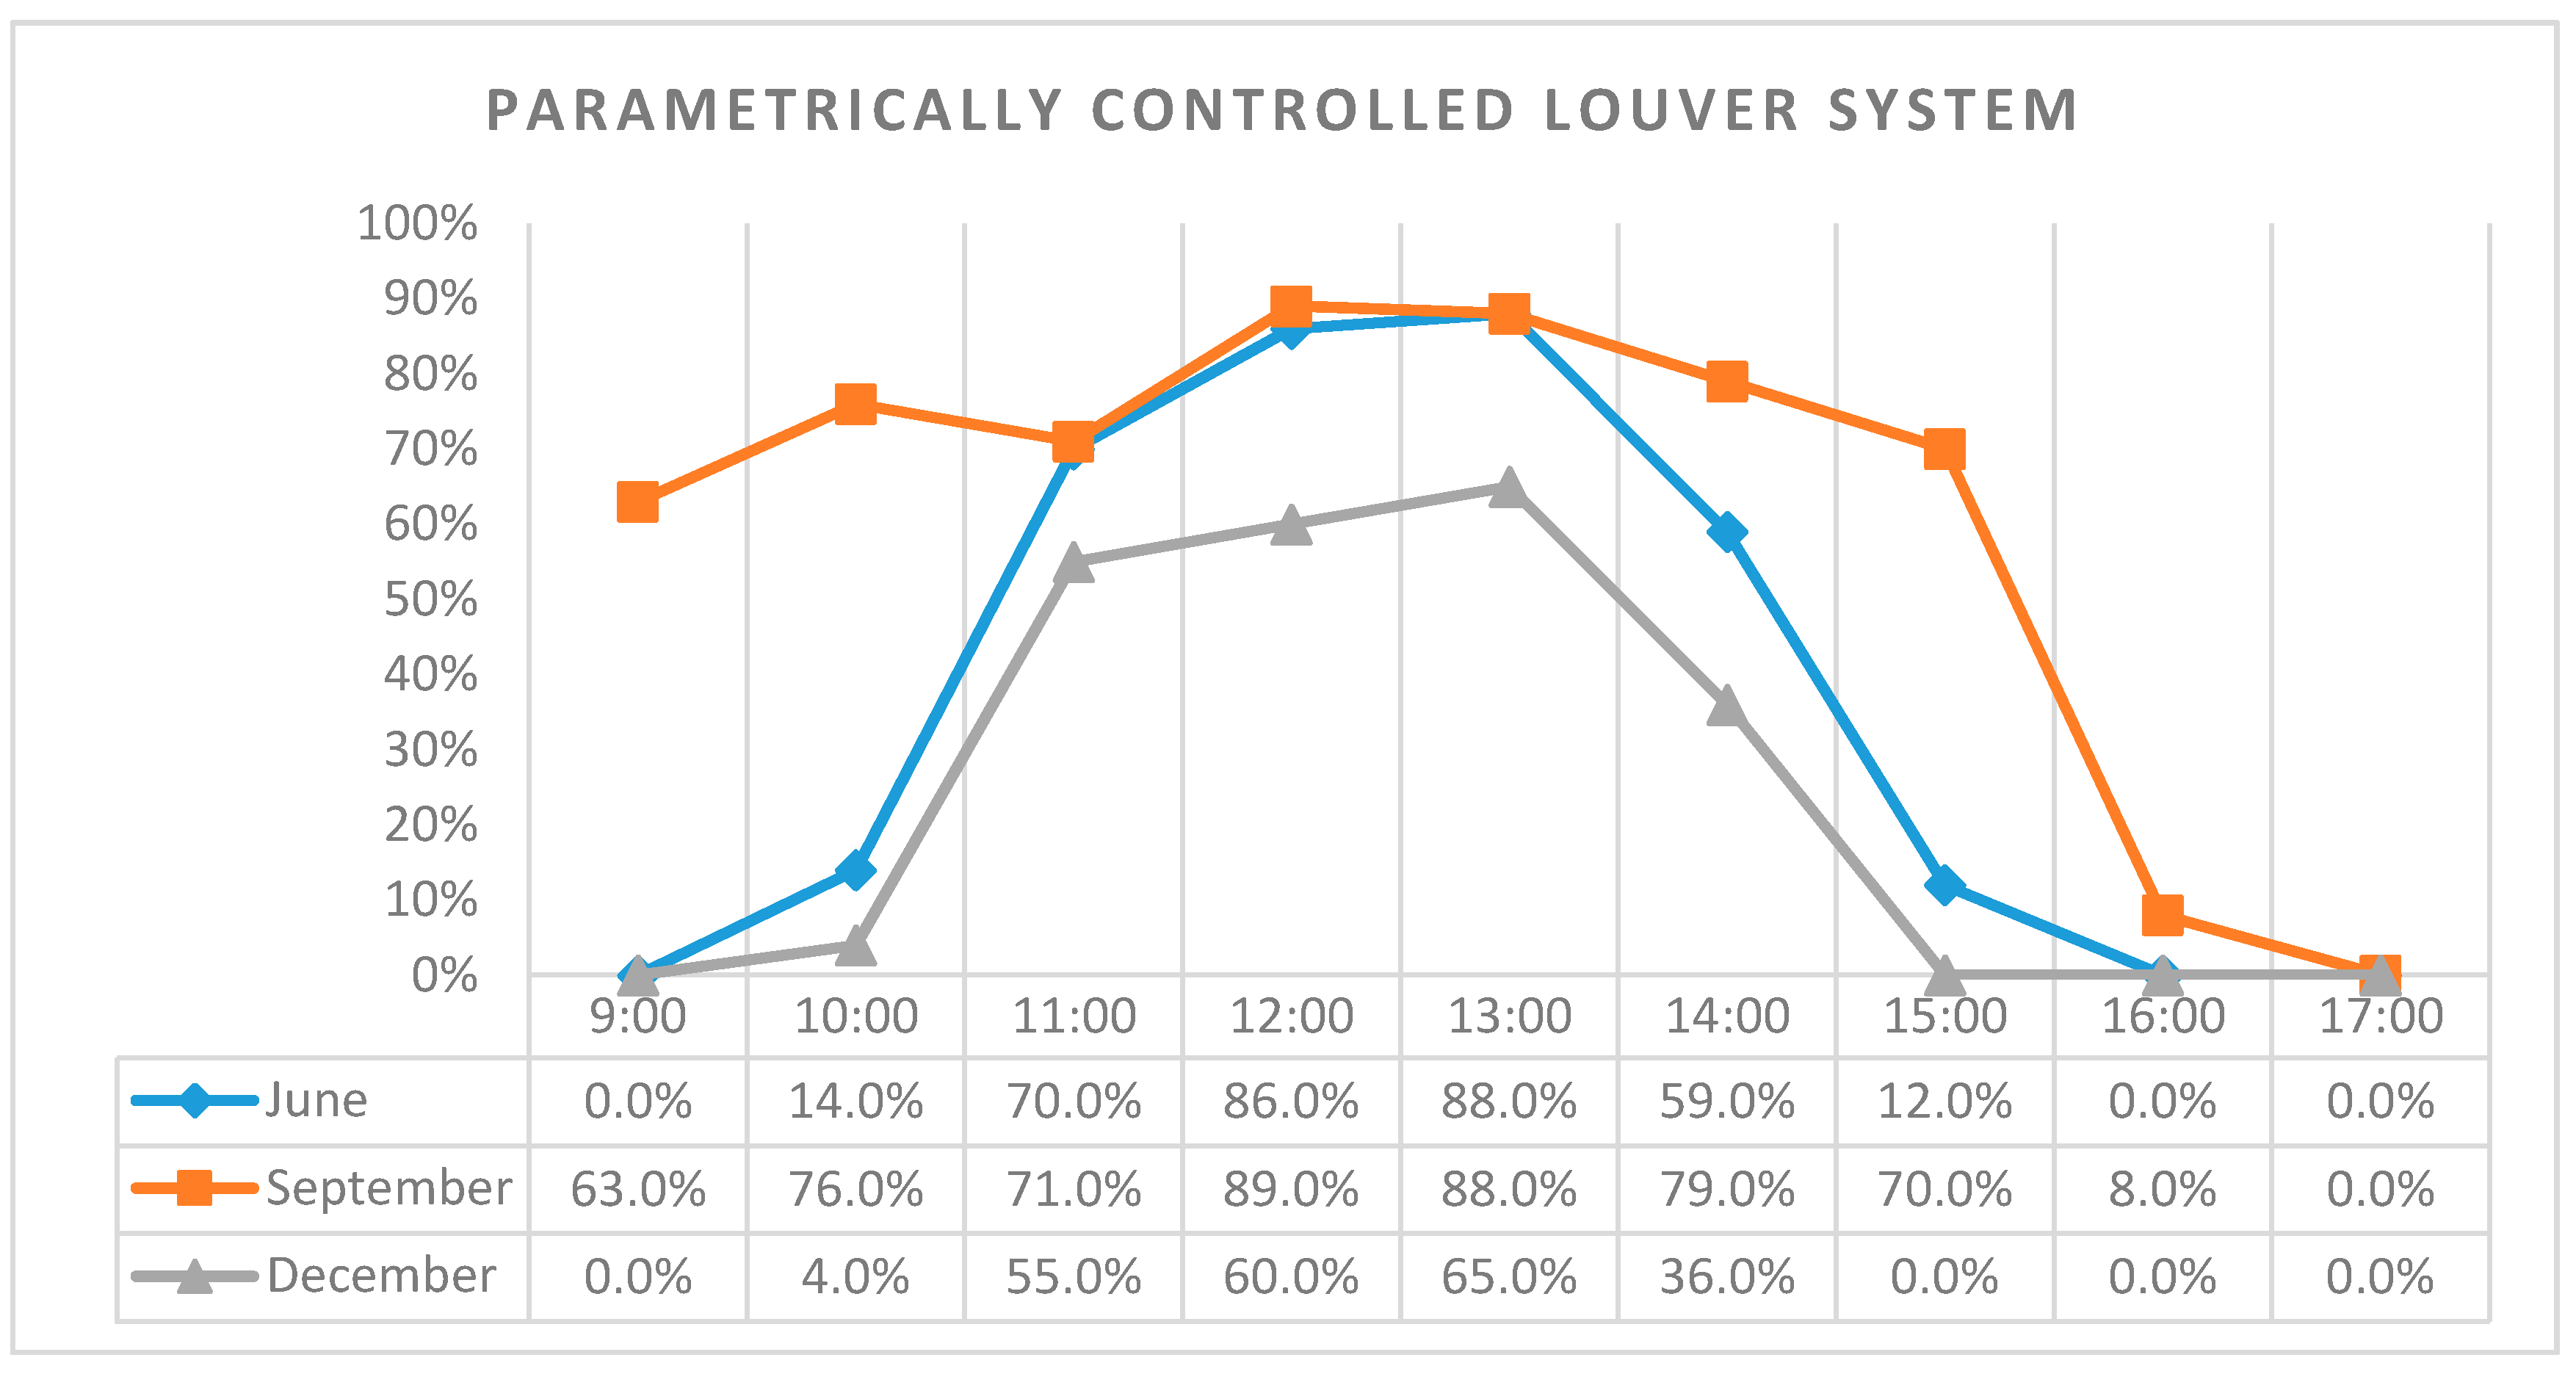
Figure 8.
Coverage percentage between 300 and 500 lux during the working hours for the office room on the five orientations on 21 June, using the conventional daylighting system.
Figure 8.
Coverage percentage between 300 and 500 lux during the working hours for the office room on the five orientations on 21 June, using the conventional daylighting system.

Figure 9.
Coverage percentage between 300 and 500 lux during the working hours for the office room on the five orientations on 21 September, using the conventional daylighting system.
Figure 9.
Coverage percentage between 300 and 500 lux during the working hours for the office room on the five orientations on 21 September, using the conventional daylighting system.

Figure 10.
Coverage percentage between 300 and 500 lux during the working hours for the office room on the five orientations on 21 December, using the conventional daylighting system.
Figure 10.
Coverage percentage between 300 and 500 lux during the working hours for the office room on the five orientations on 21 December, using the conventional daylighting system.
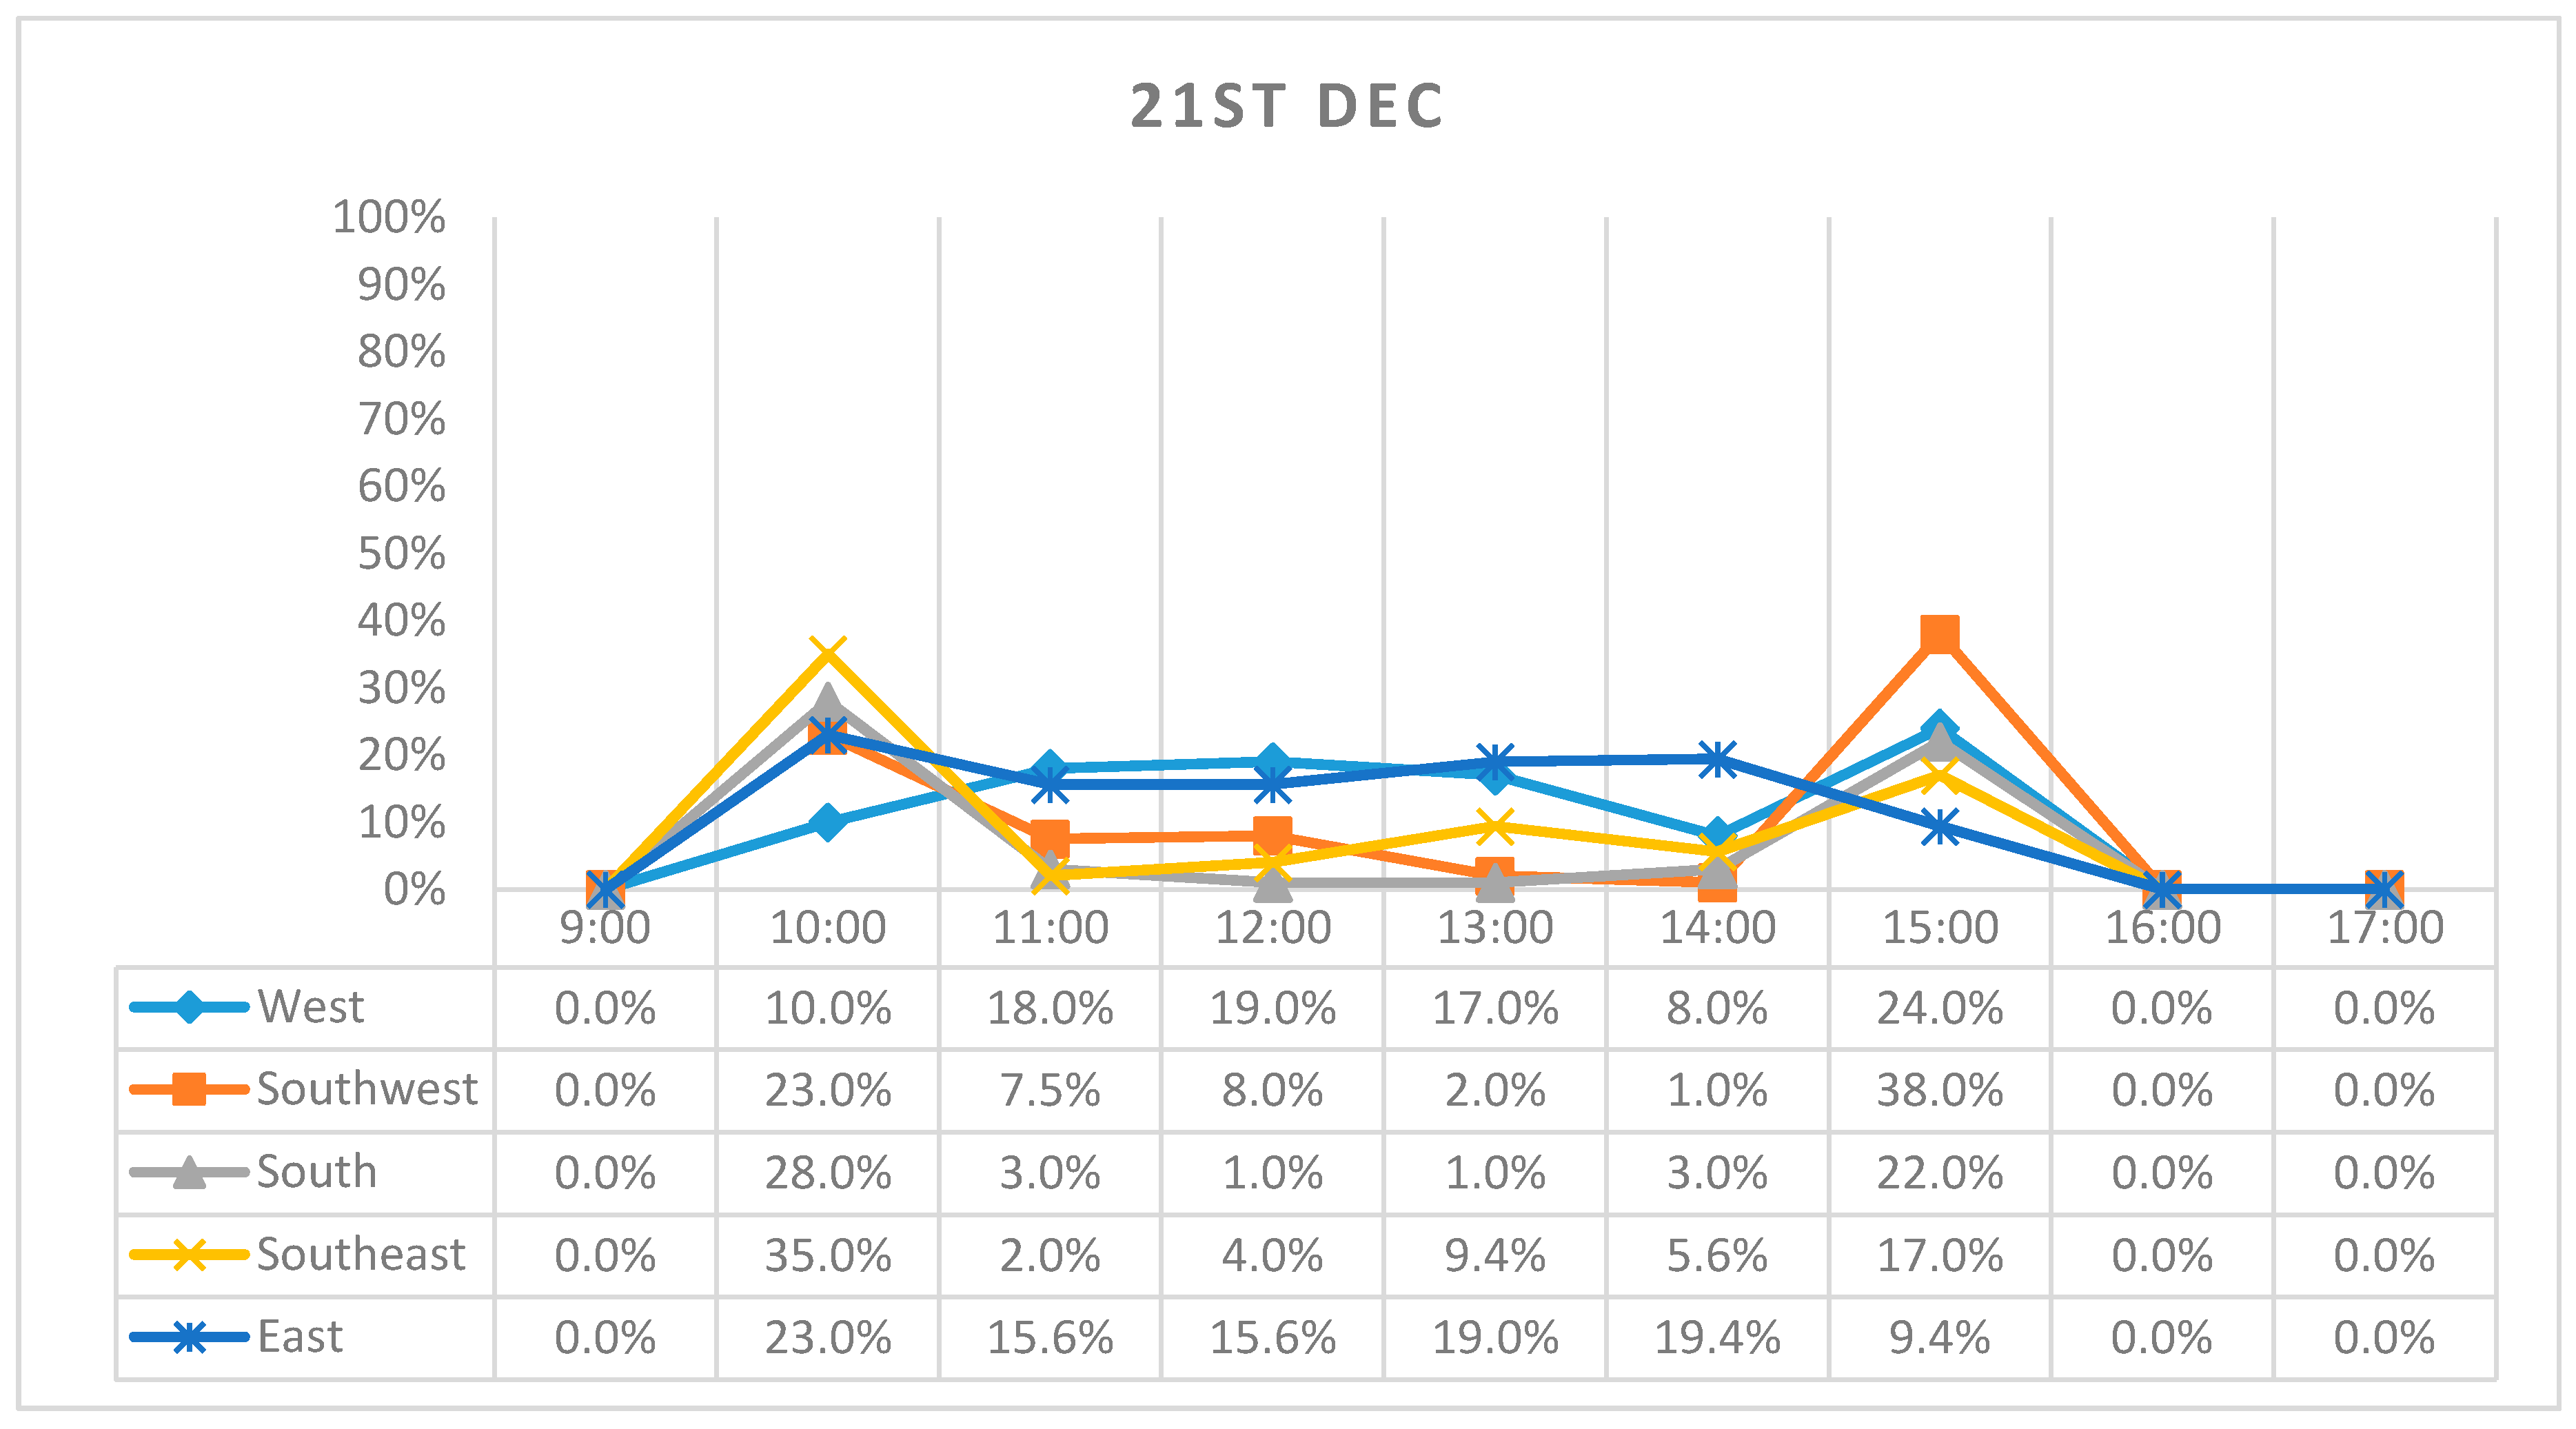
Figure 11.
Daily average coverage percentage in June (a); September (b); and December (c) by using the conventional system on the five orientations.
Figure 11.
Daily average coverage percentage in June (a); September (b); and December (c) by using the conventional system on the five orientations.
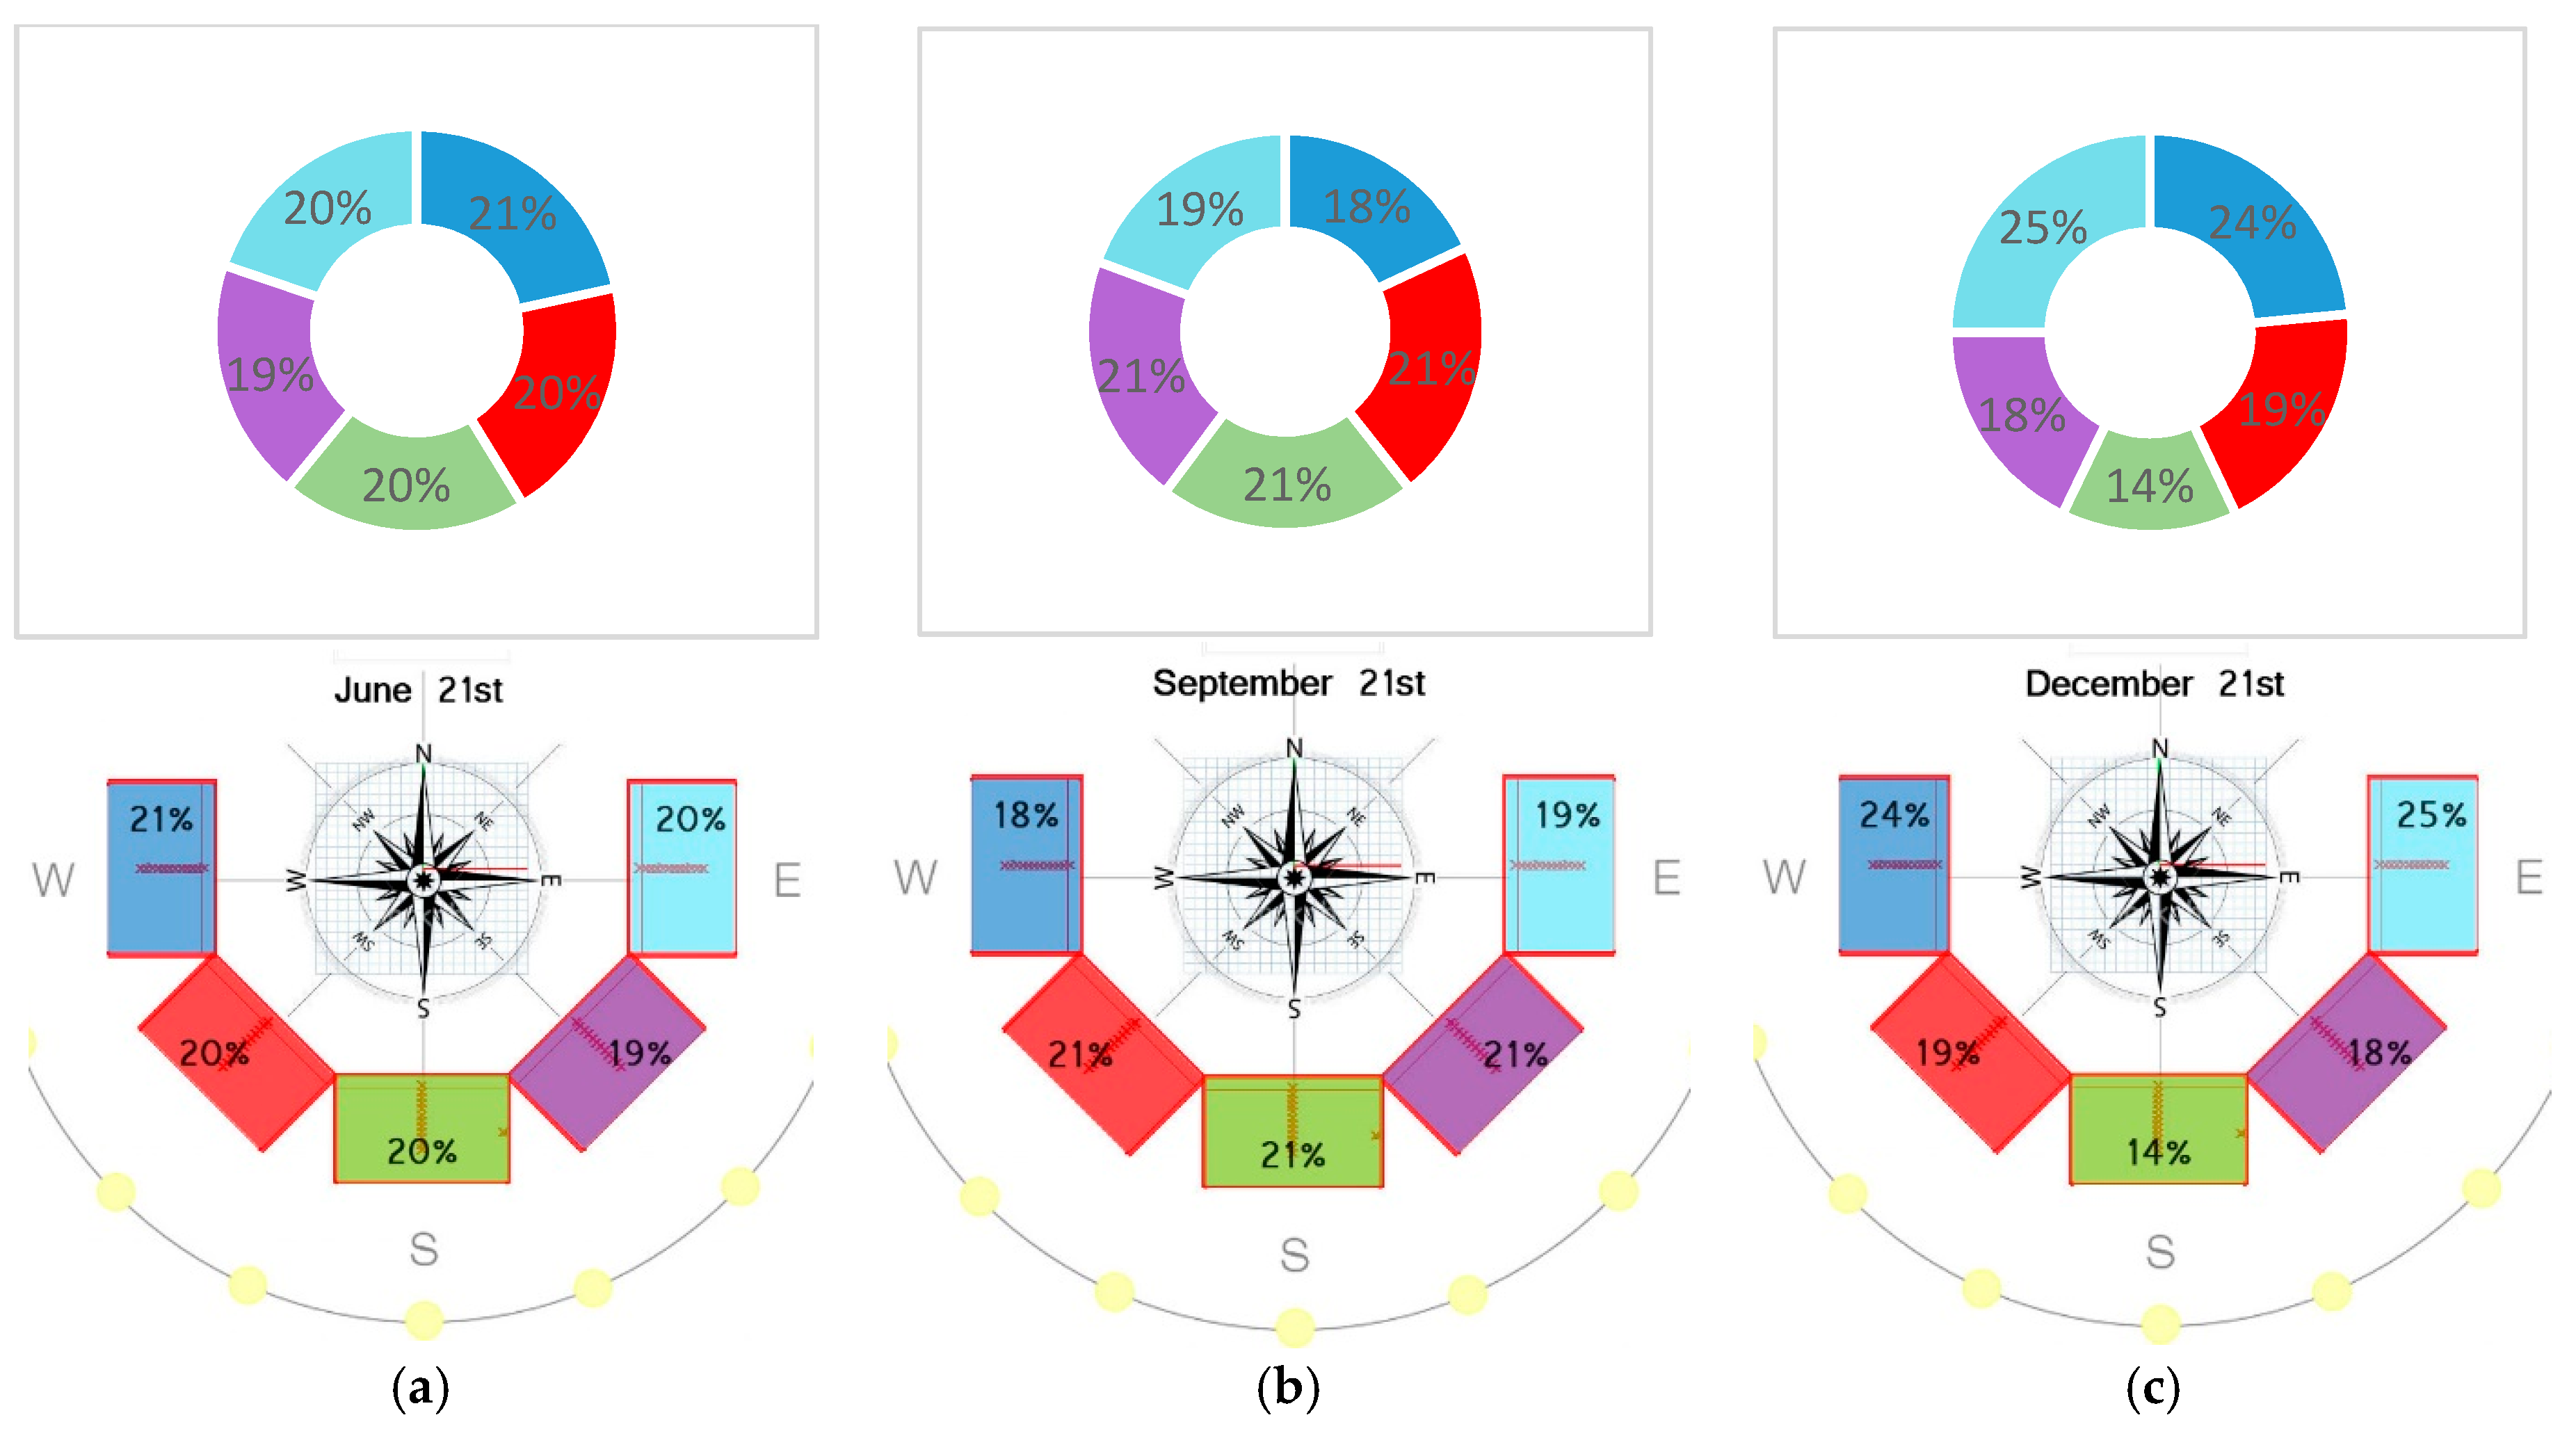
Figure 12.
Coverage percentage during the working hours for the office room through the five orientations on 21 June, using the parametric system.
Figure 12.
Coverage percentage during the working hours for the office room through the five orientations on 21 June, using the parametric system.

Figure 13.
Coverage percentage during the working hours for the office room through the five orientations on 21 September, using the parametric system.
Figure 13.
Coverage percentage during the working hours for the office room through the five orientations on 21 September, using the parametric system.

Figure 14.
Coverage percentage during the working hours for the office room through the five orientations on 21 December, using the parametric system.
Figure 14.
Coverage percentage during the working hours for the office room through the five orientations on 21 December, using the parametric system.
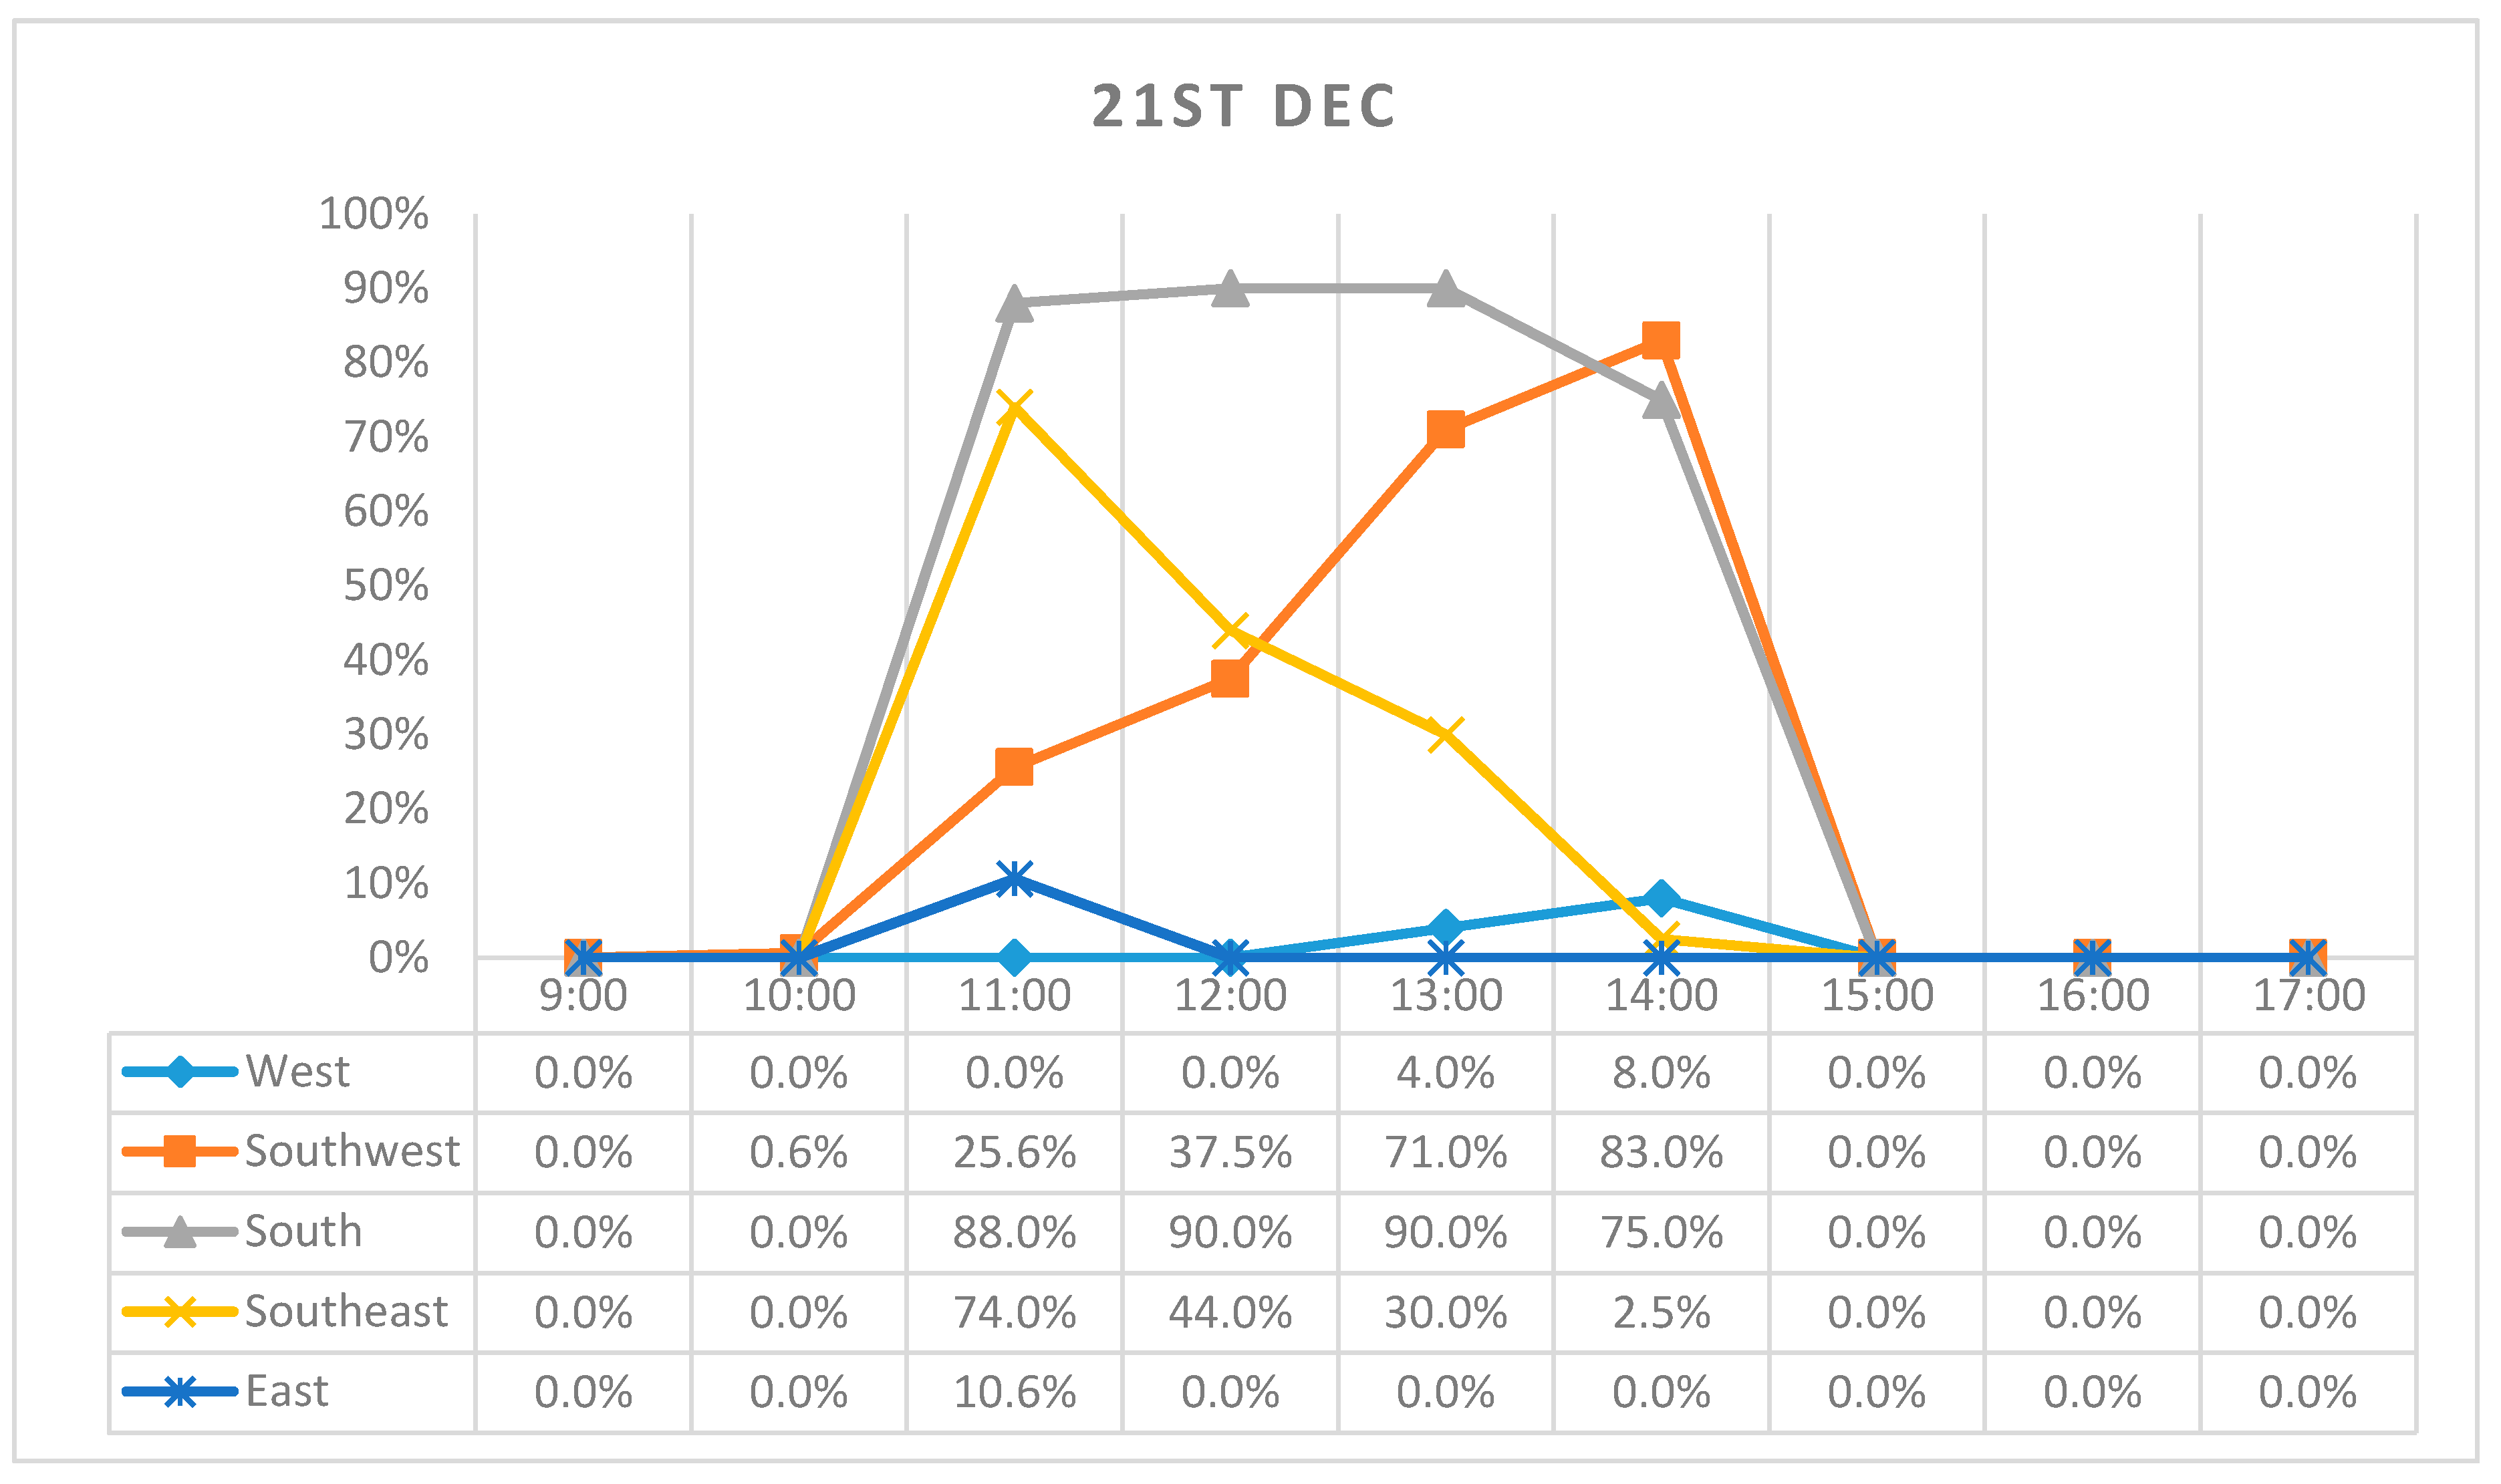
Figure 15.
Daily average coverage percentage in June (a); September (b); and December (c) by using the parametric system on the five orientations.
Figure 15.
Daily average coverage percentage in June (a); September (b); and December (c) by using the parametric system on the five orientations.
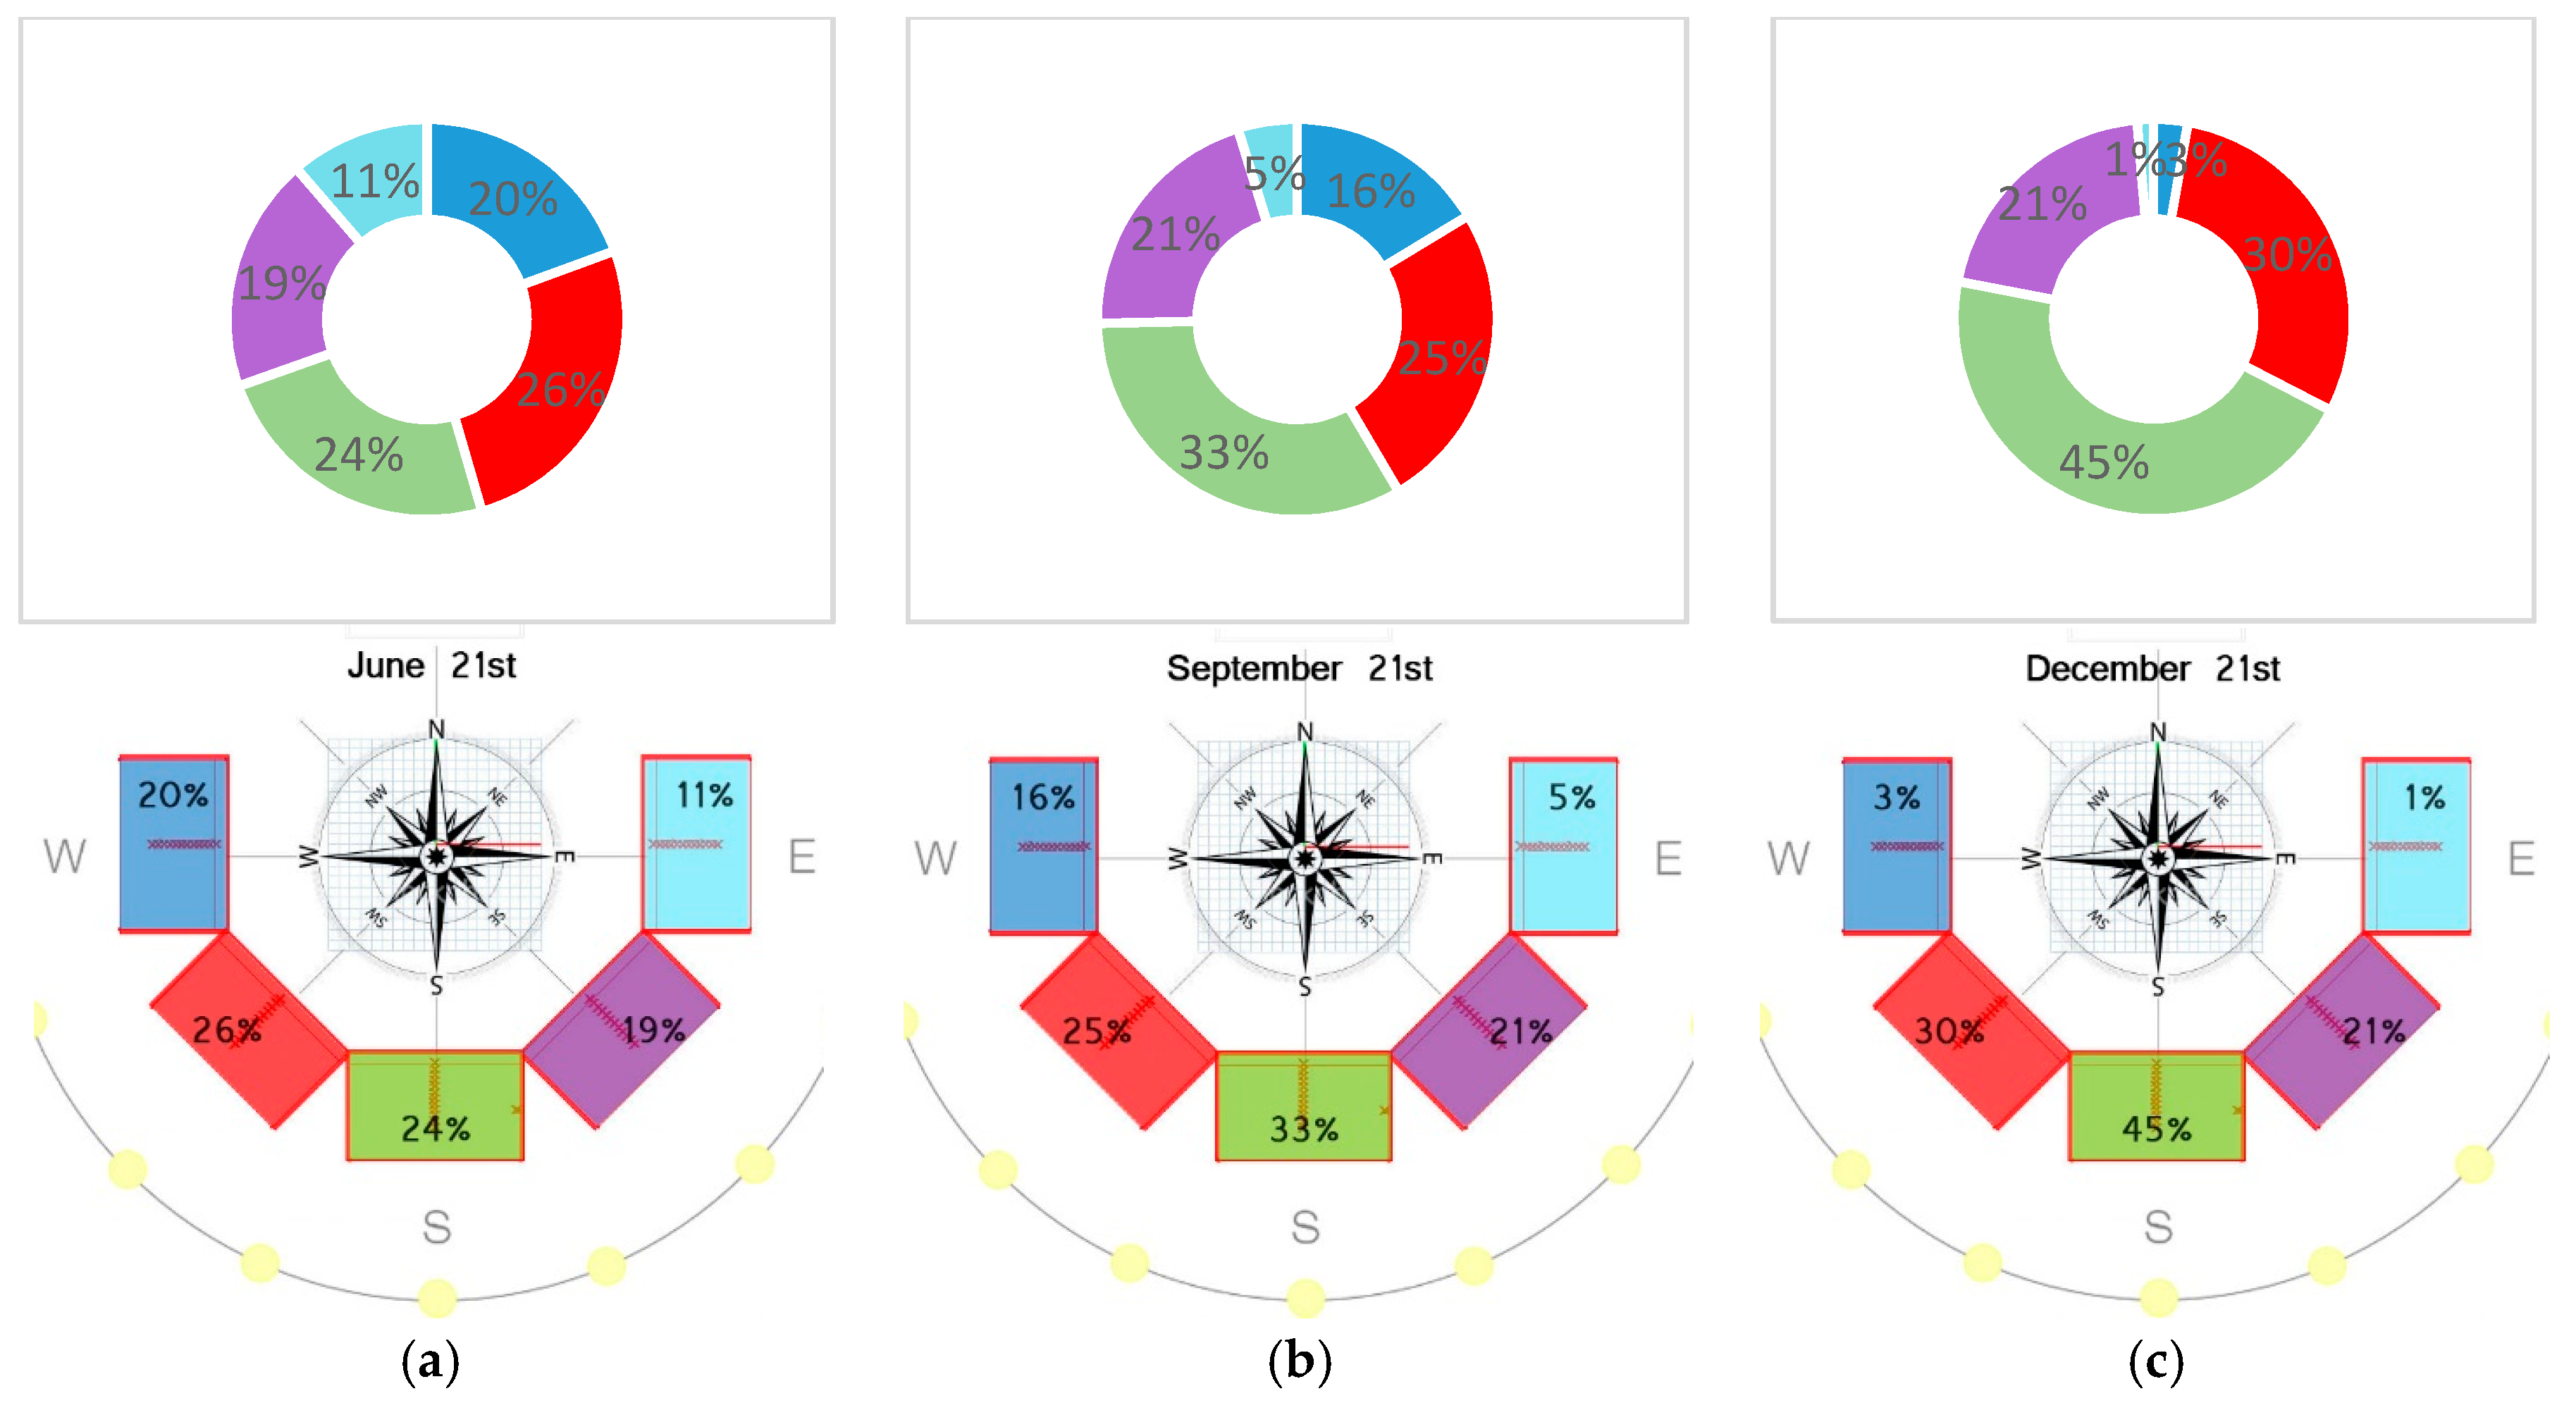
Figure 16.
Monthly consumed electrical lighting in the office room by using the parametric system.

Figure 17.
Monthly averaged daylight coverage percentage in the office room for the daylight illuminance range of 300~500 lux by using the parametrically controlled system.
Figure 17.
Monthly averaged daylight coverage percentage in the office room for the daylight illuminance range of 300~500 lux by using the parametrically controlled system.
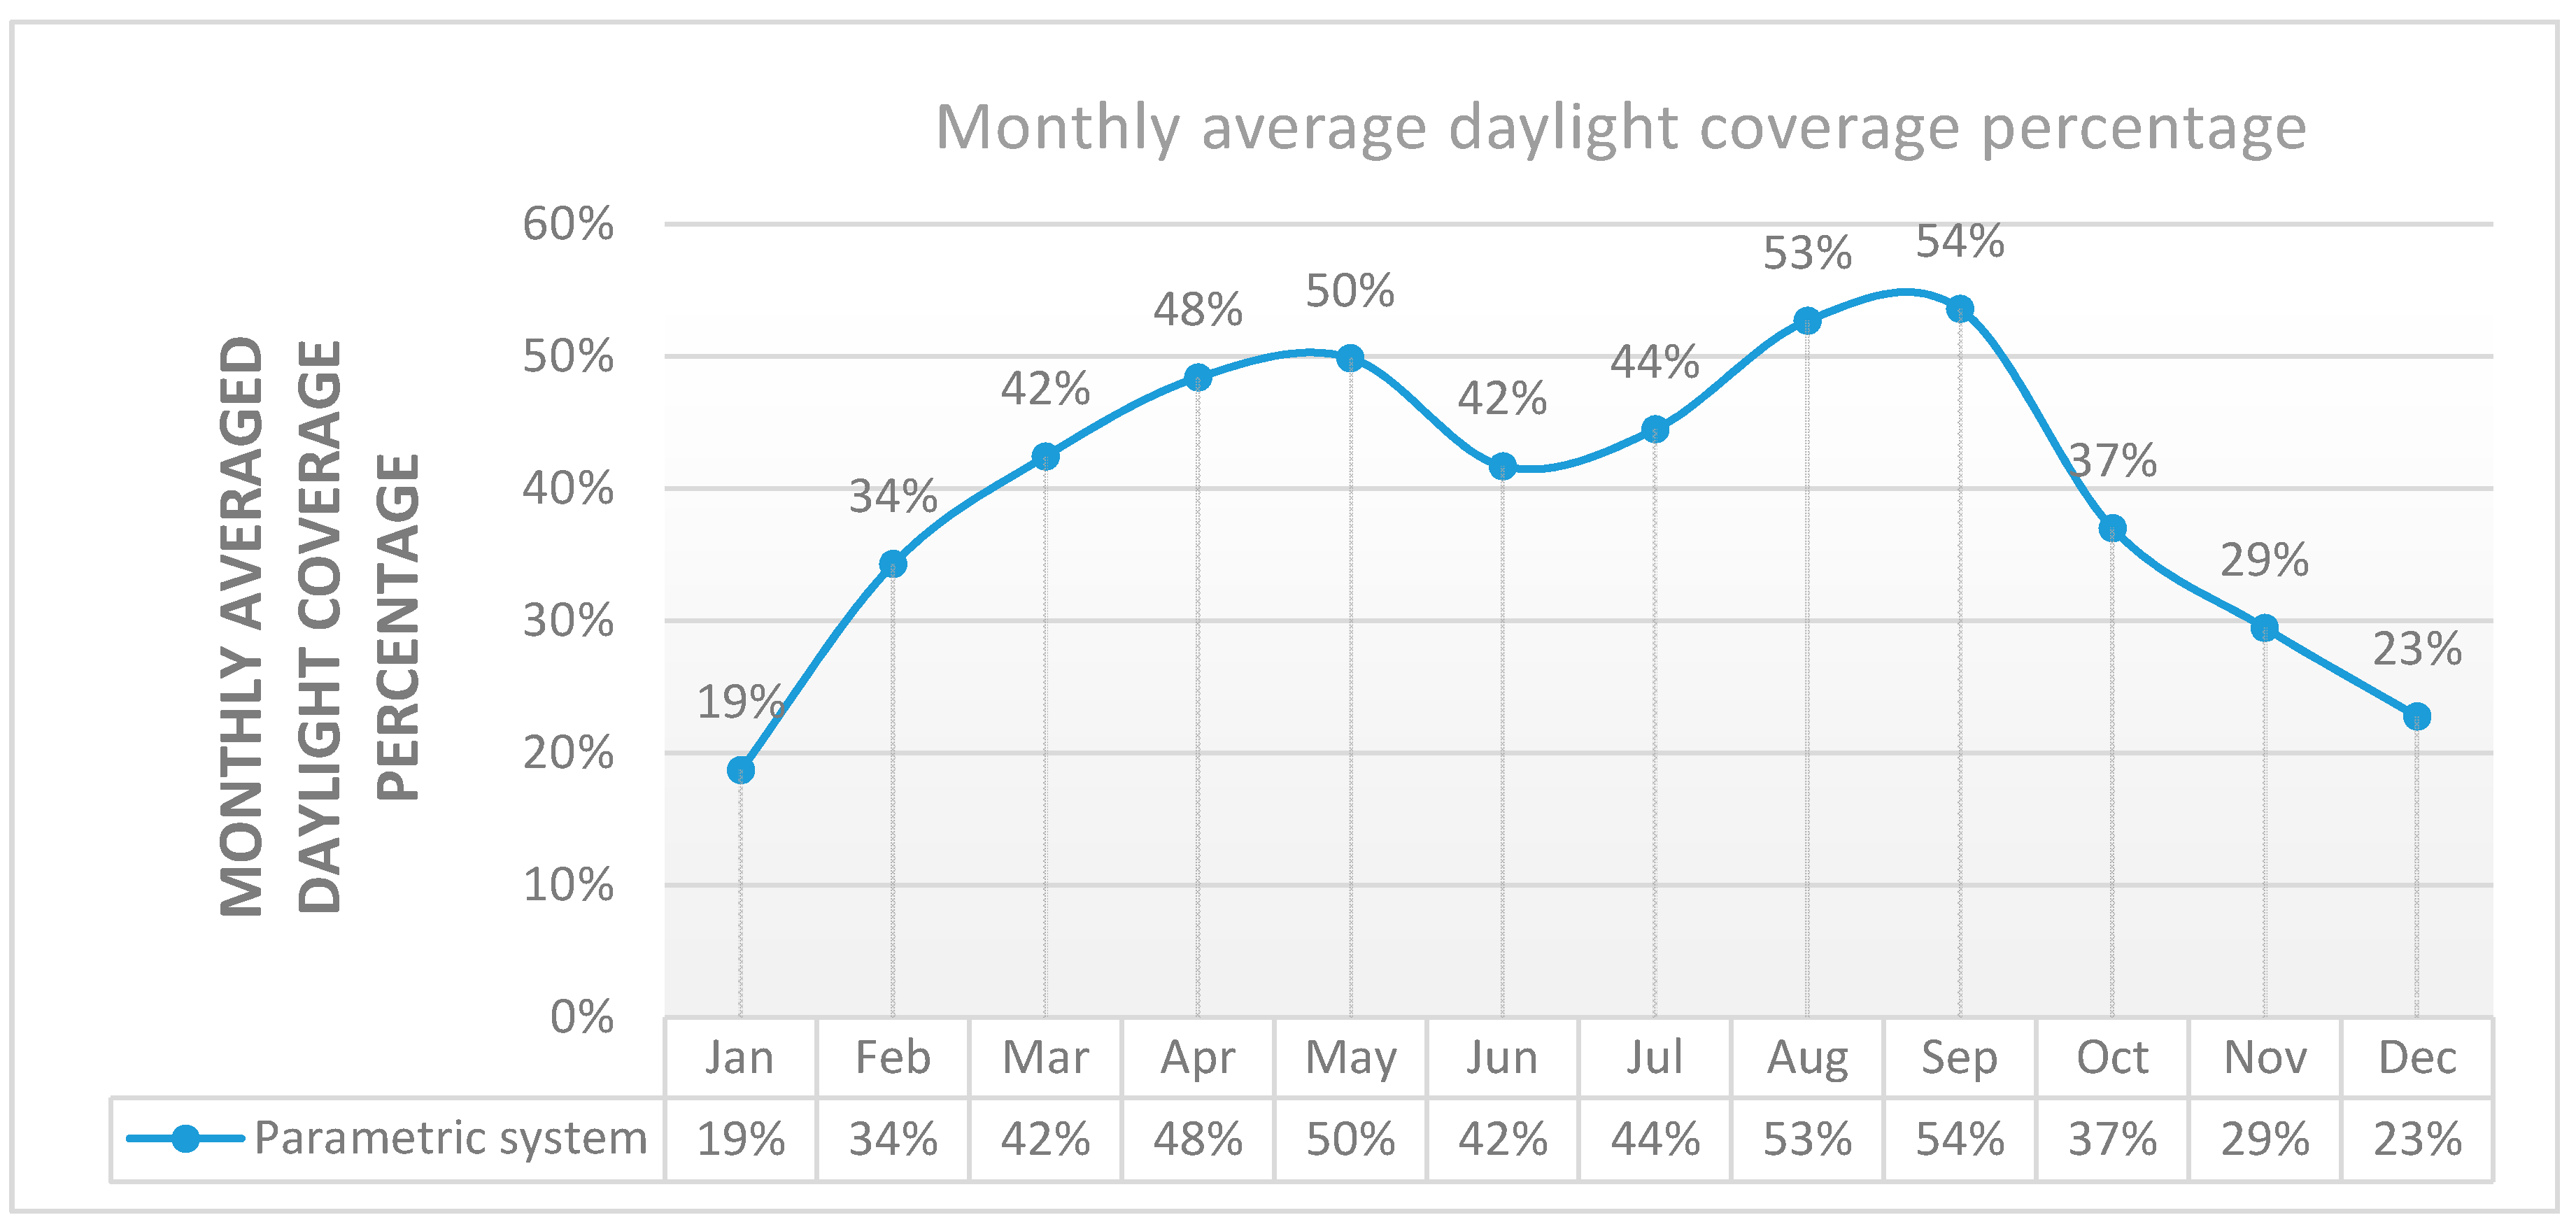
Figure 18.
Daylight analysis by using different accuracy settings for the same time and date, showing 79%, 77% and 72% of daylight coverage, respectively.
Figure 18.
Daylight analysis by using different accuracy settings for the same time and date, showing 79%, 77% and 72% of daylight coverage, respectively.


Table 1.
Daily average electrical lighting energy consumption Wh/m2 at the desk level in Birmingham, UK by using the compatible parametric system.
Table 1.
Daily average electrical lighting energy consumption Wh/m2 at the desk level in Birmingham, UK by using the compatible parametric system.
| Jan | Feb | Mar | Apr | May | Jun | Jul | Aug | Sep | Oct | Nov | Dec | |
|---|---|---|---|---|---|---|---|---|---|---|---|---|
| 1 | 2.7 | 2.5 | 2.3 | 2.3 | 2.3 | 1.8 | 2.7 | 3.3 | ||||
| 2 | 4.5 | 4.2 | 2.4 | 2.7 | 2.3 | 2.5 | 3.2 | |||||
| 3 | 3.1 | 4.5 | 4.1 | 1.8 | 2.2 | 2.7 | 2.3 | 2.5 | 2.4 | |||
| 4 | 4.4 | 3.5 | 2.9 | 1.9 | 2.7 | 2.0 | 2.1 | 3.7 | 4.1 | |||
| 5 | 4.5 | 2.1 | 1.9 | 2.6 | 2.8 | 1.9 | 2.7 | 3.0 | ||||
| 6 | 3.0 | 3.1 | 2.3 | 2.7 | 2.6 | 1.4 | 2.6 | 2.7 | 2.7 | |||
| 7 | 3.3 | 3.5 | 3.8 | 2.0 | 2.8 | 2.6 | 2.1 | 1.8 | 2.7 | 3.2 | ||
| 8 | 2.7 | 3.1 | 2.0 | 2.5 | 2.4 | 1.7 | 3.5 | 3.1 | ||||
| 9 | 4.5 | 1.9 | 2.0 | 2.7 | 2.1 | 3.0 | 4.3 | |||||
| 10 | 4.0 | 1.0 | 2.5 | 2.5 | 2.1 | 2.7 | 1.9 | 2.4 | 3.7 | |||
| 11 | 3.0 | 4.5 | 2.1 | 2.0 | 2.6 | 2.2 | 1.9 | 2.5 | 3.0 | |||
| 12 | 3.2 | 2.3 | 2.1 | 2.5 | 2.5 | 1.5 | 2.2 | 4.5 | ||||
| 13 | 3.6 | 1.8 | 2.3 | 2.7 | 2.7 | 2.1 | 2.4 | 2.8 | 4.5 | |||
| 14 | 3.7 | 2.7 | 2.3 | 2.1 | 2.4 | 2.6 | 2.2 | 2.1 | 2.7 | 3.5 | ||
| 15 | 2.1 | 1.9 | 2.5 | 2.6 | 2.1 | 2.6 | 2.7 | 3.5 | ||||
| 16 | 2.8 | 3.2 | 2.2 | 2.2 | 2.1 | 3.3 | 3.0 | |||||
| 17 | 4.5 | 2.5 | 2.3 | 2.0 | 2.3 | 2.5 | 2.3 | 4.4 | 3.0 | |||
| 18 | 2.7 | 2.4 | 2.4 | 2.3 | 2.5 | 2.1 | 2.3 | 4.3 | 3.2 | |||
| 19 | 4.5 | 2.2 | 2.3 | 2.5 | 2.5 | 2.3 | 2.3 | 3.0 | ||||
| 20 | 2.9 | 2.2 | 2.3 | 2.8 | 2.5 | 1.7 | 2.2 | 2.6 | 3.6 | |||
| 21 | 2.6 | 3.2 | 2.7 | 2.8 | 2.3 | 1.8 | 1.8 | 3.1 | 3.1 | |||
| 22 | 2.3 | 2.1 | 2.6 | 2.9 | 2.1 | 2.0 | 3.4 | 4.5 | ||||
| 23 | 4.2 | 2.8 | 2.0 | 2.4 | 2.7 | 2.2 | 4.4 | 4.1 | ||||
| 24 | 3.1 | 2.3 | 1.8 | 2.7 | 2.6 | 2.3 | 2.1 | 2.3 | 4.1 | |||
| 25 | 4.5 | 2.7 | 2.6 | 2.3 | 2.3 | 1.9 | 2.3 | 3.0 | 3.6 | |||
| 26 | 4.2 | 2.5 | 2.0 | 3.0 | 2.4 | 3.1 | 2.6 | 3.0 | ||||
| 27 | 4.5 | 2.1 | 2.3 | 2.3 | 2.1 | 2.3 | 2.6 | 3.2 | 3.1 | |||
| 28 | 2.7 | 2.2 | 2.3 | 2.7 | 2.3 | 2.2 | 2.6 | 3.2 | 3.5 | |||
| 29 | 2.6 | 2.2 | 2.5 | 2.7 | 1.9 | 2.6 | 3.3 | 4.1 | ||||
| 30 | 2.6 | 2.7 | 2.6 | 2.7 | 2.2 | 2.5 | 3.4 | |||||
| 31 | 3.6 | 2.6 | 2.5 | 2.3 | 2.1 | 2.2 | ||||||
| Parametric system Wh/m2 | 3.67 | 2.96 | 2.59 | 2.32 | 2.26 | 2.62 | 2.50 | 2.13 | 2.09 | 2.84 | 3.17 | 3.48 |
| Conventional system Wh/m2 | ||||||||||||
| Conv. Over 300 lux | 1.58 | 2.18 | 1.86 | 0.95 | 0.11 | 0.07 | 0.28 | 0.56 | 1.93 | 2.60 | 1.86 | 0.81 |
| Conv. 300~500 lux | 3.30 | 3.45 | 3.59 | 4.04 | 4.39 | 4.43 | 4.22 | 3.94 | 3.13 | 3.34 | 3.41 | 4.22 |
| Nominal energy consumption | ||||||||||||
| Wh/m2 | 4.50 | |||||||||||
Table 2.
Daily daylight coverage percentage for the daylight illuminance range of 300~500 lux at the desk level in Birmingham, UK by using the proposed parametric system.
Table 2.
Daily daylight coverage percentage for the daylight illuminance range of 300~500 lux at the desk level in Birmingham, UK by using the proposed parametric system.
| Jan | Feb | Mar | Apr | May | Jun | Jul | Aug | Sep | Oct | Nov | Dec | |
|---|---|---|---|---|---|---|---|---|---|---|---|---|
| 1 | 40% | 44% | 49% | 48% | 50% | 61% | 41% | 26% | ||||
| 2 | 0% | 7% | 46% | 41% | 48% | 45% | 29% | |||||
| 3 | 36% | 0% | 10% | 60% | 52% | 41% | 48% | 45% | 46% | |||
| 4 | 3% | 22% | 36% | 58% | 40% | 56% | 54% | 17% | 10% | |||
| 5 | 0% | 54% | 58% | 42% | 38% | 57% | 39% | 34% | ||||
| 6 | 34% | 31% | 49% | 40% | 42% | 68% | 43% | 39% | 41% | |||
| 7 | 27% | 23% | 15% | 55% | 38% | 42% | 53% | 59% | 40% | 28% | ||
| 8 | 39% | 32% | 55% | 44% | 47% | 63% | 22% | 32% | ||||
| 9 | 0% | 57% | 55% | 39% | 53% | 33% | 4% | |||||
| 10 | 12% | 78% | 44% | 45% | 54% | 40% | 57% | 46% | 17% | |||
| 11 | 34% | 0% | 53% | 55% | 43% | 51% | 57% | 45% | 34% | |||
| 12 | 29% | 48% | 54% | 44% | 45% | 66% | 52% | 0% | ||||
| 13 | 21% | 60% | 48% | 41% | 39% | 54% | 47% | 37% | 0% | |||
| 14 | 18% | 39% | 48% | 53% | 46% | 42% | 51% | 54% | 40% | 22% | ||
| 15 | 53% | 58% | 45% | 43% | 53% | 42% | 39% | 22% | ||||
| 16 | 37% | 29% | 51% | 52% | 53% | 27% | 33% | |||||
| 17 | 0% | 45% | 49% | 55% | 49% | 44% | 49% | 3% | 34% | |||
| 18 | 39% | 46% | 46% | 48% | 45% | 54% | 50% | 5% | 30% | |||
| 19 | 0% | 52% | 50% | 44% | 44% | 50% | 48% | 34% | ||||
| 20 | 35% | 52% | 50% | 38% | 44% | 63% | 51% | 43% | 19% | |||
| 21 | 42% | 30% | 39% | 37% | 49% | 59% | 60% | 31% | 31% | |||
| 22 | 49% | 53% | 43% | 36% | 53% | 55% | 25% | 0% | ||||
| 23 | 7% | 37% | 56% | 47% | 41% | 51% | 3% | 9% | ||||
| 24 | 31% | 48% | 61% | 39% | 43% | 48% | 54% | 49% | 10% | |||
| 25 | 0% | 40% | 42% | 48% | 49% | 57% | 48% | 34% | 19% | |||
| 26 | 6% | 44% | 55% | 33% | 47% | 31% | 43% | 33% | ||||
| 27 | 0% | 54% | 50% | 50% | 54% | 48% | 43% | 29% | 32% | |||
| 28 | 40% | 52% | 50% | 39% | 48% | 51% | 43% | 29% | 23% | |||
| 29 | 42% | 52% | 44% | 40% | 58% | 42% | 26% | 8% | ||||
| 30 | 42% | 39% | 43% | 41% | 52% | 45% | 25% | |||||
| 31 | 19% | 43% | 45% | 50% | 54% | 51% | ||||||
| Parametric system | 19% | 34% | 42% | 48% | 50% | 42% | 44% | 53% | 54% | 37% | 29% | 23% |
© 2017 by the authors. Licensee MDPI, Basel, Switzerland. This article is an open access article distributed under the terms and conditions of the Creative Commons Attribution (CC BY) license (http://creativecommons.org/licenses/by/4.0/).
Share and Cite
MDPI and ACS Style
Eltaweel, A.; Su, Y. Evaluation of Suitability of a Parametrically Controlled Louvers for Various Orientations throughout a Year Comparing to an Existing Case. Buildings 2017, 7, 109. https://doi.org/10.3390/buildings7040109
AMA Style
Eltaweel A, Su Y. Evaluation of Suitability of a Parametrically Controlled Louvers for Various Orientations throughout a Year Comparing to an Existing Case. Buildings. 2017; 7(4):109. https://doi.org/10.3390/buildings7040109
Chicago/Turabian StyleEltaweel, Ahmad, and Yuehong Su. 2017. "Evaluation of Suitability of a Parametrically Controlled Louvers for Various Orientations throughout a Year Comparing to an Existing Case" Buildings 7, no. 4: 109. https://doi.org/10.3390/buildings7040109
Note that from the first issue of 2016, this journal uses article numbers instead of page numbers. See further details here.