Abstract
In this paper, the effect of an exterior shading element (Iwan) on energy consumption in four different climatic regions and for different orientations, has been investigated numerically and experimentally. By applying different materials and techniques and creating various elements and spaces, architects make hard climatic conditions more tolerable for residents. Iwan is one of the cooling elements which is used in different forms and dimensions in the Islamic architecture. In the present research, Iwan has been introduced as a climatic element in traditional and contemporary architectures and its role in reducing the energy consumption in buildings has been studied. In this respect, first, the thermal loads of a building without Iwan are computed using the EnergyPlus software. Then, four different forms of Iwan are added to the above-mentioned structure along the four principal orientations, moreover, the effect of Iwan on the reduction of thermal loads is analyzed for four different climates. Finally, the design parameters of Iwan, in terms of depth and form, which can help reduce the thermal loads in different climatic conditions are presented. The results show that the best position for using an Iwan is the south direction and the use of Iwan in temperate & humid, hot & humid, cold & mountainous and hot & dry climates could reduce the energy consumption in buildings by 32%, 26%, 14% and 29%, respectively.
1. Introduction
Buildings in the world require large amounts of energy for cooling and heating, while the cost of the most types of energy is continuously increasing [1,2,3,4,5]. The amount of energy required for providing comfortable living conditions inside the buildings in a particular region depends on the weather conditions prevalent in that region [6,7,8,9,10,11,12,13].
An architectural element such as a shading device could be an important tool for reducing the energy consumption of a building, especially in hot climates. In summer, shading can protect the windows from intense solar radiation; while it allows maximum solar radiation in the wintertime. Shading devices have been used in different buildings [14,15]. There are different types of shading devices which improve the energy performance of buildings, such as external shadings [16], internal shadings [17], overhangs [18], Venetian blinds [19] and canopies [20].
One of the best energy saving strategies in buildings is the use of passive solar energy in buildings [21]. Iranian traditional architecture has offered appropriate solutions for the optimal use of passive solar energy [22]. These schemes can be found in building elements like Windcatchers [23], Shovadans [24], Courtyards [25] and Domed roofs [26] as well as in spaces like cisterns [27] and ice-pits [28]; most of which have been used for cooling purposes in hot-arid regions [29]. Shading against solar rays plays a significant role in reducing the cooling loads of a building [30,31]. The thermal performance of a building with a shading model developed for its windows was studied in [32].
The shading device selected for this study was externally fixed horizontal louvers with various slat lengths and the research was carried out in four different Italian cities. These researchers found the proper shading device that improved the thermal performance of buildings in each of the considered cities. By varying the depth and design of horizontal shading devices, Mehrotra simulated the simultaneous parameters of a building’s thermal performance and illuminance levels. The effects of various shading devices (internal, external and overhangs) on the thermal performance of buildings in four different locations in Italy were simulated by TRNSYS software in order to obtain the best shading device for each location [33,34]. Some studies have shown that for energy-efficient buildings, the effect of external shading on thermal improvement is greater than that of internal shading [35,36].
The effects of vertical and horizontal shading devices on the quality of daylight in buildings and the associated energy saving were examined by Hussain et al. [37]. Yu Huang et al. [38] analyzed the thermal performance and the daylight quality provided by glazing and shading designs in an office building located in dominantly cool climates. They found out that, with the increase of latitude, shading designs on the south windows perform better. The relationship between the use of exterior shading devices and the availability of natural light was investigated by Kim et al. [39]. They suggested that optimal shading systems should increase daylight levels while controlling the amount of excessive sunlight. The feasibility of using external shading for different exposures and at different latitudes was studied by El-Refaie et al. [40]. They concluded that shading devices are required for saving energy and reducing the cooling load of buildings. An experimental investigation of energy distribution and energy efficiency, with regard to the effect of shading on each zone of a solar pond, was presented by Karakilcik et al. [41]. The effects of adjacent shading on the thermal performance of residential buildings in a subtropical region were investigated by Chan [42]. The results showed that the use of shading could practically reduce the cooling load of a building by up to 18.3%.
The impact of external solar shadings devices on the energy needs of a typical air-conditioned office building for Italian climates has been studied by Bellia et al. The results demonstrated that exterior solar shading provides the highest energy saving for warm summers and hot climates—for instance, a 20 percent reduction in building energy consumption for Palermo’s climate. Huang et al. study a methodology for analyzing the energy and CO2 emission payback periods of external overhang shading in a university campus in Hong Kong. They resulted that the overhang shading system could reduce almost half of the cooling load in the research climate [43]. In the other study, electrochromic (EC) windows were combined with overhangs to evaluate if there were practical architectural and control strategy solutions that would significantly eroding energy-efficiency benefits. The results, which were conducted for south-facing private offices, showed that EC windows with overhangs can significantly reduce the annual energy use savings if the window area is large. For example, electric demand can be decreased by 7–8% for moderate-area windows and by 14–16% for large-area windows [44].
The impacts of variable exterior climatic conditions and different glazing and shading schemes on indoor thermal comfort levels and on the heating demand of spaces exposed to solar radiation were studied by Tzempelikos et al. [45]. They found that facades with insulating and low-transmittance glass create more comfortable and stable conditions. Also, using different types of shading devices, they studied experimentally the indoor thermal environment near a full-scale glass facade under varying climatic conditions in winter [46]. The most significant reason for using a shading device is to prevent the penetration of direct sunlight into a building during the heating seasons while allowing the wanted solar radiation gains during the cooling seasons [47].
One of the most important and complex steps in the building design is solar incident and the shading calculation. At this stage, the architect should analyze thermal performance and daylighting computation simultaneously. The improper analysis of these two factors can lead to increase in building energy consumption. For instance, the design of openings that are radically exposed to sunlight in hot climates will lead to growth in building cooling loads. In addition, the entrance of intense daylight into the building leads to glare problems of residents. An external shading device needs a lot of design analyses such as solar geometry, the physical dimension of the elements, materials, finishes, control strategies and aesthetics. The shading controls the size of solar radiation received by the building as a building facade elements. This strategy offers positive results when operating on the facade opening because they are the elements that transmit the highest radiation to the building. The American Society of Heating, Refrigerating and Air-conditioning Engineering (ASHRAE) includes shading coefficient (SC) among the factors to be considered in Calculation of heating and cooling demand of a building. This coefficient is defined as the ratio of solar heat through a Considering opening system under the specific conditions to the solar thermal performance through the standard 3 mm single clear glass [48].
Iwan is a type of external shading device for improving the energy performance of buildings. It has been considered as one of the main shading elements and passive cooling devices in the Middle Eastern and North African architectures [49]. Its difference from overhangs and balconies is that the thermal effect of Iwan often covers the whole surfaces of walls and openings.
In this research, Iwan is explored as a semi-open space in architecture and its structural characteristics and especially its various types are investigated for different climatic conditions. Unlike most shading devices for buildings, which are usually used in one direction only (vertically, horizontally, or obliquely), Iwan, as an external shading element, is an integration of vertical and horizontal shading devices. Moreover, contrary to previous studies on the thermal performance of shading devices, which focus more on solar gains through exterior openings, Iwan, in addition to providing shading for exterior openings, can also reduce the absorption of solar radiation through building walls. Although a review of the literature published on the energy performance of buildings indicates the use of several different shading mechanisms to improve the thermal efficiency of buildings, the effect of Iwan on energy efficiency has not been investigated yet.
This study can be categorized as the external shading design researches in buildings. Most of the Prior researches, usually focused on one shading type, such as overhang, side fan, Venetian blinds shadings, self-adaptive shadings etc. and its impact on reducing building energy consumption. Besides, the shadings span usually is more focused on building openings [35,36,37,38,39,40,41,42,43,44,45,46,47]. As respects in this study, Iwan as an integrated shading system that covers both the wall and the building’s openings, moreover, as a semi-space in Islamic architecture with various forms, dimensions and directions have been analyzed for the first time and eventually, to what extent, the traditional architects have been able to apply climatic efficiency design to Iwan element in buildings. For basic research, we need to reduce the number of research variables (such as building plan variety, the form and dimensions of openings, material properties etc.) and only focus on the Iwan’s form, depth and orientation to determine clearly the impact of the Iwan itself. Therefore, in this paper, the performance of Iwan in terms of cooling and heating improvements and its effect on the comfort and convenience of building residents are analyzed through experiment and simulation. The effects of different orientation and various models and dimensions of Iwan are investigated and analyzed for four different climates. Using an Iwan with the right depth and at proper orientation could be very effective in reducing the energy consumption of buildings. So, the optimal depth and geometrical form of Iwan, as well as its best geographical direction that can improve the energy performance, are explored in this research. The results of this study can be used by contemporary architects to estimate the energy efficiency of traditional buildings.
2. Traditional Shading Elements (Iwan)
In traditional architecture, shading elements reduce the incident solar rays into buildings. Iwan is one of these traditional shading elements which play an important role in buildings. In a traditional house, Iwan integrates and connects the other spaces of the building [50]. In terms of form, dimension and installed location, Iwans have various functions. Many spaces could be located around an Iwan. In many houses that remain from the Safavid and Qajar periods, Iwans are used as the main elements in one or more views (Figure 1).
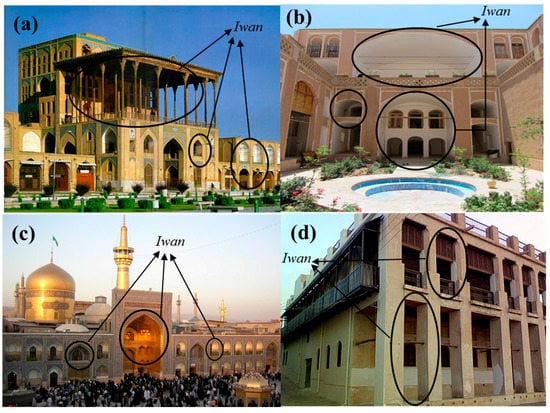
Figure 1.
Different forms of Iwan. (a) Ali Qapu palace (Isfahan); (b) Ooomiha House (Yazd); (c) Imam Reza Shrine (Mashhad); (d) Amiriye Mansion (Bushehr).
Iwans are valuable elements in terms of size, form and even decoration. Northern Iwans are cold in hot weathers and create a flow of cold breeze under them toward interior spaces. Southern Iwans (facing the sun) are used in both the heating and cooling seasons of the year. With respect to skewed sunlight, southern Iwans reduce the penetration of solar rays into interior spaces [51,52]. In terms of climatic conditions, Iwans are divided into four categories (Table 1). The characteristics of the four different climatic regions have been listed in Table 2.

Table 1.
Comparing Iwan application at different climates.
Table 2.
Classification of climates of four different regions.
3. Material and Building Details
Iwans have been used in every climatic region of the Middle East; although the form, depth and the placement direction of Iwans vary from place to place. Iwan forms depend on building plans. Usually, Iwans are enclosed from one, two or three sides. To measure the thermal efficiency of an Iwan, a 4 × 4 m room with 3 m height was considered (Figure 2 and Table 3). The components of the whole room, except a wall with a window opening, was assumed to be adiabatic. A window opening of 2 × 1 m dimensions was placed at a height of 1 m from the room floor. The specifications of wall materials have been given in Table 3, Table 4 and Table 5.
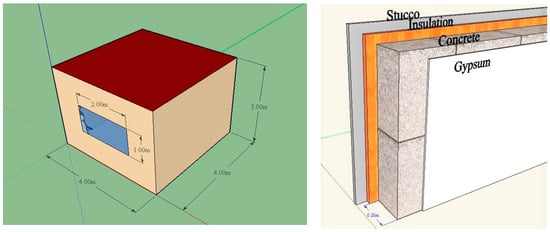
Figure 2.
The building geometry and materials.
Table 3.
The basic information for building geometry.
Table 4.
The thermal characteristics of walls.
Table 5.
The thermal characteristics of windows.
4. Governing Equations and the Solution Method
This study has been performed by using the EnergyPlus (v. 8) software [53], developed by the U.S. department of energy; which simulates the whole energy utilization of a building. Figure 3 shows the energy balance between the exterior and interior of a building wall.
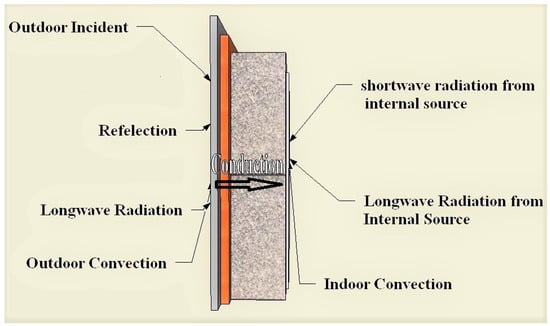
Figure 3.
Inside and outside the energy balance control volume.
The energy balance equations for zone air and surface heat transfer are two essential equations that an energy program should solve. These equations are solved by Finite Difference methods. By Crawley (2000, 2001) and Fumo (2010) Comprehensive descriptions of the equations governing the Energy Plus software have been made [54,55,56].
5. Result and Discussions
The results obtained in this paper are based on computer simulations and experimental measurements. The numerical results of this study are done by (the whole energy simulation software) EnergyPlus. First of all, we should see that this software can be used as a base simulation for solar calculation in buildings, such as shading performance and energy consumption and we can cite its results in this research. As we know, many studies in the world have used Energy Plus as energy simulation software for shading design in buildings and extracted the results and outputs of temperature, humidity, energy consumption etc. [57,58,59].
In the meantime, some studies have compared the results of this software with experimental and empirical data and validate the results of Energyplus in shading simulation of buildings [60,61,62,63]. In this study, in particular, for validating the inputs, outputs and the simulation method, an experimental building with specifications approximately given in Figure 1 and Table 1 was used to validate the computer model in hot and dry climate. The room placed on the southern side of buildings and with 4 × 4 m dimensions in the plan, three meters height and openings of 1 × 1.8 m, which is close to the simulation conditions. As shown in Figure 4, the exterior wall, window and Iwan are oriented to the south and the depth of the Iwan is one meter.
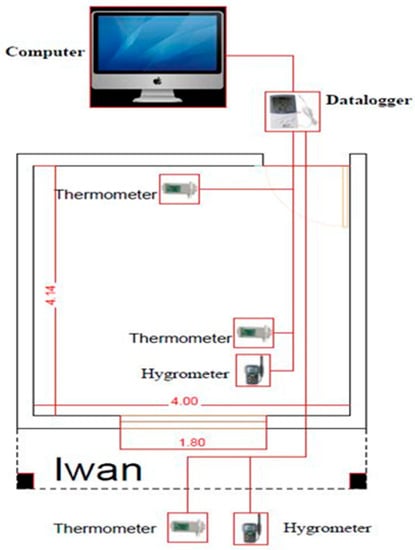
Figure 4.
Schematic of experimental testing.
The location of the experiment is Yazd in Iran, with the Latitude {31°52′ N} and Longitude {54°16′ E}, which is considered as a hot and dry climate. To measure the temperature and humidity, three of the TES’s thermometer and Hygrometer data-logger instrument, which have been previously qualified in an experimental study, have been used (Figure 4). Two of the instruments were inside the room and one of them was placed outside the building in outdoor and all this connects to a central computer for data analysis. To better understand the performance of devices and simulation software in hot climates, a typically hot summer week, 20–26 July (2017), was selected as the test time. Data loggers have taken the temperature and humidity information every hour, from the room and the outside. The same room was modeled in the Energy Plus software and analyzed and evaluated by the weather data of Yazd, approved by the U.S. Department of Energy.
The input data in Energy Plus software is set similar to the Table 3. The temperature and humidity outputs were resulted from the software on an hourly basis during the week of the July and analyzed and compared with experimental results. In Figure 5 the average of the temperatures recorded from the first and second data loggers inside the room and third outside the building, as well as the temperatures resulted from the simulation, are compared. As is clear, the temperatures resulted from the software and experimental records are in good agreement with each other.
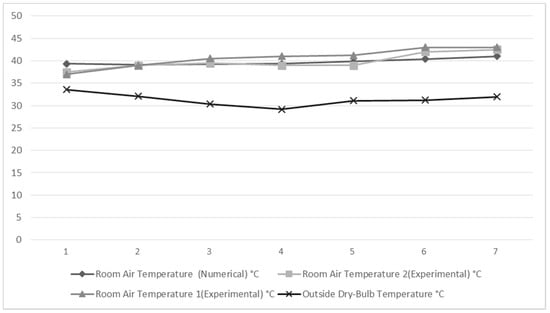
Figure 5.
Comparison of mean daily temperatures from simulation and experimental study, with outside dry-bulb temperature.
In Table 6, the minimum and maximum hourly data resulted from the software and instruments in seven days of July are presented. The accuracy and adequacy of the simulation method are confirmed by achieving an error of about 6–7% between the experimental and simulation results. The precisions of the measuring instruments used in the experiments (thermometer, hygrometer) are ±0.5 °C, 3% respectively.
Table 6.
The hourly results comparison of the experimental and simulation model in July.
5.1. Simulation Results
In the present study, the effect of Iwan on energy consumption rate in a building has been investigated and the general guidelines for the design of Iwan for different climates have been obtained. An ideal air load has been defined for the considered building in order to calculate the cooling and heating loads. The thermal zones are controlled by means of a thermostat, with its low and high temperatures being +18 °C and +24 °C, respectively. Based on this, the software program analyzes the cooling and heating loads of the building. At first, the abovementioned building is simulated without an Iwan, for the four major climates mentioned. For this purpose, the weather information of the following four regions is used: hot & dry climate (City of Yazd), hot & humid climate (City of Bandar Abbas), temperate & humid climate (City of Sari) and cold & mountainous climate (City of Tabriz). The weather data is obtained from the US Department of Energy website, specially developed for application in EnergyPlus software in EPW format. Weather data are for 6 cities of Iran based on periods of record from 30 to 43 years. The files were created using TmyCreator by the Building and Housing Research Center (BHRC) of Iran.
In order to understand how much an Iwan can be reduced the cooling and heating loads of buildings in different climates, Firstly, we should assess the thermal loads of buildings without Iwan in the same climates, upon which after applying Iwan, the rate of building loads changes is measured and thermal performance of Iwan in different climate is estimated. In Figure 6, the examined building has its maximum thermal load in the hot & humid climate, followed by the hot & dry, temperate & humid and cold & mountainous climates. In addition, the maximum cooling load is obtained in the hot & humid climate, followed by the hot & dry and temperate & humid climates. The maximum and the minimum heating loads are obtained in the cold & mountainous and hot & humid climates, respectively. The maximum and the minimum heating loads are required on the north and south elevation, respectively. On the other hand, as Figure 6 shows, the cooling load is much time higher than the heating load in three climates, except the cold & mountainous climate, in which the heating loads of buildings are slightly higher than the cooling loads. For example, the cooling load is 100 times the heating load in a hot & humid climate. Therefore, it is essential to reduce the cooling loads of buildings. One solution for reducing a building’s cooling load is to construct an Iwan over the warm side of the building and to use various Iwan forms and dimensions based on a particular climate. Commonly, the height of an Iwan equals the height of a building roof and it has a depth of 1–2 m. Also, in terms of form, Iwans are usually enclosed from one, two or three sides. So, in order to study the effect of Iwan on the cooling load, an Iwan was added to the considered building over each of its four sides. First, an Iwan in the form of an overhang was added in each of the four directions of the building. In the next step, in each of the four directions, a side fan, as wide as Iwan depth, was added to the right side of Iwan. Then, the location of the fan was changed from the right to the left side. At the final step, two fans were added together from the right and left sides of Iwan in each of the four existing directions (Table 7).
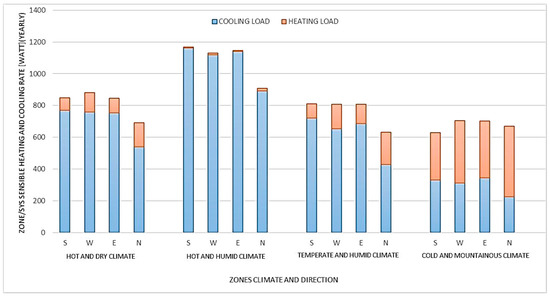
Figure 6.
Thermal load of zones without Iwan [KW/Yearly].
Table 7.
Steps of Iwan forms placement.
The numerical simulations investigated a different Iwan mode for each of the four directions. The simulations were performed for four different climatic regions and the heating and cooling loads of the building were calculated. Also, the effects of orientations on the energy optimization achieved by all Iwan forms were investigated. First, the building was modeled with no Iwan installed in any of the four orientations and then the simulations were performed for four forms of Iwan. Six different Iwan depths were studied. So, in total, 120 different cases have been simulated. The building and all the above cases of Iwan have been modeled for four different climates and the results for the cooling and heating loads of the building have been illustrated in the following diagrams (Figure 6 and Table 8). It is noteworthy that, there are many factors affecting the impact of shading on the building performance that has been studied in many researches. The effects of site and geographic shape around the shadings on the building solar incident is mentioned as an important factor, such as the height of surrounding buildings and generally the urban texture surrounding the building, as well as vegetation and surrounding trees. Self-shading and geometry of the buildings can also have a positive or negative impact on building energy consumption depending on their climates. Other main factors can be the behavior of residents [64,65]. In this research, the environmental factors around the building and urban texture are eliminated to reduce the variables in the simulation.
Table 8.
Thermal load analysis after Iwan insertion.
Regarding the above diagram (Table 8, Figure 7), we can see that after applying an Iwan, the heating loads increase and the cooling loads diminish. Therefore, it can be said that in this case an Iwan acts as a cooler for the building and, consequently, it decreases the cooling load and increases the heating load in all climatic conditions. Another point is that for all climates, the maximum reduction of cooling load occurs on the south elevation of the building and that Iwan Form S4 is the best form among all Iwan forms, because the reduction of building’s thermal load is achieved by using this form. The results did not change much by using Iwan Forms S2 and S3 and the maximum change in the results occurred by using Iwan Form S1. Therefore, we can say that the key element in the design of an Iwan is its roof, because it can result in a tangible reduction of temperature. An ideal direction in which an Iwan can be used is the south elevation that provides a maximum rate of thermal load (cooling and heating) before using an Iwan and a max rate of thermal load reduction after applying an Iwan. According to diagrams and calculations, the south elevation of a building is the ideal elevation to use an Iwan in all climates.
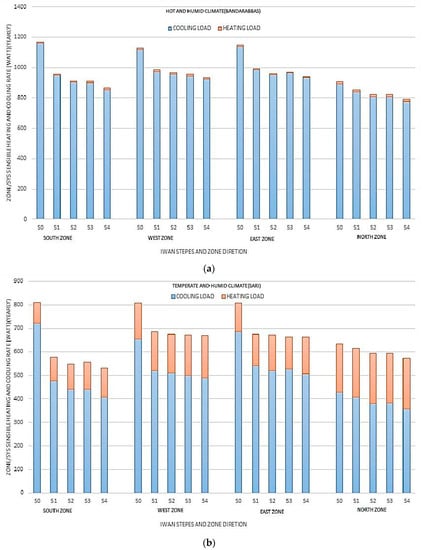
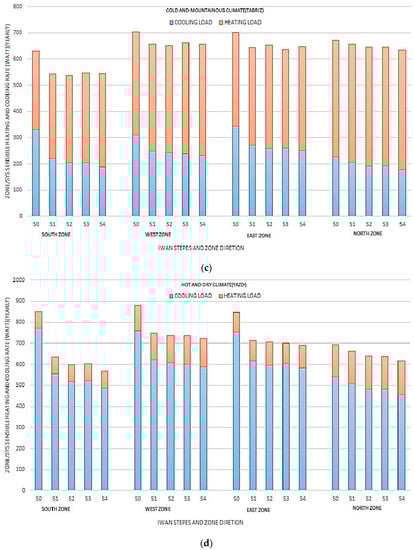
Figure 7.
Thermal loads of the various forms of Iwan’s steps in major climates [KW/Yearly] (a) Hot and Humid (Bandar Abbas); (b) Temperate and Humid (Sari); (c) Cold and Mountainous (Tabriz); (d) Hot and Dry (Yazd).
5.2. Studying the Southern Zone
Now that we know the south elevation is the ideal elevation for installing an Iwan in all climates, we try to find the best Iwan depth that can reduce the thermal load.
In a cooling load analysis (Figure 8), an Iwan with a depth of 1.5 m achieves tangible and gradual reduction in the cooling load; however, above the depth of 1.5 m, the differences in the results are negligible. Therefore, the best way of reducing the cooling load is to use Iwans with a depth of 1.5 m. In this respect, the minimum and the maximum cooling load reduction is achieved in the cities of Tabriz and Bandar Abbas, respectively. However, by increasing the Iwan depth and thus increasing the shading, the heating load increases in all climates. As for the thermal load of a building, we can say that in temperate & humid and in dry & hot climates, the lowest thermal load is achieved by Iwans of 1.5 m depth and that in cold & mountainous regions, the thermal load is reduced slightly by using Iwans with 0–1.5 m depth and it is increased by using Iwans of larger depths. In hot & humid climates, the lowest thermal load is achieved by Iwans with a depth of 3 m; but there is no significant difference between the thermal loads when using Iwans with a depth of 1.5–3 m. Also, a gradual increase in thermal load is observed when using Iwans with a depth of less than 1.5 m. Generally, we can say that the best depth for Iwans, in all climates, is 1.5 m. Table 9 shows the thermal performances of various Iwans with respect to their depth.
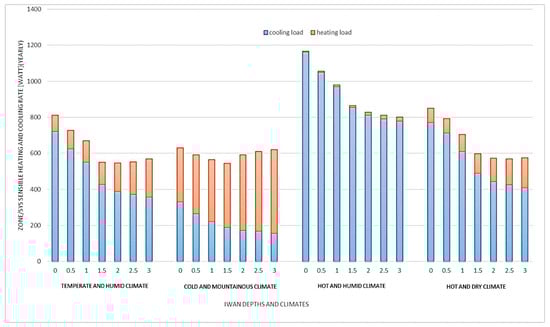
Figure 8.
Thermal loads of southern zone based on the Iwan depth [KW/Yearly].
Table 9.
General analysis of thermal performance in different depth of Iwan in buildings.
6. Conclusions
In this paper, the effects of Iwan, as an exterior shading element, on the reduction of energy utilization in a building and on the thermal comfort level of the building’s residents were evaluated by modeling various forms of Iwan for different climates and different orientations. The obtained results indicate that the most important element in the design of Iwan is the overhang. By using overhangs, the annual thermal load of a building in hot & humid, cold & mountainous, temperate & humid and dry & hot climates is reduced by 18%, 14%, 28% and 24%, respectively. A maximum reduction of thermal and cooling loads is achieved by applying an Iwan over the south elevation of a building. Therefore, the ideal orientation for using an Iwan is the south elevation and the best climate is the hot & humid climate, followed by temperate & humid, hot & dry and finally cold & mountainous climates. Knowing that the ideal Iwan depth is 1.5 m and that the southward direction is the best direction to use an Iwan for a building’s energy consumption optimization, meanwhile, the results show that Form S4 is good for hot & dry, hot & humid and humid & temperate climates but not at all suitable for a cold & mountainous climate. Forms S2 and S3 have no effect on energy efficiency in a cold & mountainous climate but they perform well in the other three climates. Form S1 is excellent for hot & dry, hot & temperate and humid & temperate climates and good for a cold & mountainous climate. So, according to the results, S1 is the best form of Iwan for different climatic conditions.
Experimental and numerical results show that, from the perspective of energy efficiency and the reduction of a building’s thermal load, using Iwans (especially with depths larger than 1 m) in a cold & mountainous climate is not economical. The best depth for Iwans on the south elevation is 1.5 m; and by using a 1.5 m deep Iwan in the south direction, a thermal load reduction of 32%, 26%, 29% and 14% is generally achieved in temperate & humid, hot & humid, dry & hot and cold & mountainous climates, respectively. Naturally, Iwan is a kind of shading that covers both wall and openings of the building and is available in a variety of forms that can be applied to the building. Given that a comprehensive study that examines the thermal properties of Iwan has not been studied, these results cannot be compared accurately with previous studies, so an overall and relative comparison with some of the research results presented in the introduction can be done. Iwan in an ideal form which is located in the south-facing, depending on its climate, approximately reduces between 14% and 32% of the building’s energy consumption. Compared with the results of the research in the introduction [44,45,46,47], Different reductions for building thermal loads are mentioned, which range between 7% and 35%. The conclusions of this research paper are summarized as follows:
- The best possible orientation for using an Iwan is the south direction.
- The most optimal Iwan depth is 1.5 m.
- The best Iwan form is S1.
- By using an Iwan in the south direction, the energy consumption of buildings in temperate & humid, hot & humid, dry & hot and cold & mountainous climatic regions is reduced by 32%, 26%, 29% and 14%, respectively.
Author Contributions
H.E., M.S. and M.M. conceived of the presented idea. H.E. developed the theory and performed the computations. H.E., M.S. conceived and designed the experiments; H.E. performed the experiments; H.E., M.S. and M.M. verified the model and analyzed the data; All authors discussed the results and contributed to the final manuscript.
Conflicts of Interest
The authors declare no conflict of interest.
References
- Liddament, M.W. A review of ventilation and the quality of ventilation air. Indoor Air 2000, 10, 193–199. [Google Scholar] [CrossRef] [PubMed]
- Mahmoud, A.S.; Asif, M.; Hassanain, M.A.; Babsail, M.O.; Sanni-Anibire, M.O. Energy and Economic Evaluation of Green Roofs for Residential Buildings in Hot-Humid Climates. Buildings 2017, 7, 30. [Google Scholar] [CrossRef]
- Luis, P.L.; José, O.; Christine, P. A review on buildings energy consumption information. Energy Build. 2008, 40, 394–398. [Google Scholar]
- De Ruggiero, M.; Forestiero, G.; Manganelli, B.; Salvo, F. Buildings Energy Performance in a Market Comparison Approach. Buildings 2017, 7, 16. [Google Scholar] [CrossRef]
- Kirimtat, A.; Koyunbaba, B.K.; Chatzikonstantinou, I.; Sariyildiz, S. Review of simulation modeling for shading devices in buildings. Renew. Sustain. Energy Rev. 2016, 53, 23–49. [Google Scholar] [CrossRef]
- Anand, S.; Gupta, A.; Tyagi, S.K. Simulation studies of refrigeration cycles: A review. Renew. Sustain. Energy Rev. 2013, 17, 260–277. [Google Scholar] [CrossRef]
- Richard, H.B.; Nasarullah, C.H.; Abdul, G.S. A review of sustainable cooling technologies in buildings. Renew. Sustain. Energy Rev. 2011, 15, 3112–3120. [Google Scholar]
- Cellura, M.; Ciulla, G.; Guarino, F.; Longo, S. Redesign of a Rural Building in a Heritage Site in Italy: Towards the Net Zero Energy Target. Buildings 2017, 7, 68. [Google Scholar] [CrossRef]
- Paoletti, G.; Pascuas, P.R.; Pernetti, R.; Lollini, R. Nearly Zero Energy Buildings: An Overview of the Main Construction Features across Europe. Buildings 2017, 7, 43. [Google Scholar] [CrossRef]
- Alrashed, F.; Asif, M.; Burek, S. The Role of Vernacular Construction Techniques and Materials for Developing Zero-Energy Homes in Various Desert Climates. Buildings 2017, 7, 17. [Google Scholar] [CrossRef]
- Yu, J.; Yang, C.; Tian, L.; Liao, D. Evaluation on energy and thermal performance for residential envelopes in hot summer and cold winter zone of China. Appl. Energy 2009, 86, 2520–2529. [Google Scholar] [CrossRef]
- Yao, J. Energy optimization of building design for different housing units in apartment buildings. Appl. Energy 2012, 94, 330–337. [Google Scholar] [CrossRef]
- Susorova, I.; Tabibzadeh, M.; Rahman, A.; Clack, H.; Elnimeiri, M. The effect of geometry factors on fenestration energy performance and energy savings in office buildings. Energy Build. 2013, 57, 6–13. [Google Scholar] [CrossRef]
- Mateus, T.; Oliveira, A.C. Energy and economic analysis of an integrated solar absorption cooling and heating system in different building types and climates. Appl. Energy 2009, 86, 949–957. [Google Scholar] [CrossRef]
- Baniyounes, A.M.; Gang, L.; Rasul, M.G.; Khan, M.M.K. Analysis of solar desiccant cooling system for an institutional building in subtropical Queensland, Australia. Renew. Sustain. Energy Rev. 2012, 16, 6423–6431. [Google Scholar] [CrossRef]
- Tzempelikos, A.; Athienitis, A.K. The impact of shading design and control on building cooling and lighting demand. Sol. Energy 2007, 81, 369–382. [Google Scholar] [CrossRef]
- Florides, G.A.; Kalogirou, S.A. Modeling of the modern houses of Cyprus and energy consumption analysis. Energy 2000, 25, 915–937. [Google Scholar] [CrossRef]
- Lee, E.S.; Tavil, A. Energy and visual comfort performance of electrochromic windows with overhangs. Build. Environ. 2007, 42, 2439–2449. [Google Scholar] [CrossRef]
- Hans, A.; Binder, B. Experimental and numerical determination of the total solar energy ransmittance of glazing with venetian blinds hading. Build. Environ. 2008, 43, 197–204. [Google Scholar]
- Kenneth, I.; Marta, L.; Andrew, M. Shading performance of a vertical deciduous climbing plant canopy. Build. Environ. 2010, 45, 81–88. [Google Scholar]
- Ralegaonkar, R.V.; Gupta, R. Review of intelligent building construction: A passive solar architecture approach. Renew. Sustain. Energy Rev. 2010, 14, 2238–2242. [Google Scholar] [CrossRef]
- Khalili, M.; Amindeldar, S. Traditional Solutions in Low Energy Buildings of Hot-Arid Regions of Iran. Sustain. Cities Soc. 2014, 13, 171–181. [Google Scholar] [CrossRef]
- Saadatian, O.; Haw, L.C.; Sopian, K.; Sulaiman, M. Review of windcatcher technologies. Renew. Sustain. Energy Rev. 2012, 16, 1477–1495. [Google Scholar] [CrossRef]
- Moradi, H.; Eskandari, H. An experimental and numerical investigation of Shovadan heating and cooling operation. Renew. Energy 2012, 48, 364–368. [Google Scholar] [CrossRef]
- Safarzadeh, H.; Bahadori, M. Passive cooling effects of courtyards. Build. Environ. 2005, 40, 89–104. [Google Scholar] [CrossRef]
- Faghih, A.K.; Bahadori, M.N. Thermal performance evaluation of domed roofs. Energy Build. 2011, 43, 1254–1263. [Google Scholar] [CrossRef]
- Ameri Siahoui, H.; Dehghani, A.; Razavi, M.; Khani, M. Investigation of thermal stratification in cisterns using analytical and Artificial Neural Networks methods. Energy Convers. Manag. 2011, 52, 505–511. [Google Scholar] [CrossRef]
- Bahadori, M.N. Natural production, storage, and utilization of ice in deep ponds for summer air conditioning. Sol. Energy 1985, 34, 143–149. [Google Scholar] [CrossRef]
- Bahadori, M.N. Passive cooling systems in Iranian architecture. Sci. Am. 1978, 238, 144–150. [Google Scholar] [CrossRef]
- Khoroshiltseva, M.; Slanzi, D.; Poli, I. A Pareto-based multi-objective optimization algorithm to design energy-efficient shading devices. Appl. Energy 2016, 184, 1400–1414. [Google Scholar] [CrossRef]
- Datta, G. Effect of fixed horizontal louver shading devices on thermal perfomance of building by TRNSYS simulation. Renew. Energy 2001, 23, 497–507. [Google Scholar] [CrossRef]
- Mehrotra, M. Solar Control Devices; Balance between Thermal Performance and Daylight. In Proceedings of the International Conference on Passive and Low Energy Cooling for the Built Environment, Santorini, Greece, 19–21 May 2005; pp. 991–996. [Google Scholar]
- TRNSYS, A Transient Simulation Program, version 14.2; Solar Energy Laboratory, University of Wisconsin: Madison, WI, USA, 1992.
- Introduction to TRNSYS for Windows with IISiBat; Solar Energy Laboratory, University of Wisconsin: Madison, WI, USA, 1997.
- Kolaitis, D.; Malliotakis, E.; Kontogeorgos, D.; Mandilaras, I.; Katsourinis, D.; Dimitrios, I. Comparative assessment of internal and external thermalinsulation systems for energy efficient retrofitting of residential buildings. Energy Build. 2013, 64, 123–131. [Google Scholar] [CrossRef]
- Aste, N.; Adhikari, R.; Manfren, M. Cost optimal analysis of heat pumptechnology adoption in residential reference buildings. Renew. Energy 2013, 60, 615–624. [Google Scholar] [CrossRef]
- Stamatakis, A.; Mandalaki, M.; Tsoutsos, T. Multi-criteria analysis for PV integrated in shading devices for Mediterranean region. Energy Build. 2016, 117, 128–137. [Google Scholar] [CrossRef]
- Huang, Y.; Niu, J.; Chung, T. Comprehensive analysis on thermal and daylighting performance of glazing and shading designs on office building envelope in cooling-dominant climates. Appl. Energy 2014, 134, 215–228. [Google Scholar] [CrossRef]
- Kim, G.; Lim, H.S.; Lim, T.S.; Shaefer, L.; Kim, T.J. Comparative advantage of an exterior shading device in thermal performance for residential buildings. Energy Build. 2012, 46, 105–111. [Google Scholar] [CrossRef]
- Frontini, F.; Kuhn, T.E. The influence of various internal blinds on thermal comfort: A new method for calculating the mean radiant temperature in office spaces. Energy Build. 2012, 54, 527–533. [Google Scholar] [CrossRef]
- EL-Refaie, M.F.; EL-Asfourit, A.S. Feasibility of external shading of fenestration on different exposures. Energy Convers. Manag. 1988, 21, 161–169. [Google Scholar] [CrossRef]
- Chan, A.L.S. Effect of adjacent shading on the thermal performance of residential buildings in a subtropical region. Appl. Energy 2012, 92, 516–522. [Google Scholar] [CrossRef]
- Bellia, L.; De Falco, F.; Minichiello, F. Effects of solar shading devices on energy requirements of standalone office buildings for Italian climates. Appl. Therm. Eng. 2013, 54, 190–201. [Google Scholar] [CrossRef]
- Huang, Y.; Niu, J.-L.; Chung, T.-M. Energy and carbon emission payback analysis for energy-efficient retrofitting in buildings—Overhang shading option. Energy Build. 2012, 44, 94–103. [Google Scholar] [CrossRef]
- Tzempelikos, A.; Bessoudo, M.; Athienitis, A.K.; Zmeureanu, R. Indoor thermal environmental conditions near glazed facades with shading devices—Part II: Thermal comfort simulation and impact of glazing and shading properties. Build. Environ. 2010, 45, 2517–2525. [Google Scholar] [CrossRef]
- Bessoudo, M.; Tzempelikos, A.; Athienitis, A.K.; Zmeureanu, R. Indoor thermal environmental conditions near glazed facades with shading devices—Part I: Experiments and building thermal model. Build. Environ. 2010, 45, 2506–2516. [Google Scholar] [CrossRef]
- Haeri, M.R. House, in Culture, and Nature of Iran; Architecture and Urban Development Publications: Tehran, Iran, 2010. [Google Scholar]
- Heschong, L. Daylighting and human performance. ASHRAE J. 2002, 44, 65–67. [Google Scholar]
- Florides, G.A.; Tassou, S.A.; Kalogirou, S.A.; Wrobel, L.C. Measures used to lower building energy consumption and their cost effectiveness. Appl. Energy 2002, 73, 299–328. [Google Scholar] [CrossRef]
- Platzer, W.J. Evaluation of overheating protection with sun-shading. Sol. Energy 2001, 69, 59–74. [Google Scholar]
- Mahmoudi, M. Review the importance of iwan in traditional houses (with special attention to the bam). Fine Arts J. 2005, 22. [Google Scholar]
- Memariyan, G.H. Introduction to House Typology in Iran: Courtyard Houses; University of Science and Technology Publications: Tehran, Iran, 1994. [Google Scholar]
- EnergyPlus Energy Simulation Software n.d. Available online: http://apps1.eere.energy.gov/buildings/energyplus/ (accessed on 7 August 2017).
- Crawley, D.B.; Lawrie, L.K.; Winkelmann, F.C.; Buhl, W.F.; Huang, Y.J.; Pedersen, C.O.; Strand, R.K.; Liesen, R.J.; Fisher, D.E.; Witte, M.J.; et al. EnergyPlus: Creating a new-generation building energy simulation program. Energy Build. 2001, 33, 319–331. [Google Scholar] [CrossRef]
- Crawley, D.B.; Lawrie, L.K.; Pedersen, C.O.; Winkelmann, F.C. EnergyPlus: Energy simulation program. ASHRAE J. 2000, 42, 49–56. [Google Scholar]
- Fumo, N.; Mago, P.; Luck, R. Methodology to estimate building energy consumption using EnergyPlus Benchmark Models. Energy Build. 2010, 42, 2331–2337. [Google Scholar] [CrossRef]
- Ellis, P.G.; Torcellini, P.A. Simulating Tall Buildings Using EnergyPlus. In Proceedings of the International IBPSA Conference, Montreal, QC, Canada, 15–18 August 2005; pp. 279–286. [Google Scholar]
- Lomanowski, B.A.; Wright, J.L. Modeling Fenestration with Shading Devices in Building Energy Simulation: A Practical Approach. In Proceedings of the 11th International IBPSA Conference, Glasgow, UK, 27–30 July 2009. [Google Scholar]
- Loutzenhiser, P.G.; Manz, H.; Felsmann, C.; Strachan, P.A.; Maxwell, G.M. An empirical validation of modeling solar gain through a glazing unit with external and internal shading screens. Appl. Therm. Eng. 2007, 27, 528–538. [Google Scholar] [CrossRef]
- Witte, M.J.; Henninger, R.H.; Crawley, D.B. Experience Testing EnergyPlus with the ASHRAE 1052-RP Building Fabric Analytical Tests. In Proceedings of the SimBuild 2004, Building Sustainability and Performance through Simulation, Boulder, CO, USA, 4–6 August 2004. [Google Scholar]
- Loutzenhiser, P.G.; Maxwell, G.M.; Manz, H. An empirical validation of the daylighting algorithms and associated interactions in building energy simulation programs using various shading devices and windows. Energy 2007, 32, 1855–1870. [Google Scholar] [CrossRef]
- Mateus, N.M.; Pinto, A.; da Graça, G.C. Validation of EnergyPlus thermal simulation of a double skin naturally and mechanically ventilated test cell. Energy Build. 2014, 75, 511–522. [Google Scholar] [CrossRef]
- Witte, M.J.; Henninger, R.H.; Glazer, J. Testing and Validation of a New Building Energy Simulation Program. In Proceedings of the International IBPSA Conference, Rio de Janeiro, Brazil, 13–15 August 2001; pp. 353–360. [Google Scholar]
- Nowak, D.J. The Effects of Urban Trees on Air Quality; USDA Forest Service: Syracuse, NY, USA, 2002; pp. 96–102.
- Pacheco, R.; Ordóñez, J.; Martínez, G. Energy efficient design of building: A review. Renew. Sustain. Energy Rev. 2012, 16, 3559–3573. [Google Scholar] [CrossRef]


© 2017 by the authors. Licensee MDPI, Basel, Switzerland. This article is an open access article distributed under the terms and conditions of the Creative Commons Attribution (CC BY) license (http://creativecommons.org/licenses/by/4.0/).