Dynamic Characterisation and Finite Element Updating of a RC Stadium Grandstand


1
CERIS, ICIST and Departamento de Engenheria Civil da Faculdade de Ciências e Tecnologia da Universidade Nova de Lisboa, Quinta da Torre, 2829-516 Caparica, Portugal
2
Department of Engineering and Architecture, University of Trieste, 34127 Trieste, Italy
*
Author to whom correspondence should be addressed.
Buildings 2018, 8(10), 141; https://doi.org/10.3390/buildings8100141
Submission received: 13 September 2018
/
Revised: 29 September 2018
/
Accepted: 10 October 2018
/
Published: 12 October 2018
(This article belongs to the Special Issue Non-destructive Testing for Building Evaluation)
Abstract
:This paper reports on the dynamic characterisation of a Reinforced Concrete (RC) stadium grandstand module for the Sporting Stadium in Lisbon. To this aim, a three-dimensional (3D) Finite-Element (FE) numerical model, implemented according to the technical drawings of the structure, is first presented to provide preliminary estimates of the expected modal characteristics for the examined structural system. Ambient vibration tests are then carried out on the same grandstand, and used to extract the natural frequencies and vibration modes of the system, according to conventional state-of-the-art output-only modal parameter identification techniques. A sensitivity investigation and FE model updating study is hence presented for the grandstand, giving evidence of the major influencing parameters and key input data for the numerical fitting of the experimental modal testing results.
1. Introduction and State-of-the-Art
Public facilities suitable to host lively events, where crowd motion is expected to induce significant dynamic loads, may suffer excessive vibrations during their life-time. This is the case of stadium structures, where slender and light engineering solutions are frequently adopted, turning them highly susceptible to human-induced vibrations. For grandstand structures with spans greater than 6 m, in particular, possible dynamic effects are usually tackled by guaranteeing that the natural frequency of such systems under operational conditions is higher than 6 Hz [1], and hence comply with conventional serviceability requirements [2].
In the last years, a huge number of studies have been focused on the dynamic performance of stadium structures. A large number of references on structural response and vibration serviceability of stadium structural assemblies under human-induced live loads (see for example [3,4,5,6], etc.) highlighted that their dynamic response depend not only on basic mechanical features—i.e., geometry, mass and damping of a given structure—but also on the nature of loading, which can become quite complex when moving crowd effects have to be considered. Besides the significant magnitude of dynamic loads that can be induced by crowds, the human-structure interactions can also change the dynamic properties of the structure itself. As a consequence, especially for the design of stadium structures, it is highly recommended to consider the dynamic nature of moving loads induced by lively spectators [7]. Despite the extensive literature research documents focused on the dynamic performance of existing stadium structures, the available knowledge on the topic is still not yet sufficiently advanced, and currently not recognised in most of the design codes.
In addition, stadium structures are widely used for multi-purpose utilisation goals, due to huge hosting and seating capacities, hence resulting—according to design standards—in typical strategic and vulnerable structural systems that should be properly designed and monitored during their life-time (in the same way of “soft targets” [8], infrastructures, etc.), especially in the event of extreme design actions. In this regard, dynamic identification based on non-destructive methods and smart technologies is increasingly in popularity and efficiency for civil engineering investigations ([9,10,11,12,13], etc.).
In order to gain more insight regarding the complex dynamics of such a structural typology, experimental identification methods are currently being used for both empty and occupied stadiums. According to the literature [14], these methods can be traditionally classified in input-output and output-only modal identification techniques. Among the input-output dynamic testing techniques that can be used in the case of grandstands, shaker testing options are mentioned in past documents [15]. However, such a kind of technique is extremely difficult to perform, as it requires heavy and expensive experimental equipment [16]. Two alternative output-only testing techniques can be considered instead, namely the Ambient Vibration Tests (AVT) and the heel-drop testing option (see [15]). In the first case, the major issue of the AVT method relies on ambient vibration only to excite a given structure (i.e., typically wind pressure), hence its application to stadium assemblies and components may not be efficient and mostly limited to the identification of the seating decks modes. On the other hand, heel-drop testing is unlikely to excite modes involving significant motion of whole stands. A combination of the two output-only approaches may hence be considered, for optimal dynamic estimations.
In this regard, Finite Element (FE) computer packages and the related numerical models are generally recognised as an important and robust tools that can help structural engineers to properly design (or retrofit) stadiums structures. However, when the results of the numerical simulations are compared to the experimental data, discrepancies in the natural frequencies and corresponding modal shapes are commonly observed, as a major effect of typical issues related to (i) simplifying assumptions (i.e., regarding the geometry and/or the mechanical behavior of materials); (ii) inaccuracy in modeling boundary conditions and/or non-linearities; (iii) uncertainties related to the model dynamic parameters, such as variation of material properties, damping, etc.; and (iv) possible errors/uncertainties in the test measurements. The FE model updating, based on test data derived from modal system identification techniques, has hence become a useful approach that can allow for a more reliable and accurate calibration of the reference FE assemblies, so that they could be efficiently used in subsequent dynamic analyses [17,18,19].
2. Research Objectives and Methods
The present study focuses on the experimental dynamic characterisation and on the FE model updating of a RC stadium grandstand. As a case study, the Sporting Stadium in Lisbon is examined. The first objective of the study is to assess the dynamic parameters of the stadium structure under live loads. At the same time, the study goal is to obtain, based on test measurements, a reliable FE model that can be used in subsequent numerical simulations, to assess the structural response of the stadium grandstand under the action of crowds. In this regard, the research investigation discussed herein also provides a useful insight for designers, with respect to the main variables and influencing parameters that can affect the dynamic behavior of similar structures. To this aim, experimental data recorded in a dynamic characterisation campaign are used. Such a set of test data consists in output-only AVT under two different loading conditions, namely obtained (i) in presence of natural excitation only (i.e., wind) and (ii) in presence of wind pressures combined with an artificial excitation (i.e., random movement of a group of volunteers). The so collected test data are processed by using the Enhanced Frequency Domain Decomposition (EFDD), see [20,21], and the Stochastic Subspace Identification (SSI) algorithms [22,23], as available in the ARTeMIS software package [24], in order to extract the dynamic characteristics of the grandstand. The collected modal identification output results are then used to update a preliminary FE numerical model of the structure, taken as reference for first estimations only, by parametrically fitting uncertain input variables and performing sensitivity analyses. Among them, key effects were observed to derive from the RC elastic modulus, the connections stiffness and the contribution of non-structural elements (see Section 5).
Description of the Grandstand
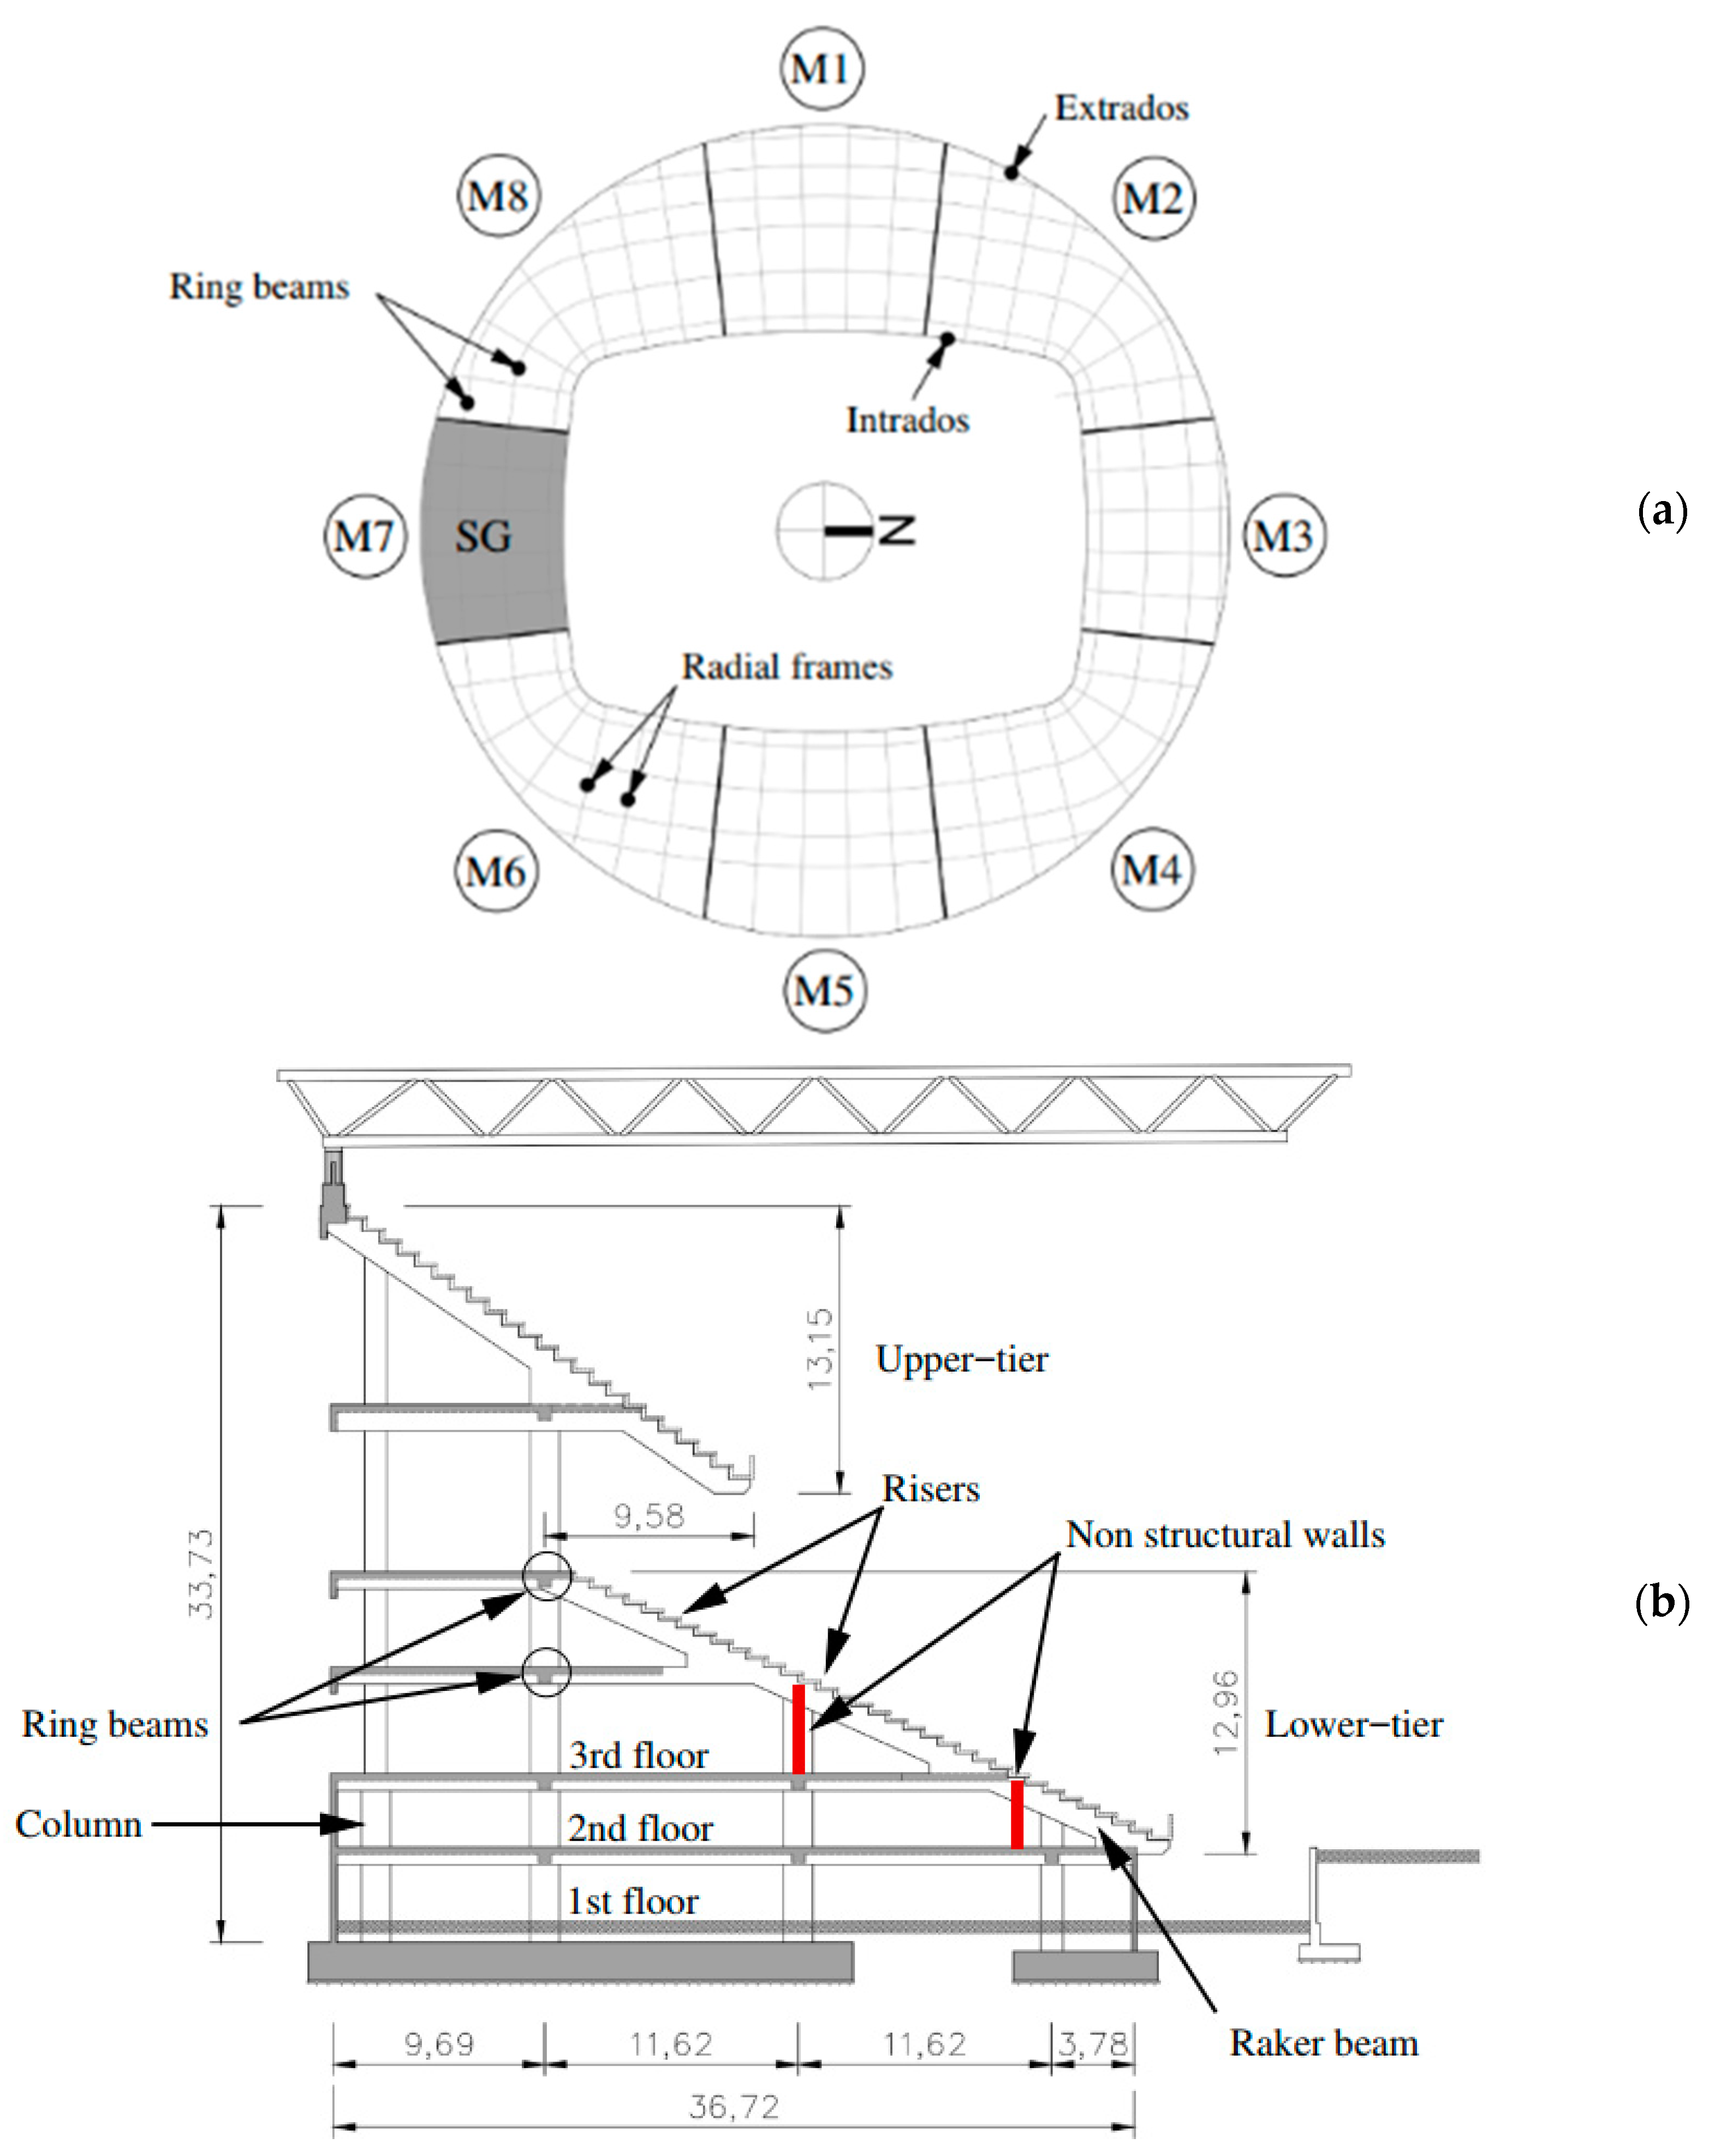
As a case study for the actual research investigation, the South grandstand (SG) of the “Estádio José Alvalade” football stadium in Lisbon—home of Sporting Clube de Portugal—is considered. This stadium was built between 2001 and 2003 and has an overall capacity of 50,000 seated spectators. A general view of the South grandstand is shown in Figure 1. In Figure 2, the location of the grandstand object of investigation (M7) is also emphasised.
In terms of structural concept, according to the available technical drawings, the stadium is basically divided into eight independent modules, comprising a total of 48 radial frames, see Figure 2a. Each frame consists of RC columns, walls and beams, while post-tensioned RC sections are used for raker beams (0.90 × 0.95 mm2) and ring beams (0.70 × 0.60 mm2). The ring beams have spans ranging between 10.5 m and 12.5 m, while pre-stressed hollow-core slabs with RC topping are used in the floors.
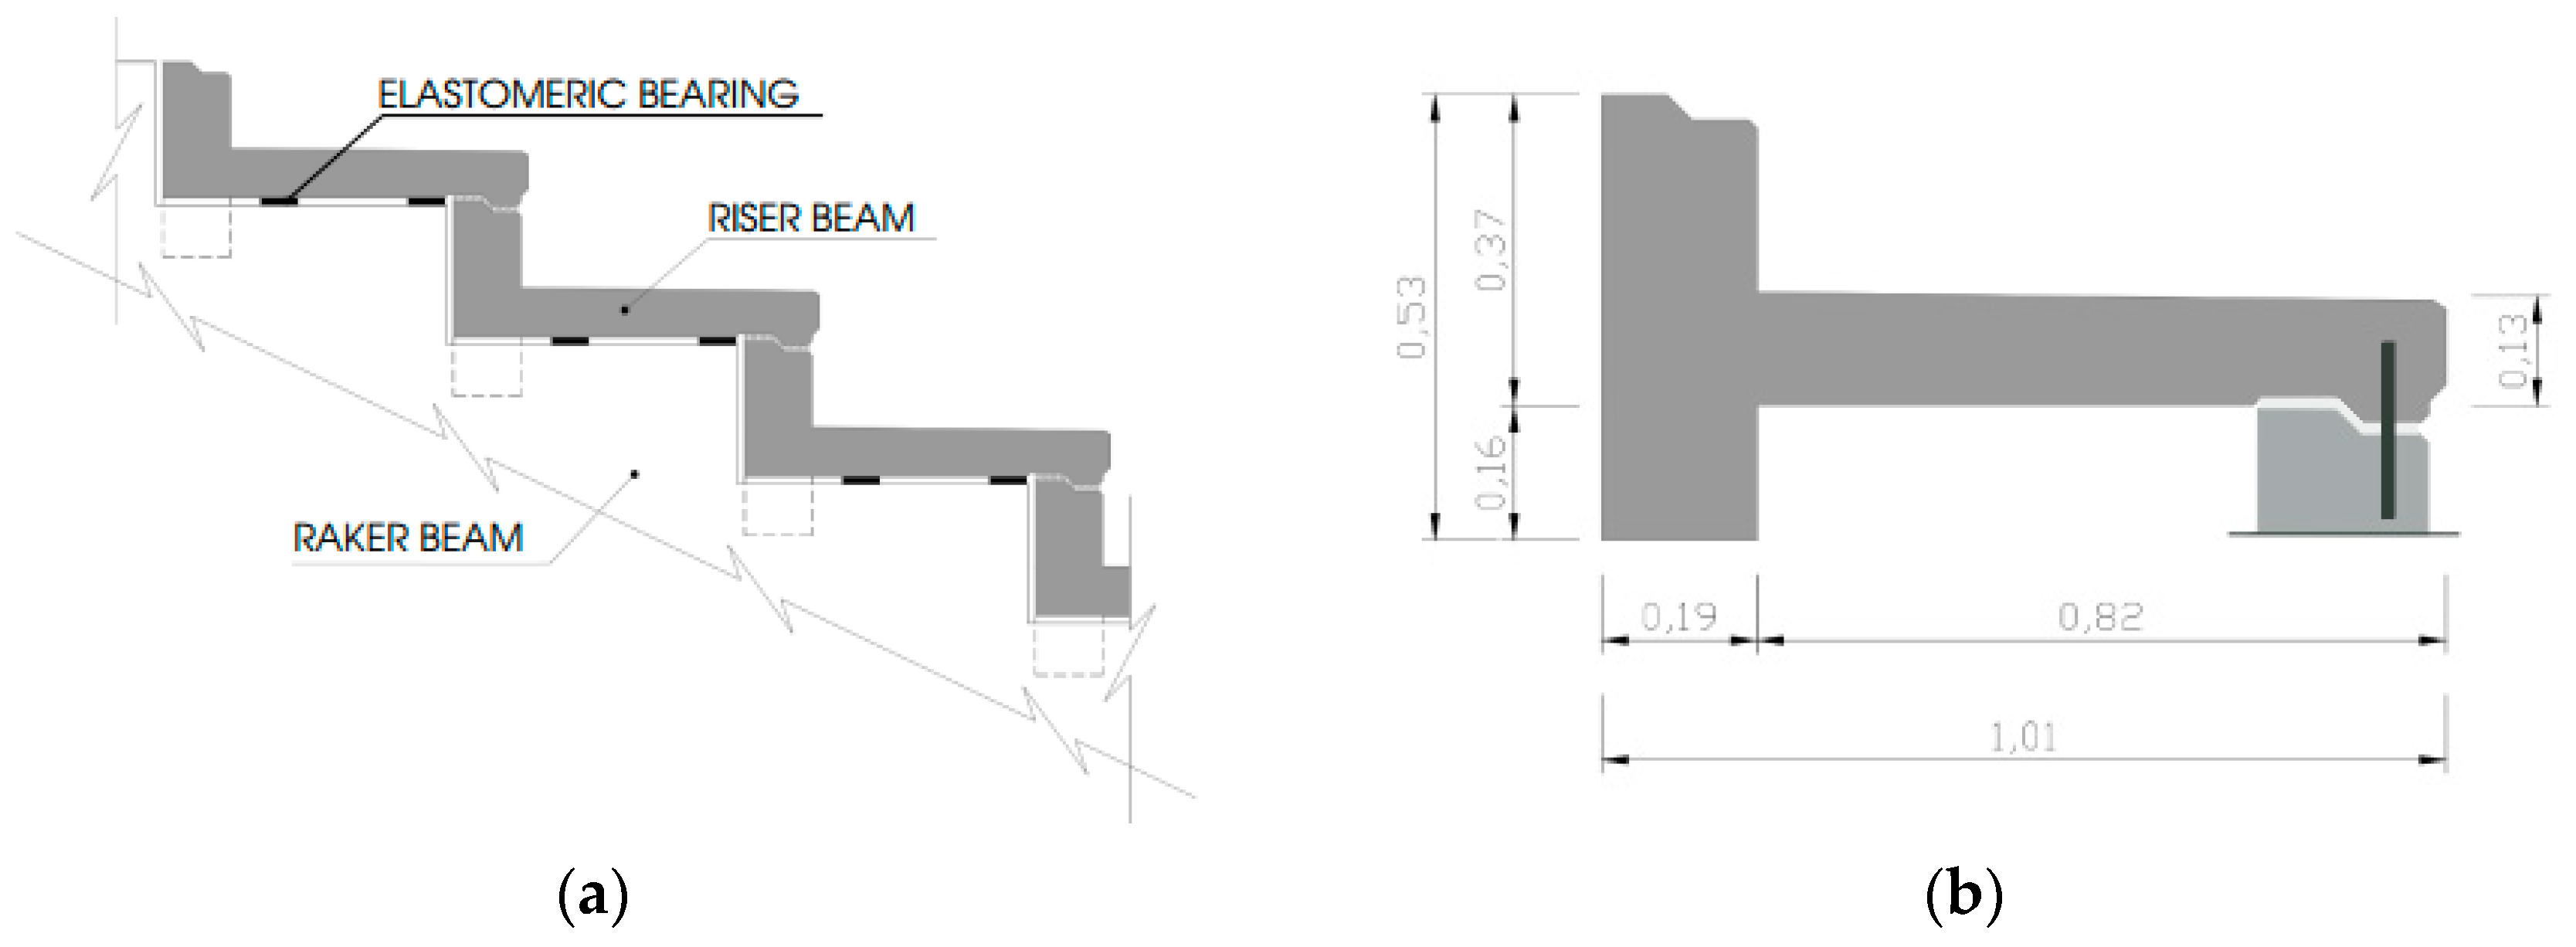
The risers, see Figure 3, are then realised in the form of standardised pre-cast, T-shaped pre-stressed RC members.
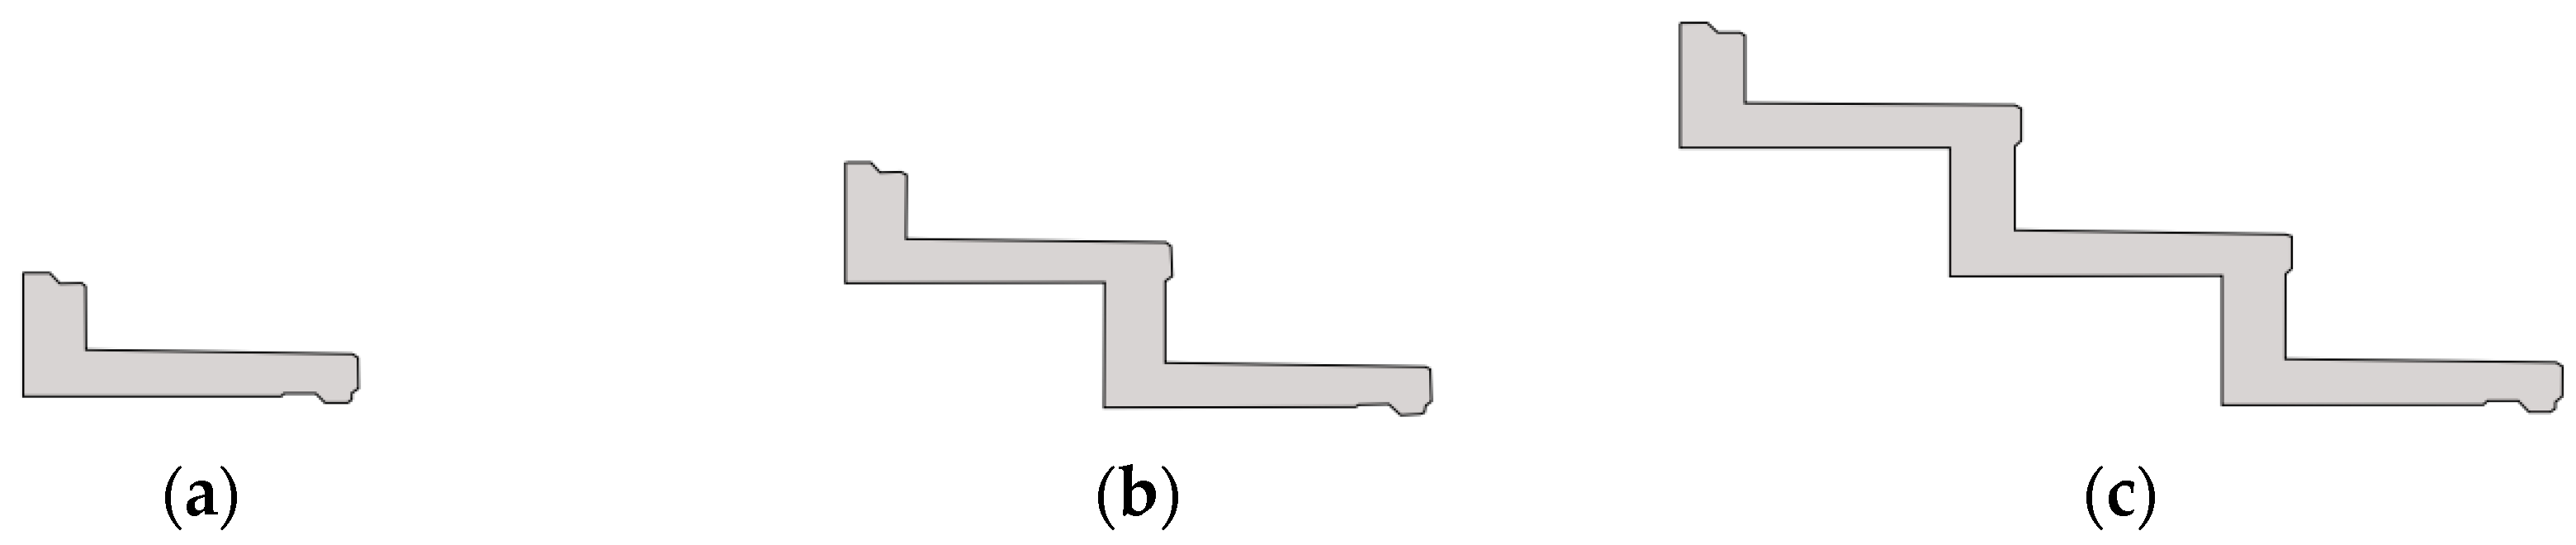
In general terms, riser beams represent one of the most important structural components, for the study of vibration modes of grandstands. Their main functions are in fact to physically accommodate the grandstand seats and to transfer the upcoming loads to the raker beams. In stadium structures, risers can typically comprise single (as for the Sporting Stadium), two or three continuous elements, see Figure 4. Multiple riser elements have the advantage of being stiffer than their single element counterparts, and hence less prone to human induced vibrations. However, this comes at the cost of being a more cumbersome structural element, which is also hard to manage during on-site assembly. In most of the cases, from a construction point of view, it is easier to adopt single element risers, connected between themselves by a set of steel dowels.
For the Sporting Stadium, see Figure 3b, the risers span over a total length of 9.85 m and are simply supported on the raker beams, using neoprene elastomeric bearings and a set of steel dowels (20 mm their nominal diameter). The cross-section of the risers is built up of a rectangular beam (0.53 × 0.19 m2 its size), and a horizontal slab (0.82 m the width, with an average thickness of 0.13 m). The beam comprises then a 0.16 m stem, which is interrupted at the supports. Multiple riser units are then connected between themselves, at mid-span, through a steel dowel having a nominal diameter of 20 mm (Figure 3b).
3. Preliminary Finite Element Model of the Grandstand
Before the execution of on-site experiments, a preliminary 3D FE model was developed using SAP2000 [25] commercial code, see Figure 5, by accounting for the available technical drawings of the grandstand. Four-node quadrilateral shell elements with six degrees of freedom per node were used to model the RC slabs, the walls and the risers of the grandstand, while the other structural elements (namely the RC columns and beams) were described by means of frame elements.
In terms of mechanical properties of the RC members, the material input parameters were calibrated in accordance with the original design calculations for the stadium, where a C40/50 resistance class concrete was chosen for the riser beams, while a C35/45 type concrete was used for the other pre-stressed components of the grandstand (i.e., the ring beams, the raker beams and the slabs). The latter concrete type was also used for the RC columns and walls. A C30/37 resistance class concrete, finally, was taken into account for the radial beams.
Assuming for concrete an isotropic, linear elastic constitutive law, the values of the elastic moduli E corresponding to each one of the mentioned concrete types were chosen from design standards accordingly to the general material prescriptions, i.e., 35, 34 and 33 GPa, respectively, and hence implemented in the reference FE model of the grandstand. Constant values for the Poisson ratio (ν = 0.2) and volumetric weight (γ = 25 kN/m3) were finally considered for all the RC and pre-stressed structural components.
A key role was then assigned to the boundary conditions, as well as to the mechanical interaction between the structural components.
At the foundation level, possible soil-structure interaction was fully neglected and the whole stadium structure was assumed to be ideally clamped at the base. Ideal hinges were then defined at the interception between all the RC components, while particular attention was given to the description of the risers supports. The steel dowel connections between the risers at mid-span (see Figure 3a), were modeled in fact in the form of frame elements reproducing their nominal dimensions. Otherwise, the connection between each riser and the raker beams (see Figure 3b) were numerically described in the form of equivalent, linear spring elements. The elastic stiffness of these springs, being representative of the actual supports, was hence preliminary derived by taking into account the mechanical and geometrical features of neoprene elastomeric bearings and dowel connectors, hence resulting in a reference value of 107 kN/m. As the free length of the dowels (i.e., the gap between the riser and the raker beam) amounted to 20 mm only and the cross-section of the dowels was relevant, this results in an extremely high flexural stiffness for the connection. It was shown in [26] that dynamic estimates for structural systems may be highly affected by input assumptions in the supports and connection details, especially when elastomeric components are used [27], hence requiring careful attention, with respect to the nominal mechanical features (see also Section 5).
A linear modal analysis was carried out in SAP2000, on the so assembled and calibrated reference FE model. In doing so, an unloaded configuration of the grandstand was taken into account. The eigenvalue analysis was hence carried out by fully neglecting the non-linear behavior of the structure due to the deformed geometrical configuration induced by possible dead and live loads.
Post-processing of FE modal results highlighted that the vibration modes of the grandstand are generally localised within the joints of the structural system formed by the raker and the riser beams. These vibration modes are mostly dominated by vertical oscillations, with a front-to-back component of some extent, and are the modes which are specifically addressed in this research study. The first three vibration modes of the lower tier of the grandstand are shown in Figure 6, with evidence of the corresponding frequencies.
4. Experimental Dynamic Identification of the Grandstand
The actual analysis of experimental and FE data follows a past dynamic investigation on a single riser. Previous dynamic testing was in fact carried out during the construction phase of the stadium, as also reported in [28]. The past study detected in about 6.75 Hz the fundamental frequency of a single riser for the stadium grandstand. At that time, in order to accomplish with the frequency criteria that prevent serviceability troubles during lively crowd events [29], the introduction of an additional restraint at mid-span between the risers, and consisting in a 20 mm diameter steel dowel (see Figure 3a), was then proposed and implemented on-site.
The effects of such a restraint solution on the dynamic characteristics of the grandstand are hence evaluated in this paper through a set of experimental measurements, focusing in particular on the natural frequencies and modal shapes of the seating deck, known to be the most vulnerable to crowd-induced dynamic loads. Based on the preliminary FE modal analysis summarised in Section 3, a new set of dynamic experimental tests was hence properly planned and optimised.
AVT are commonly used to identify the global vibration modes of large structures [30], which generally encompass the displacement of a whole structure [1,15]. However, the success of such a method strictly depends on the capacity of the ambient excitation to vibrate the structure, and may be therefore hindered when measuring vertical modes of seating decks (typically protected from the wind). To overcome this limitation, an artificial excitation (random movement of a group of volunteers) was imposed to the examined structure.
4.1. Test Procedure and Vibration Measurement
Several output-only measurement campaigns were conducted during 2012 and 2013 on the empty structure, in the presence of:
- (I)
- natural excitation (wind), and
- (II)
- combined, natural (wind) and artificial (random movement of a group of volunteers) excitation, in order to identify the corresponding dynamic performance, with careful consideration for the the seating deck modes.
By processing the so recorded test data, it was then concluded that the AVT measurements derived from the (II) combined excitation can be used to extract the modal shapes for the grandstand object of investigation.
The experimental study reported in this paper was focused on a limited area on the lower tier of the grandstand, see Figure 7a, known to be the location of the organised supporters. The position of the monitoring grid points was defined based on the FE modal simulations, aiming to guarantee the identification of the natural frequencies and the corresponding vibration modes in the range of interest. The choice of the localisation of the monitoring area and of the interest of the modal parameters of the grandstand was set according to the primary goal of the identification process, that is the simulation of the dynamic response of the grandstand in the presence of a lively crowd participating in a sportive event where coordinated motion is expected. Coordinated crowd motion is likely to excite the symmetric modes of the seating deck and consequently their identification was considered to be the most important. The test setup consisted in a monitoring points grid covering only half of the grandstand, shown in Figure 7b. The dynamic response of the structure was recorded using four Syscom triaxial synchronised velocity sensors (geophones). To cover the 21 grid points, seven different setups were considered, with one reference geophone (grid point #24) and three roving ones. In each setup, the data was acquired for 5 min at a sampling rate of 100 Hz. The required broad-band excitation was achieved by an uncoordinated movement of a group of twelve volunteers.
4.2. Pre-Processing and Data Relevance Analysis of the Measurements Records
When FE updating techniques are used to improve the correlation between the simulated numerical outputs and the experimental behavior of the real structures (based on experimental modal identification data), it is usually assumed that the test measurements represent the reference, correct estimation, and the numerical model must/can be adjusted and enhanced, at the component and/or assembly level. In this case, the presence of possible errors and/or uncertainties in the test measurements can strongly compromise the modal identification results and, consequently, the whole FE updating process [31,32].
One of the possible source of errors in the collected AVT records, at the time of the test measurements, was related to the artificial component of excitation that has been considered. The structural response originated by a group of un-synchronised volunteers, in particular, namely consisted in not an ideal stationary random excitation for the grandstand, and the recorded data consequently needed a careful treatment [5]. Nevertheless, the quality and reliability assessment of the information derived from recorded AVT data is generally recognised to have a key role, in order to guarantee the success of the overall modal identification process [33].
For the study discussed herein, the pre-treatment of the recorded structural responses consisted, essentially, in data inspection, stationarity hypothesis check, filtering and windowing and spectral analysis for relevance check. The time histories were visually inspected to clean the data from spurious trends and the hypothesis of stationarity was checked by a statistical analysis method, the reverse arrangements test [33]. This process allowed to select the portions of the time history that proved to be reasonably stationary, thus minimising the uncertainty of the AVT results.
The adopted reverse arrangement technique computes the mean square values (or other similar parameters) in adjacent segments (at least 20) for individual time histories, and aligns these sample values in time. The number of inequalities where the mean square value (xi > xj) for all pairs (i, j) (i = 1, N) with i < j represents the reverse arrangements [33,34]. The observed number of reverse arrangements A is used to identify the non-stationarity trends. When such a number is in the interval from AN;1𲈒α/2 to AN;α/2 (where α is the confidence level), the time record can be considered as stationary to the degree of significance α. From a theoretical point of view, the Root Mean Square (RMS) values from adjacent segments of a stationary signal are independent observations from a random variable. The presence of time trends in the RMS values may indicate a non-stationarity signal [33].
Each time record was divided in 1.5 s long, non-overlapping data segments and the test for stationarity was checked with a high confidence level (α = 0.03). Based on such a kind of evaluation, the time records from test points #17 and #32 were rejected as non-stationary, see Figure 6b.
To reduce low and high frequency components embedded in the recorded data, a digital Butterworth band pass filter with cut-off frequencies at 0.8 and 20 Hz was applied. Hanning window and 50% overlap was used to the spectrum computation, to minimise possible leakage effects that may affect the Fast Fourier Transform (FFT) results on an incomplete time history.
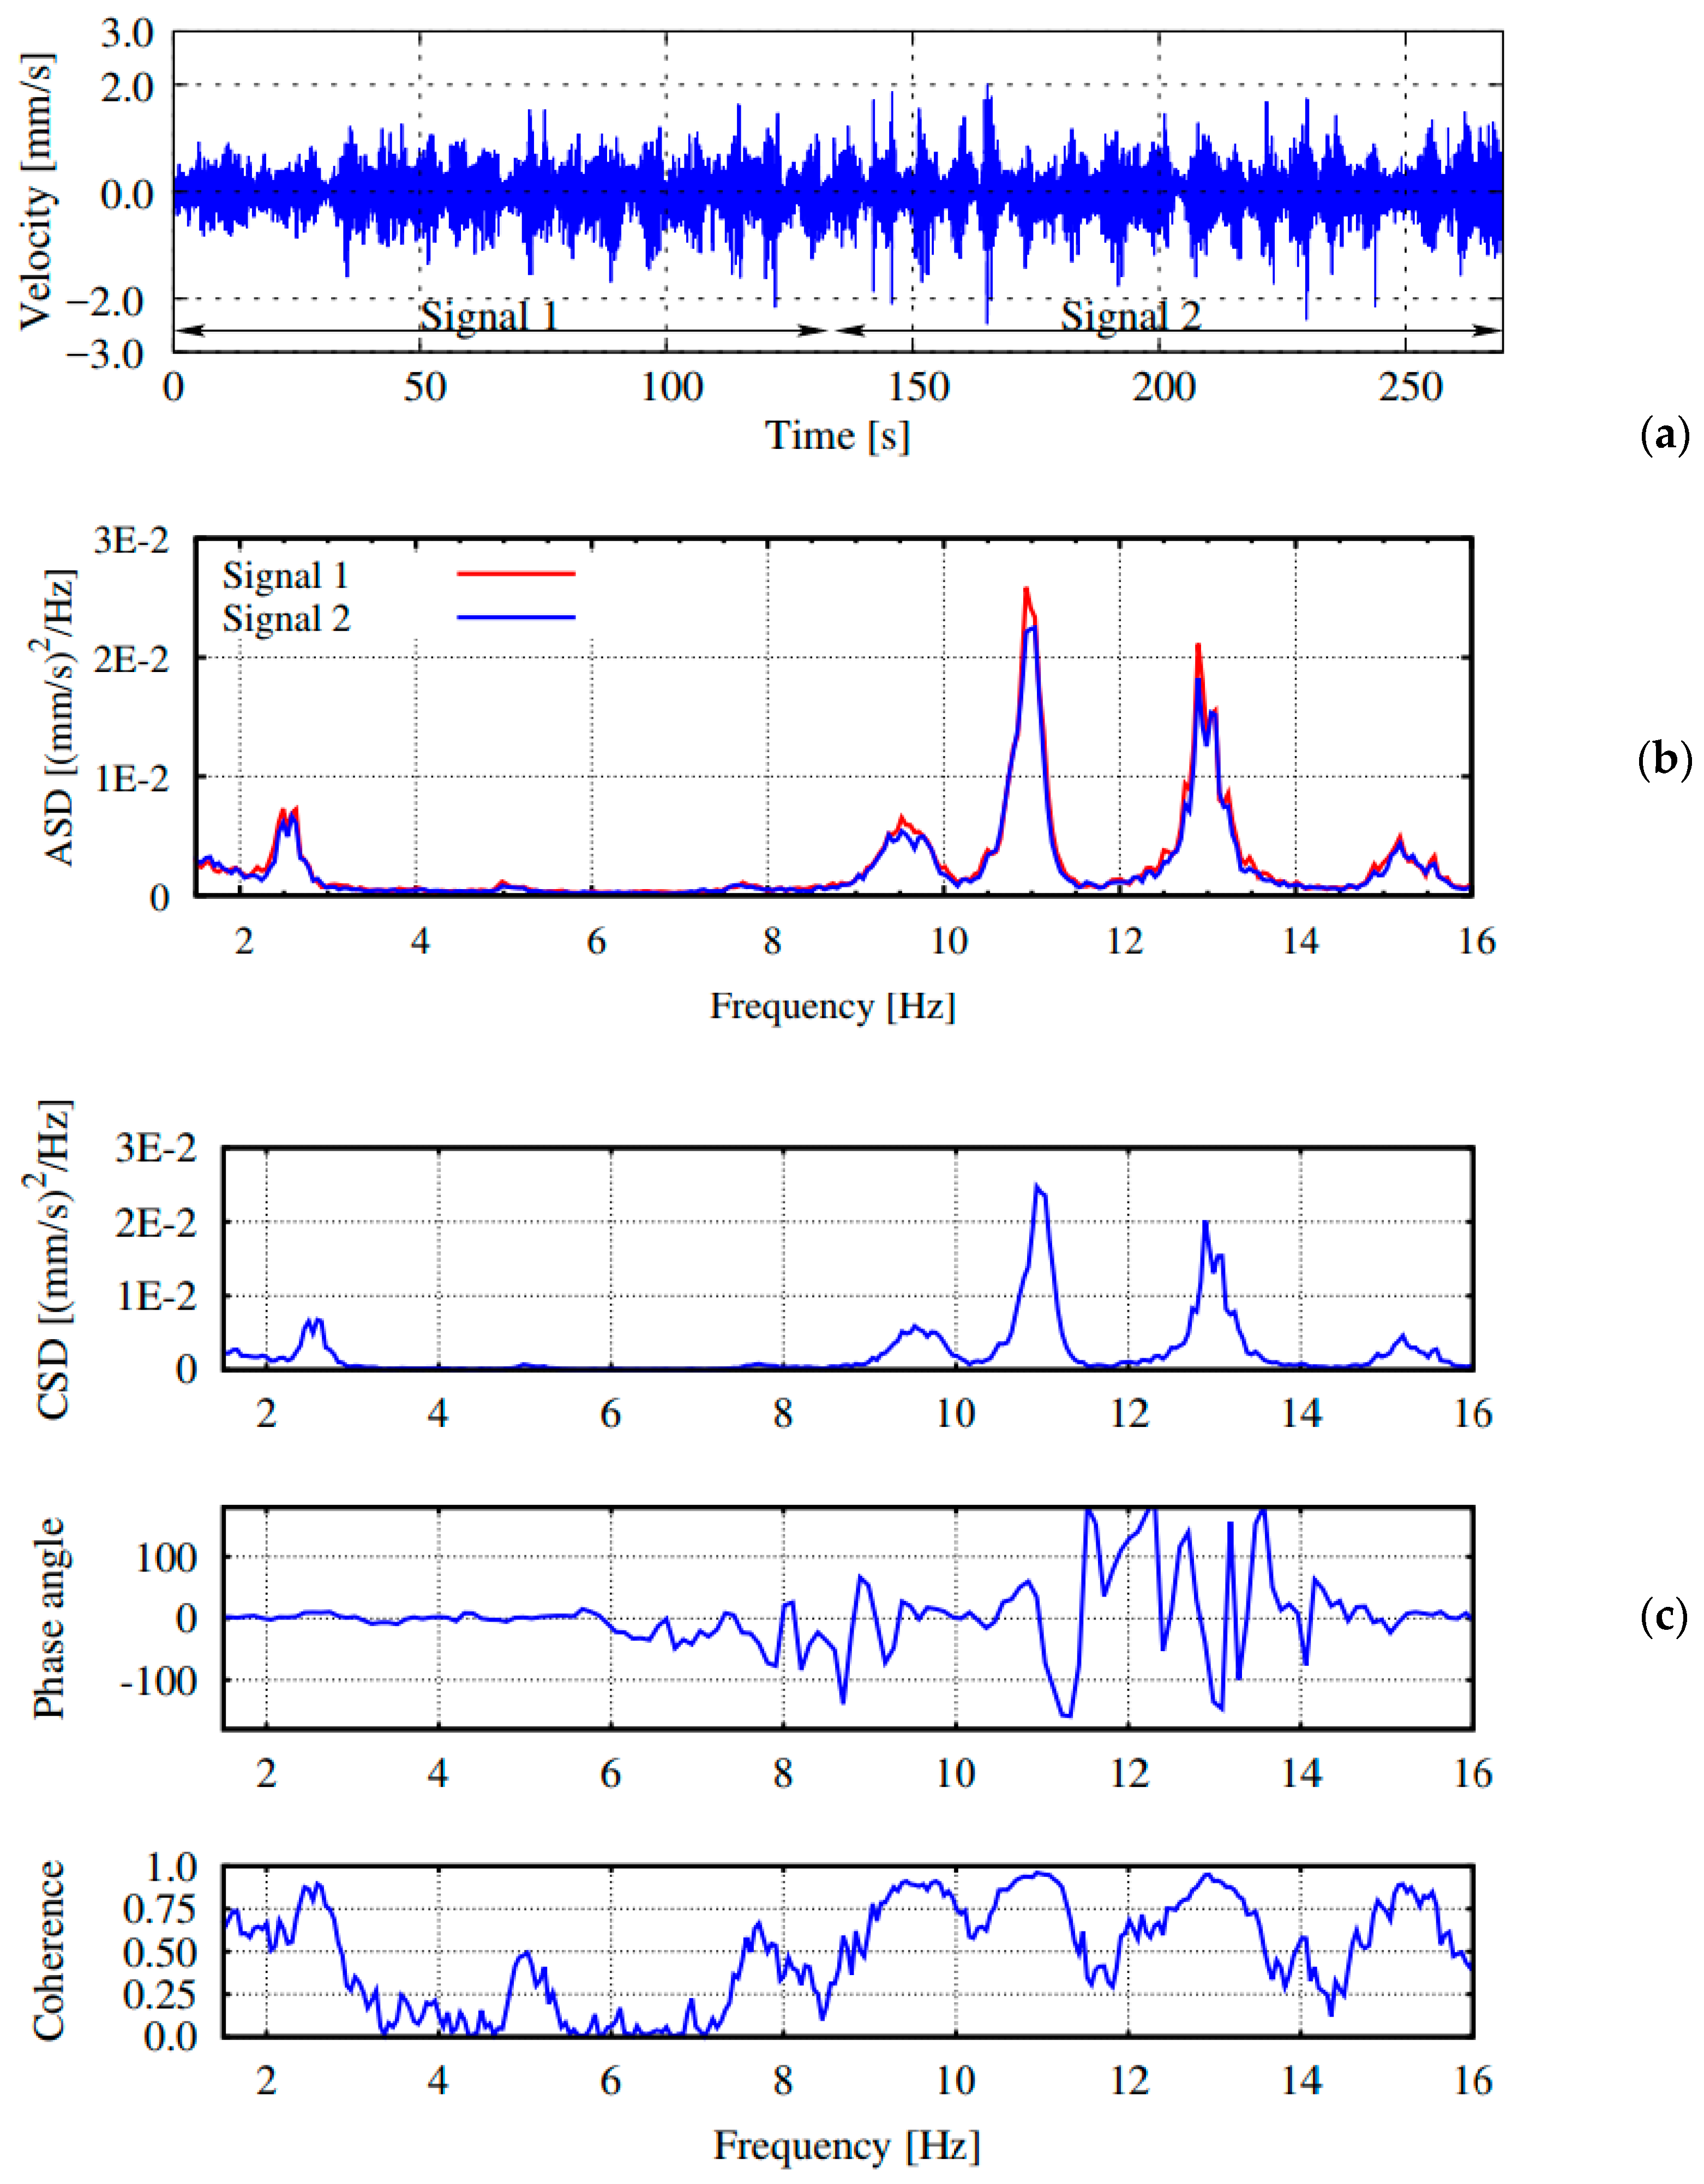
The pre-processed time histories records were checked for data relevance. Each individual signal record was divided into two equal parts, see the Signal 1 and Signal 2 illustrated in Figure 8a,b, and data relevance was checked by a spectral analysis.
Data relevance was commonly considered reliable when (like in Figure 8a,b), their auto-power spectral density estimates showed relevant peaks at the same frequencies. In Figure 8c, the cross-spectrum, coherency, and phase angles for the two signal segments are also proposed. As shown, the relevant peaks exhibit perfect to near-perfect coherence and consistent phase angles.
A detailed spectral analysis was carried out on the individual time series and on pairs of the velocity measurements. The velocity time histories and the corresponding auto-power spectral estimates for selected grid points are presented in Figure 9.
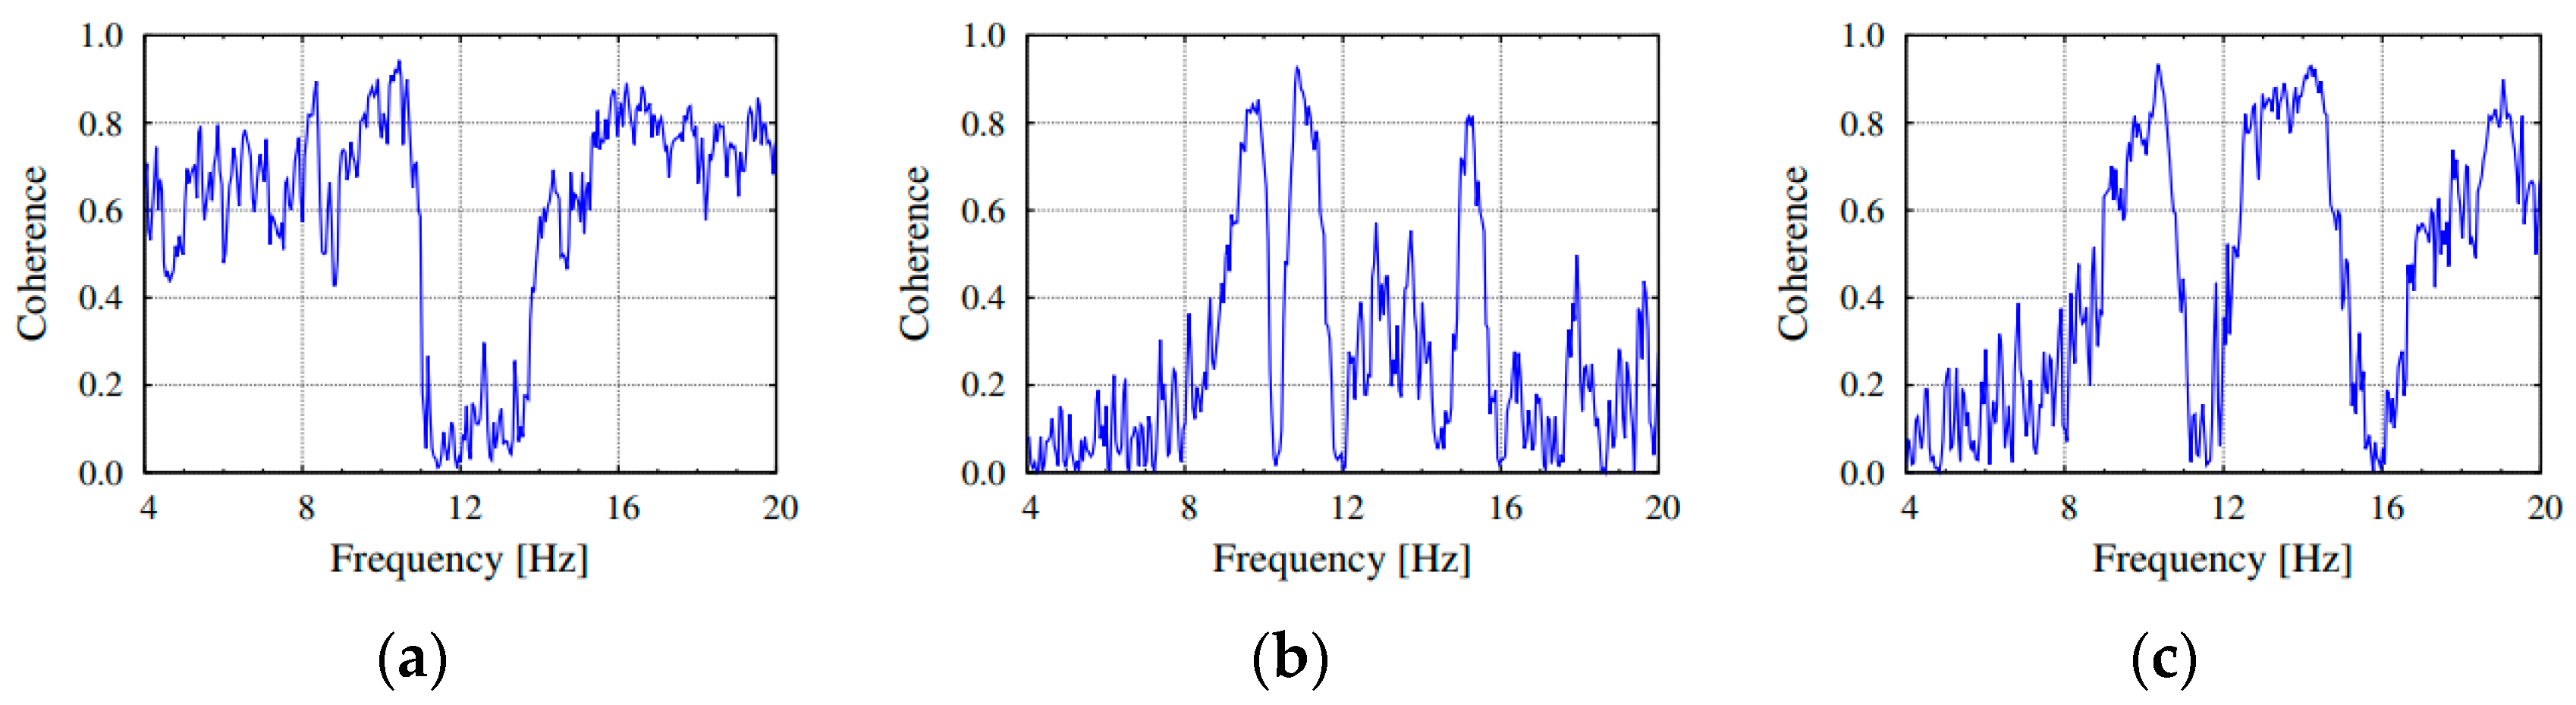
Analysing the time history velocity curves, one can observe that similar velocity amplitude was recorded by all sensors, indicating that the dynamic load was distributed uniformly on the structure. Moreover, the presence of relevant peaks in the same frequency range of the power spectral density plots, strongly suggests that they are consistently related to the natural modes of the structure. In order to evaluate the significance of the spectral peaks in term of the structural vibration modes, the coherence functions for a set of channel pairs are also shown in Figure 10a–c. There, the collected plots suggest a rather good correlation, in the frequency intervals where fundamental modes are expected. Highest values of the coherence occur around 10 Hz, indicating possible frequencies around this value.
4.3. Data Processing for Modal Identification
The velocity time records processed for quality assurance were used next to extract the modal parameters of the empty structure by applying the EFDD [20] and SSI [22] modal identification algorithms, both available in the ARTeMIS [24] commercial software.
The EFDD [19,20] non-parametric method is an extension of the Frequency Domain Decomposition (FDD) algorithm, that estimates the Eigen-modes in the condition of a white noise input and a lightly damped structure by performing a singular-value decomposition of the system’s spectral density spectra to obtain power spectral densities of a set of several single-degrees-of-freedom systems, each corresponding to an individual mode. The EFDD allows the estimation not only of the mode shapes and their frequencies but also of the corresponding damping ratios.
The Stochastic Subspace Identification (SSI) techniques [21,22] is a parametric method developed in the time domain, that uses weighted time series data resulting from the output-only measurements to identify a stochastic state space model that describes the linear vibrations of the structure. For each set-up, a set of models with different parameters are identified and a stabilisation diagram is established, discriminating between stable, unstable, and noise modes.
The dynamic modal characteristics of the lower tier of the grandstand, as resulted from the AVT modal identification procedure based on EFDD and SSI algorithms, are summarised in Table 1. As shown, the first vibration mode (9.40 Hz, according to the SSI algorithm) was not properly identified by the EFDD method.
The corresponding modal shapes are illustrated in Figure 11.
One of the most popular index for the quantitative analysis of the correlation between mode shapes is the modal Assurance Criterion (MAC), see [35]. The MAC is a squared, linear regression correlation coefficient and it provides a measure of the consistency (degree of linearity) between the two vectors under comparison. The MAC values are bounded between 0 and 1, with 1 indicating fully consistent vectors.
When a set of experimental mode shapes are correlated with themselves the MAC procedure is known as AutoMAC and is often used to assess the effectiveness of sensor layout [35].
The AutoMAC matrix computed for the FE model and for the experimental data, Table 2, points out that the measuring points were adequate to determine the mode shapes.
The recorded time series duration comply with the length recommended by technical literature, i.e., 1000-to-2000 times of the first natural period [36,37], therefore the natural frequencies and the mode shapes could be accurately estimated. The family of the SSI method typically provides reliable modal estimates from records of limited duration as they operate on time domain.
The initial MAC matrix, computed from the FE model and experimental data, is shown in Table 3.
5. Sensitivity Analysis and Finite Element Model Updating
Based on the experimentally identified modal properties of the grandstand, it is possible to notice in Table 3 that a relatively week degree of correlation was found for the first vibration modes. The comparison of test estimations with the reference FE numerical results suggests an additional refined calibration of the FE model, with confidence in further analysis. To assess the sensitivity of FE results to input data, an updating procedure was herein performed, consisting in modifying the physically meaningful—but mostly uncertain—input parameters of the numerical model, so as to obtain a better agreement between the numerical estimates and the experimental predictions.
A sensitivity analysis was performed in order to identify/select the most influencing parameters whose changes cause relevant variations in the FE outcomes. According to this analysis it was observed that, for the present structure, the uncertain parameters lie in some specific components, namely represented by:
- (a)
- the riser and raker beams,
- (b)
- the beams and columns belonging to the main frame,
- (c)
- the presence of non-structural elements, and
- (d)
- the mechanical features of the connections between multiple RC components.
By using the reference input values summarised in Table 4 (and further graphically emphasised in Figure 12 by a vertical dot line), a parametric FE investigation was carried out on the preliminary numerical model of Section 3. The modal properties of the grandstand were hence estimated as a function of independent variations in each one of the (a)-to-(d) variables. The resulting sensitivity curves are presented in Figure 12 for the three fundamental vibration modes of interest (f1, f2 and f3) hence allowing to emphasise the major parameters affecting the structural dynamics of the grandstand, hence required to be considered in the updating of the initial FE assembly. The final values of the so selected parameters, through the sensitivity study that is only briefly described in this paper, were in fact chosen using good engineering reasoning, in order to maximise the correlation between the numerical estimates and the experimentally derived dynamic properties of the structure.
5.1. Riser Beams
The riser beams of the Sporting Stadium consist of single precast pre-stressed RC members, hence the uncertainties related to their geometrical variations from nominal dimensions, as well as possible imperfections and possible cracking, are limited. Several literature studies ([38,39,40], etc.) showed how non-destructive testing can be efficient to assess the durability of RC structures.
In this study, it seems reasonable to assume that the parameters controlling the dynamic behavior of the FE model are related to the elastic modulus E and the specific weight γ. The influence of these parameters on the three natural frequencies of the vertical modes is presented in Figure 12a,b. Analysing the related sensitivity curves, one can see that changes in both the input parameters have significant influence on the predicted natural frequencies. The values that allows the numerical prediction to best fit the experimental data are summarised in Table 4, and are respectively characterised by a +10% scatter in the elastic modulus (i.e., corresponding to a higher RC resistance class for the pre-casted elements, compared to the prescribed one), and a marginal decrease (−2%) in the specific weight. The latter value, during the parametric study, was specifically needed to correct possible overlapping effects of the FE model components, in the vicinity of nodal regions.
5.2. Racker Beams
The main functions of the raker beams are to accommodate the riser beams and to transmit their loads to the main structural frame of the grandstand. They also confer an additional horizontal stiffness to the main frame, limiting the inter-story drifts of the overall grandstand. The racker beams are usually pre-stressed, heavy RC elements, cast in place, and hence more prone to geometrical imperfections and deviations from their nominal features. For this reason, the sensitivity analysis was still focused on their elastic modulus E and specific weight γ. The numerical plots presented in Figure 12c,d, however, show that, while E-changes mildly affect the modal properties of the grandstand modes, these modes are mostly non-sensitive to changes in the specific weight γ of the raker beams. Therefore, in the updated FE model, the changes were limited to a +3% increase in the elastic modulus.
5.3. Main Structural Frame
Built up of a series of radial and circumferential RC beams and columns, the key mechanical properties of the main frame members are likely to be affected by cracking. The sensitivity curves illustrated in Figure 12e–f show that a possible opening and evolution of cracks of concrete would moderately affect the vibration modes of the grandstand. Based on the FE parametric simulations, a −10% decrease in the elastic modulus for all these elements was finally considered in the updated model, so as to account for time, load and ambient effects on the frame members.
5.4. Connections
Since largely affecting the structural properties of the grandstand, the FE numerical modeling of connections is generally a subtle and demanding task. In the specific case of the Sporting Stadium, it was shown in Figure 3 that the risers are connected to the raker beams, and between themselves (at mid-span), by a set of steel dowels.
The influence of the actual cross-section of the mid-span dowels on the vibration modes of the grandstand was hence first numerically addressed, and the corresponding curves are presented in Figure 12g. Analysing the so collected plots, it is possibile to notice that the 2nd and 3rd frequencies are highly sensitive to the cross-section of these mid-span dowels, being responsible of an additional restraint for their nominal span. In the updated FE model, a −10% variation in the nominal diameter was considered for them, which is also reasonably representative of possible corrosion effects.
Another important but rather uncertain FE input parameter is then associated with the stiffness of the riser-to-raker beams mechanical connections. These connections, see Figure 3, are physically materialised by a set of steel dowels which work together with neoprene elastomeric bearings, and are numerically reproduced, in the FE model, by a set of equivalent spring elements. As shown in Figure 12h, compared to mid-span dowels, the stiffness of these connections marginally affects the 2nd and 3rd vibration modes of the grandstand. As the initial stiffness considered for these connections (i.e., 107 kN/m) proved to be numerically unreliable, however, a lower value (105 kN/m) was taken into account in the FE updated model.
5.5. Non-Structural Components
The presence of non-structural components, in conclusion, can largely affect the dynamic behavior of the given grandstand, as a major effect of the additional mass (which could be readily considered in the FE model in the form of lumped mass contributions), but also resulting from the additional constrain that these members may partly involve in the free vibration of the structure. The non-structural elements considered in the present study, in particular, are represented by the walls that divide the space in the grandstand lower floors, as derived from architectural impositions (see also Figure 2b for further details). In the FE model, these masonry walls are located between the riser beams and the 2nd and 3rd floors, respectively, and described in the form of equivalent spring members.
The sensitivity analysis of the updated FE model showed that the activation of these spring elements—and especially the springs representative of the masonry walls placed between the riser beams and the 2nd floor—are responsible of suppressing the first vibration mode of the lower tier of the grandstand, hence resulting in unreliable numerical predictions. From such a preliminary FE outcome, one may conclude that the 2nd level masonry wall is not mechanically connected to the riser beams, and therefore the corresponding spring elements should not activate. In the current FE study, these springs were hence dismissed from the updated numerical model.
Accordingly, further attention was spent for the masonry walls at the level of the 3rd floor, see Figure 2b. Based on the sensitivity curves collected in Figure 12i, this latter set of spring elements proved to have negligible effects on the numerical estimates of the vibration modes of the grandstand. As a result, similarly to the 2nd floor walls, these springs were dismissed from the optimal FE model assembly.
5.6. Optimal FE Parameters
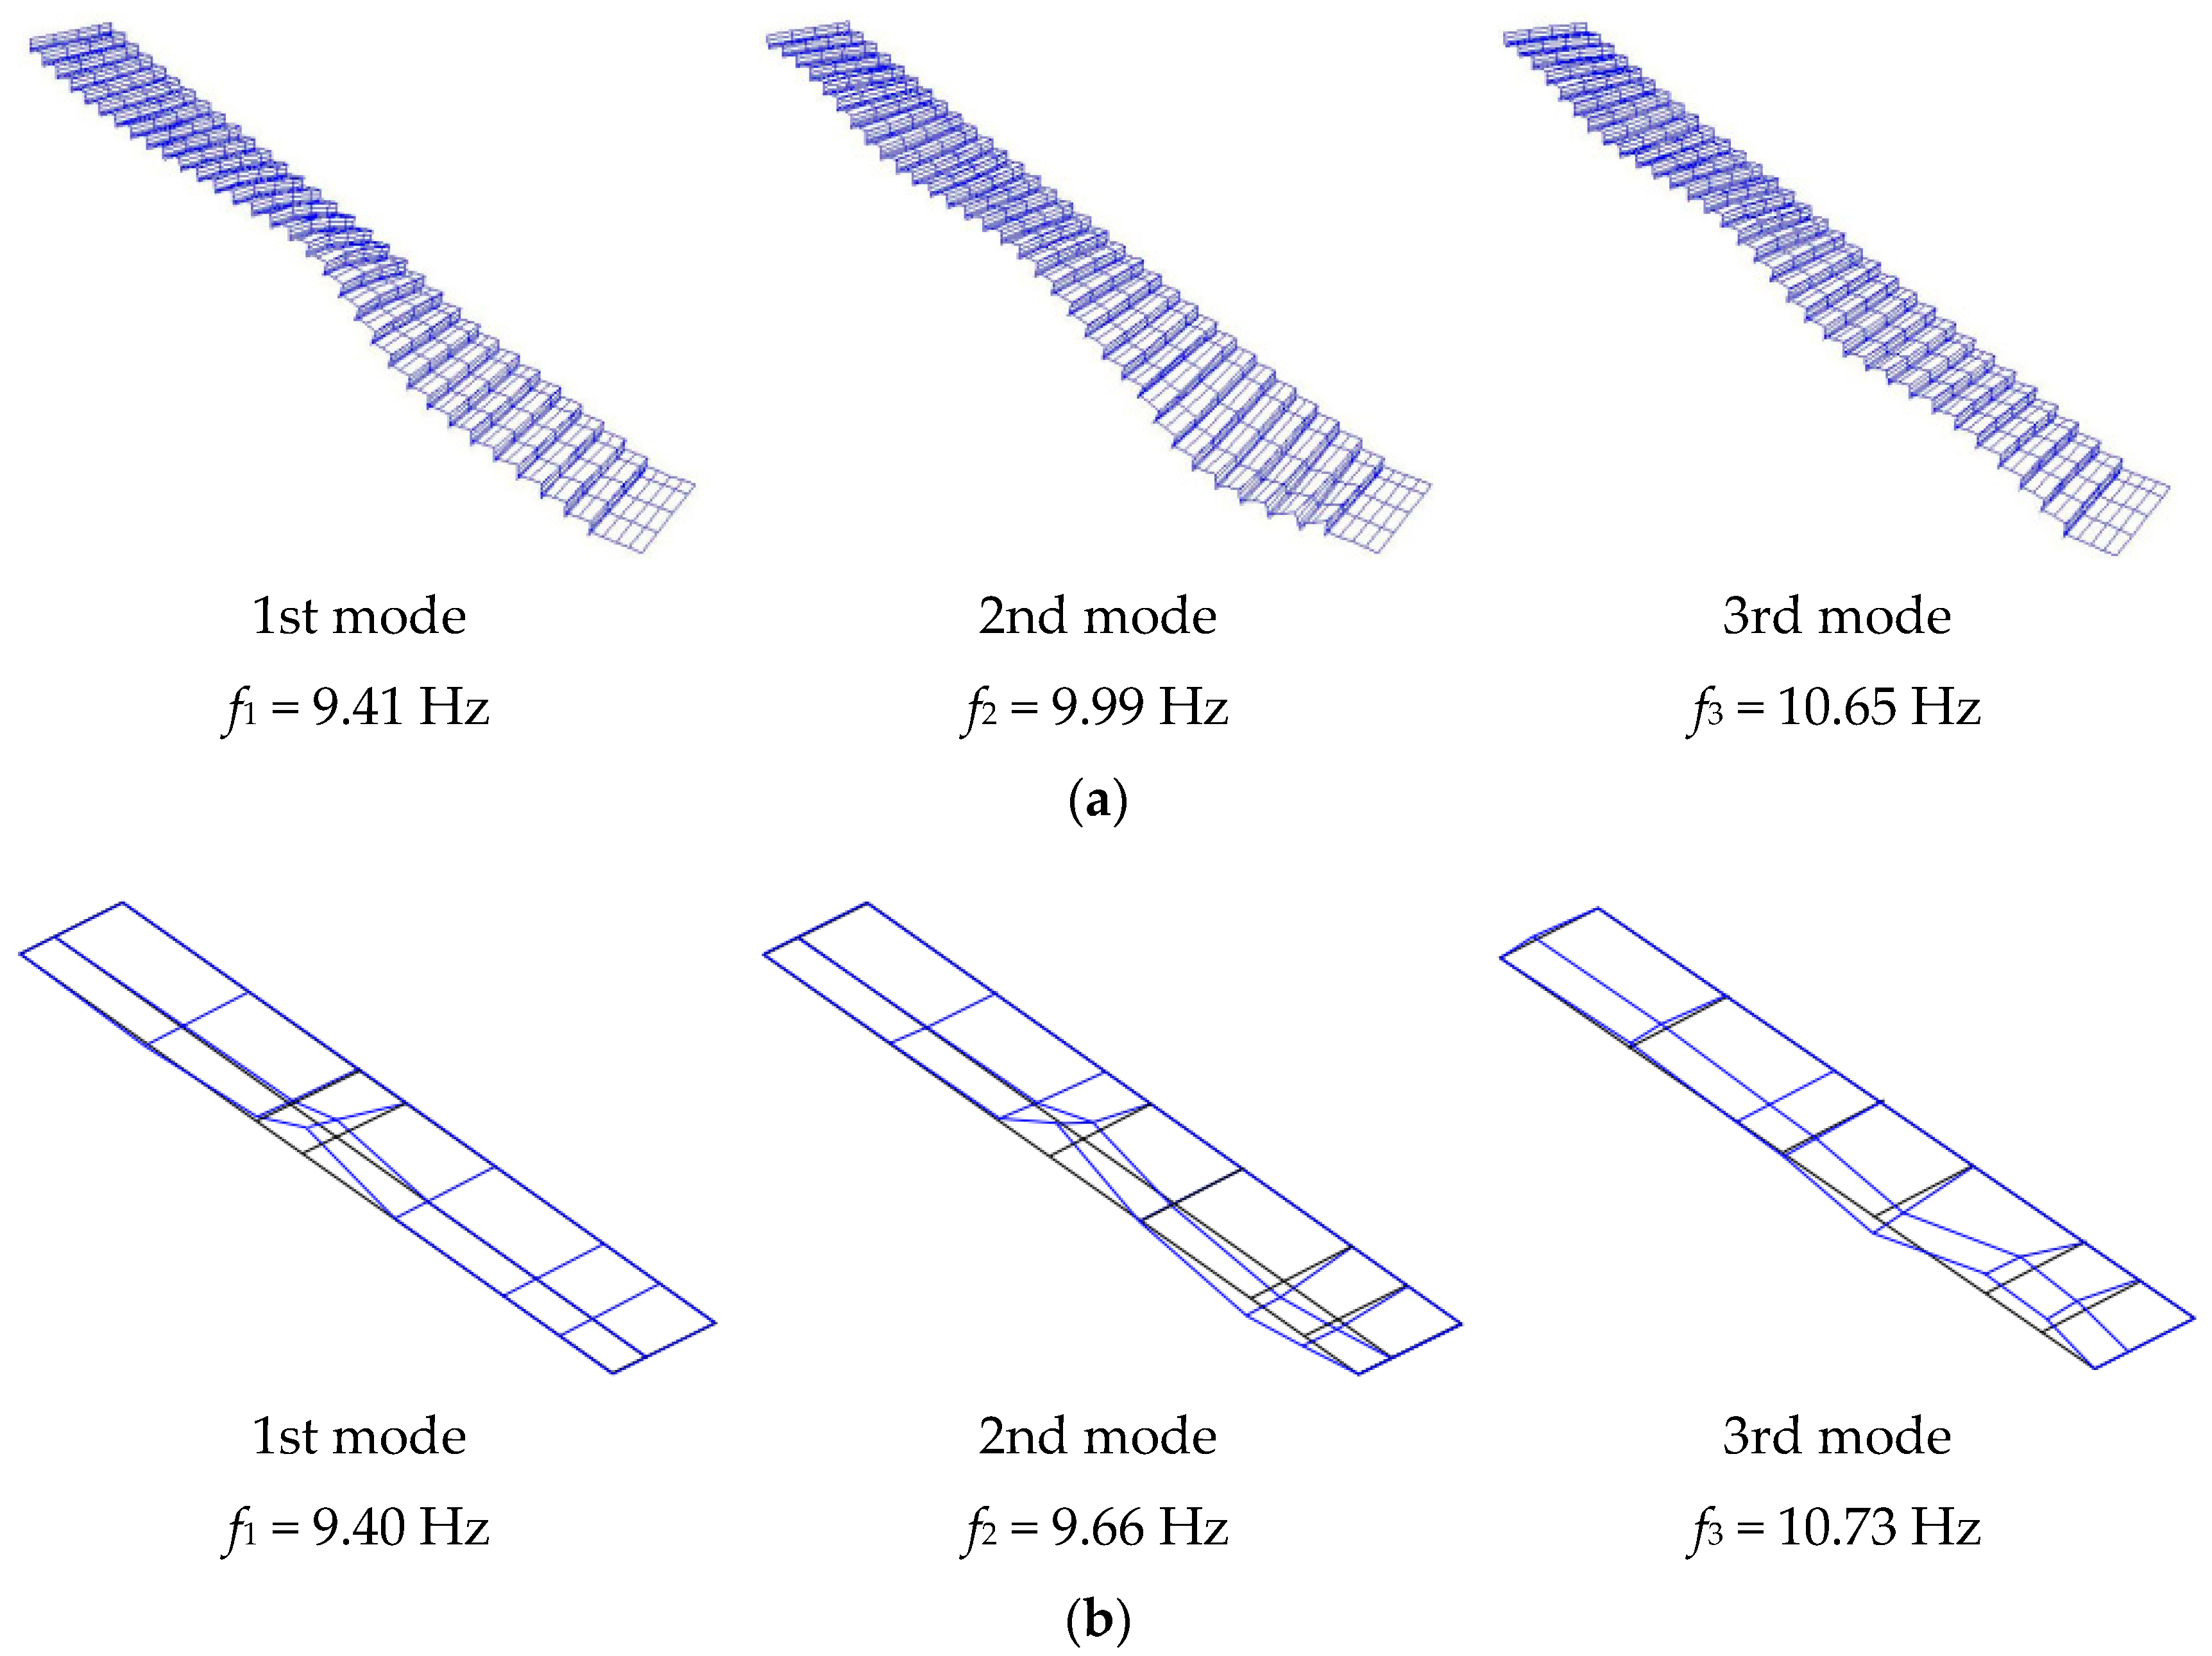
The updated FE parameters resulting from the sensitivity study are collected in Table 4. The comparison between the modal experimental data and the numerical estimates, calculated by using both the reference and the updated FE models, are also presented in Table 5, so as to illustrate the marked reduction in the initial frequency discrepancies with respect to the test measurements. One may also refer to that the updated MAC values presented in Table 6, that also suggest a high correlation between the examined modal shapes, hence denoting that the obtained updated FE model could be used, with some degree of confidence, in subsequent analyses of the stadium. Especially for the 1st and 3rd vibration modes, in particular, it can be see that the corresponding frequency scatter is minimised, with MAC values in the order of 0.98 and 0.88 respectively. The numerical estimates for the modal shapes and corresponding natural frequencies, as obtained by using the updated FE model of the grandstand, are presented in Figure 13, together with the corresponding test derivations (empty structure). In the case of the 2nd mode, a weakest modal correlation was still observed, even with marked improvements, with respect to the initial FE estimations. The calculated scatter and MAC are in fat in the range of 3.3% and 0.75, hence suggesting a rather good correlation with test measurements.
6. Conclusions
In this paper, the dynamic modal parameters of a RC stadium grandstand structure were identified using test measurements of the structural response induced by a combined natural and artificial ambient excitation. To this aim, the acquired velocity records were processed to minimise noise effects, so as to qualify and assess data relevance of the selected data segments used in the identification process.
By using two independent operational modal analysis techniques, the EFDD and SSI algorithms available in the ARTeMIS computer software, it was possible to identify the fundamental frequencies and mode shapes of the examined grandstand, with a good agreement between the corresponding test estimations. The frequencies and mode shapes where hence used to define the target of a FE model updating algorithm, to considerably improve the quality of a preliminary structural FE model carried out in SAP2000, but accounting for nominal geometrical and mechanical features only.
It was found that the dynamic properties of the grandstand are highly sensitive to even small variations (i.e., less than ±10%) on the elastic modulus of the RC structural elements, mainly in what concerns the riser and the raker beams. Limited variations on the weight of the riser beams (up to a maximum of ±3%) also proved to greatly affect the dynamic properties of the examined grandstand. A key role was then emphasised by the stiffness calibration for the structural connections, as well as non-structural components.
The updated FE model generally resulted in rather good correlation with test measurements, as well as markedly enhanced estimates, compared to the preliminary FE model. In this sense, it is expected that the updated FE assembly could be reasonably used as a robust tool for the evaluation of the dynamic response of the grandstand in the presence of a crowd action, as well as that could serve as a reference background for possible long-term monitoring of the grandstand.
Author Contributions
This research contribution results from a joint collaboration between the involved authors. More in detail, F.S., C.C. and I.C. developed and post-processed the experimental data measurements. FS implemented the numerical model of the RC structure. C.B. supported the post-processing analysis of experimental/numerical results and the interpretation of their correlation. All the authors actively contributed to the paper drafting and review.
Funding
No external funding was received for the research study.
Acknowledgments
The authors would like to thank Sporting Clube de Portugal for providing access to the structure and supplementary data. The authors would also like to thank António Reis, from GRID, for providing important technical data, and José Varandas, for his inestimable help during the field tests.
Conflicts of Interest
The authors declare no conflict of interest.
References
- IStructE. Dynamic Performance Requirements for Permanent Grandstands Subject to Crowd Action; Recommendations for Management Design and Assessment; The Institution of Structural Engineers: London, UK, 2008. [Google Scholar]
- ISO10137. Bases for Design of Structures—Serviceability of Buildings against Vibration; International Standardisation Organisation: Geneva, Switzerland, 2007. [Google Scholar]
- Jones, C.; Reynolds, P.; Pavic, A. Vibration serviceability of stadium structures subjected to dynamic crowd loads: A literature review. J. Sound Vib. 2011, 330, 1531–1566. [Google Scholar] [CrossRef]
- Sachse, R.; Pavic, A.; Reynolds, P. Parametric study of modal properties of damped two-degree-of-freedom crowd-structure dynamic systems. J. Sound Vib. 2004, 274, 461–480. [Google Scholar] [CrossRef]
- Reynolds, P.; Pavic, A. Vibration performance of a large cantilever grandstand during an international football match. ASCE J. Perform. Constr. Facil. 2006, 20, 202–212. [Google Scholar] [CrossRef]
- Yang, Y. Comparison of bouncing loads provided by three different human structure interaction models. In Proceedings of the 2010 International Conference on Mechanic Automation and Control Engineering, Wuhan, China, 26–28 June 2010. [Google Scholar] [CrossRef]
- Ellis, B.R.; Ji, T.; Littler, J.D. The response of grandstands to dynamic crowd loads. Proc. ICE Struct. Build. 2000, 140, 355–365. [Google Scholar] [CrossRef] [Green Version]
- Vasileios, K.; Larcher, M.; Solomos, G. Review on soft target/public space protection guidance. In Report EUR 29116 EN, 2nd ed.; European Commission: Brussels, Belgium, 2018; ISBN 978-92-79-79907-5. ISSN 1831-9424. [Google Scholar] [CrossRef]
- Gul, M.; Catbas, F.N. A review of structural health monitoring of a football stadium for human comfort and structural performance. Struct. Congr. 2013, 2445–2454. [Google Scholar] [CrossRef]
- Ren, L.; Yuan, C.-L.; Li, H.-N.; Yi, T.-H. Structural health monitoring system developed for Dalian Stadium. Int. J. Struct. Stab. Dyn. 2016, 16, 1640018. [Google Scholar] [CrossRef]
- Di Lorenzo, E.; Manzato, S.; Peeters, B.; Marulo, F.; Desmet, W. Structural health monitoring strategies based on the estimation of modal parameters. Procedia Eng. 2017, 199, 3182–3187. [Google Scholar] [CrossRef]
- Spencer, B.F.; Ruiz-Sandoval, M.; Kurata, N. Smart sensing technology for structural health monitoring. In Proceedings of the 13th World Conference on Earthquake Engineering, Vancouver, BC, Canada, 1–6 August 2004. Paper no. 1791. [Google Scholar]
- Bedon, C.; Bergamo, E.; Izzi, M.; Noé, S. Prototyping and validation of MEMS accelerometers for structural health monitoring—The case study of the Pietratagliata cable-stayed bridge. J. Sens. Actuator Netw. 2018, 7, 30. [Google Scholar] [CrossRef]
- Cunha, A.; Caetano, E. Experimental modal analysis of civil engineering structures. Sound Vib. 2006, 40, 12–20. [Google Scholar]
- IStructE. Dynamic Testing of Grandstands and Seating Decks. Advisory Note; Tech. rep.; Department for Transport, Local Government and the Regions, Department for Culture, Media and Sport: London, UK, 2002.
- Caprioli, A.; Vanali, M. Comparison of different serviceability assessment measures for different events held in the G. Meazza Stadium in Milano. In Proceedings of the IMAC-XXVII, Orlando, FL, USA, 9–12 February 2009. [Google Scholar]
- Modak, S.; Kundra, T.; Nakra, B. Comparative study of model updating methods using simulated experimental data. Comput. Struct. 2002, 80, 437–447. [Google Scholar] [CrossRef]
- Steenackers, G.; Guillaume, P. Finite element model updating taking into account the uncertainty on the modal parameters estimates. J. Sound Vib. 2006, 296, 919–934. [Google Scholar] [CrossRef]
- Karadelis, J. Reliability pointers for modal parameter identification of grandstand terraces. J. Civ. Eng. Res. 2012, 2, 84–99. [Google Scholar] [CrossRef]
- Brincker, R.; Ventura, C.; Andersen, P. Damping estimation by frequency domain decomposition. In Proceedings of the 19th International Modal Analysis Conference (IMAC), Kissimmee, FL, USA, 5–8 Feberuary 2001. [Google Scholar]
- Brincker, R.; Andersen, P.; Jacobsen, N.J. Automated frequency domain decomposition for operational modal analysis. In Proceedings of the 25th International Modal Analysis Conference (IMAC), Orlando, FL, USA, 19 February 2007. [Google Scholar]
- Van Overschee, P.; Moor, B.D. Subspace Identification for Linear Systems: Theory, Implementation, Applications; Kluwer Academic Publishers: Dordrecht, The Netherlands, 1996. [Google Scholar]
- Brincker, R.; Andersen, P. Understanding stochastic subspace identification. In Proceedings of the XXIV International Modal Analysis Conference (IMAC), St. Louis, MO, USA, 30 January–2 February 2006; Society for Experimental Mechanics (SEM) I, The Printing House: Bethel, CT, USA, 2006; p. 6. [Google Scholar]
- Structural Vibration Solutions A/S (SVS). ARTeMIS Extractor Pro 2011, Release 5.3, User’s Manual; SVS: Aalborg, Denmark, 2011. [Google Scholar]
- Computers and Structures Inc. (CSI). SAP2000 v10 Integrated Finite Element Analysis and Design of Structures; CSI: Berkeley, CA, USA, 2013. [Google Scholar]
- Bedon, C.; Dilena, M.; Morassi, A. Ambient vibration testing and structural identification of a cable-stayed bridge. Meccanica 2016, 51, 2777–2796. [Google Scholar] [CrossRef] [Green Version]
- Bedon, C.; Morassi, A. Dynamic testing and parameter identification of a base-isolated bridge. Eng. Struct. 2014, 60, 85–99. [Google Scholar] [CrossRef]
- Proença, J.; Branco, F. Case studies of vibrations in structure. Rev. Eur. Génie Civ. 2005, 9, 159–186. [Google Scholar] [CrossRef]
- IStructE. Dynamic Performance Requirements for Permanent Grandstands Subject to Crowd Action: Interim Guidance on Assessment and Design; The Institution of Structural Engineers: London, UK, 2001. [Google Scholar]
- Brincker, R.; Andersen, P. Ambient response analysis modal analysis for large structures. In Proceedings of the 6th International Congress on Sound and Vibration, Copenhagen, Denmark, 5–8 July 1999. [Google Scholar]
- Cattaneo, A.; Manzoni, S.; Vanal, M. Measurement uncertainty in operational modal analysis of a civil structure. In Proceedings of the ISMA2010 Including USD2010, Leuven, Belgium, 20–22 September 2010. [Google Scholar]
- Zhang, J.; Prader, J.; Grimmelsman, K.; Moon, F.; Aktan, A.; Shama, A. Challenges in experimental vibration analysis for structural identification and corresponding engineering strategies. In Proceedings of the International Conference of Experimental Vibration Analysis for Civil Engineering Structures, Zurich, Switzerland, 19–21 October 2015. [Google Scholar]
- Bendat, J.S.; Piersol, A.G. Random Data: Analysis and Measurement Procedures, 4th ed.; John Wiley & Sons, Inc.: New York, NY, USA, 2012. [Google Scholar]
- Brandt, A. Introduction, in Noise and Vibration Analysis: Signal Analysis and Experimental Procedures; John Wiley & Sons, Ltd.: New York, NY, USA, 2011. [Google Scholar]
- Rainieri, C.; Fabbrocino, G. Operational Modal Analysis of Civil Engineering Structures: An Introduction and Guide for Applications; Springer: Heidelberg, Germany, 2014. [Google Scholar]
- Brincker, R.; Ventura, C.C.; Andersen, P. Why output-only modal testing is a desirable tool for a wide range of practical applications. In Proceedings of the 21th International Modal Analysis Conference (IMAC), Kissimmee, FL, USA, 3–6 February 2003. [Google Scholar]
- Rainieri, C.; Fabbrocino, G.; Cosenza, E. Some remarks on experimental estimation of damping for seismic design of civil constructions. Shock Vib. 2010, 17, 383–395. [Google Scholar] [CrossRef]
- Hola, J.; Bien, J.; Sadowski, L.; Schabowicz, K. Non-destructive and semi-destructive diagnostics of concrete structures in assessment of their durability. Bull. Pol. Acad. Sci. 2015, 63. [Google Scholar] [CrossRef]
- Lute, M. Non-destructive vibration tests on reinforced concrete structures. Key Eng. Mater. 2015, 660, 186–191. [Google Scholar] [CrossRef]
- Verma, S.K.; Bhadauria, S.S.; Akhtar, S. Review of nondestructive testing methods for condition monitoring of concrete structures. J. Constr. Eng. 2013, 2013, 834572. [Google Scholar] [CrossRef]
- Nagy, A. Determination of E-modulus of young concrete with nondestructive method. J. Mater. Civ. Eng. 1997, 9, 15–20. [Google Scholar] [CrossRef]
- Chisari, C.; Bedon, C.; Amadio, C. Dynamic and static identification of base-isolated bridges using Genetic Algorithms. Eng. Struct. 2015, 102, 80–92. [Google Scholar] [CrossRef]
Figure 1.
General view of the South grandstand.

Figure 2.
Structural features of the South grandstand (M7): (a) location (plan view) and (b) detailing of the radial frame (nominal dimensions given in m).
Figure 2.
Structural features of the South grandstand (M7): (a) location (plan view) and (b) detailing of the radial frame (nominal dimensions given in m).

Figure 3.
Geometrical features of the risers: (a) supports on the raker beams and (b) mid-span cross-section (nominal dimensions given in m).
Figure 3.
Geometrical features of the risers: (a) supports on the raker beams and (b) mid-span cross-section (nominal dimensions given in m).

Figure 4.
Riser beam typologies: schematic view of (a) single, (b) two and (c) three-element riser beams.
Figure 4.
Riser beam typologies: schematic view of (a) single, (b) two and (c) three-element riser beams.

Figure 5.
Finite Element model of the grandstand (SAP2000).

Figure 6.
Numerically estimated vibration modes of the lower tier (reference FE model, SAP2000). (a) First, (b) second and (c) third modal shape and corresponding frequency.
Figure 6.
Numerically estimated vibration modes of the lower tier (reference FE model, SAP2000). (a) First, (b) second and (c) third modal shape and corresponding frequency.

Figure 7.
AVT of the empty structure: (a) detail of the monitored zone for the M7 grandstand (lower tier) and (b) corresponding test grid (with grid point #24 representing the reference geophone).
Figure 7.
AVT of the empty structure: (a) detail of the monitored zone for the M7 grandstand (lower tier) and (b) corresponding test grid (with grid point #24 representing the reference geophone).

Figure 8.
Data relevance for a representative time record for grid point #24: (a) velocity time history for each signal segment; (b) auto-power spectral density estimate for each signal segment; (c) cross-spectral density, phase angle and coherence for the two signal segments.
Figure 8.
Data relevance for a representative time record for grid point #24: (a) velocity time history for each signal segment; (b) auto-power spectral density estimate for each signal segment; (c) cross-spectral density, phase angle and coherence for the two signal segments.

Figure 9.
(a) Typical time history and (b) auto-power spectral density for selected representative grid points (vertical direction).
Figure 9.
(a) Typical time history and (b) auto-power spectral density for selected representative grid points (vertical direction).

Figure 10.
Coherence of the cross spectral density function for representative grid point pairs: (a) grid points #33 and #24; (b) #15 and #24; (c) #22 and #24.
Figure 10.
Coherence of the cross spectral density function for representative grid point pairs: (a) grid points #33 and #24; (b) #15 and #24; (c) #22 and #24.

Figure 11.
Identified frequencies and corresponding modal shapes (empty structure).

Figure 12.
FE sensitivity study of the grandstand. In evidence, the variation of the first three vibration frequencies of the structure. (a–i) plots according to Table 4.
Figure 12.
FE sensitivity study of the grandstand. In evidence, the variation of the first three vibration frequencies of the structure. (a–i) plots according to Table 4.

Figure 13.
(a) Numerical (updated FE model) and (b) experimental fundamental modal shapes, with evidence of the corresponding vibration frequencies.
Figure 13.
(a) Numerical (updated FE model) and (b) experimental fundamental modal shapes, with evidence of the corresponding vibration frequencies.


Table 1.
Experimentally identified fundamental frequencies of the lower tier of the grandstand. n.a. = not available.
Table 1.
Experimentally identified fundamental frequencies of the lower tier of the grandstand. n.a. = not available.
| f [Hz] | ||
|---|---|---|
| Vibration Mode | EFDD | SSI |
| 1st mode | n.a. | 9.40 |
| 2nd mode | 9.66 | 9.67 |
| 3rd mode | 10.96 | 10.73 |
Table 2.
AutoMAC for the reference FE model and experimental matrices.
| Reference FE Model | 1st mode | 2nd mode | 3rd mode |
| 1st mode | 1.00 | 0.03 | 0.12 |
| 2nd mode | 0.03 | 1.00 | 0.24 |
| 3rd mode | 0.12 | 0.24 | 1.00 |
| Experiment | 1st mode | 2nd mode | 3rd mode |
| 1st mode | 1.00 | 0.28 | 0.00 |
| 2nd mode | 0.28 | 1.00 | 0.47 |
| 3rd mode | 0.00 | 0.47 | 1.00 |
Table 3.
MAC matrix.
| Reference FE Model/Experiment | 1st Mode | 2nd Mode | 3rd Mode |
|---|---|---|---|
| 1st mode | 0.98 | 0.21 | 0.01 |
| 2nd mode | 0.00 | 0.64 | 0.24 |
| 3rd mode | 0.00 | 0.52 | 0.87 |
Table 4.
Key parameters for the sensitivity analyses and FE model updating. In evidence, the reference input and the updated (optimal) values. ∆ = 100 × (vup − vref)/vref.
Table 4.
Key parameters for the sensitivity analyses and FE model updating. In evidence, the reference input and the updated (optimal) values. ∆ = 100 × (vup − vref)/vref.
| FE Parameter | Reference Value | Updated Value | ∆ [%] | Reference Figure | ||
|---|---|---|---|---|---|---|
| Riser beams | Elastic modulus E | GPa | 35 | 38.5 | +10 | 12a |
| Specific weight γ | kN/m3 | 25 | 24.5 | −2 | 12b | |
| Raker beams | Elastic modulus E | GPa | 34 | 35 | +3 | 12c |
| Specific weight γ | kN/m3 | 25 | 25 | 0 | 12d | |
| Main frame beams | Elastic modulus E | GPa | 33 | 29.7 | −10 | 12e |
| Main frame columns | Elastic modulus E | GPa | 34 | 30.6 | −10 | 12f |
| Dowels | Diameter φ | mm | 20 | 18 | −10 | 12g |
| Connections | Stiffness k (riser-to-raker beams) | kN/m | 107 | 105 | −100 | 12h |
| Stiffness k (walls-to-riser beam) | kN/m | 107 | 105 | −100 | 12i | |
Table 5.
Experimental and numerical frequencies, as obtained from the reference and updated FE models. ∆ = 100 × (vFE − vexp)/vexp.
Table 5.
Experimental and numerical frequencies, as obtained from the reference and updated FE models. ∆ = 100 × (vFE − vexp)/vexp.
| Experiment | Reference FE Model | Updated FE Model | |||||
|---|---|---|---|---|---|---|---|
| Vibration Mode | f [Hz] | f [Hz] | ∆ [%] | MAC | f [Hz] | ∆ [%] | MAC |
| 1st | 9.40 | 9.50 | 1.06 | 0.98 | 9.41 | 0.11 | 0.98 |
| 2nd | 9.66 | 10.22 | 5.69 | 0.64 | 9.99 | 3.31 | 0.75 |
| 3rd | 10.73 | 11.76 | 9.60 | 0.87 | 10.65 | 0.75 | 0.88 |
Table 6.
Final MAC matrix for the updated FE model.
| Updated FE Model/Experiment | 1st Mode | 2nd Mode | 3rd Mode |
|---|---|---|---|
| 1st mode | 0.98 | 0.21 | 0.01 |
| 2nd mode | 0.07 | 0.75 | 0.20 |
| 3rd mode | 0.04 | 0.42 | 0.88 |
© 2018 by the authors. Licensee MDPI, Basel, Switzerland. This article is an open access article distributed under the terms and conditions of the Creative Commons Attribution (CC BY) license (http://creativecommons.org/licenses/by/4.0/).
Share and Cite
MDPI and ACS Style
Santos, F.; Cismaşiu, C.; Cismaşiu, I.; Bedon, C. Dynamic Characterisation and Finite Element Updating of a RC Stadium Grandstand. Buildings 2018, 8, 141. https://doi.org/10.3390/buildings8100141
AMA Style
Santos F, Cismaşiu C, Cismaşiu I, Bedon C. Dynamic Characterisation and Finite Element Updating of a RC Stadium Grandstand. Buildings. 2018; 8(10):141. https://doi.org/10.3390/buildings8100141
Chicago/Turabian StyleSantos, Filipe, Corneliu Cismaşiu, Ildi Cismaşiu, and Chiara Bedon. 2018. "Dynamic Characterisation and Finite Element Updating of a RC Stadium Grandstand" Buildings 8, no. 10: 141. https://doi.org/10.3390/buildings8100141
Note that from the first issue of 2016, this journal uses article numbers instead of page numbers. See further details here.