Article

Preventing Dampness Related Health Risks at the Design Stage of Buildings in Mediterranean Climates: A Cyprus Case Study

by
Ugochukwu Kenechi Elinwa
1,*,
Cemil Atakara
1,
Ifeoluwa Oyeleke Ojelabi
1,2,* and
Abiola Ayopo Abiodun
2
1
Department of Architecture, Faculty of Fine Arts, Design and Architecture, Cyprus International University, Lefkosa 99258, North Cyprus, via Mersin 10, Turkey
2
Department of Civil Engineering, Faculty of Engineering, Eastern Mediterranean University, Famagusta 99628, North Cyprus, via Mersin 10, Turkey
*
Authors to whom correspondence should be addressed.
Buildings 2018, 8(5), 66; https://doi.org/10.3390/buildings8050066
Submission received: 20 February 2018 / Revised: 30 March 2018 / Accepted: 22 April 2018 / Published: 1 May 2018
(This article belongs to the Special Issue Occupant Comfort and Well-Being)

Abstract

:
Dampness is a major building challenge that poses a health risk by aiding the growth of mold and other related microorganisms in very humid areas. Thus, the correction of these post-effects results in high maintenance costs via energy consumption, due to the prolonged heating of damp rooms and post-treatment, especially during the winter. A survey of 2000 valid respondents living in apartment-style buildings was conducted and analyzed using SPSS software. In this study, the AutoDesk Computational Fluid Dynamics (ACFD) software was used to perform a simulation for building materials analysis, to evaluate them for suitability in high humidity areas and to select the best building orientation for adequate and natural ventilation. The analysis aimed to observe the indoor air conditions due to environmental air flow conditions. The relationships of the airflow conditions to the material properties were measured. The methodology involves a Failure Modes and Effects Analysis to determine the level and nature of the dampness sources. The Design-Expert Statistical-Software 10 confirmed the simulation results. The simulation revealed a lower percentage of relative humidity and temperature in Adobe walls than in brick walls.

1. Introduction

Dampness can be defined as water penetration through the walls and individual elements of a building. Dampness can also be defined as an excessive quantity of moisture contained in building materials and components that cause adverse movements or deterioration, resulting in unacceptable internal environmental conditions [1]. Dampness is defined as the amount of moisture content present in a material and classified it as capillary moisture content, equilibrium moisture content, hygroscopic water content, total water content, and potential moisture content [2]. Some authors have argued that dampness contributes to more than 50% of all known building failures [3,4,5]. Therefore, the ultimate objective of any humidity study is to identify the lead source of moisture and to recommend steps to remedy the problem [6]. Sources of dampness can be classified as rising humidity, penetrating moisture, condensation, and pipe leakages [2,5]. Nevertheless, a high proportion of building dampness is caused by rising damp, penetrating damp (rain penetration), and condensation, which are the three most common types of dampness that affect a building. Rising humidity occurs as a result of the capillary suction of moisture from the ground into porous masonry building materials such as stones, bricks, blocks, earth, and mortars [7]. The illustration of possible ways that buildings can get wet is provided in Figure 1.
At the request of the U.S. Centers for Disease Control and Prevention (CDC), the Institute of Medicine (IOM) of the National Academy of Sciences convened a committee of experts to conduct a comprehensive review of the scientific literature concerning the relationship between damp or moldy indoor environments and the appearance of adverse health effects in exposed populations. Based on their review, the members of the Committee on Damp Indoor Spaces and Health concluded that the epidemiological evidence shows an association between exposure to damp indoor environments and adverse health effects, including upper respiratory (nasal and throat) symptoms, cough, wheeze, asthma symptoms in sensitized persons with asthma [8,9,10,11,12,13]. The transfer of moisture in buildings is a very complex issue that can cause the deterioration of buildings by damaging brick/block work, the decaying and breaking up of mortar joints, fungal attacks in timber, and corrosion in iron and steel as well as stained wall surfaces (both internally and externally) [1]. This has a significant effect on the performance of the building envelopes, thus affecting the general performance of the building. Building Information Modeling (BIM) tools provide integrated systems that can address building performance issues at the design stage and also provide useful measures for assessing the life cycle of the performance of the building [14]. The application of BIM offers a communicative profile by which a link can be established for the observed conditions with the expectations within the built environment. The study argues that the CFD analysis is most suitable at the design stage of a building to determine what materials are most suitable for the envelopes of buildings because the building envelopes have a significant 51% influence on the energy loads of the buildings [15]. “Defining evidence-based thresholds for unhealthy levels of D/M would involve, first, identifying a metric of D/M that shows sufficiently consistent dose-related associations with key health effects to be considered an acceptable proxy for the underlying dampness-related causal agents [8].” Optimizing ventilation can significantly impact the indoor air and reduce the cooling loads experienced within the boundaries of existing conditions associated with the mold index [9]. Scholars have further argued for adequate levels of ventilated spaces, as too little leads to mold growth and too much may result in the growth of Cladosporium. Also, critical factors for fungal growth in indoor spaces are temperature and humidity [12]. In a similar study on dampness, [10], asserts that factors of climatology could influence the prevalence of indoor dampness and molds. Their study revealed that the number of occupants (e.g., family of two or a family of four) and the type of building (detached villas or apartments) had a significant influence on the reported cases of indoor mold or damp spots. They also argued that there is insufficient research that deals with this issue. Therefore, the objective of this work, among others, is to contribute to existing research on dampness and indoor air quality.
In this work, 2000 questionnaires were reviewed on a ratio of 1:6 to determine the nature of reported damp spots and molds within the interiors of buildings in North Cyprus Using the Failure Modes and Effects Analysis (FMEA) and Computational Fluid Analysis (CFD) analysis methods. This study determined the nature of airflow and relative humidity of interior spaces and to postulate prevention, remediation, and maintenance techniques for apartment buildings in Famagusta, North Cyprus.

1.1. Computational Fluid Dynamics (CFD) Analysis

The CFD analysis was first introduced in the mid-1950s, made conceivable by the introduction of the digital computer. A CFD is a computer-based scientific modeling tool fit for managing liquid flow problems and foreseeing physical liquid streams and heat exchange [16]. According to the book Computational Fluid Dynamics: The Basics with Applications [17], CFD utilizes the fundamental governing equations of fluid dynamics as represented by the continuity, momentum, and energy equations. CFD is utilized intensively as a tool for assessing the indoor condition of a building and its connection with the building envelope and also to analyze the outdoor condition of the building [18]. CFD has additionally been connected to test proposed natural ventilation, blended mode ventilation, and HVAC systems in structures [19,20,21,22], which for the most part includes the prediction of air temperature, speed, and relative humidity among different parameters.

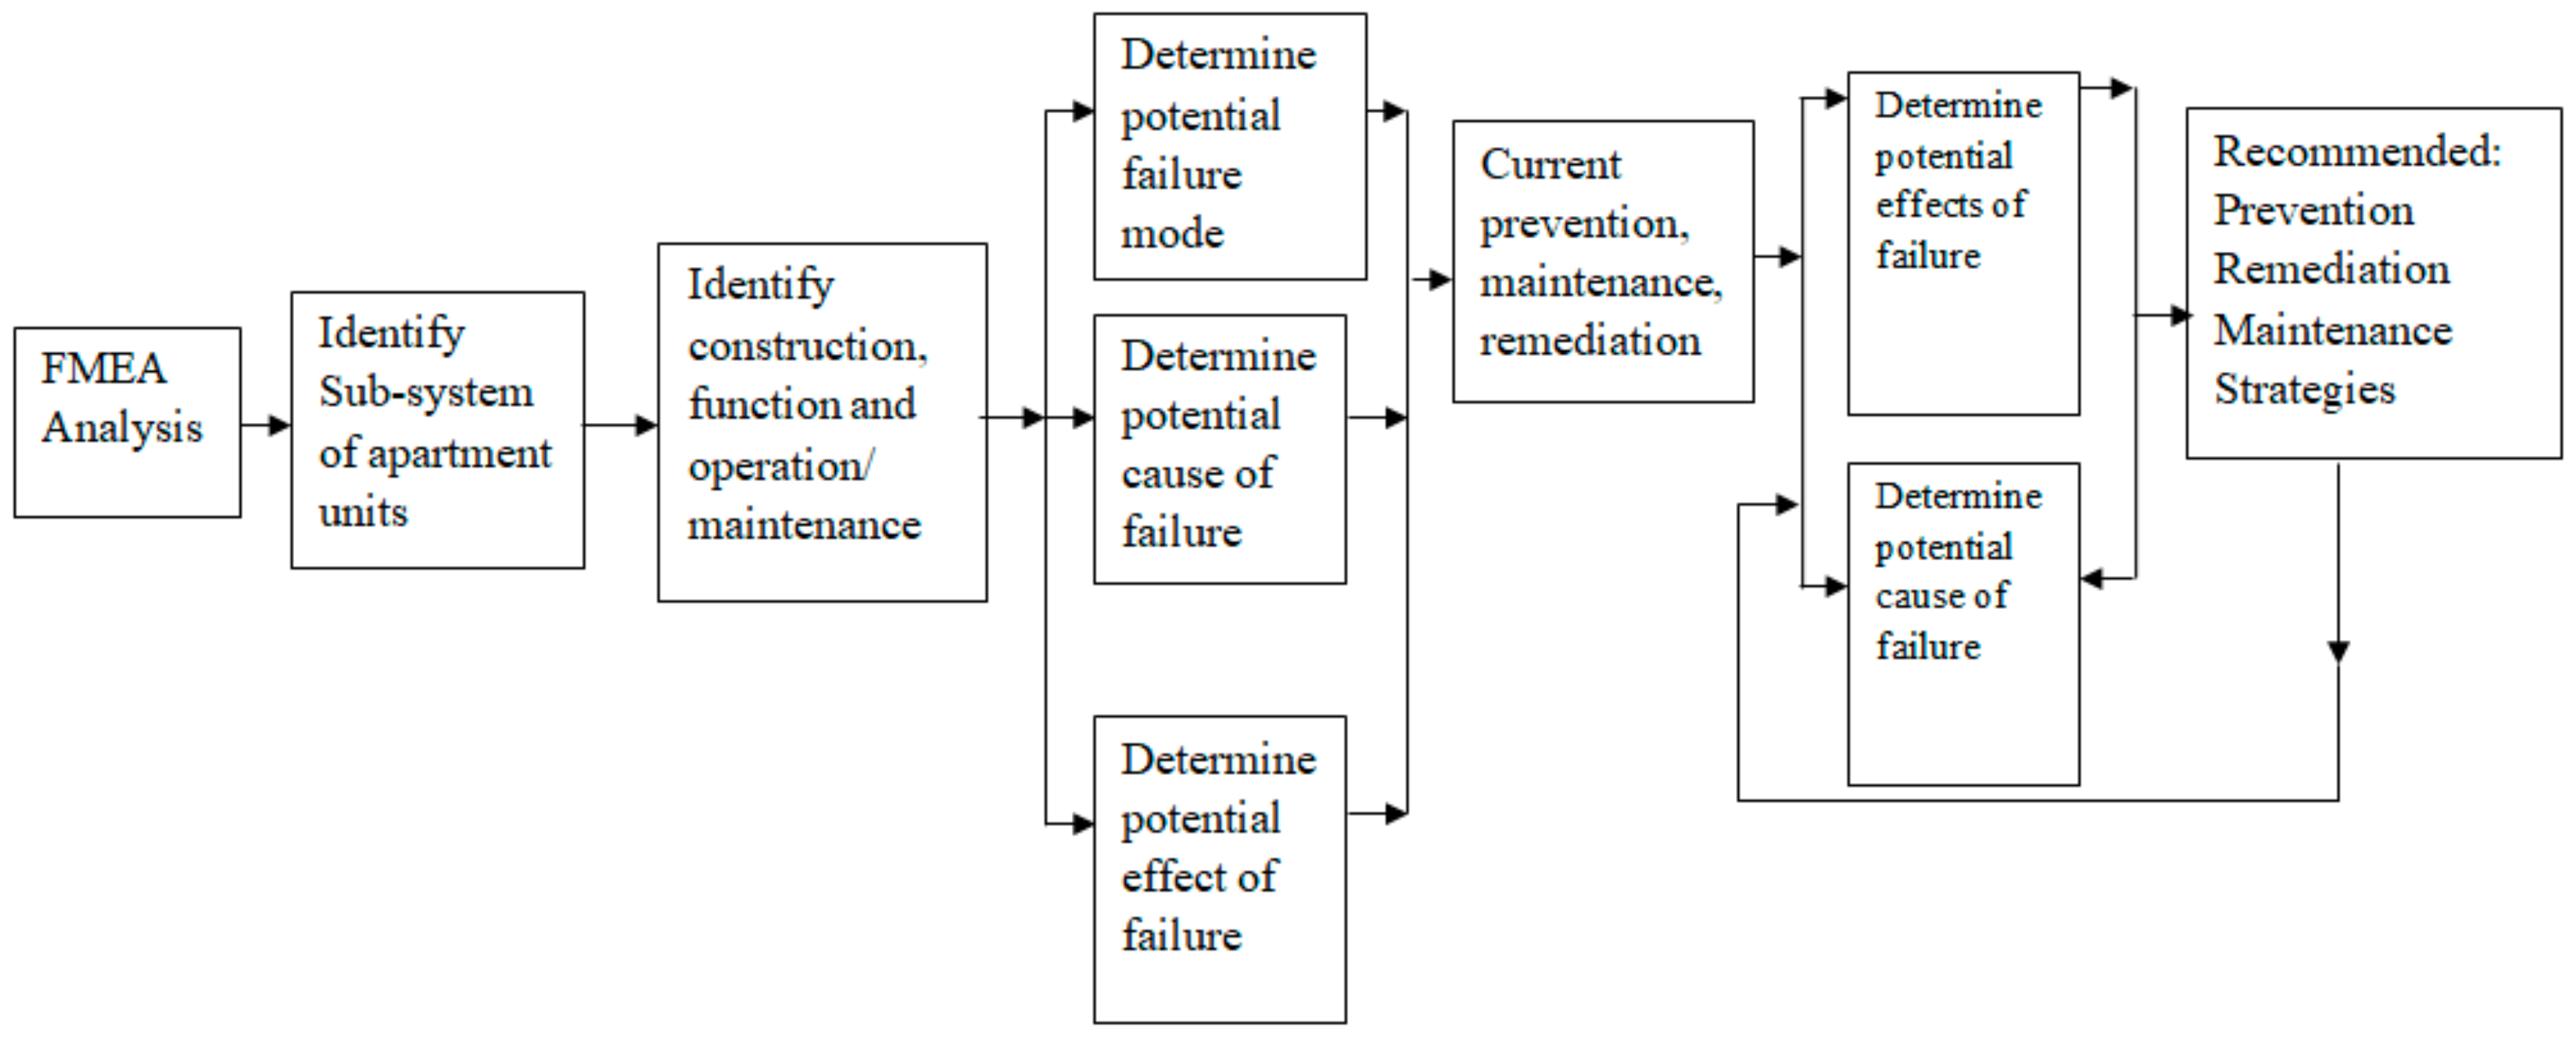
1.2. Failure Modes and Effects Analysis (FMEA)

[23] first introduced the failure modes and effects analysis to the building industry in the year 2002. In this paper, FMEA was utilized to analyze the dampness issues in building a structure in a subtropical climate. The FMEA approach was utilized to create a prevention, remediation, and preventive method for a High-Density Buildings (HDB) unit in Singapore due to a mold growth attack. Failure Mode and Effects Analysis is proposed to perceive and assess the potential failure of an item or process and discover its effects [24]. According to [25], “FMEA is a particular procedure to assess a system, design, process, or service for possible ways in which failures can occur”. It is a systematic and analytical quality design and planning tool for identifying failures of the product, service and process design, and development stages [26] (Figure 2). The early and steady utilization of FMEA in the planning process permits the designers to put into consideration failures and long durable structures. FMEA likewise records, historical data for use in future product advancement [27]. Mostly, the impact of the failure is not discovered until it happens. This is comparable to the situation of humidity issues in the building. However, with the FMEA analysis, the identification of a failure is conceivable by recognizing certain signals, after which diagnostics are used to discover the cause [25]. For this study, the related FMEA type used is System FMEA. It is on the grounds that the apartment building environment is a holistic system that has supportive and complicated sub-systems, which must maintain a proper and balanced operation. This necessity matches with a System FMEA goal, which is to define and demonstrate a proper balance between operational (maintenance) and economic factors [25]. A system FMEA is usually accomplished through a series of steps that include conceptual design, detail design, and development, and testing and evaluation [25]. The methodology of the System FMEA approach to postulate prevention, remediation, and maintenance techniques for mold development, according to [28] is stated below:
  • Outline the system to be analyzed.
  • Create a block outline of the system.
  • Distinguish all the likely item failure modes and characterize their impacts on the immediate function on the system and the reasons.
  • Evaluate each failure mode in terms of the worst potential consequence, which may result and assign a severity classification category.
  • Identify failure detection methods and remedies for each failure Mode.
  • Identify the corrective design or other actions required to eliminate the failure or control the risk.
  • Document the analysis and identify the problems that could not be corrected by design.

2. Methods and Study Setting

A literature search was carried out using online databases to search for articles with terminologies matching mold, dampness, indoor air quality, and ventilation. The search was restricted to households and studies conducted in the English language. The articles were then scanned and grouped into FMEA and CFD applications for the purpose of our research. Through the articles, we were able to identify the sources and causes of molds and dampness in buildings and also able to determine the factors that may contribute to or enhance mold growth in buildings. We then carried out a field survey of different apartment blocks, during which we investigated for visible mold or damp spots. Specifications of building materials, their functions, and building locations were considered. We carried out a survey using questionnaires distributed to the occupants of the apartments that were surveyed. A total of about 2000 valid questionnaire results was retrieved and analyzed using SPSS software. We then proceeded to identify the root causes of all mold growth cases using the Failure Mode and Effects Analysis (FMEA). This involved listing all the probable causes of mold growth within the interior of apartment buildings and then the proposed solutions using the FMEA approach. Within the System FMEA processes, we are able to identify the possible root causes of mold growth or dampness. Therefore, similar failures in the future can be avoided and the quality of the apartment building is enhanced as relating to dampness (Figure 3). In addition, the procedure FMEA is a living document that can be edited in the future to maintain quality [26].
In determining the material integrity of the building envelopes, we designed a model to show how CFD analysis can effectively influence the final outcome of the building during the design stage. Factors that influence building outcomes and their interactions can be well understood in the design analysis, which functions as a system (Figure 4). The model results determine what actions are necessary for realizing the expected outcome. Thus, the process starts out with a perceived outcome (desired outcome) and ends with an action plan for its realization (expected outcome). The continuous testing of the material integrity using CFD provides an opportunity to eliminate possible sources of high humidity within the interior of buildings. Design tools used for the analysis are:
• Revit architecture 2016, Autodesk CFD 2016, Design-Expert Software 10.
CFD methods are generally utilized as a design help tool. The outcomes from CFD simulations during the conceptual stage can help designers to enhance the indoor and outdoor air condition of the building at the schematic design stage. Generally, according to the National Project for Applications-oriented Research in CDF (NPARC) 2012, a CFD analysis is commonly made out of three stages: preprocessing, solving, and post-processing. Pre-processing comprised bringing in the building geometry from CAD, making a computational area, meshing, defining boundaries and initial conditions, and setting numerical controls. Once the computational conditions were set, the analysis began, utilizing CFD codes (Figure 5).
This simulation (Figure 6) is an example of an apartment building, which is interesting because of its orientation on the site and the prevailing wind direction. The positioning reflects some indication of what to expect in areas that would receive a direct flow of air and the spaces with single/double openings show spaces that would retain more humid air. The simulation was generated with boundary conditions, fixed environmental conditions, the nature of ventilation, and the materials used were specified. In the fluid simulation, the scenario for the parameters is taken during the coldest winter period. The western side, according to the building orientation is taken as the western wind direction, which carries the velocity-inlet boundary and temperature conditions. The eastern side is assumed as the pressure-outlet boundary condition. The exterior walls, concrete floor, and roof of the apartments were assumed as the wall boundaries. The interior walls, doors and the windows of the apartment were assumed as the interior boundary conditions. The analysis was done comparatively for two different wall materials, the brick, and the adobe. All the parameters of the boundaries were taken from the documented weather condition of North Cyprus, according to the meteorological department, LLC, © 2016, based on data obtained on 19 December 2016.

2.1. Material Properties Assigned for the CFD Analysis

The material properties assigned for the analysis on the model apartments are presented in Table 1. Two test scenarios were carried out (the Brick wall and the Adobe brick)
The simulated cases are the two flats on the ground floor as seen in Figure 7, with a total floor area of 300 m2. Two variations of the model were tested. In the simulated model, the inlet boundary coordinates from the west of the site, which carries a total of 10 Km/h velocity humid air for the winter season. 10 °C temperature was injected for the two cases on the same inlet boundary. These all cater to the environmental conditions of the case study at the stated date of the seasons. The heat gain by the external walls, floors, and ceiling for the model was also taken into consideration, and all quantities used for them are stated in the boundary conditions. The effect of these boundary condition changes was studied and analyzed.

2.2. Boundary Conditions Used for Simulation

Standard climatic conditions existing in the Northern parts of Cyprus were assigned for the analysis. The floor and the ceiling were considered to be concrete.
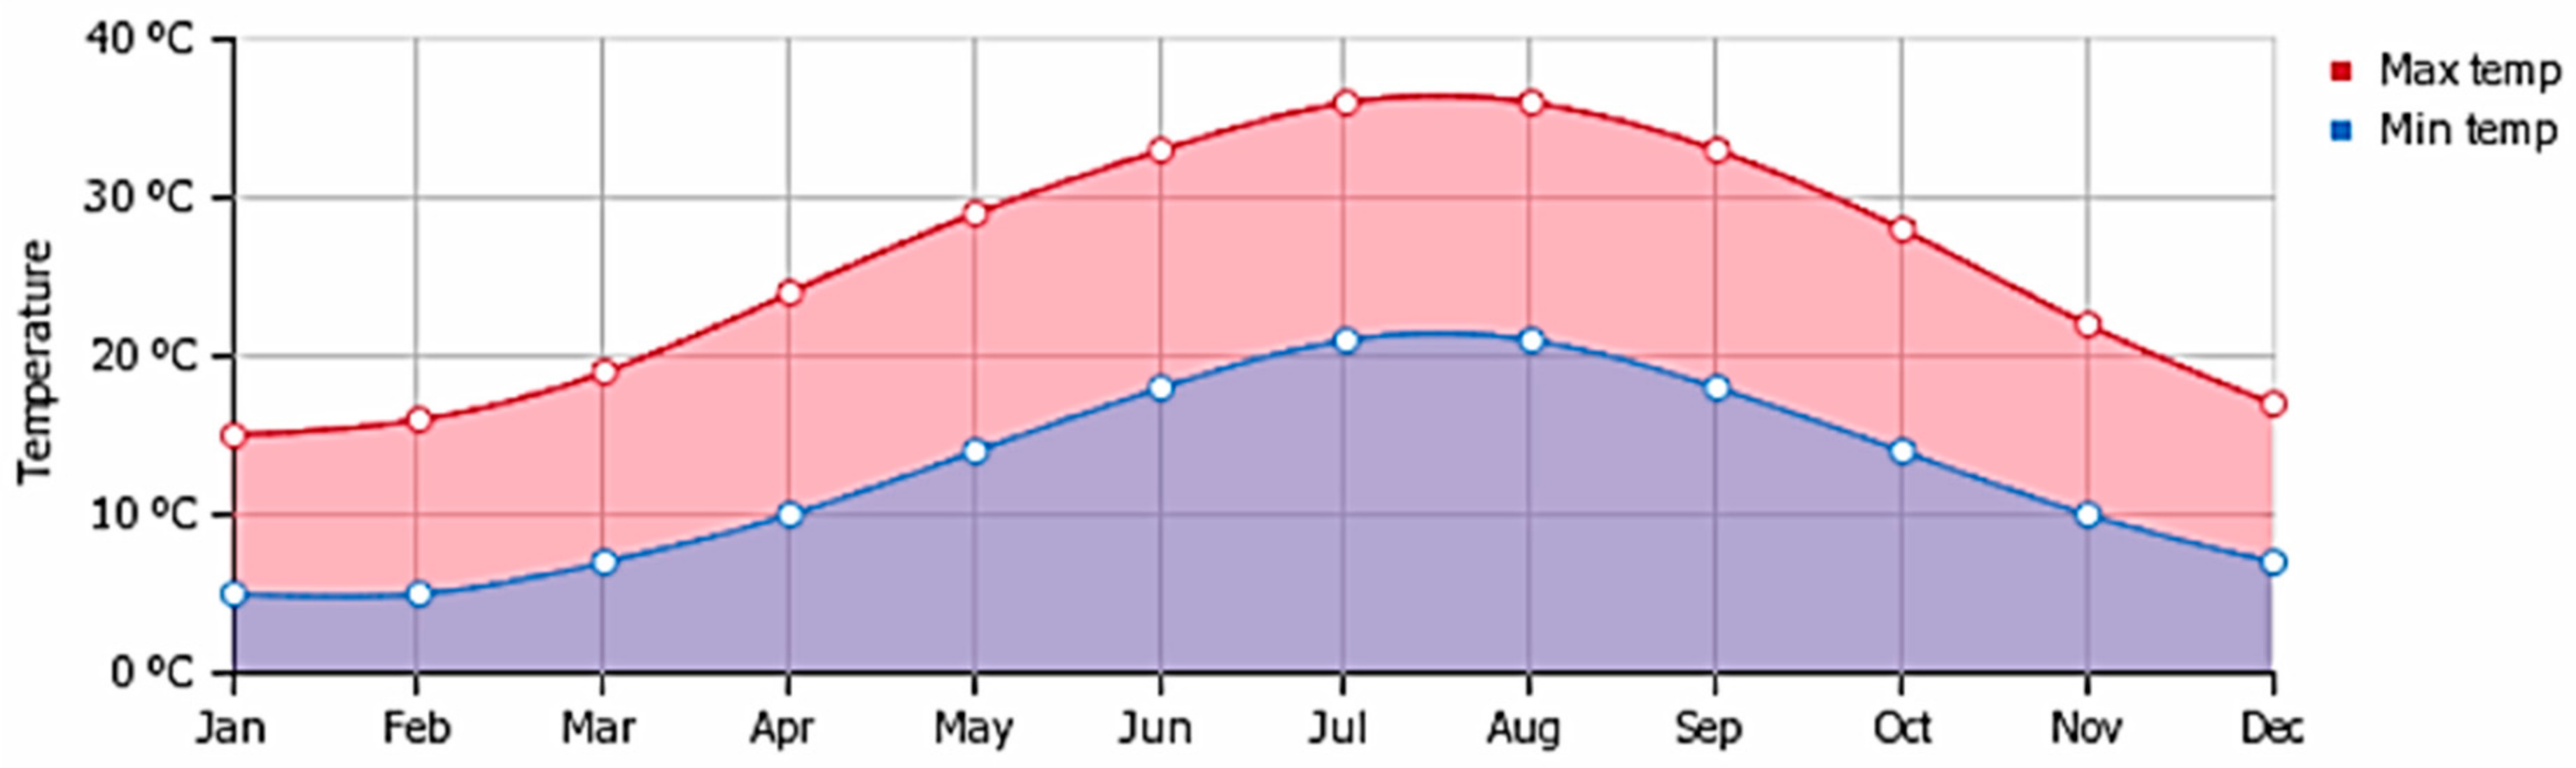
  • The inlet temperature of the incoming air is 10 °C and 27 °C, for winter and summer respectively.
  • Incoming air volume is humid air, and for winter and summer humidity of 60% and 40% respectively.
  • Velocity magnitude of the air flow is 10 Km/h for winter and 14 Km/h for the summer scene.
  • Ceiling temperature is 15 °C and 30 °C for winter and summer, respectively.
  • External wall temperatures are 10 °C and 27 °C for winter and summer, respectively.
  • The floor is assumed to be solid concrete.
  • Standard temperature and pressure are assumed as operating conditions.

2.3. Assumptions for the Analysis.

  • The airflow is turned on and is assumed to be at a steady state time and constant spatial variation.
  • There is no mechanical source to infuse and diffuse humidity within the room.
  • Density change due to compressibility is neglected and as per ideal gas, law density changes in temperature.
  • The thermophysical properties except for the density of the materials are assumed as constant.
  • Solar radiation is according to the scene environment.

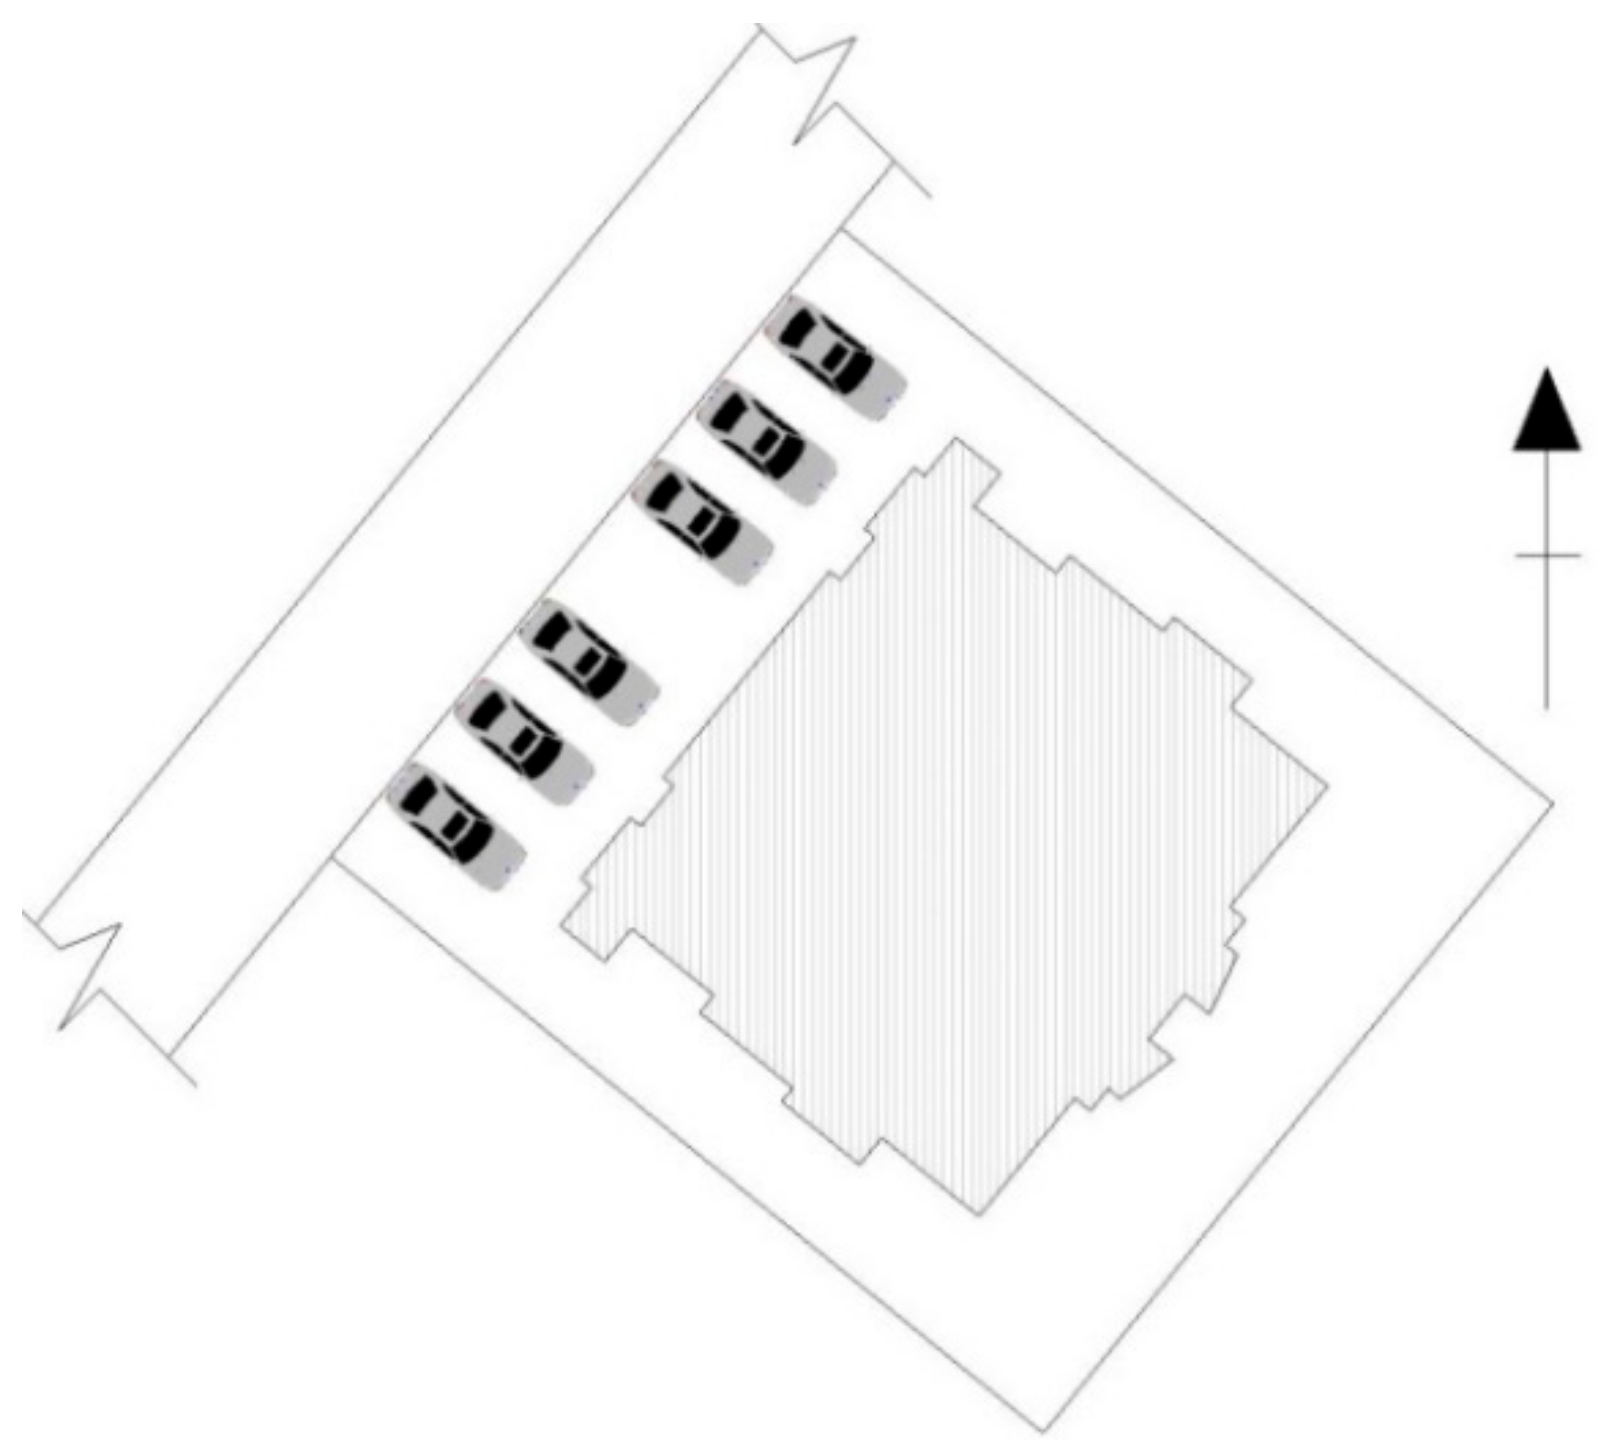
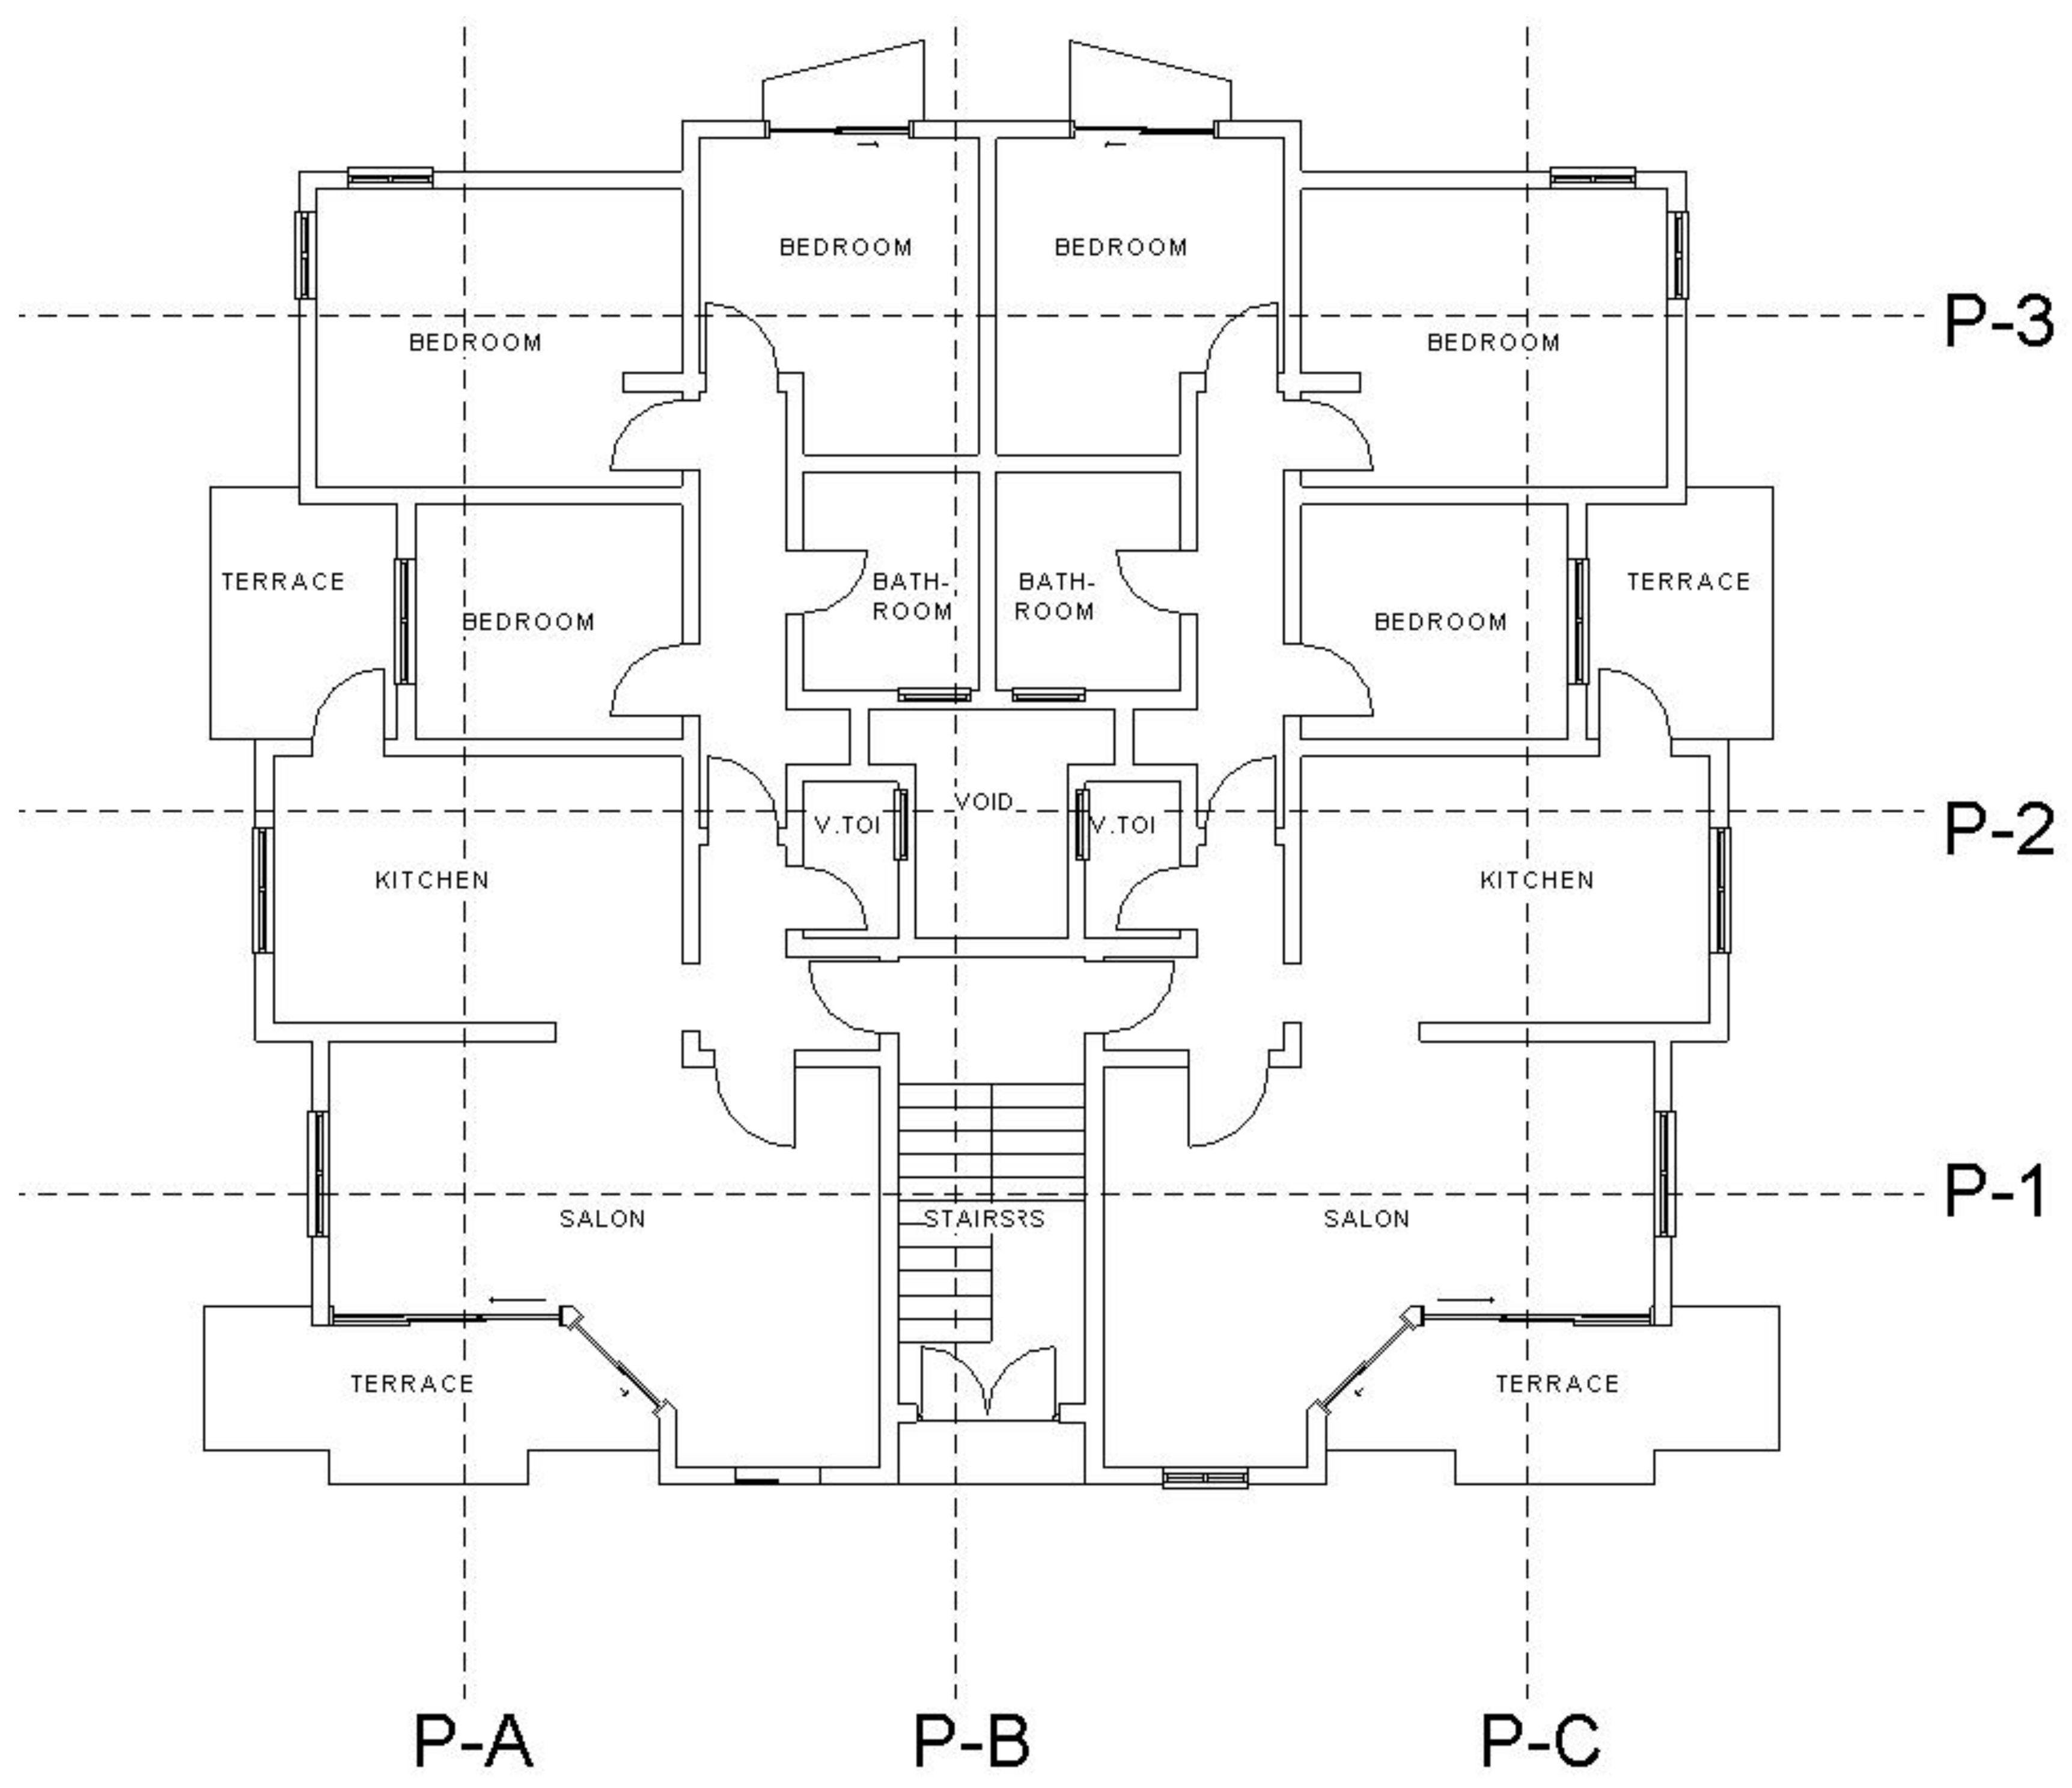
2.4. Selected Study Area

Cyprus is an island in the Eastern Mediterranean sea, which cuts across Asia, Europe, and Africa [29]. Cyprus is located in the Northeastern part of the Mediterranean Sea, 33° east of Greenwich and 35° north of the Equator. It has a total landmass of 9.251 square kilometers, of which 1.733 are forested [30]. For the purpose of this study, the data used were gathered from the Northern Part of Cyprus. The climate of the island is of an extreme Mediterranean type, with hot, dry summers from mid-May to mid-September and slightly cold winters from mid-November to mid-March. These periods are separated by short autumn and spring seasons.
The bulk of the precipitation is concentrated between December and January. In summer, most of the island is affected by a shallow trough of low pressure spanning from the great continental depression centered over Southwest Asia [31]. The atmosphere of the coastal parts is less intense than the core inland because the sea ion atmospheric humidity is constantly present there. The temperature of the sea can rise to 28 °C in August but does not fall below 16 °C between January and February [32]. The average rainfall of 402 mm, however (which is below Mediterranean average), conforms more to the climate pattern of the eastern Mediterranean. The coastal plains get a little rainfall, on average, from 34 to 50 mm (Figure 8), falling predominately in the winter.
Spring and autumn are short, typified by changeable weather, with occasional heavy storms battering the coast in spring and a westerly wind, called “meltem” carrying the influence of Atlantic depressions to this far eastern end of the Mediterranean [34]. From mid-May to mid-September the sun shines on a daily average of around 11 h. Temperatures can reach 40 °C (Figure 9). On the Mesaoria Plain, although lower on the coasts, with a northwesterly breeze called “Poyraz” prevailing. The skies are cloudless with low humidity between 40% to 60% humidity ratios (Figure 10). Thus, the high temperatures are easier to bear. The hot, dry, dust-laden “sirocco” wind blowing from Africa also finds its way to the island. Short-lived windy conditions resulting from relatively small depressions prevail throughout the winter, with 60 percent of rainfall between December and February. The Northern Range receives around 50 mm of rain per year, whereas the Mesaoria Plain receives only around 30–40 mm.
Eastwards, precipitation and humidity are reduced by the partial rain-shadow effect of the Southern Range. A similar effect is also caused by the Northern Range, which cuts off the humidity associated with proximity to the sea from much of the northern Mesaoria Plain. Eastwards of the Northern Range, towards the bays of the Karpaz Peninsula, where the land narrows and the effects of sea influence increase accordingly, humidity increases progressively towards the end of the peninsula. Most of the rivers are simply winter torrents, only flowing after heavy rain. The rivers running out of the Northern and Southern Ranges rarely flow all year round [35,36].
During the wet winter months, Cyprus is a green island. However, by the time June arrives the landscape at the lower levels assumes a brown, parched aspect, which characterizes its summer face [37]. The forests and the vineyards in the mountains, plus the strips of irrigated vegetation in the valleys remain green.

3. Design of Experiments

The space area for the calculated analysis is 2516 m2, and the model area is 300 m2. The auto size mesh tool was used to break the simulation spaces using the settings in Table 2, and which divided it into nodes and elements (Figure 11).
The finite element summary follows a total of 696,106 nodes: 627,484 fluid nodes and 68,622 solid nodes, and a total 2,803,037 elements, 2,114,847 fluids, and 688,190 solid elements were calculated. The simulated space was also gridded automatically by the authorizing tool, and each grid division is 2 m by 2 m. The magnitude of air flow and the calculated temperature through the apartments can be seen in Figure 12. The flow of air can be seen moving directly into the window openings facing the prevailing wind, while the windows of the other flat have a slurry air gain. The spaces with cross ventilation have an exchange of air with high flow rate. Diffusion and return of air can be seen for the two scenarios by the arrows, where the sizes, direction, and color of the arrows, called the velocity vector, show the movement of air and how it returns. The nature of the airflow has an effect on the room temperature (Figure 12).

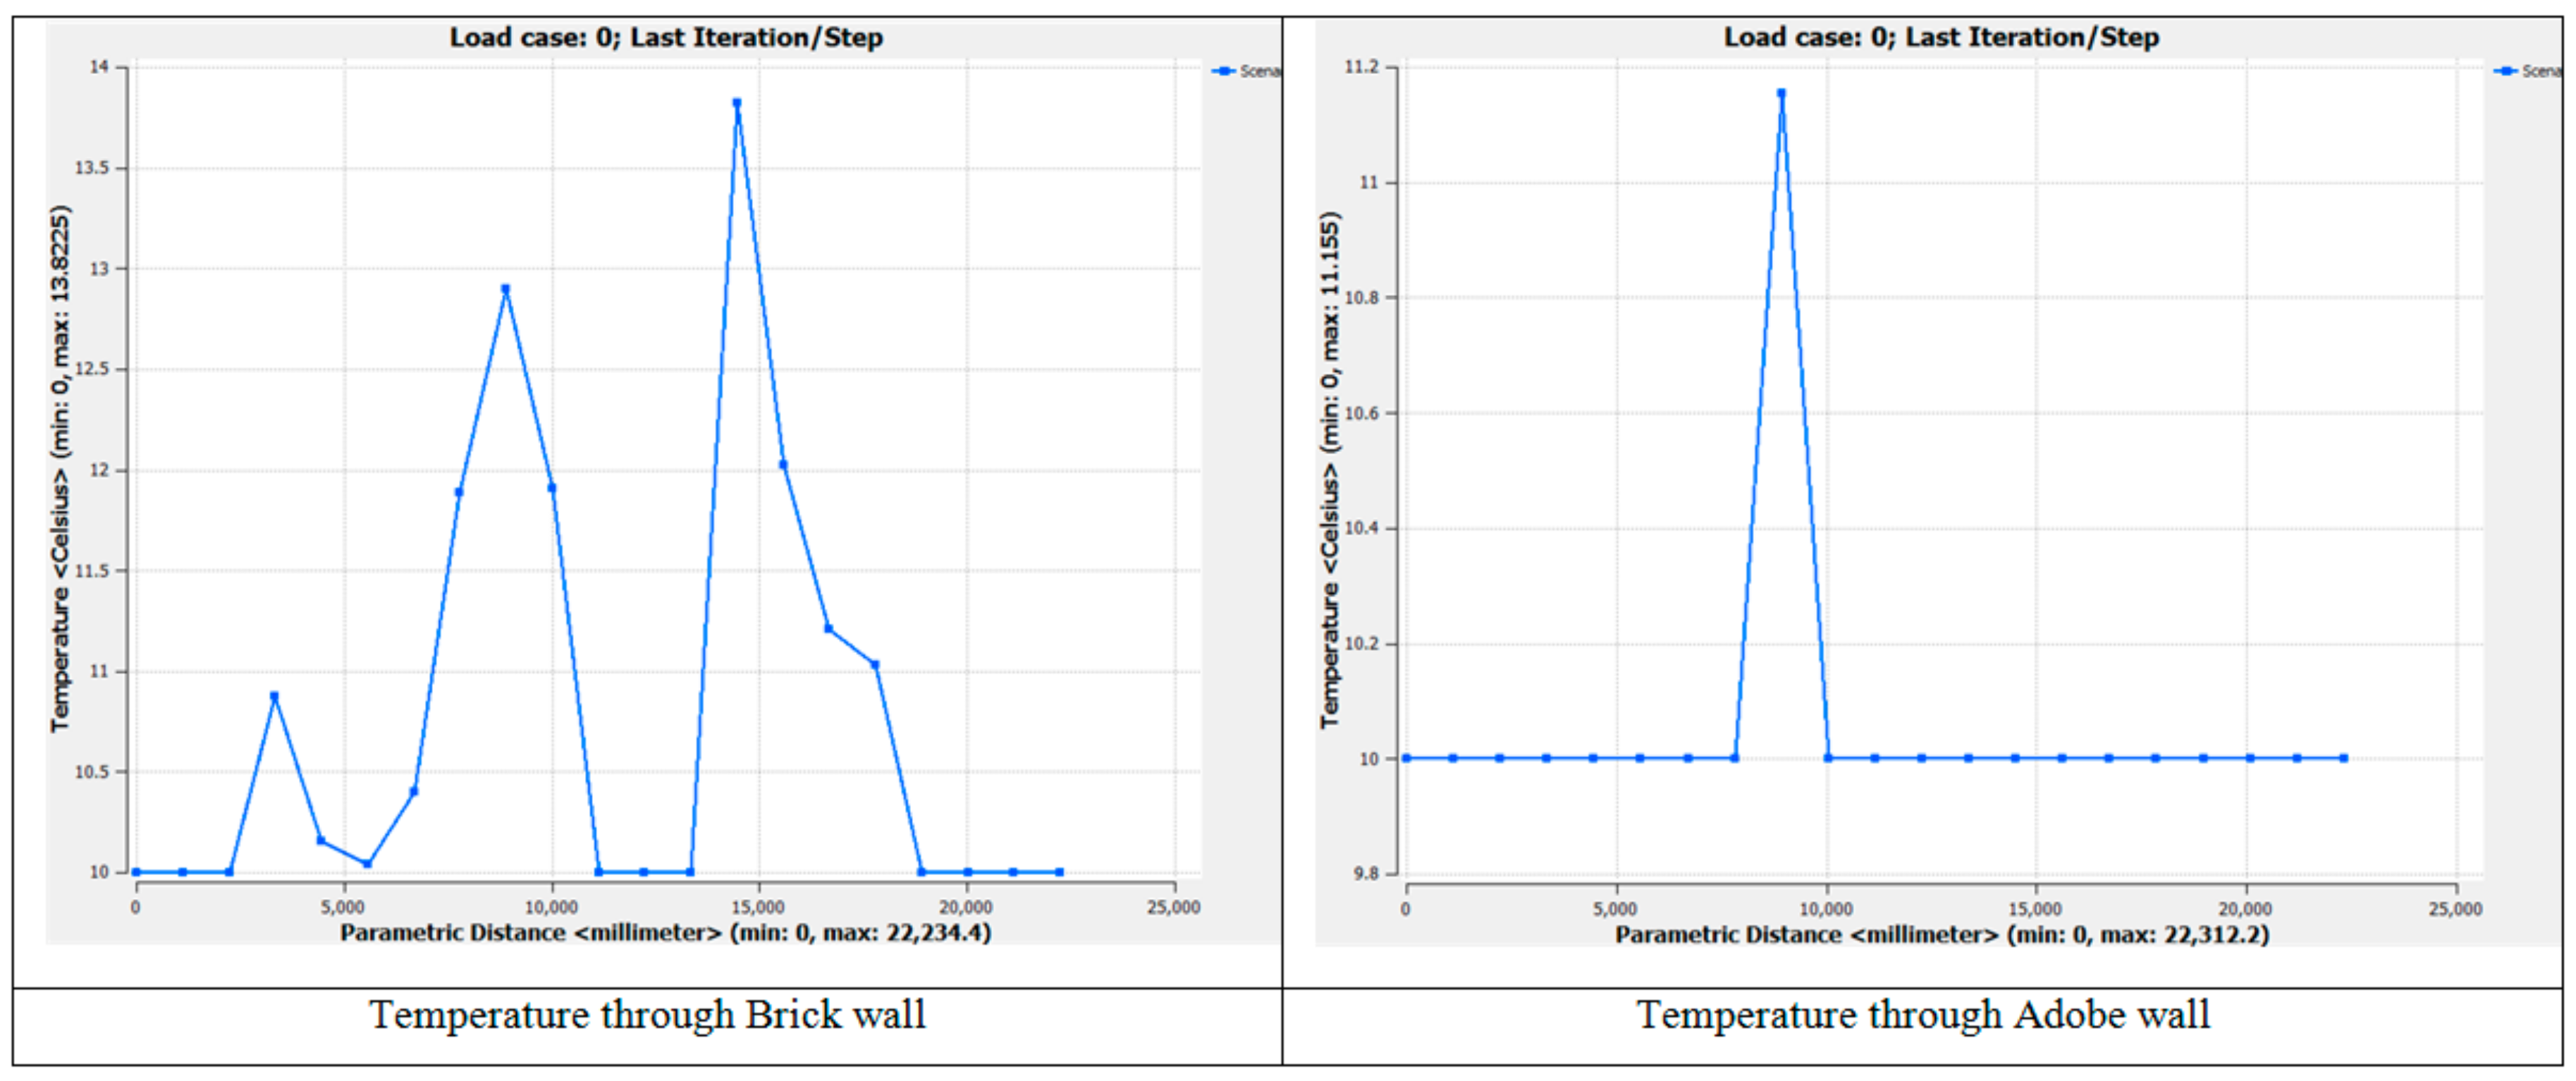
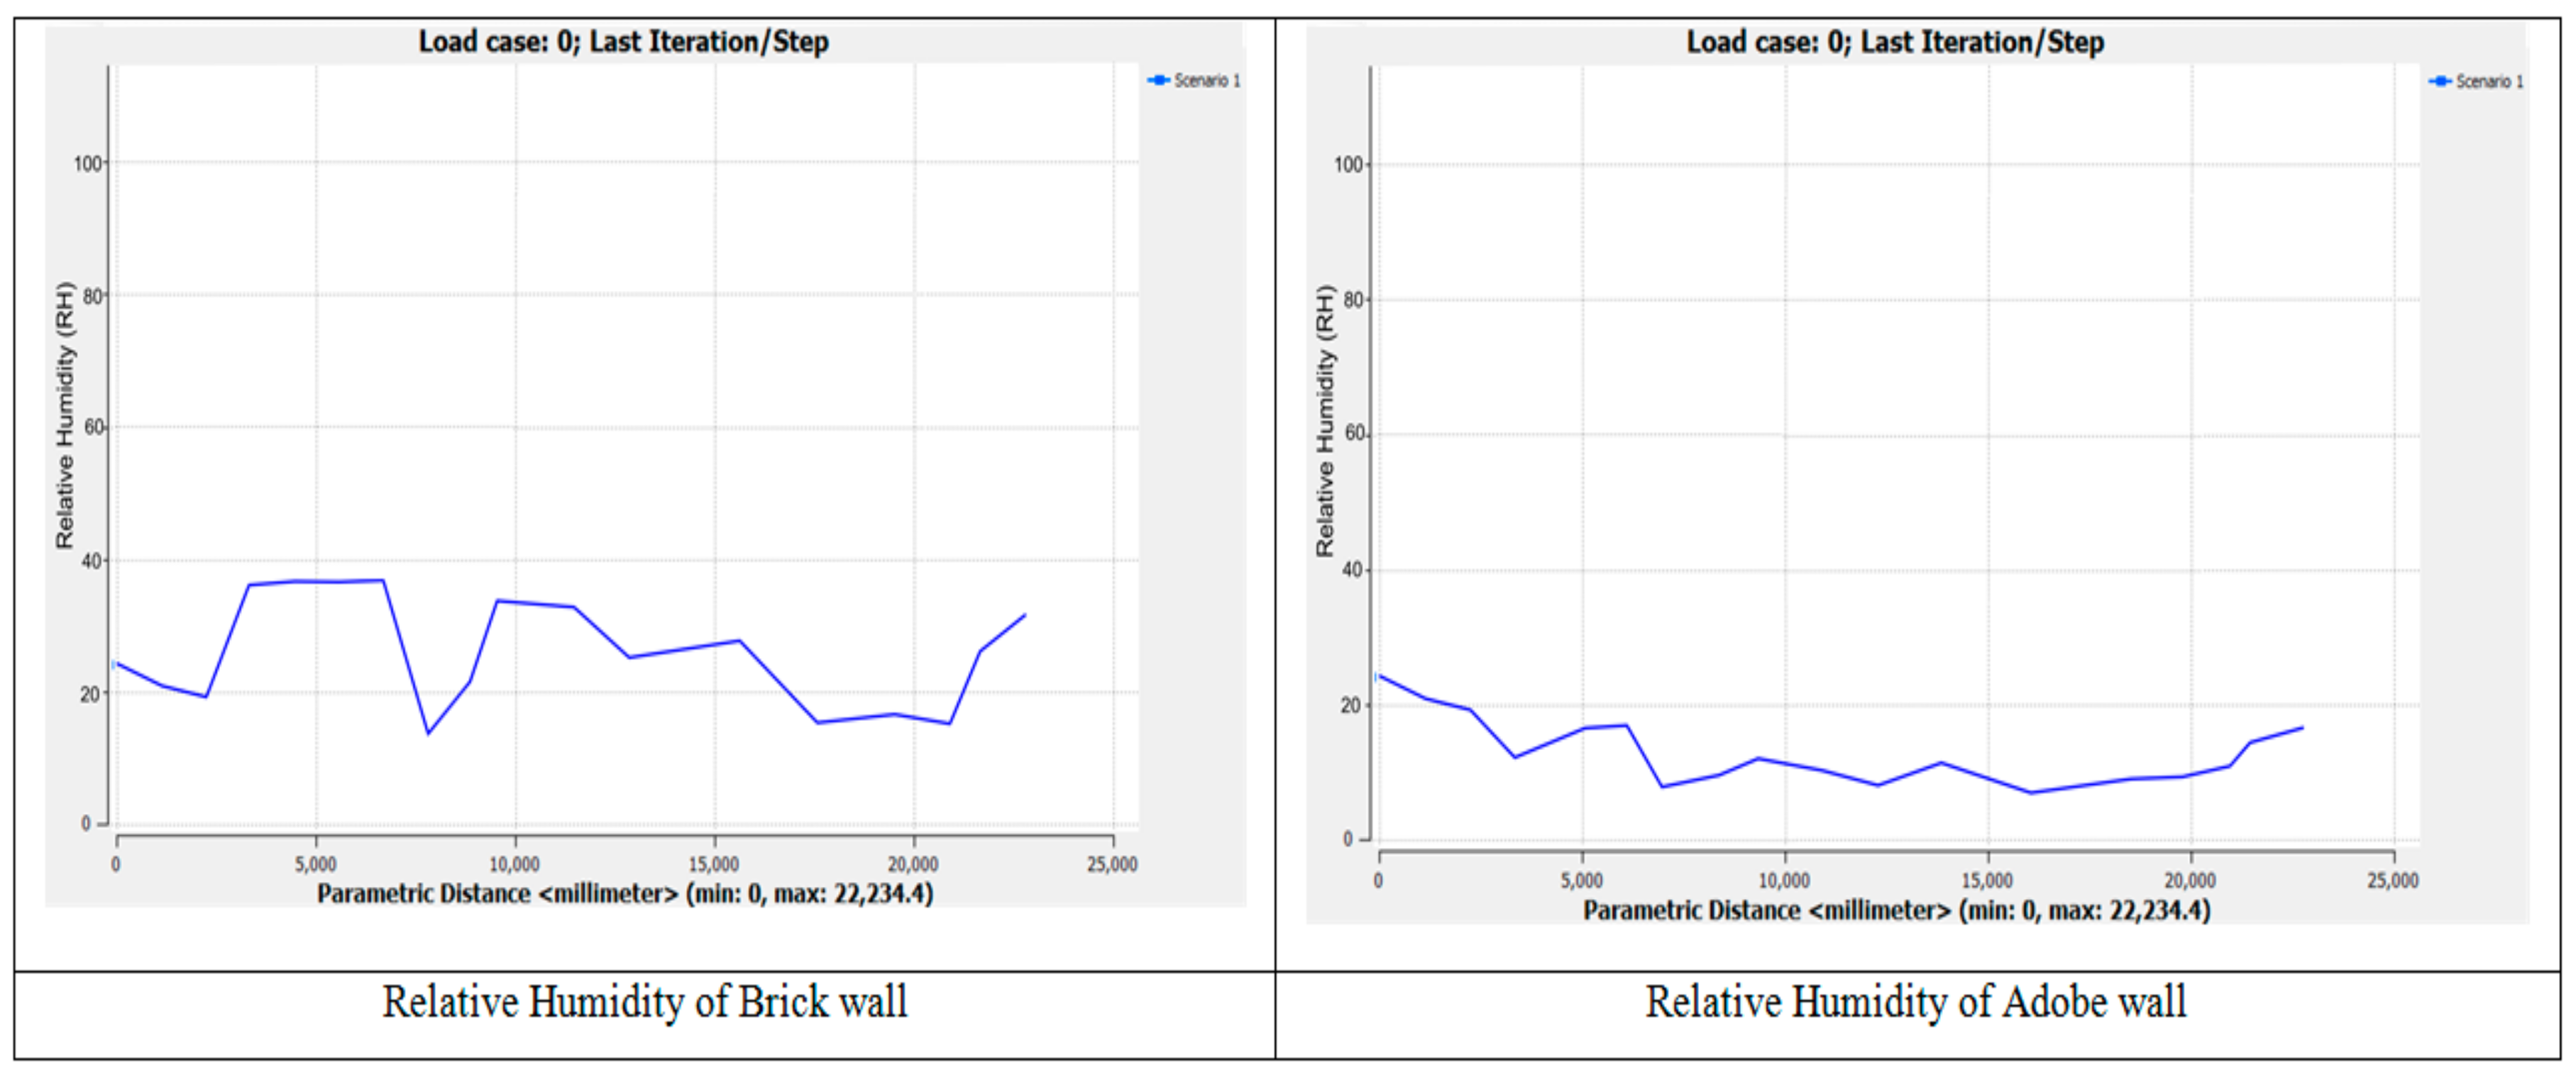
3.1. Relative Humidity Contours Across the Building

The variation in the contour of Relative Humidity for the same boundary conditions between the Brick wall scenario and the Adobe wall across Plane P-1, P-2, P-3, P-A, P-B, and P-C can be seen in Figure 13 and Figure 14. With the airflow amount and heat gain by the external wall and roof, heat enters the closed interior spaces by conduction. The value of relative humidity of the indoor and the outdoor condition differs and varies at different positions due to the planes cutting across the building. As a result of the airflow through different openings and spaces, relative humidity variations are considered at the roof and wall corners. By comparison, of the relative humidity contour for the two wall materials, the drop in value for the Adobe wall is more than that of the brick wall.
In order to establish which of the materials for floors, materials for walls, and layers of window glass are more significant to cause damp stain and mold growth, a response surface methodology (RSM), which is an efficient statistical method, was adopted in this study. A central composite face-centered (CCFC) design, which is one of the designs describing the response surface, was used with the appropriate factors. The CCFC design analysis of the experiments was performed to study the effects of the material coverings for floors, materials for walls, and layers of window glass and their possible interactions on the responses. The design matrix of the analysis was comprised of two levels of maximum and minimum coded as +1 and −1, respectively. The responses were the prevalent six indicators for home dampness-related indicators. They were estimated and presented in acronyms as visible mold spots (VMS); visible damp stains (VDS); windowpane condensation moisture (WCM); water damages and flood (WDF); damp clothing and/or bedding (DCB) and moldy odor (MOR) in their residences, respectively, and checked against the lifestyle, building characteristics and residential types in the study area. The visible mold spots (VMS), visible damp stains (VDS), and condensations on the window pane (WCM) are the responses considered in the analysis of experiments, because of their high prevalence effects on the buildings.

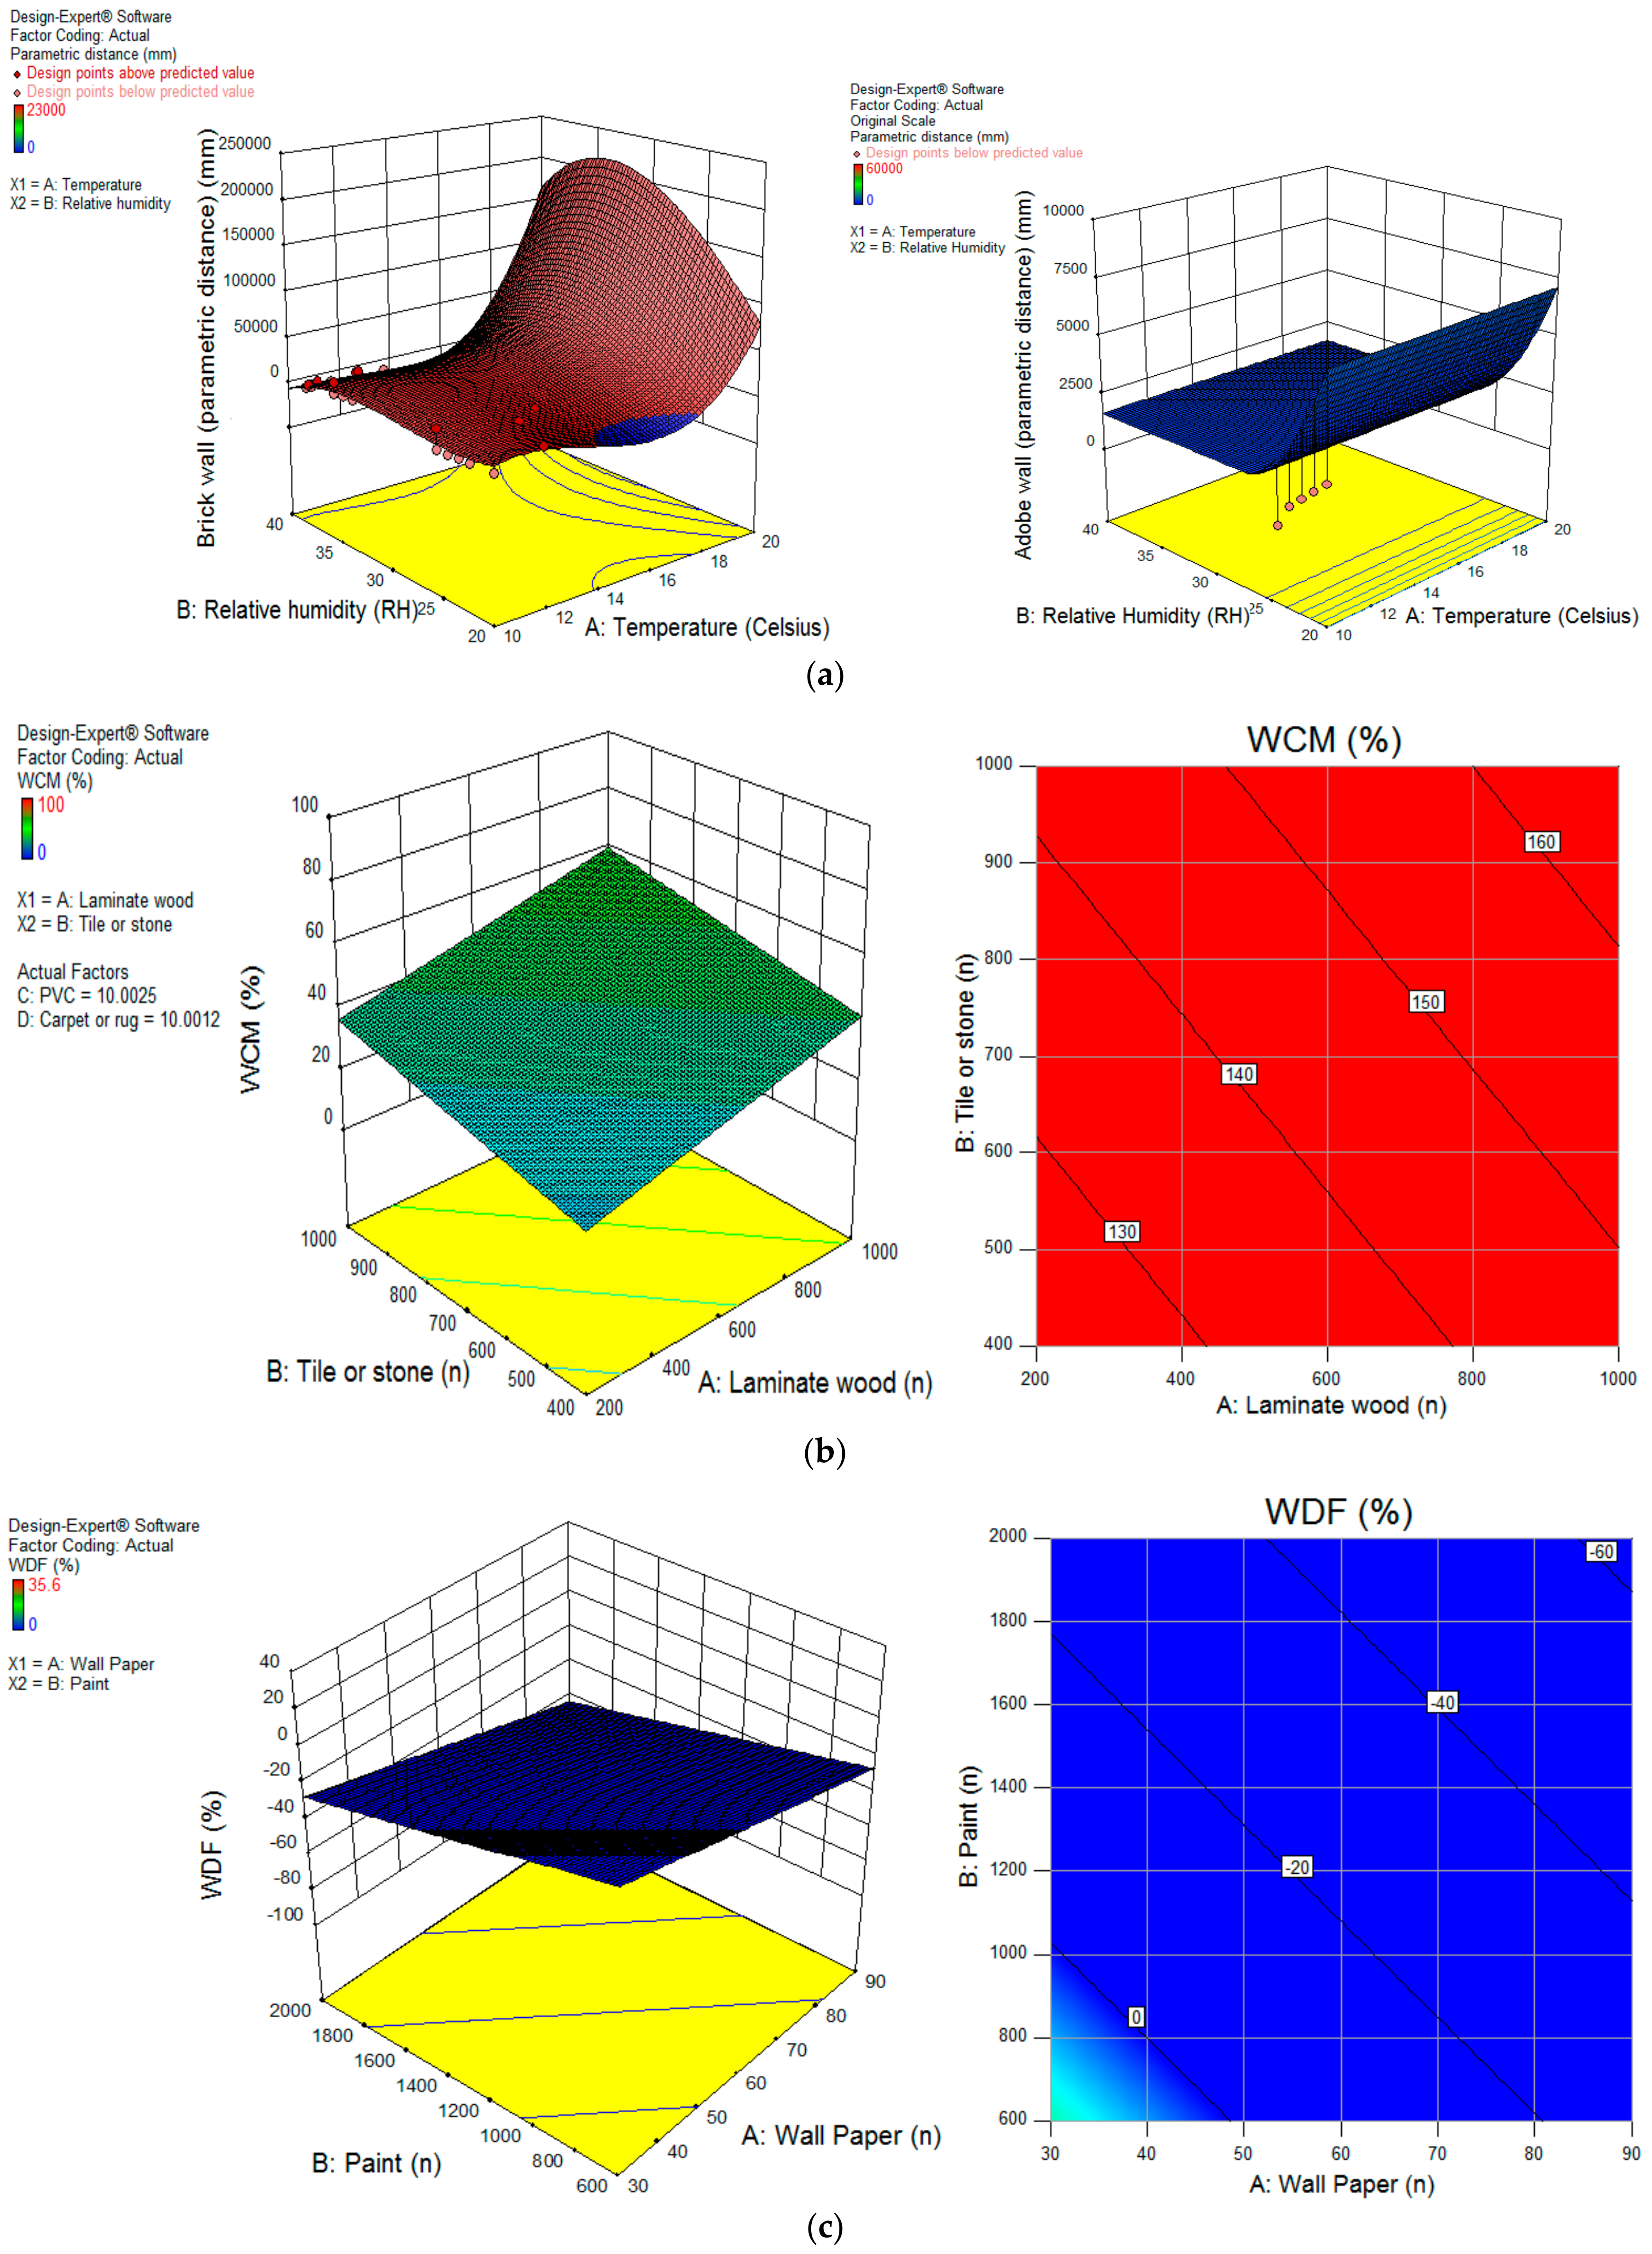
3.2. Statistical Data Analysis

The survey yielded 2000 valid questionnaires from individuals with ages ranging from 15 to over 41 years of age with the dominant age group being those between 25–40 years. 92.5% of the surveyed residences were located in the urban area and were multi-story apartment dwellings. The survey also discovered that 94.5% of the sampled homes have concrete roofing while the others have roofing materials. 79.0% of the sampled respondents do not have an exhaust fan in the bathroom while 21.0% of the bathrooms have an air exhaust to the inside of the residence (such as corridor and staircase). 66.5% have air conditioners in their bedrooms, and other parts of the building, while 33.5% do not have air conditioners. In furtherance of the lifestyle evaluation of the sampled residents, 78.5% of the residents sampled do not use an air humidifier while 22.5% of the residents do. The residential type of the sampled respondents ranges from detached houses for single family (2.0%), to semi-detached, apartment (46.5%), and multi-storey apartment dwellings (50.5%). Furthermore, the sampled residents were observed to have between 1–2 (27.5%) adults living in an apartment while 72.5% of the residents sampled have more than two adults in their household. 79.5% of the sampled respondents said they had noticed visible mold stains on the walls of their building while 20.5% said they have never seen visible mold stain on the walls. 5.5% of respondents said there had been flooding in the area in the last 12 months. Visible mold spots (VMS) and visible damp stains (VDS) were found in the 82.5% and 81.5% of the sampled residences, respectively. A total of 98.5% of residents reported condensation on the window pane (WCM), and 18.0% of the apartments had water damages (WD) in past years (IPY) and during the last year (DLY); 42.0% and 11.9% of occupants (often or sometimes) have found damp clothing and/or bedding (DCB) and moldy odor (MOR) in their residences, respectively.
Urban residences reported a lower prevalence of WDF, WCM, DCB, and MOR but a higher prevalence of VDS and VMS than suburban and rural residences. Residences farther than 200 m of a river and/or lake showed a higher prevalence of dampness-related indicators than other residences, except for WDF, with significant WCM, MOR, VDS, and VDS. Among the different types of residential, multi-storey apartment dwellings reported the lowest prevalence of WCM, WDF, VDS and MOR, and the highest prevalence of DCB and VMS. As the number of occupants increases, the prevalence of WCM and VMS increased. Residences with one layer of window glass or with exhausted bathroom-air to the inside of the building had a higher prevalence of WDF and MOR than other types of apartments. Apartments with wood window frames or without an exhaust fan in the bathroom had a significantly higher prevalence of WCM and DCB, but a lower prevalence of the other four indicators than residences with the other kinds of the window layer.
The prevalence of dampness-related indicators among the families using air conditioning in the current residence did not differ significantly from those of families not using air conditioning, whereas using an air humidifier was associated with a lower prevalence of these indicators except for WDF, VMS, and VDS. About 85% of occupants would always open windows in their apartment in the summer, and 11% in winter. Prevalence among residences using various materials of floor or wall covering showed little significant difference. Occupants who always opened the bedroom window for a period during the winter reported the lowest prevalence of WCM. Residents who cleaned their bedroom with a vacuum cleaner or wet mop always had the lowest prevalence of MOR. Most of the dampness-related indicators do not have a significant difference in all seasons due to cleaning.
The “Design-Expert” software (Stat-Ease, Inc., Minneapolis, MN, USA) was utilized for the analyses. The program estimates the effects for all model variables using the variance (ANOVA). The response surface, central composite, using a linear model was carried out and assigned to explicitly maximize the accuracy, more realistic fit, lack of fit, and R-squared values for each of the models, thus minimizing pure error in the experiment.
The model was applied to a p-value less than 0.05, insignificant lack of fit, and reasonable agreement between adjusted R-squared, and predicted R-squared (within 0.2 differences of each other) values was finally selected as a representative model. Diagnostic tools were provided by the software to examine the assumptions underlying the data analysis and model fitting. Multiple response methods termed desirability were applied to determine the optimum condition that provides the most suitable material combination to achieve the most desirable responses. From the ANOVA analysis, it was the condensation on the window pane (WCM) that was the most significant amongst the six prevalence indicators. The Model F-value of 6.15 implies that the model is significant. In this analysis of the experiment, the materials for covering floors such as PVC and carpet or rug are significant model terms in most of the buildings sampled for the survey.
The effects of the materials for covering floors are invariably pronounced on the prevalence indicator of WCM. According to the ANOVA analysis, the values of prob > F less than 0.0500 indicate model terms are significant. And the results obtained, showed PVC and carpet or rug are more significant in comparison to the tile or stone and laminate wood. The optimization of the ANOVA report indicated that to minimize the effect of the WCM and another related prevalence indicator to ≥15% as indicated in Figure 14b,c. For instance, for every ≥15 sample of PVC and carpet or rug surveyed and used in the analysis in detecting WCM and other related prevalence indicators in the buildings and residences, the equivalent number of survey sample of tiles or stones, TS and laminate woods, LW required to produce the same effect will be 200 < TS/LW ≥ 400 at the desirability of 0.946. Therefore, PVC and carpet or rug requires a more robust design to minimize the effect of dampness and its corresponding molds growing on the building floors. The results of the analysis of the experiment verified the interpretation of the results in Table 3 and Table 4. In this analysis, with the desirability versus the materials covering for floors, it was detected that much attention is required, given the design and application of PVC and carpet, and rug in reducing the prevalence indicators: WCM, VDF, and VMS, etc. Based on the analysis of the sample surveyed for the material of the wall covering, it was determined by the ANOVA analysis that wallpaper and paint are more significant to cause the WDF prevalence indicator when compared to the other prevalent factors.

4. Conclusions

The survey yielded 2000 valid questionnaires from adults with ages ranging from 15 to over 41 years of age with the dominant age group being those between 25–40 years. 92.5% of the surveyed residences were located in the urban area and were multi-story apartment dwellings. The residential type of the sampled respondents ranges from the detached housing for single family (2.0%) to the semi-detached, apartment (46.5%) and multi-story apartment dwellings (50.5%). Furthermore, the sampled residents were observed to have between 1–2 (27.5%) adults living in an apartment while 72.5% of the residents sampled have more than 2 adults in their household. The visible mold spots (VMS) and visible damp stains (VDS) were found in 82.5% and 81.5% of the sampled residences, respectively. A total of 98.5% of residents reported condensation on the window pane (WCM), and 18.0% of the apartments had water damages (WD) in past years (IPY) and during the last year (DLY). 42.0% and 11.9% of occupants (often or sometimes) have found damp clothing and/or bedding (DCB) and a moldy odor (MOR) in their residences, respectively. Urban residences reported a lower prevalence of WDF, WCM, DCB, and MOR but a higher prevalence of VDS and VMS than suburban and rural residences. Residences farther than 200 m from a river and/or lake showed a higher prevalence of dampness-related indicators than other residences, except for WDF, with significant WCM, MOR, VDS, and VDS. Among the different types of residential, multi-story apartment dwellings reported the lowest prevalence of WCM, WDF, VDS and MOR, and the highest prevalence of DCB and VMS. The number of occupants increases the prevalence of WCM and VMS. Residences with one layer of window glass or with exhausted bathroom-air to the inside of the building had a higher prevalence of WDF and MOR than other types of apartments. Apartments with wood window frames or without an exhaust fan in the bathroom had a significantly higher prevalence of WCM and DCB, but a lower prevalence of the other four indicators than residences with other kinds of the window layer. The status of room characteristics and lifestyle behaviors were related to the occupant’s bedroom. About 85% of occupants would always open windows in their apartment in the summer, and 11% in winter, but close to half of the occupants never open their windows in winter. The prevalence among residences using various materials of floor or wall covering had no significant difference. The survey suggested a connection between damp interiors and health risks, such as upper respiratory (nasal and throat) symptoms, cough, wheeze, and asthma symptoms.

Supplementary Materials

Supplementary File 1

Author Contributions

Data Analysis and Simulations (Ugochukwu K. Elinwa, Ifeoluwa Oyeleke Ojelabi, Abiola Ayopo Abiodun), Writing and Review (Ugochukwu K. Elinwa, Camil Atakara, Ifeoluwa Ojelabi).

Funding

This research received no external funding.

Conflicts of Interest

The authors declare no conflicts of interest.

References

  1. Agyekum, K.; Ayarkwa, J.; Koranteng, C.; Adinyira, E. Preliminary assessment of dampness in walls of residential buildings in four climatic zones in Ghana. J. Sustain. Dev. 2013, 6, 51. [Google Scholar] [CrossRef]
  2. Burkinshaw, R.F. Which instruments should surveyors use to monitor moisture condition? Struct. Surv. 2004, 22, 7–19. [Google Scholar] [CrossRef]
  3. Halim, A.H.A.; Harun, S.N.; Hamid, M.Y. Diagnosis of dampness in conservation of historic building. J. Des. Built 2012, 5. [Google Scholar]
  4. Trotman, P.M.; Harrison, H. Understanding Dampness; BREbookshop: Berkshire, UK, 2004. [Google Scholar]
  5. Hollis, M. Surveying Building; RB-RICS Books: Coventry, UK, 2000. [Google Scholar]
  6. Agyekum, K.; Ayarkwa, J. A case study of dampness in a three bedroom residential building in Kumasi, Ghana. J. Build. Perform. 2014, 5, 50–61. [Google Scholar]
  7. Riley, M.; Cotgrave, A. Dampness in Buildings. Division of Sustainable Development. 2005. Available online: http://folders.nottingham.edu.cn (accessed on 3 April 2013).
  8. Mendell, M.J.; Kumagai, K. Observation-based metrics for residential dampness and mold with dose–response relationships to health: A review. Indoor Air 2017, 27, 506–517. [Google Scholar] [CrossRef] [PubMed]
  9. Ye, J.; Qian, H. Ventilation optimization to minimize the total cooling load under the constraint condition of mold index in indoor air. Procedia Eng. 2017, 205, 2105–2110. [Google Scholar] [CrossRef]
  10. Norbäck, D.; Zock, J.P.; Plana, E.; Heinrich, J.; Tischer, C.; Jacobsen Bertelsen, R.; Sunyer, J.; Künzli, N.; Villani, S.; Olivieri, M.; et al. Building dampness and mold in European homes in relation to climate, building characteristics and socio-economic status: The European Community Respiratory Health Survey ECRHS II. Indoor Air 2017, 27, 921–932. [Google Scholar] [CrossRef] [PubMed]
  11. Smedje, G.; Wang, J.; Norbäck, D.; Nilsson, H.; Engvall, K. SBS symptoms in relation to dampness and ventilation in inspected single-family houses in Sweden. Int. Arch. Occup. Environ. Health 2017, 90, 703–711. [Google Scholar] [CrossRef] [PubMed]
  12. Boulic, M.; Phipps, R.A.; Cunningham, M.; Cleland, D.J.; Fjällström, P.; Abe, K.; Howden-Chapman, P. Heater choice, dampness and mould growth in 26 New Zealand homes: A Study of Propensity for Mould Growth using encapsulated fungal spores. Buildings 2015, 5, 149–162. [Google Scholar] [CrossRef]
  13. Wolde, A.; Ten; Pilon, C.L. The Effect of Indoor Humidity on Water Vapor Release in Homes; ASHRAE: Atlanta, GA, USA, 2007. [Google Scholar]
  14. Elinwa, U.K.; Radmehr, M.; Ogbeba, J.E. Alternative Energy Solutions Using BIPV in Apartment Buildings of Developing Countries: A Case Study of North Cyprus. Sustainability 2017, 9, 1414. [Google Scholar] [CrossRef]
  15. Padilla-Marcos, M.Á.; Meiss, A.; Feijó-Muñoz, J. Proposal for a simplified CFD procedure for obtaining patterns of the age of air in outdoor spaces for the natural ventilation of buildings. Energies 2017, 10, 1252. [Google Scholar] [CrossRef]
  16. Versteeg, H.K.; Malalasekera, W. An introduction to CFD. The Finite Volume Method; Longman: Harlow, UK, 1995. [Google Scholar]
  17. Anderson, J.D; Wendt, J. Computational Fluid Dynamics; McGraw-Hill: New York, NY, USA, 1995; Volume 206. [Google Scholar]
  18. Blocken, B.; Defraeye, T.; Derome, D.; Carmeliet, J. High-resolution CFD simulations for forced convective heat transfer coefficients at the facade of a low-rise building. Build. Environ. 2009, 44, 2396–2412. [Google Scholar] [CrossRef]
  19. Balocco, C.; Lio, P. Assessing ventilation system performance in isolation rooms. Energy Build. 2011, 43, 246–252. [Google Scholar] [CrossRef]
  20. Bangalee, M.Z.I.; Lin, S.Y.; Miau, J.J. Wind driven natural ventilation through multiple windows of a building: A computational approach. Energy Build. 2012, 45, 317–325. [Google Scholar] [CrossRef]
  21. Chiang, W.H.; Wang, C.Y.; Huang, J.S. Evaluation of cooling ceiling and mechanical ventilation systems on thermal comfort using CFD study in an office for subtropical region. Build. Environ. 2012, 48, 113–127. [Google Scholar] [CrossRef]
  22. Van Hooff, T.; Blocken, B. Full-scale measurements of indoor environmental conditions and natural ventilation in a large semi-enclosed stadium: Possibilities and limitations for CFD validation. J. Wind Eng. Ind. Aerodyn. 2012, 104, 330–341. [Google Scholar] [CrossRef]
  23. Nielsen, A. Use of FMEA-failure modes effects analysis on moisture problems in buildings. In Proceedings of the 6th Symposium on Building Physics in the Nordic Countries, Trondheim, Norway, 17–19 June 2002; Norwegian Building Research Institute: Oslo, Norway, 2002. [Google Scholar]
  24. Moubray, J. Reliability-centered Maintenance, 2nd ed.; Butterworth-Heinemann: Oxford, UK, 1999. [Google Scholar]
  25. Stamatis, D.H. Failure Mode and Effect Analysis: FMEA from Theory to Execution; ASQ Quality Press: Milwaukee, MI, USA, 2003. [Google Scholar]
  26. Aldridge, J.R.; Dale, B.G. Failure Mode and Effects Analysis. In Managing Quality; Blackwell: London, UK, 2003; p. 387. [Google Scholar]
  27. Crow, R. ARL Bimonthly Report 223; ARL: Washington, DC, USA, 2002. [Google Scholar]
  28. Modarres, M.; Cheon, S.W. Function-centered modeling of engineering systems using the goal tree—Success tree technique and functional primitives. Reliab. Eng. Syst. Saf. 1999, 64, 181–200. [Google Scholar] [CrossRef]
  29. Wallis, H. Vignettes in the Cartographic History of Cyprus: The Agnes Michaelides Memorial Lecture; Bank of Cyprus Cultural Foundation: Nicosia, Cyprus, 1992. [Google Scholar]
  30. Hatay, M. Is the Turkish Cypriot Population Shrinking; PRIO Cyprus Centre: Nicosia, Cyprus, 2007; Volume 2. [Google Scholar]
  31. Papadavid, G.; Neocleous, D.; Styianou, A.; Markou, M.; Kountios, G.; Hadjimitsis, D. Remote sensing applications for estimating changes on crop evapotranspiration of the most water intensive crops, due to climate change in Cyprus. In Proceedings of the Fourth International Conference on Remote Sensing and Geoinformation of the Environment (RSCy2016), Paphos, Cyprus, 4–8 April 2016; p. 96881S. [Google Scholar]
  32. Price, C.; Michaelides, S.; Pashiardis, S.; Alpert, P. Long term changes in diurnal temperature range in Cyprus. Atmos. Res. 1999, 51, 85–98. [Google Scholar] [CrossRef]
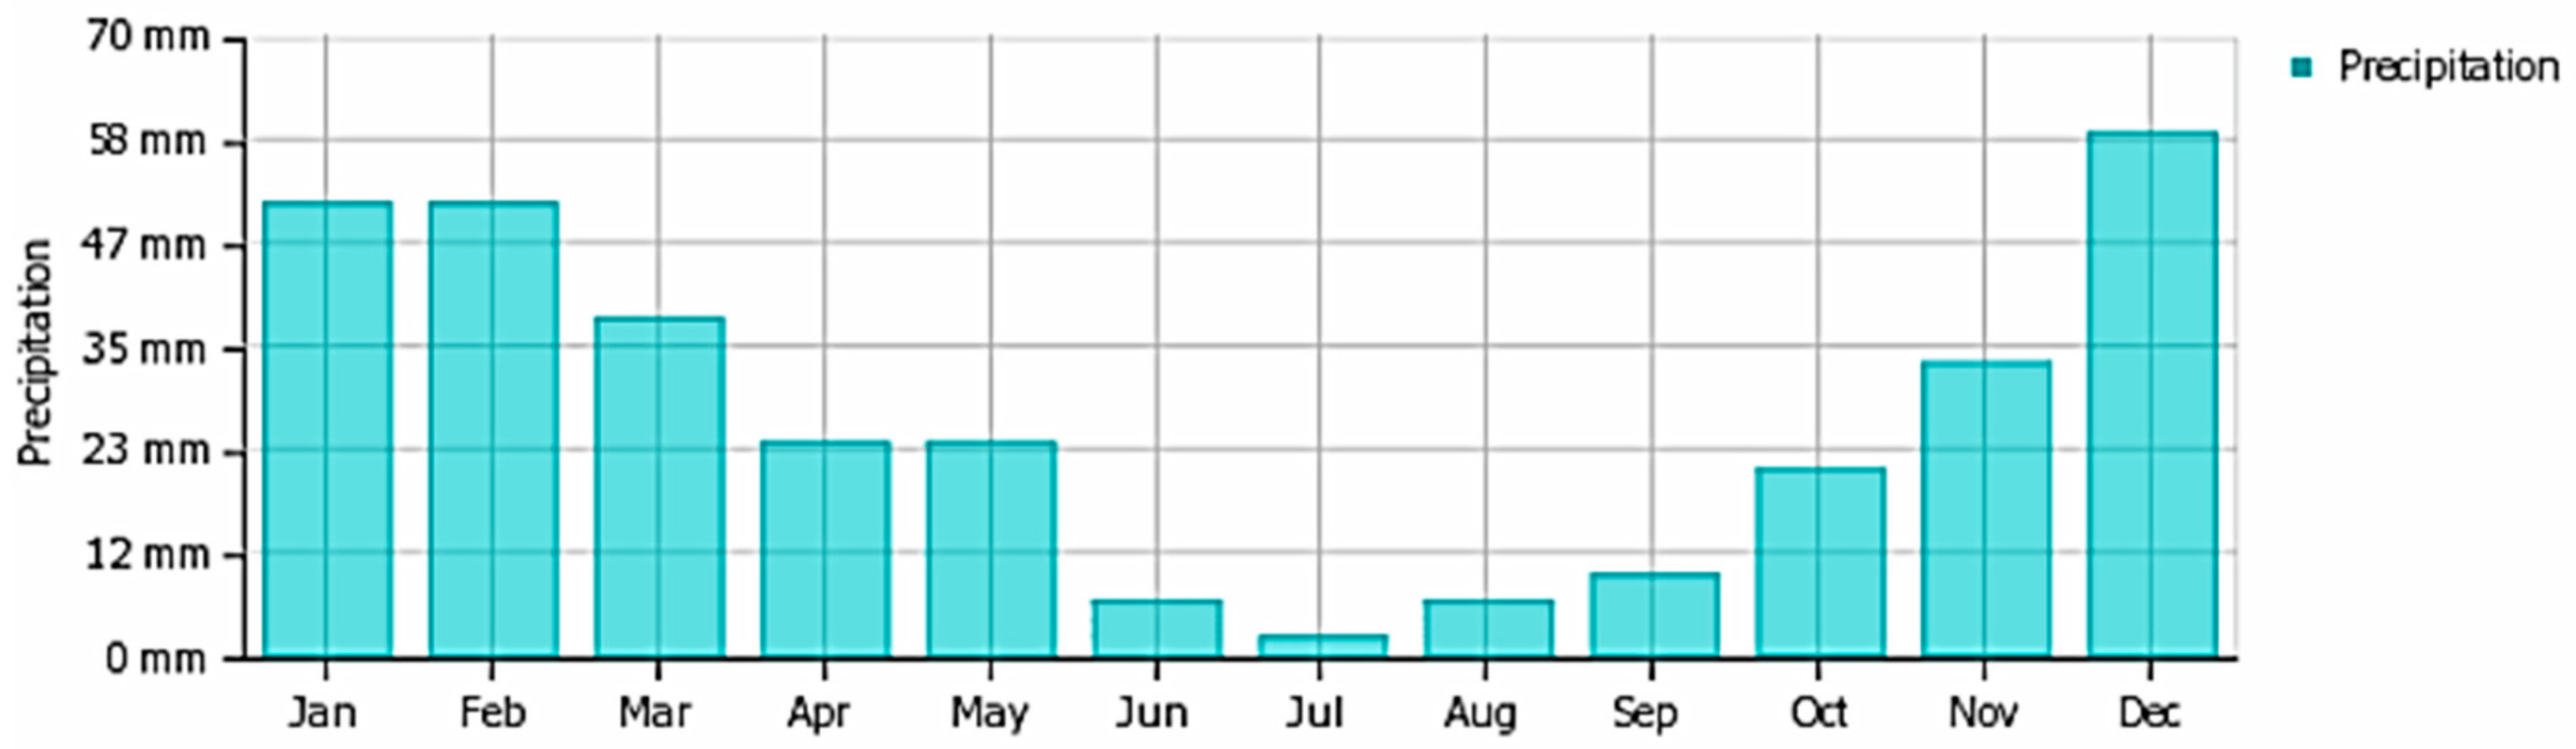
  33. Available online: https://weather-and-climate.com/average-monthly-Rainfall-Temperature-Sunshine,kyrenia-northern-cyprus-cy,Cyprus (accessed on 3 April 2018).
  34. Michaelides, S.C.; Tymvios, F.S.; Michaelidou, T. Spatial and temporal characteristics of the annual rainfall frequency distribution in Cyprus. Atmos. Res. 2009, 94, 606–615. [Google Scholar] [CrossRef]
  35. Pashiardis, G. School climate in elementary and secondary schools: Views of Cypriot principals and teachers. Int. J. Educ. Manag. 2000, 14, 224–237. [Google Scholar] [CrossRef]
  36. Yarmohammadi, S.E. Evaluation of the Appropriateness of Photovoltaic (PV) Panels for Sustainable Building in North Cyprus. Ph.D. Thesis, Eastern Mediterranean University (EMU)-Doğu Akdeniz Üniversitesi (DAÜ), Famagusta, Northern Cyprus, 2013. [Google Scholar]
  37. Tucker, P.; Gilliland, J. The effect of season and weather on physical activity: A systematic review. Public Health 2007, 121, 909–922. [Google Scholar] [CrossRef] [PubMed]
Figure 1. Illustration of the basic sources of dampness.
Buildings 08 00066 g001
Figure 2. The Q-map of system Failure Modes and Effects Analysis (FMEA) analysis [26].
Buildings 08 00066 g002
Figure 3. FMEA outline for apartment unit source.
Buildings 08 00066 g003
Figure 4. Architectural design stage.
Buildings 08 00066 g004
Figure 5. CFD Process.
Buildings 08 00066 g005
Figure 6. Site plan of the simulated building.
Buildings 08 00066 g006
Figure 7. The ground floor plan of the simulated apartment.
Buildings 08 00066 g007
Figure 8. The mean monthly precipitation of North-Cyprus [33].
Buildings 08 00066 g008
Figure 9. The mean monthly temperature of North-Cyprus [33].
Buildings 08 00066 g009
Figure 10. The mean monthly Relative Humidity of North-Cyprus [33].
Buildings 08 00066 g010
Figure 11. Contour and Grid Vector of air velocity and magnitude, CFD Autodesk 2016.
Buildings 08 00066 g011
Figure 12. Calculated Temperatures through the Apartments. CFD Autodesk 2016, 21 April 2017.
Buildings 08 00066 g012
Figure 13. Calculated Relative Humidity through the Materials. CFD Autodesk 2016, 21 April 2017.
Buildings 08 00066 g013
Figure 14. (a) Response surface plots of the mutual effect of the temperature and relative humidity through the apartment. Design-Expert Software 10. (b) Response surface plots of the mutual effect of the tile or stone and laminate wood on WCM. (c) Response surface plots of the mutual effect of the paint and wallpaper on WDF.
Buildings 08 00066 g014
Table 1. Material properties assigned to the simulated materials.
MaterialsThickness (cm)Volume (m3)Area (m2)Specific Heat Capacity J/(Kg K)Thermal Conductivity, λ W/(m K)Density (Kg/m3)Emissivity
Brick wall25 external1144068351.1019200.94
Adobe brick25 internal11440610045.1015200.93
Concrete (roof & floor)121493008371.1023,0600.92
Wooden door4--13800.125100.8
Glass window1--8400.7827000.92
Table 2. Automatic meshing settings used for the model.
TasksValue
Surface reinforcement0
Gap refinement0
Resolution factor1.0
Edge growth rate1.1
Minimum points on the edge2.0
Points on the longest edge10
Surface limiting aspect ration20
Table 3. Experimental range of amount and levels of the factors.
FactorsUnitSymbolRange of Amounts
TemperatureCelsiusA1020
Relative HumidityRHB2040
Level Coded −1+1
Table 4. Summary of ANOVA for the condensation on the window pane (WCM) model fit.
SourceSum of SquaresdfMean SquareF Valuep-Value Prob > FSignificance Level, SL
Model17,974.1544493.546.150.0021Significant
A-Laminate wood2447.2612447.263.350.0821
B-Tile or stone2473.2512473.253.390.0806
C-PVC9570.8619570.8613.110.0017(<0.0021)
D-Carpet or rug9809.3119809.3113.440.0015(<0.0021)
SourceSum of SquaresdfMean SquareF Valuep-Value Prob > FSL
Model1526.592763.3015.130.0013Significant
A-Wall Paper1426.5311426.5328.280.0005(<0.0013)
B-Paint1422.8311422.8328.200.0005(<0.0013)

