Financing Health Care in Ghana: Are Ghanaians Willing to Pay Higher Taxes for Better Health Care? Findings from Afrobarometer

Department of Political Studies, University of Saskatchewan, 283C Arts Building, Saskatoon, SK S7N 5A5, Canada
Soc. Sci. 2017, 6(3), 90; https://doi.org/10.3390/socsci6030090
Submission received: 2 July 2017
/
Revised: 28 July 2017
/
Accepted: 4 August 2017
/
Published: 8 August 2017
Abstract
:Considering the recent struggle in the Ghanaian health sector, Ghanaian policy makers and donor agencies are confronted with rethinking how the health sector can be funded and sustained. In Ghana, where budgetary decisions are heavily contested and politically expensive, one option available to the government may be to raise taxes or user fees to allow for increased spending on public health care. Using Afrobarometer 2014/2015 round six survey data, this study examined whether Ghanaians would support or oppose paying higher taxes or user fees in order to increase government spending on public health care. In this study, Cross tabulation, correlation, and multiple linear regression analysis were performed to examine whether Ghanaians willingness to pay or not to pay higher tax is correlated with demographic factors, access to health services, perceptions of health care, government performance, and perceived official corruption. Findings from this study indicate that only (35%) of respondents support the payment of higher taxes or user fees even though many Ghanaians have difficulties in accessing better health and medical care. More importantly, findings from the correlation and a multiple linear regression analysis indicate that, Ghanaians support for or opposition to higher taxes/fees are powerfully influenced by perceptions of government’s performance and trustworthiness (President’s performance = 0.136**; MP performance = 0.130**; leaders serving their own interest = 0.085**; trust President = 0.147**; trust Parliament = 0.121**; trust tax department = 0.136**) rather than sociodemographic factors or difficulties in obtaining health care as well as going without medical care. Also, corruption in the Office of the President and among tax officials showed negative association with paying of higher taxes (corruption at the tax department, −0.021; p-value = 0.003 and corruption at the Office of the President, −0.005; p-value = 0.001). Therefore, improving popular access to information about taxes people owe and public spending, while reducing corruption and misuse of public monies, will help encourage voluntary compliance and enhance the government’s revenue generation in Ghana.
1. Introduction
After many years of economic stagnation, Ghana is recording increasing growth rate in gross domestic product (GDP) and positive policy improvements (Akosua Akortsu and Aseweh Abor 2011). For example, according to the OECD and WorldBank reports released in 2016 and 2017 respectively, GDP growth rates hover around 5 to 6 percent per annum with global comparison, and these have brought greater economic stability to Ghana (World Bank 2017; OECD 2016). These positive trends in economic growth and stability are good news for efforts to reduce poverty and improve health outcomes in Ghana (Akazili et al. 2012). Despite these encouraging improvements, Ghana has been cited as one of the African countries with perhaps one of the greater health inefficiencies (Kaseje 2006; McKay 2015). This poor population health status is mirrored by crises in health financing and human resources for health (Mills et al. 2012). With only 0.2 percent of the global health workforce and only 0.1 percent of the world’s health expenditures (Gottret and Schieber 2006), health systems in Ghana are ill-equipped to adequately address their health problems. Low per capita income and limited capacity for domestic revenue mobilization have complicated government’s ability to respond effectively to the health challenges in Ghana (Criel et al. 2008; McKay 2015; Streefland 2005).
It is estimated by the World Bank (2011) that Ghana’s population will increase from its 2010 level of 24.3 million to 33.8 million in 2030, an increase of 39 percent. With declining birth rates and increasing life expectancy, the percentage of the population below 14 years will decrease from 38.1 percent in 2010 to 30.8 percent in 2030, and the percentage of the population over age 64 will increase from 3.7 percent to 5.0 percent. In 2030, there will be 90 percent more people over age 64 in Ghana than there were in 2010 (World Bank 2011). This gloomy picture painted by the World Bank indicates that Ghana’s health system and other social programs will need to grow to meet the increasing demands of the country’s growing and structurally changing population.
With all things being equal, this demographic transition suggests a change in the epidemiological transition in Ghana. According to Schieber et al. (2012), this change might increase a shift from communicable disease to non-communicable disease in the next 20 years, assuming it follows the sub-Saharan African trend. Also, communicable disease burden in Ghana is projected to decline from 52 percent to 39 percent, whereas non-communicable disease is projected to increase from 41 percent to 47 percent (Schieber et al. 2012). This paints a gloomy picture since it is more expensive to treat non-communicable diseases than communicable diseases. With the presence of poor road networks, ineffective occupational health and disease prevention strategies, and weak coordination between the Ministry of Health and National Health Insurance Authority, the epidemiological transition might exacerbate already existing cost pressure of financing the health needs of Ghanaians (McKay 2015). This increasing challenge in the health sector suggests an increase investment in the sector which is also likely compete with other equally important sectors like education, agriculture, and energy (Deaton and Tortora 2015; KPMG 2012; Bryan et al. 2010). This will therefore mean that increasing investment in the health sector by cutting down spending in other sectors—such as education, electricity, agriculture, and other equally important social services—may not be a popular idea and feasible solution in Ghana. One alternative available to the government of Ghana to raise money to finance the health sector may be to raise taxes or user fees in order to increase available funding for the health sector. However, the central question then is: are Ghanaians willing to support government decision to increase taxes or user fees to support health care spending? This question shapes the prospects of this study. This study employs the Afrobarometer round six survey data (2014/2015) to examine whether Ghanaians will reject or accept the idea of higher tax or user fees to support the increasing health cost. This paper specifically examines Ghanaians responses and analyzes whether their willingness to pay or not to pay higher tax are associated or correlated with demographic factors, access to health services, perceptions of health care, government performance, and perceived official corruption.
2. Historical Overview of Health Care Financing in Ghana
There is abundant literature on evolution of the Ghanaian health system. The evolution of the system from a classic general revenue, thus the one funded by national health system (in which free care was provided by the Ministry of Health) to a “cash and carry” system relying on substantial patient payments to a national mandatory health insurance scheme has been well documented (see Table 1 below for detailed chronological development of health care financing in Ghana) (NDPC 2009; Durairaj et al. 2010; Hendriks 2010; Mensah et al. 2010; Nyonator 2010a, 2010b, 2010c; Apoya and Marriott 2011). Evidence from the literature suggests that Ghana, at independence, provided free health care for its citizens (NDPC 2009; Durairaj et al. 2010; Hendriks 2010; Mensah et al. 2010). After independence, the then socialist and Pan-Africanist government led by Dr. Kwame Nkrumah tried to eliminate all barriers to access to health care and to ensure that everyone had access to health care irrespective of their socio-economic background. As such, user fees were abolished and health care was thus free to all and funded through general taxes and donor support (Nyonator and Kutzin 1999). The free health care which was part of the socialist policies was also backed by the Arusha declaration of 1967 which intended to ensure universal access of social services to the poor and those living in marginalized rural areas. These fully tax funded health systems tried to address some of the inequities in geographical distribution of health services. Attention was given to developing a wide range of primary health care facilities across the country, promoting and strengthening preventive interventions such as immunization and antenatal care (Akazili 2010).
However, in the 1980s, Ghana—like many African countries—started crumbling under severe macroeconomic difficulties which resulted in negative or limited economic growth (Hendriks 2010). Ghana’s situation was exacerbated by an unstable political environment through frequent military interventions in governance. Ghana did not have the resources to maintain the free health services and indeed the socialist ideologies. Public health services deteriorated and added to this was the prescription of Structural Adjustment Programs (SAP) by the IMF and World Bank which require the government to reduce expenditure and to share cost, which meant levying significant user fees for health care. These were necessary requirements and conditions for loans that the country desperately needed. These developments led naturally to the growth of the private sector where previously they were limited or non- existent. The results of all these developments—which can be said to be largely influenced by colonial health policies—is a heavily fragmented and inequitable health system (Nyonator 2010a, 2010b).
The nation-wide fee-for-service was introduced by the Hospital Fees Act 387 after the user-fee regime. With this, health care was provided by token fees charged for health services provided (Nyonator and Kutzin 1999). This financing strategy again, was insufficient for the increasing resource demands of the sector. The government in response to the above challenges, introduced the ‘cash and carry’ system in the mid-1980s. This system saw the complete withdrawal of government subsidy with patients paying the full health-care cost. This system was justified based on full cost recovery for an expansion in health facilities. It was again meant to reduce the abuse of service through the frequency of visits. The basic assumption underpinning the ‘cash and carry’ system was defeated eventually since it in-turn excluded the poor and created vast inequalities. According to Johnson and Stoskopf (2009), the ‘cash and carry’ system led to under-utilization of basic health services.
SSNIT = Social Security and National Insurance Trust. Formal sector employees contribute 5% of their incomes to the SSNIT and their employers pay 12.5%.
The search for an alternative financing strategy led to Act 650 in 2003. This act established the National Health Insurance Scheme (NHIS). This was meant to eradicate all financial barriers created by the earlier health reforms (Mills et al. 2012; Akazili 2010; Borghi et al. 2009). The NHIS is aimed at affording members access to health care without having to pay at the point of access and offer affordable medical care. The funding of the NHIS comes from 2.5% VAT levy on selected goods and services, 2.5% of workers Social Security and National Insurance Trust (SSNIT) contribution, parliamentary approval from the consolidated fund, donations, grants, gifts, and other voluntary contributions, money that may accrue from the investment by the National Health Insurance council (NHIC) and from graduated premium contributions by those in the informal sector of ¢72,000 (GH¢7.2) to ¢480,000 (GH¢480.0). The purpose of the graduated premiums is to ensure equity through assessing who pays what being based on the criteria outlined in Table 2. The complexities and lack of clarity in these criteria has resulted in current premiums contributions being flat, with people generally paying the lowest premium of ¢72,000 and this makes it regressive (Akazili 2010). It is important to note that the NHIS (especially at the implementation stage) received a lot of financial support from international organizations, particularly from DANIDA and that contributed to the smooth initiation of the scheme.
The 2003 Act demands that every district should have an operational insurance scheme with membership opened to all district residents. Moreover, exemptions have been made under Act 650 for the poor and indigents. The NHIS since 2008 has exceeded its target of 40 percent nationwide coverage (Addae-Korankye 2013). According to the Ministry of Health, the scheme has accredited over 145 service providers with a 45 percent increase in membership (Ministry of Health 2008). Other major achievements within the 14 years of its establishment include—but are not limited to—the introduction of free maternal health care policy, an electronic membership card platform, and establishment of regional coordinating offices.
Ghana, since the implementation of the NHIS, has received encouraging praise from neighboring countries for its impressive achievements. However, the rapid increase in enrolment over the last five years to more than one-third of the population has placed serious strains on the scheme due to political influences and complex administrative structures as well as financial burdens (Schieber et al. 2012; Akazili et al. 2014). More importantly, the increase in national coverage has had negative financial implication on the scheme since NHIS income is largely tax based i.e., 90–95% SSNIT and VAT levy. This suggests that the increase in nationwide coverage implies a simultaneous increase in revenue mobilization by the scheme (Addae-Korankye 2013). It appears that the raising of taxes remains the prudent alternative in sustaining health finance in Ghana.
Current Funding of Ghana Health System
It must be noted that Ghanaian health care system, like many other developing countries, is significantly financed by direct and indirect tax revenue (Akosua Akortsu and Aseweh Abor 2011; Mensah et al. 2010). Regarding direct tax-thus personal income tax, workers contribute 5% of their income for retirement (Price WaterHouse Coopers 2009) and this amount is collected by a social security organization called SSNIT. The rates range from 0% for income less than GH¢180 to 28% for income exceeding GH¢720. The personal tax contributes about 5.2% to the total health expenditure of the Ghana health system.
Corporate tax is also one of the funding source of the Ghana health care system. The key elements of the debate regarding this tax have been whether increases will result in lower wages, lower retail earnings, or higher prices? Some writers assume an equal share (50%) of burden for consumers and shareholders (mainly foreign owned in Ghana) and others assume a 10% burden on consumers and 90% burden on shareholders of the companies (Martinez-Vazquez 2008; Akazili 2010). The corporate tax also contributes 7.1% to the total health expenditure of Ghana. Value Added Tax (VAT) is the indirect tax regime that is also used to finance Ghana’s health sector. The current total rate of VAT collected is 15%. This includes a main VAT component of 10% with two additional sector specific components of 2.5% each. The first 2.5% is directly earmarked and allocated to the Ghana Education Trust Fund (GETFund). The other 2.5%, which was introduced in 2004 by an act of parliament and called the National Health Insurance Levy (NHIL), is collected separately but on the same goods and services that VAT is covering (Price Water House Coopers 2008; Akazili 2010).
The fuel levy is also one of the source of funding for the Ghana health sector. In 2005 the fuel levy was second only to VAT in its contribution to total tax revenue, contributing 8.5%. The key fuel types in Ghana are petrol, diesel, and kerosene. Kerosene is often consumed more by those who do not have access to electricity. In remote areas, the high cost of kerosene can consume much of a family’s income. Given the fact that kerosene is a frequently purchased item, it was annualized (Akazili 2010). Apart from the above funding sources, import duty also contributes greatly to the financing of Ghana health sector. It is often assumed that import duties passed on to consumers have the same incidence as VAT (Martinez-Vazquez 2008). Import duty is the third largest contributor of taxes after VAT and income tax in Ghana. It contributes 8.0% to the total health expenditure of Ghana. Apart from tax, health care in Ghana is also financed by Health insurance contributions made up of premiums (through DHIS) from the informal sector and pay roll deductions (by SSNIT) to the National health insurance scheme as well as out of pocket payments (OOP) which has been discussed in the previous section above. Out of pocket payments contribute 48% of the total health expenditure of Ghana (Owusu-Sekyere and Bagah 2014). In summary, the current sources of Ghana’s health sector funding include 47% of both direct and indirect tax, 48% out of pocket payment, and 4.3% from other sources (Akazili 2010; Yevutsey and Aikins 2010; Armah-Attoh and Awal 2013; Owusu-Sekyere and Bagah 2014).
3. Materials and Methods
Afrobarometer is an African-led, non-partisan research network that conducts public attitude surveys on democracy, governance, economic conditions, and related issues across more than 30 countries in Africa. Five rounds of surveys were conducted in Ghana between 1999 and 2013, and Round 6 surveys (2014–2015) have been used for this current study. Afrobarometer conducts face-to-face interviews in the language of the respondent’s choice with nationally representative samples of between 1200 and 2400 respondents. The Afrobarometer team in Ghana, led by the Center for Democratic Development (CDD-Ghana), interviewed 2400 adult Ghanaians between 24 May and 10 June 2014 with 2010 Ghana Population and Housing Census as the sample frame. A sample of this size yields results with a margin of error of ±2% at a 95% confidence level. The languages employed for the survey were Twi, Ewe, Ga, and Dagbani. There was a contact rate of 95.90% with 82.10% cooperating. Refusal rate stood at 7.90% compared to a 78.70% response rate.
3.1. Sampling Procedure
Nationally representative, random, clustered, stratified, multi-stage area probability sampling techniques were employed for the survey. The sample was stratified into regional, and urban–rural locations. With the multi-stage sampling, the primary sampling unit (from strata) was the start point. With the cluster sampling, the cluster size was eight households per primary sampling unit. After that, households were randomly selected start points, followed by a walk pattern using a 5/10 interval respondent selection and this was made with care to be gender representative. The gender quota was filled by alternating interviews between men and women while respondents of appropriate gender were listed. After an appropriate gender is listed, each household member draws a numbered card to select individual to be interviewed.
3.2. Measurements and Variables of the Study
In order to access the willingness of Ghanaians to pay or not to pay higher taxes, Q65C of the survey questions which is the dependent variable of this was used. Q65c, “If the government decided to make people pay more taxes or user fees in order to increase spending on public health care, would you support this decision or oppose it?” Response (1 = Strongly oppose, 2 = Somewhat oppose, 3 = Neither support nor oppose, 4 = Somewhat support, 5 = Strongly support, 6 = It depends (e.g., on size of the increase). The independent variables that were used to explain or predict the dependent variable were measured as follows. Q8c: going without medical care over the past year (0 = Never, 1 = Just once or twice, 2 = Several times, 3 = Many times, 4 = Always). Difficulty in obtaining medical care was measured with Q55c (1 = Very easy, 2 = Easy, 3 = Difficult, 4 = Very Difficult, 9 = Don’t Know). Also, paying bribes to obtain medical service at public hospitals was measured using Q55d (0 = Never, 1 = Once or twice, 2 = A few times, 3 = Often, 9 = Don’t Know). Moreover, trust in the President, tax department, and Parliament were measure with Q52 of the survey questionnaires. The responses include (0 = Not at all, 1 = Just a little, 2 = Somewhat, 3 = A lot, 9 = Don’t know/Haven’t heard). Q55 also measures the level of perceived corruption among the tax department, the President and the officials in his office, and Parliament. Q55 reads: “How many of the following people do you think are involved in corruption, or have you not heard enough about them to say?” The responses include (0 = None, 1 = Some of them, 2 = Most of them, 3 = All of them, 9 = Don’t know/Haven’t heard). In addition, performance of the President and the MPs were measured with Q68 of the survey questions which reads: Do you approve or disapprove of the way that the President and MPs have performed their jobs over the past twelve months, or haven’t you heard enough about them to say? The responses include (1 = Strongly Disapprove, 2 = Disapprove, 3 = Approve, 4 = Strongly Approve, 9 = Don’t know/Haven’t heard enough). The urban or rural primary sampling unit was measured as (1 = Urban, 2 = rural). Gender was also measured as (1 = Male, 2 = female).
3.3. Data Analysis
The data from this survey were analyzed using the SPSS version 24. The data in SPSS format can be downloaded from the Afrobarometer website: (Afrobarometer Ghana 2015). The variables and the objectives of the study were analyzed using descriptive statistics, cross-tabulations, and excel. The Afrobarometer online data analysis tools were also employed for the cross-tabulation analysis. The correlation and multiple linear regression analysis were performed to ascertain whether the willingness to pay or not to pay higher taxes or user fees are associated or correlated with demographic factors, access to health services, perceptions of health care, government performance, and perceived official corruption.
4. Results
This section of the paper analyzes and discusses the findings in relation to the objectives of the paper. The main objective of this current study is to examine whether Ghanaians would support or oppose paying higher taxes or user fees to increase government spending on public health care. More specifically, this paper examines Ghanaians responses and analyzes whether their willingness to pay or not to pay higher tax they are associated or correlated with demographic factors, access to health services, perceptions of health care, government performance, and perceived official corruption. Out of the 2400 participants who took part of the study, 1199 (50%) were male while 1201 (50%) were females. Also, 1305 (54.4%) of the respondents were urban dwellers while 1095 (45.6%) were urban dwellers. Regarding employment status, 836 (34.8%) were unemployed while 268 (11%) of the respondents were part-time workers. In addition, 1273 (53%) thus greater majority of the respondents were full time employed while 22 (0.9%) did not know their employment status. Regarding the level of education of the participants, 458 (19.3%) had no formal schooling at all while 477 (20%) of them had received some form primary education. In addition, 1,161(representing 48%) left high school, while 187 of the respondents (7.8%) had completed a post-secondary education but not university. In addition, 91 (4%) had completed university, while only 18 (0.8%) had post-graduate degree.
4.1. Access to Health Care
For a population of a little above of 24 million people, there are only 1740 health care facilities across the 10 regions (Netherlands Enterprise Agency 2015). It is said that access to these limited health facilities remains a challenge (Salisu and Prinz 2009). To know how difficult or easy Ghanaians encounter in seeking medical care, The Afrobarometer team in 2014/2015 survey asked three main questions. First, respondents were asked if there is any health facility or clinic within easy walking distance. The respondents were further asked how easy or difficult it was to obtain medical treatment they needed and finally how often they went without medical care.
From Figure 1 below, it can be observed that at least 47% of the respondents surveyed do not have a clinic or hospital nearby. Among the number of respondents who can access health care, 19% had it difficult in accessing health care. Regarding those who went without medical services for the past 12 months, about 26% said they went without needed medical care. With this figure, 11% said they went without medical services just once, 10% said several times, while 5% said many times.
It must be noted that above numbers and figures are significantly dependent on the location where people reside in Ghana.
From Figure 2 below, it can be noted that, on average, urban residents are more fortunate than rural residents to have a health clinic within walking distance (69% vs. 34%). It is also visible from Figure 2 below that people living in rural areas are likely to report going with without medical care (32%) with 13% going without medical care at least once in the last 12 months, 12% going without medical care several times, and 7% going without medical care many times within the past 12 months. While it is expected that people living in rural communities would report difficulties in accessing health care, this study have revealed the opposite. The result in Figure 2 below indicates that, urban residents had greater difficulties in accessing health care than rural residents (21% vs. 18%).
4.2. Are Ghanaians Willing to Pay Higher Taxes/User Fees to Support Higher Health Spending?
The capacity of any country to provide for the welfare and security of its citizens as well as to develop and consolidate representative democracy is determined by its ability to raise enough resources (Armah-Attoh and Awal 2013). Generally, in Africa, previous studies by (Isbell 2016) have shown that citizens from Madagascar, Mozambique, Senegal, and Burkina Faso have rallied for higher taxes or user fees in exchange for increased health spending, led by Madagascar (59% “somewhat” or “strongly” support), Mozambique (57%), Senegal (57%), and Burkina Faso (56%).
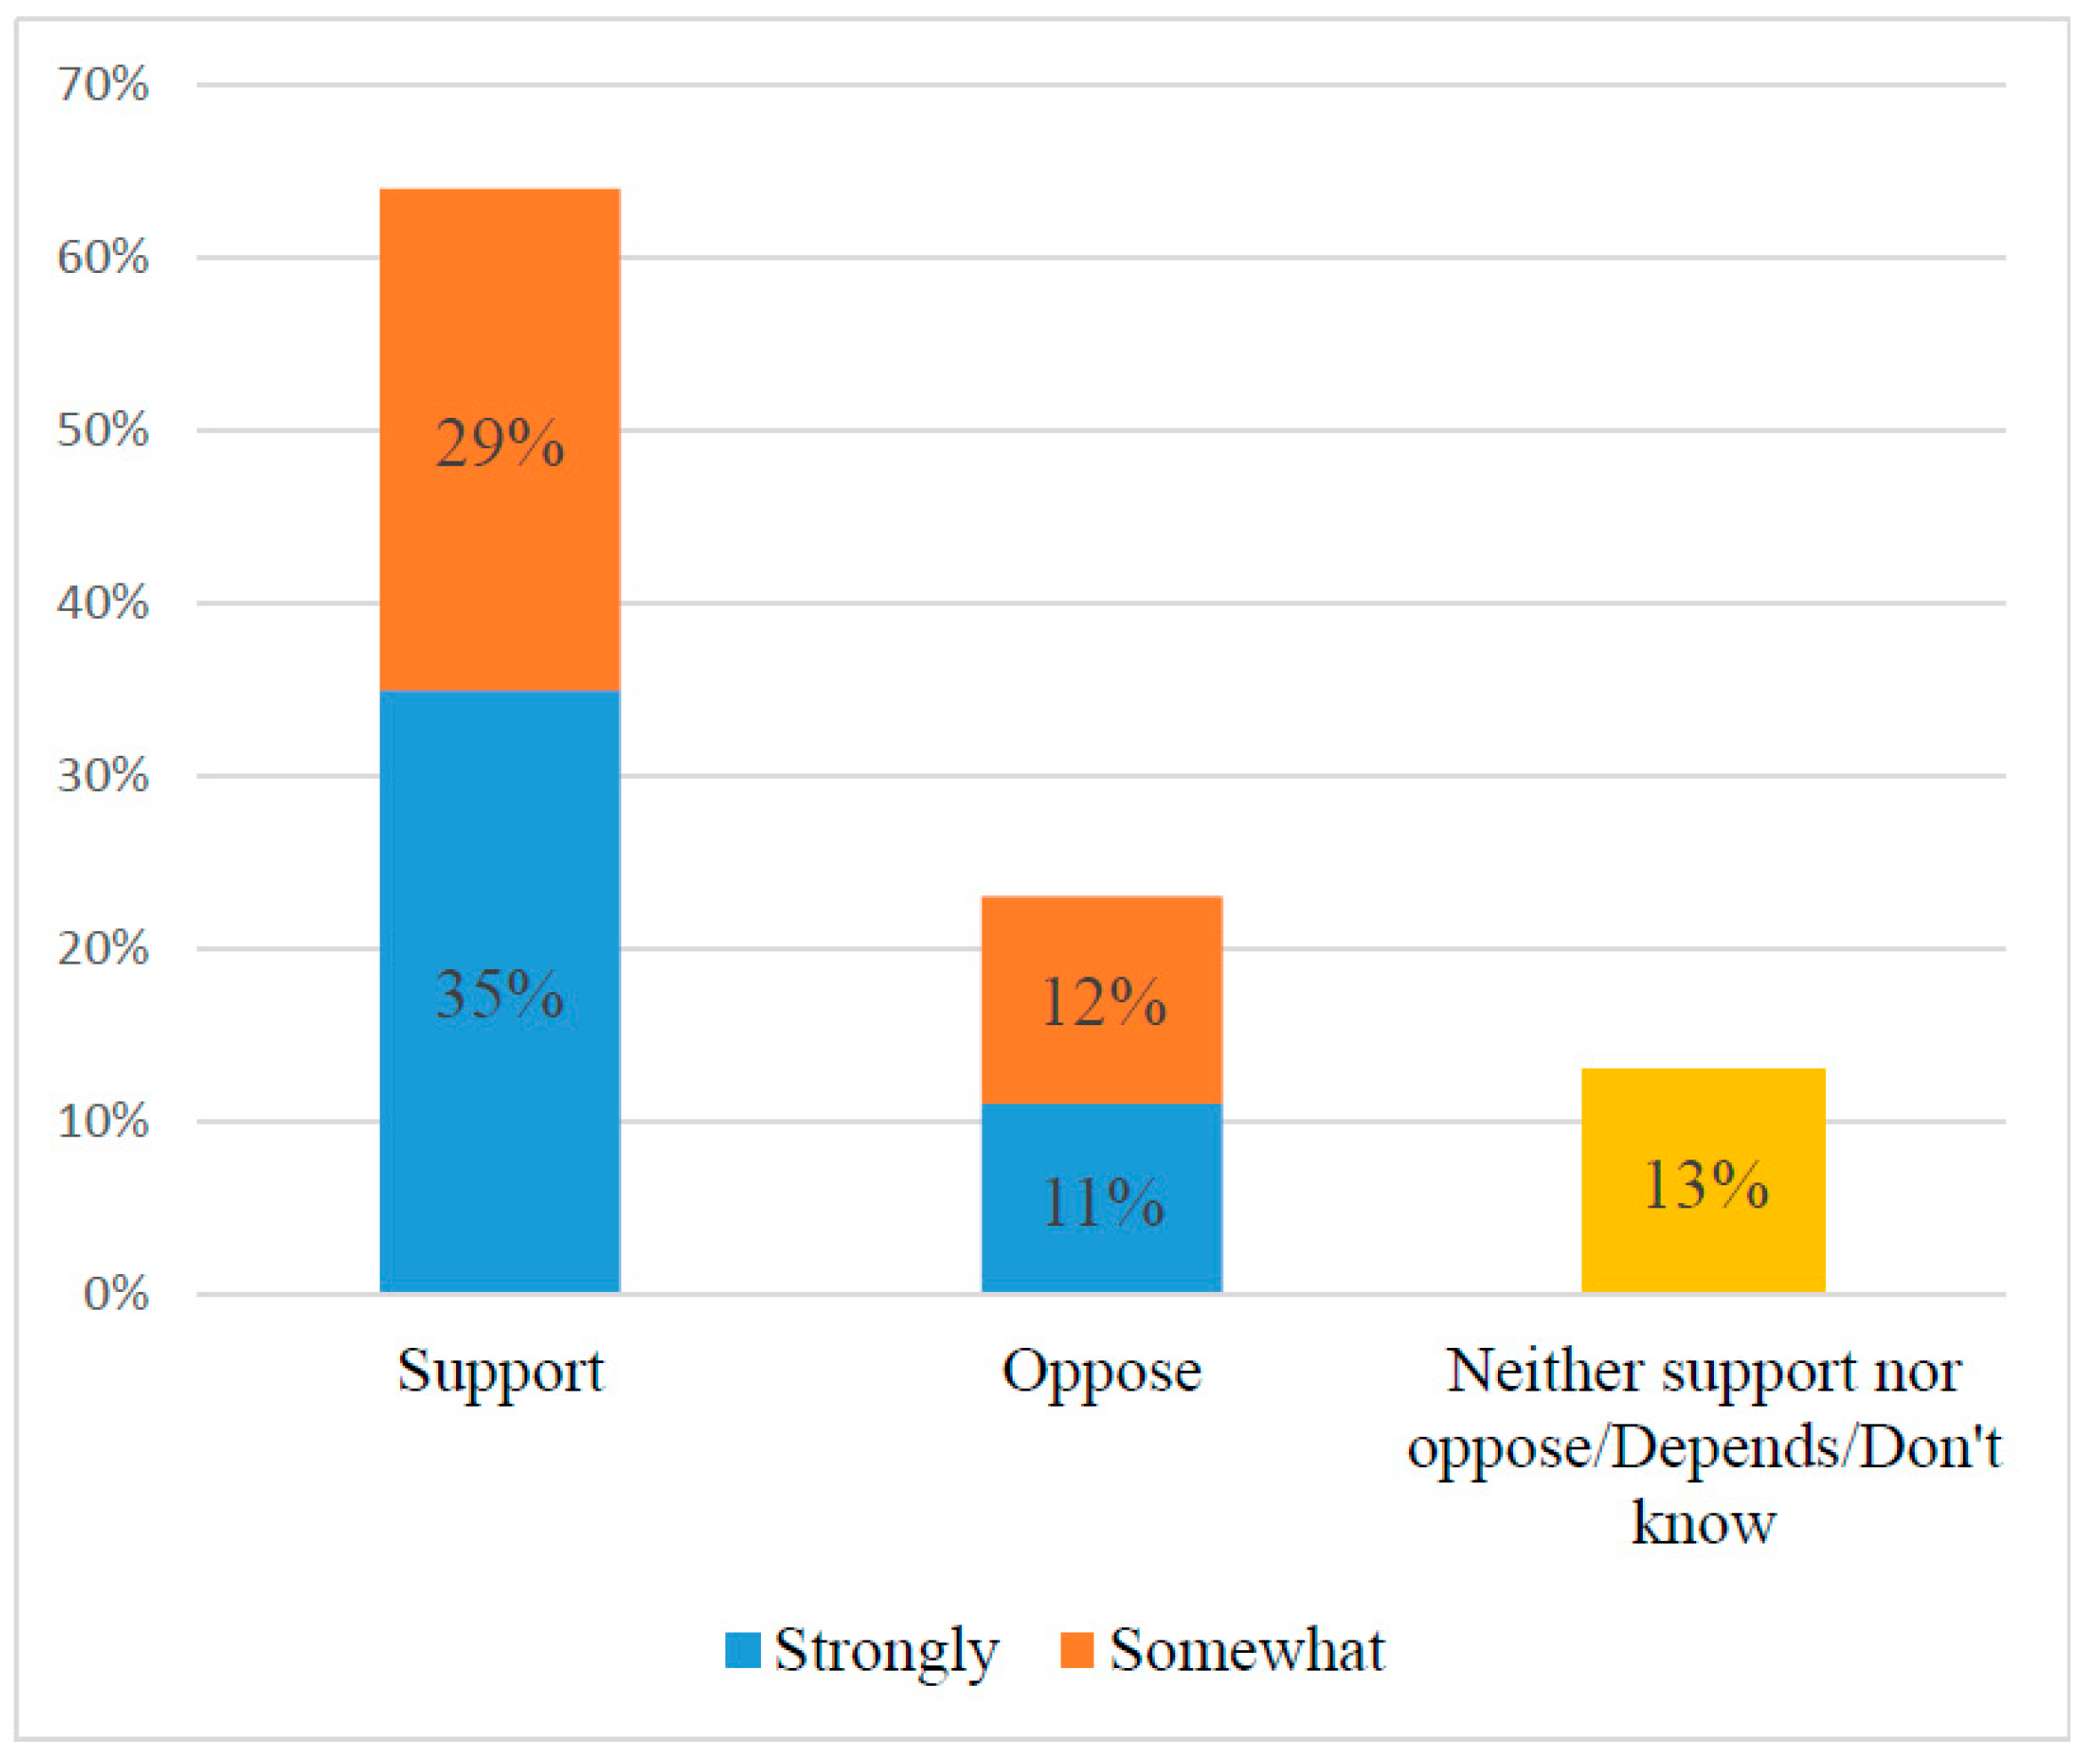
Putting Ghana in context, Afrobarometer in 2014/2015 asked Ghanaians: if the government decided to make people pay more taxes or user fees to increase spending on public health care, would you support this decision or oppose it? With this question, the views of Ghanaians are divided as to their willingness to pay higher user fees or taxes to increase government spending on health care: 35% would “strongly” support paying higher taxes while 29% would “somewhat” support paying higher taxes. Just a little above 20% would strongly or somewhat oppose such a government decision (see Figure 3 below).
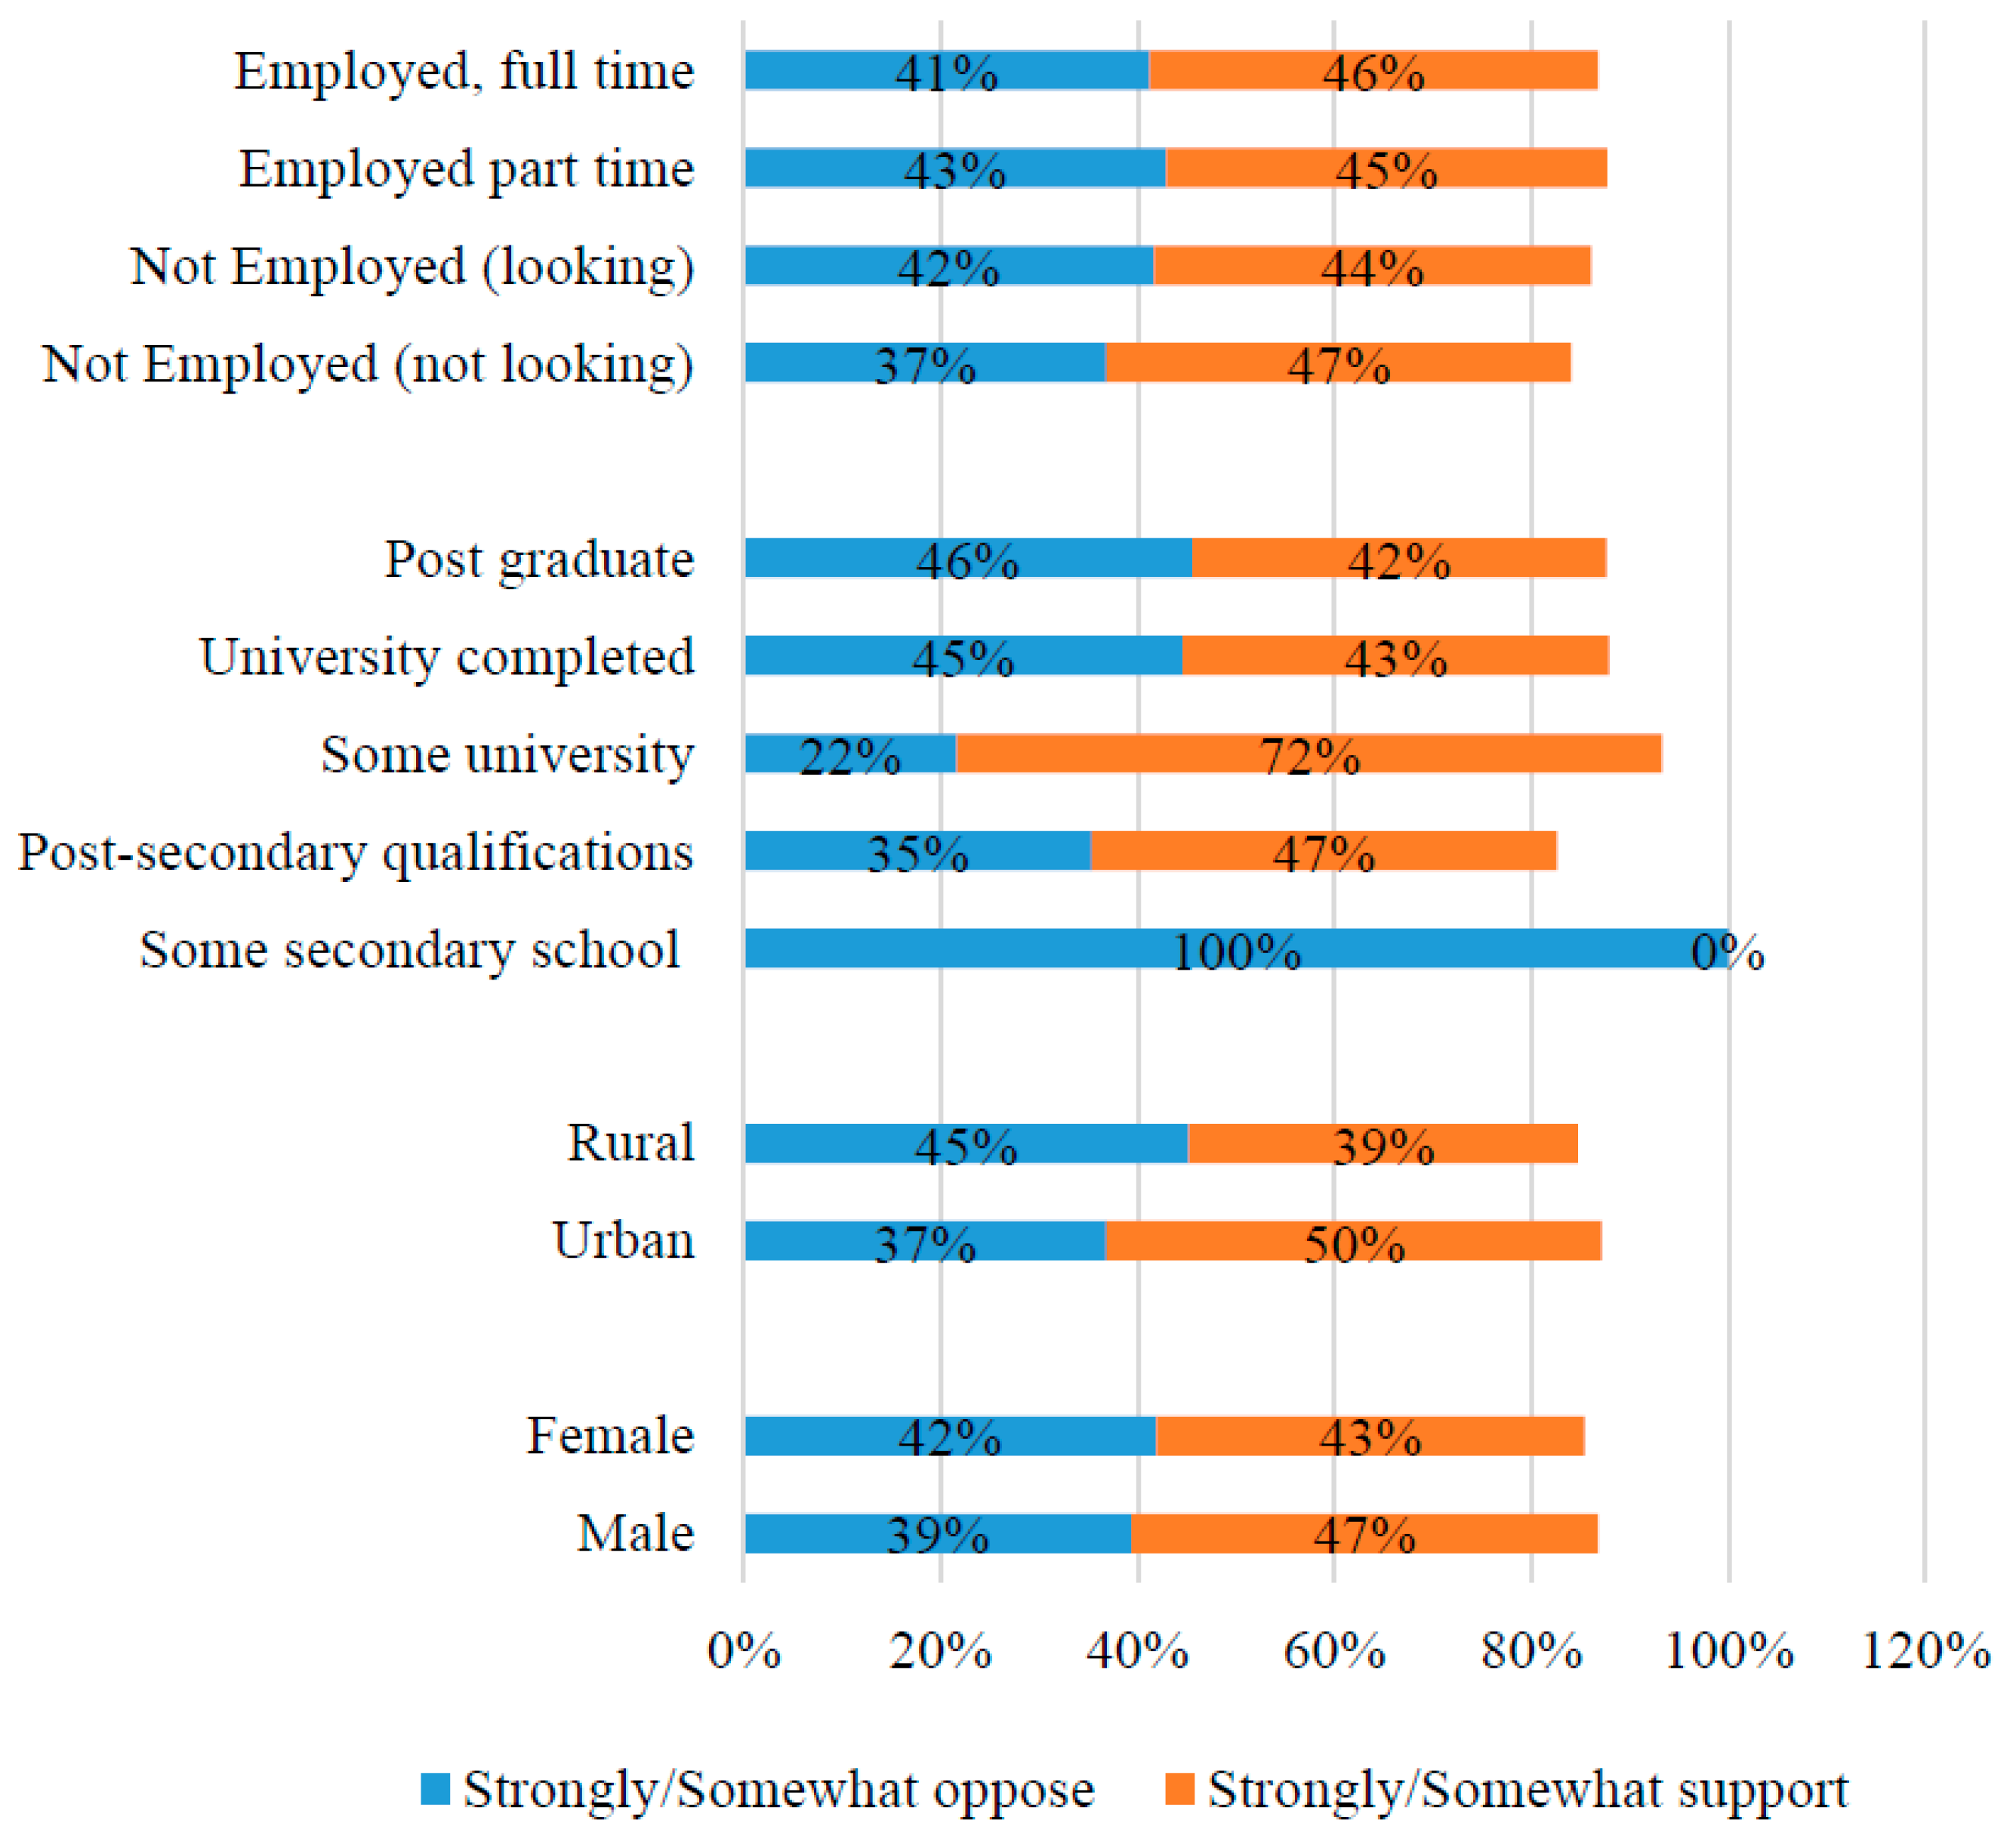
While just 35% of the sampled population would strongly support paying higher taxes while 23% oppose such decision, it was very prudent to examine whether their support or opposition is influenced by demographic factors. In this regard, demographic factors such as gender, urban/rural residence, level of education, and employment status were cross tabulated.
It is evident that differences in support and opposition to higher taxes are small across sociodemographic factors such as gender, urban/rural residence, level of education, and employment status (Figure 4). Only education shows a modest association: respondents with some secondary education are more likely to support higher taxes/fees than their better-educated counterparts.
4.3. Do Experiences with and Perceptions of the Health System Matter?
While sociodemographic factors above show modest association in people’s attitudes toward paying higher taxes in exchange for increased health spending, it is probable that their views might be influenced by their perceptions and experiences with the current health system in Ghana. However, such direction might sound a bit confusing and may even be difficult to predict. For instance, if Ghanaians see the current health services as good, they might think the system has money and as such there is no need to pay higher user fees. On the other hand, those who might think the current system is suffering from financial crises can decide not to pay higher user fees because they cannot waste their resources on an underperforming system. They can also decide to pay higher taxes considering the current state of the health system.
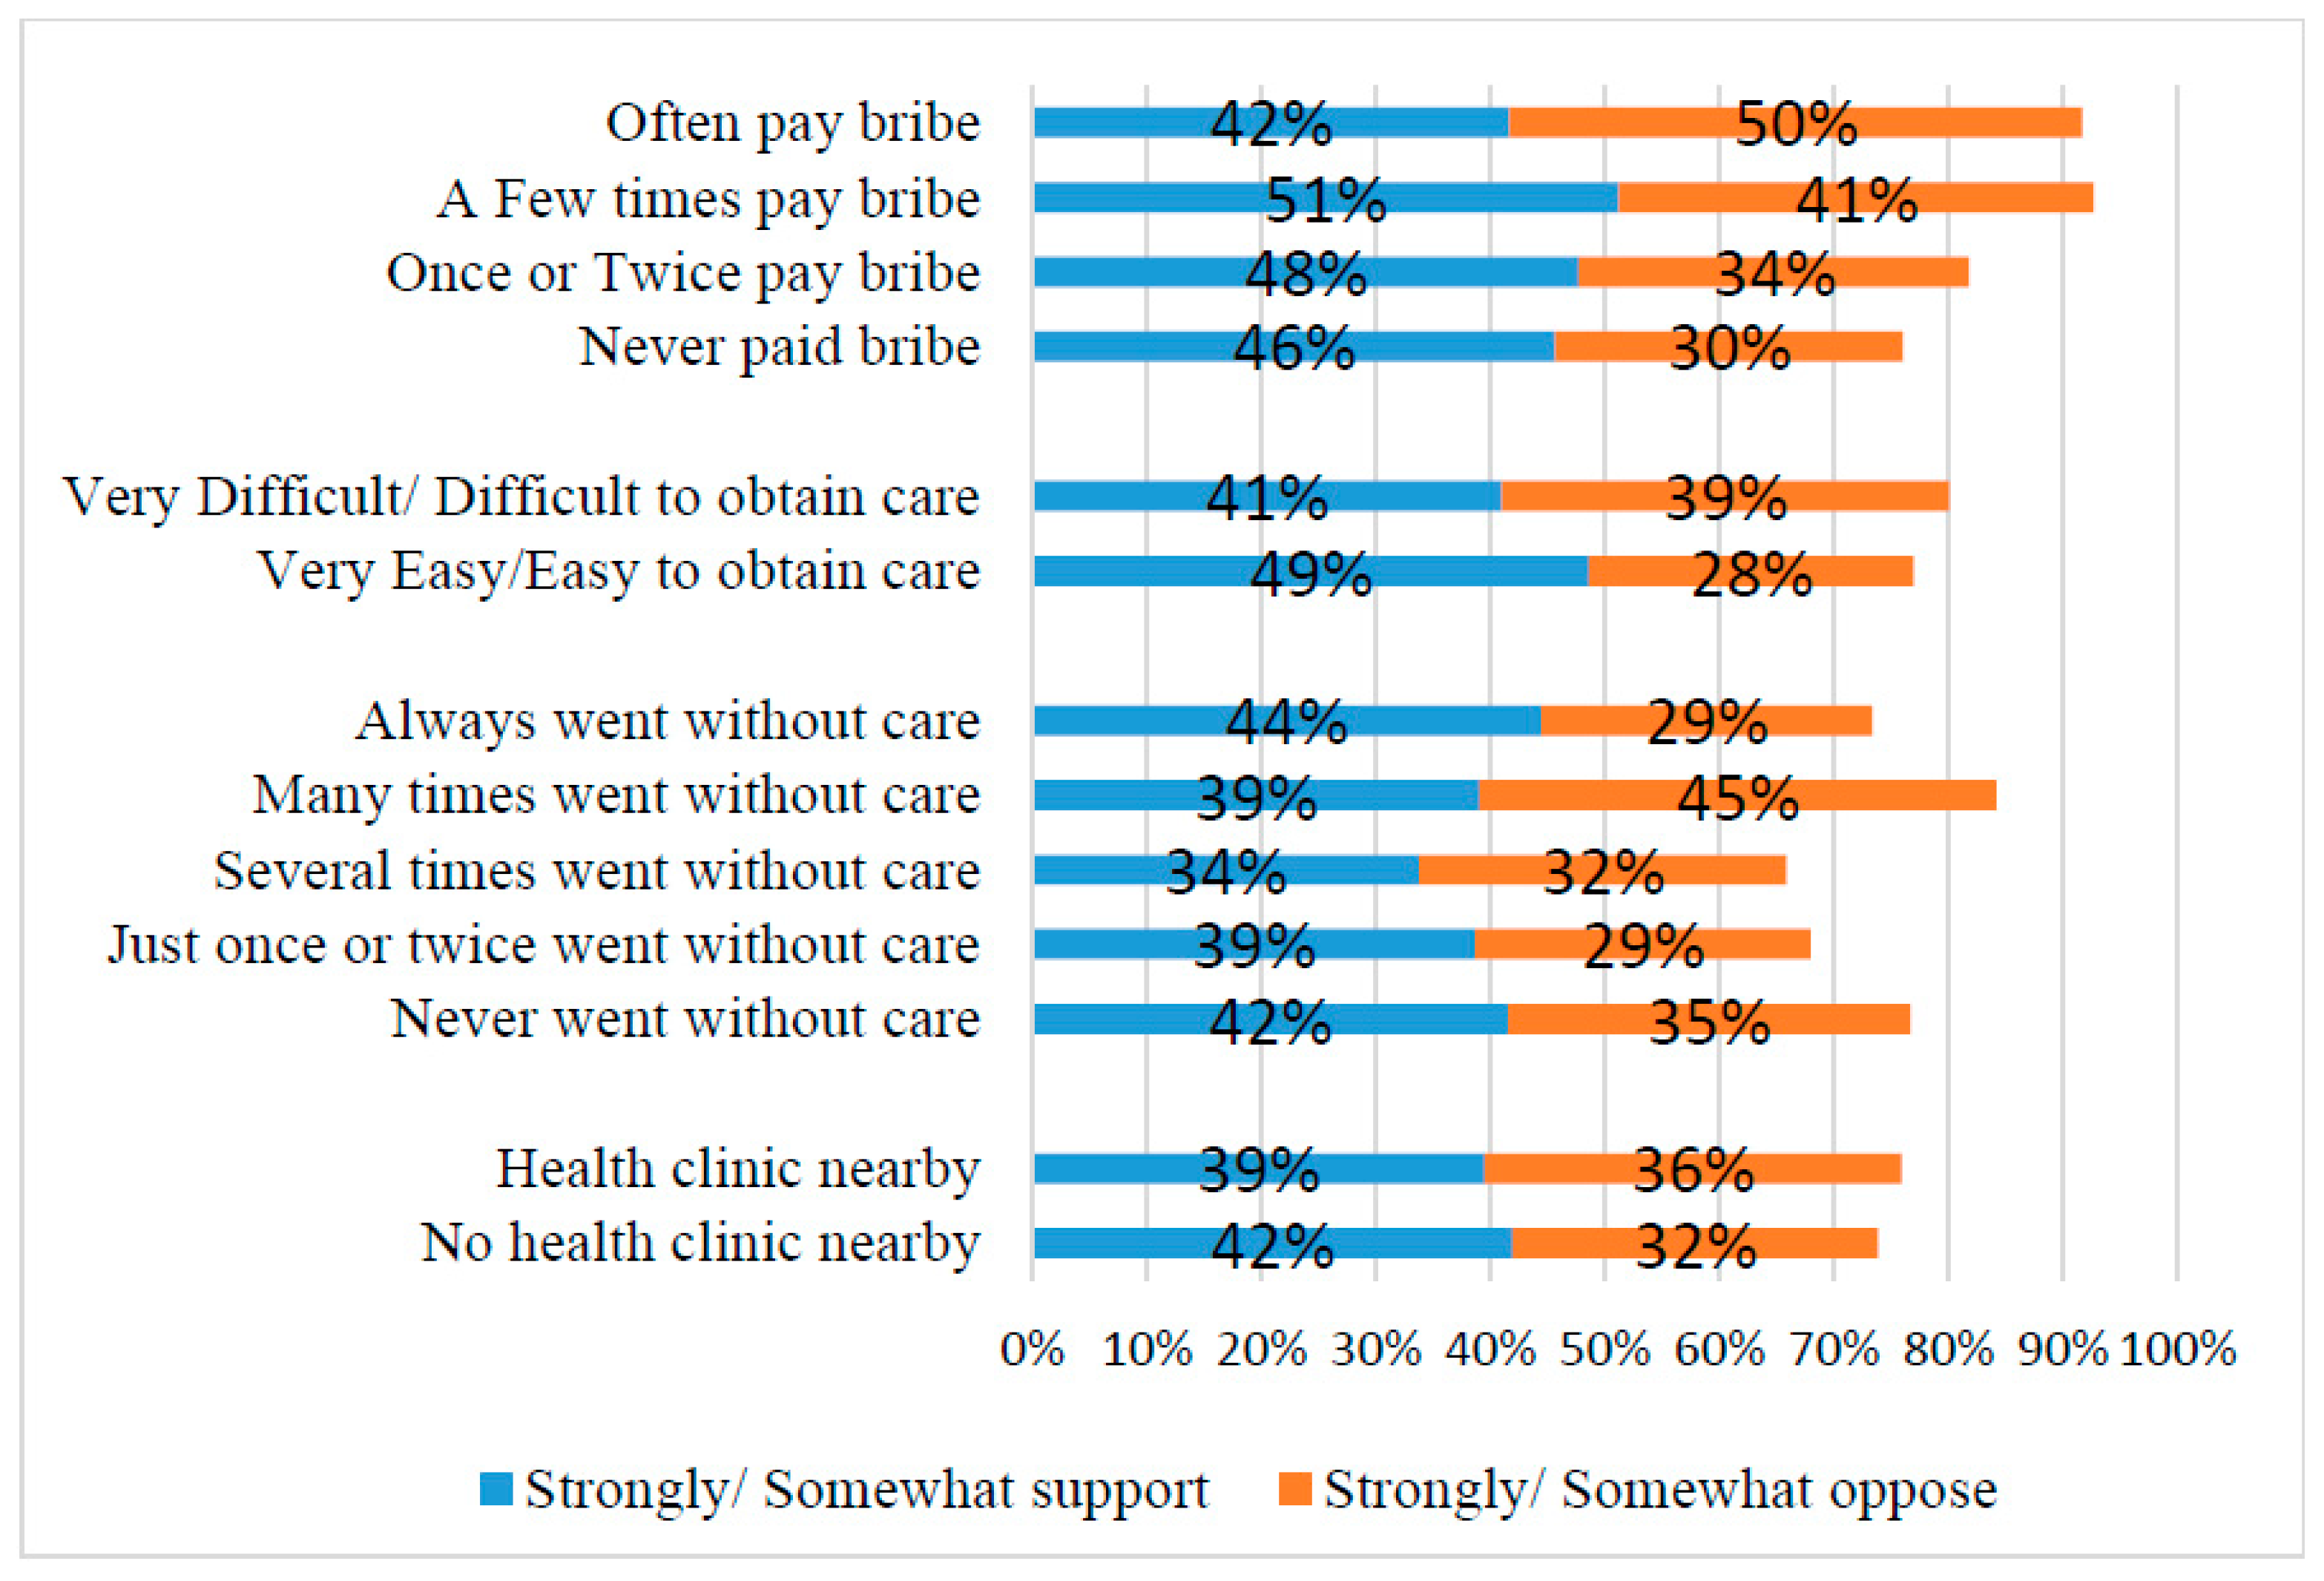
Figure 5 below shows opinions on paying more taxes for increased health spending grouped by respondents’ experiences with the health-care system. From the analysisbelow, those with no health clinic nearby were more strongly or somewhat supportive of paying higher taxes than those with health clinic nearby (42% vs. 39%). Similarly, one might expect that respondents who went without medical care or those who found it difficult to obtain needed care, or those who had to pay a bribe to obtain care would be more supportive of higher taxes/fees if they think such a policy might impact their lives in a positive way. These findings in Figure 5 below confirm such expectations only to a limited extent. Respondents who paid a bribe to obtain medical services a few times were strongly supportive of paying higher taxes than those who often pay bribes (51% vs. 42%). However, respondents who always went without medical care were more likely to support paying higher taxes to increase government spending than those who went without medical care (44% vs. 42%). Respondents who found it difficult/very difficult to obtain treatment are somewhat less likely to support taxes/fees than those who found it easy/very easy (41% vs. 49%).
4.4. Perceived Corruption, Performance, and Trust in Institutions
During the round six survey in 2014, Afrobarometer team asked several questions about citizens’ perception of government performance, including how respondents think the government is doing regarding the improvement of basic health services, whether they approve or disapprove of the overall job performance of the President and Members of Parliament (MPs), and how much they trust certain government officials.
Table 3 below shows that respondents who think that the government is performing or handling basic health services well or very well strongly support the payment of higher taxes or user fees than respondents who rated the government performances as very bad (52% vs. 34%). Similarly, respondents who gave their President and MP positive job-performance ratings (“approve” or “strongly approve”) are more supportive of increased taxes than respondents who offer negative performance evaluations (43% and 43% respectively).
Also, public trust in the President, tax department, and their MPs shows similar influence in public perception about supporting or opposing higher taxes. In each variable, respondents who trust these officials “a lot” were willing to support paying higher taxes/or increased health spending than respondents who do not trust these institutions at all. Among those who trust the tax department, President, and MPs “a lot”, support for higher taxes rose up to (56%, 52%, and 53% respectively).
Most importantly, supporting the payment of higher taxes or user fees is somewhat dependent on how well citizens think their elected representatives are fulfilling their roles, how constituents perceived the integrity of their political leaders, responsiveness, and their commitment to serving the public interest (Isbell 2016). The results from Table 3 above also show that indeed support for taxes/fees is lower among respondents who think their leaders are motivated by self-interest (34%) than among those who see their leaders as serving the interests of the people (40%).
4.5. Correlations and a Multiple Linear Regression Showing Relationship between Public Perceptions and Support for Higher Taxes/Fees
Findings from the descriptive analysis in the sections above indicate that respondent’s willingness to pay or support paying user fees or higher taxes is associated with their perception of the current health care system in Ghana and people’s perception about the government performance, trustworthiness and perceived official corruption. In this section, correlations and multiple linear regression analysis were performed to better understand and estimate these associations by testing the statistical significance and association between the responses to a variety of questions. While the cross tabulation analysis Figure 4 above shows little if any association with views on taxes/fees and sociodemographic factors (gender, age, urban/rural residence, lived poverty, education, etc.), Table 4, Table 5, and Table 6 below summarize the results of correlation and a multiple linear regression analysis analyses on four thematic variable clusters—personal experience with the health system, trust in elected and non-elected leaders, perceptions of corruption, and performance evaluation of government.
Since the P-value in the ANOVA table is less than 0.05, there is a statistically significant relationship between the variables at 95.0% confidence level. The R-Squared statistic above indicates that the model is 83.26% fit to explain the relationship between public perceptions and support for taxes/fees. The adjusted R-squared statistic is 79.39%, which makes it more suitable for comparing models with different numbers of independent variables.
From the Table 6 above, it can be observed that, going without medical care and paying a bribe to obtain care, difficulty in obtaining medical care, educational level of respondents, and gender of respondents shows no significant relationship with support for higher taxes or user fees (p-value = 0.626; 0.240; 0.883; and 0.96 respectively). Occupation of respondents on the other hand showed a strong statistical relationship with paying of higher taxes (p-value = 0.003).
Also, from the results obtained in the multiple linear regression model, there is strong evidence that credibility of the government affects the rate at which Ghanaians meet their tax obligations. Specifically, the positive coefficient of trust in the President and the revenue agency implies that support for taxes and fees is enhanced whenever Ghanaians perceive the President and the tax department as more credible. The reverse is true in the case where the common perception of Ghanaians is that the President and the tax department cannot be trusted to utilize public funds for the common good. Also, perceptions that political officials care more about themselves rather than serving public interest is also significantly and negatively correlated with support for higher taxes (0.085**; p-value = 0.000). Thus, the more people perceive public officials and leaders as group who serve their own interest rather the interest of the populace, the less likely they will be willing to support paying higher taxes.
Again, it is evident that government’s performance can encourage a positive attitude toward taxes and fees. Improvement in the performance of the President and the ability of Members of Parliament (MPs) to fulfill their campaign promises has the propensity to garner support for taxes and fees in Ghana, all other things being equal. In relation to this is the fact that improvement in health facilities and services also results in greater willingness of Ghanaians to pay taxes and fees. Among these however, the performance of the President has the highest effect on tax support with a coefficient of 0.167. The only variable that has a negative impact on support for taxes and fees is the occupation of the respondent and corruption of the Office of the President. Apart from these variables, other factors which do not have a significant effect on the support for taxes and fees are inefficiencies in the medical system, trust in the Parliament, corruption of tax officials, corruption at the Office of the President and the education of respondent. Perceived corruption in the Office of the President and the tax department are negatively correlated with the payment of higher taxes/fees. The more respondents perceive these officials as corrupt, the less likely it is that they would support paying higher taxes for health spending (corruption at the tax department, −0.021; p-value = 0.003 and corruption of the Office of the President, −0.005; p-value = 0.001). Across all variables, public trust in the tax department and the President as well as performance evaluations of the President and MPs are most significantly associated and positively correlated with views on higher taxes or user fees to increase health spending while perceived official corruption in the Office of the President and amongst tax officials showed negative correlation with paying of higher taxes or user fees.
4.6. Discussion of Results
In this current study, I examined whether Ghanaians would support or oppose paying higher taxes or user fees in order to increase government spending on public health care. Specifically, the main objective this paper was to ascertain whether Ghanaians’ willingness to pay or not to pay higher tax are associated or correlated with demographic factors, access to health services, perceptions of health care, government performance, and perceived official corruption. Regarding the first objective of this paper which examines Ghanaians willingness to support or oppose higher taxes, the findings of the study showed that only 35% of the respondents were willing to support higher taxes to increase government spending on health care. Comparing Ghana to other African countries, the percentage of people willing to pay higher taxes remains low. For instance, previous studies from other African countries by Isbell (2016) have shown that citizens from Madagascar, Mozambique, Senegal, and Burkina Faso have rallied their support for higher taxes or user fees in exchange for increased health spending, led by Madagascar (59% “somewhat” or “strongly” support), Mozambique (57%), Senegal (57%), and Burkina Faso (56%). Previous studies from United States of America also indicate that at least 60% of Americans are willing to pay higher taxes to cover the uninsured (Hacker 2012). Despite inefficiencies in the Canadian health system, the 2002 national survey indicated that Canadians are willing to maintain quality and access to health care without large increases in taxes. Even though Canadians are aware of inefficiencies in the system, only about 1 in 3 Canadians supports tax increases to fund improvements to the system (Mendelsohn 2002). The findings of this current study support the findings from the national survey conducted in Canada. Even though the Ghanaian health system is struggling to maintain quality and access, public support for higher taxes is still low. Another objective of this study was to test whether Ghanaians’ willingness to pay or oppose higher taxes will be influenced by sociodemographic factors such as place of residence (rural vs. urban, level of education, and poverty level or income status). It was expected that respondents living in rural communities would oppose the payment of higher taxes due to disparities in development projects and provision of health care facilities. Previous studies in Ghana (see Salisu and Prinz 2009; Blanchet et al. 2012; Saeed and Abdul-Aziz 2013) have revealed that medical facilities are not evenly distributed across Ghana, with most rural areas lacking basic facilities such as hospitals and clinics as well as doctors and nurses. Ghanaians living in rural communities on average live about 16 km from a healthcare facility where they can consult a doctor, but half of the population lives within a 5-km radius. By the same token, the other half cannot consult a doctor within what corresponds to a one-hour walking distance, and one-quarter even lives more than 15 km from a facility where a doctor can be consulted. It was therefore expected that these difficulties will prevent them from the idea of higher paying higher taxes, however, it turns out that 45% of rural dwellers were willing to pay higher taxes than 37% of urban dwellers. This finding might result that rural dwellers in Ghana have recognized the challenges they face in accessing health care and as such willing to pay more taxes in order provide quality services to Ghanaian ruralites. Also in this study, gender and educational level did not show any significant association regarding the payment or opposition to higher taxes, however, occupation of respondents showed a strong statistical relationship with paying of higher taxes (p-value = 0.003).
It must be acknowledged that supporting or opposing the payment of higher taxes to finance health care might not only be influenced by people’s perception of the current challenges facing their health care system as well as demographic factors discussed above. It can be said that willingness to pay higher taxes can also be influenced by perceived corruption in government institutions, the overall performance of the government, as well as how well the people trust the government and institutions (Aiko et al. 2016; Armah-Attoh 2014). The outcome of this study shows that positive evaluations of the President’s and MPs’ job performance and that of the government’s handling and improving health services are all significantly and positively correlated with support for higher taxes or user fees. Perceptions that political officials care more about serving the public interest than their own ambitions are also significantly and positively correlated with support for higher taxes.
Also, perceived corruption in the Office of the President, Parliament, and the tax department are negatively correlated with views on higher taxes/fees. The more respondents perceive these officials as corrupt, the less likely they are to support increasing taxes for health spending. Similar findings have been found in Aiko and Logan (2014). In the study by Aiko and Logan (2014), it was revealed that though many Africans are willing to pay higher taxes, their willingness has been thwarted by the opaque tax system and official corruption. Similar to Aiko and Logan (2014), in this current study, it was revealed that personal experience with Ghana’s health system, sociodemographic variables, going without medical care, and paying a bribe to obtain care showed no significant correlation with support for higher taxes or user fees. However, perceptions related to government performance and trustworthiness show stronger correlations with views on taxes/fees. In this study, it can be seen that the more people show trust in institutions, the more likely they would be willing to higher taxes or user fees; trust President = 0.147**; trust Parliament = 0.121**; trust tax department = 0.136**; President performance = 0.136**; MP performance = 0.130**; leaders serving their own interest = 0.085**. Also, the more corruption in institutions and among public officials escalates, the less likely Ghanaians will be willing to support paying higher taxes since they might think their taxes may end up in the pocket of few individuals in the country. The above findings suggest that the government of Ghana needs to improve the transparency and accountability of revenue authorities and public institutions if Ghana wants to strengthen the foundations of a sound revenue system.
4.7. Limitations of the Study.
While this study contributes to the ongoing debate in Ghana towards universal health coverage, it is nevertheless without limitations. The main limitation of this paper can be found in the data set used for the analysis. All the analysis centers round the question… “if the government decided to make people pay more taxes or user fees, would you support this decision or oppose it?”. This question is very useful but means very different thing to different population. This is because, in Ghana only the formal sector pays payroll tax, so everyone else would agree on raising those taxes. Also, part of the population is exempt from VAT (given exemptions), and as such, user fees at present may be understood to mean fees paid for private services or fees paid by non-national health insurance beneficiaries at public hospitals. In short, questions relating to willingness to pay higher taxes or user fees needs to be tailored to the different populations in Ghana in the next round of Afrobarometer survey. Overall, the question is useful but does not give directions as to which taxes they will support or oppose. This is a limitation that hopefully future rounds of Afrobarometer can improve on.
5. Conclusions
Considering the recent struggle in the Ghanaian health sector, Ghanaian policy makers and donor agencies are confronted with rethinking how the health sector can be funded and sustained. Where budgetary decisions are heavily contested and politically expensive, one option may be to raise taxes or user fees to allow for increased spending on public health care. Findings from this study indicate that only (35%) of Ghanaians support the payment of higher taxes or user fees even though many Ghanaians have difficulties in accessing better health and medical care.
More importantly, the outcome of the study indicates that Ghanaians’ support for and opposition to higher taxes/fees are more powerfully influenced by perceptions of government performance and trustworthiness than by sociodemographic factors or difficulties in obtaining health care (President performance = 0.136**; MP performance = 0.130**; leaders serving their own interest = 0.085**; trust President = 0.147**; trust Parliament = 0.121**; trust tax department = 0.136**). Among all the demographic variables, only occupation of respondents showed strong statistical relationship with paying of higher taxes (p-value = 0.003). It is important to note that paying a bribe to obtain medical services was not seen to influence their perception (−0.022) rather than that of the corruption among tax officials and the President as well as his office. It can therefore be said that paying more user fees or taxes even in the form of an informal payment may not be what Ghanaians are opposing, but rather the perception that paying more taxes or user fees may not improve their current access to health care because taxes paid end up in the pocket of corrupt government officials. This implies that the willingness to pay higher taxes or user fees is motivated partly by transparency in the tax systems in Ghana. The findings here suggest that Ghanaians may be willing to bear the cost of higher taxes for better health care if they trust that the government will use the tax revenue for its intended purposes. Therefore, improving transparency and accountability among revenue authorities must therefore remain a cornerstone of efforts to strengthen domestic revenue generation in Ghana. Finally, improving popular access to information about taxes people owe and about public spending, while reducing corruption and misuse of public monies, will help encourage voluntary compliance and enhance government revenue generation in Ghana.
Supplementary Materials
The following are available online at www.mdpi.com/2076-0760/6/3/90/s1.
Acknowledgments
I wish to express my profound gratitude to Afrobarometer Ghana particularly their country partner, Center for Democratic Development (CDD-Ghana) for given me access to this data set for the study. I also acknowledge my colleagues especially, Taiwo Bello at the Department of History, University of Toronto, Paul Kenney Lawer at the University of Ghana for providing positive feedback on the initial drafts of this manuscript. Finally, I express my appreciation to the peer reviewers and the academic editor of this journal who pointed out areas I had initially overlooked.
Conflicts of Interest
The author declares no conflict of interest.
References
- Addae-Korankye, Alex. 2013. Challenges of financing health care in Ghana: The case of national health insurance scheme (NHIS). International Journal of Asian Social Science 3: 511–22. [Google Scholar]
- Ghana Round six data, 2015. Available online: http://www.afrobarometer.org/countries/ghana (accessed on 10 May 2017).
- Aiko, Rose, and Carolyn Logan. 2014. Africa’s willing taxpayers thwarted by opaque tax systems, corruption’. Afrobarometer Policy Paper. Available online: http://afrobarometer.org/sites/default/files/publications/Briefing%20paper/ab_r5_policypaperno7.pdf (accessed on 10 May 2017).
- Aiko, Rose, Hervé Akinocho, and Mogopodi Lekorwe. 2016. Job Performance of MPs, Local Councillors: Are Representatives Serving Voters or Themselves? Afrobarometer Dispatch No. 115. Available online: http://afrobarometer.org/publications/ad115-job-performance-mps-local-councillors-are-representatives-serving-voters-or-themselves (accessed on 10 May 2017).
- Akazili, James. 2010. Equity in Health Care Financing in Ghana. Doctoral dissertation, University of Cape Town, Cape Town, South Africa. [Google Scholar]
- Akazili, James, Bertha Garshong, Moses Aikins, John Gyapong, and Di McIntyre. 2012. Progressivity of health care financing and incidence of service benefits in Ghana. Health Policy and Planning 27: i13–i22. [Google Scholar] [CrossRef]
- Akazili, James, Paul Welaga, Ayaga Bawah, Fabian S. Achana, Abraham Oduro, John Koku Awoonor-Williams, John E. Williams, Moses Aikins, and James F. Phillips. 2014. Is Ghana’s pro-poor health insurance scheme really for the poor? Evidence from Northern Ghana. BMC Health Services Research 14: 637. [Google Scholar] [CrossRef] [PubMed]
- Akosua Akortsu, Mercy, and Patience Aseweh Abor. 2011. Financing public healthcare institutions in Ghana. Journal of Health Organization and Management 25: 128–41. [Google Scholar] [CrossRef] [PubMed]
- Apoya, Patrick, and Anna Marriott. 2011. Achieving a Shared Goal: Free Universal Health Care in Ghana. Accra: Alliance for Reproductive Health Rights, Essential Services Platform of Ghana, Integrated Social Development Centre and Oxfam International. [Google Scholar]
- Armah-Attoh, Daniel. 2014. Perceived corruption escalates, trust in institutions drops: A call for ordinary Ghanaians to get involved in the fight. Afrobarometer Dispatch No. 6. Available online: http://www.afrobarometer.org/fr/publications/ad6-perceived-corruption-escalates-trust-institutions-drops-call-ordinary-ghanaians-get (accessed on 7 June 2017).
- Armah-Attoh, Daniel, and Mohammed Awal. 2013. Tax administration in Ghana: Perceived institutional challenges. Afrobarometer, Briefing Paper 124. Available online: http://afrobarometer.org/sites/default/files/publications/Briefing%20paper/afrobriefno124.pdf (accessed on 7 June 2017).
- Blanchet, Nathan J., Günther Fink, and Isaac Osei-Akoto. 2012. The effect of Ghana’s National Health Insurance Scheme on health care utilisation. Ghana Medical Journal 46: 76–84. [Google Scholar] [PubMed]
- Borghi, Josephine, Ataguba John, Mtei Gemini, Akazili James, Meheus Filip, Rehnberg Clas, and Di Mcintyre. 2009. Methodological challenges in evaluating health care financing equity in data-poor contexts: lessons from Ghana, South Africa and Tanzania. In Innovations in Health System Finance in Developing and Transitional Economies. Bingley: Emerald Group Publishing Limited, pp. 133–56. [Google Scholar]
- Bryan, Lowell, Michael Conway, Tineke Keesmaat, Sorcha McKenna, and Ben Richardson. 2010. Strengthening subSaharan Africa’s Health Systems: A Practical Approach. McKinsey & Co. Available online: http://www.mckinsey.com/industries/healthcare-systems-and-services/ourinsights/strengthening-sub-saharan-africas-health-systems-a-practical-approach (accessed on 7 June 2017).
- Criel, Bart, Maria P. Waelkens, Werner Soors, Narayanan Devadasan, and Chris Atim. 2008. Community health insurance in developing countries. In International Encyclopedia of Public Health. Edited by K Huggehougen and S. Squah. San Deigo: Academic Press, vol. 1, pp. 782–91. [Google Scholar]
- Deaton, Angus S., and Robert Tortora. 2015. People in sub-Saharan Africa rate their health and health care among the lowest in the world. Health Affairs 34: 519–27. [Google Scholar] [CrossRef] [PubMed]
- Durairaj, Varatharajan, Selassi D’Almeida, and Joses Kirigia. 2010. Ghana’s Approach to Social Health Protection. Background paper for the 2010 World Health Report. Geneva: World Health Organization. [Google Scholar]
- Gottret, Pablo, and George Schieber. 2006. Health Financing Revisited: A Practitioner’s Guide. Washington: World Bank. [Google Scholar]
- Hacker, Jacob, ed. 2012. Health at Risk: America’s Ailing Health System--and How to Heal It. New York: Columbia University Press. [Google Scholar]
- Hendriks, Richard. 2010. National Health Insurance Ghana. Washington: World Bank, Accra: Ghana Ministry of Health. [Google Scholar]
- Isbell, Thomas. 2016. Are Africans willing to pay higher taxes or user fees for better health care? Afrobarometer Policy Paper, NO. 37. Available online: http://www.afrobarometer.org/publications/pp37-are-africans-willing-pay-higher-taxes-or-user-fees-better-health-care (accessed on 14 June 2017).
- Johnson, James A., and Carleen H. Stoskopf. 2009. Comparative Health Systems: Global Perspectives. Burlington: Jones and Bartlett Publishers. [Google Scholar]
- Kaseje, Dan. 2006. Health care in Africa: Challenges, opportunities and an emerging model for improvement. Available online: https://www.wilsoncenter.org/sites/default/files/Kaseje2.pdf (accessed on 7 June 2017).
- KPMG. 2012. The State of Healthcare in Africa. KPMG Africa Limited. Available online: http://www.kpmg.com/Africa/en/IssuesAndInsights/Articles-Publications/Documents/TheState-of-Healthcare-in-Africa.pdf (accessed on 7 June 2017).
- Martinez-Vazquez, Jorge. 2008. The Impact of Budgets on the Poor: Tax and Expenditure Benefit Incidence Analysis. In Public Finance for Poverty Reduction: Concepts and Case Studies from Africa and Latin America. Edited by B. Moreno-Dodson and W. Quentin. Washington: World Bank. [Google Scholar]
- McKay, Betsy. 2015. West Africa Struggles to Rebuild Its Ravaged Health-Care System. Wall Street Journal. June 4. Available online: http://www.wsj.com/articles/africa-struggles-to-rebuild-its-ravagedhealth-care-system-1433457230 (accessed on 7 June 2017).
- Mendelsohn, Mathew. 2002. Canadians’ Thoughts on Their Health Care System: Preserving the Canadian Model through Innovation. Commission on the Future of Health Care in Canada. Ontario: Queens University. [Google Scholar]
- Mensah, Joseph, Joseph Oppong, and Schmidt Christopher. 2010. An Evaluation of the Ghana National Health Insurance Scheme in the Context of the Health MDGs. Health Economics 19: 95. [Google Scholar] [CrossRef] [PubMed]
- Mills, Anne, John E. Ataguba, James Akazili, Jo Borghi, Bertha Garshong, Suzan Makawia, Gemini Mtei, Bronwyn Harris, Jane Macha, Filip Meheus, and et al. 2012. Equity in financing and use of health care in Ghana, South Africa, and Tanzania: implications for paths to universal coverage. The Lancet 380: 126–33. [Google Scholar] [CrossRef]
- Ministerial Task Team. 2002. Policy Framework for Establishment of Health Insurance in Ghana; Accra: Ministry of Health.
- Ministry of Health. 2008. Draft Report-Ghana Annual Independent Health Sector Review; Accra: Ministry of Health.
- NDPC (National Development Planning Commission). 2009. 2008 Citizens’ Assessment of the National Health Insurance Scheme; Accra: National Development Planning Commission.
- Netherlands Enterprise Agency. 2015. Sector Report Health and Life Sciences Ghana. Available online: http://ghana.nlembassy.org/binaries/content/assets/postenweb/g/ghana/ambassade-van-het-koninkrijk-der-nederlanden-in-accra/import/producten_en_diensten/health-sector-report-ghana-2015-rvo.pdf (accessed on 7 June 2017).
- Nyonator, Frank. 2010a. District Mutual Health Insurance Scheme Operations in Ghana: Key Operational Components, Quality Assurance and Challenges. PowerPoint presentation. Washington: World Bank Institute. [Google Scholar]
- Nyonator, Frank. 2010b. Establishment and Governance of the National Health Insurance Scheme (NHIS) Based on District Mutual Health Insurance Schemes. PowerPoint presentation. Washington: World Bank Institute. [Google Scholar]
- Nyonator, Frank. 2010c. Ghana Case Study. Washington: World Bank Institute Health Reform Flagship Course. [Google Scholar]
- Nyonator, Frank, and Joseph Kutzin. 1999. Health for some?: The effects of user fees in volta region of Ghana. Health Policy and Planning 14: 329–41. [Google Scholar] [CrossRef] [PubMed]
- OECD (Organisation for Economic Co-operation and Development). 2016. Development Centre and the African Development Bank. African Economic Outlook. Available online: https://www.afdb.org/fileadmin/uploads/afdb/Documents/Publications/AEO_2016_Report_Full_English.pdf (accessed on 10 May 2017).
- Owusu-Sekyere, Ebenezer, and Daniel A. Bagah. 2014. Towards a sustainable health care financing in Ghana: is the national health insurance the solution? Public Health Research 4: 185–94. [Google Scholar]
- Price Water House Coopers. 2008. 2008 Tax Facts and Figures: A quick guide to Taxation in Ghana. Available online: https://www.pwc.com/gh/en/pdf/tax-facts-and-figures-2008.pdf (accessed on 22 June 2017).
- Price WaterHouse Coopers. 2009. 2009 Tax Facts and Figures: A quick guide to Taxation in Ghana. Available online: https://www.pwc.com/gh/en/pdf/tax-facts-and-figures-2009.pdf (accessed on 22 June 2017).
- Ramachandra, Paul Shaw, and William Hsiao. 2007. Ghana: Initiating Social Health Insurance. Social Health Insurance for Developing Countries. Edited by W. Hsiao and P. Shaw. Washington: The World Bank. [Google Scholar]
- Saeed, Bashiru II, and A. R. Abdul-Aziz. 2013. Assessing the influential factors on the use of healthcare: Evidence from Ghana. International Journal of Business and Social Science 4: 12–20. [Google Scholar]
- Salisu, Abdallah, and Vanessa Prinz. 2009. Health Care in Ghana, Austrian Centre for Country of Origin and Assylum Research and Documentation (ACCORD). Available online: www.ecoi.net (accessed on 28 May 2017).
- Schieber George, Cheryl Cashin, Karima Saleh, and Rouselle Lavado. 2012. Health Financing in Ghana. Washington: World Bank Publications. [Google Scholar] [CrossRef]
- Streefland, Pieter. 2005. Public health care under pressure in sub-Saharan Africa. Health Policy 71: 375–82. [Google Scholar] [CrossRef] [PubMed]
- World Bank. 2011. Republic of Ghana: Joint Review of Public Expenditure and Financial Management. Washington: Africa Region. [Google Scholar]
- World Bank. 2017. African Development Indicators 2017. Washington: World Bank Group. [Google Scholar]
- Yevutsey, Saviour K., and Moses Aikins. 2010. Financial viability of district mutual health insurance schemes of lawra and sissala East districts, Upper West Region, Ghana. Ghana Medical Journal 44. [Google Scholar] [CrossRef]
Figure 1.
Availability of health services; 2014/2015: Source: Author’s construct.
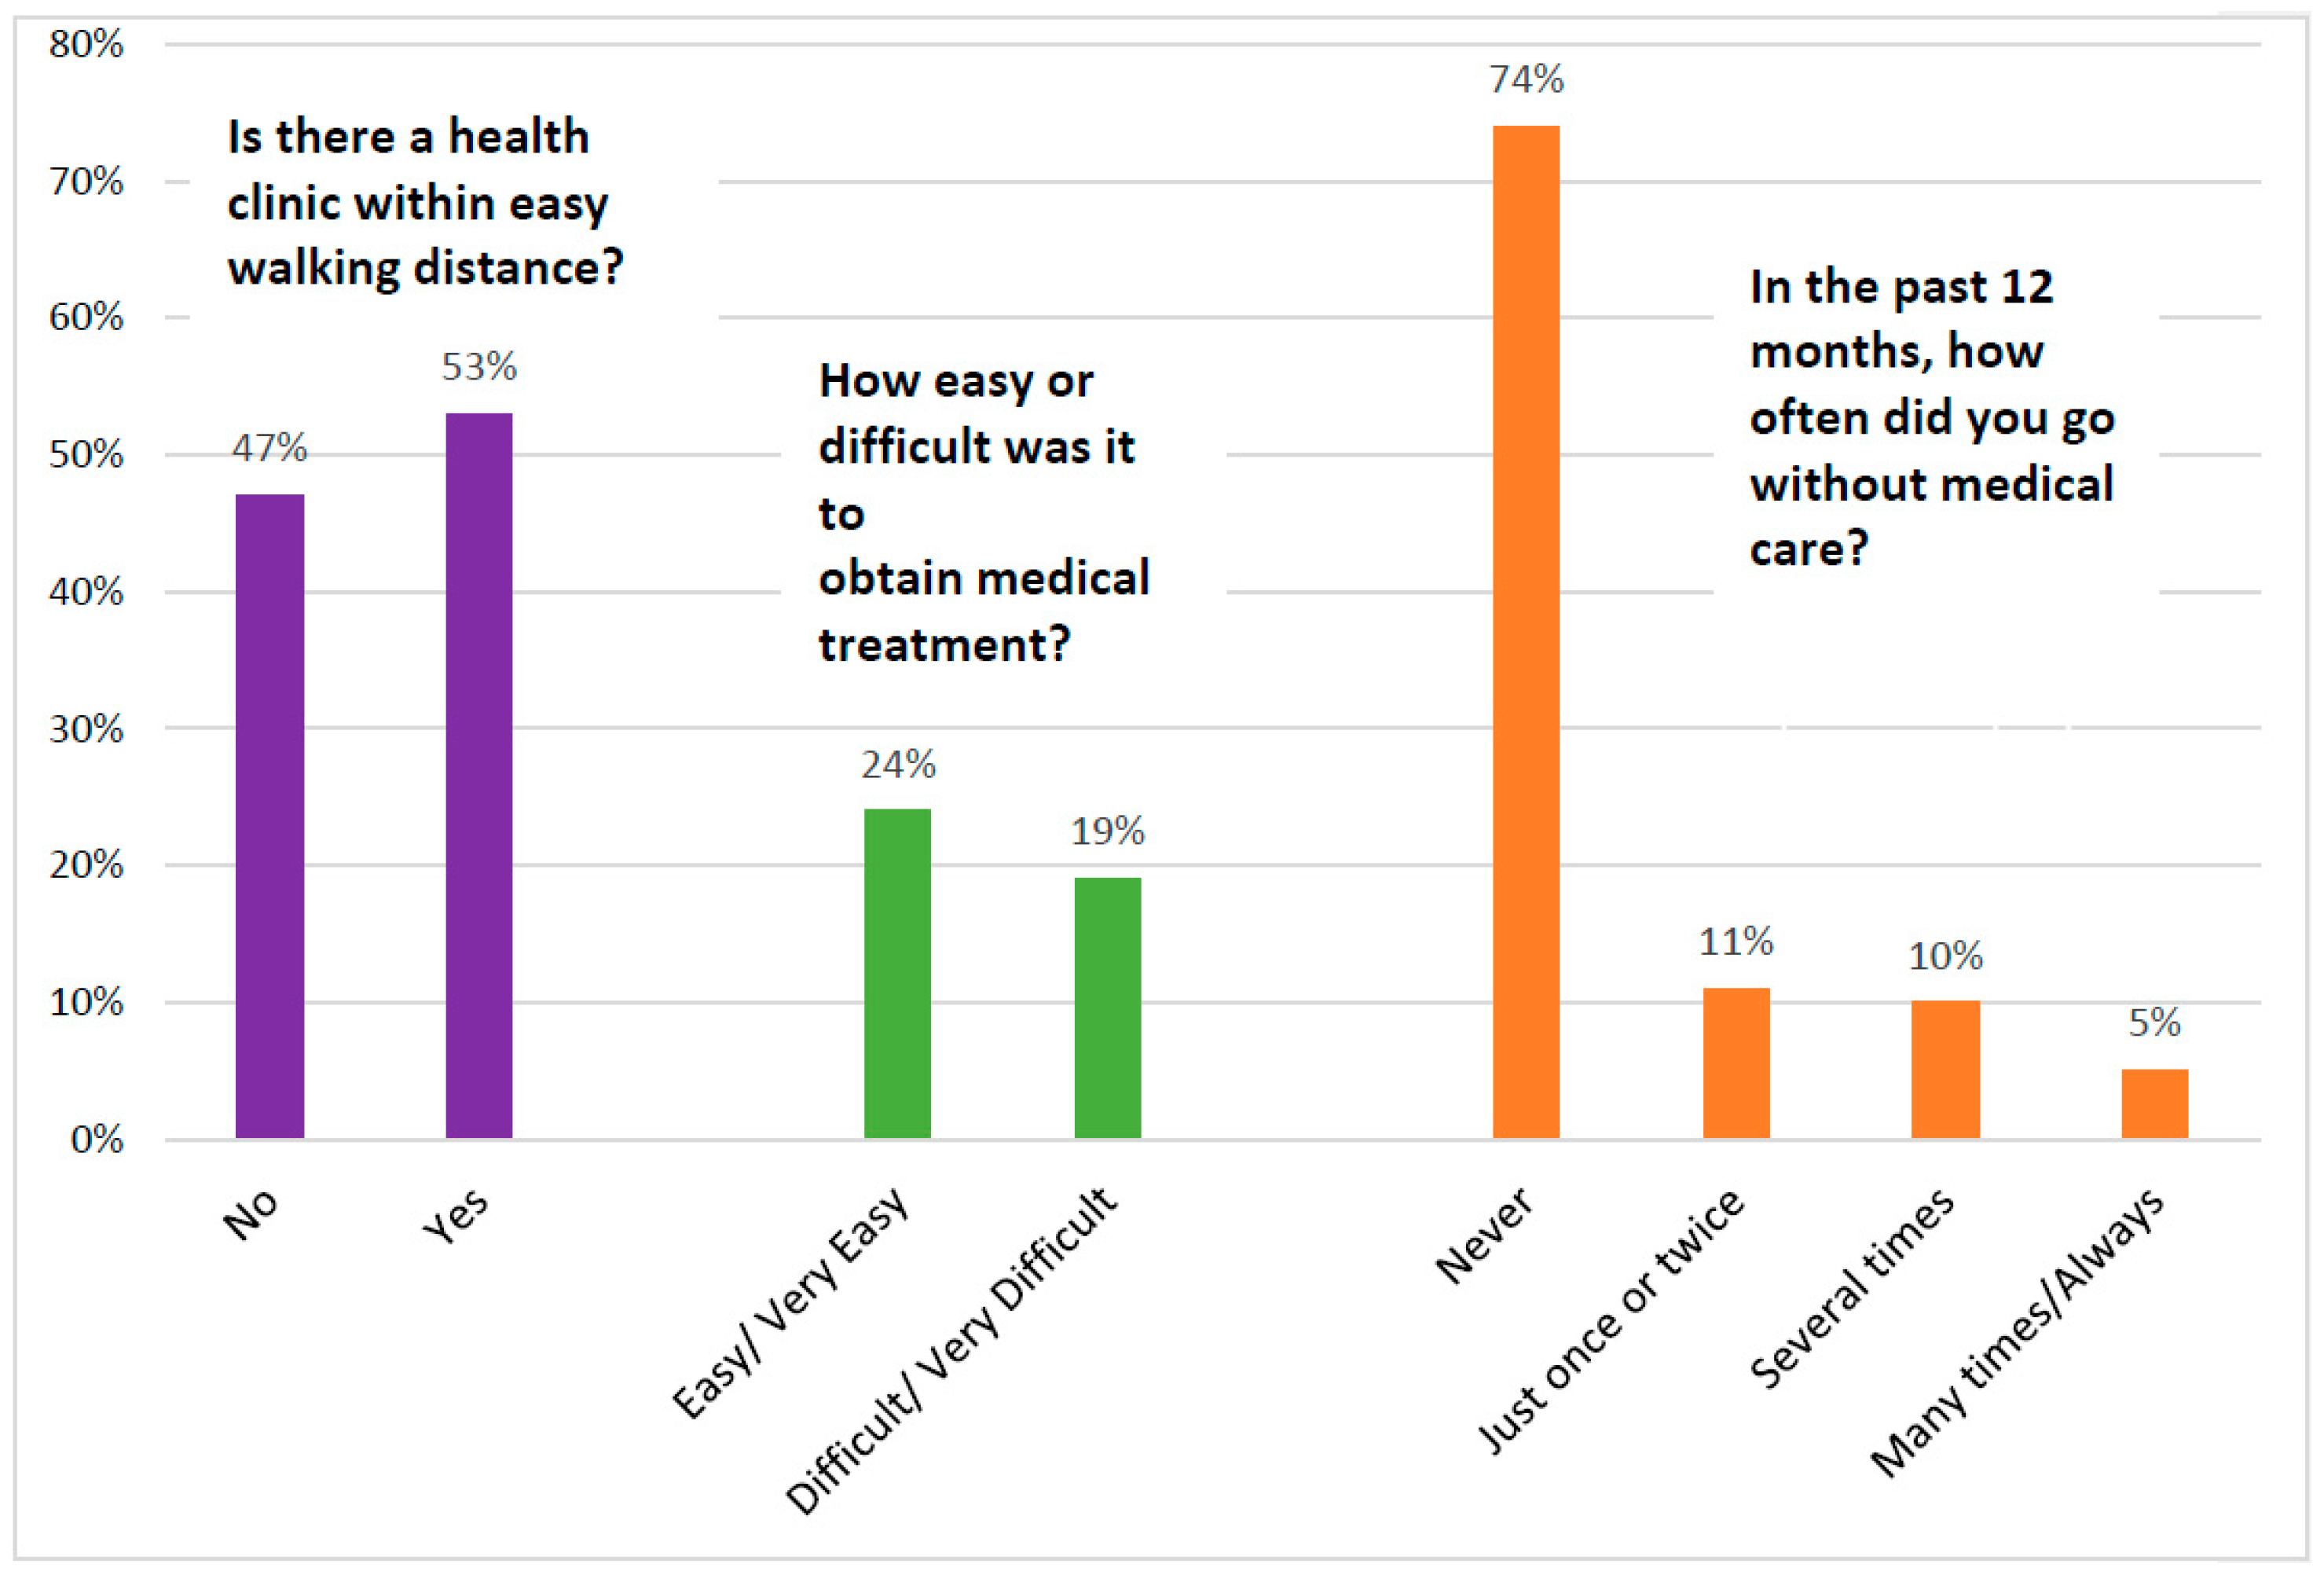
Figure 2.
Availability of health services, urban vs. rural areas-2014/2015; Source: Author’s construct.
Figure 2.
Availability of health services, urban vs. rural areas-2014/2015; Source: Author’s construct.
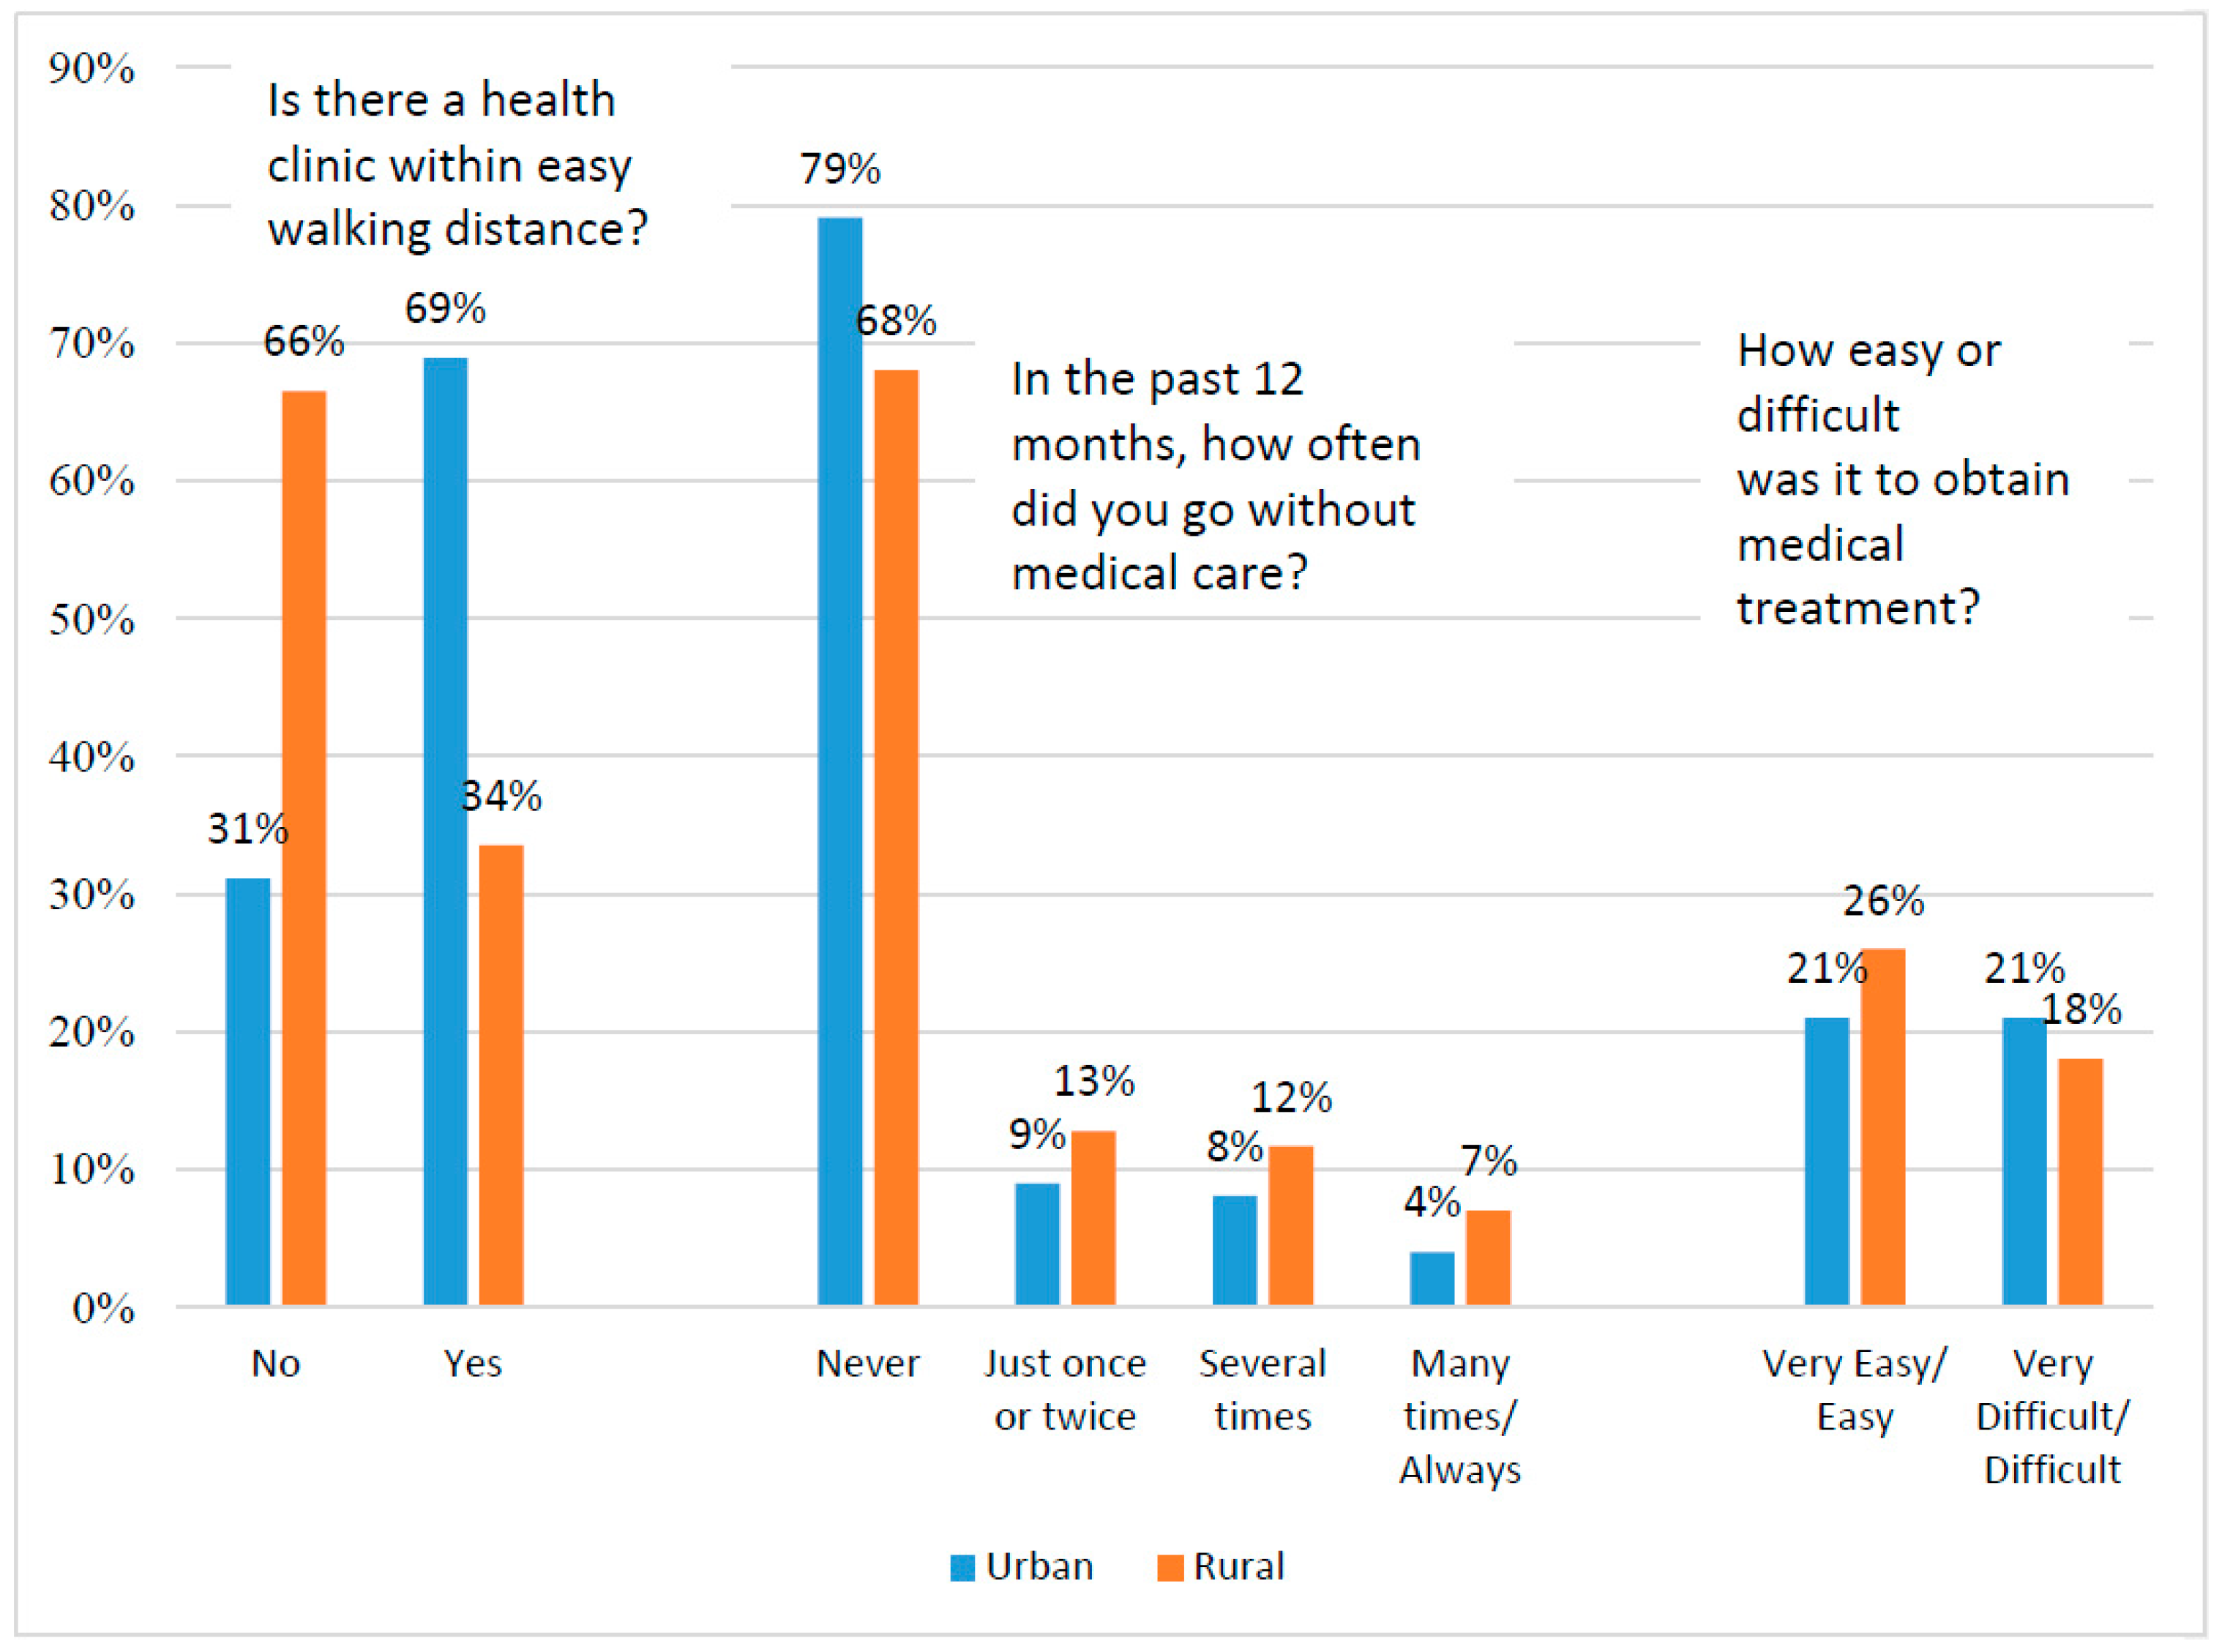
Figure 3.
Willingness to pay more taxes or user fees for higher health spending: Source: Author’s construct.
Figure 3.
Willingness to pay more taxes or user fees for higher health spending: Source: Author’s construct.

Figure 4.
Support for taxes/fees by sociodemographic factors; Source: Author’s construct.

Figure 5.
Support for higher taxes/fees and access to health services; Source: Author’s construct.

Table 1.
Chronological Development of Health Care Financing in Ghana.
| Year | Event | Rationale | Features | Sources of Financing | Results |
|---|---|---|---|---|---|
| 1957 | Introduction of a national health service modeled after the British system | -Driven by early economic performance, natural resources, and a strong export base | Everyone entitled to free health care -Health care delivery through a network of publicly owned facilities | General revenue | Not sustainable with the decline in economic performance, the scheme proved to be too expensive |
| 1985 | Co-payments introduced | -Co-payments for services | Co-payments for services -Health care delivery through a network of publicly government-owned owned facilities | General revenue and user fees | Out-of-pocket user charges from partial-to-full recovery |
| 1992 | Cash-and-carry system instituted | -To increase funds for providers -To make fee recovery legal -To restrict unnecessary use | Full cost recovery for drugs -Reduced fees for children and primary care facilities | General revenue and user fees | Outpatient visits dropped by 66% |
| Early 1990s | Voluntary mutual health insurance organization movement | -Heavy cash-and-carry burden -Lack of social protection mechanisms -Lack of government oversight of the informal sector | -Subsidization of the vulnerable by the better off -Social protection against the impoverishing cost of illness | Donors such as the DANIDA and USAID -Community | -Reduced gap between those covered and those not covered -Paved the way for spread of MHOs |
| Early 2000s | Profusion of MHOs | -Trend in other African nations -Success of initial MHOs in Ghana -Encouragement by the Ministry of Health | -Spread across 67 out of 138 districts in 10 regions -Diverse in management styles and benefits -Based on district or occupation or religion or gender | -Donors such as the DANIDA and USAID -Community | -Financial protection and health services access for poor -Model for covering larger parts of the population |
| 2003 | National mandatory health insurance reform | Relative success of the MHOs -Agenda of the ruling government (election platform) | -Abolish cash and carry -Introduced mandatory health insurance -Expand coverage through MHOs in all districts | -Nation health insurance levy (NHIL)-2.5% VAT -2.5% of SSNT state budget transfers -Returns on investment made by the National Insurance Council -Voluntary contributions | -National Health Insurance Council set up -Interim administration arrangements introduced -Move toward 90 district mutual health schemes |
Source: (Ramachandra and Hsiao 2007; Akazili 2010).
Table 2.
Graduated premium arrangement.
| Group | Category of Population with the Group | Amount | |
|---|---|---|---|
| Core Poor | A | Adults who are unemployed and do not receive any identifiable and constant support from elsewhere for survival. | Free |
| Very Poor | B | Adults who are unemployed but receive identifiable and consistent financial support from sources of low income | Gh 72 |
| Poor | C | Adults who are employed but receive low returns for their efforts and are unable to meet their basic needs | |
| Middle Income | D | Adults who are employed and able to meet their basic needs | Gh 180 |
| Rich | E | Adults who are able to meet their basic needs and some of their wants. | Gh 480 |
| Very Rich | F | Adults who are able to meet their needs and most of their wants. |
Source: (Ministerial Task Team 2002; Akazili 2010).
Table 3.
Support for taxes/fees for health spending.
| Public Perception | Strongly/Somewhat Oppose | Strongly/Somewhat Support |
|---|---|---|
| Government handling of improving basic health services | ||
| Fairly/Very badly | 53% | 34% |
| Fairly/Very well | 34% | 52% |
| President overall job performance | ||
| Disapprove/Strongly disapprove | 53% | 30% |
| Approve/Strongly approve | 34% | 43% |
| MP overall job performance | ||
| Disapprove/Strongly disapprove | 51% | 31% |
| Approve/Strongly approve | 37% | 43% |
| Trust in President | ||
| Not at all | 56% | 33% |
| Just a little/Somewhat | 43% | 35% |
| A lot | 35% | 52% |
| Trust in Parliament | ||
| Not at all | 52% | 38% |
| Just a little/Somewhat | 13% | 34% |
| A lot | 35% | 53% |
| Trust in tax department | ||
| Not at all | 53% | 35% |
| Just a little/Somewhat | 13% | 35% |
| A lot | 31% | 56% |
| Leaders serve their own ambitions or the people | ||
| Ambitions—agree/strongly agree | 11% | 34% |
| The people—agree/strongly agree | 16% | 40% |
Source: Author’s construct.
Table 4.
Correlations between public perceptions and support for taxes/fees.
| Pearson Correlation | |
|---|---|
| How often gone without medical care | 0.003 |
| Difficulty to obtain medical treatment | −0.034 |
| Pay bribe for treatment at public clinic or hospital | −0.022 |
| Trust President | 0.147 ** |
| Trust Parliament/National Assembly | 0.121 ** |
| Trust tax department | 0.136 ** |
| Corruption: Office of the President | −0.005 |
| Corruption: Members of Parliament | 0.033 |
| Corruption: tax officials | 0.021 |
| Gov’t handling improving basic health services | 0.014 |
| Performance: President | 0.136 ** |
| Performance: MP/National Assembly rep. | 0.130 ** |
| Leaders serve interests of people or their own | -0.085 ** |
| Occupation of respondent | −0.068 ** |
| Education of respondent | −0.063 ** |
| Gender of respondent | 0.050 * |
Source: Author’s construct. **. Correlation is significant at p < 0.01 level (2-tailed). *. Correlation is significant at p < 0.05 level (2-tailed).
Table 5.
A multiple linear regression ANOVA model describing the relationship between public perceptions and support for taxes/fees.
Table 5.
A multiple linear regression ANOVA model describing the relationship between public perceptions and support for taxes/fees.
| Sum of Squares | df | Mean Square | F-Value | p-Value | |
|---|---|---|---|---|---|
| Regression | 474.170 | 15 | 31.611 | 8.110 | 0.000 |
| Residual | 9292.161 | 2384 | 3.898 | ||
| Total | 9766.331 | 2399 |
Source: Author’s construct. R-square = 0.8326; Adjusted R-square = 0.7939.
Table 6.
A multiple linear regression analysis showing relationship between public perceptions and support for taxes/fees.
Table 6.
A multiple linear regression analysis showing relationship between public perceptions and support for taxes/fees.
| Variables | Coefficient | Std. Error | T-Statistics | p-Value |
|---|---|---|---|---|
| Constant | 2.864 | 0.215 | 13.310 | 0.000 |
| How often gone without medical care | −0.009 | 0.040 | −0.222 | 0.824 |
| Difficulty to obtain medical treatment | −0.083 | 0.057 | −1.470 | 0.142 |
| Pay bribe for treatment at public clinic or hospital | 0.044 | 0.039 | 1.107 | 0.268 |
| Trust President | 0.096 | 0.025 | 3.868 | 0.000 |
| Trust Parliament/National Assembly | −0.003 | 0.034 | −0.074 | 0.941 |
| Trust tax department | 0.075 | 0.021 | 3.601 | 0.000 |
| Corruption: Office of the President | −0.052 | 0.024 | −2.169 | 0.030 |
| Corruption: tax officials | 0.003 | 0.026 | 0.104 | 0.917 |
| Ruling vs. opposition: improving health | 0.069 | 0.014 | 4.828 | 0.000 |
| Performance: President | 0.167 | 0.021 | 7.927 | 0.000 |
| Performance: MP/National Assembly rep. | 0.012 | 0.019 | 0.636 | 0.003 |
| Leaders serve interests of people or their own | 0.074 | 0.017 | 4.422 | 0.000 |
| Occupation of respondent | −0.006 | 0.002 | −2.952 | 0.003 |
| Education of respondent | −0.018 | 0.012 | −1.543 | 0.123 |
| Gender of respondent | 0.179 | 0.082 | 2.195 | 0.028 |
Notes: Source: Author’s construct; The bold figures show the variables that are significant.
© 2017 by the author. Licensee MDPI, Basel, Switzerland. This article is an open access article distributed under the terms and conditions of the Creative Commons Attribution (CC BY) license (http://creativecommons.org/licenses/by/4.0/).
Share and Cite
MDPI and ACS Style
Adisah-Atta, I. Financing Health Care in Ghana: Are Ghanaians Willing to Pay Higher Taxes for Better Health Care? Findings from Afrobarometer. Soc. Sci. 2017, 6, 90. https://doi.org/10.3390/socsci6030090
AMA Style
Adisah-Atta I. Financing Health Care in Ghana: Are Ghanaians Willing to Pay Higher Taxes for Better Health Care? Findings from Afrobarometer. Social Sciences. 2017; 6(3):90. https://doi.org/10.3390/socsci6030090
Chicago/Turabian StyleAdisah-Atta, Isaac. 2017. "Financing Health Care in Ghana: Are Ghanaians Willing to Pay Higher Taxes for Better Health Care? Findings from Afrobarometer" Social Sciences 6, no. 3: 90. https://doi.org/10.3390/socsci6030090
Note that from the first issue of 2016, this journal uses article numbers instead of page numbers. See further details here.