Article

Exploring Landscape Engagement through a Participatory Touch Table Approach

Social, Economic and Geographical Sciences Group, The James Hutton Institute, Craigiebuckler, Aberdeen AB15 8QH, UK
*
Author to whom correspondence should be addressed.
Soc. Sci. 2017, 6(4), 118; https://doi.org/10.3390/socsci6040118
Submission received: 27 July 2017 / Revised: 25 September 2017 / Accepted: 28 September 2017 / Published: 3 October 2017

Abstract

:
Governments and national bodies are increasingly concerned with promoting outdoor activity as a means to benefit general health and wellbeing. Techniques to encourage and popularize engagement with the outdoor environment should therefore be welcome. This paper explores the use of a touch table as a method to facilitate discussions about people’s engagement with rural and urban landscapes through recreational walking. We describe a study in north-east Scotland involving 22 participants who undertook walks of their choice using GPS smartphone applications to track their routes. Tracked routes were uploaded to a touch table and small group sessions explored spatial behavior in, and perceptions and knowledge of, local landscapes. Individual interviews 4–6 weeks later elicited reflections on the touch table session and personal engagement with the landscape. Two types of findings are reported: (i) observations and recommendations relating to the use of a touch table in combination with GPS applications; and (ii) knowledge exchange and insights afforded by group discussion and individual reflection. We conclude that our approach is a promising participatory method through which to investigate spatial behavior and promote recreational opportunities in the landscape.

1. Introduction

Touch tables are large user-friendly surface computers similar to hand-held tablet devices, capable of supporting multi-touch applications. Touch tables make it possible for people to share, collaborate and explore together using large screens that react to fingers, hands and other objects placed on the screen.
Although still a relatively novel technology, touch tables are increasingly used in a variety of contexts. Touch tables can be found in airports, hotels and showrooms as a means of providing local information and advertising products. The ubiquity of touch-based devices such as tablets and smartphones mean that touch tables are non-threatening and appealing devices with which to engage. As Ryall et al. (2006) observe, people seem to find touch tables and their applications “less intimidating, and often more playful, than a traditional computer desktop environment.” (p. 95).
This paper reports on a study using a touch table to explore spatial behavior in the local landscape, and as a method to facilitate discussions about people’s perceptions and knowledge of local landscapes. This research sits within a policy and practice context of efforts to increase engagement with natural environments for individual, social and community health and wellbeing. It contributes to a broader portfolio of research on people-environment studies (e.g., Bechtel and Churchman 2002), and particularly to the literature on novel mobile and visual methodologies for exploring and understanding the experience of place.
An overview of touch table research in different areas is provided in the next section, followed by an overview of mobile and visual methods.

1.1. Touch Table Research Areas

In public spaces such as museums and galleries touch tables can be a means of enhancing and enriching interaction with collections (Ciocca et al. 2012; Patsoule 2014), and are popular with visitors, especially younger age groups (Hinrichs and Carpendale 2011; Hornecker 2008; Ch’ng 2012; Zaharias et al. 2013). Research in public settings such as museums has often focused on the ways in which people approach and engage with touch table displays (e.g., (Hornecker 2008; Hinrichs and Carpendale 2011)) but there is also some evidence that use of interactive touch tables in museums can lead to deeper intellectual engagement than occurs otherwise. For example, Horn et al. (2016) found that pairs of children (8–15 years old) who interacted with a touch table exhibit about evolutionary concepts showed learning gains over children who watched a video on the same topic. The authors observed that activation of relevant exhibit functions on the touch table, together with conversation about the information presented contribute to this deeper learning experience. They also found that the degree of affective engagement with the information presented on the touch table (as evidenced by affect words such as ‘wow’ and ‘cool’) was significantly correlated with learning.
Touch tables have also been utilised within museum and gallery environments as a platform with which to conduct ‘crowd behavior mining’, a form of behavioural crowdsourcing whereby visitors become active participants in helping to model past human behaviours in the landscape (Ch’ng 2015; Ch’ng et al. 2016). Displaying lost or ancient landscapes such Stonehenge on a touch table, and enabling participants to interact with these environments and make the types of choices and decisions that ancient peoples had to make provides valuable insights to the historical and archaeological research communities.
Within educational settings there is evidence that touch tables can facilitate more effective collaborative learning, compared to traditional pen and paper methods. For example, Higgins et al. (2012) found that groups of 10–11 year old children using a touch table to complete a collaborative history task performed better than those using pen and paper. They argue that the ability to have several people interact with the touch table at once was fundamental to creating an environment conducive to collaborative interaction, and that it was beneficial that attention was focused on one single plane (the touch table screen). Falcones et al. (2016) compared use of a touch table with pencil and paper for collaborative computer science design activities and similarly found that students exceeded over their peers in relation to their quality and intensity of argumentation. Clayphan et al. (2016) compared brainstorming in groups of design students using touch tables or pen and paper and again found that using touch tables was more effective. Interestingly they also found the use of vertical digital displays to be more effective than pen and paper, but that for affective measures (i.e., those dealing with emotions and attitudes) horizontal touch tables were better.
In land, marine and urban planning, touch tables have been demonstrated to be particularly valuable as decision support tools involving different stakeholder groups. Bringing people together around large digital maps presented on a touch table, and enabling additional information to be viewed or added through different digital layers facilitates both understanding and information sharing and gathering. For example, Bhandari et al. (2010) employed a touch table with geographic information systems (GIS) software enabling freehand drawing over maps to allow stakeholders to collaboratively design forest biolink areas. Arciniegas and Janssen (2012) used a touch table in a similar way in peat-meadow polder planning workshops in the Netherlands. Areas of conflict for a potential site for tidal renewable energy in Scotland were captured and explored on a touch table by Alexander et al. (2012), and urban development conflicts have also been facilitated through meeting around digital maps on a touch table (e.g., (Pelzer et al. 2013; Lay 2013)).

1.2. Mobile and Visual Research Methods

Mobile methods are research methods which focus on the ‘observation of people’s movement…observing directly or in digitally enhanced forms mobile bodies undergoing various performances of travel, work and play’ (Sheller and Urry 2006, p. 217). Ricketts Hein et al. (2008) define mobile methodologies as those which:
seek to use movement as part of the research approach itself, so that generally the researcher is mobile and thus either follows the subject through space, or makes the subject mobile for the purposes of the research’.
(p. 1269)
The term can therefore be applied to a wide range of methodologies including mobile forms of interviewing such as go-alongs or walking interviews (Carpiano 2009; Evans and Jones 2011), Global Positioning System (GPS) tracking and ‘geo-narratives’ (Bell et al. 2015), and mobile video ethnography (Brown and Banks 2014) amongst other methods. Mobile forms of qualitative research are increasingly being adopted in studies of place (Evans and Jones 2011) and have been described as offering ‘a unique means of obtaining contextually based information about how people experience their local world’ (Carpiano 2009, p. 271) as well as offering views into the role that mobility plays in place-making practices (Ross et al. 2009). The increasing popularity of mobile methods may be seen to reflect a wider turn towards theory and methods emphasising movement and mobility that has been characterised as a ‘new mobilities paradigm’ in the social sciences (Sheller and Urry 2006). This paradigmatic shift is at least partly underpinned by the emergence of both technologies contributing to increasing mobility and distance communication, and those enabling novel approaches to researching the mobile aspects of everyday life (such as mobile phones, GPS trackers, GIS applications, action cameras) (Evans and Jones 2011; Ricketts Hein et al. 2008).
Visual methods encompass a broad range of research approaches and techniques employing visual inputs and/or outputs (Pauwels 2011). These include (but are not limited to) methods using or generating: photographic materials e.g., in participatory photographic and photo-elicitation techniques (Stedman et al. 2014); video materials e.g., participant-generated videos using point-of-view (POV) cameras (Brown and Banks 2014); or computer-aided visualisations e.g., of landscape change (Laing et al. 2009) or interactive maps (Collins 2011).
We undertook a study combining participatory mobile and visual methodological elements to investigate the use of a touch table as a means to promote dialogue and knowledge sharing about local landscapes, and to understand engagement with local landscapes/nature. Participants tracked the route of a walk of their choice using a GPS smartphone application. The routes were uploaded to an interactive map on a touch table and participants viewed and discussed their routes in small groups around the touch table. The main study aims were:
  • To identify the practical issues around using a touch table as a visual tool to display and communicate participant-generated spatial behaviour.
  • To gain an understanding of the shared knowledge building about use of and engagement with the landscape that might be elicited through group discussion around this visual tool.
  • To elicit any evidence for changes in recreational walking behaviour following the touch table session.

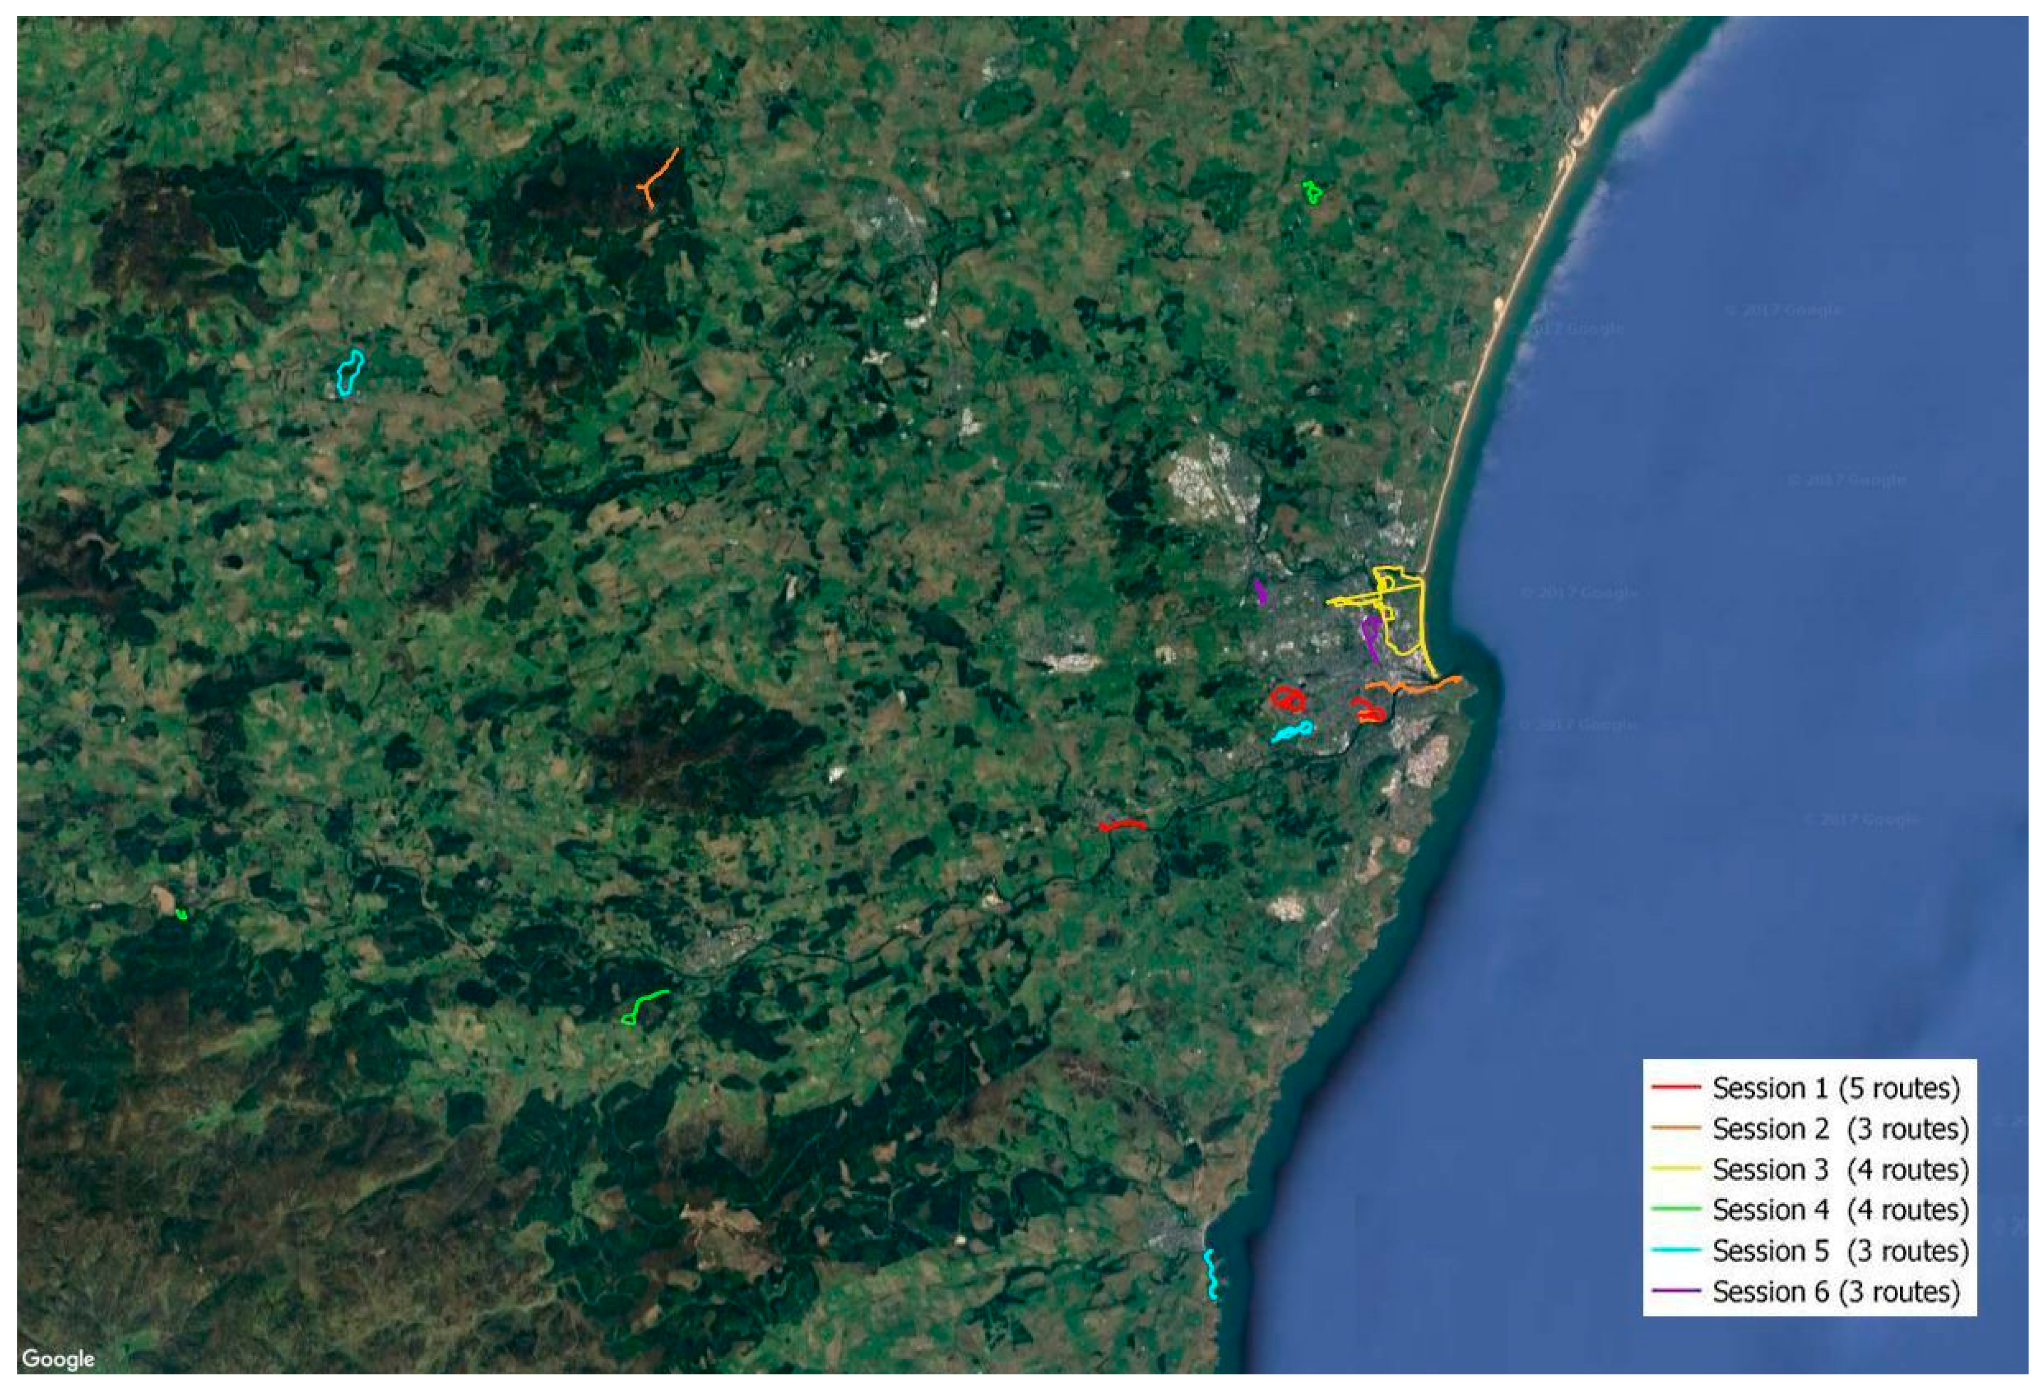
2. Method and Materials

Recruitment to the study was through e-mail advertisement at a large research organization (n = 300) in north-east Scotland. Twenty-two individuals (15 female, 7 male) ranging in age from 24 to 63 participated in the study; all except 3 were researchers on land-based issues. Most participants knew one another; the majority were not originally from north-east Scotland. All participants gave their informed consent for inclusion before they participated in the study. The study was conducted in accordance with the Declaration of Helsinki, and the protocol was approved by the Ethics Committee of The James Hutton Institute (#40/2015).
Participants were provided instructions on how to install one of two different free GPS applications (Map My Tracks for iPhones; My Tracks for Android phones) on their smartphones for tracking their walks, and how to export these tracks to the researchers. Alternative applications of the participants’ choice could be used as long as tracks could be exported to the researchers in a usable format, for example .gpx or .kml.
Participants were instructed to take a favourite recreational walk (minimum 30 min; maximum 2 h) of their choice in a familiar location in or around their local area, and to send the tracked route back to the researchers. The participants’ walks covered a mix of urban and rural areas within Aberdeen City and Aberdeenshire (see Figure 1).
Following receipt of walks taken, participants were divided into small groups (3–5 people) for a touch table session. Routes for each group session were uploaded into the web mapping service Bing Maps which was running on the touch table. The routes were overlaid onto an aerial photographic map, with the possibility remaining for participants to choose to switch to road map or Ordnance Survey display mode. The touch table was a 40” Samsung SUR40 using Microsoft PixelSense™ to sense fingers and objects touching the screen. Six 1-h sessions were run. Sessions were video and voice recorded so that the group discussion could be analysed.
At the start of each session, the map was centred over the middle of Aberdeen city, where no one had walked. Participants were asked to locate their own walks in turn, which necessitated zooming out and panning, enabling them to get used to interacting with the touch table.
Participants were asked to briefly describe their start and end points, whether they were on their own or with a friend/family member/dog, and why they chose this particular walk. Once all the participants had done this, conversation progressed in a participant-led manner, to enable the researchers to understand what landscape engagement topics were of most importance to participants. If conversation faltered, the researchers prompted the participants with questions regarding people’s favourite season in which to do their walk, and favourite/least liked parts of their walks. Four to six weeks later participants took part in 10-min semi-structured individual interviews to elicit their reflections on the touch table session and any evidence of behaviour change in terms of undertaking new walks.

3. Results

The 22 routes our participants took are shown on one map in Figure 1. The walking routes ranged in distance from 2.1 km to 15.83 km. The mean distance was 4.66 km, and the median was 3.65 km. The majority of the walks (18) were taken inside the Aberdeen City boundary, with the remainder being taken in the more rural surroundings of Aberdeenshire. Nearly all of the routes were local to where participants lived or worked, with only 4 participants travelling by car or bicycle to their route starting point.
The walking routes were divided into 6 sessions. Three of these sessions contained only urban walks (Sessions 1, 3 and 6), one contained only rural walks (Session 4), and two contained a mix of both urban and rural walks (Sessions 2 and 5). Two of the urban walk sessions (1 and 3) contained routes (or parts of routes) that had been walked by more than one participant in the session, while the other sessions shared no common routes.

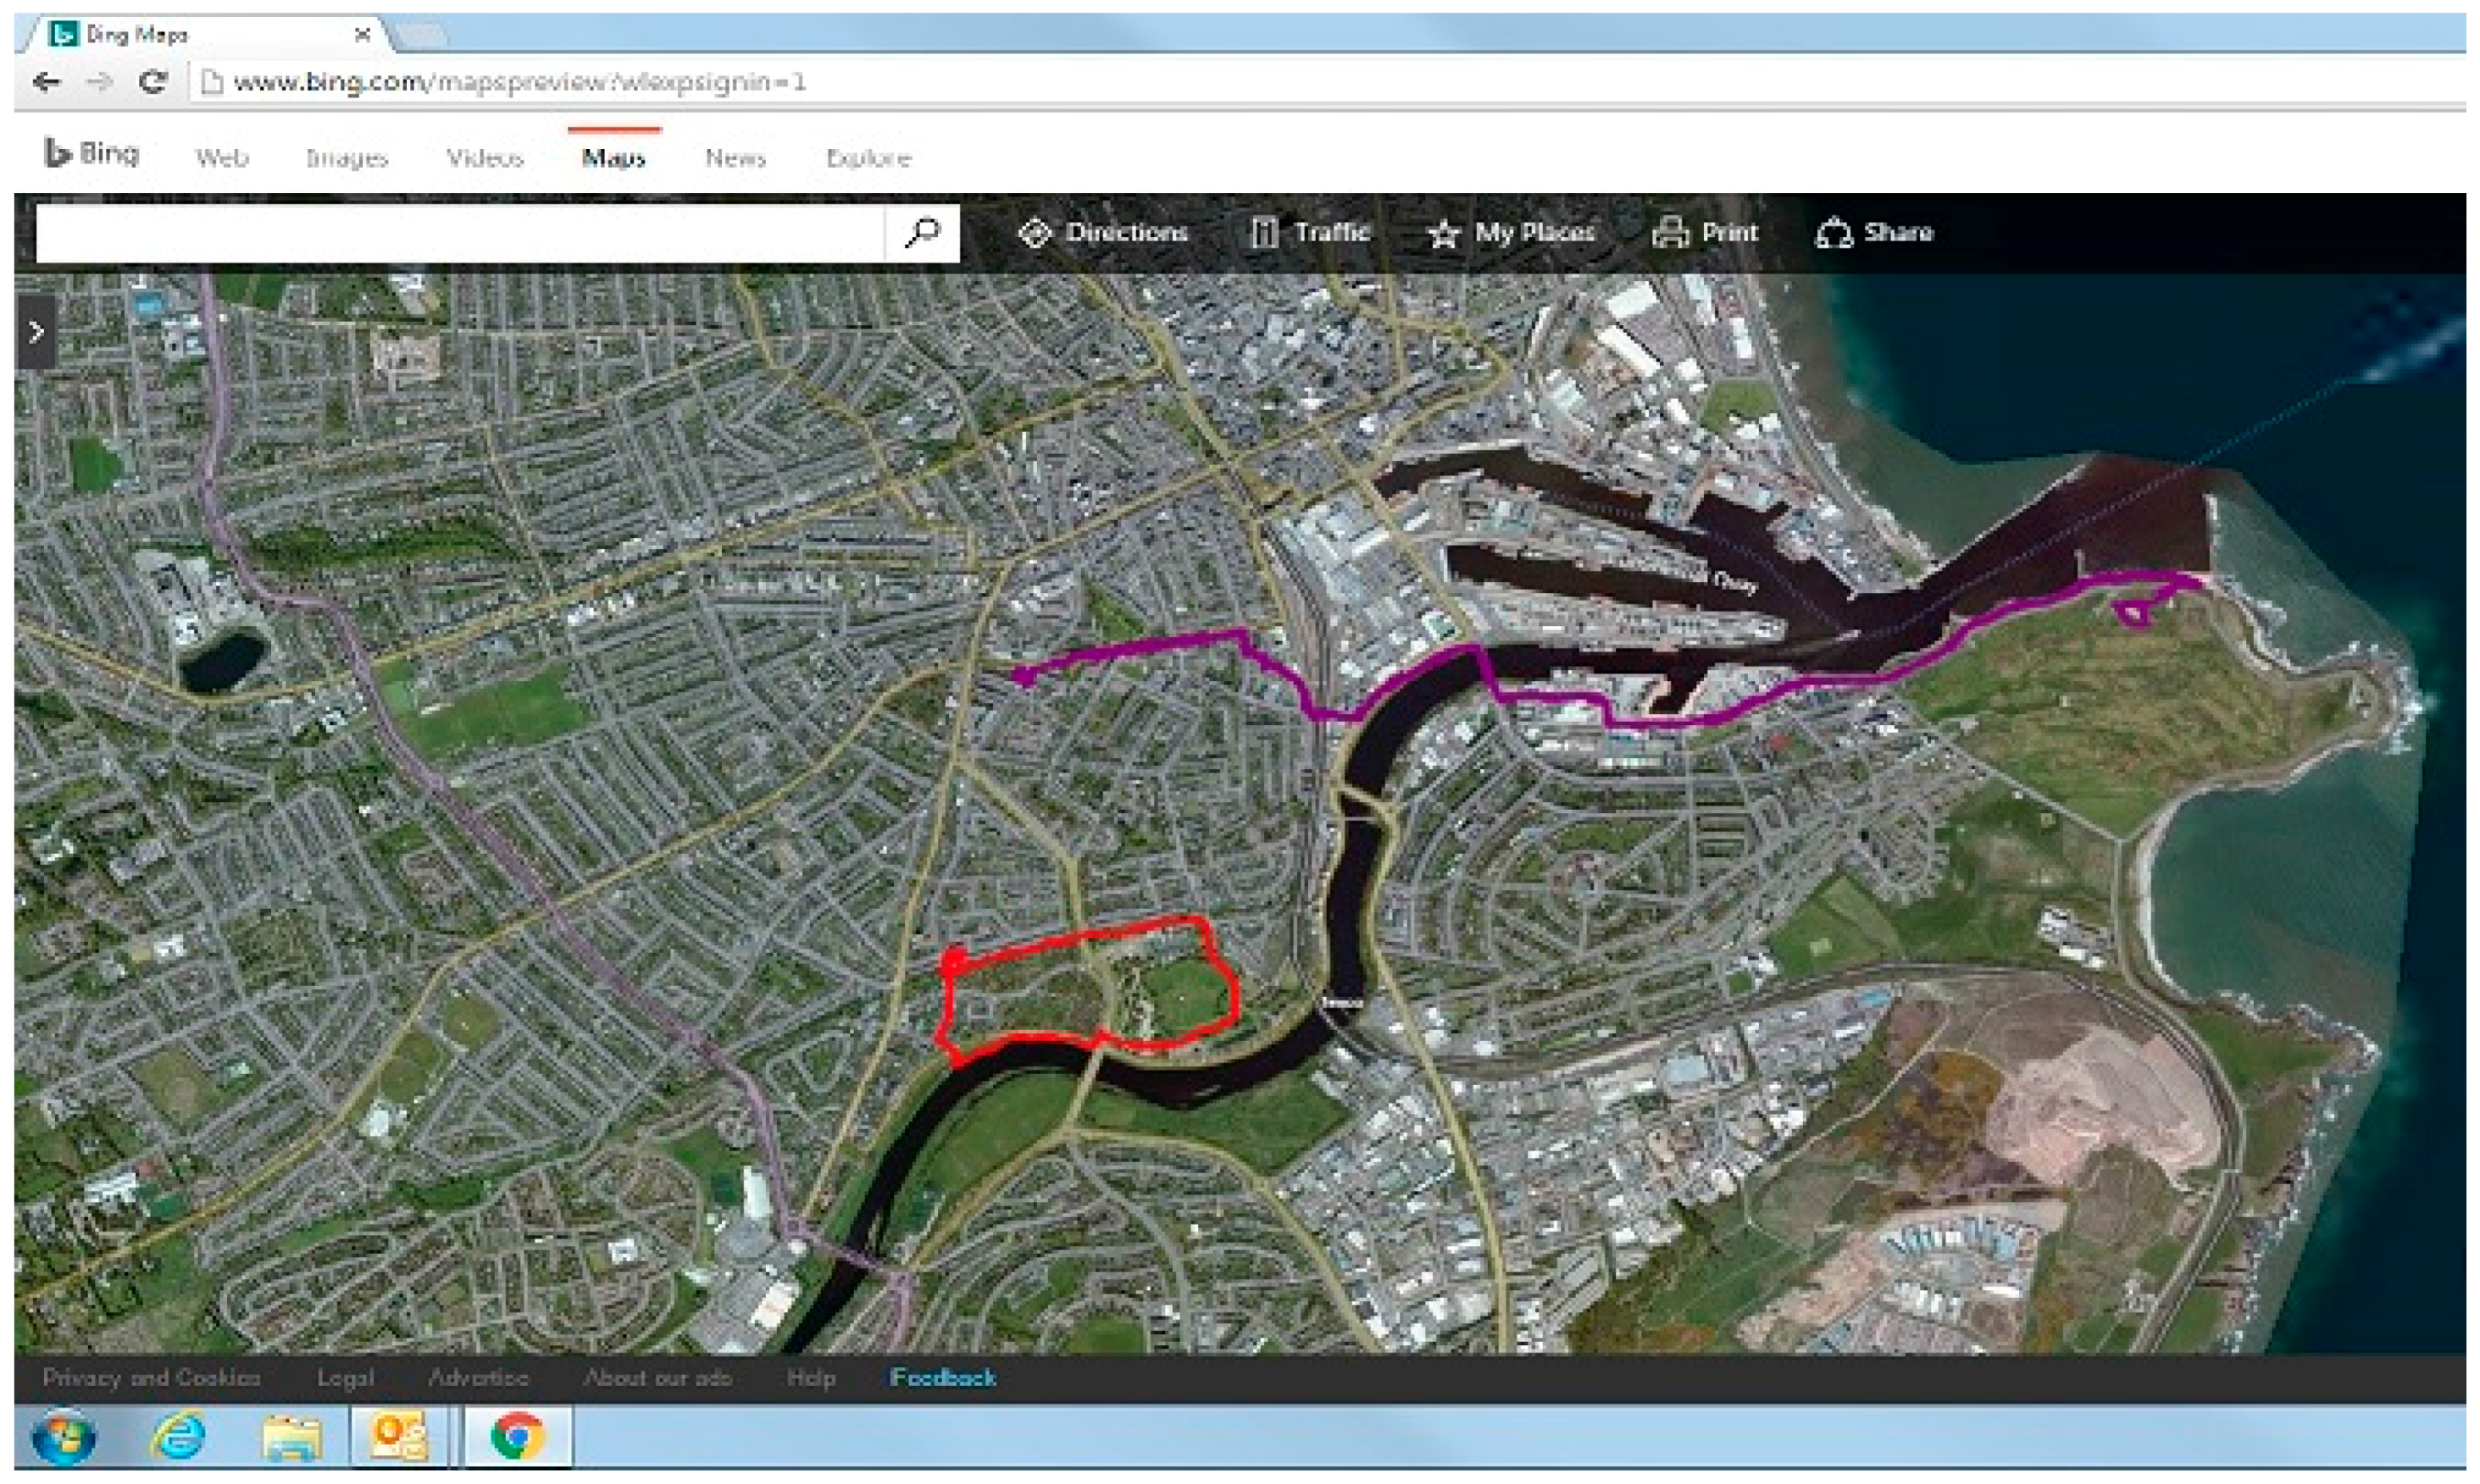
3.1. Technical and Practical Observations

In terms of recording our participants’ routes, we found multiple benefits to using GPS tracking technology: ease of use, low cost (both in financial terms and researcher time) and the objective nature of this data gathering method. This was offset by the need for participants to have access to a smartphone or GPS watch, and the fact that the GPS signal could be hard to find. A few participants were slightly reluctant to download the application, believing that it would take up considerable space in their smartphone memory, and drain the battery while running.
It was straightforward to upload the participants’ tracks as individual map layers in the freely available web mapping services Google Maps and Bing Maps. A screenshot showing two participants’ routes uploaded into Bing Maps is shown in Figure 2.
The intuitive nature of the scrolling and zooming facility on the touch table made it easy and seemingly enjoyable for participants to move around the aerial imagery of the landscape. On the other hand, our particular model of touch table (Samsung SUR40) was susceptible to interference from overhead light and sometimes reacted to sleeves or objects brushing against the surface, resulting in unexpected movement of the screen content. Participants might have benefitted from a longer familiarisation period with the touch table to get used to these issues.
The interaction between the GPS tracking application and the participant’s smartphone was problematic on occasion. Clearly it was not practical or possible to test the recommended applications on all types of Android or versions of iPhone, and this meant that some participants had difficulty in getting the application to work effectively on their phones. In most cases this was circumvented by the participant finding another application that worked better for them. It also became apparent during the study that the reliability of the GPS locking on to the satellite was variable for some participants, but it is not possible to determine whether this was due to model of smartphone, the tracking application or the location of the walk. Other researchers may want to consider using a uniform set of smartphones or GPS tracking devices.
Group size in our study ranged from 3–5 participants. We found, for the discursive and interactive nature of our study, that 3 participants was too few, and 5 probably too many, particularly in light of positioning a camera with which to record the sessions. We video-recorded our sessions from a camera mounted on a tripod facing the touch table, but with 5 participants the view of the table was sometimes partially obscured. We recommend 4 participants as the optimal number for studies of this type, using a touch table of this size.

3.2. Findings from Group Discussions and Individual Interviews

Several themes emerged from analysis of the group discussion and interviews. First we report on our observations of group dynamics around the touch table. Next we present findings on participants’ communication about their walking routes, followed by those relating specifically to the aerial perspective of these routes on the touch table. The fourth theme relates to how participants discuss landscape changes, and the final section describes longer terms effects arising from participation in the study, as reflected in the individual interviews.

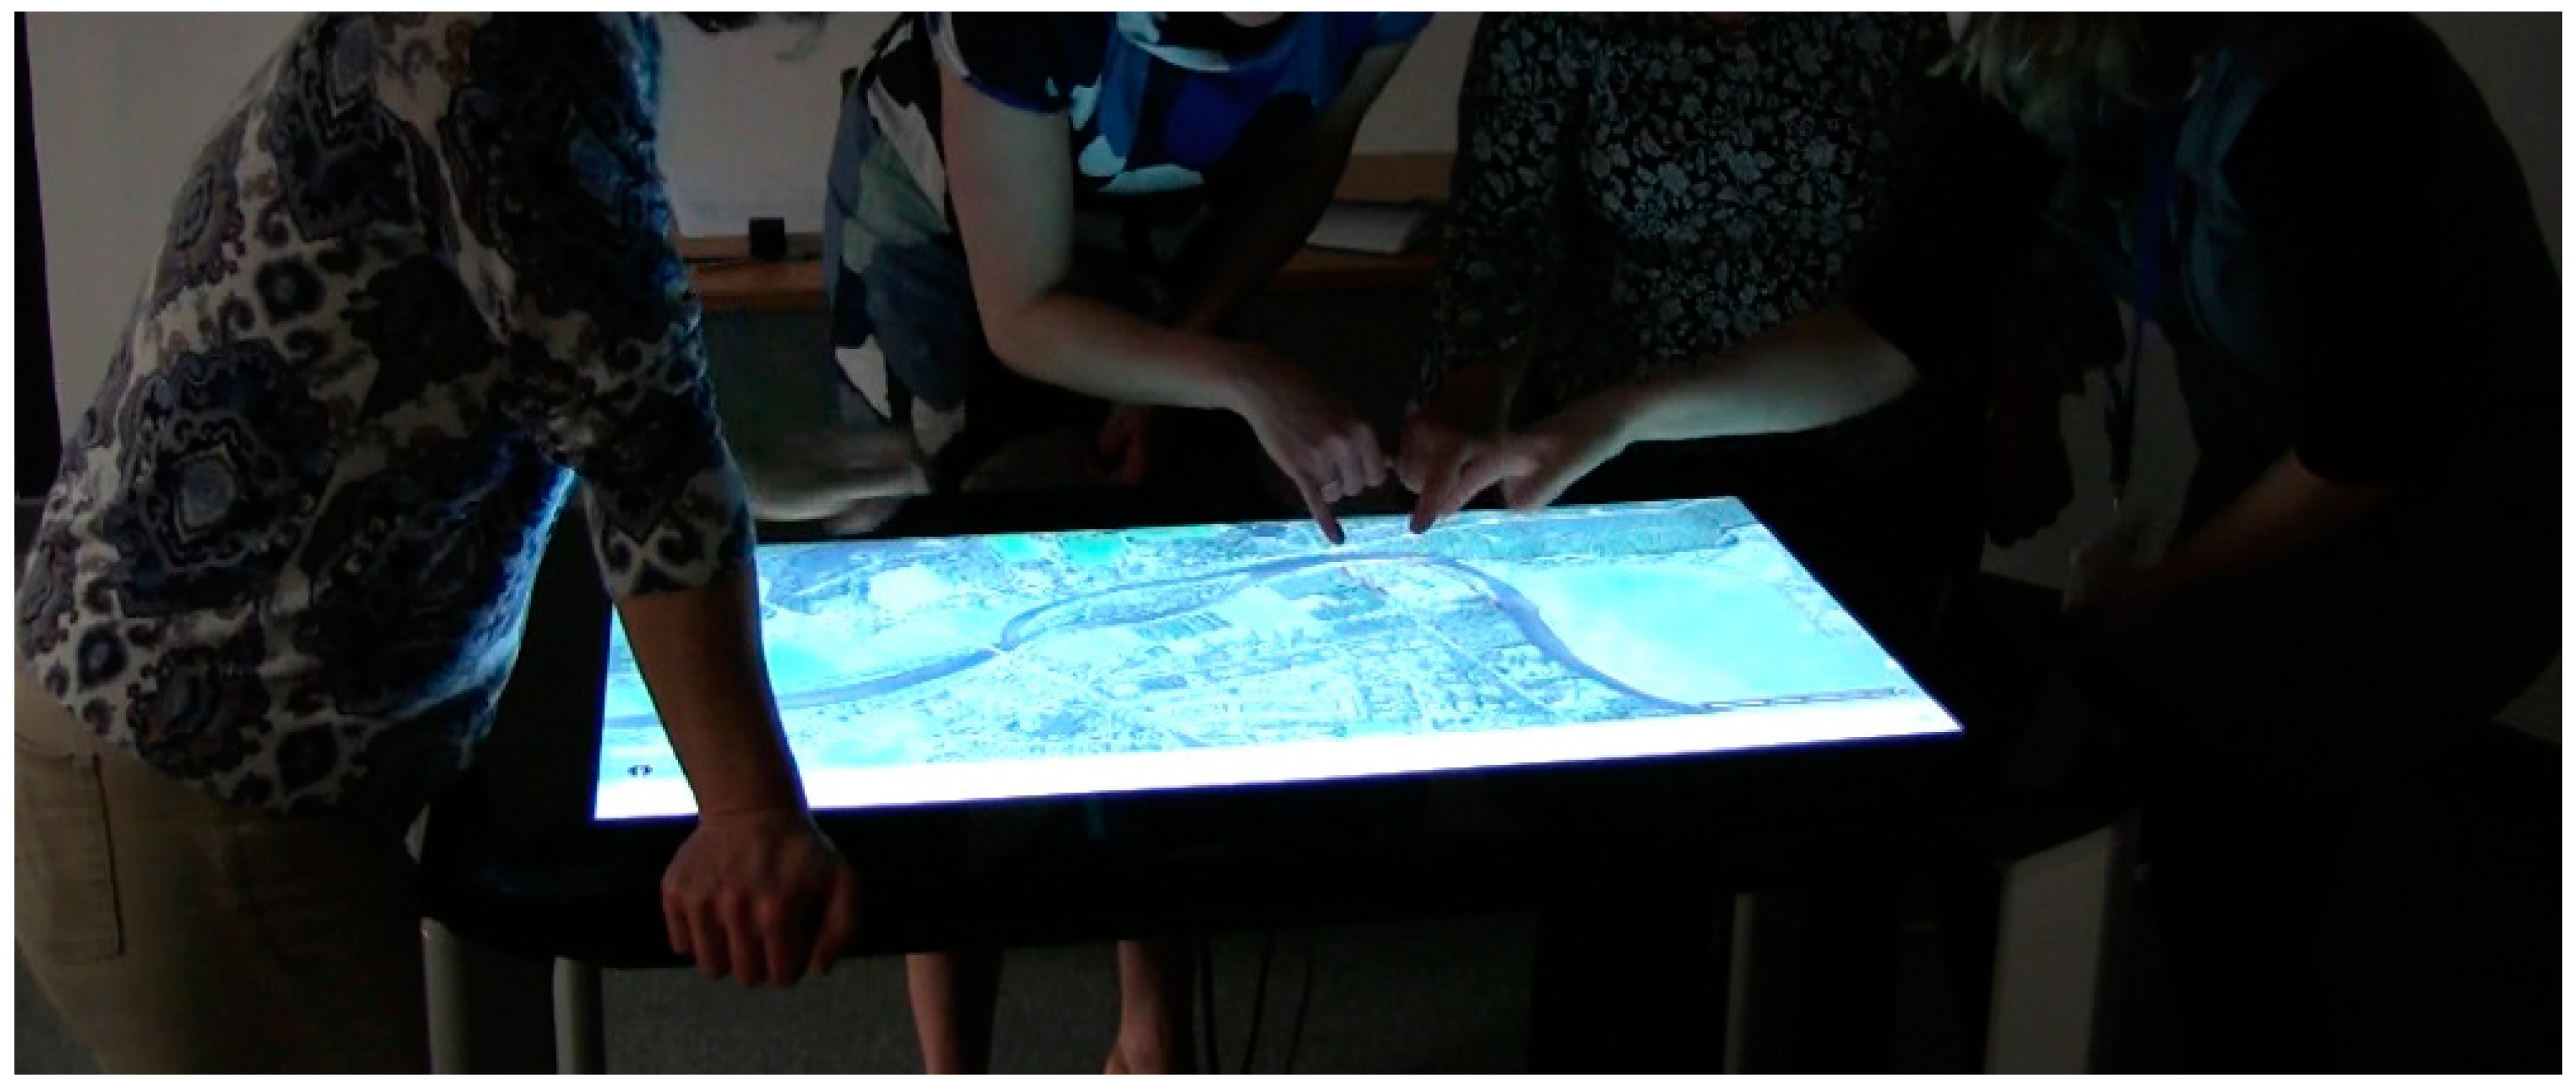
3.2.1. Group Dynamics around the Touch Table

The group dynamics of discussion sessions were notable for the common occurrence of one person ‘taking charge’ of the touch table. Some participants were more hesitant to engage with the touch table than others, and/or were reluctant to re-engage if their initial interaction had encountered any usability problems such as unintentional panning (cf. (Ch’ng 2012; Ryall et al. 2006)). As it was only possible to have one person engaging with Bing Maps at a time (i.e., in charge of zooming or scrolling to the place they wanted to talk about), it was necessary for participants to engage in a form of negotiation about (i) who would be the first to find their route and describe it; and then (ii) who would be the lead ‘zoomer’ after everyone had taken their turn showing and describing their route. Some participants seemed to be quite comfortable with talking while another participant scrolled to the area that they were talking about, while at other times it was clear that other participants would like to ‘take over’, but were hesitant to make their wishes known to the lead zoomer.
Given that the majority of our participants were acquainted with both each other and the research team, this reticence to step forward to engage with the touch table was interesting and should be borne in mind for future research projects involving participants who are not known to each other. Although most of our participants were known to each to other, participants had different levels of local knowledge, which led to some participants speaking at length while others had less to say. Interestingly it was not always the participants who spoke most that engaged most with the touch table.
Finally, we observed from the video recordings that discussion around the touch table seemed to remove some of the visual focus that would normally be directed to a speaker. It was thus perhaps easier for shy people to speak up, knowing that people’s attention would be directed towards the illustrative visual of the touch table rather than the speaker per se.

3.2.2. Communication/Knowledge Exchange about Walking Routes

The group discussions around the touch table facilitated participants in gaining an understanding of ‘what is it like there?’. After the initial description of routes by the individuals who walked them, the nature of the group discussion enabled further information to be gleaned that allowed participants to understand whether a particular route would meet their needs/personal preferences. Participants shared information about how to get to the start points for their walks and answered queries about the ownership of the land. Using the touch table map, they pointed to the best places to park and discussed issues such as the path surfaces and terrain, how busy it might be, what flora and fauna to look for, and the views that would be experienced (see Figure 3).
In addition to these primary considerations, participants also talked about the more ephemeral aspects that impacted their choice of route. For example, one participant talked about how she would not choose to do her walk under different seasonal and weather conditions, as the route becomes less accessible:
And then this bit is a bit more...you can’t...sometimes it’s flooded and...now the nettles are getting really high, so it’s getting more difficult...
(P5)
while another participant described how increasing pollen levels meant part of his route was inaccessible to him during the summer:
I quite often actually walk down to the river edge here and stroll along the footpath along there... But when the grass is long and it’s summer, and I get hay fever [...] I steer clear of the long grass...
(P17)
Parts of walks that became inaccessible due to mud after periods of rain were also pointed out.
For others, it was specifically the ephemeral experiences afforded by their routes that provided the main attraction. For example, P9 talked about how she liked her route because there was always something happening, something different to look at:
P9: Yeah because it’s such a lovely place, and just like...scarf on, jacket on, go... There’s always boats coming in as well—there’s always something to watch...
P10: Yeah it’s the ferry...the Orkney Ferry...
P9: Yeah that’s every other day yeah, and there’s always boats coming in or sitting out in the harbour, so there’s always loads to see...
In her post-session interview, P6 said she had reflected further on what she liked about her urban walk, describing how she enjoys monitoring change, for example noting progress on house extensions and different garden plantings.
The zoomable view/scale manipulation that was possible on the touch table enabled participants to not only zoom into the landscape of their walks to point to local detail, but also to zoom out to demonstrate the wider context of their walks, and to indicate other parts of the region or country that they would recommend as good places to walk. The unbounded nature of the web map meant that participants were completely unconstrained in locating parts of the landscape they wished to discuss, sharing information about walking in locations as distant as the Moray Firth coast and the Black Isle (approximately 60 and 110 miles from Aberdeen City respectively). This type of information exchange is unlikely to have occurred with a paper-based map, since the area covered by this would be bounded, and so any discussion of distant areas would not have been accompanied by visual illustration.

3.2.3. Aerial Perspective Eliciting Discussion

We tested both Google and Bing Maps in designing our study. It was interesting to note the differences between the two in terms of their satellite photography. For this part of Scotland, Google’s satellite imagery was taken in winter when there were no leaves on the trees, while Bing Map’s images were taken in the summer hence lots of foliage. This made a practical difference, particularly where the routes that were being discussed took place in woodlands. The observation was made that it would be impossible to see paths through woods without the overlaying of the GPS track when the summer foliage was dense:
And you can’t really find your path—if you hadn’t marked it you couldn’t really find out because it’s eh...through the trees you don’t see anything...
(P13)
Researchers engaging in future studies of this type could fruitfully utilise winter satellite photographs so that tracks can be more clearly seen by participants wishing to share routes and paths that have not been highlighted through overlaid GPS tracks.
Participants provided several observations about how viewing their routes on the touch table afforded them a different perspective on the landscape. The top-down view allowed participants to detect and discuss unknown paths, streets and landscape features that are hidden from street level view. Although these elements are also viewable in satellite images displayed on personal devices such as laptops, tablets and smartphones, it was the noting and discussion of these features in a group session that enriched this experience for participants, as they were able to confer and reflect on what they were seeing. Participants frequently commented on how street layout, in particular, looked different to how they pictured it mentally, and on how close one landscape feature was to another. There were multiple instances of discussion of landscape features that would not be visible on traditional maps (e.g., Ordnance Survey) of the areas in which people walked. For example, participants pointed to and discussed a good swimming spot on a river; cycle lanes on a street; an actual ferry; and park furniture and play equipment.
The aerial view presented on the touch table enabled participants to zoom in and point out the precise feature they were talking about, rather than talking in more abstract terms. Participants were able to appreciate the benefits that the satellite photography offered them over a topographic map, as illustrated by the following exchange:
P17: I think I have a fairly highly developed spatial sense and what this does is add layers of… you know, of clearly quite tightly-managed grouse moor, open Scots pine woodland….
Multiple: [noises of agreement].
P17: ehm, meadows and so on…footpaths. And…yeah, it adds a lot of depth and you can see a great massive Sitka spruce there as well…. Some of that would be on the map actually—the moorland would be on the map….
P18: But not so obvious…. If I had to describe my walk, if that was a map, I’d really have to study it hard...to see exactly what...’Is that the field?’, ‘What’s that sign mean?’...
P17: Yeah.
P18: ...you know, it’s obvious to see on....
P17: Yes, yeah, I suppose it’s....
P18: Much easier.
P17: Yeah.
However, it is also important to consider what it not afforded by an aerial viewpoint. Participants observed that it is hard to interpret aerial imagery in terms of where there is a good viewpoint or vista or how steep the landscape is because of the lack of contour lines. For example:
Because there’s obviously detail that you don’t think about it...But then there’s some detail that you can’t see from a flat map which is like...the fact that that’s actually quite a steep hill...
(P16)
It was difficult to interpret what the terrain was like at times, with no indication of where the ground might be boggy, for example. Participants were reliant on others to supply this information.
In the post-session interviews there were several positive statements that viewing the landscape and routes through the touch table made it easier to imagine what a walk would be like, compared to doing the same using an Ordnance Survey (OS) map. One participant (P5) commented that seeing walks on Bing Maps “adds something beyond just talking about where you walk”. She felt that OS maps were good for finding a route, but satellite is better for imagining wildlife/greenery, making it easier to visualise what the landscape is like.

3.2.4. Landscape Changes: Present and Past

The fact that the satellite photography displayed on the touch table captured a particular moment in time was the source for much interesting and varied discourse. We observed that participants used the image as a frame of reference to discuss what had happened in and to the landscape since the photograph was taken, and also as a prompt to discuss what the landscape used to be like before the photograph had been taken.
When seeing their routes overlaid on the satellite photograph, participants immediately noticed any differences between what was displayed and their personal experiences of their walk. Commenting on when the satellite photograph must have been taken, many conversations were held about ‘what was there now’ e.g., new houses and schools. When finding the start point of her route, one participant commented:
It started here, which is no longer in the middle of a field because it’s...it’s where I live...
(P16)
Whether the satellite imagery being up to date matters or not undoubtedly depends on the purpose of the study. In our study the mismatch between the satellite images and the current state of the landscape was a useful conversation starter—as one participant put it at the end of her group session:
and interestingly it’s what things that aren’t there anymore that we also talked about.
(P15)
This was particularly apparent in cases where access points to walks had been changed or recently reopened. For example, one participant had chosen her route specifically because access to a patch of woodland had recently been renewed following completion of building works:
Yeah...I walked from my house...Now before...the thing that’s exciting for me about this walk is because it’s a new development, they had fences down here and down here, so you couldn’t actually access the woods from the house—they’ve been building that way, and this way, and they’ve not been letting you get into the woods […] Anyway they’ve taken this fence down here. So the reason that I wanted to do this walk was because they’ve now taken that fence down and allowed me access like through the woods. So beforehand I would have to walk all the way down like that, to get access...
(P16)
The impact of landscape change not immediately in the vicinity of the walking route was also discussed. For example, one participant talked about how a new housing development upstream had impacted on the level of water in a pond around which she liked to walk:
And now that housing development’s there...the water’s really low and murky, it’s horrible...
(P3)
Another participant talked about how increasing house building in town was compressing the range that local wildlife (deer) had:
Eh, come up here, through an over fifty-fives dwelling, through the woods, along here, and there are eight or...usually eight or nine roe deer in the fields round here, I think being squashed in by all the houses being built, poor things—I mean condensed in.... We always see them—they’re really tame.
(P18)
More ephemeral changes, such as seasonal transformations to the visual appearance of the landscape were also discussed. Many participants talked about appreciating how their route looked different according to the season, for example:
Well and I like it ‘cause in the woods there you get the snowdrops in...whenever it is—March or so—and it’s all white carpet, and then there’s a bit when there’s nothing or it’s just green, and then you get the wild garlic coming up and it’s carpets of them…. But it looks, you know, amazing, ehm... And now there’s some sort of purply little weed out so it’s always...something else to discover...
(P13)
The ‘snapshot in time’ aspect provided by the satellite images afforded the opportunity to discuss the history of the landscape being viewed in terms of what used to be there, as well as what was still there but no longer used. For example, one participant gestured to and described landscape features in an urban park that had been changed in recent years, as well as indicating still existing features of an old railway line in the same area:
And then this area’s interesting ‘cause this is where they’ve still got one of the original railway sheds, ‘cause originally this is where...so the Deeside line obviously used to be the railway line, so the railway would branch along here...And they’ve recently built these houses on what was the railway sheds, but they’ve still kept one of them and they’ve still got...so the turning circle, that’s where they used to turn the trains.
(P6)
Participants also used the stimulus of the near-present landscape to reflect on the local history attached to a particular place. For example, some participants talked about the history of the area where they live and others talked about land ownership in their local areas. Participant 17 made the observation that there is potential to use sessions like these around a touch table to tap into these local knowledges and histories, to map the cultural history of the landscape before the knowledge dies with their owners. He gave the example of an encounter with a local farmer:
P17: I remember when we were talking and he said there was a...there’s a cross up on top of the hill here...And the old footpath from Lumsden...you can actually see a path coming down here... And a servant girl died in a snowstorm up on top of the hill here, and there’s a cross there...
multiple: [sad noise].
P17: And it happened...a hundred years ago? A hundred and fifty years ago... But he knew it was there and he knows the story...
P19: It’s not there anymore?
P17: No the cross is there, but there’s nothing about it other than his knowledge.
P19: Yeah.
P18: And that’s going to die with him.
The same participant (P17) also saw the potential for satellite displays on the touch table to be used in agri-environmental schemes to support dialogue between farmers and local communities, to illustrate what and where certain types of intervention could be undertaken.

3.2.5. Longer Term Effects on Understanding and Experience of Place

In the subsequent one-to-one interviews, participants were asked whether they had undertaken their own walk again or any other walks discussed in their touch table session. They were also asked to provide any further reflections on the study as a whole.
Eight of the participants had not done their walk again. The most common reason given for this was because of the time of year (summer)—many participants had either been on annual leave or been away at conferences. None of the participants reported having undertaken a new route, although eleven of them did indicate that they would like to do so in the future. This intention was, however, often qualified with statements such as ‘if I was in that area’ i.e., they were unlikely to make a special trip to take the walk. The walks that individuals had taken were very often local to their home, and fellow participants reported that they were unlikely to make a point of travelling specially to that area, e.g.,
If you want to make a trip you want somewhere a bit more…special.
(P13)
Whilst we found little evidence for behaviour change in terms of taking new walking routes, there was evidence that, for at least some participants, the session around the touch table had helped to change the understanding and experience people had of the places they had chosen to walk. They reported the experience had caused them to think more deeply about the landscape around them as they walked through it, and to reflect further on what aspects of their walks made it a favourite walk for themselves.
Participant 6 had reflected that what she liked best about her urban walk was the diversity in the landscape she encountered. Diversity was also important to P18, but for her it was the biodiversity of her walk that she valued most, recognising that the prime reason she took her walk was because it was the “closest to countryside”. Participant 18 also talked about how she thought that it would be interesting to map out ‘biodiversity walks’ on the touch table, indicating to people where they could see particular species of trees, flowers, fungi etc. She felt that this might be a method by which a walk could be ‘sold’ to people interested in learning more about the natural world around them. The concept of ‘selling a walk’ was also touched on by P17, although for him the focus was on already active walkers, who could be shown new walking opportunities and routes and what to expect on them through display on the touch table.
One participant (P9) reported that she had become more aware of other people she encountered on her walk, in terms of wondering about their motives for taking the same walk as her, while another (P2) found herself paying greater attention to the seasonal changes to the flora, and how the scenery might be described differently as a result. Participants 3 and 4 had taken the same walk independently (the only two of our participants to take the same walk), and were in the same group session. They both commented on how they had found it was good to talk about a route that was familiar to other people, and how what the other person said made them remember other aspects of their walk. Participant 3 talked about how she felt the touch table experience had made her mindful of her walking experiences, and that she found herself considering things on her route more carefully than usual.
Participant 22 felt that it was possible that the touch table session had made her more aware of spaces in Aberdeen that are underused/not recognised or acknowledged. She said that she felt she had started to value the city differently.

4. Discussion

Our findings suggest that the use of touch table technology (in combination with GPS tracking and aerial photographic maps) offers a promising method for participatory research investigating knowledge of and engagement with local landscapes. Participants reported few problems with recording their route information via GPS applications, and were generally positive about the touch table as a visual tool, valuing the opportunity it provided for discussion of their chosen walks through the landscape. We found limited evidence of likelihood to take new walking routes, but it can be argued that this is in part because we did not ask participants to walk in the same general location, and as a consequence routes were widespread, with many participants choosing to effectively walk from their front door. If, for example, we had constrained our participants to taking walks around the location of the workplace we may have found more evidence for participants taking new routes after their touch table session, as participants would have been discussing an immediate environment common to them all. It would therefore be valuable to replicate the study with members of a local community. As Bruun et al. (2017) report, only 3% of studies using touch tables are conducted ‘in-the-wild’, but it is only through conducting research in natural settings that the accurate worth of the applications in question can be established.
We observed our participants describing and illustrating, via the touch table, places to walk that were further out than the boundaries that would be experienced with a physical map. However, it is clearly a limitation to our study that we did not have a comparison condition using paper maps, and so while we can hypothesise that the wide ranging discussion and illustration of walking routes might not have happened away from the touch table, we cannot be sure. Future research of this nature should include a comparison group using paper maps to explore the differences in information shared and discussed.
Participants’ use of the touch table in our study was limited to exploring only one large object (Bing Maps) which did not support multiple interactions at the same time. This met the requirements of this particular study since we wanted our participants to explore specific parts of the mapped landscape together, but future studies could benefit from exploiting the touch table’s multi-touch capability, perhaps by using multi-user zooming lenses for maps as described in Ryall et al. (2006). The ability to draw on and annotate the map would also be a useful addition to future studies, as it would lead to a participatory map that could be saved and distributed to participants. This would be particularly valuable when trying to encourage reluctant walkers to get out and experience their local landscape.
The aerial photography displayed on the touch table was effective in conveying an impression of the landscape through which walks took place but was less effective at communicating certain terrain features such as gradient, and the views that would be experienced. A future study could therefore include geotagged photographs or videos to reflect the in-person viewpoint, which could also be captured by participants as they walk, for example by using GoPro cameras. Applications such as Google’s Street View could also be used for sharing urban walking routes with others, although this currently primarily provides photography from the point of view of a car rather than a pedestrian. As suggested by one of our participants, the potential to layer aerial photographs or maps from different time periods on a touch table would enable people to gain a rich understanding of how the landscape has changed over time (cf. with urban environments e.g., GeoPulse Linz 2017). This could be used with many different types of groups (e.g., farmers and land managers, local communities, historians, archaeologists) to share landscape knowledge. This addition of layers of information is closely related to softGIS methods (Kahila and Kyttä 2009; Rantanen and Kahila 2009) which have been used primarily to support urban planning processes and community consultations. Enabling participants to contribute their local knowledge (whether this is historical knowledge or how they use and view the environment around them on a daily basis) via a touch table application, is an avenue worth pursuing.
We observed that interaction with the touch table can be dominated by one or two individuals, but also that the visual focus on the tool, rather than fellow participants, can make it easier for more reserved participants to contribute. The discussion in our study was participant led; by increasing the facilitation of touch table sessions in future research, it could be possible to circumvent the issue of ‘zoomer dominance’ on the touch table, such that all participants have equal opportunity to engage with it. Issues such as domination and reticence within focus groups have been well-researched (e.g., (Bloor et al. 2001)) but participant engagement around a touch table involves additional challenges arising from necessarily smaller group sizes (see (Ryall et al. 2006; Nacenta et al. 2012)). There is much scope for future research to explore further these small group methodological issues.

5. Conclusions

The study reported here has contributed to the body of literature around touch table use, in this case using a touch table as a visual method to explore recreational walking and spatial behavior. In common with other researchers, we found that our participants were engaged by the touch table, and willing to communicate using the table as a visual tool with which to discuss and illustrate their walks. We found that our combined GPS and touch table approach to explore and share recreational walking routes is a promising technique that could be used in future studies to promote recreational opportunities for different groups of people in the landscape. We believe that further studies using touch tables to gather and convey information on how people move through and relate to the physical environment are warranted.

Acknowledgments

This study was funded by the Macaulay Development Trust. Time for development of the manuscript was funded by the Scottish Government’s Rural and Environmental Science and Analytical Services (RESAS) Division. We wish to thank our participants, our internal reviewer Dominic Duckett and the anonymous reviewers for their constructive criticism.

Author Contributions

All authors conceived and designed the study; A.C. and K.C. carried out the data collection; all authors analyzed the data; A.C. wrote the paper with contributions from K.C. and K.N.I.

Conflicts of Interest

The authors declare no conflict of interest. The founding sponsors had no role in the design of the study; in the collection, analyses, or interpretation of data; in the writing of the manuscript, and in the decision to publish the results.

References

  1. Alexander, Karen A., Ron Janssen, Gustavo Arciniegas, Timothy G. O’Higgins, Tessa Eikelboom, and Thomas A. Wilding. 2012. Interactive marine spatial planning: Siting tidal energy arrays around the Mull of Kintyre. PLoS ONE 7: e30031. [Google Scholar] [CrossRef] [PubMed]
  2. Arciniegas, Gustavo, and Ron Janssen. 2012. Spatial decision support for collaborative land use planning workshops. Landscape and Urban Planning 107: 332–42. [Google Scholar] [CrossRef]
  3. Bechtel, Robert B., and Arza Churchman, eds. 2002. Handbook of Environmental Psychology. Hoboken: Wiley, ISBN 978-0-471-40594-8. [Google Scholar]
  4. Bell, Sarah L., Cassandra Phoenix, Rebecca Lovell, and Benedict W. Wheeler. 2015. Using GPS and geo-narratives: A methodological approach for understanding and situating everyday green space encounters. Area 47: 88–96. [Google Scholar] [CrossRef] [Green Version]
  5. Bhandari, Chhavi, Subhash C. Sharma, Ian D. Bishop, and Christopher Pettit. 2010. Visualizing Future Biolinks Using a Touch Table—New Dimensions in Planning. Paper presented at Joint International Conference on Theory, Data Handling and Modelling in GeoSpatial Information Science, Hong Kong, China, May 26–28. [Google Scholar]
  6. Bloor, Michael, Jane Frankland, Michelle Thomas, and Kate Robson. 2001. Focus Groups in Social Research. London: Sage, ISBN 9780761957430. [Google Scholar]
  7. Brown, Katrina M., and Esther Banks. 2015. Close encounters: Using mobile video ethnography to understand human-animal relations. In Video Methods: Social Science Research in Motion. Edited by Charlotte Bates. London: Routledge, vol. 10, pp. 95–120. [Google Scholar]
  8. Bruun, Anders, Kenneth Eberhardt Jensen, Dianna Hjorth Kristensen, and Jesper Kjeldskov. 2017. Escaping the Trough: Towards Real-World Impact of Tabletop Research. International Journal of Human–Computer Interaction 33: 77–93. [Google Scholar] [CrossRef]
  9. Carpiano, Richard M. 2009. Come take a walk with me: The “Go-Along” interview as a novel method for studying the implications of place for health and well-being. Health and Place 15: 263–72. [Google Scholar] [CrossRef] [PubMed]
  10. Ch’ng, Eugene. 2012. New Ways of Accessing Information Spaces Using 3D Multitouch Tables. Paper presented at the International Conference on Cyberworlds, Darmstadt, Germany, September 25–27; pp. 144–50. [Google Scholar]
  11. Ch’ng, Eugene. 2015. Crowd behavior mining with virtual environments. Presence 24: 347–58. [Google Scholar] [CrossRef]
  12. Ch’ng, Eugene, Vince Gaffney, Paul Garwood, Henry Chapman, Richard Bates, and Wolfgang Neubauer. 2016. Merging the Real with the Virtual: Crowd Behaviour Mining with Virtual Environments. Paper presented at the 2016 22nd International Conference on Virtual System & Multimedia (VSMM), Kuala Lumpur, Malaysia, October 17–21; pp. 1–9. [Google Scholar]
  13. Ciocca, Gianluigi, Paolo Olivo, and Raimondo Schettini. 2012. Browsing museum image collections on a multi-touch table. Information Systems 37: 169–82. [Google Scholar] [CrossRef]
  14. Clayphan, Andrew, Roberto Martinez-Maldonado, Martin Tomitsch, Susan Atkinson, and Judy Kay. 2016. An in-the-wild study of learning to brainstorm: Comparing cards, tabletops and wall displays in the classroom. Interacting with Computers 28: 788–810. [Google Scholar] [CrossRef]
  15. Collins, Daniel. 2011. Participatory Geographic Information Systems (PGIS) in visual research. In The SAGE Handbook of Visual Research Methods. Edited by Eric Margolis and Luc Pauwels. London: SAGE, chp. 25. pp. 474–93. [Google Scholar]
  16. Evans, James, and Phil Jones. 2011. The walking interview: Methodology, mobility and place. Applied Geography 31: 849–58. [Google Scholar] [CrossRef]
  17. Falcones, Gabriel, Marisol Wong-Villacres, Vanessa Echeverría Barzola, and Katherine Chiluiza Garcia. 2016. Enhancing Quality of Argumentation in a Co-located Collaborative Environment through a Tabletop System. Paper presented at the Ecuador Technical Chapters Meeting (ETCM), Guayaquil, Ecuador, October 12–14; vol. 1, pp. 1–6. [Google Scholar]
  18. GeoPulse Linz. 2017. GeoPulse Linz—Ars Electronica Center. Available online: https://www.aec.at/center/en/ausstellungen/geopulse/ (accessed on 2 October 2017).
  19. Higgins, Steve, Emma Mercier, Liz Burd, and Andrew Joyce-Gibbons. 2012. Multi-touch tables and collaborative learning. British Journal of Educational Technology 43: 1041–54. [Google Scholar] [CrossRef] [Green Version]
  20. Hinrichs, Uta, and Sheelagh Carpendale. 2011. Gestures in the Wild: Studying Multi-Touch Gesture Sequences on Interactive Tabletop exhibits. Paper presented at the SIGCHI Conference on Human Factors in Computing Systems, Vancouver, BC, Canada, May 7–12; pp. 3023–32. [Google Scholar]
  21. Horn, Michael S., Brenda C. Phillips, Evelyn Margaret Evans, Florian Block, Judy Diamond, and Chia Shen. 2016. Visusalizing biological data in museums: Visitor learning with an interactive tree of life exhibit. Journal of Research in Science Teaching 53: 895–918. [Google Scholar] [CrossRef]
  22. Hornecker, Eva. 2008. “I Don’t Understand it Either, But It is Cool”-Visitor Interactions with a Multi-Touch Table in a Museum. Paper presented at the 3rd IEEE International Workshop on Horizontal Interactive Human Computer Systems (TABLETOP), Amsterdam, The Netherlands, October 1–3; pp. 113–20. [Google Scholar]
  23. Kahila, Maarit, and Marketta Kyttä. 2009. SoftGIS as a bridge-builder in collaborative urban planning. Planning Support Systems Best Practice and New methods 95: 389–411. [Google Scholar]
  24. Laing, Richard, Anne-Marie Davies, David Miller, Anna Conniff, Stephen Scott, and Jane Morrice. 2009. The application of visual environmental economics in the study of public preference and urban greenspace. Environment and Planning B: Planning and Design 36: 355–75. [Google Scholar] [CrossRef]
  25. Lay, Erica. 2013. Evaluating Touch-Table Technology in Neighbourhood Planning. Ph.D. thesis, University of British Columbia, Vancouver, BC, Canada. [Google Scholar]
  26. Nacenta, Miguel A., Mikkel R. Jakobsen, Remy Dautriche, Uta Hinrichs, Marian Dörk, Jonathan Haber, and Sheelagh Carpendale. 2012. The Lunch Table: A Multi-User, Multi-Display System for Information Sharing in Casual Group Interactions. Paper presented at the 2012 International Symposium on Pervasive Displays, Porto, Portugal, June 4–5; p. 18. [Google Scholar] [CrossRef] [Green Version]
  27. Patsoule, Evelyn. 2014. Interactions around a multi-touch tabletop: A rapid ethnographic study in a museum. In Design, User Experience, and Usability. Berlin and Heidelberg: Springer, pp. 434–45. [Google Scholar]
  28. Pauwels, Luc. 2011. An integrated conceptual framework for visual social research. In The SAGE Handbook of Visual Research Methods. Edited by Eric Margolis and Luc Pauwels. London: SAGE, chp. 1. pp. 3–23. [Google Scholar]
  29. Pelzer, Peter, Gustavo Arciniegas, Stan Geertman, and Jaap de Kroes. 2013. Using MapTable® to learn about sustainable urban development. In Planning Support Systems for Sustainable Urban Development. Edited by Stan Geertman, Fred Toppen and John Stillwell. Berlin and Heidelberg: Springer, pp. 167–86. [Google Scholar]
  30. Rantanen, Heli, and Maarit Kahila. 2009. The SoftGIS approach to local knowledge. Journal of Environmental Management 90: 1981–90. [Google Scholar] [CrossRef] [PubMed]
  31. Ricketts Hein, Jane, James Evans, and Phil Jones. 2008. Mobile methodologies: Theory, technology and practice. Geography Compass 2: 1266–85. [Google Scholar] [CrossRef]
  32. Ross, Nicola J., Emma Renold, Sally Holland, and Alexandra Hillman. 2009. Moving stories: Using mobile methods to explore the everyday lives of young people in public care. Qualitative Research 9: 605–23. [Google Scholar] [CrossRef]
  33. Ryall, Kathy, Meredith R. Morris, Katherine Everitt, Clifton Forlines, and Chia Shen. 2006. Experiences with and Observations of Direct-Touch Tabletops. Paper presented at First International Workshop on Horizontal Interactive Human-Computer Systems (TableTop), Adelaide, Australia, January 5–7; pp. 89–96. [Google Scholar]
  34. Sheller, Mimi, and John Urry. 2006. The new mobilities paradigm. Environment and Planning A 38: 207–26. [Google Scholar] [CrossRef]
  35. Stedman, Richard C., Benoni L. Amsden, Thomas M. Beckley, and Keith G. Tidball. 2014. Photo-based methods for understanding place meanings as foundations of attachment. In Place Attachment: Advances in Theory, Methods and Applications. Edited by Lynne C. Manzo and Patrick Devine-Wright. London: Routledge, pp. 112–24. [Google Scholar]
  36. Zaharias, Panagiotis, Michael Despina, and Yiorgos Chrysanthou. 2013. Learning through multi-touch interfaces in museum exhibits: An empirical investigation. Journal of Educational Technology & Society 16: 374–84. [Google Scholar]
Figure 1. All participants’ routes. Routes were grouped into six different touch table sessions.
Socsci 06 00118 g001
Figure 2. Two GPS tracks uploaded into Bing Maps.
Socsci 06 00118 g002
Figure 3. Group engagment with the touch table.
Socsci 06 00118 g003

