
Monitoring the SARS-CoV-2 Pandemic: Prevalence of Antibodies in a Large, Repetitive Cross-Sectional Study of Blood Donors in Germany—Results from the SeBluCo Study 2020–2022
 , , , , , , , , add
Show full author list
, , , , , , , , add
Show full author list
Abstract
:1. Introduction
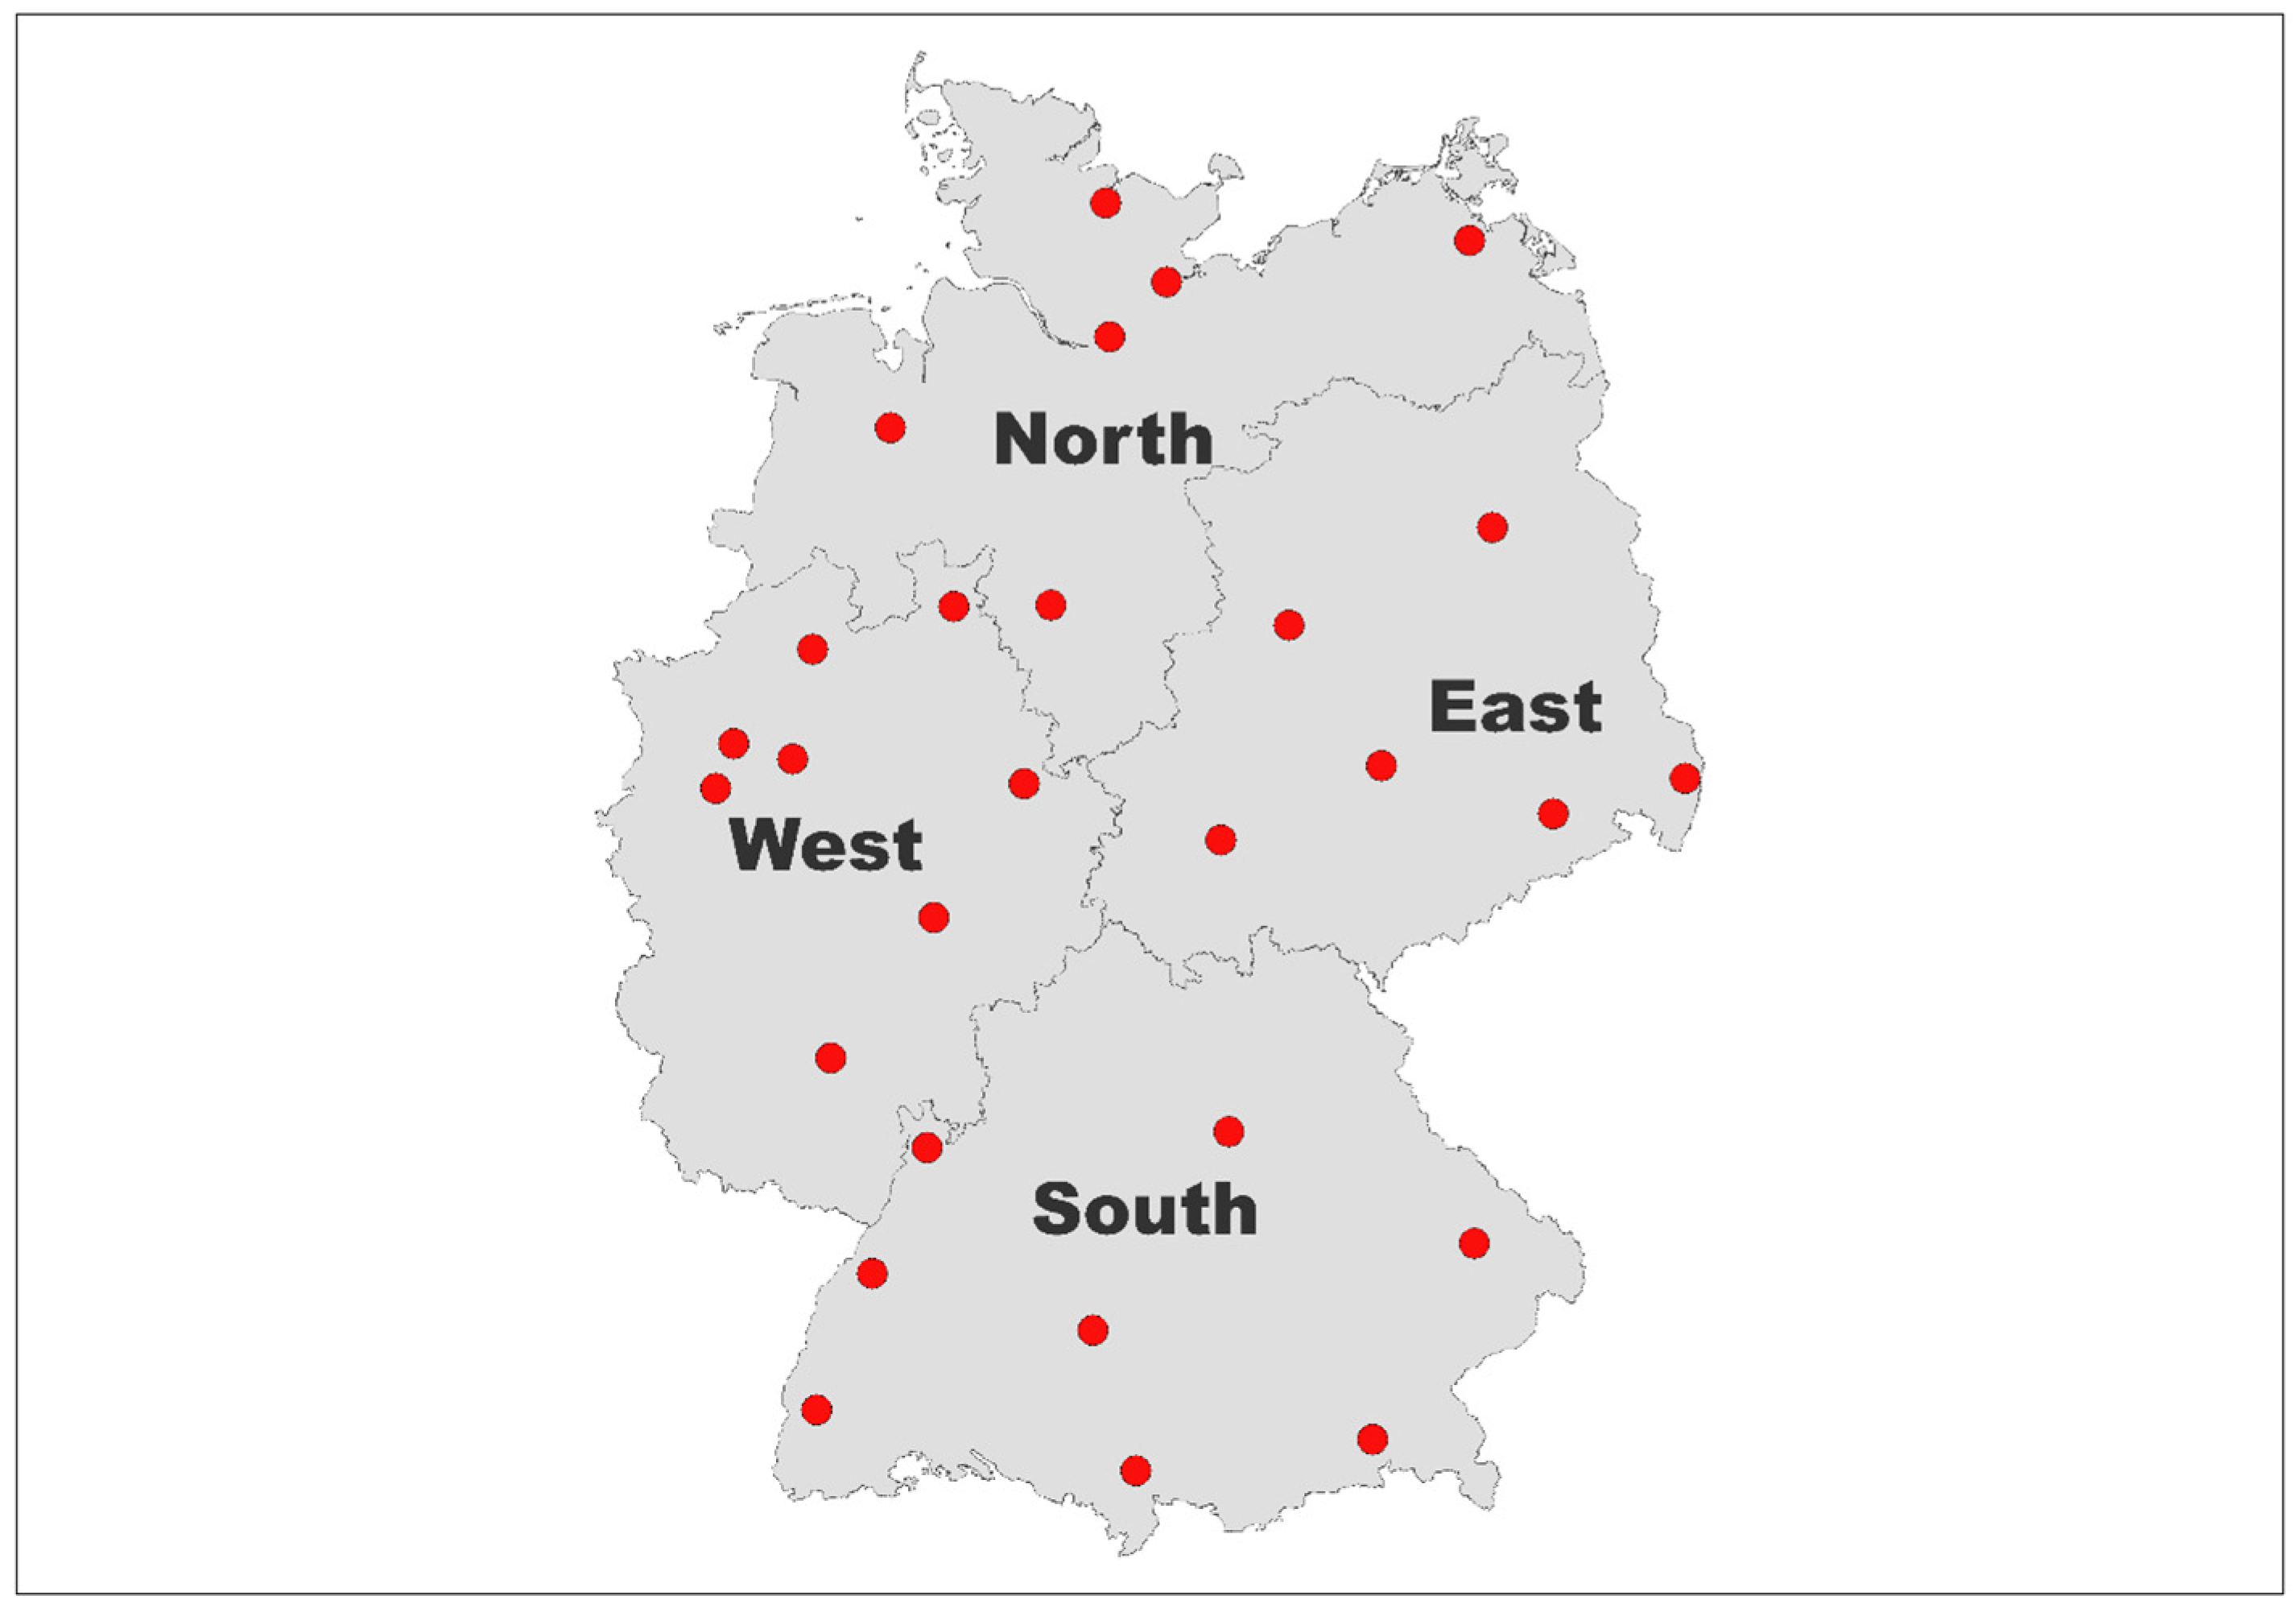
2. Materials and Methods
- German Red Cross Blood Service West (4 CA)
- University Medicine Greifswald (1 CA)
- University Hospital Magdeburg (1 CA)
- University Hospital Giessen and Marburg (1 CA)
- University Hospital Hamburg Eppendorf (1 CA)
- University Hospital Essen (1 CA)
- Medical Center University of Freiburg (1 CA)
- University Hospital of Schleswig-Holstein (2 CA)
- Bavarian Red Cross Blood Service (4 CA)
- German Red Cross Blood Transfusion Service Baden-Württemberg—Hessen, Frankfurt (6 CA)
- Haema AG (3 CA)
- German Red Cross Blood Service NSTOB (2 CA)
- Institute for Laboratory and Transfusion Medicine, Heart and Diabetes Centre NRW (1 CA).
2.1. Laboratory Testing
2.2. Demographic Data, Case Numbers and Vaccination Coverage Rates
2.3. Statistical Methods
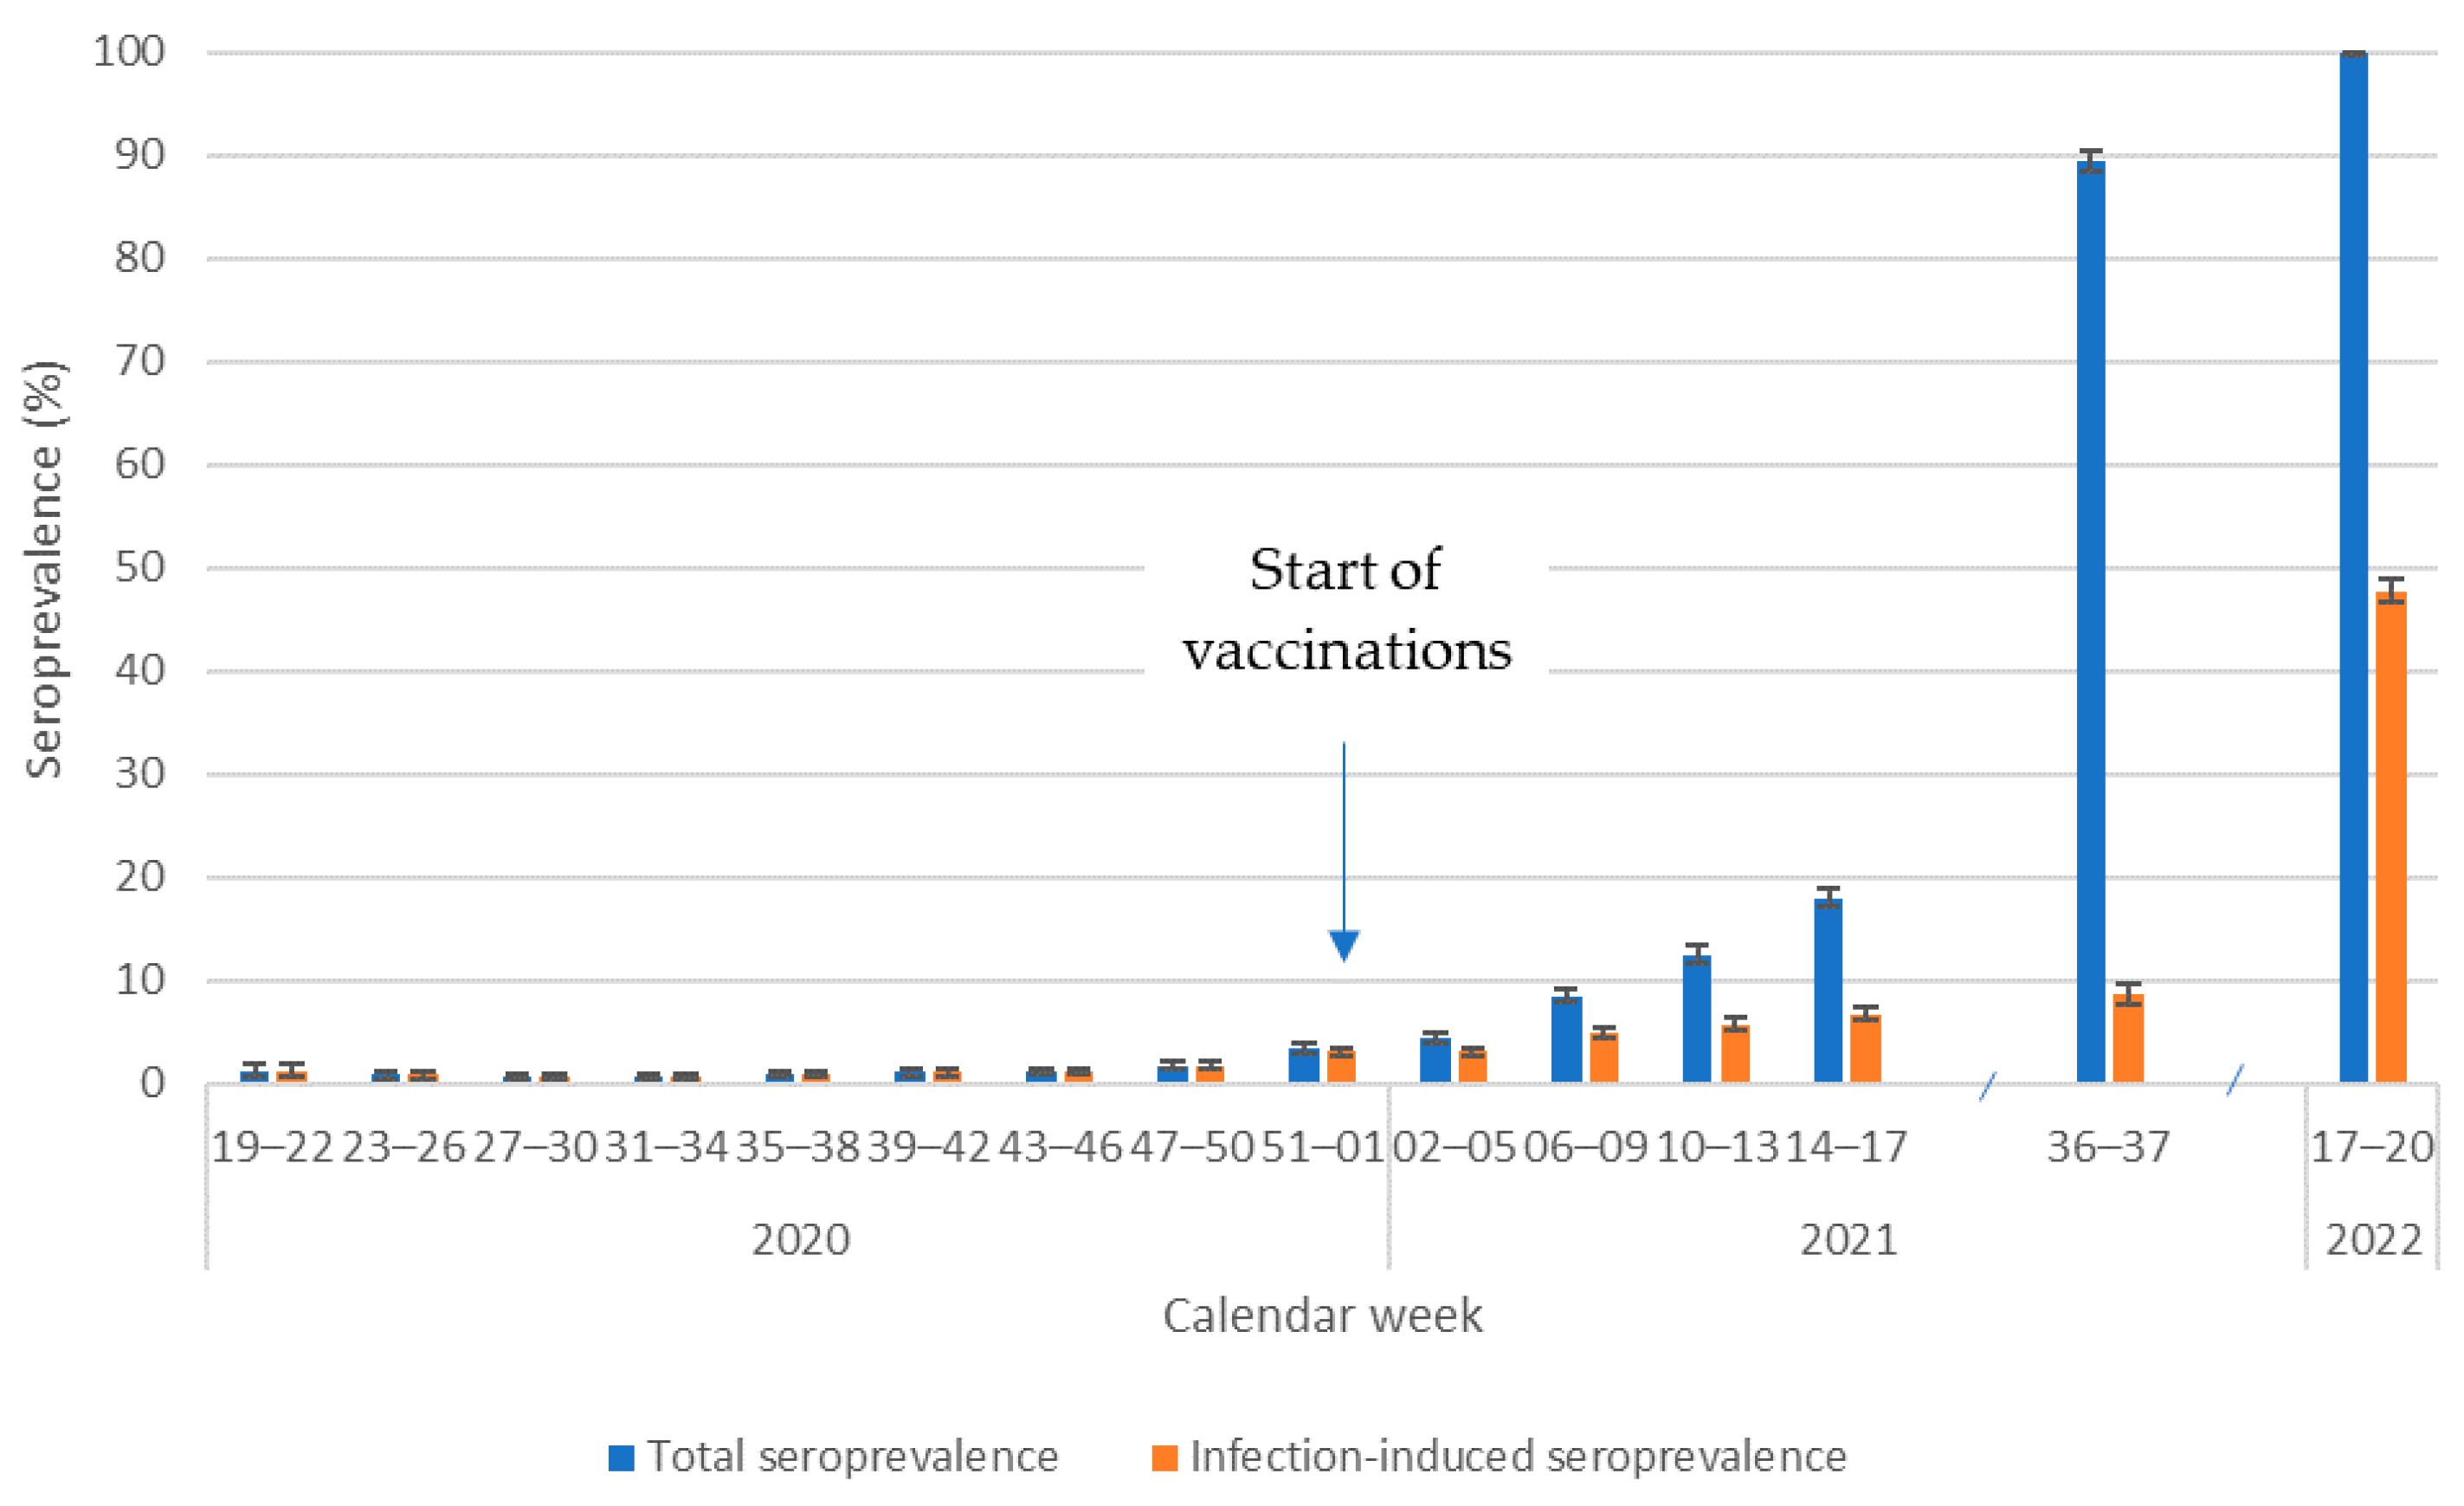
- Total SARS-CoV-2 seroprevalence was defined as the prevalence of specimens with S1 antibodies.
- In 2020, the prevalence of S1 antibodies indicated infection-induced SARS-CoV-2 seroprevalence in the absence of vaccinations. In 2021 and 2022, after the beginning of vaccinations, infection-induced seroprevalence was defined as the prevalence of specimens with both S1 and N antibodies.
- Vaccination-induced seroprevalence was defined as total seroprevalence minus infection-induced seroprevalence after the introduction of vaccinations.
3. Results
3.1. Total Study-Wide Seroprevalence over Time
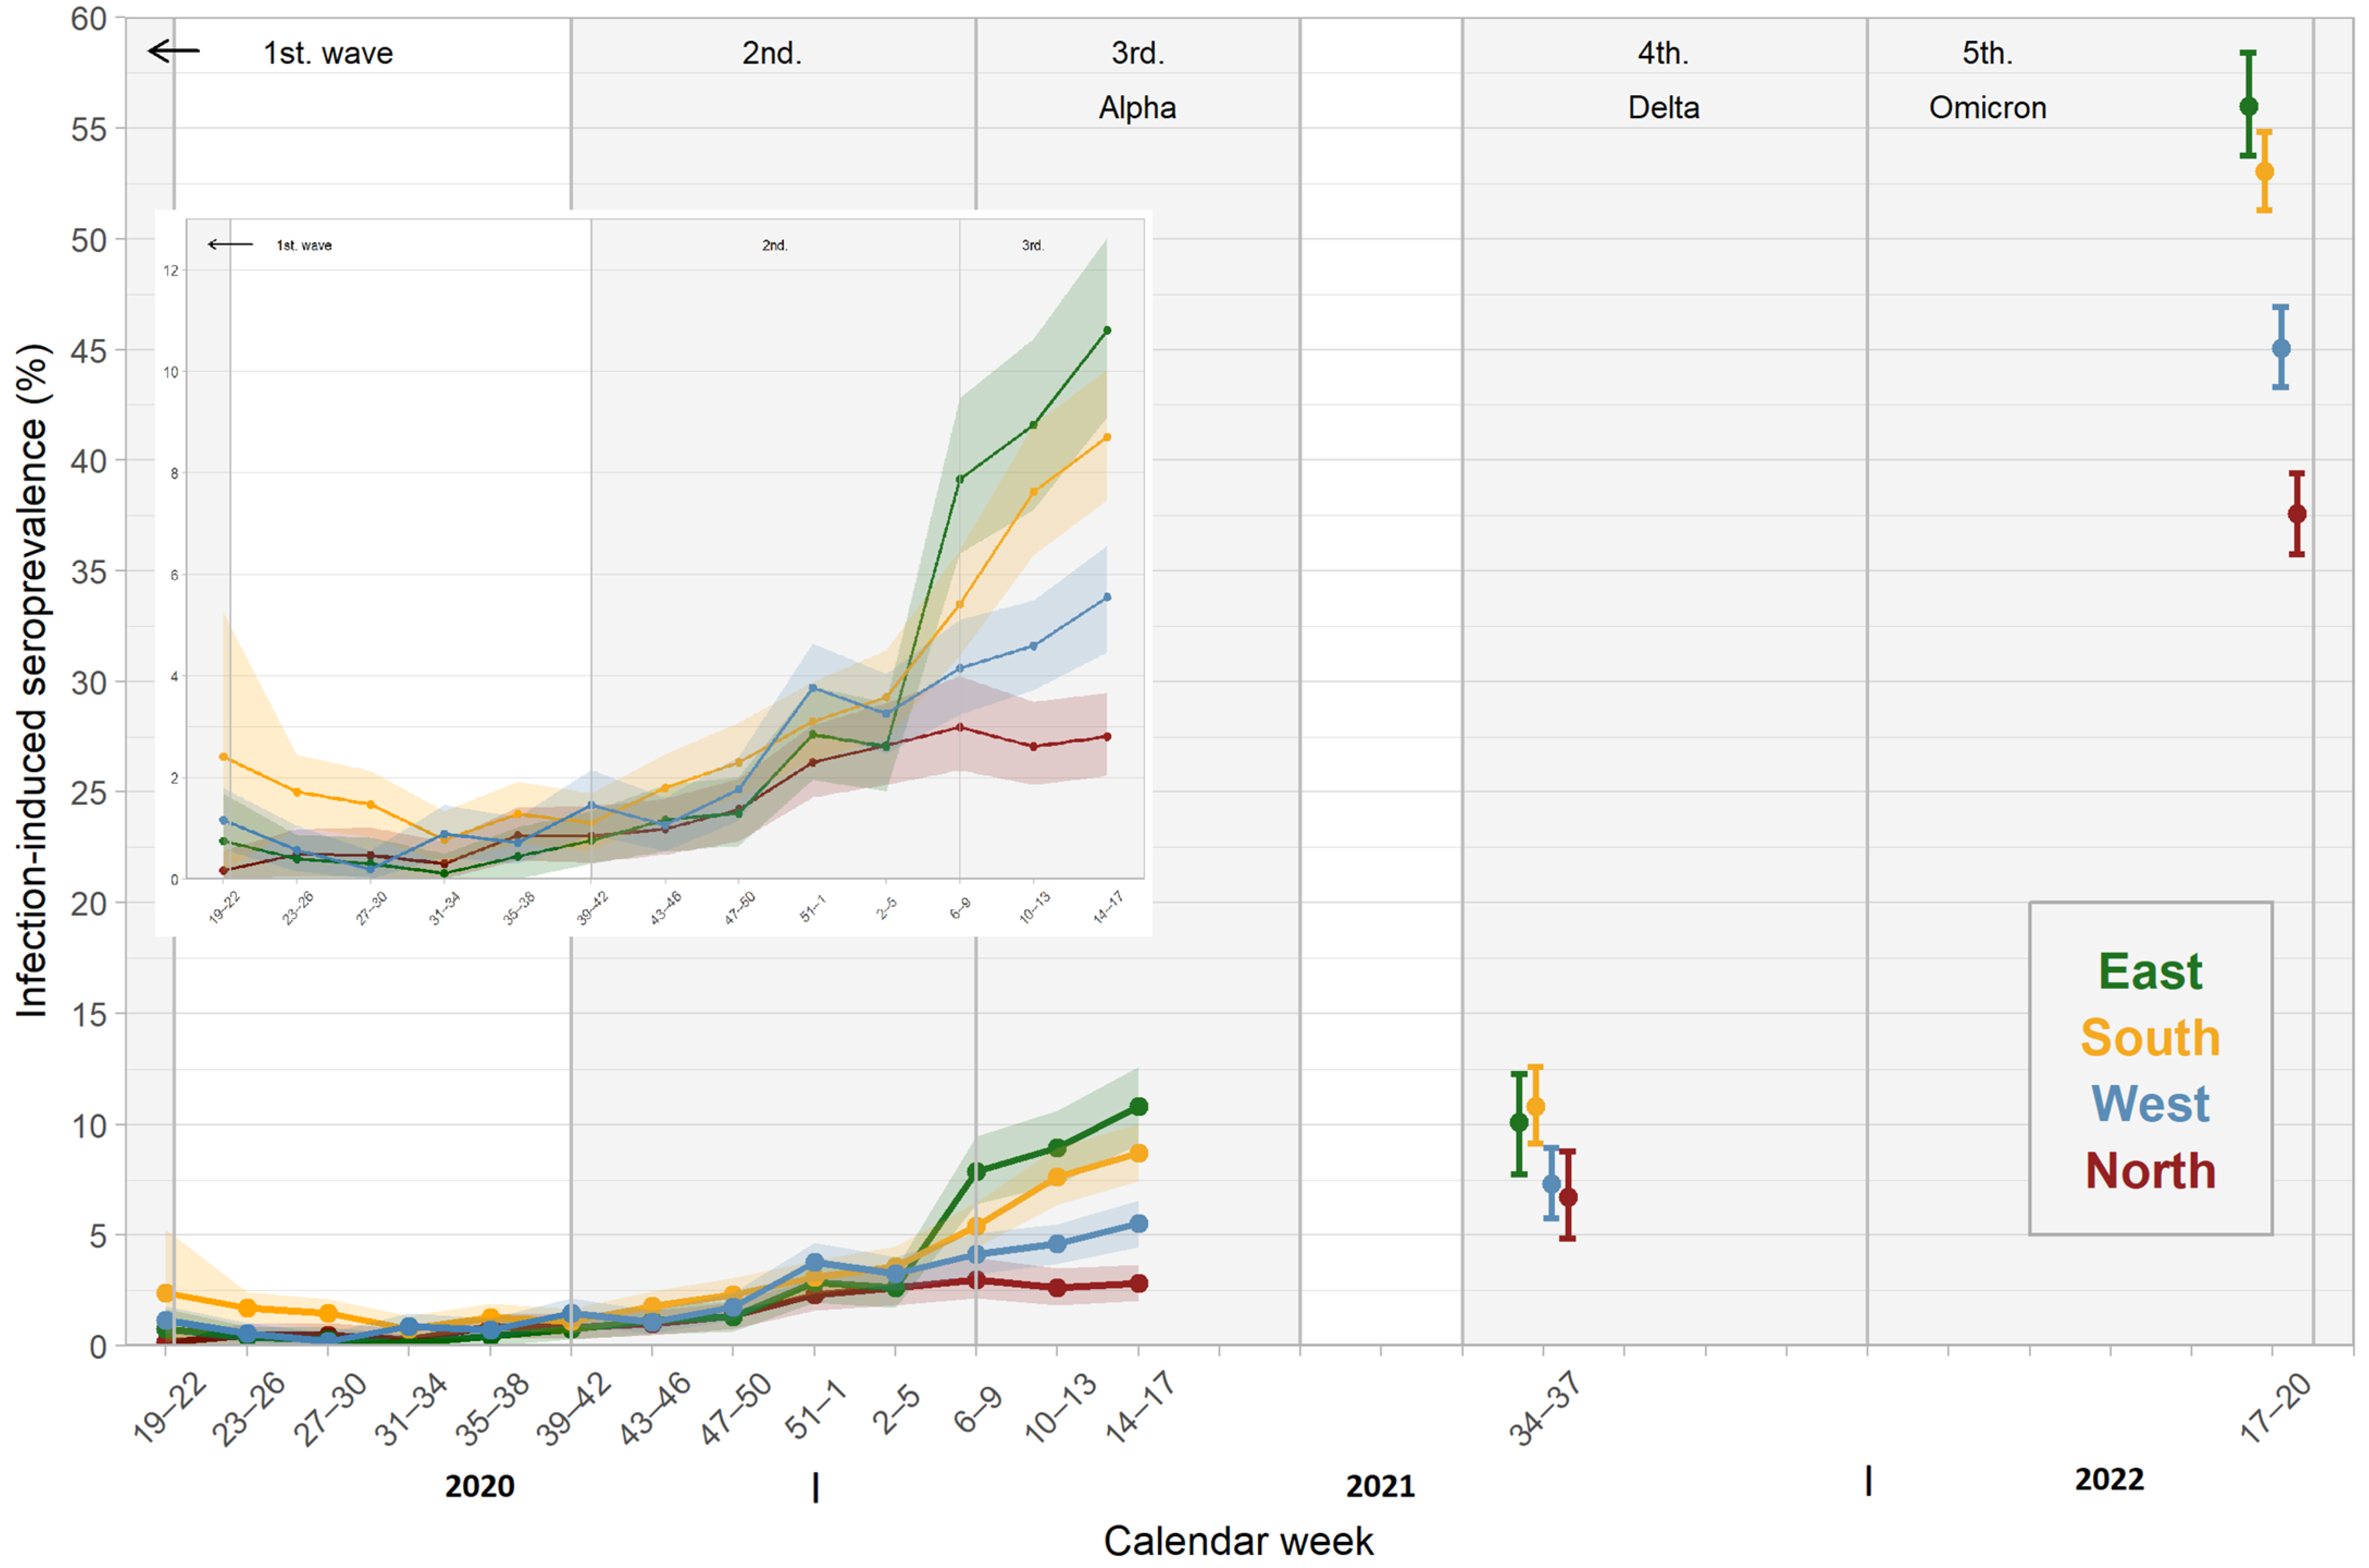
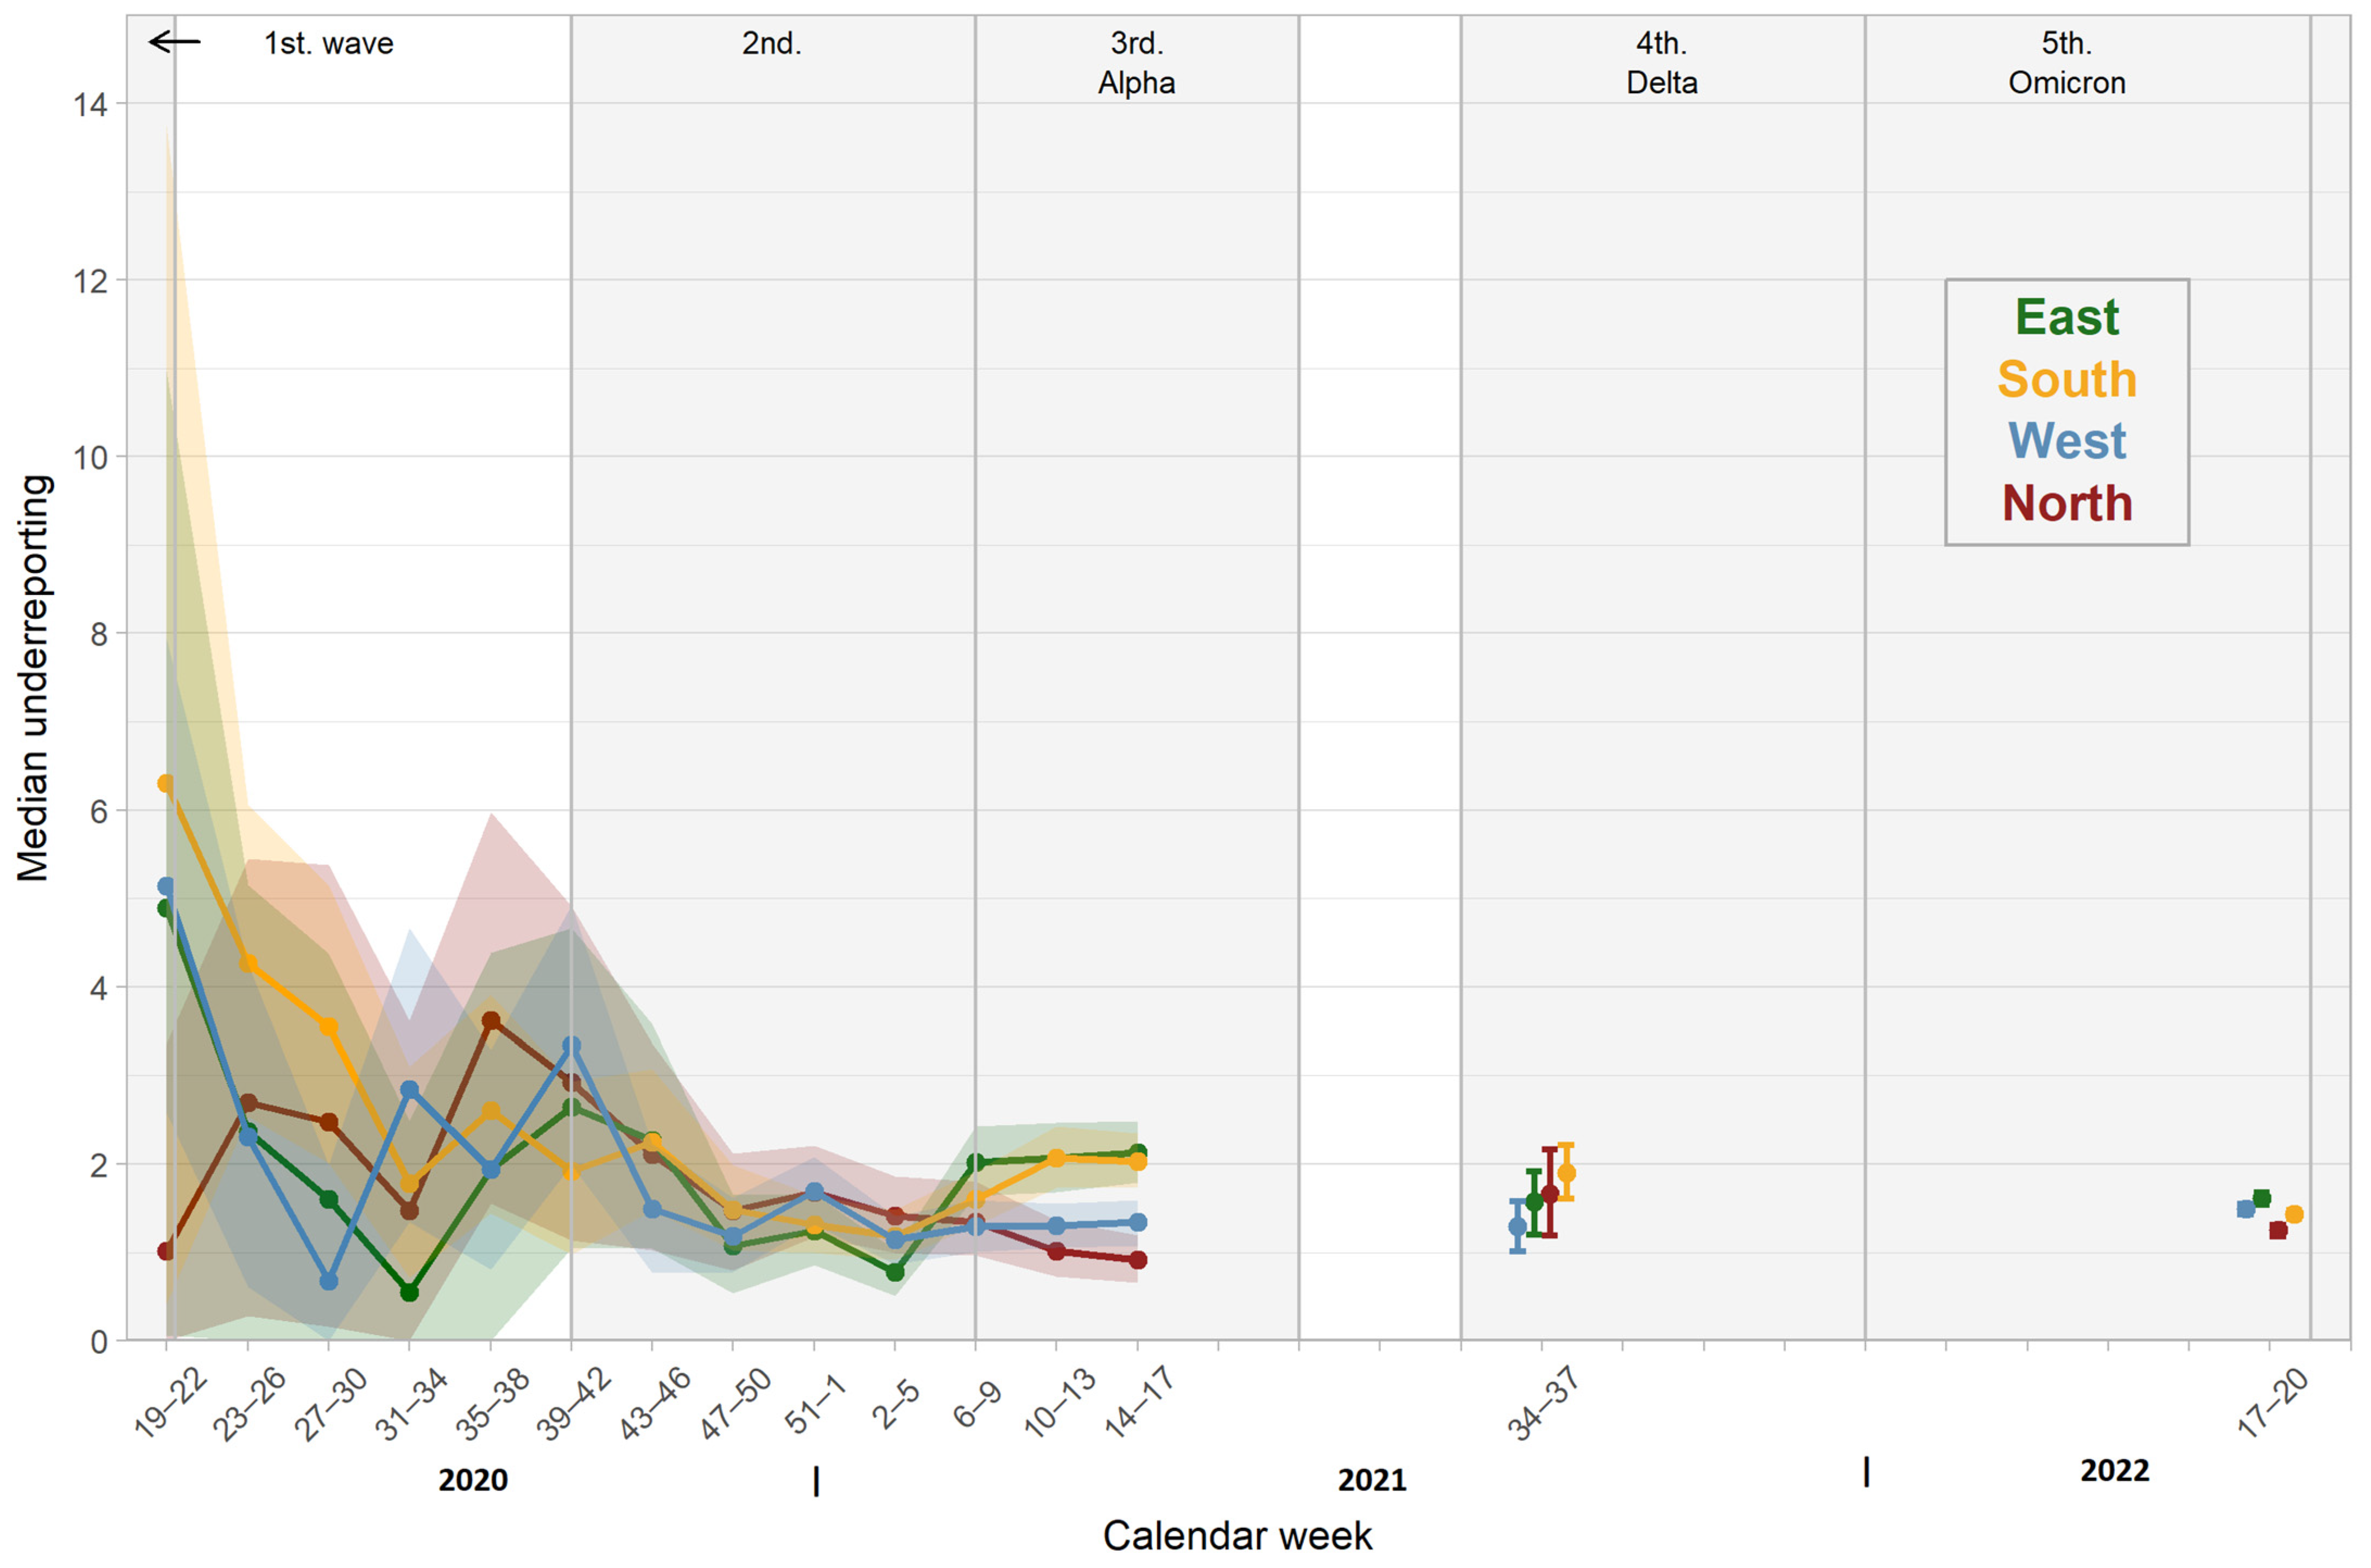
3.2. Seroprevalence in Different Regions
3.3. Seroprevalence Stratified by Sex and Age
3.3.1. Sex
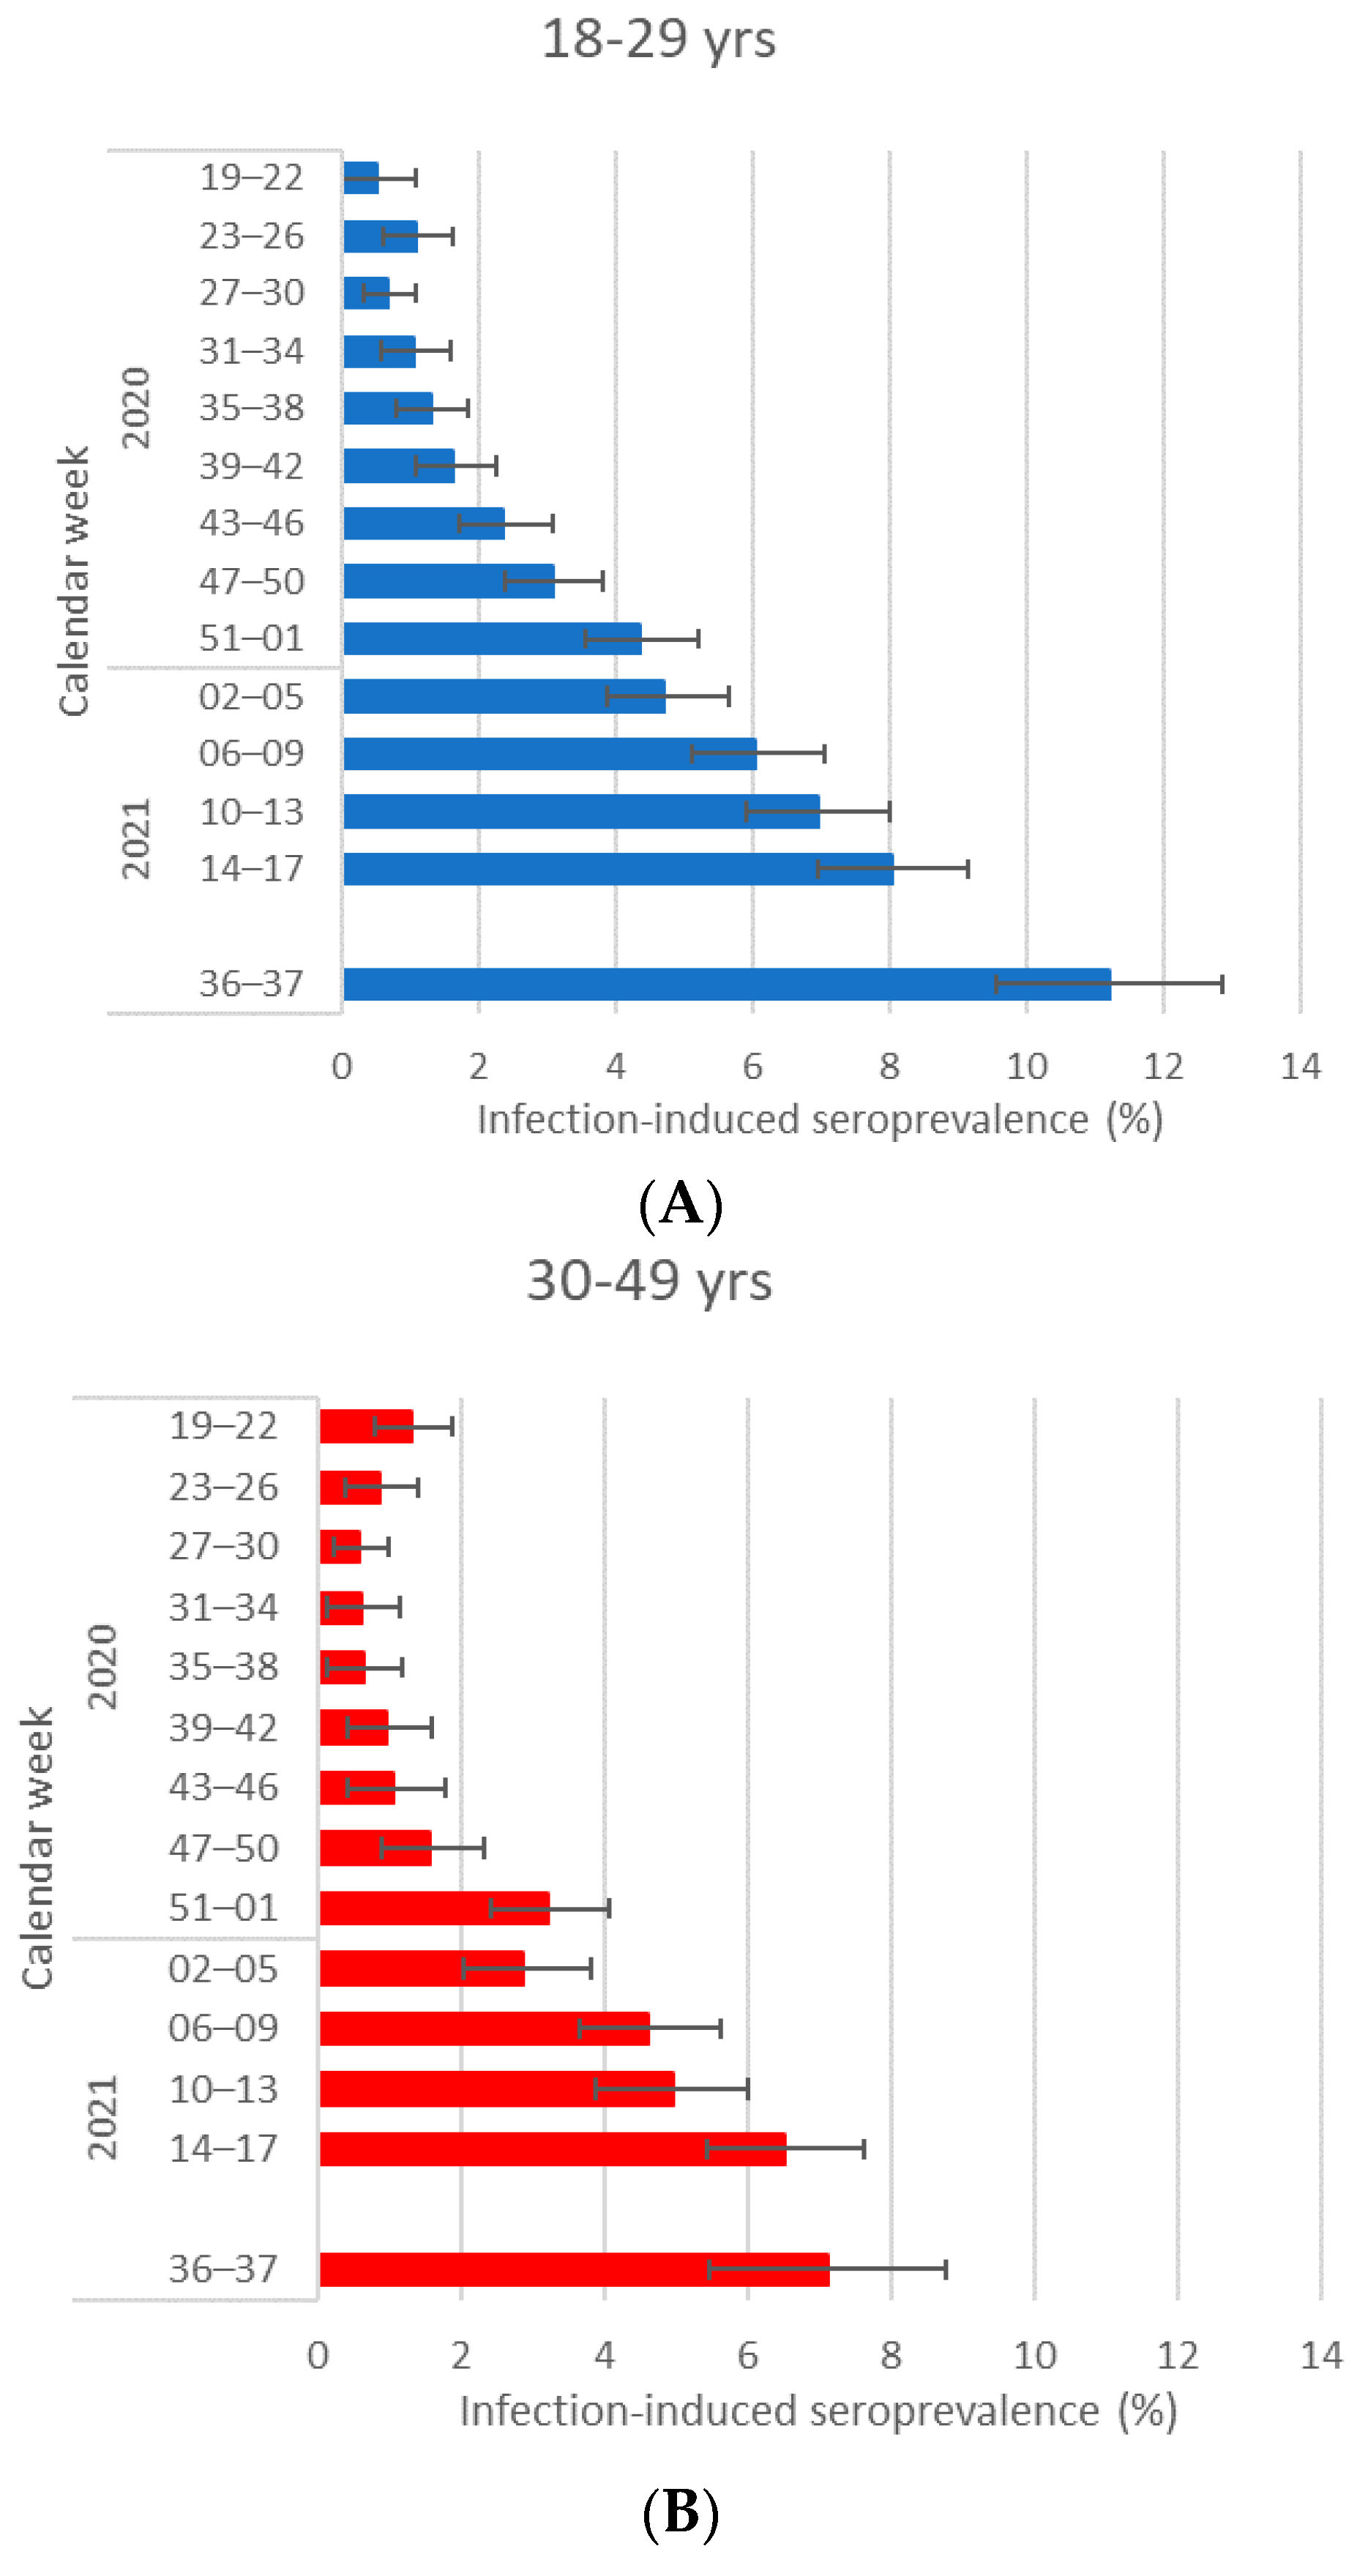
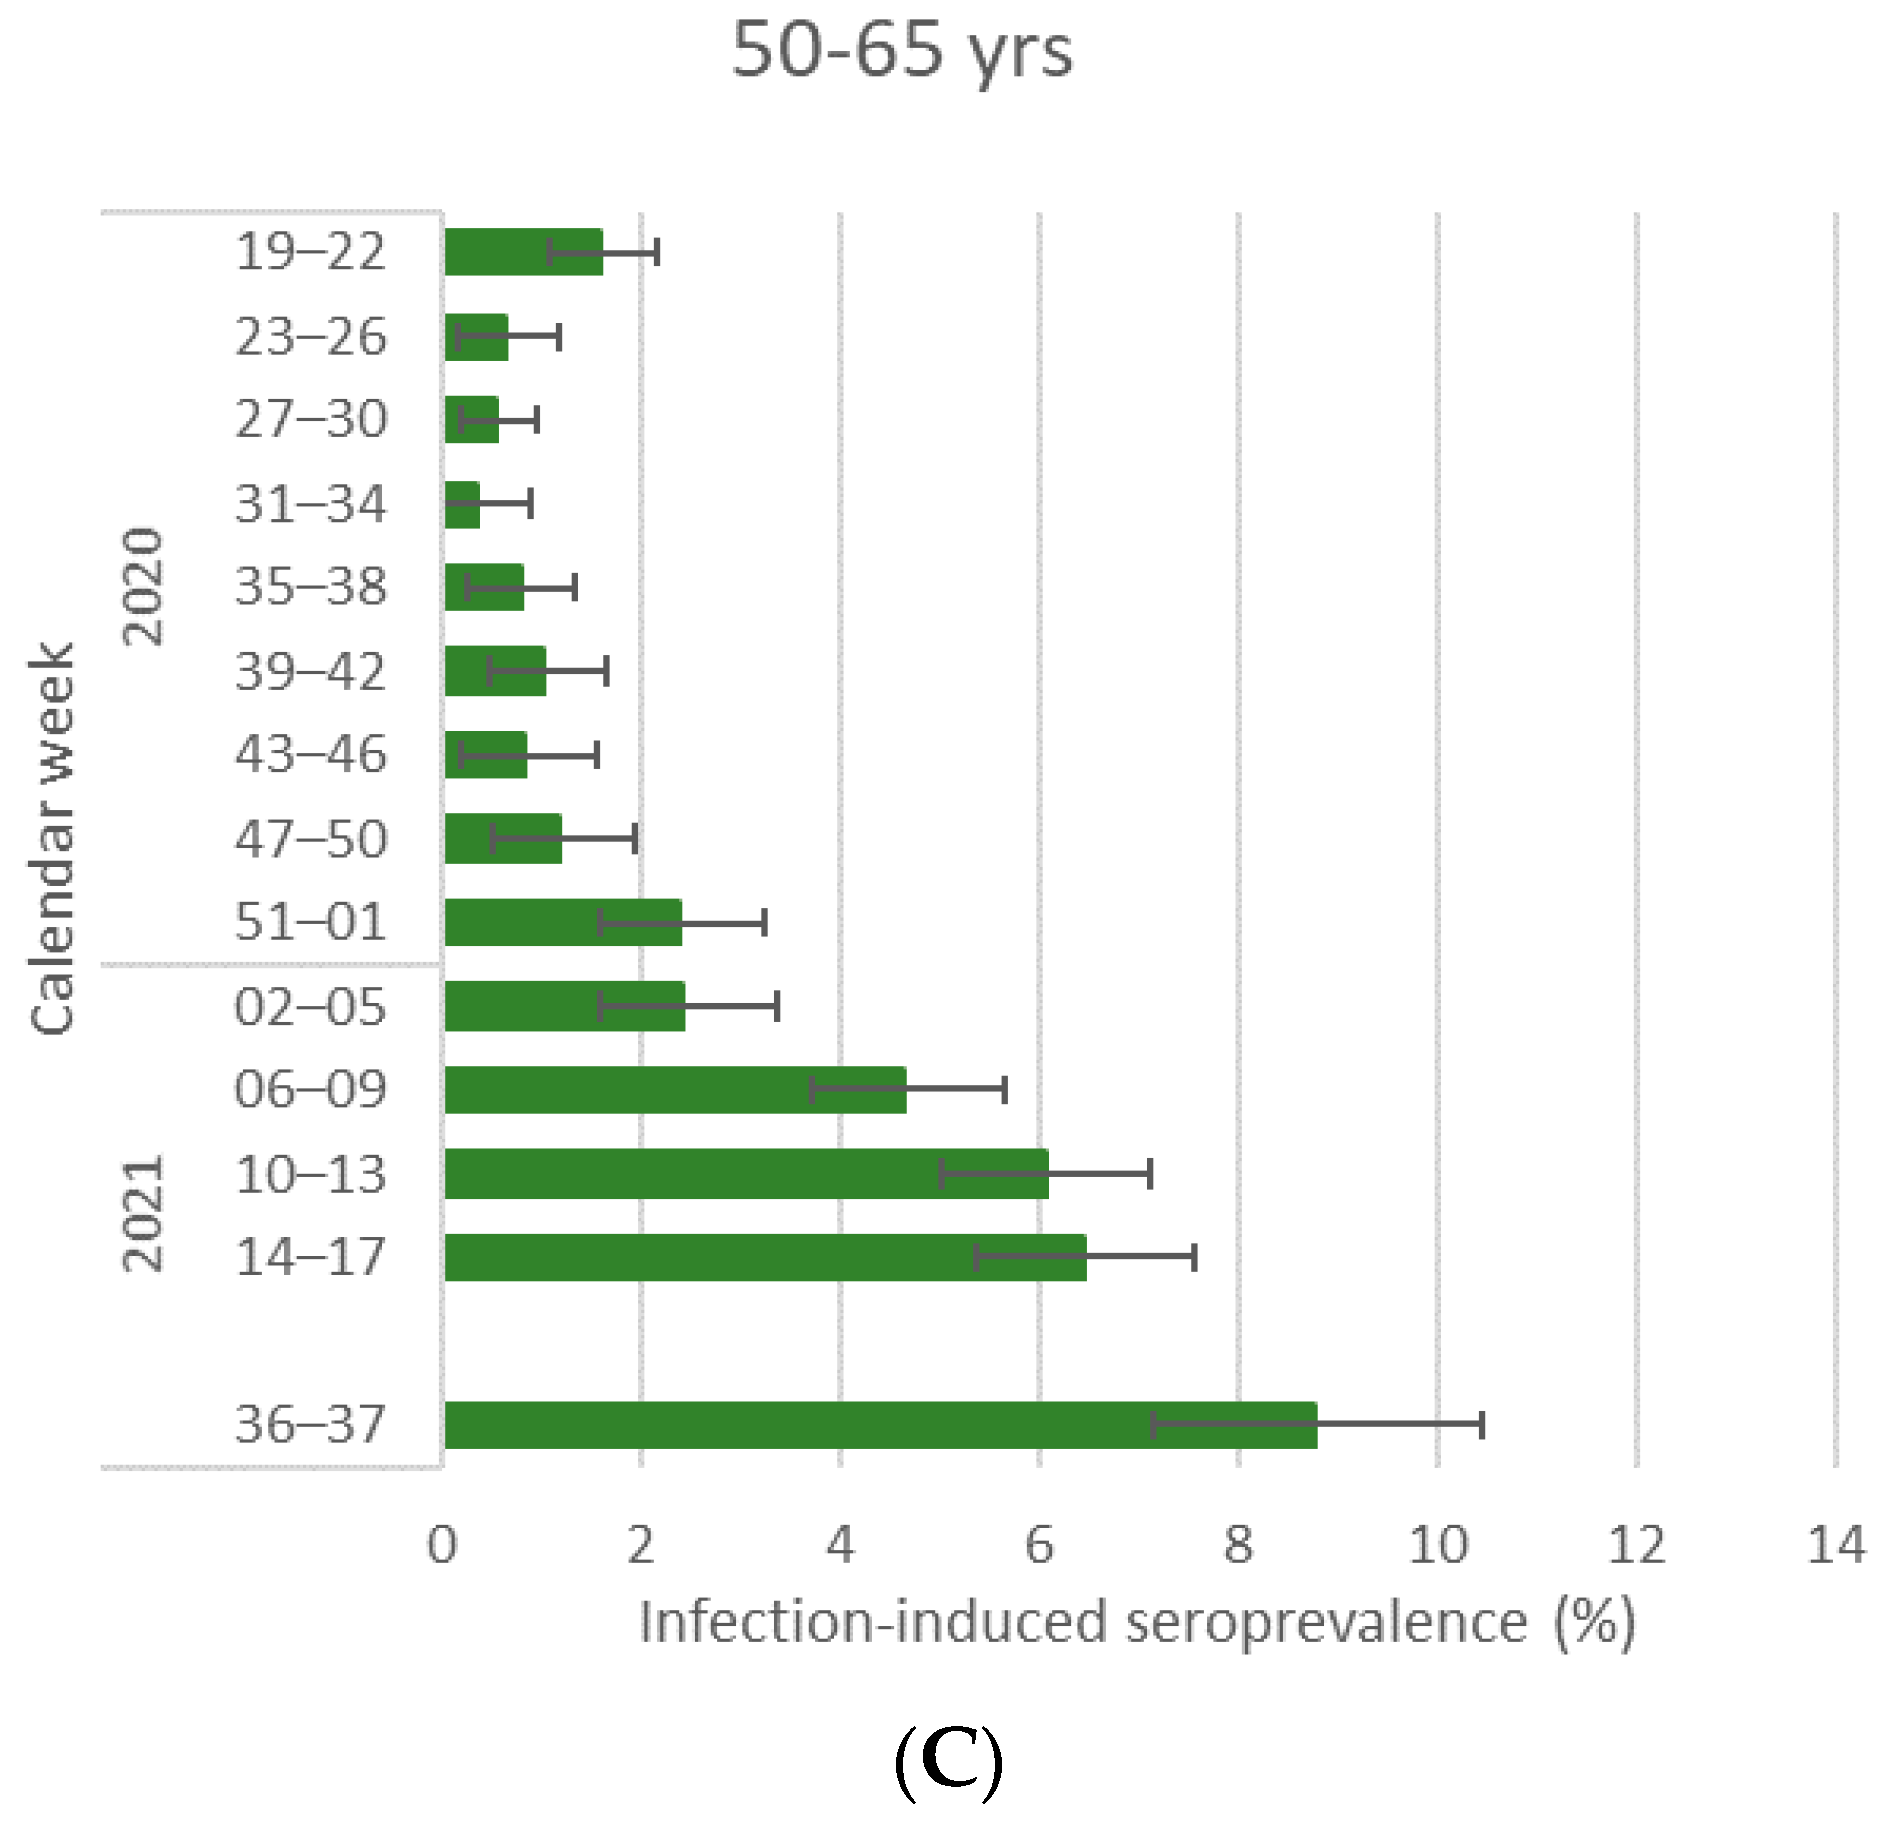
3.3.2. Age
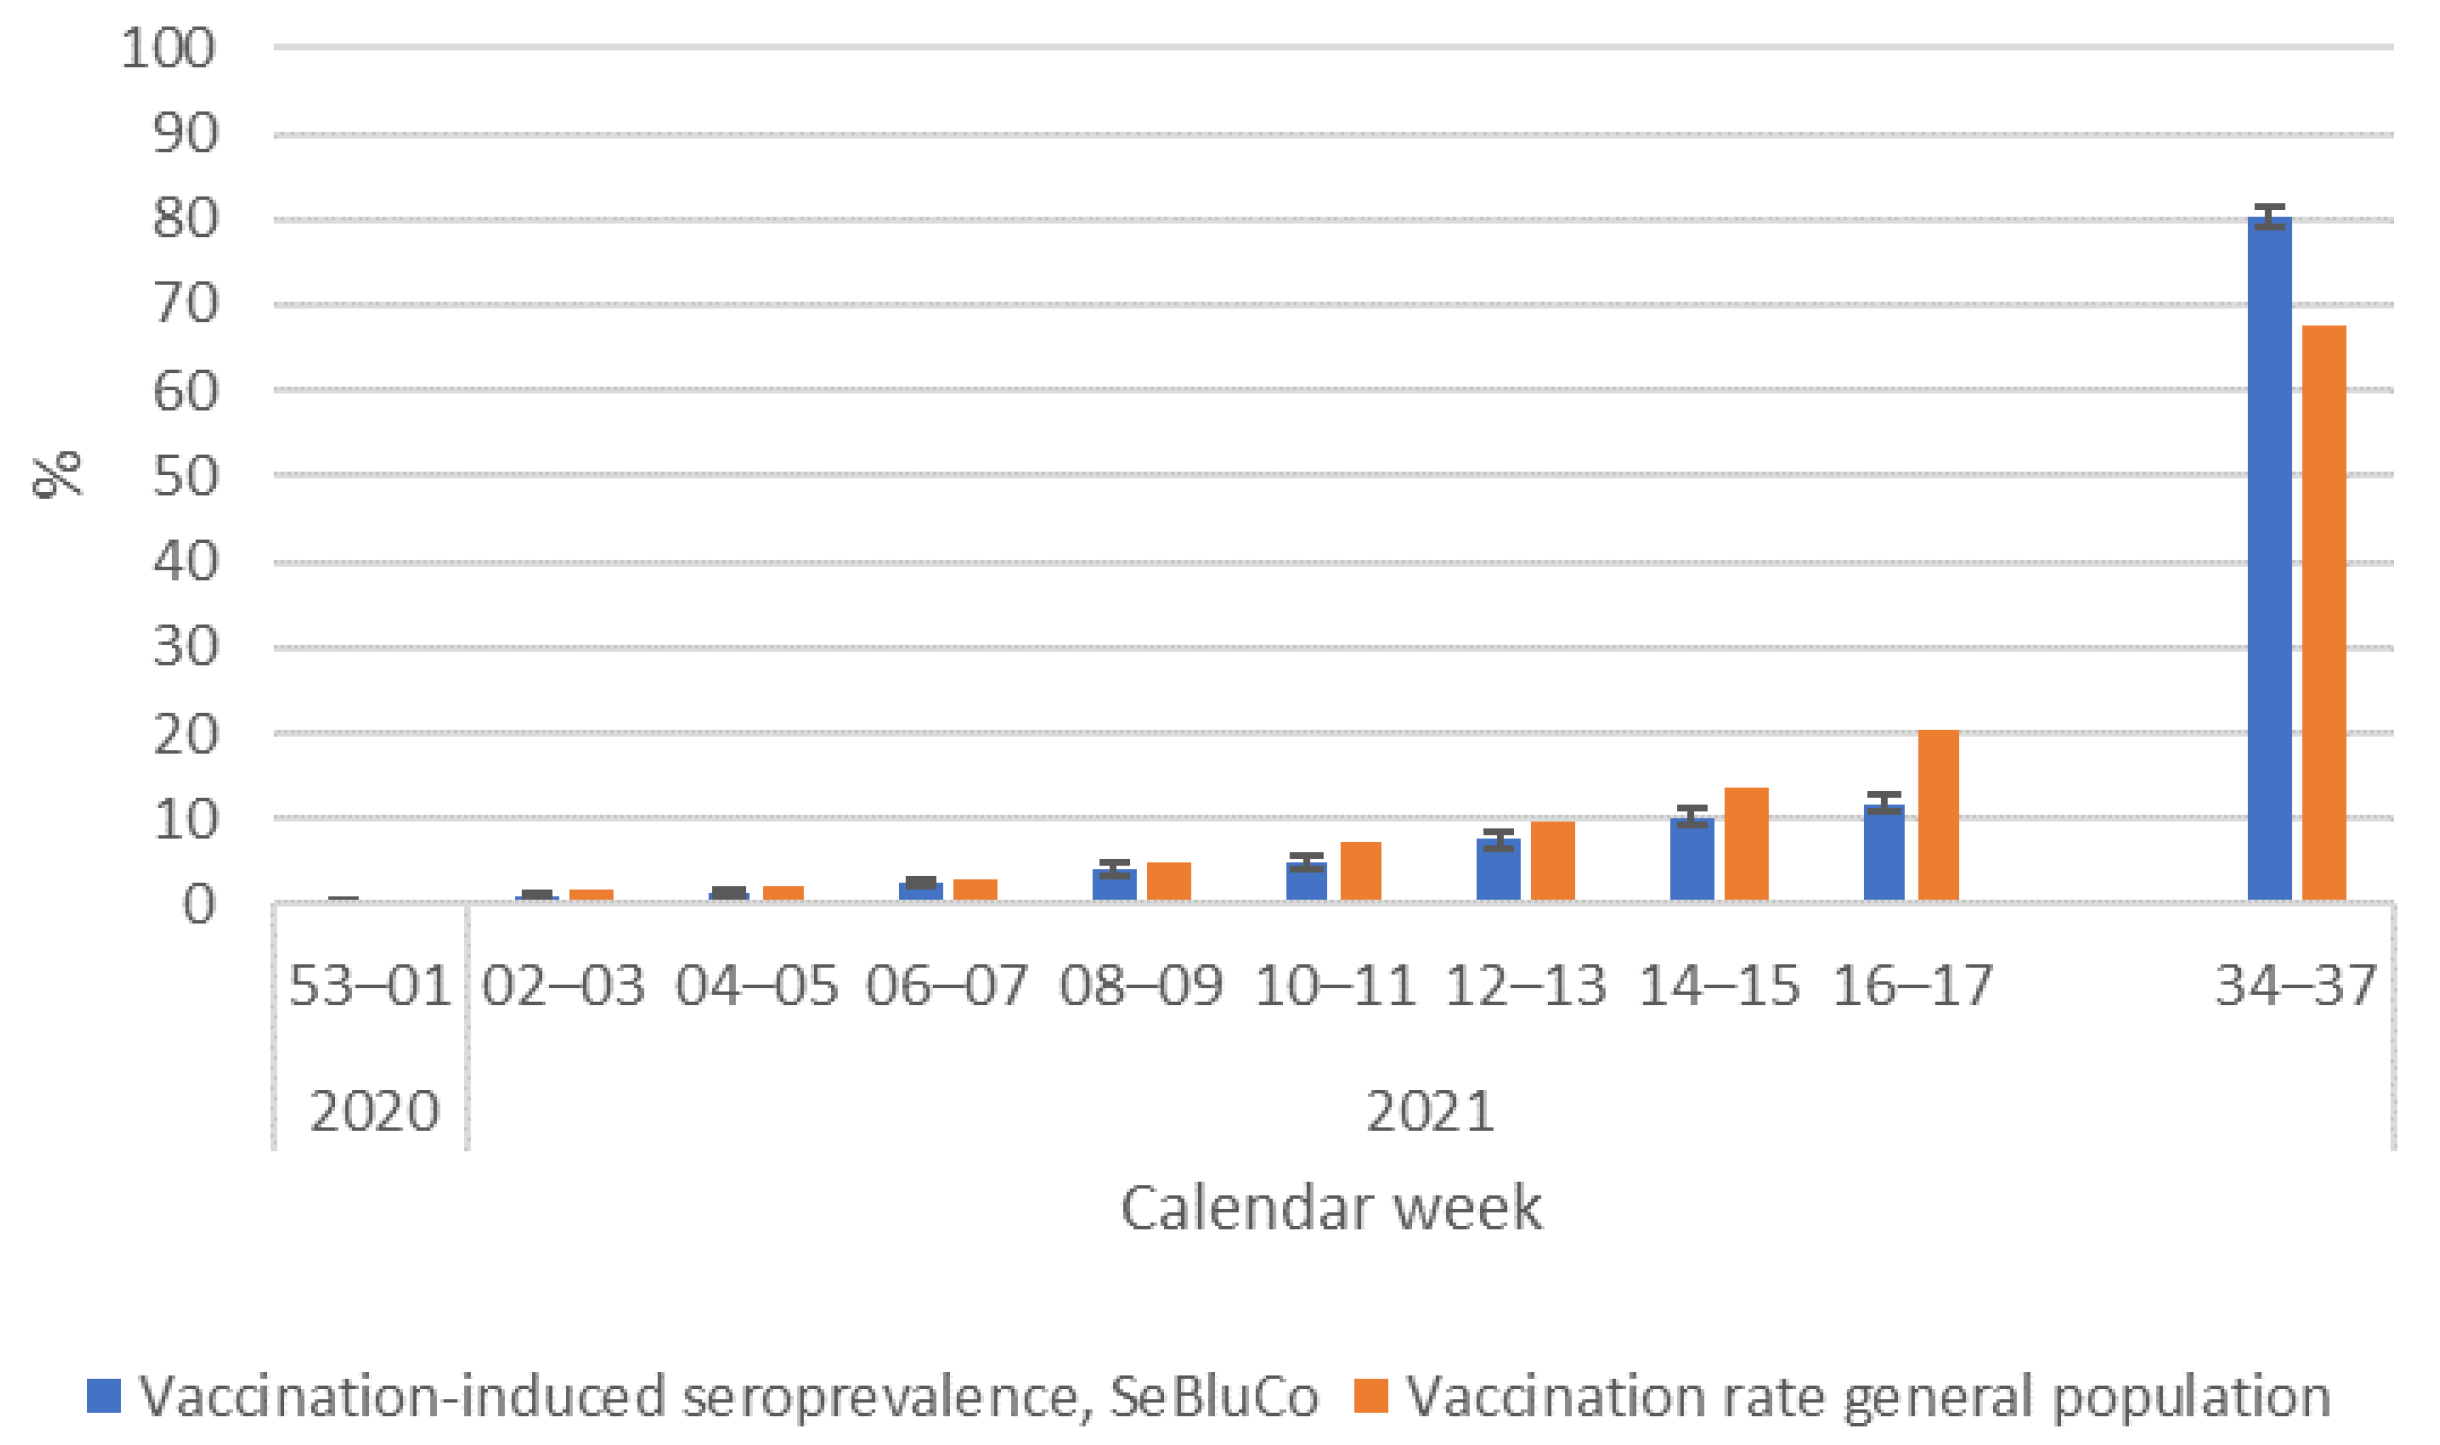
3.4. Comparison of Reported Vaccinations with Vaccine-Induced Seroprevalence
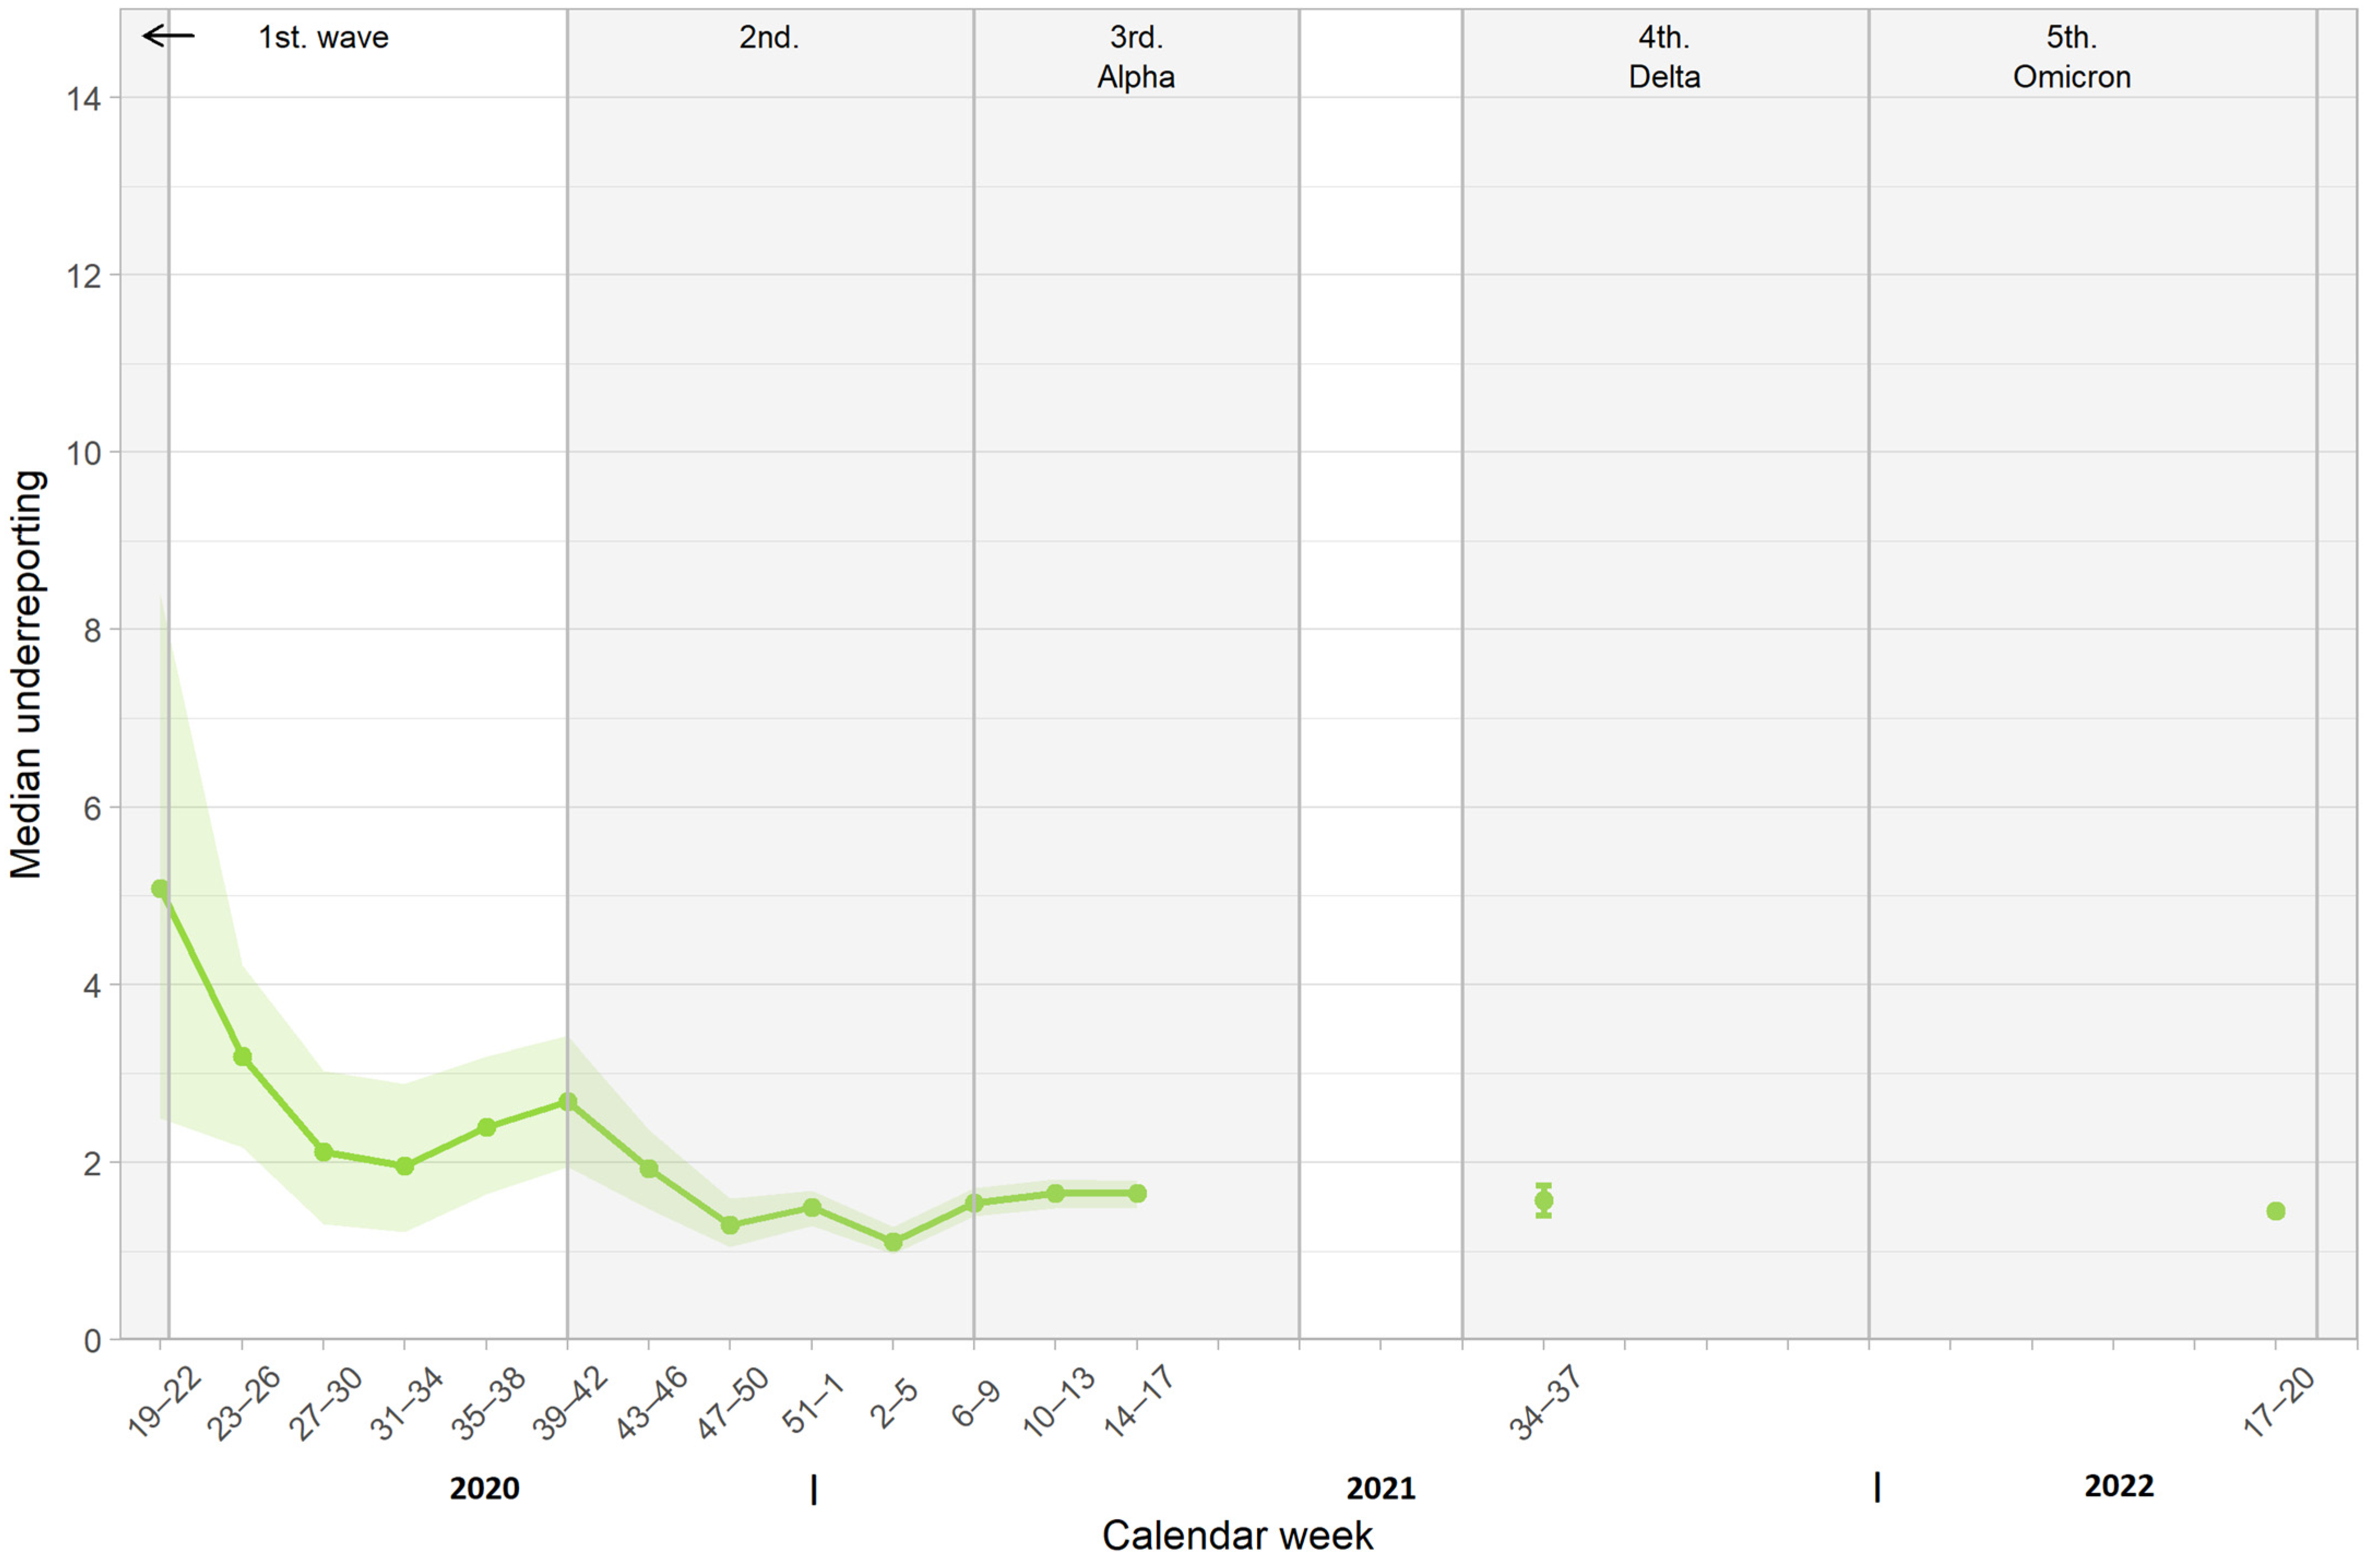
3.5. Comparison of Cumulative Case Reporting Rate and Infection-Induced Seroprevalence
3.6. Comparison of Seroprevalence Data with Data from Studies with Different Sampling Approaches
- SERODUS measured seroprevalence in young adults (aged 18–30 years) in Düsseldorf [25] and we compared it to the results from 18–29-year-old SeBluCo participants in the region “West”. SERODUS used a random sampling method using the population registry and tested samples with the Elecsys Anti-SARS-CoV-2 immunoassay, targeted against nucleocapsid (Roche Diagnostics, Mannheim, Germany). Data were adjusted for test performance and weighted for population characteristics.
- MusPAD, which measured seroprevalence in the general population in the region of Reutlingen, Freiburg, Aachen, Osnabrück, Magdeburg, and Chemnitz [3]. MusPAD used a random sampling method using the population registries and the S1 IgG ELISA (EUROIMMUN, Lübeck, Germany). Participants were 18–79 years of age and were compared to SeBluCo participants aged 18–65 years. Data were adjusted for test performance and weighted for population characteristics.
- The nationwide representative RKI-SOEP study (wave 1) used the S1 IgG ELISA (EUROIMMUN, Lübeck, Germany) with dried blood spots [26]. Data were compared for the subset of 18–69-year-old RKI-SOEP participants to 18–65-year-old SeBluCo participants (all regions). Data were adjusted for test performance and weighted for population characteristics.
4. Discussion
Supplementary Materials
Author Contributions
Funding
Institutional Review Board Statement
Informed Consent Statement
Data Availability Statement
Acknowledgments
Conflicts of Interest
References
- Böhmer, M.M.; Buchholz, U.; Corman, V.M.; Hoch, M.; Katz, K.; Marosevic, D.V.; Böhm, S.; Woudenberg, T.; Ackermann, N.; Konrad, R.; et al. Investigation of a COVID-19 outbreak in Germany resulting from a single travel-associated primary case: A case series. Lancet Infect. Dis. 2020, 20, 920–928. [Google Scholar] [CrossRef]
- Robert Koch Institute. COVID-19 Dashboard 2023. Available online: https://experience.arcgis.com/experience/478220a4c454480e823b17327b2bf1d4 (accessed on 27 February 2023).
- Gornyk, D.; Harries, M.; Gloeckner, S.; Strengert, M.; Kerrinnes, T.; Heise, J.-K.; Maaß, H.; Ortmann, J.; Kessel, B.; Kemmling, Y.; et al. SARS-CoV-2 seroprevalence in Germany. Dtsch. Arztebl. Int. 2021, 118, 824–831. [Google Scholar] [CrossRef] [PubMed]
- Pritsch, M.; Radon, K.; Bakuli, A.; Le Gleut, R.; Olbrich, L.; Guggenbühl Noller, J.G.; Saathoff, E.; Castelletti, N.; Garí, M.; Pütz, P.; et al. Prevalence and Risk Factors of Infection in the Representative COVID-19 Cohort Munich. Int. J. Environ. Res. Public Health 2021, 18, 3572. [Google Scholar] [CrossRef] [PubMed]
- Wachtler, B.; Müters, S.; Michalski, N.; Koschollek, C.; Albrecht, S.; Haller, S.; Hamouda, O.; Hövener, C.; Hoebel, J. Socioeconomic inequalities in the prevalence and perceived dangerousness of SARS-CoV-2 infections in two early German hotspots: Findings from a seroepidemiological study. BMC Res. Notes 2021, 14, 375. [Google Scholar] [CrossRef]
- Santos-Hövener, C.; Neuhauser, H.K.; Rosario, A.S.; Busch, M.; Schlaud, M.; Hoffmann, R.; Gößwald, A.; Koschollek, C.; Hoebel, J.; Allen, J.; et al. Serology- and PCR-based cumulative incidence of SARS-CoV-2 infection in adults in a successfully contained early hotspot (CoMoLo study), Germany, May to June 2020. Eurosurveillance 2020, 25, 2001752. [Google Scholar] [CrossRef]
- Stone, M.; Di Germanio, C.; Wright, D.J.; Sulaeman, H.; Dave, H.; Fink, R.V.; Notari, E.P.; Green, V.; Strauss, D.; Kessler, D.; et al. Use of US Blood Donors for National Serosurveillance of Severe Acute Respiratory Syndrome Coronavirus 2 Antibodies: Basis for an Expanded National Donor Serosurveillance Program. Clin. Infect. Dis. 2022, 74, 871–881. [Google Scholar] [CrossRef]
- Amirthalingam, G.; Whitaker, H.; Brooks, T.; Brown, K.; Hoschler, K.; Linley, E.; Borrow, R.; Brown, C.; Watkins, N.; Roberts, D.J.; et al. Seroprevalence of SARS-CoV-2 among Blood Donors and Changes after Introduction of Public Health and Social Measures, London, UK. Emerg. Infect. Dis. 2021, 27, 1795–1801. [Google Scholar] [CrossRef]
- Jespersen, S.; Mikkelsen, S.; Greve, T.; Kaspersen, K.A.; Tolstrup, M.; Boldsen, J.K.; Redder, J.D.; Nielsen, K.; Abildgaard, A.M.; Kolstad, H.A.; et al. Severe Acute Respiratory Syndrome Coronavirus 2 Seroprevalence Survey among 17 971 Healthcare and Administrative Personnel at Hospitals, Prehospital Services, and Specialist Practitioners in the Central Denmark Region. Clin. Infect. Dis. 2021, 73, e2853–e2860. [Google Scholar] [CrossRef] [PubMed]
- Jones, J.M.; Stone, M.; Sulaeman, H.; Fink, R.V.; Dave, H.; Levy, M.E.; Di Germanio, C.; Green, V.; Notari, E.; Saa, P.; et al. Estimated US Infection- and Vaccine-Induced SARS-CoV-2 Seroprevalence Based on Blood Donations, July 2020–May 2021. JAMA 2021, 326, 1400–1409. [Google Scholar] [CrossRef] [PubMed]
- Slot, E.; Hogema, B.M.; Reusken, C.B.E.M.; Reimerink, J.H.; Molier, M.; Karregat, J.H.M.; Ijlst, J.; Novotný, V.M.J.; van Lier, R.A.W.; Zaaijer, H.L. Low SARS-CoV-2 seroprevalence in blood donors in the early COVID-19 epidemic in the Netherlands. Nat. Commun. 2020, 11, 5744. [Google Scholar] [CrossRef]
- Fink, R.V.; Fisher, L.; Sulaeman, H.; Dave, H.; Levy, M.E.; McCann, L.; Di Germanio, C.; Notari, E.P.; Green, V.; Cyrus, S.; et al. How do we …form and coordinate a national serosurvey of SARS-CoV-2 within the blood collection industry? Transfusion 2022, 62, 1321–1333. [Google Scholar] [CrossRef]
- Bajema, K.L.; Wiegand, R.E.; Cuffe, K.; Patel, S.V.; Iachan, R.; Lim, T.; Lee, A.; Moyse, D.; Havers, F.P.; Harding, L.; et al. Estimated SARS-CoV-2 Seroprevalence in the US as of September 2020. JAMA Intern. Med. 2021, 181, 450–460. [Google Scholar] [CrossRef]
- SeroTracker. Available online: https://serotracker.com/en/Explore (accessed on 27 February 2023).
- Bergeri, I.; Whelan, M.G.; Ware, H.; Subissi, L.; Nardone, A.; Lewis, H.C.; Li, Z.; Ma, X.; Valenciano, M.; Cheng, B.; et al. Global SARS-CoV-2 seroprevalence from January 2020 to April 2022: A systematic review and meta-analysis of standardized population-based studies. PLoS Med. 2022, 19, e1004107. [Google Scholar] [CrossRef]
- Tolksdorf, K.; Loenebach, A.; Buda, S. Dritte Aktualisierung der “Retrospektiven Phaseneinteilung der COVID-19-Pandemie in Deutschland”. Epid. Bull. 2022, 38, 3–6. [Google Scholar] [CrossRef]
- World Health Organization. Pandemic Influenza Severity Assessment (PISA). A WHO Guide to Assess the Severity of Influenza in Seasonal Epidemics and Pandemics; World Health Organization: Geneva, Switzerland, 2017; p. 18. [Google Scholar]
- Scheiblauer, H.; Nübling, C.M.; Wolf, T.; Khodamoradi, Y.; Bellinghausen, C.; Sonntagbauer, M.; Esser-Nobis, K.; Filomena, A.; Mahler, V.; Maier, T.J.; et al. Antibody response to SARS-CoV-2 for more than one year—Kinetics and persistence of detection are predominantly determined by avidity progres-sion and test design. J. Clin. Virol. 2022, 146, 105052. [Google Scholar] [CrossRef] [PubMed]
- Hofmann, N.; Grossegesse, M.; Neumann, M.; Schaade, L.; Nitsche, A. Evaluation of a commercial ELISA as alternative to plaque reduction neutralization test to detect neutralizing antibodies against SARS-CoV-2. Sci. Rep. 2022, 12, 3549. [Google Scholar] [CrossRef] [PubMed]
- Lau, E.H.Y.; Tsang, O.T.Y.; Hui, D.S.C.; Kwan, M.Y.W.; Chan, W.-H.; Chiu, S.S.; Ko, R.L.W.; Chan, K.H.; Cheng, S.M.S.; Perera, R.A.P.M.; et al. Neutralizing antibody titres in SARS-CoV-2 infections. Nat. Commun. 2021, 12, 63. [Google Scholar] [CrossRef] [PubMed]
- Wölfel, R.; Corman, V.M.; Guggemos, W.; Seilmaier, M.; Zange, S.; Müller, M.A.; Niemeyer, D.; Jones, T.C.; Vollmar, P.; Rothe, C.; et al. Virological assessment of hospitalized patients with COVID-2019. Nature 2020, 581, 465–469. [Google Scholar] [CrossRef] [Green Version]
- Robert Koch Institute. COVID-19 Vaccinations in Germany. Available online: https://github.com/robert-koch-institut/COVID-19-Impfungen_in_Deutschland (accessed on 27 February 2023).
- Speybroeck, N.; Devleesschauwer, B.; Joseph, L.; Berkvens, D. Misclassification errors in prevalence estimation: Bayesian handling with care. Int. J. Public Health 2013, 58, 791–795. [Google Scholar] [CrossRef]
- Devleesschauwer, B.; Torgerson, P.; Charlier, J.; Levecke, B.; Praet, N.; Roelandt, S.; Smit, S.; Dorny, P.; Berkvens, D.; Speybroek, N. Prevalence: Tools for Prevalence Assessment Studies; R Package Version 0.4.1. 2022. Available online: https://cran.r-project.org/web/packages/prevalence/prevalence.pdf (accessed on 27 February 2023).
- Backhaus, I.; Hermsen, D.; Timm, J.; Boege, F.; Lübke, N.; Degode, T.; Göbels, K.; Dragano, N. SARS-CoV-2 seroprevalence and determinants of infection in young adults: A population-based seroepidemiological study. Public Health 2022, 207, 54–61. [Google Scholar] [CrossRef]
- Neuhauser, H.; Rosario, A.S.; Butschalowsky, H.; Haller, S.; Hoebel, J.; Michel, J.; Nitsche, A.; Poethko-Müller, C.; Prütz, F.; Schlaud, M.; et al. Nationally representative results on SARS-CoV-2 seroprevalence and testing in Germany at the end of 2020. Sci. Rep. 2022, 12, 19492. [Google Scholar] [CrossRef] [PubMed]
- Jin, D.K.; Nesbitt, D.J.; Yang, J.; Chen, H.; Horowitz, J.; Jones, M.; Vandergaast, R.; Carey, T.; Reiter, S.; Russell, S.J.; et al. Seroprevalence of anti-SARS-CoV-2 antibodies in a cohort of New York City metro blood donors using multiple SARS-CoV-2 serological assays: Implications for controlling the epidemic and “Reopening”. PLoS ONE 2021, 16, e0250319. [Google Scholar] [CrossRef] [PubMed]
- Sullivan, D.J.; Franchini, M.; Joyner, M.J.; Casadevall, A.; Focosi, D. Analysis of anti-SARS-CoV-2 Omicron-neutralizing antibody titers in different vaccinated and unvaccinated convalescent plasma sources. Nat. Commun. 2022, 13, 6478. [Google Scholar] [CrossRef] [PubMed]
- Saeed, S.; Drews, S.J.; Pambrun, C.; Yi, Q.L.; Osmond, L.; O’Brien, S.F. SARS-CoV-2 seroprevalence among blood donors after the first COVID-19 wave in Canada. Transfusion 2021, 61, 862–872. [Google Scholar] [CrossRef]
- Robert Koch Institute. COVID-19-Fälle nach Altersgruppe und Meldewoche. Available online: https://www.rki.de/DE/Content/InfAZ/N/Neuartiges_Coronavirus/Daten/Altersverteilung.html?nn=2386228 (accessed on 27 February 2023).
- Vygen-Bonnet, S.; Koch, J.; Bogdan, C.; Harder, T.; Heininger, U.; Kling, K.; Littmann, M.; Meerpohl, J.; Meyer, H.; Mertens, T.; et al. Beschluss und Wissenschaftliche Begründung der Ständigen Impfkommission (STIKO) für die COVID-19-Impfempfehlung. Epid. Bull. 2021, 2, 3–63. [Google Scholar] [CrossRef]
- Robert Koch Institute. Digital Vaccination Monitoring and Low-Aggregated Health Insurance Billing Data (Non Public); Robert Koch Institute: Berlin, Germany, 2022. [Google Scholar]
- Statistisches Bundesamt. Gesundheitspersonal 2023. Available online: https://www.destatis.de/DE/Themen/Gesellschaft-Umwelt/Gesundheit/Gesundheitspersonal/_inhalt.html (accessed on 27 February 2023).
- Robert Koch Institute. COVID-19 Impfquoten-Monitoring in Deutschland (COVIMO), Report 6. Available online: https://www.rki.de/DE/Content/InfAZ/N/Neuartiges_Coronavirus/Projekte_RKI/COVIMO_Reports/covimo_studie_bericht_6.pdf?__blob=publicationFile (accessed on 27 February 2023).
- Atsma, F.; Veldhuizen, I.; Verbeek, A.; de Kort, W.; de Vegt, F. Healthy donor effect: Its magnitude in health research among blood donors. Transfusion 2011, 51, 1820–1828. [Google Scholar] [CrossRef]
- Maier, B.F.; Rose, A.H.; Burdinski, A.; Klamser, P.; Neuhauser, H.; Wichmann, O.; Schaade, L.; Wieler, L.H.; Brockmann, D. Estimating the share of SARS-CoV-2-immunologically naïve individuals in Germany up to June 2022. Epidemiol. Infect. 2023, 15, e38. [Google Scholar] [CrossRef]
- Tuite, A.R.; Fisman, D.; Abe, K.T.; Rathod, B.; Pasculescu, A.; Colwill, K.; Gingras, A.-C.; Yi, Q.-L.; O’Brien, S.F.; Drews, S.J. Estimating SARS-CoV-2 Seroprevalence in Canadian Blood Donors, April 2020 to March 2021: Improving Accuracy with Multiple Assays. Microbiol. Spectr. 2022, 10, e02563-21. [Google Scholar] [CrossRef]
- Di Stefano, M.; Sarno, M.; Faleo, G.; Mohamed, A.M.F.; Lipsi, M.R.; De Nittis, R.; Bruno, S.R.; De Feo, L.; Granato, T.; Corso, G.; et al. Low Prevalence of Antibodies to SARS-CoV-2 and Undetectable Viral Load in Seropositive Blood Donors from South-Eastern Italy. Acta Haematol. 2021, 144, 580–584. [Google Scholar] [CrossRef]
- Dopico, X.C.; Muschiol, S.; Christian, M.; Hanke, L.; Sheward, D.J.; Grinberg, N.F.; Rorbach, J.; Bogdanovic, G.; Mcinerney, G.M.; Allander, T.; et al. Seropositivity in blood donors and pregnant women during the first year of SARS-CoV-2 transmission in Stockholm, Sweden. J. Intern. Med. 2021, 290, 666–676. [Google Scholar] [CrossRef]
- Reimer, T.; Horn, P.A.; Fischer, J.; Kordelas, L.; Jiménez Klingberg, C.L.; Zeiler, T. Andere Gene—Gleiche Chancen. Hämo-therapie 2018, 31, 38–40. [Google Scholar]
- Lewin, A.; Osiowy, C.; Erikstrup, C.; Custer, B.; Renaud, C.; Tiberghien, P.; Russell, A.; Lieshout-Krikke, R.; O’Brien, S.F. Research partnerships between blood services and public health authorities: An international, cross-sectional survey. Vox Sang. 2022, 117, 1368. [Google Scholar] [CrossRef] [PubMed]
- O’Brien, S.F.; Drews, S.J.; Lewin, A.; Russell, A.; Davison, K.; Goldman, M. How do we decide how representative our donors are for public health surveillance? Transfusion 2022, 62, 2431–2437. [Google Scholar] [CrossRef] [PubMed]


| Wave | Calendar Week/Year | Virus/Variant |
|---|---|---|
| 1 | 10/2020–20/2020 | Wild type |
| 2 | 40/2020–08/2021 | Wild type |
| 3 | 09/2021–23/2021 | Alpha |
| 4 | 31/2021–51/2021 | Delta |
| 55 | 52/2021–21/2022 | Omicron |
| Total Seroprevalence | Infection-Induced Seroprevalence | Vaccination-Induced Seroprevalence | |||||||||||
|---|---|---|---|---|---|---|---|---|---|---|---|---|---|
| Year | CW | Male Donors | Female Donors | Male Donors | Female Donors | Male Donors | Female Donors | ||||||
| Prevalence (%) | 95% CI | Prevalence (%) | 95% CI | Prevalence (%) | 95% CI | Prevalence (%) | 95% CI | Prevalence (%) | 95% CI | Prevalence (%) | 95% CI | ||
| 2020 | 19–22 | 1.6 | 0.7–2.9 | 0.9 | 0.1–1.2 | 1.6 | 0.7–2.9 | 0.9 | 0.1–1.2 | No vaccine available | |||
| 23–26 | 0.8 | 0.5–1.2 | 0.8 | 0.4–1.3 | 0.8 | 0.5–1.2 | 0.8 | 0.4–1.3 | |||||
| 27–30 | 0.6 | 0.3–1.0 | 0.6 | 0.2–1.0 | 0.6 | 0.3–1.0 | 0.6 | 0.2–1.0 | |||||
| 31–34 | 0.5 | 0.2–0.8 | 0.8 | 0.4–1.2 | 0.5 | 0.2–0.8 | 0.8 | 0.4–1.2 | |||||
| 35–38 | 1.2 | 0.8–1.7 | 0.5 | 0.1–0.8 | 1.2 | 0.8–1.7 | 0.5 | 0.1–0.8 | |||||
| 39–42 | 1.2 | 0.9–1.6 | 1.1 | 0.6–1.6 | 1.2 | 0.9–1.6 | 1.1 | 0.6–1.6 | |||||
| 43–46 | 1.7 | 1.3–2.1 | 0.8 | 0.5–1.3 | 1.7 | 1.3–2.1 | 0.8 | 0.5–1.3 | |||||
| 47–50 | 2.0 | 1.6–2.5 | 1.5 | 1.0–2.0 | 2.0 | 1.6–2.5 | 1.5 | 1.0–2.0 | |||||
| 51–01 | 3.2 | 2.6–3.7 | 3.7 | 3.0–4.4 | 2.9 | 2.4–3.4 | 3.4 | 2.8–4.1 | 0.3 | 0.1–0.4 | 0.3 | 0.1–0.5 | |
| 2021 | 02–05 | 4.4 | 3.8–5.1 | 4.3 | 3.6–5.1 | 3.2 | 2.6–3.8 | 3.0 | 2.4–3.7 | 1.2 | 0.9–1.6 | 1.3 | 0.9–1.7 |
| 06–09 | 7.5 | 6.7–8.3 | 9.5 | 8.5–10.6 | 4.8 | 4.1–5.5 | 5.1 | 4.3–5.9 | 2.7 | 2.2–3.2 | 4.4 * | 3.7–5.2 | |
| 10–13 | 10.3 | 9.3–11.2 | 14.9 | 13.6–16.2 | 5.5 | 4.8–6.3 | 6.1 | 5.1–7.0 | 4.7 | 4.1–5.4 | 8.8 * | 7.8–9.7 | |
| 14–17 | 14.6 | 13.5–15.6 | 21.6 | 20.1–23.1 | 6.7 | 5.9–7.5 | 7.0 | 6.0–8.0 | 8.0 | 7.3–8.8 | 14.6 * | 13.4–18.8 | |
| 36–37 | 89.1 | 87.9–90.4 | 89.6 | 88.1–91.2 | 9.0 | 7.8–10.3 | 8.2 | 6.9–9.6 | 80.1 | 78.6–81.7 | 81.4 | 79.7–83.1 | |
| 2022 | 17–20 | 99.9 | 99.7–100 | 100 | 99.8–100 | 47.8 | 46.5–49.1 | 47.5 | 46.1–49.1 | 47.8 | 46.5–49.1 | 47.5 | 46.1–49.1 |
| Year | CW | Study | Region | Adjusted and Weighted Total Seroprevalence (%; 95% CI) |
|---|---|---|---|---|
| 2020 | 27–31 | MusPAD | Reutlingen | 2.0 (1.0–3.0) |
| 27–30 | SeBluCo | South | 1.5 (0.8–2.1) | |
| 32–35 | MusPAD | Freiburg | 1.2 (0.5–1.9) | |
| 31–34 | SeBluCo | South | 0.8 (0.3–1.3) | |
| 36–40 | MusPAD | Aachen | 2.0 (1.0–2.9) | |
| 35–38, 39–42 | SeBluCo | West | 0.8 (0.3–1.2), 1.5 (0.9–2.2) | |
| 41–44 | MusPAD | Osnabrück | 1.1 (0.4–1.7) | |
| 43–46 | SeBluCo | North | 0.9 (0.3–1.4) | |
| 41–44 | MusPAD | Reutlingen | 2.1 (1.2–3.2) | |
| 43–46 | SeBluCo | South | 1.8 (1.2–2.5) | |
| 45–48 | MusPAD | Magdeburg | 2.0 (1.1–2.9) | |
| 43–46, 47–50 | SeBluCo | East | 1.2 (0.5–1.9), 1.3 (0.7–2.0) | |
| 45–48 | MusPAD | Freiburg | 2.0 (1.0–3.1) | |
| 43–46, 47–50 | SeBluCo | South | 1.8 (1.2–2.5), 2.3 (1.6–3.1) | |
| 45–48 | SERODUS | Düsseldorf (city) | 3.1 (2.4–4.0) | |
| 47–50 | SeBluCo | West | 3.5 (2.1–4.9) | |
| 2021 | 05–08 | MusPAD | Aachen | 5.2 (3.6–6.9) |
| 02–05, 06–09 | SeBluCo | West | 4.4 (3.5–5.3), 8.5 (7.2–9.9) | |
| 09–13 | MusPAD | Osnabrück | 3.7 (2.1–5.2) | |
| 10–13 | SeBluCo | North | 11.8 (10.1–13.4) † | |
| 09–13 | MusPAD | Chemnitz | 14.3 (12.0–16.5) | |
| 10–13 | SeBluCo | East | 14.7 (12.6–16.8) | |
| 14–17 | MusPAD | Magdeburg | 9.2 (6.9–11.6) | |
| 14–17 | SeBluCo | East | 19.1 (16.8–21.5) † | |
| 2020/2021 | 41–08 * | SOEP | nationwide | 1.9 (1.3–2.7) |
| 2020 | 47–50 | SeBluCo | nationwide | 1.8 (1.4–2.2) |
Disclaimer/Publisher’s Note: The statements, opinions and data contained in all publications are solely those of the individual author(s) and contributor(s) and not of MDPI and/or the editor(s). MDPI and/or the editor(s) disclaim responsibility for any injury to people or property resulting from any ideas, methods, instructions or products referred to in the content. |
© 2023 by the authors. Licensee MDPI, Basel, Switzerland. This article is an open access article distributed under the terms and conditions of the Creative Commons Attribution (CC BY) license (https://creativecommons.org/licenses/by/4.0/).
Share and Cite
Offergeld, R.; Preußel, K.; Zeiler, T.; Aurich, K.; Baumann-Baretti, B.I.; Ciesek, S.; Corman, V.M.; Dienst, V.; Drosten, C.; Görg, S.; et al. Monitoring the SARS-CoV-2 Pandemic: Prevalence of Antibodies in a Large, Repetitive Cross-Sectional Study of Blood Donors in Germany—Results from the SeBluCo Study 2020–2022. Pathogens 2023, 12, 551. https://doi.org/10.3390/pathogens12040551
Offergeld R, Preußel K, Zeiler T, Aurich K, Baumann-Baretti BI, Ciesek S, Corman VM, Dienst V, Drosten C, Görg S, et al. Monitoring the SARS-CoV-2 Pandemic: Prevalence of Antibodies in a Large, Repetitive Cross-Sectional Study of Blood Donors in Germany—Results from the SeBluCo Study 2020–2022. Pathogens. 2023; 12(4):551. https://doi.org/10.3390/pathogens12040551
Chicago/Turabian StyleOffergeld, Ruth, Karina Preußel, Thomas Zeiler, Konstanze Aurich, Barbara I. Baumann-Baretti, Sandra Ciesek, Victor M. Corman, Viktoria Dienst, Christian Drosten, Siegfried Görg, and et al. 2023. "Monitoring the SARS-CoV-2 Pandemic: Prevalence of Antibodies in a Large, Repetitive Cross-Sectional Study of Blood Donors in Germany—Results from the SeBluCo Study 2020–2022" Pathogens 12, no. 4: 551. https://doi.org/10.3390/pathogens12040551