
Microbiological Survey and Antimicrobial Resistance of Foodborne Bacteria in Select Meat Products and Ethnic Food Products Procured from Food Desert Retail Outlets in Central Virginia, USA

 ,
,
Abstract
:1. Introduction
2. Materials and Methods
2.1. Food Safety Inspection
2.2. Expiration Date/Use-by-Date and Price
2.3. Microbial Testing
2.4. Antimicrobial Resistance (AMR)
2.4.1. Campylobacter
2.4.2. E. coli, Listeria, and Salmonella
2.5. Data Analysis
3. Results and Discussion
3.1. Food Safety Inspection
3.2. Expiration Date/Use-by-Date and Price
3.3. Microbial Evaluation
3.3.1. Meat Product (Section I)
3.3.2. Packaging Surface (Section II)
3.3.3. Ethnic Product (Section III)
3.4. Antimicrobial Resistance (AMR)
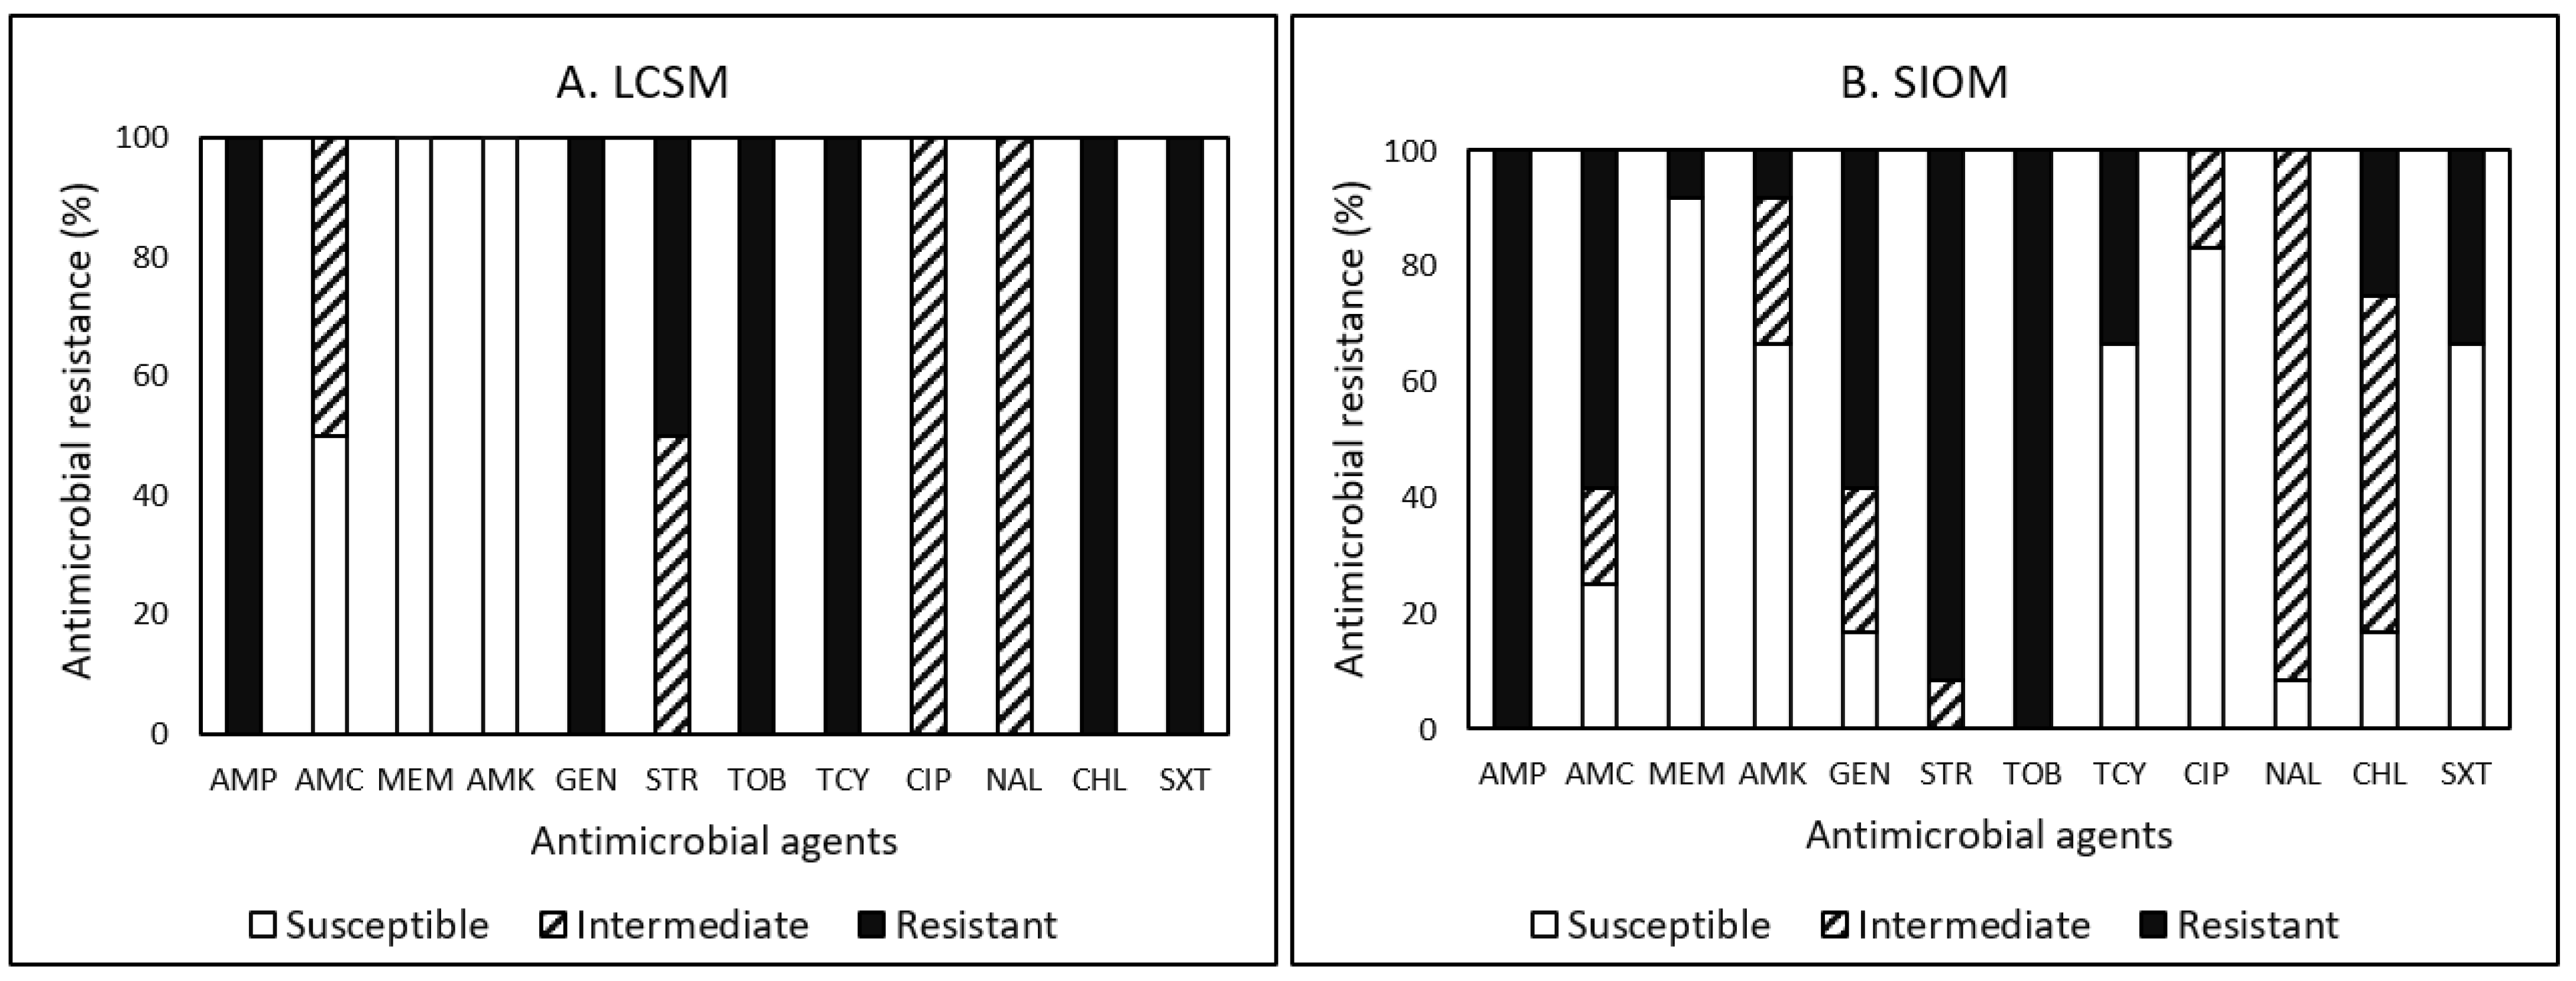
3.4.1. Campylobacter
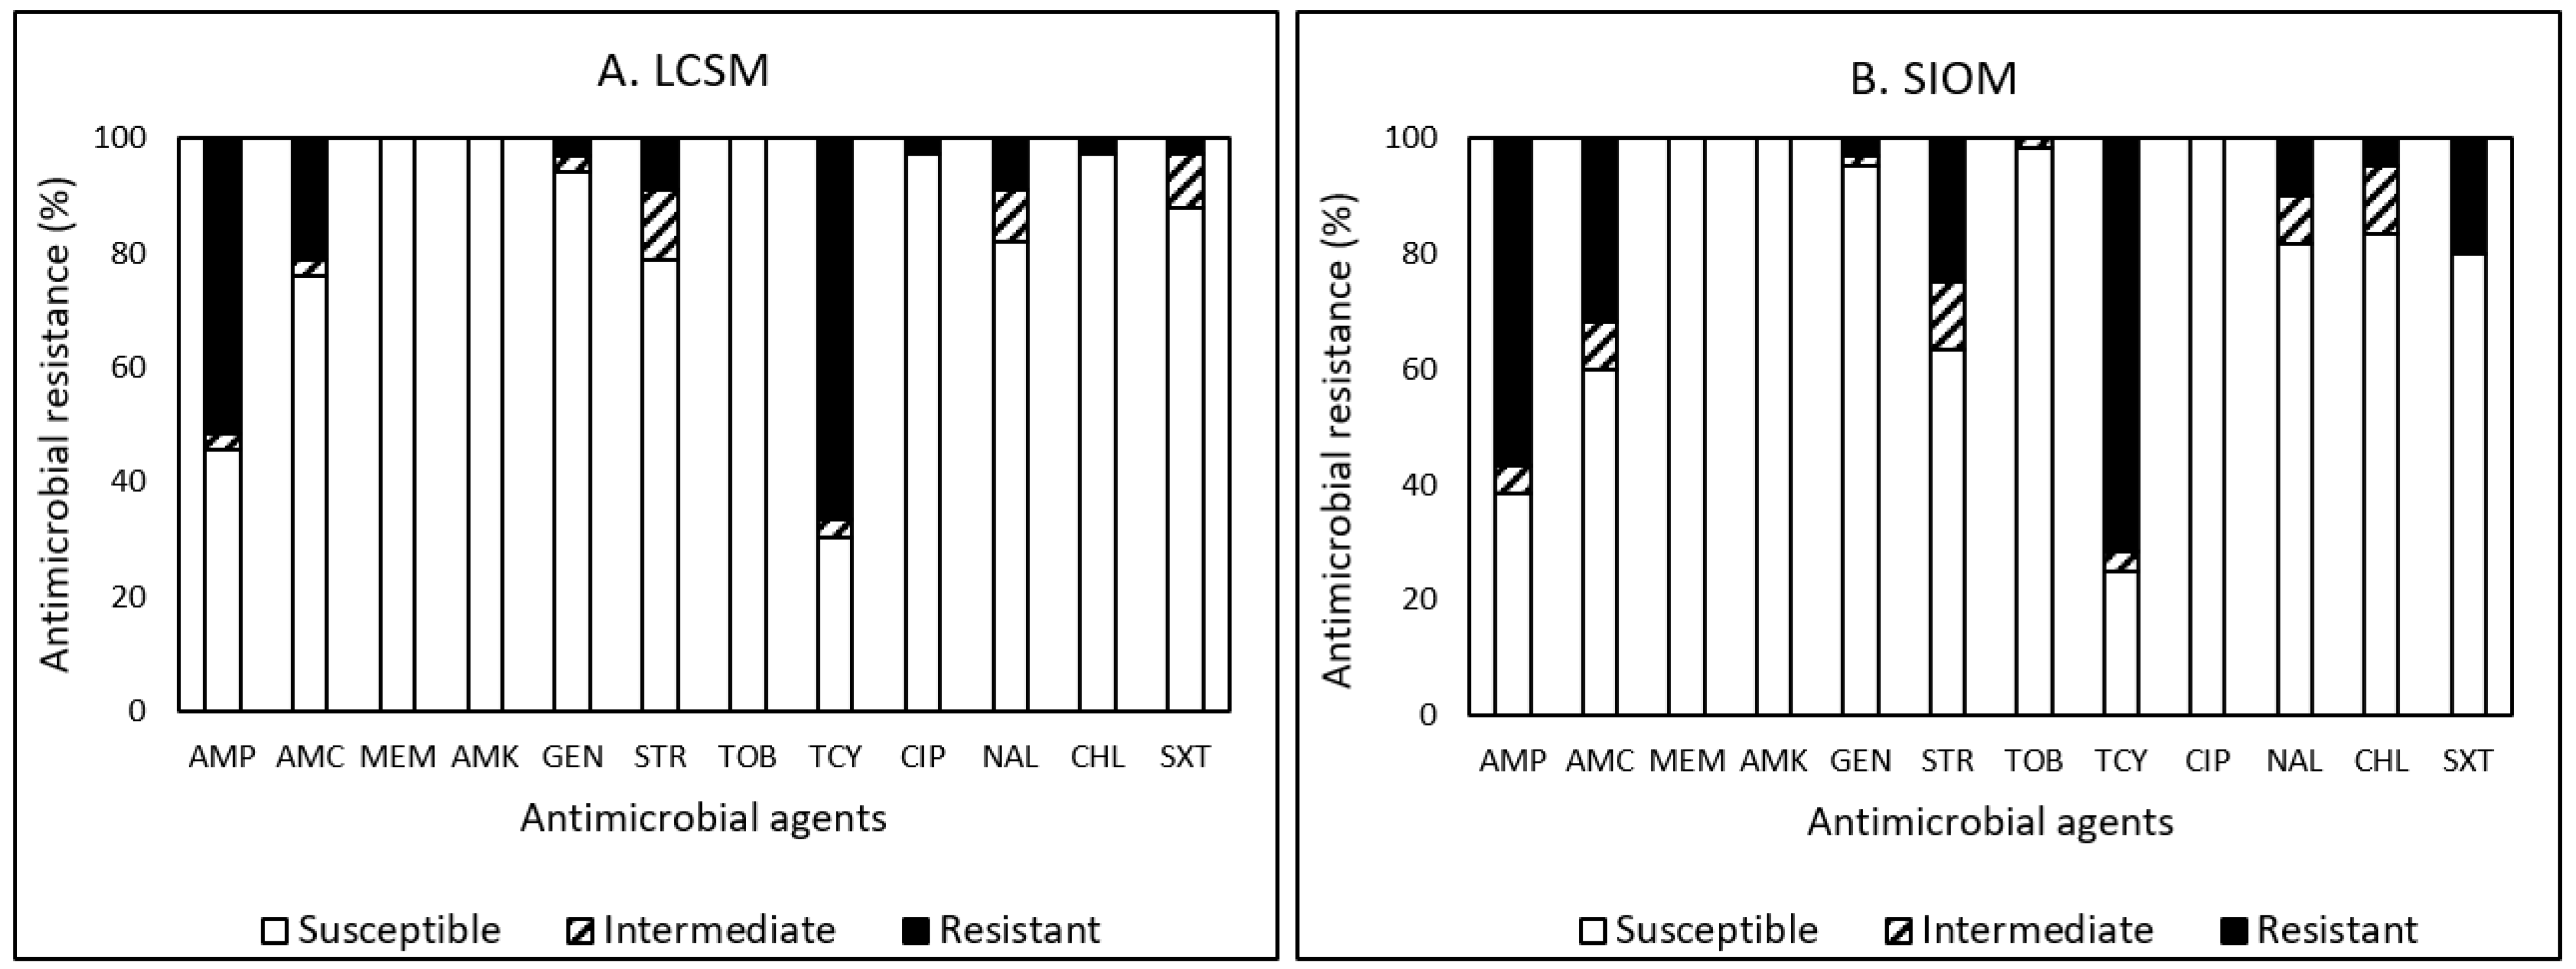
3.4.2. E. coli
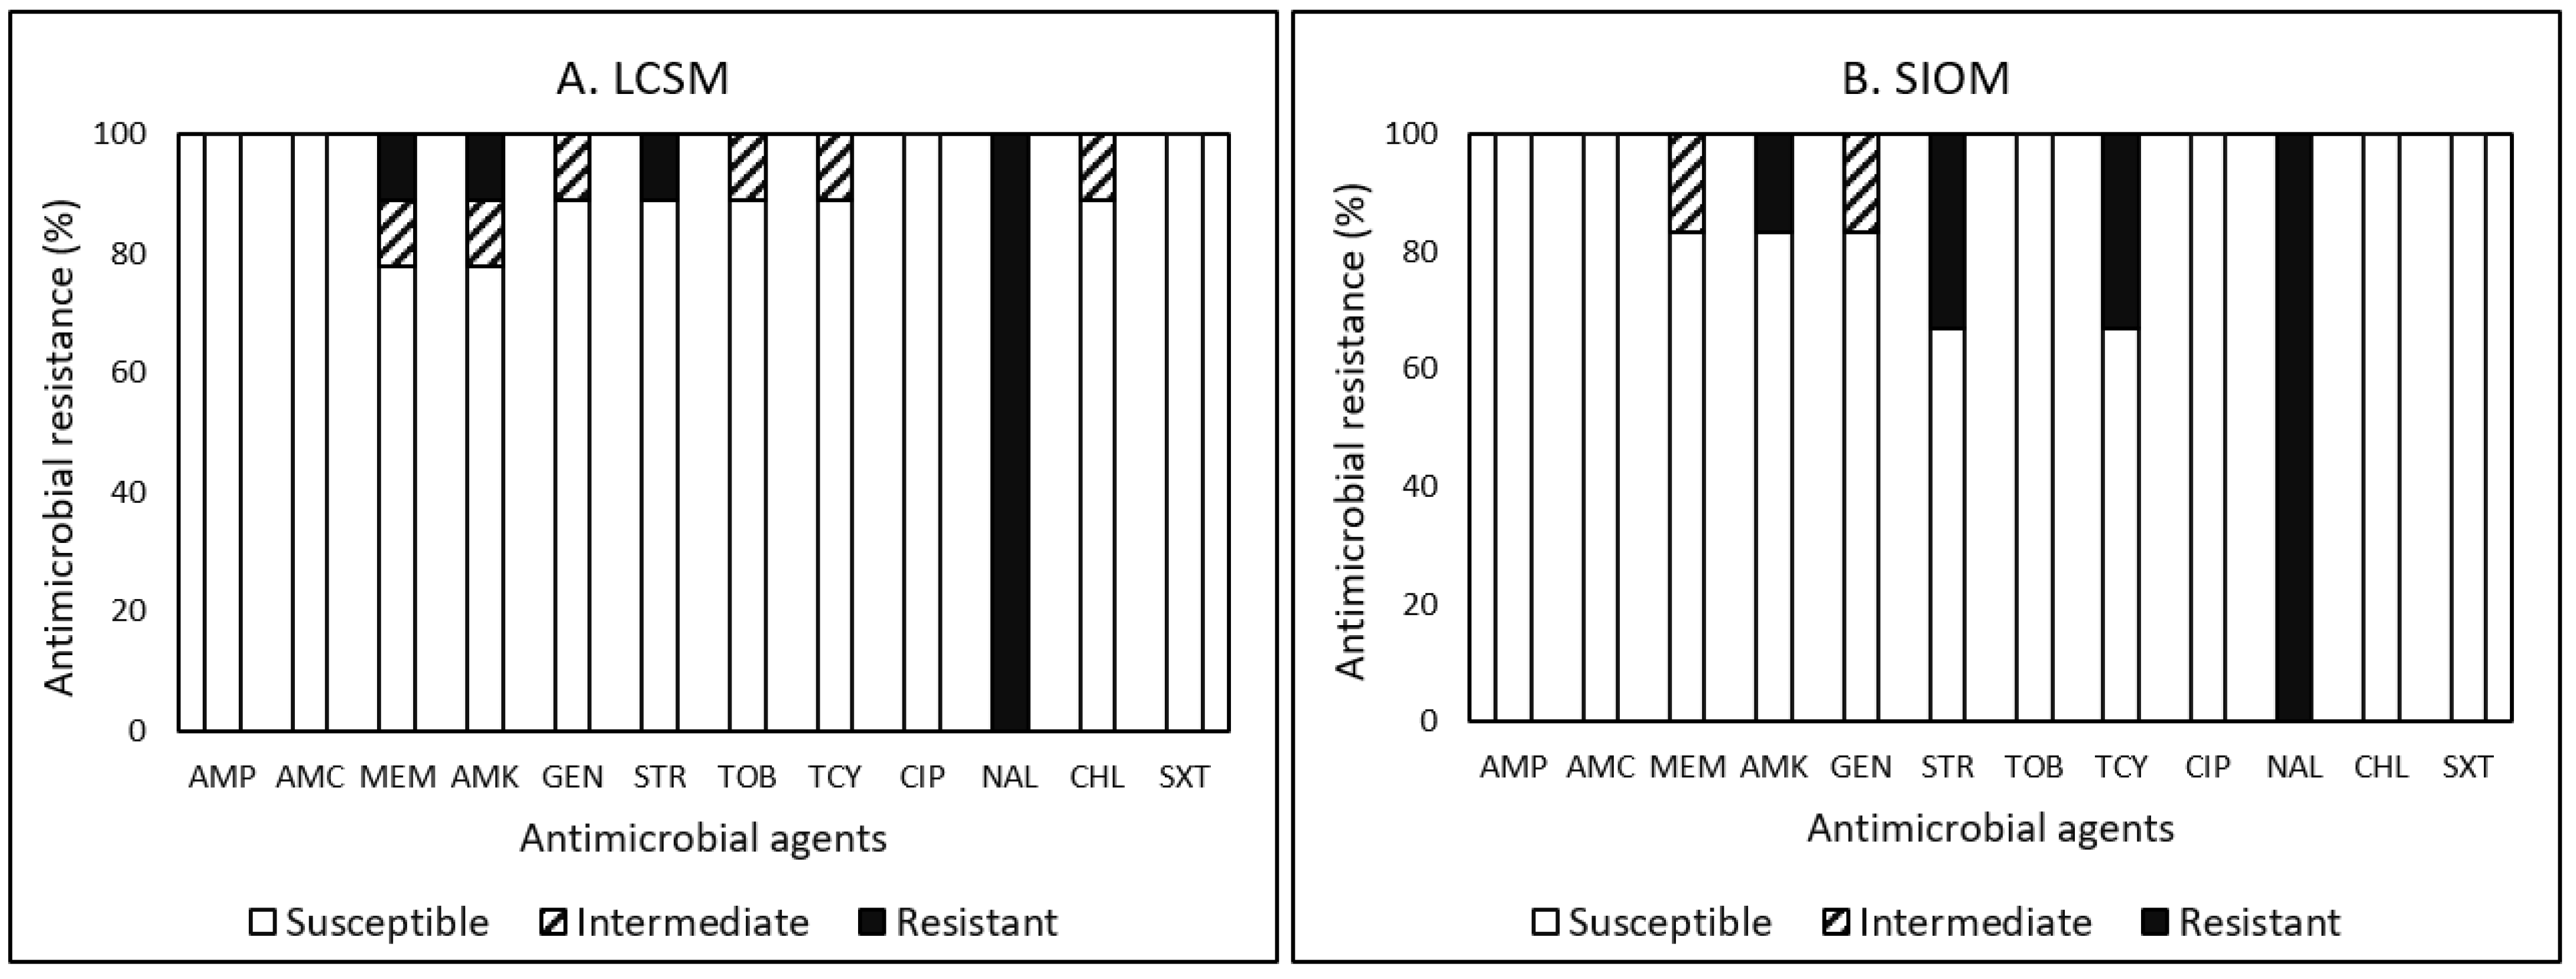
3.4.3. Listeria
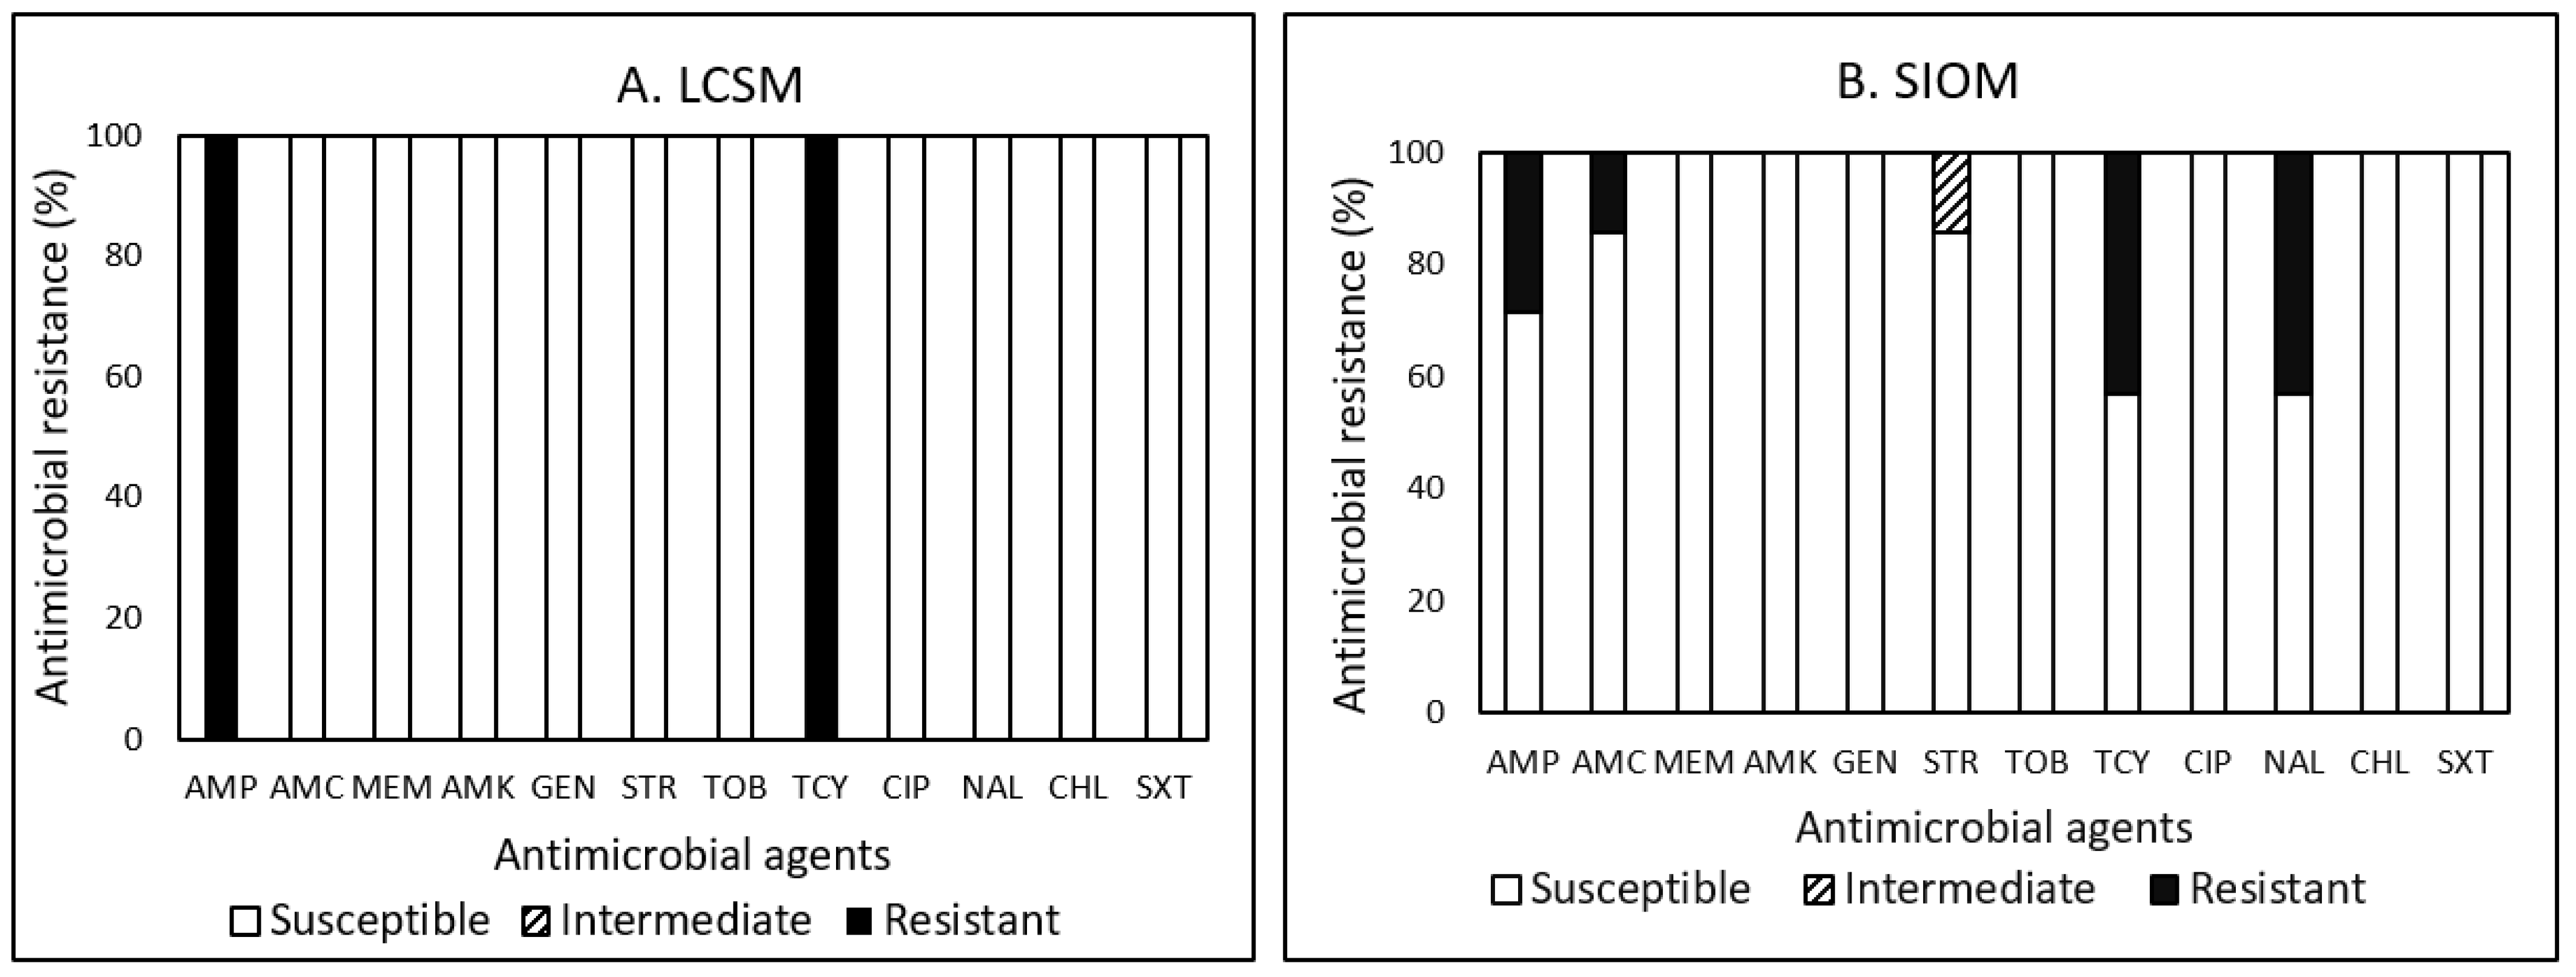
3.4.4. Salmonella
4. Conclusions
Author Contributions
Funding
Data Availability Statement
Acknowledgments
Conflicts of Interest
Disclaimer
References
- McComsey, H. ABC13 Special Report: Living in a Food Desert. Available online: https://wset.com/news/local/abc13-special-report-living-in-a-food-desert (accessed on 15 November 2022).
- Alwitt, L.F.; Donley, T.D. Retail Stores in Poor Urban Neighborhoods. J. Consum. Aff. 1997, 31, 139–164. [Google Scholar] [CrossRef]
- Beaulac, J.; Kristjansson, E.; Cummins, S. A Systematic Review of Food Deserts, 1966–2007. Prev. Chron. Dis. 2009, 6, 3. Available online: http://www.cdc.gov/pcd/issues/2009/jul/08_0163.htm (accessed on 5 May 2023).
- Newsad, R.; Ripley, D.; Shephered, C.A. Assessed food safety risks associated with grocery stores. J. Environ. Health 2016, 79, 16–21. [Google Scholar]
- Andreyeva, T.; Blumenthal, D.M.; Schwartz, M.B.; Long, M.W.; Brownell, K.D. Availability and Prices of Foods Across Stores and Neighborhoods: The Case of New Haven, Connecticut. Health Aff. 2008, 27, 1381–1388. [Google Scholar] [CrossRef] [PubMed] [Green Version]
- Koro, M.E.; Anandan, S.; Quinlan, J.J. Microbial Quality of Food Available to Populations of Differing Socioeconomic Status. Am. J. Prev. Med. 2010, 38, 478–481. [Google Scholar] [CrossRef] [PubMed]
- Signs, R.J.; Darcey, V.L.; Carney, T.A.; Evans, A.A.; Quinlan, J.J. Retail Food Safety Risks for Populations of Different Races, Ethnicities, and Income Levels. J. Food Prot. 2011, 74, 1717–1723. [Google Scholar] [CrossRef]
- Hendrickson, D.; Smith, C.; Eikenberry, N. Fruit and vegetable access in four low-income food deserts communities in Minnesota. Agric. Hum. Values 2006, 23, 371–383. [Google Scholar] [CrossRef]
- Darcey, V.L.; Quinlan, J.J. Use of Geographic Information Systems Technology to Track Critical Health Code Violations in Retail Facilities Available to Populations of Different Socioeconomic Status and Demographics. J. Food Prot. 2011, 74, 1524–1530. [Google Scholar] [CrossRef]
- Centers for Disease Control and Prevention (CDC). Foodborne Illnesses and Germs. 2018. Available online: https://www.cdc.gov/foodsafety/foodborne-germs.html (accessed on 2 April 2023).
- Centers for Disease Control and Prevention (CDC). Antibiotic Resistance Threats in the United States. 2019. Available online: https://www.cdc.gov/drugresistance/pdf/threats-report/2019-ar-threats-report-508.pdf (accessed on 2 April 2023).
- United States Department of Agriculture Economic Research Service (USDA ERS). Food Access Research Atlas: Low Access to Store. 2017. Available online: https://www.ers.usda.gov/data-products/food-access-research-atlas/go-to-the-atlas (accessed on 2 April 2023).
- United State Department of Agriculture National Institute of Food and Agriculture (USDA NIFA). Virginia Extension Aids Food Deserts. 2018. Available online: https://nifa.usda.gov/virginia-extension-aids-food-deserts (accessed on 2 April 2023).
- Virginia Beach Department of Public Health (VBDH). “Food Establishment plan Review Packet Checklist”. 2019. Available online: https://www.vdh.virginia.gov/content/uploads/sites/131/2019/03/Application-for-Food-Service-Plan-Review_2019.pdf (accessed on 2 April 2023).
- McHenry County Department of Health (MCDH). “Food Establishment Self-Inspection Checklist”. 2018. Available online: https://www.mchenrycountyil.gov/home/showdocument?id=2309 (accessed on 2 April 2023).
- South Dakota Department of Health (SDDH). “Food Service Manager Self-Inspection Checklist”. 2013. Available online: https://doh.sd.gov/documents/Food/Checklist.pdf (accessed on 2 April 2023).
- Food and Drug Administration (FDA). Food Sampling/Preparation of Sample Homogenate. 1998. Available online: https://www.fda.gov/food/laboratory-methods-food/bam-chapter-1-food-samplingpreparation-sample-homogenate (accessed on 3 April 2023).
- Pao, S.; Hagens, B.; Kim, C.; Wildeus, S.; Ettinger, M.; Wilson, M.D.; Watts, B.; Whitley, N.; Porto-Fett, A.; Schwarz, J.; et al. Prevalence and molecular analyses of Campylobacter jejuni and Salmonella spp. in co-grazing small ruminants and wild-living birds. Livest. Sci. 2014, 160, 163–171. [Google Scholar] [CrossRef]
- Sails, A.D.; Bolton, F.J.; Fox, A.J.; Wareing, D.R.A.; Greenway, D.L.A. Detection of Campylobacter jejuni and Campylobacter coli in Environmental Waters by PCR Enzyme-Linked Immunosorbent Assay. Appl. Environ. Microbiol. 2002, 68, 1319–1324. [Google Scholar] [CrossRef] [Green Version]
- Kim, C.; Fatani, A.; Almuqati, R.; Rahemi, A.; Abujamous, A.; Wynn, C.; Nartea, T.; Ndegwa, E.; Rutto, L.; Dhakal, R. Prevalence and antimicrobial resistance of foodborne pathogens in value-added commodities procured from farmers’ markets in Central Virginia. J. Food Saf. 2021, 41, e12931. [Google Scholar] [CrossRef]
- M100–S25; Performance Standards for Antimicrobial Disk Susceptibility Tests. Clinical and Laboratory Standards Institute (CLSI): Wayne, PA, USA, 2015.
- Magiorakos, A.-P.; Srinivasan, A.; Carey, R.B.; Carmeli, Y.; Falagas, M.E.; Giske, C.G.; Harbarth, S.; Hindler, J.F.; Kahlmeter, G.; Olsson-Liljequist, B.; et al. Multidrug-resistant, extensively drug-resistant and pandrug-resistant bacteria: An international expert proposal for interim standard definitions for acquired resistance. Clin. Microbiol. Infect. 2012, 18, 268–281. [Google Scholar] [CrossRef] [PubMed] [Green Version]
- Food and Drug Administration (FDA). FDA Releases 2012 and 2013 NARMS Integrated Annual Report; Finds Some Improvement in Antibiotic Resistance Trends in Recent Years. 2015. Available online: http://www.fda.gov/AnimalVeterinary/NewsEvents/CVMUpdates/ucm457825.htm (accessed on 10 April 2023).
- Caspi, C.E.; Pelletier, J.E.; Harnack, L.J.; Erickson, D.J.; Lenk, K.; Laska, M.N. Pricing of Staple Foods at Supermarkets versus Small Food Stores. Int. J. Environ. Res. Public Health 2017, 14, 915. [Google Scholar] [CrossRef] [Green Version]
- Kaufman, P.; MacDonald, J.; Lutz, S.; Smallwood, D. Do the Poor Pay More for Food? Item Selection and Price Difference Affect Low-Income Household Food Costs; U.S. Department of Agriculture, Economic Research Service: Washington, DC, USA, 1997.
- Sadler, R.C.; Gilliland, J.A.; Arku, G. Community Development and the Influence of New Food Retail Sources on the Price and Availability of Nutritious Food. J. Urban Aff. 2013, 35, 471–491. [Google Scholar] [CrossRef]
- Block, D.; Kouba, J. A comparison of the availability and affordability of a market basket in two communities in the Chicago area. Public Health Nutr. 2006, 9, 837–845. [Google Scholar] [CrossRef] [Green Version]
- Krukowski, R.A.; West, D.S.; Harvey-Berino, J.; Prewitt, T.E. Neighborhood Impact on Healthy Food Availability and Pricing in Food Stores. J. Community Health 2010, 35, 315–320. [Google Scholar] [CrossRef] [PubMed] [Green Version]
- Emond, J.A.; Madanat, H.N.; Ayala, G.X. Do Latino and non-Latino grocery stores differ in the availability and affordability of healthy food items in a low-income, metropolitan region? Public Health Nutr. 2012, 15, 360–369. [Google Scholar] [CrossRef]
- Martin, N.H.; Trmčić, A.; Hsieh, T.-H.; Boor, K.J.; Wiedmann, M. The Evolving Role of Coliforms As Indicators of Unhygienic Processing Conditions in Dairy Foods. Front. Microbiol. 2016, 7, 1549. [Google Scholar] [CrossRef]
- Zenk, S.N.; Powell, L.M.; Odoms-Young, A.M.; Krauss, R.; Fitzgibbon, M.L.; Block, D.; Campbell, R.T. Impact of the Revised Special Supplemental Nutrition Program for Women, Infants, and Children (WIC) Food Package Policy on Fruit and Vegetable Prices. J. Acad. Nutr. Diet. 2014, 114, 288–296. [Google Scholar] [CrossRef] [PubMed] [Green Version]
- International Commission on Microbiological Specification for Foods (ICMSF). Microorganisms in Foods. 2. Sampling for Microbiological Analysis: Principles and Specific Applications, 2nd ed.; University of Toronto Press: Toronto, ON, Canada, 1986; p. 199. [Google Scholar]
- Kornacki, J. Indicator Organism Assays: Chaos, Confusion, and Criteria. FoodSafety Magazine, 2011. Available online: https://www.food-safety.com/articles/3850-indicator-organism-assays-chaos-confusion-and-criteria(accessed on 10 April 2023).
- Martin, K.S.; Ghosh, D.; Page, M.; Wolff, M.; McMinimee, K.; Zhang, M. What Role Do Local Grocery Stores Play in Urban Food Environments? A Case Study of Hartford-Connecticut. PLoS ONE 2014, 9, e94033. [Google Scholar] [CrossRef] [Green Version]
- Jang, J.; Hur, H.-G.; Sadowsky, M.; Byappanahalli, M.; Yan, T.; Ishii, S. Environmental Escherichia coli: Ecology and public health implications-a review. J. Appl. Microbiol. 2017, 123, 570–581. [Google Scholar] [CrossRef] [Green Version]
- Water Science School. Bacteria and E. coli in Water. 2018. Available online: https://www.usgs.gov/special-topics/water-science-school/science/bacteria-and-e-coli-water#:~:text=animals%20and%20humans.-,E.,the%20elderly%20are%20particularly%20susceptible (accessed on 15 April 2023).
- Kim, C.; Albukhaytani, S.; Goodwyn, B.; Nartea, T.; Ndegwa, E.; Kaseloo, P. Microbial quality assessment of fresh produce sold in food desert areas in central Virginia. In Proceedings of the International Association for Food Protection Virtual Conference, Virtual, 26–28 October 2020. [Google Scholar]
- Zhao, S.; Blickenstaff, K.; Bodeis-Jones, S.; Gaines, S.A.; Tong, E.; McDermott, P.F. Comparison of the Prevalences and Antimicrobial Resistances of Escherichia coli Isolates from Different Retail Meats in the United States, 2002 to 2008. Appl. Environ. Microbiol. 2012, 78, 1701–1707. [Google Scholar] [CrossRef] [Green Version]
- Aslam, M.; Nattress, F.; Greer, G.; Yost, C.; Gill, C.; McMullen, L. Origin of Contamination and Genetic Diversity of Escherichia coli in Beef Cattle. Appl. Environ. Microbiol. 2003, 69, 2794–2799. [Google Scholar] [CrossRef] [Green Version]
- Fegan, N.; Higgs, G.; Vanderlinde, P.; Desmarchelier, P. Enumeration of Escherichia coli O157 in cattle faeces using most probable number technique and automated immunomagnetic separation. Lett. Appl. Microbiol. 2004, 38, 56–59. [Google Scholar] [CrossRef]
- World Health Organization (WHO). Antimicrobial Resistance. 2020. Available online: https://www.who.int/news-room/fact-sheets/detail/antimicrobial-resistance (accessed on 10 June 2022).
- Institute of Medicine and National Research Council (IMNRC). An Evaluation of the Role of Microbiological Criteria for Foods and Food Ingredients; The National Academies Press: Washington, DC, USA, 1985. [Google Scholar] [CrossRef]
- Kim, C.; Torres, A.; Smith, W.; Kulinczenko, A.; Pao, S.; Wildeus, S.; Ettinger, M.; Gruszynski, K.; Wynn, C. Prevalence of antimicrobial resistance (AMR) in bacteria isolated from farm animals, wildlife, and food samples in the eastern United States between 2007 and 2013. EC Nutr. 2017, 7, 264–274. [Google Scholar]
- Engberg, J.; Neimann, J.; Nielsen, E.M.; Aarestrup, F.M.; Fussing, V. Quinolone-resistant Campylobacter Infections: Risk Factors and Clinical Consequences. Emerg. Infect. Dis. 2004, 10, 1056–1063. [Google Scholar] [CrossRef] [PubMed]
- Giacomelli, M.; Salata, C.; Martini, M.; Montesissa, C.; Piccirillo, A. Antimicrobial resistance of Campylobacter jejuni and Campylobacter coli from poultry in Italy. Microb. Drug Resist. 2014, 20, 181–188. [Google Scholar] [CrossRef] [PubMed]
- Doğan-Halkman, H.B.; Çakır, I.; Keven, F.; Worobo, R.; Halkman, A.K. Relationship among fecal coliforms and Escherichia coli in various foods. Eur. Food Res. Technol. 2003, 216, 331–334. [Google Scholar] [CrossRef]
- Food Safety Preventive Controls Alliance (FSPCA). Appendix 6: Hygienic Zoning and Environmental Monitoring; FSPCA Preventive Controls for Human Food Participant Manual, Version 1.2. 2016. Available online: https://www.ifsh.iit.edu/fspca/fspca-preventive-controls-human-food (accessed on 12 March 2023).
- Abdallah-Ruiz, A.; Wood, L.S.; Kim, T.; Schilling, W.; White, S.B.; Chen, B.-Y.; Durango-Villadiego, A.; Silva, J.L. Microbial Indicators and Possible Focal Points of Contamination during Production and Processing of Catfish. Foods 2022, 11, 2778. [Google Scholar] [CrossRef] [PubMed]
- Antunes, P.; Réu, C.; Sousa, J.C.; Peixe, L.; Pestana, N. Incidence of Salmonella from poultry products and their susceptibility to antimicrobial agents. Int. J. Food Microbiol. 2003, 82, 97–103. [Google Scholar] [CrossRef]
- Musgrove, M.T.; Jones, D.R.; Northcutt, J.K.; Cox, N.A.; Harrison, M.A.; Fedorka-Cray, P.J.; Ladely, S.R. Antimicrobial Resistance in Salmonella and Escherichia coli Isolated from Commercial Shell Eggs. Poult. Sci. 2006, 85, 1665–1669. [Google Scholar] [CrossRef] [PubMed]
- Mihaiu, L.; Lapusan, A.; Tanasuica, R.; Sobolu, R.; Mihaiu, R.; Oniga, O.; Mihaiu, M. First study of Salmonella in meat in Romania. J. Infect. Dev. Ctries. 2014, 8, 050–058. [Google Scholar] [CrossRef] [Green Version]
- Abd-Elghany, S.M.; Sallam, K.I.; Abd-Elkhaek, A.; Tamura, T. Occurrence, genetic characterization and antimicrobial resistance of Salmonella isolated from chicken meat and giblets. Epidemiol. Infect. 2015, 143, 997–1003. [Google Scholar] [CrossRef] [PubMed]
- Nesemeier, B.; Ekiri, A.B.; Landblom, D.; Doetkott, D.; Khaitsa, M.L. Prevalence and antimicrobial resistance of Salmonella enterica shed from range and feedlot cattle from post-weaning to slaughter. Food Prot. Trends 2015, 35, 280–289. [Google Scholar]
- Kilonzo-Nthenge, A.; Ricketts, J.; Pitchay, D. Good Agricultural Practices Training for Limited-Resource Produce Growers and Extension Educators. J. Ext. 2018, 56, 7. [Google Scholar] [CrossRef]

| Antimicrobial Category | Antimicrobial Agent and Its Abbreviation | Concentration (µg/disk) | Zone Diameter (mm) | ||
|---|---|---|---|---|---|
| S | I | R | |||
| Penicillins | Ampicillin (AMP) | 10 | >17 | 14–16 | <13 |
| β-lactamase inhibitor combinations | Amoxicillin-clavulanic acid (AMC) | 30 | >18 | 14–17 | <13 |
| Carbapenems | Meropenem (MEM) | 10 | >23 | 20–22 | <19 |
| Aminoglycosides | Amikacin (AMK) | 30 | >17 | 15–16 | <14 |
| Gentamicin (GEN) | 10 | >15 | 13–14 | <12 | |
| Streptomycin (STR) | 10 | >15 | 12–14 | <11 | |
| Tobramycin (TOB) | 10 | >15 | 13–14 | <12 | |
| Tetracyclines | Tetracycline (TCY) | 30 | >15 | 12–14 | <11 |
| Fluoroquinolones | Ciprofloxacin (CIP) | 5 | >21 | 16–20 | <15 |
| Quinolones | Nalidixic acid (NAL) | 30 | >19 | 14–18 | <13 |
| Phenicols | Chloramphenicol (CHL) | 30 | >18 | 13–17 | <12 |
| Folate pathway inhibitors | Trimethoprim-sulfamethoxazole (SXT) | 25 | >16 | 11–15 | <10 |
| Food Safety Checklist | Food Outlets/Compliance (%) | |
|---|---|---|
| LCSMs (n = 9) | SIOMs (n = 10) | |
| Packaging | ||
| Clear indication of expiration date (or sell by) | 100 | 50.0 |
| Good condition (e.g., no damage and no evidence of fluid leakage) | 100 | 80.0 |
| Storage | ||
| Raw meat & poultry stored separate or below produce | 88.9 | 80.0 |
| No evidence of pest is present | 100 | 80.0 |
| Dry product storage area are clean and organized | 100 | 80.0 |
| Refrigerators and freezers maintained clean (shelving, etc.) | 100 | 80.0 |
| Holding Temperature | ||
| Product is stored or displayed at 41 °F (5 °C) or below | 77.8 | 50.0 |
| Frozen foods are frozen in freezer temperature at or below 0 °F (−18 °C) | 100 | 80.0 |
| Employee Practices | ||
| Employees use good hygiene practices wearing a hair net and gloves while handling products | 77.8 | 70.0 |
| Employees do not consume food in product storage and preparation areas | 100 | 90.0 |
| Overall | 94.5 | 76.0 |
| Sample Type | Market Source (Store Number) | |||||
|---|---|---|---|---|---|---|
| LCSMs (n = 9) | SIOMs (n = 10) | |||||
| Sample Number | Price ($/lb) | Use-by Date (Day) | Sample Number | Price ($/lb) | Use-by Date (Day) | |
| Bacon | 16 | 4.36 ± 1.98 a | 82.8 ± 17.7 A | 10 | 5.57 ± 1.31 a | 19.3 ± 7.9 B |
| Ground beef | 20 | 4.49 ± 0.62 a | 3.2 ± 2.2 A | 22 | 3.61 ± 0.34 b | 4.0 ± 1.3 A |
| Chicken leg | 18 | 1.51 ± 0.49 a | 3.8 ± 1.0 A | 16 | 1.19 ± 0.36 a | 5.0 ± 1.2 A |
| Chicken wing | 16 | 2.96 ± 1.16 a | 4.5 ± 1.6 A | 16 | 3.21 ± 0.46 a | 4.3 ± 1.6 A |
| Pork chop | 18 | 4.25 ± 0.34 a | 4.0 ± 2.0 A | 16 | 3.47 ± 0.53 b | 3.3 ± 2.1 A |
| Sausage | 22 | 1.44 ± 0.64 a | 76.0 ± 37.2 A | 15 | 2.72 ± 2.08 a | 19.0 ± 21.2 B # |
| Hot dog | 12 | 1.28 ± 0.16 b | 109.2 ± 23.7 A | 12 | 1.92 ± 0.32 a | 72.7 ± 43.1 B |
| Sample Type | Sample Number | Store Source | Microorganism Population (log CFU/g or log MPN/g) | |||
|---|---|---|---|---|---|---|
| Aerobic Mesophiles | Coliforms | E. coli | ||||
| Average | ICMSF (%) # | Range | Range | |||
| Bacon | 16 | LCSMs | A 3.33 ± 1.73 b | 88, 0, 12 | 0.48–0.56 | 0.48–0.48 |
| 10 | SIOMs | A 4.47 ± 1.99 b | 70, 10, 20 | 0.48–1.97 | 0.48–0.96 | |
| Beef cut | 4 | LCSMs | B 3.98 ± 2.3 b | 50, 50, 0 | 0.48–0.48 | 0.48–0.48 |
| 8 | SIOMs | A 6.99 ± 1.86 a | 25, 0, 75 | 0.48–5.34 | 0.48–1.97 | |
| Ground beef | 20 | LCSMs | A 5.85 ± 1.26 a | 35, 30, 35 | 0.48–4.18 | 0.48–2.18 |
| 22 | SIOMs | A 6.53 ± 1.56 a | 18, 18, 64 | 0.48–5.04 | 0.48–1.58 | |
| Pork sausage | 22 | LCSMs | B 4.75 ± 1.33 ab | 73, 23, 4 | 0.48–4.38 | 0.48–2.38 |
| 18 | SIOMs | A 7.06 ± 1.54 a | 22, 0, 78 | 0.48–3.38 | 0.48–1.63 | |
| Sample Type | Sample Number | Store Source | Microorganism Population (log CFU/mL of Wash Fluid or log MPN/mL of Wash Fluid) | |||
|---|---|---|---|---|---|---|
| Aerobic Mesophiles | Coliforms | E. coli | ||||
| Average | Range | Range | Range | |||
| Chicken leg | 18 | LCSMs | B 3.74 ± 1.99 a | 1.30–7.53 | 0.78–2.75 | 0.78–0.86 |
| 16 | SIOMs | A 5.90 ± 2.11 a | 1.60–8.56 | 0.78–5.34 | 0.78–1.93 | |
| Chicken wing | 16 | LCSMs | B 4.30 ± 1.76 a | 2.00–8.24 | 0.78–3.34 | 0.78–1.66 |
| 16 | SIOMs | A 5.84 ± 2.34 a | 3.88–7.52 | 0.78–4.96 | 0.78–1.93 | |
| Pork chop | 18 | LCSMs | B 4.34 ± 0.87 a | 1.30–7.74 | 0.48–2.58 | 0.48–1.88 |
| 16 | SIOMs | A 6.21 ± 1.19 a | 2.00–8.07 | 0.48–3.58 | 0.48–0.56 | |
| Sample Type | Sample Number | Market Source | Prevalence (%) of Positive Samples | |||
|---|---|---|---|---|---|---|
| E. coli | Campylobacter | Listeria spp. | Salmonella | |||
| Bacon | 16 | LCSMs | ND # | ND | 6.25 | ND |
| 10 | SIOMs | 10 | 10 | ND | ND | |
| Beef cut | 4 | LCSMs | ND | ND | ND | ND |
| 8 | SIOMs | 12.5 | ND | ND | ND | |
| Ground beef | 20 | LCSMs | 5 | ND | ND | ND |
| 22 | SIOMs | 36 | 4.5 | 4.5 | ND | |
| Chicken leg | 18 | LCSMs | 5.5 | 5.5 | 5.5 | ND |
| 16 | SIOMs | 18.8 | 6.3 | ND | 6.3 | |
| Chicken wing | 16 | LCSMs | 25 | ND | ND | ND |
| 16 | SIOMs | 18.8 | 12.5 | 18.8 | 6.3 | |
| Pork chop | 18 | LCSMs | 11.1 | ND | 11.1 | ND |
| 16 | SIOMs | 12.5 | 6.3 | ND | ND | |
| Pork sausage | 22 | LCSMs | 50 | 4.5 | 9 | 4.5 |
| 18 | SIOMs | 50 | ND | 11.1 | 16.6 | |
| Sample Packaging | Sample Number | Store Source | Microorganism Population | ||
|---|---|---|---|---|---|
| Aerobic Mesophiles (log CFU/cm3) | Coliforms (log MPN/cm3) | ||||
| Average | Range | Range | |||
| Hot dog | 12 | LCSMs | A 2.28 ± 1.34 a | 1.30–4.62 | 0.78–0.78 |
| 12 | SIOMs | A 1.55 ± 0.39 b | 1.30–2.38 | 0.78–0.78 | |
| Sausage | 22 | LCSMs | B 2.07 ± 1.14 a | 1.30–5.53 | 0.78–1.26 |
| 15 | SIOMs | A 3.07 ± 1.62 a | 1.30–7.31 | 0.78–2.68 | |
| Sample Type | Sample Number (n = 45) | Microorganisms | Prevalence (%) of Bacteria | ||||
|---|---|---|---|---|---|---|---|
| Aerobic Mesophiles | Coliforms | E. coli | Campylobacter | Listeria spp. | Salmonella | ||
| Average | Average | Average | |||||
| Fat back | 4 | 3.07 ± 0.71 c | 0.48 ± 0.00 d | 0.48 ± 0.00 b | 0 | 0 | 0 |
| Meat seasoned | 2 | 8.23 ± 1.1 ab | 1.16 ± 0.28 cd | 0.92 ± 0.62 ab | 0 | 0 | 0 |
| Pork, jowl | 4 | 5.33 ± 2.44 bc | 0.50 ± 0.04 d | 0.48 ± 0.00 b | 0 | 0 | 0 |
| Pollock, fillets | 2 | 2.50 ± 0.71 c | 0.48 ± 0.00 d | 0.48 ± 0.00 b | 0 | 0 | 0 |
| Seafood salad | 2 | 6.33 ± 0.04 ab | 1.47 ± 0.71 c | 0.48 ± 0.00 b | 0 | 0 | 0 |
| Shrimp, ground | 2 | 5.38 ± 0.25 bc | 0.48 ± 0.00 d | 0.48 ± 0.00 b | 0 | 0 | 0 |
| Egusi, ground | 2 | 5.36 ± 0.25 bc | 3.18 ± 1.12 b | 1.18 ± 0.00 ab | 0 | 0 | 0 |
| Okazi leave, dried | 2 | 8.73 ± 1.8 a | 5.04 ± 0.00 a | 1.43 ± 1.34 a | 100 | 0 | 100 |
| Saffron, powder | 2 | 7.72 ± 0.27 ab | 0.52 ± 0.06 d | 0.48 ± 0.00 b | 0 | 0 | 0 |
| Sample Type | Sample Number (n = 45) | Microorganisms | ||
|---|---|---|---|---|
| Aerobic Mesophiles | Coliforms | E. coli | ||
| Average | Average | Average | ||
| Chicken, free range | 2 | 3.53 ± 1.05 cd | 1.13 ± 0.49 c | 0.78 ± 0.00 a |
| Chicken, whole | 2 | 8.05 ± 0.02 a | 4.22 ± 1.05 a | 0.86 ± 0.00 a |
| Cow, feet | 2 | 2.93 ± 0.83 def | 0.78 ± 0.00 c | 0.78 ± 0.00 a |
| Goat meat | 3 | 3.41 ± 0.40 cde | 0.74 ± 0.24 c | 0.58 ± 0.17 b |
| Lamb meat | 2 | 3.71 ± 0.13 cd | 0.48 ± 0.00 c | 0.48 ± 0.00 b |
| Ox tail | 2 | 4.30 ± 0.28 c | 1.97 ± 0.43 b | 0.78 ± 0.00 a |
| Pork, BBQ | 2 | 2.39 ± 0.55 ef | 0.48 ± 0.00 c | 0.48 ± 0.00 b |
| Anchovies, smoked | 2 | 8.33 ± 0.16 a | 0.48 ± 0.00 c | 0.48 ± 0.00 b |
| Shrimp, smoked | 2 | 5.89 ± 0.41 b | 0.48 ± 0.00 c | 0.48 ± 0.00 b |
| Stock fish bites | 2 | 4.44 ± 0.33 c | 0.78 ± 0.00 c | 0.78 ± 0.00 a |
| Date | 2 | 2.00 ± 0.00 f | 0.48 ± 0.00 c | 0.48 ± 0.00 b |
| Bacteria | Nature of AMR a | Market Source (n) b | Prevalence (%) of Resistance or Non-Susceptibility to Each Quantity of Antimicrobial Agents c | |||||||||||
|---|---|---|---|---|---|---|---|---|---|---|---|---|---|---|
| 1 | 2 | 3 | 4 | 5 | 6 | 7 | 8 | 9 | 10 | 11 | MDR (≥3) d | |||
| Campylobacter | R | LCSMs (2) | 0.0 | 0.0 | 0.0 | 0.0 | 0.0 | 50.0 | 50.0 | 0.0 | 0.0 | 0.0 | 0.0 | 100 |
| SIOMs (12) | 0.0 | 0.0 | 25.0 | 16.7 | 25.0 | 0.0 | 25.0 | 0.0 | 0.0 | 0.0 | 0.0 | 66.7 | ||
| Total (14) | 0.0 | 0.0 | 21.4 | 7.1 | 28.6 | 7.1 | 28.6 | 0.0 | 0.0 | 0.0 | 0.0 | 71.4 | ||
| R+I | LCSMs (2) | 0.0 | 0.0 | 0.0 | 0.0 | 0.0 | 0.0 | 0.0 | 0.0 | 50.0 | 50.0 | 0.0 | NA e | |
| SIOMs (12) | 0.0 | 0.0 | 8.3 | 0.0 | 0.0 | 16.7 | 16.7 | 33.3 | 8.3 | 8.3 | 8.3 | NA | ||
| Total (14) | 0.0 | 0.0 | 7.1 | 0.0 | 0.0 | 14.3 | 14.3 | 35.7 | 14.3 | 7.1 | 7.1 | NA | ||
| E. coli | R | LCSMs (33) | 39.4 | 15.2 | 18.2 | 6.1 | 0.0 | 0.0 | 3.0 | 0.0 | 0.0 | 0.0 | 0.0 | 27.3 |
| SIOMs (60) | 18.3 | 26.7 | 11.7 | 8.3 | 10.0 | 1.7 | 3.3 | 0.0 | 0.0 | 0.0 | 0.0 | 35.0 | ||
| Total (93) | 25.8 | 22.6 | 14.0 | 7.5 | 6.5 | 2.2 | 2.2 | 0.0 | 0.0 | 0.0 | 0.0 | 32.3 | ||
| R+I | LCSMs (33) | 30.3 | 21.2 | 15.2 | 9.1 | 3.0 | 3.0 | 3.0 | 0.0 | 0.0 | 0.0 | 0.0 | NA | |
| SIOMs (60) | 10.0 | 20.0 | 20.0 | 10.0 | 8.3 | 10.0 | 3.3 | 0.0 | 0.0 | 0.0 | 0.0 | NA | ||
| Total (93) | 17.2 | 20.4 | 18.3 | 9.7 | 4.3 | 9.7 | 3.2 | 0.0 | 0.0 | 0.0 | 0.0 | NA | ||
| Listeria spp. | R | LCSMs (9) | 77.8 | 11.1 | 11.1 | 0.0 | 0.0 | 0.0 | 0.0 | 0.0 | 0.0 | 0.0 | 0.0 | 0.0 |
| SIOMs (6) | 66.7 | 0.0 | 16.7 | 16.7 | 0.0 | 0.0 | 0.0 | 0.0 | 0.0 | 0.0 | 0.0 | 33.4 | ||
| Total (15) | 73.3 | 6.7 | 13.3 | 6.7 | 0.0 | 0.0 | 0.0 | 0.0 | 0.0 | 0.0 | 0.0 | 13.3 | ||
| R+I | LCSMs (9) | 77.8 | 0.0 | 0.0 | 0.0 | 11.1 | 11.1 | 0.0 | 0.0 | 0.0 | 0.0 | 0.0 | NA | |
| SIOMs (6) | 66.7 | 0.0 | 0.0 | 16.7 | 16.7 | 0.0 | 0.0 | 0.0 | 0.0 | 0.0 | 0.0 | NA | ||
| Total (15) | 73.3 | 0.0 | 0.0 | 6.7 | 13.3 | 6.7 | 0.0 | 0.0 | 0.0 | 0.0 | 0.0 | NA | ||
| Salmonella | R | LCSMs (1) | 0.0 | 100 | 0.0 | 0.0 | 0.0 | 0.0 | 0.0 | 0.0 | 0.0 | 0.0 | 0.0 | 0.0 |
| SIOMs (7) | 42.9 | 14.3 | 0.0 | 14.3 | 0.0 | 0.0 | 0.0 | 0.0 | 0.0 | 0.0 | 0.0 | 14.3 | ||
| Total (8) | 37.5 | 25.0 | 0.0 | 12.5 | 0.0 | 0.0 | 0.0 | 0.0 | 0.0 | 0.0 | 0.0 | 12.5 | ||
| R+I | LCSMs (1) | 0.0 | 100 | 0.0 | 0.0 | 0.0 | 0.0 | 0.0 | 0.0 | 0.0 | 0.0 | 0.0 | NA | |
| SIOMs (7) | 28.6 | 28.6 | 0.0 | 14.3 | 0.0 | 0.0 | 0.0 | 0.0 | 0.0 | 0.0 | 0.0 | NA | ||
| Total (8) | 25.0 | 37.5 | 0.0 | 12.5 | 0.0 | 0.0 | 0.0 | 0.0 | 0.0 | 0.0 | 0.0 | NA | ||
Disclaimer/Publisher’s Note: The statements, opinions and data contained in all publications are solely those of the individual author(s) and contributor(s) and not of MDPI and/or the editor(s). MDPI and/or the editor(s) disclaim responsibility for any injury to people or property resulting from any ideas, methods, instructions or products referred to in the content. |
© 2023 by the authors. Licensee MDPI, Basel, Switzerland. This article is an open access article distributed under the terms and conditions of the Creative Commons Attribution (CC BY) license (https://creativecommons.org/licenses/by/4.0/).
Share and Cite
Kim, C.; Goodwyn, B.; Albukhaytan, S.; Nartea, T.; Ndegwa, E.; Dhakal, R. Microbiological Survey and Antimicrobial Resistance of Foodborne Bacteria in Select Meat Products and Ethnic Food Products Procured from Food Desert Retail Outlets in Central Virginia, USA. Pathogens 2023, 12, 965. https://doi.org/10.3390/pathogens12070965
Kim C, Goodwyn B, Albukhaytan S, Nartea T, Ndegwa E, Dhakal R. Microbiological Survey and Antimicrobial Resistance of Foodborne Bacteria in Select Meat Products and Ethnic Food Products Procured from Food Desert Retail Outlets in Central Virginia, USA. Pathogens. 2023; 12(7):965. https://doi.org/10.3390/pathogens12070965
Chicago/Turabian StyleKim, Chyer, Brian Goodwyn, Sakinah Albukhaytan, Theresa Nartea, Eunice Ndegwa, and Ramesh Dhakal. 2023. "Microbiological Survey and Antimicrobial Resistance of Foodborne Bacteria in Select Meat Products and Ethnic Food Products Procured from Food Desert Retail Outlets in Central Virginia, USA" Pathogens 12, no. 7: 965. https://doi.org/10.3390/pathogens12070965