Diverse Epidemiology of Leptospira Serovars Notified in New Zealand, 1999–2017

 , , , , and
Abstract
:1. Introduction
2. Results
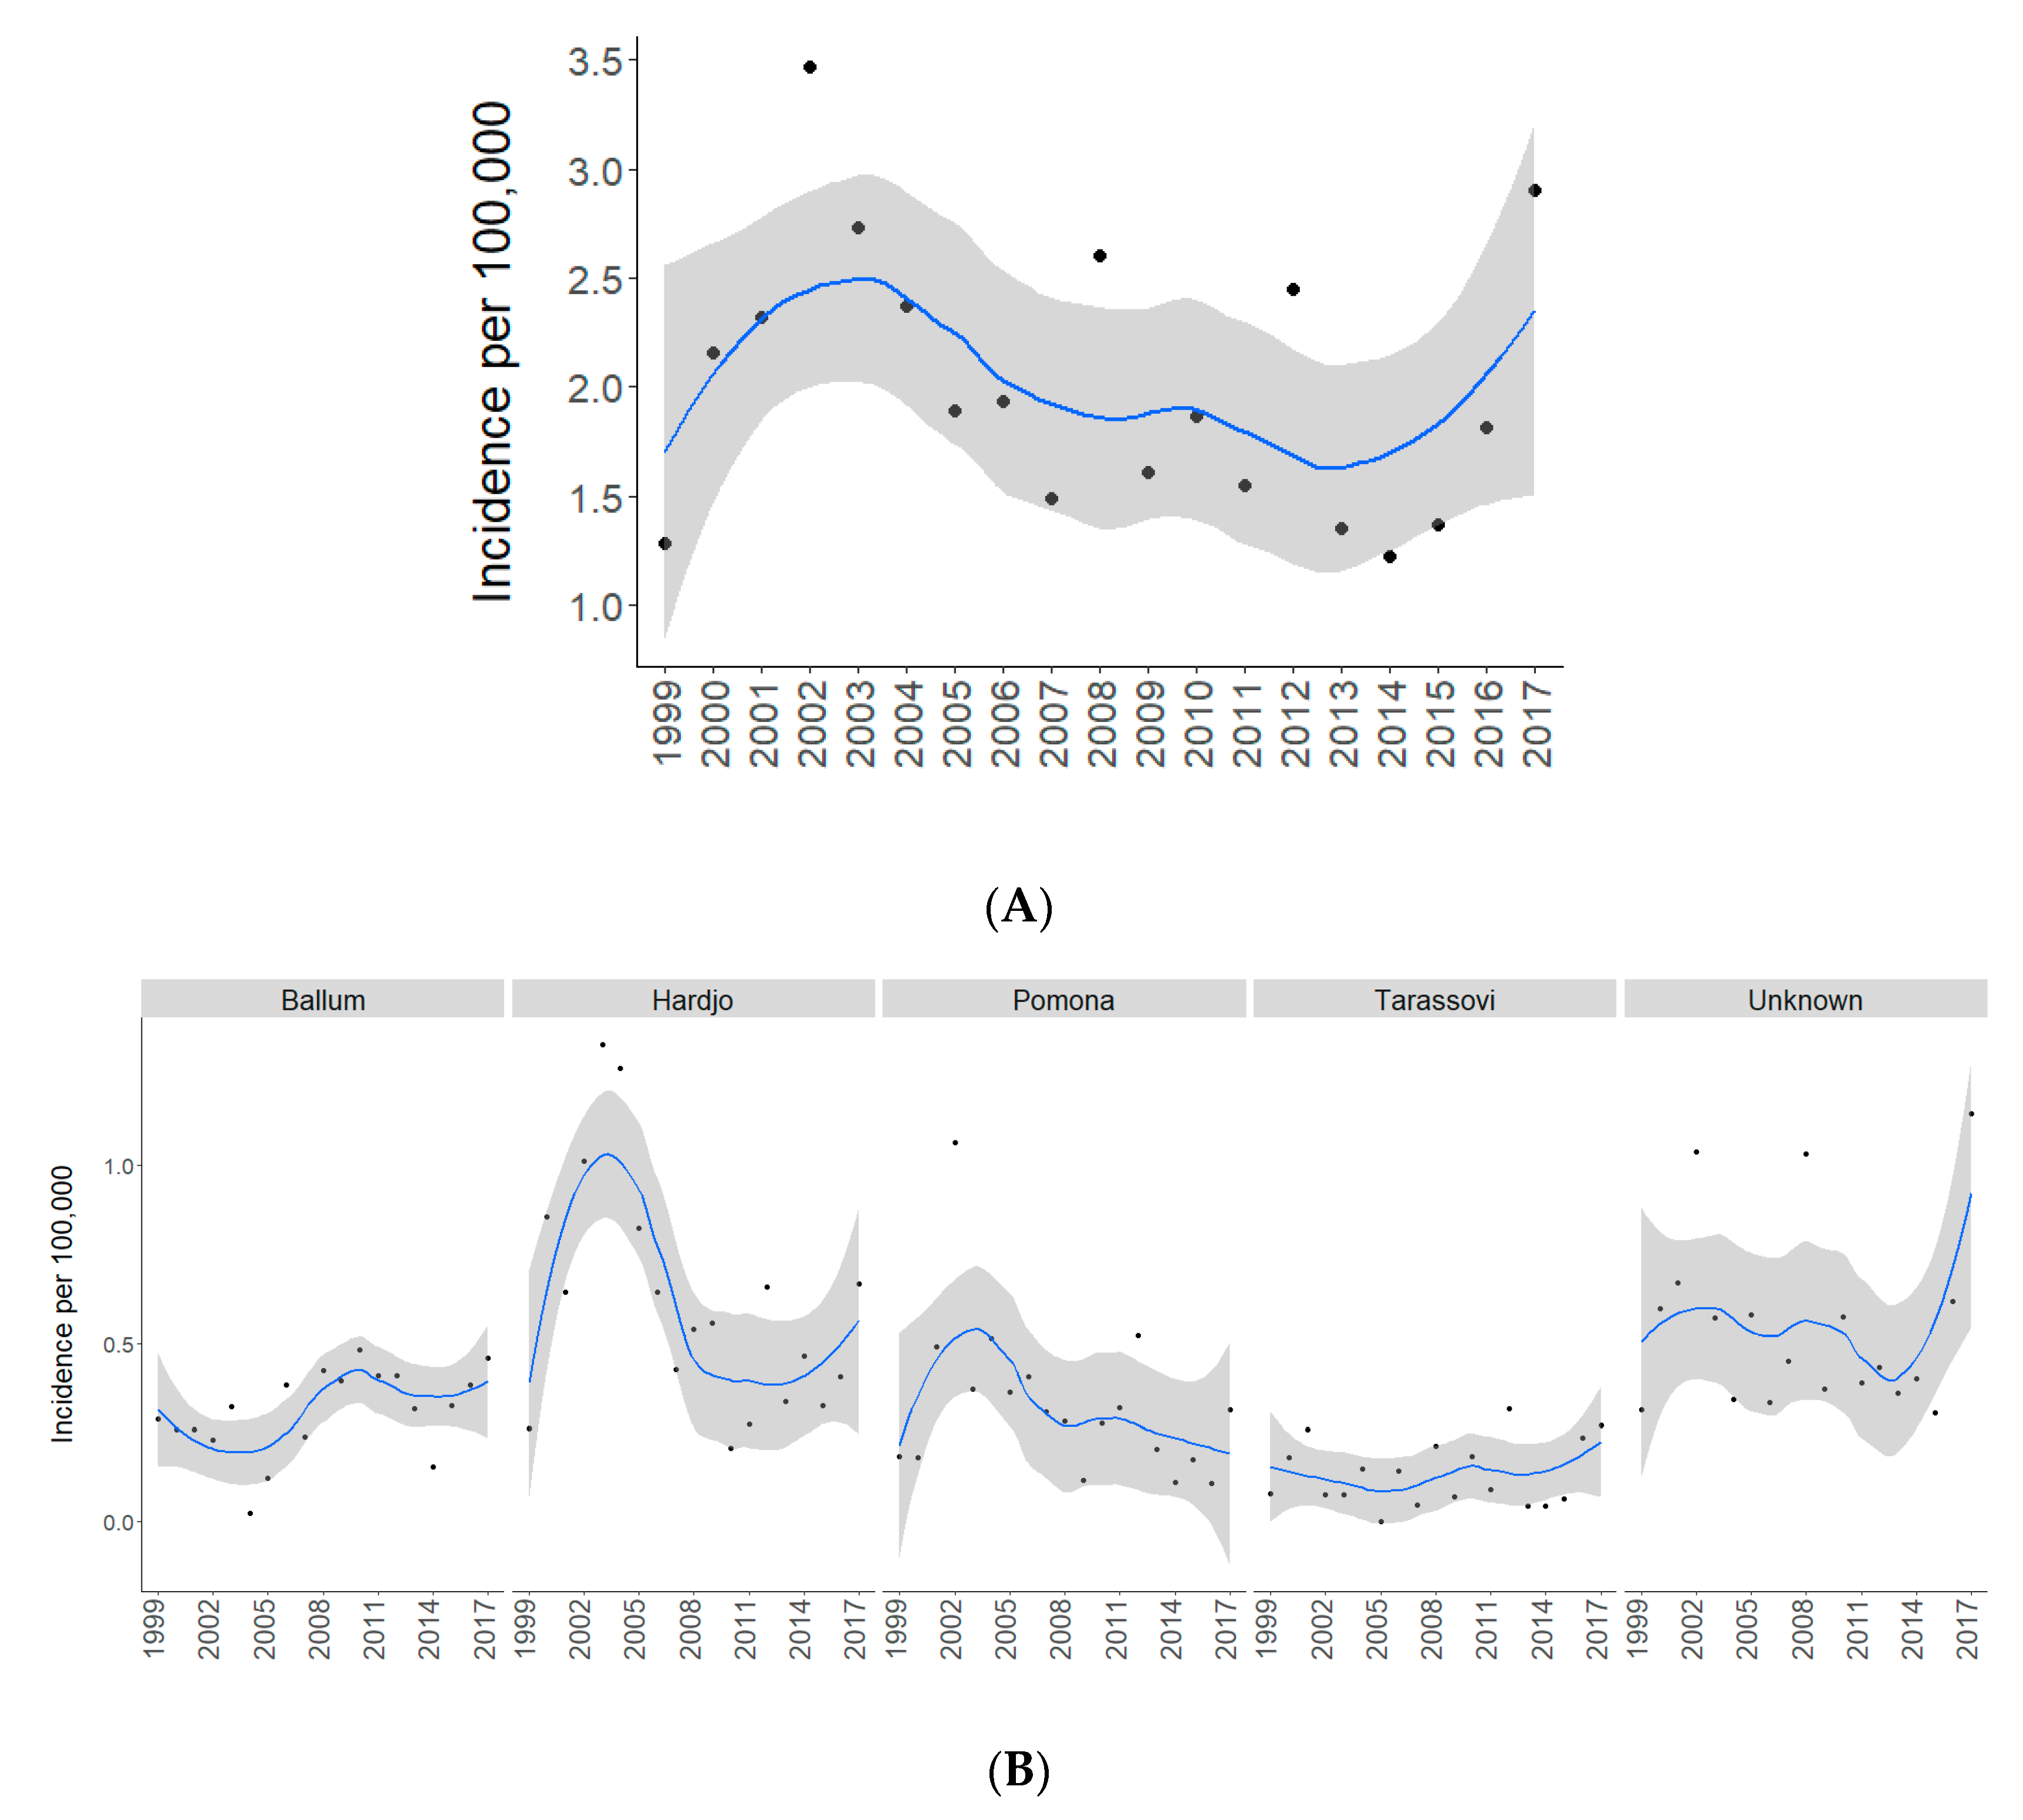
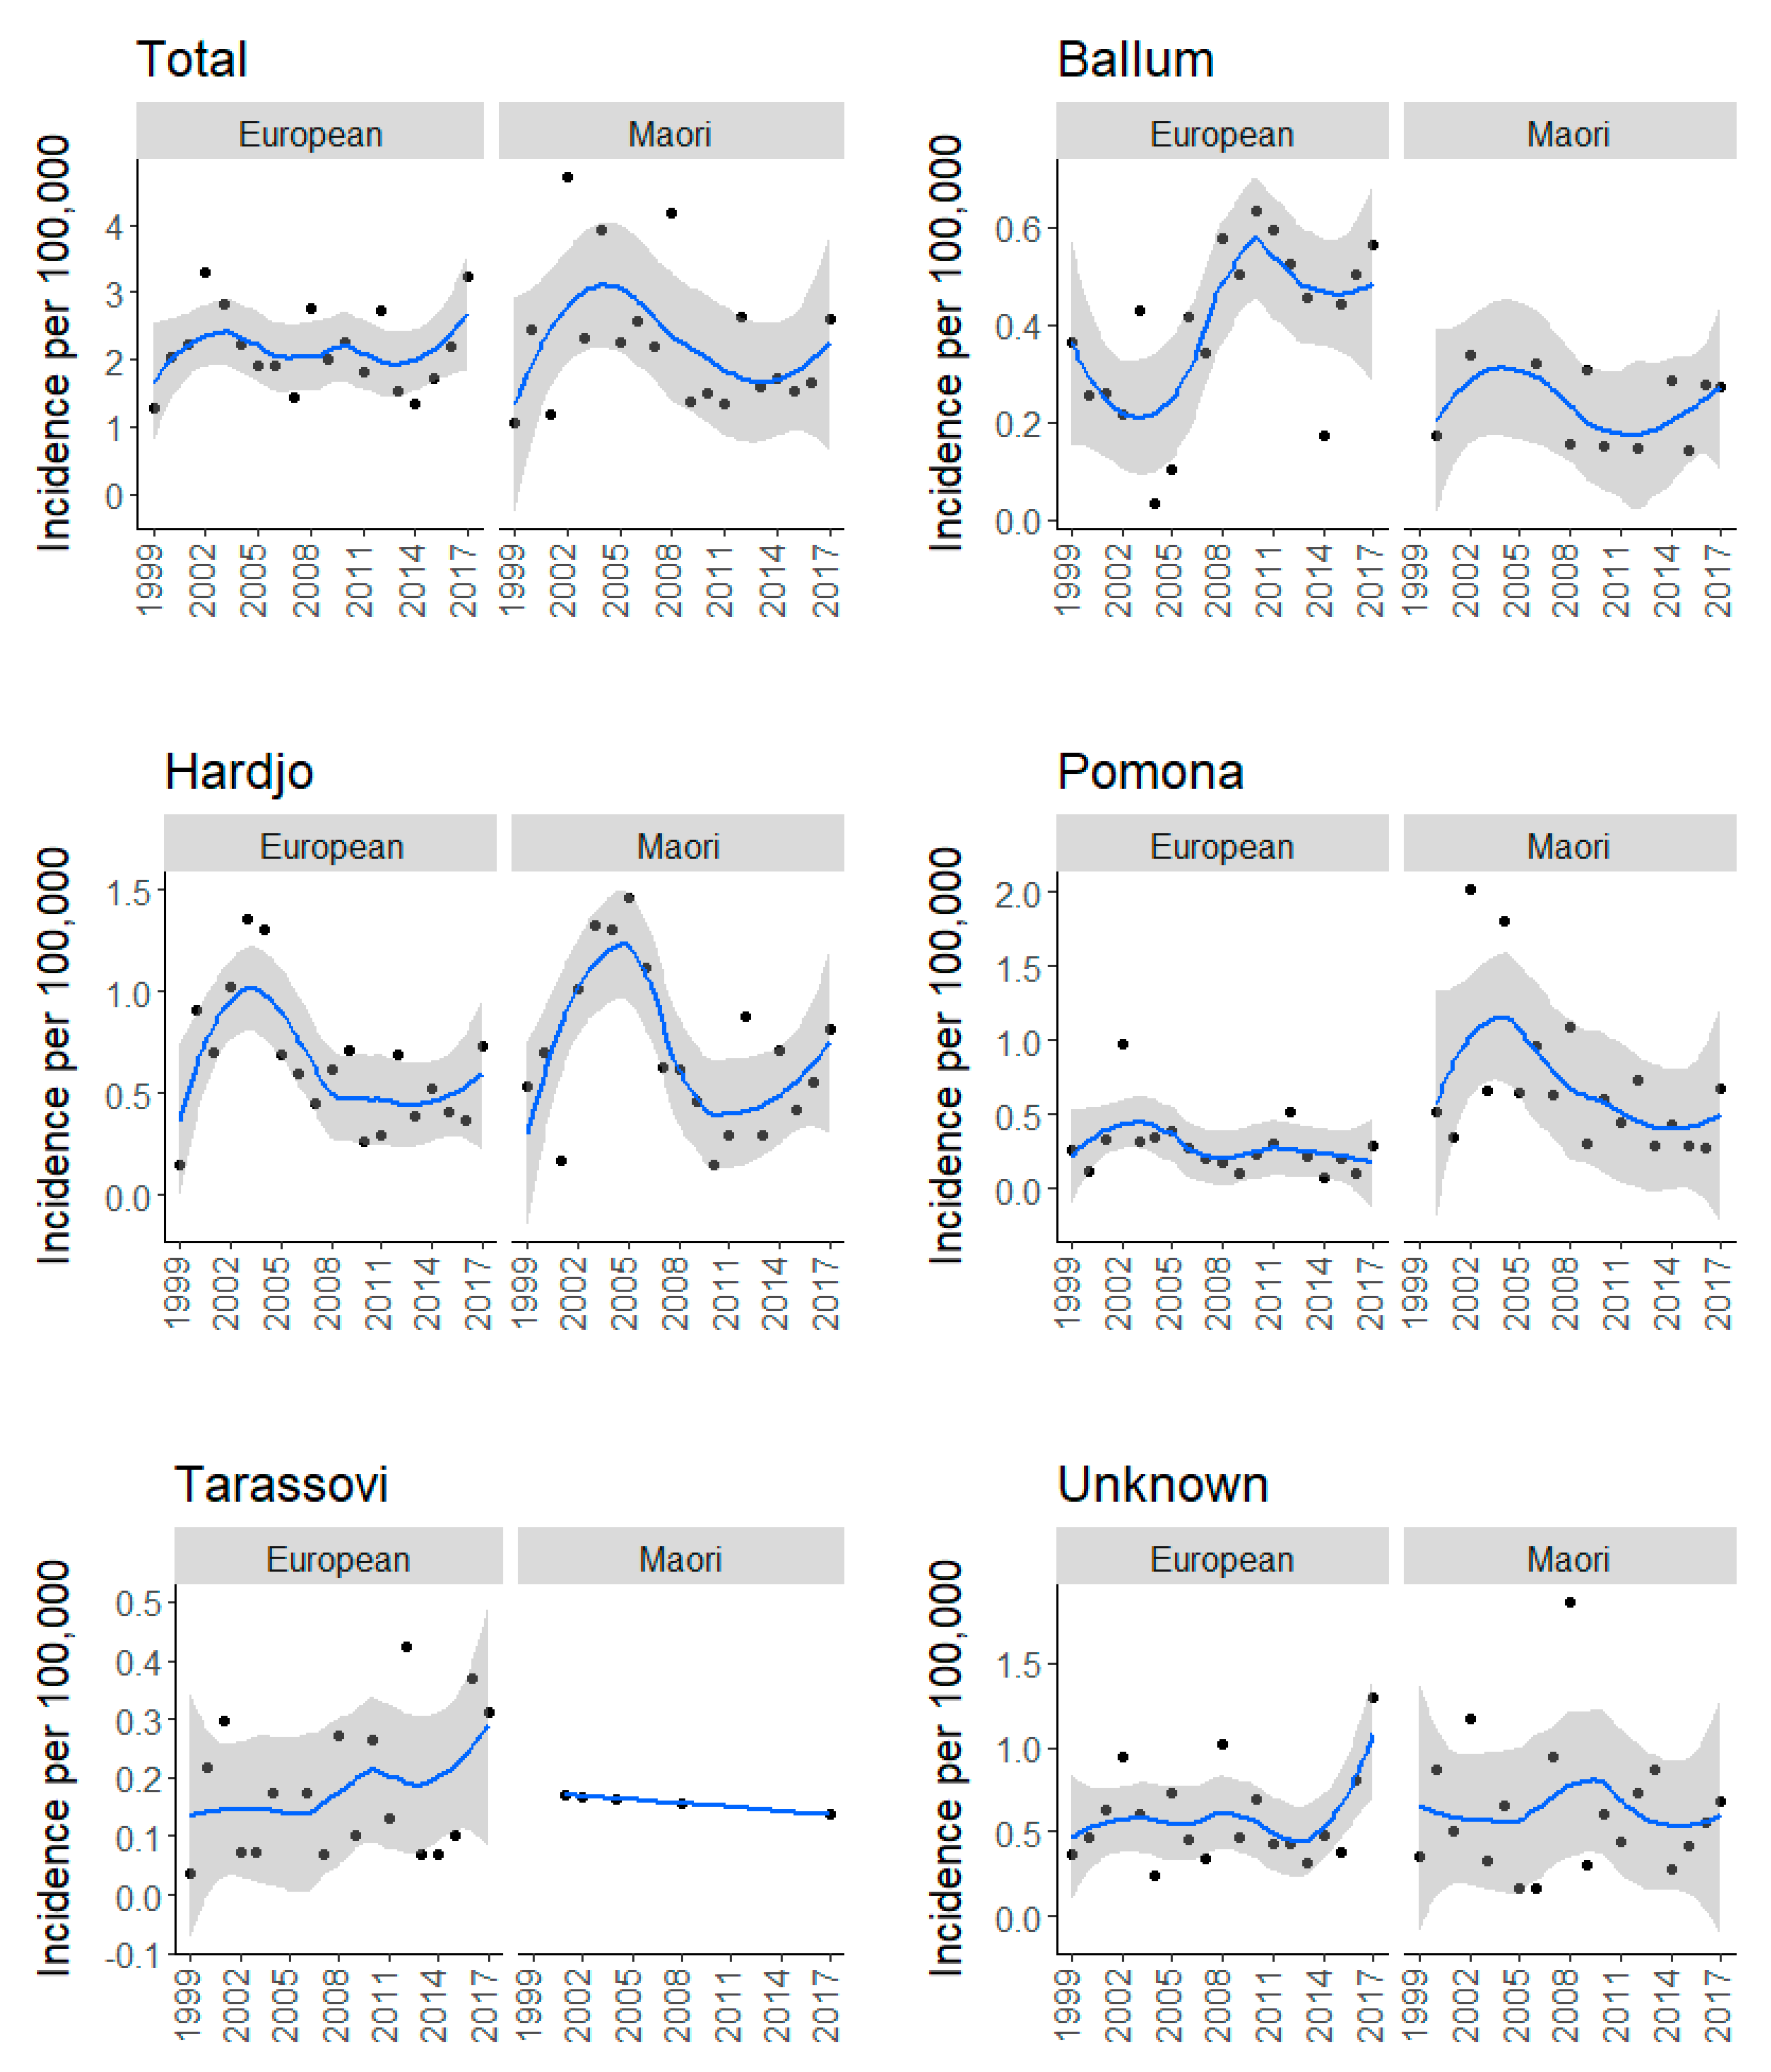
2.1. Total and Serovar-Specific Incidences
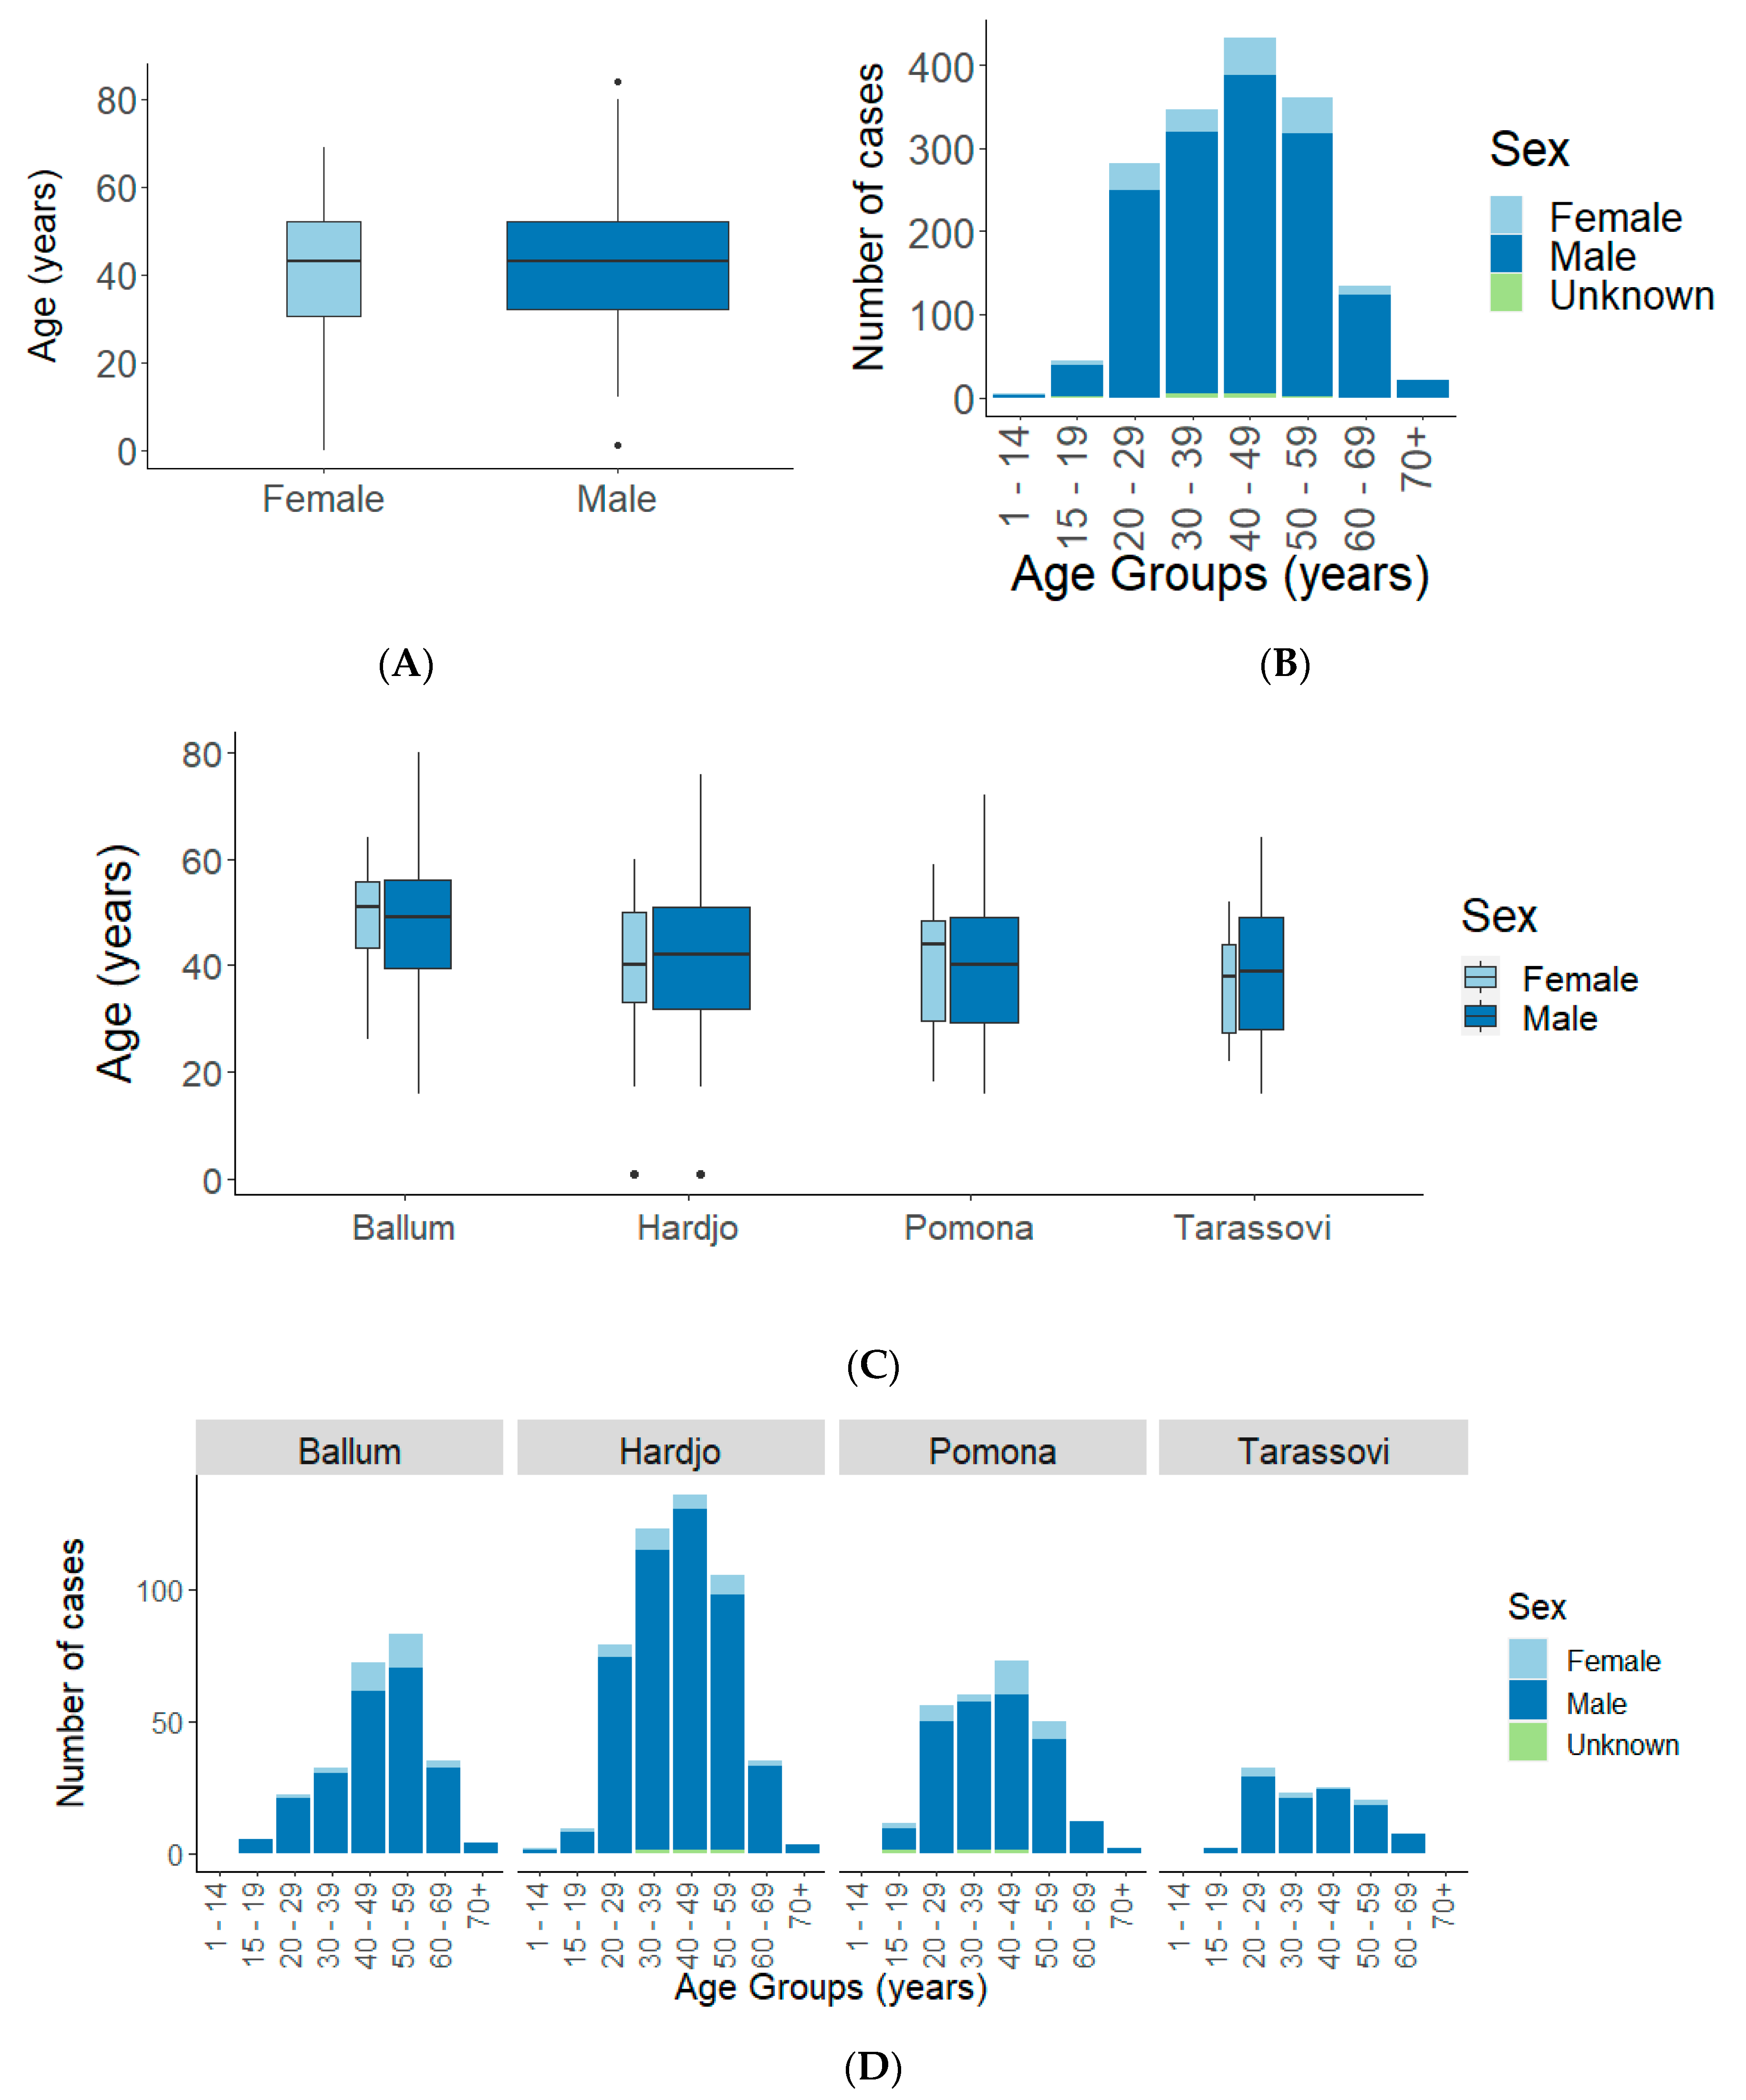
2.1.1. Sex and Age
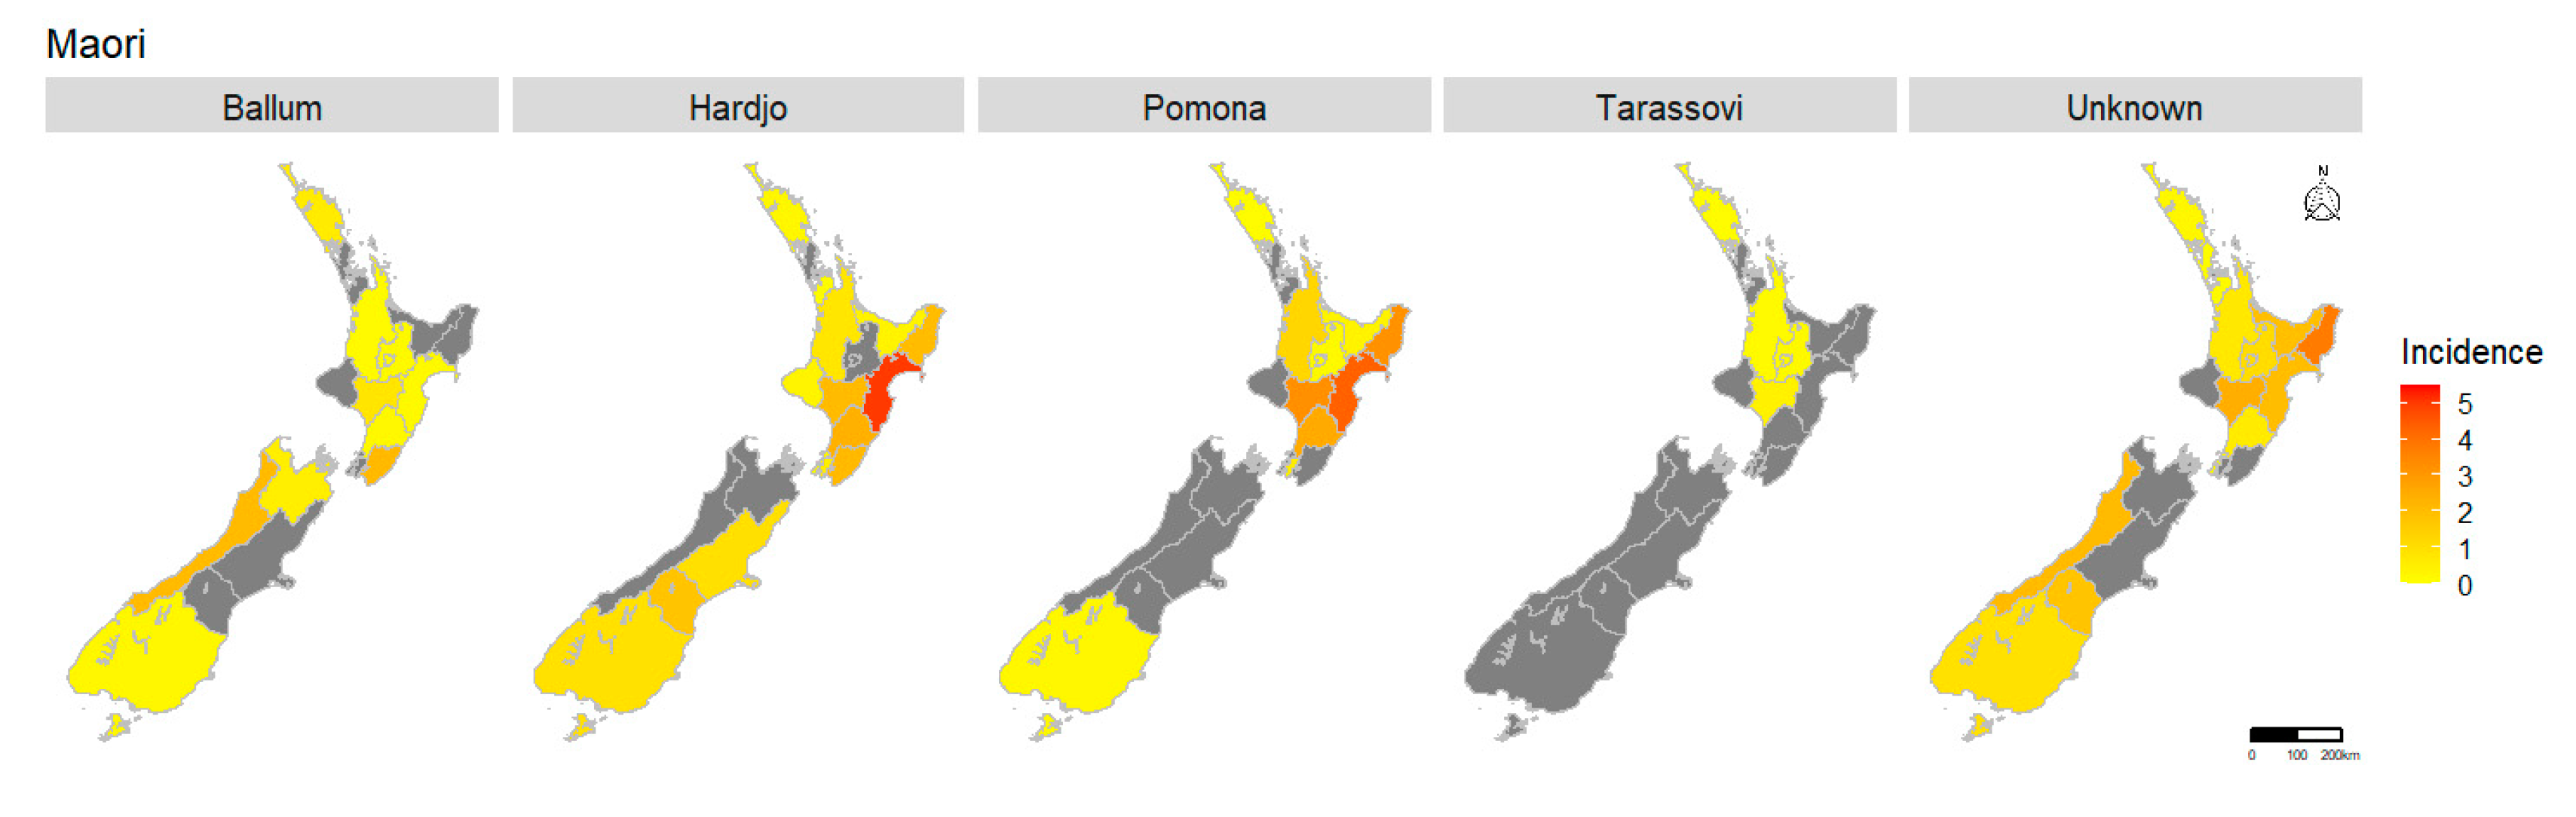
2.1.2. Ethnicity
2.1.3. Occupation
2.1.4. Hospitalization
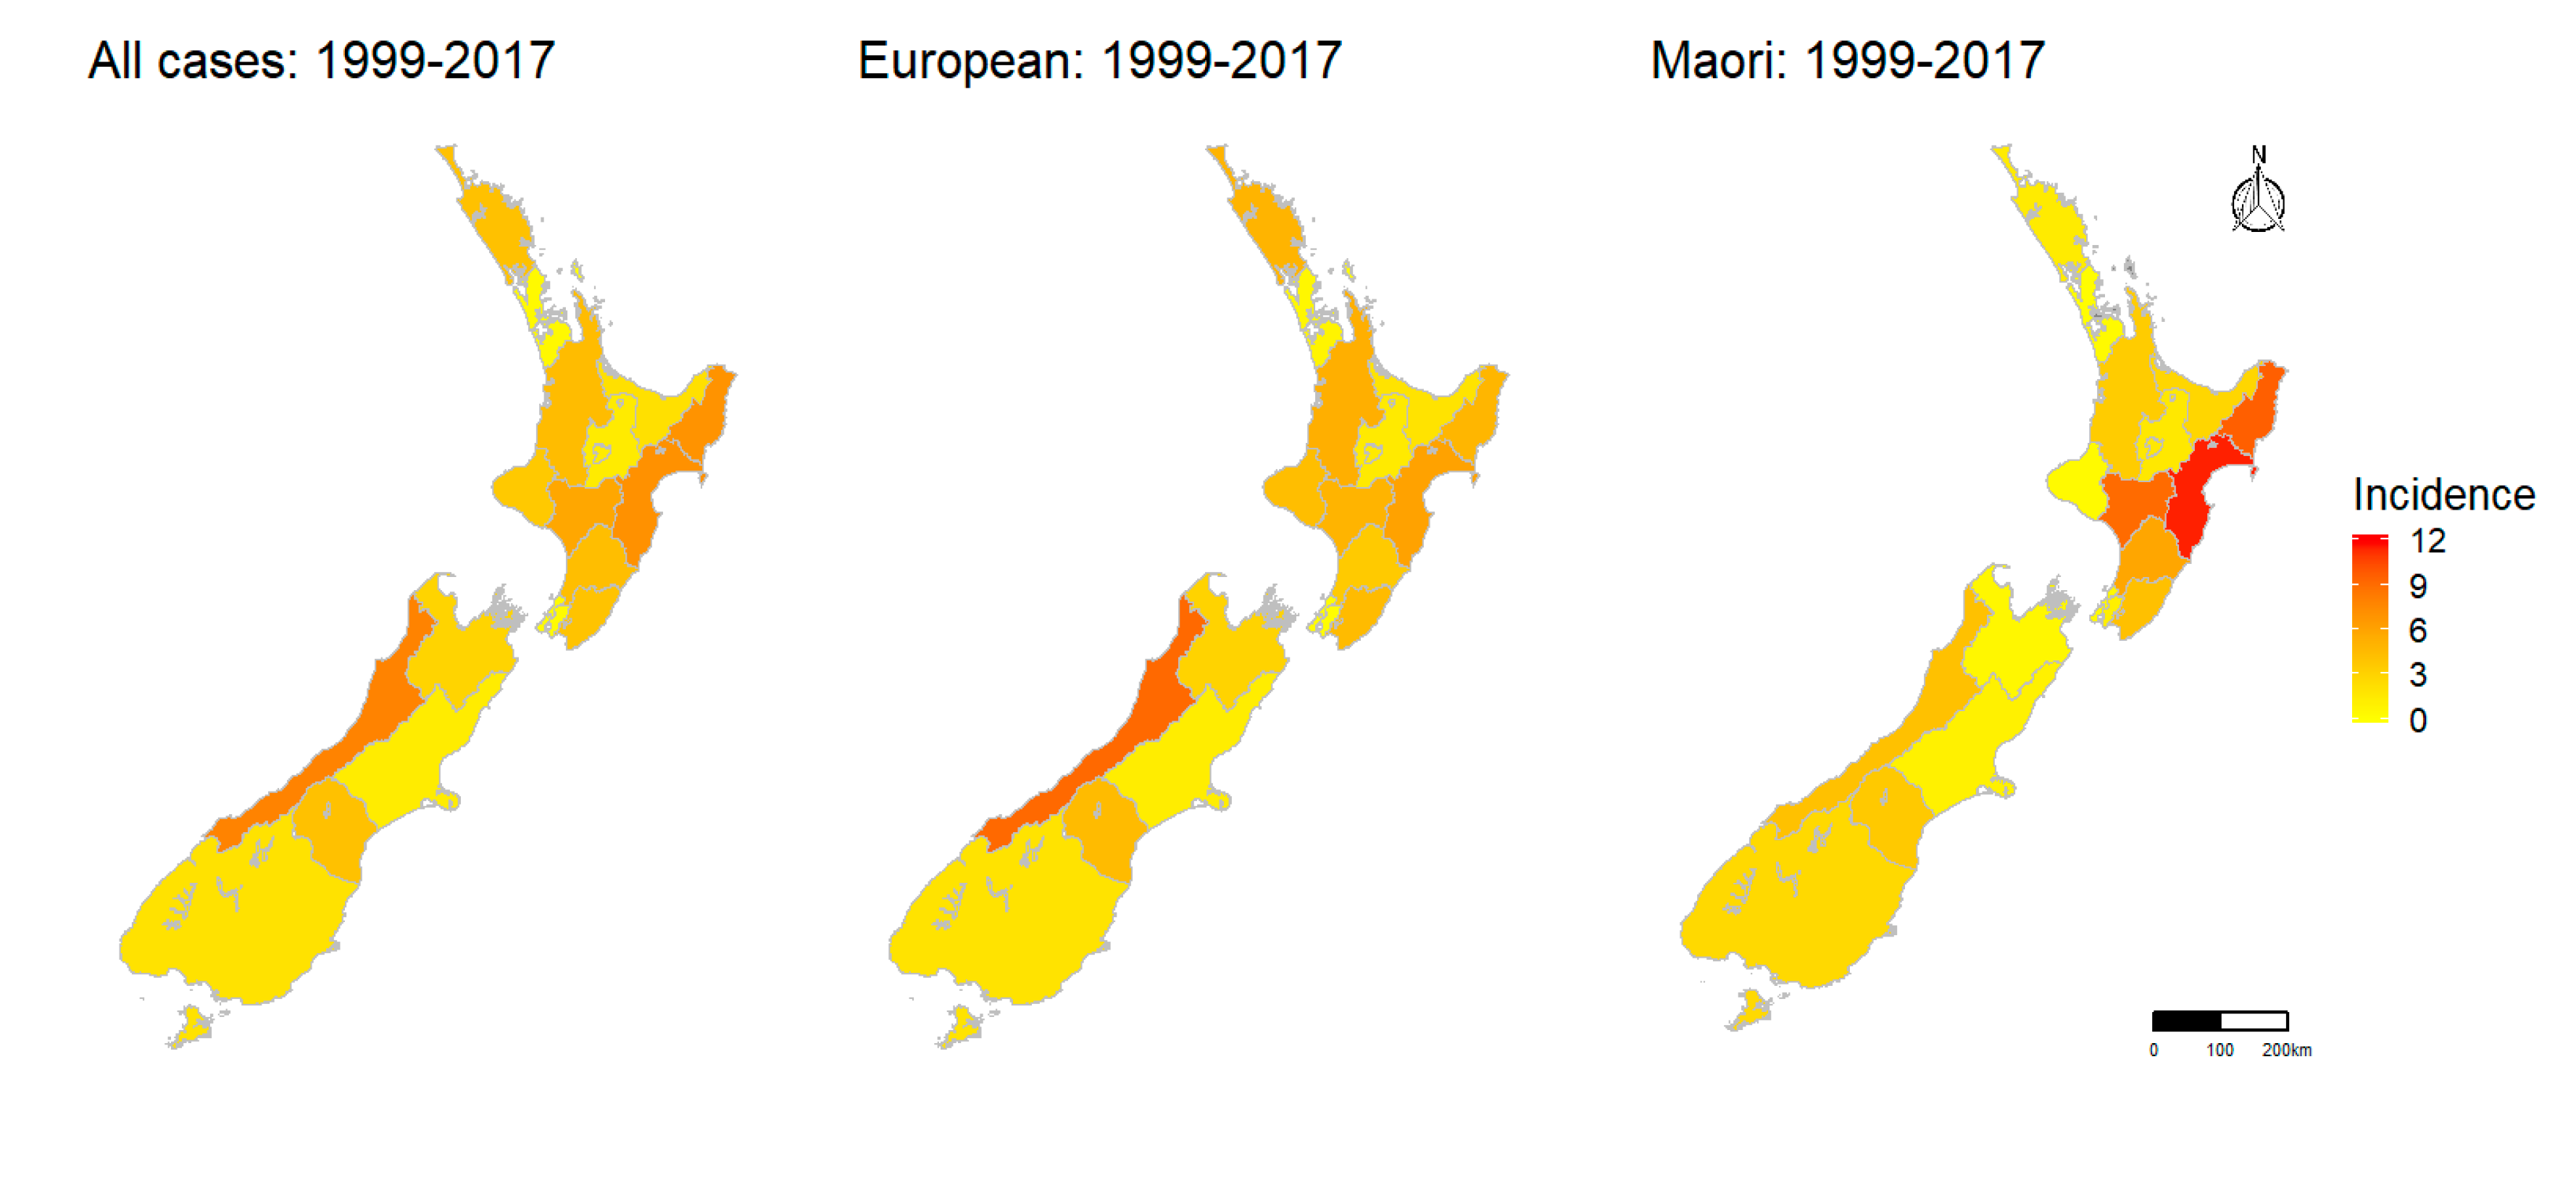
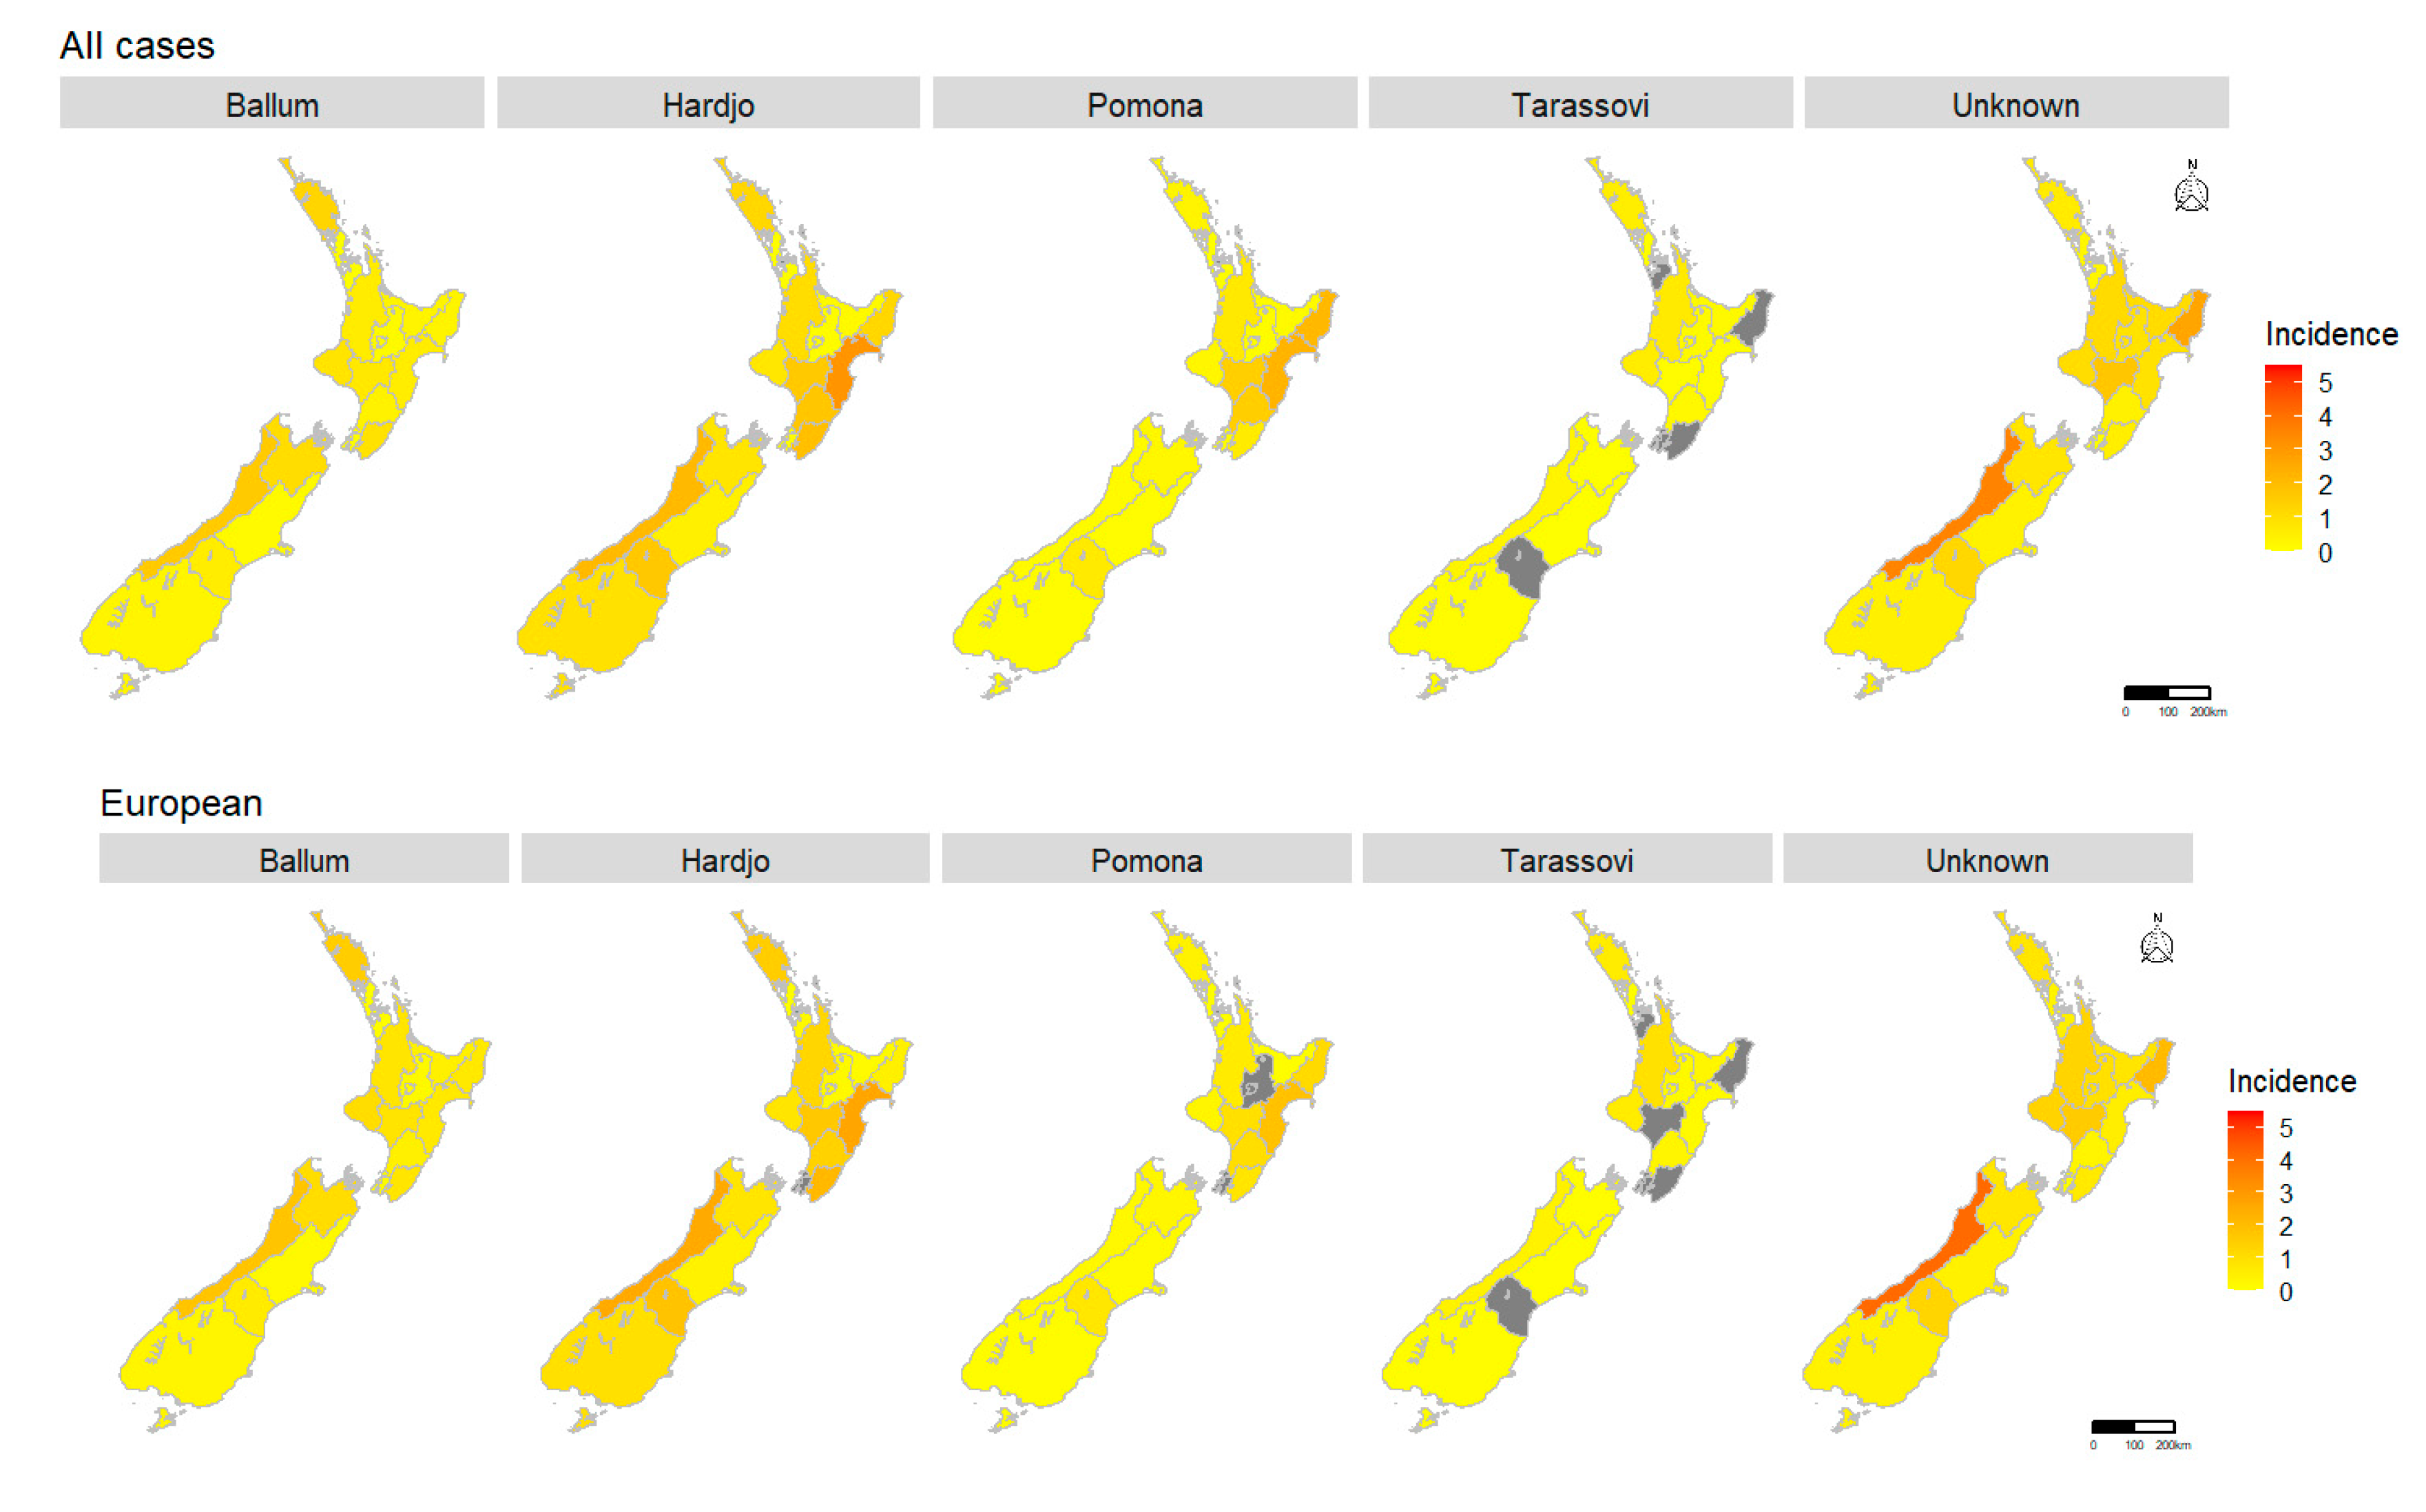
2.1.5. Spatial Pattern
3. Discussion
3.1. Implications for Surveillance and Research
3.2. Implications for Prevention and Control
4. Materials and Methods
5. Conclusions
Supplementary Materials
Author Contributions
Funding
Acknowledgments
Conflicts of Interest
References
- Adler, B.; Moctezuma, A.D.L.P. Leptospira and leptospirosis. Vet. Microbiol. 2010, 140, 287–296. [Google Scholar] [CrossRef] [PubMed]
- Costa, F.; Hagan, J.E.; Calcagno, J.; Kane, M.; Torgerson, P.; Martinez-Silveira, M.S.; Stein, C.; Abela-Ridder, B.; Ko, A.I. Global morbidity and mortality of leptospirosis: A systematic review. PLoS Negl. Trop. Dis. 2015, 9, e0003898. [Google Scholar] [CrossRef] [PubMed]
- Torgerson, P.R.; Hagan, J.E.; Costa, F.; Calcagno, J.; Kane, M.; Martinez-Silveira, M.S.; Goris, M.G.A.; Stein, C.; Ko, A.I.; Abela-Ridder, B. Global burden of leptospirosis: Estimated in terms of disability adjusted life years. PLoS Negl. Trop. Dis. 2015, 9, e0004122. [Google Scholar] [CrossRef] [PubMed] [Green Version]
- Haake, D.A.; Levett, P.N. Leptospirosis in humans. Curr. Top. Microbiol. Immunol. 2015, 387, 65–97. [Google Scholar] [PubMed] [Green Version]
- Benschop, J.; Collins-Emerson, J.; Maskill, A.; O’Connor, P.; Tunbridge, M.; Yupiana, Y.; Weston, J. Leptospirosis in three workers on a dairy farm with unvaccinated cattle. N. Z. Med. J. 2017, 130, 102–108. [Google Scholar] [PubMed]
- Goris, M.G.A.; Kikken, V.; Straetemans, M.; Alba, S.; Goeijenbier, M.; Van Gorp, E.C.M.; Boer, K.R.; Wagenaar, J.F.P.; Hartskeerl, R.A. Towards the burden of human leptospirosis: Duration of acute illness and occurrence of post-leptospirosis symptoms of patients in The Netherlands. PLoS ONE 2013, 8, e76549. [Google Scholar] [CrossRef] [Green Version]
- Bharti, A.R.; Nally, J.E.; Ricaldi, J.N.; Matthias, M.A.; Diaz, M.M.; Lovett, M.A.; Levett, P.N.; Gilman, R.H.; Willig, M.R.; Gotuzzo, E.; et al. Leptospirosis: A zoonotic disease of global importance. Lancet Infect. Dis. 2003, 3, 757–771. [Google Scholar] [CrossRef]
- Thibeaux, R.; Iraola, G.; Ferrés, I.; Bierque, E.; Girault, D.; Soupé-Gilbert, M.-E.; Picardeau, M.; Goarant, C. Deciphering the unexplored Leptospira diversity from soils uncovers genomic evolution to virulence. Microb. Genom. 2018, 4, e000144. [Google Scholar] [CrossRef]
- Vincent, A.T.; Schiettekatte, O.; Goarant, C.; Neela, V.K.; Bernet, E.; Thibeaux, R.; Ismail, N.; Khalid, M.K.N.M.; Amran, F.; Masuzawa, T.; et al. Revisiting the taxonomy and evolution of pathogenicity of the genus Leptospira through the prism of genomics. PLoS Negl. Trop. Dis. 2019, 13, e0007270. [Google Scholar] [CrossRef] [Green Version]
- Picardeau, M. Virulence of the zoonotic agent of leptospirosis: Still terra incognita? Nat. Rev. Genet. 2017, 15, 297–307. [Google Scholar] [CrossRef]
- Dunay, S.N.; Bass, J.; Stremick, J. Leptospirosis: A global health burden in review. Emerg. Med. Open Access 2016, 6. [Google Scholar] [CrossRef] [Green Version]
- Whitcombe, E.; Maze, M.J.; Crump, J.A. Leopold kirschner, Edward Sayers, and Neil Bruère: The initial descriptions of leptospirosis in New Zealand. Aust. N. Z. J. Public Health 2019, 44, 5–7. [Google Scholar] [CrossRef]
- Marshall, R.B.; Manktelow, B.W. Fifty years of leptospirosis research in New Zealand: A perspective. N. Z. Vet. J. 2002, 50, 61–63. [Google Scholar] [CrossRef] [PubMed]
- Marshall, R.; Chereshsky, A. Vaccination of dairy cattle against leptospirosis as a means of preventing human infections. Surveillance 1996, 23, 27–28. [Google Scholar]
- Fairly, R. Porcine leptospirosis in New Zealand. Surveillance 1997, 24, 15. [Google Scholar]
- Thornley, C.N.; Baker, M.G.; Weinstein, P.; Maas, E.W. Changing epidemiology of human leptospirosis in New Zealand. Epidemiol. Infect. 2002, 128, 29–36. [Google Scholar] [CrossRef]
- El-Tras, W.F.; Bruce, M.; Holt, H.R.; Eltholth, M.M.; Merien, F. Update on the status of leptospirosis in New Zealand. Acta Trop. 2018, 188, 161–167. [Google Scholar] [CrossRef] [PubMed]
- Dreyfus, A.; Heuer, C.; Wilson, P.; Collins-Emerson, J.; Baker, M.G.; Benschop, J. Risk of infection and associated influenza-like disease among abattoir workers due to two Leptospira species. Epidemiol. Infect. 2015, 143, 2095–2105. [Google Scholar] [CrossRef] [Green Version]
- McLean, M.; Ruscoe, Q.; Kline, T.; King, C.; Nesdale, A. A cluster of three cases of leptospirosis in dairy farm workers in New Zealand. N. Z. Med. J. 2014, 127, 13–20. [Google Scholar]
- Benschop, J.; Heuer, C.; Jaros, P.; Collins-Emerson, J.; Midwinter, A.; Wilson, P. Sero-prevalence of leptospirosis in workers at a New Zealand slaughterhouse. N. Z. Med. J. 2009, 122, 39–47. [Google Scholar]
- Firth, H.M.; Rothstein, D.S.; Herbison, P.; McBride, D. Chemical exposure among NZ farmers. Int. J. Environ. Health Res. 2007, 17, 33–43. [Google Scholar] [CrossRef] [PubMed]
- Smythe, L.D.; Smith, I.L.; Smith, G.A.; Dohnt, M.F.; Symonds, M.L.; Barnett, L.J.; McKay, D.B. A quantitative PCR (TaqMan) assay for pathogenic Leptospira spp. BMC Infect. Dis. 2002, 2, 13. [Google Scholar] [CrossRef] [PubMed] [Green Version]
- Yupiana, Y.; Vallee, E.; Wilson, P.; Collins-Emerson, J.; Weston, J.; Benschop, J.; Heuer, C. Emerging Leptospira strain poses public health risk for dairy farmers in New Zealand. Prev. Vet. Med. 2019, 170, 104727. [Google Scholar] [CrossRef] [PubMed]
- Sanhueza, J.; Heuer, C.; Wilson, P.R.; Benschop, J.; Collins-Emerson, J.M. Seroprevalence and risk factors for leptospira seropositivity in beef cattle, sheep and deer farmers in New Zealand. Zoonoses Public Health 2016, 64, 370–380. [Google Scholar] [CrossRef]
- Dreyfus, A.; Wilson, P.; Collins-Emerson, J.; Benschop, J.; Moore, S.; Heuer, C. Risk factors for new infection with Leptospira in meat workers in New Zealand. Occup. Environ. Med. 2014, 72, 219–225. [Google Scholar] [CrossRef]
- Mackintosh, C.; Marshall, R.; Blackmore, D. Leptospira interrogans serovar balcanica in cattle. N. Z. Vet. J. 1980, 28, 268. [Google Scholar] [CrossRef]
- Hathaway, S.C.; Blackmore, D.K.; Marshall, R.B. The serologic and cultural prevalence of leptospira interrogans serovar balcanica in possums (trichosurus vulpecula) in New Zealand. J. Wildl. Dis. 1978, 14, 345–350. [Google Scholar] [CrossRef] [Green Version]
- Mwachui, M.A.; Crump, L.; Hartskeerl, R.; Zinsstag, J.; Hattendorf, J. Environmental and behavioural determinants of leptospirosis transmission: A systematic review. PLoS Negl. Trop. Dis. 2015, 9, e0003843. [Google Scholar] [CrossRef] [Green Version]
- Moinet, M.; Nisa, S.; Haack, N.; Wilkinson, D.A.; Oosterhof, H.; Aberdein, D.; Benschop, J. Is wildlife a source of Leptospira infection in livestock in New Zealand. In Proceedings of the Society of Dairy Cattle Veterinarians of the NZVA Annual Conference—2017 Proceedings of the Society of Dairy Cattle Veterinarians Annual Conference, Wellington, New Zealand, January 2017; VetLearn Foundation: Palmerston North, New Zealand, 2017; Volume 332, pp. 30–33. [Google Scholar]
- Garvey, P.; Connell, J.; O’Flanagan, D.; McKeown, P. Leptospirosis in Ireland: Annual incidence and exposures associated with infection. Epidemiol. Infect. 2013, 142, 847–855. [Google Scholar] [CrossRef]
- Jansen, A.; Schöneberg, I.; Frank, C.; Alpers, K.; Schneider, T.; Stark, K. Leptospirosis in Germany, 1962–2003. Emerg. Infect. Dis. 2005, 11, 1048–1054. [Google Scholar] [CrossRef]
- Ciceroni, L.; Stepan, E.; Pinto, A.; Pizzocaro, P.; Dettori, G.; Franzin, L.; Lupidi, R.; Mansueto, S.; Manera, A.; Ioli, A.; et al. Epidemiological trend of human leptospirosis in Italy between 1994 and 1996. Eur. J. Epidemiol. 2000, 16, 79–86. [Google Scholar] [CrossRef] [PubMed]
- Baranton, G.; Postic, D. Trends in leptospirosis epidemiology in France. Sixty-six years of passive serological surveillance from 1920 to 2003. Int. J. Infect. Dis. 2006, 10, 162–170. [Google Scholar] [CrossRef] [Green Version]
- Bakoss, P.; Machacová, E.; Jareková, J. Long-term trends in the epidemiology of human leptospirosis (Slovak Republic, 1954–2006). Eur. J. Clin. Microbiol. Infect. Dis. 2012, 31, 2167–2176. [Google Scholar] [CrossRef]
- Musso, D.; La Scola, B. Laboratory diagnosis of leptospirosis: A challenge. J. Microbiol. Immunol. Infect. 2013, 46, 245–252. [Google Scholar] [CrossRef] [PubMed] [Green Version]
- Russell, J.C.; Innes, J.G.; Brown, P.H.; Byrom, A.E. Predator-free New Zealand: Conservation country. Bioscience 2015, 65, 520–525. [Google Scholar] [CrossRef] [Green Version]
- Statistics New Zealand. Available online: https://www.stats.govt.nz/indicators/livestock-numbers#:~:text=The%20largest%20number%20of%20dairy,5%20million%20to%203.6%20million).&text=Total%20cattle%20have%20increased%20from,and%203.6%20million%20beef%20cattle) (accessed on 4 September 2020).
- Lau, C.; Smythe, L.; Weinstein, P. Leptospirosis: An emerging disease in travellers. Travel Med. Infect. Dis. 2010, 8, 33–39. [Google Scholar] [CrossRef]
- Communicable Disease Control Manual. 2018. Available online: https://www.health.govt.nz/our-work/diseases-and-conditions/communicable-disease-control-manual/leptospirosis#casedef (accessed on 4 March 2020).
- Ethnicity Code Tables. 2010. Available online: https://www.health.govt.nz/nz-health-statistics/data-references/code-tables/common-code-tables/ethnicity-code-tables (accessed on 4 March 2020).
- Statistics New Zealand. Available online: https://www.stats.govt.nz/topics/census (accessed on 4 March 2020).
- District Health Board Boundaries. 2012. Available online: https://koordinates.com/layer/4324-nz-district-health-boards-2012/ (accessed on 31 January 2020).
- StataCorp. Stata Statistical Software: Release 14; StataCorp LP: College Station, TX, USA, 2015. [Google Scholar]
- R Core Team. R: A Language and Environment for Statistical Computing; R Foundation for Statistical Computing: Vienna, Austria, 2020. [Google Scholar]
- Wickham, H.; François, R. Dplyr: A Grammar of Data Manipulation. 2014. Available online: https://CRAN.R-project.org/package=dplyr (accessed on 9 October 2020).
- Wickham, H.; Averick, M.; Bryan, J.; Chang, W.; McGowan, L.D.; François, R.; Grolemund, G.; Hayes, A.; Henry, L.; Hester, J.; et al. Welcome to the Tidyverse. J. Open Source Softw. 2019, 4, 1686. [Google Scholar] [CrossRef]
- Wickham, H. Forcats: Tools for Working with Categorical Variables (Factors); R Package Version 0.5.0. 2020. Available online: https://CRAN.R-project.org/package=forcats (accessed on 9 October 2020).
- Stevenson, M.; Nunes, T.; Sanchez, J.; Thornton, R.; Reiczigel, J.; Robison-Cox, J.; Sebastiani, P. EpiR: An. R Package for the Analysis of Epidemiological Data. 2013. Available online: https://CRAN.R-project.org/package=epiR (accessed on 9 October 2020).
- Wickham, H. Ggplot2: Elegant Graphics for Data Analysis; Springer: New York, NY, USA, 2016. [Google Scholar]
- Keitt, T.; Bivand, R.; Pebesma, E.; Rowlingson, B. Rgdal: Bindings for the Geospatial Data Abstraction Library; R package Version 0.6-27. 2010. Available online: https://CRAN.R-project.org/package=rgdal (accessed on 9 October 2020).
- Auguie, B. GridExtra: Miscellaneous Functions for “Grid” Graphics; R Package Version 2.3. 2019. Available online: https://www.R-project.org/ (accessed on 9 October 2020).
- Urbanek, S. Png: Read. and Write PNG Images; R Package Version 0.1-7. 2013. Available online: https://CRAN.R-project.org/package=png (accessed on 9 October 2020).
- Baquero, O.S. Ggsn: North. Symbols and Scale Bars for Maps Created with ’ggplot2’ or ’ggmap’; R Package Version. 2019. Available online: https://github.com/oswaldosantos/ggsn (accessed on 9 October 2020).
- Becker, R.A.; Wilks, A.R.; Brownrigg, R.; Minka, T.P.; Deckmyn, A. Maps: Draw Geographical Maps; R Package Version 3.3.0. 2018. Available online: https://CRAN.R-project.org/package=maps (accessed on 9 October 2020).
- Bivand, R.; Lewin-Koh, N. Maptools: Tools for Handling Spatial Objects; R Package Version 0.9-9. 2019. Available online: https://CRAN.R-project.org/package=maptools (accessed on 9 October 2020).


| Average Annual Incidence Per 100,000 | ||||
|---|---|---|---|---|
| 1999–2017 | 1999–2007 a | 2008–2017 b | IRR b/a (95% CI) | |
| All cases | ||||
| Ballum | 0.31 | 0.23 | 0.38 | 1.59 (1.22–2.09) *** |
| Hardjo | 0.61 | 0.81 | 0.44 | 0.55 (0.46–0.67) *** |
| Pomona | 0.33 | 0.43 | 0.24 | 0.56 (0.43–0.72) *** |
| Tarassovi | 0.13 | 0.11 | 0.15 | 1.39 (0.83–2.11) |
| Unknown | 0.55 | 0.54 | 0.57 | 1.04 (0.86–1.26) |
| Total | 2.01 | 2.48 | 1.63 | 0.65 (0.59–0.72) *** |
| European | ||||
| Ballum | 0.39 | 0.27 | 0.49 | 2.18 (1.59–2.99) *** |
| Hardjo | 0.64 | 0.79 | 0.50 | 0.63 (0.51–0.78) *** |
| Pomona | 0.28 | 0.36 | 0.22 | 0.62 (0.45–0.86) ** |
| Tarassovi | 0.17 | 0.12 | 0.22 | 1.75 (1.13–2.78) * |
| Unknown | 0.59 | 0.53 | 0.65 | 1.22 (0.97–1.53) |
| Total | 2.15 | 2.12 | 2.19 | 1.03 (0.92–1.16) |
| Māori | ||||
| Ballum | 0.14 | 0.09 | 0.14 | 5.02 (1.12–46.15) * |
| Hardjo | 0.69 | 0.92 | 0.52 | 0.62 (0.38–0.94) * |
| Pomona | 0.66 | 0.85 | 0.51 | 0.64 (0.39–1.00) * |
| Tarassovi | 0.04 | 0.06 | 0.03 | 0.56 (0.05–4.87) |
| Unknown | 0.63 | 0.57 | 0.67 | 1.24 (0.77–2.02) |
| Total | 2.24 | 2.53 | 2.00 | 0.79 (0.62–1.00) |
| Meat worker | ||||
| Ballum | 1.75 | 1.71 | 2.00 | 1.30 (0.17–9.71) |
| Hardjo | 57.29 | 78.60 | 38.67 | 0.55 (0.39–0.75) *** |
| Pomona | 45.31 | 57.52 | 36.00 | 0.69 (0.49–0.97) ** |
| Tarassovi | 1.75 | 2.28 | 1.33 | 0.65 (0.06–4.54) |
| Unknown serovar | 31.28 | 38.16 | 26.67 | 0.78 (0.51–1.17) |
| Total | 140.61 | 180.56 | 109.36 | 0.67 (0.55–0.82) *** |
| Farmer c | ||||
| Ballum | 11.09 | 9.06 | 13.12 | 1.61 (1.05–2.49) * |
| Hardjo | 18.74 | 19.55 | 18.23 | 1.04 (0.75–1.42) |
| Pomona | 8.69 | 7.87 | 9.56 | 1.35 (0.84–2.19) |
| Tarassovi | 4.00 | 2.86 | 5.11 | 1.98 (0.95–4.38) |
| Unknown serovar | 14.29 | 14.79 | 14.01 | 1.05 (0.73–1.52) * |
| Total | 57.83 | 54.85 | 61.37 | 1.24 (1.04–1.49) * |
| Dairy Farmer | ||||
| Ballum | 5.59 | 3.04 | 7.53 | 2.75 (1.12–7.69) * |
| Hardjo | 12.80 | 14.34 | 11.29 | 0.87 (0.52–1.48) |
| Pomona | 1.02 | 0.87 | 1.13 | 1.44 (0.17–17.27) |
| Tarassovi | 12.59 | 9.99 | 14.67 | 1.63 (0.95–2.86) |
| Unknown serovar | 10.76 | 5.22 | 15.43 | 3.29 (1.69–6.87) *** |
| Total | 43.89 | 33.47 | 52.30 | 1.74 (1.31–2.32) *** |
| Other occupation d | ||||
| Ballum | 0.16 | 0.11 | 0.21 | 2.14 (1.44–3.24) *** |
| Hardjo | 0.09 | 0.12 | 0.07 | 0.67 (0.39–1.11) |
| Pomona | 0.04 | 0.06 | 0.02 | 0.37 (0.14–0.87) * |
| Tarassovi | 0.008 | 0.003 | 0.01 | 4.61 (0.52–218.12) |
| Unknown serovar | 0.22 | 0.16 | 0.26 | 1.83 (1.31–2.58) *** |
| Total | 0.53 | 0.48 | 0.63 | 1.46 (1.19–1.78) *** |
| Hospitalization Rates Ratio (95% CI) | |||
|---|---|---|---|
| Serovars | All Cases | European | Māori |
| Ballum | 1.70 (1.29–2.26) *** | 1.81 (1.37–2.52) *** | 0.75 (0.21–2.46) |
| Hardjo | 0.80 (0.66–0.98) * | 0.76 (0.60–0.96) * | 1.33 (0.81–2.21) |
| Pomona | 1.32 (1–1.74) | 1.42 (1–2.03) * | 1.52 (0.89–2.63) |
| Tarassovi | 0.58 (0.37–0.89) * | 0.68 (0.42–1.07) | 0 (0–1.51) |
| Unknown serovar | 1.26 (1.02–1.57) * | 1.24 (0.97–1.59) | 1.00 (0.59–1.70) |
| Total | 1.16 (1.05–1.29) ** | 1.11 (0.98–1.26) | 1.17 (0.89–1.56) |
Publisher’s Note: MDPI stays neutral with regard to jurisdictional claims in published maps and institutional affiliations. |
© 2020 by the authors. Licensee MDPI, Basel, Switzerland. This article is an open access article distributed under the terms and conditions of the Creative Commons Attribution (CC BY) license (http://creativecommons.org/licenses/by/4.0/).
Share and Cite
Nisa, S.; Wilkinson, D.A.; Angelin-Bonnet, O.; Paine, S.; Cullen, K.; Wright, J.; Baker, M.G.; Benschop, J. Diverse Epidemiology of Leptospira Serovars Notified in New Zealand, 1999–2017. Pathogens 2020, 9, 841. https://doi.org/10.3390/pathogens9100841
Nisa S, Wilkinson DA, Angelin-Bonnet O, Paine S, Cullen K, Wright J, Baker MG, Benschop J. Diverse Epidemiology of Leptospira Serovars Notified in New Zealand, 1999–2017. Pathogens. 2020; 9(10):841. https://doi.org/10.3390/pathogens9100841
Chicago/Turabian StyleNisa, Shahista, David A. Wilkinson, Olivia Angelin-Bonnet, Shevaun Paine, Karen Cullen, Jackie Wright, Michael G. Baker, and Jackie Benschop. 2020. "Diverse Epidemiology of Leptospira Serovars Notified in New Zealand, 1999–2017" Pathogens 9, no. 10: 841. https://doi.org/10.3390/pathogens9100841