
Non-Contact Multiple-Frequency AC Impedance Instrument for Cement Hydration Based on a High-Frequency Weak Current Sensor
by
 , ,
, ,
He Wang
1,2,3,
Tao Wu
1,2,3,*,
Shengwen Tang
4,
Jinhua She
5,
Feng Wang
1,2,3 and
Juan Zhao
1,2,3 1
School of Automation, China University of Geosciences, Wuhan 430074, China
2
Hubei Key Laboratory of Advanced Control and Intelligent Automation for Complex Systems, Wuhan 430074, China
3
Engineering Research Center of Intelligent Technology for Geo-Exploration, Ministry of Education, Wuhan 430074, China
4
State Key Laboratory of Water Resources and Hydropower Engineering Science, Wuhan University, Wuhan 430074, China
5
School of Engineering, Tokyo University of Technology, Hachioji 192-0982, Japan
*
Author to whom correspondence should be addressed.
Actuators 2023, 12(1), 26; https://doi.org/10.3390/act12010026
Submission received: 5 December 2022
/
Revised: 31 December 2022
/
Accepted: 3 January 2023
/
Published: 6 January 2023
(This article belongs to the Section Actuators for Robotics)
Abstract
:This paper presents a new non-contact alternating current impedance instrument (NCACII) with multiple frequencies to measure the electrical impedance during the hydration of cement-based materials. It implements two measurement techniques: the first technique is a frequency conversion measurement with a frequency variation range of 1–100 kHz. The second is to measure the variation in impedance with time. It provides a new way to analyze the pore structure of cement-based materials. In this instrument, we design a current sensor made from nanocrystalline T37. The experimental results demonstrate the detection accuracy of NCACII has been improved and indicates the superiority of nanocrystalline T37.
1. Introduction
Cementitious materials have been widely used as artificial materials around the world. Many hydration reactions produce a hardened cement-based material. For example, Portland cement consists of various inorganic oxide compounds, including tricalcium silicate, dicalcium silicate, tricalcium aluminate, and tetra calcium aluminum ferrite [1]. When these compounds come into contact with water, hydration starts immediately. It causes the formation of different complicated oxides, most prominently calcium hydroxide [2], calcium silicate hydrates [3], ettringite [4], and monosulfate [5]. The hydration characteristics of cement-based materials have an important impact on their mechanical properties and durability. Therefore, it is of great significance to determine the hydration law of cement-based materials for their performance and analysis of lifetime.
A feature of cement hydration is a refinement in the pore structure. In the process of hydration, a large number of ions are dissolved in cement, and a chemical reaction between ions and saturated precipitation will lead to hydration products gradually forming in the physical pore structure of the paste [6]. A continuously evolving network of pores determines the ultimate strength and durability [7]. Experimental methods, such as water adsorption [8], scanning electron microscopy [9], transmission electronic microscopy [10], and X-ray diffraction [11], have been developed and applied to investigate pore structures. However, these methods only capture the hydration characteristics of cement-based materials at a certain time, and cannot monitor the early hydration process of cement-based materials in real-time. It is difficult to predict and evaluate their later mechanical strength and durability.
Cement-based materials are porous multiphase materials that contain a large number of conductive ions. Therefore, electrical methods have been receiving increased attention. Electrical methods have some advantages over others in sensitivity and fast processing. They are non-destructive and analyze the micro-structure in situ [12]. Conventional electrical methods include the direct current method (DCM), alternating current impedance spectroscopy (ACIS), and four-point Wenner probe (FPWP). The electrical parameters of cement-based materials are obtained by these methods. The electrical parameters reflect the permeability, mobility, concentration, and distribution of cement-based materials. Among these parameters, the impedance [13] of cement-based materials is a key indicator of pore structure.
Previously used electrical methods usually insert metallic electrodes into cement-based materials [2]. These methods have some problems, such as electrode polarization, corrosion, and large differences in layout, installation, and shrinkage gap. This affects the accuracy of resistance. Li et al. [14] presented a non-contact resistivity measurement (NCRM) with a fixed frequency of 1 kHz to judge the hydration stage of cement-based materials, determine the setting time, analyze the pore structure, and predict and evaluate their mechanical strength to solve the problem of monitoring the early hydration properties of cement-based materials. This method avoids electrode polarization and slurry shrinkage during hydration, ensures the accuracy of the results, and predicts [15] the porosity of cement-based materials.
Porosity is the main focus when studying the pore structure of cement-based materials by electrical methods. NCRM predicts the porosity of cement-based materials through a change in resistance. There are mainly three problems: first, the pore tortuosity, volume fractal dimension, and tortuosity dimension of cement-based materials cannot be obtained. Second, during the hydration of cement-based materials, the cement-based materials hydrate from a pure cement paste to a hardened cement containing more pores. The cement-based materials at the early stage of hydration exhibit resistance characteristics. The cement-based materials in the middle and late stages of hydration exhibit impedance characteristics. Therefore, NCRM can only be used in the early stage of hydration. Third, higher frequencies need to be applied in the NCRM to observe smaller pore structures (at a frequency of 1 kHz, NCRM can observe pores in the range of 0.32–2.1 mm. At a frequency of 100 kHz, NCRM can observe pores in the range of 3.2–21 μm [16]).
Tang et al. [17] presented a spread spectrum theory to solve these three problems. They supposed to change the frequency measurement mode from a fixed one (1 kHz) to a variable one (1–100 kHz). The NCRM should test the impedance of cement-based materials during hydration at different applied frequencies.
Theoretically, based on the measured impedance, the pore tortuosity, volume fractal dimension, and tortuosity of cement-based materials can be predicted, and smaller pore structures can be observed. However, it is difficult to implement the theory of the NCRM due to the following problems: First, the wider the frequency band, the more severe the distortion of the output sine wave at different frequencies; thus, the voltage fluctuation of the cement-based materials is very large. Therefore, it is difficult to suppress the voltage fluctuations of cement-based materials at different frequencies. Secondly, when NCRM tests resistance at high frequencies, the current of the cement-based materials is very weak. Conventional current sensors have a phase distortion problem at high frequencies, which leads to a reduction in the accuracy of the measured current. Thirdly, during hydration, the cement-based materials have a wide range of impedance. It is difficult to track and display the variation in impedance with time. Finally, during hydration of cement-based materials, released heat causes a rise in temperature, and changes in ambient temperature [18] can affect the accuracy of the measured impedance.
This paper presents a new non-contact alternating current impedance instrument that solves the above problems to ensure a clear understanding of the trend of pore structure changes during the hydration of cement-based materials. Its frequency range is 1–100 kHz (commonly used frequency points are 1 kHz, 2 kHz, 4 kHz, 8 kHz, 16 kHz, 32 kHz, 64 kHz, 80 kHz, and 100 kHz). It enables the prediction of the porosity, pore size distribution, and pore tortuosity of cement-based materials, which provides a new way to analyze the pore structure of cement-based materials. The NCACII contains a direct digital synthesizer (DDS). At different frequencies, the impedance of the power amplifier and the excitation coil is different. Therefore, when the induced voltage of the cement-based materials changes, the DDS automatically adjusts the output voltage according to the change in the induced voltage. This solves the problem of induced voltage fluctuation of cement-based materials. The main contributions of this study are as follows:
- (1)
- The NCACII changes the original fixed frequency into a variable frequency with a frequency variation range of 1–100 kHz. The common frequency points are 1 kHz, 2 kHz, 4 kHz, 8 kHz, 16 kHz, 32 kHz, 64 kHz, 80 kHz, and 100 kHz. NCACII is able to track the variation in impedance with time.
- (2)
- A high-frequency weak current sensor made from nanocrystalline T37 is designed and used in the instrument’s current detection circuit. This solves the problem of accuracy reduction caused by phase distortion of conventional current sensors and improves the detection accuracy of the NCACII.
- (3)
- Impedance and phase errors measured by the nanocrystalline T37 sensor are smaller and fluctuate less than those measured by a Permalloy 1J85 sensor, which indicates that nanocrystalline T37 has a better performance than Permalloy 1J85.
The rest of this paper is organized as follows. Section 2 introduces the principle of NCACII. Section 3 explains how to obtain and calibrate the impedance data. In Section 4 and Section 5, two kinds of high-frequency weak current sensors with different core materials are used as the current detection device of the instrument to conduct impedance and phase accuracy experiments. Finally, Section 6 offers some concluding remarks.
2. The Principle and Calibration of NCACII
The structure diagram of NCACII is shown in Figure 1. Transformer I is for the primary coupling between the excitation coil and a ring-shaped cement sample that is equivalent to the secondary transformer. A sinusoidal AC signal is applied to the excitation coil of transformer I. The exciting voltage by wave amplification and signal generator is and its frequency range is 1 kHz to 100 kHz. Generally, the recommended frequency range of electrical signals applied to a ring-shaped cement sample is 1 kHz to 100 kHz. A pick-up coil, called a loop voltage detection coil, twining with core I is employed to detect the induced voltage, , in the ring-shaped sample. As the loop resistance is very large (nearly infinity), its current is negligible in the primary coupling. The ring-shaped cement sample is regarded as a single turn wire whose impedance ranges from 50 Ω to 20,000 Ω, and the induced voltage in the ring-shaped cement sample is equal to . As a result of a constant number of excitation coils, the induced voltage of the ring-shaped cement sample is unchanged under a constant amplitude of the excitation voltage. The internal impedance of the power amplifier and excitation coils are different at different frequencies. Therefore, will decrease with increasing frequency. The output voltage of the direct digital synthesizer (DDS) will be automatically adjusted according to the pick-up coil voltage to keep unchanged.
The hardware circuit structure diagram of NCACII is shown in Figure 2. First, the signal generator generates the excitation signal of the transformer. Second, the acquisition circuit module regulates and synchronizes the voltage and current signals induced by the ring-shaped cement sample. Third, the data are transmitted to the upper computer management software through the data communication module. The hardware circuit design mainly includes a power module, a DDS signal generator, a signal module circuit, an A/D synchronous acquisition circuit, and a network interface circuit.
We designed a current detection sensor called transformer II to solve the problem of phase distortion at high frequencies [19]. It is similar to a Rogowski coil [20]. The difference is that the Rogowski coil’s core is made of non-magnetic materials [21], while our sensor’s core is made of a magnetic material called nanocrystalline T37. Rogowski coil is an ideal sensor. It reduces large measurement errors by the hysteresis characteristic [22] of the core and saturation under large currents, especially at high frequency [23]. While the primary current is small in this measurement, the magnetic core enables the generation of a detectable induced current [24]. The measurement error and phase shift under high frequencies are eliminated to some degree due to the presence of a magnetic core [25,26].
The induced current, , of a ring-shaped cement sample is measured by transformer II. The electrical impedance, , of the ring-shaped cement sample is calculated as (1):
where is the excitation coil’s angular frequency.
The main parameters of this instrument are shown in Table 1. Fresh cement-based materials were poured into a plastic ring mold. In order to accommodate most cement pastes, mortars, and concretes, the section area of the ring mold was designed to be 50 mm × 60 mm. Therefore, the inner diameter of core I and II was set as 106 mm, which was big enough to incorporate the mold.
The cement-based materials were composed of a nearly insulated solid phase, a conductive liquid phase, and a solid–liquid interface. Their electrical response is described by some equivalent circuit models. One of the equivalent circuit models of cement-based materials is shown in Figure 3. The permeability and conductivity of hydrated cement-based materials are not constant. They are influenced by the water content of cement paste, the ion concentration, and the pore structure of the filling material, and change with the hydration process. Theoretically, the impedance of cement-based materials gradually increases as the hydration process progresses due to the gradual densification of their internal pores. At the same time, the phase angle of impedance also increases. Due to the capacitance and inductance characteristics of cement-based materials with different degrees of hydration, the impedance value change at different application frequencies. The impedance characteristics are influenced by the pore structure of cement-based materials. The relative permeability of different cement mortars has been reported to increase from 10 to 80 with a decrease in applied frequency [27]. The range of electrical resistivity is potentially from to for the solid phase but from to for hydrating cement paste at an early age [28]. Therefore, the electrical resistance of the ring-shaped sample for NCACII is estimated to be from 50 Ω to 20,000 Ω. At the late stage of hydration, the current of the ring-shaped sample will drop down to about , since the impedance range of such a sample is too large and is maintained at approx. 1 V.
In the process of cement hydration, a diffusion double electric layer is formed on the surface of cement particles. The thickness and potential of the double electric layer change with the hydration time. In addition, the response characteristics of the diffusion double electric layer are associated with the applied frequency. Therefore, the pore structure of the cement-based materials will be analyzed through the trend in impedance changes under different frequencies of excitation power by NCACII.
3. Impedance Data Calculation and Calibration
The current and voltage signals are acquired by two independent high-speed analog-to-digital (A/D) channels (2000 kHz, 18 bit). In addition to the fundamental wave, there are also some noise and high-order harmonic components in the actual two-channel signal acquisition system. The least-square algorithm is used to calculate the impedance to obtain the accurate amplitude and phase information of the current and voltage.
The expression of induced voltage is , and the induced current of the ring-shaped sample is . is the phase of induced voltage and is the phase of induced current. After these signals are collected synchronously by A/D, the discrete sequence data are obtained. Expanding the voltage and current signal expressions results in (2) and (3):
where , , , and .
Here, the A/D simultaneously samples and during 10 signal periods with a sampling rate of , obtaining pairs of discretized sequences, and . Through the least square method, the coefficients ,,, and can be obtained by linear equations constructed by sampling sequences. The phase angle and impedance modulus are calculated by (4) and (5):
The phase angle and impedance modulus from (4) and (5) are not the actual impedance modulus of the ring-shaped cement sample.
The ratio difference and phase difference of the current sensor inevitably end and are related to the properties of magnetic materials. Especially at high frequencies, the phase angle error will increase. Figure 4 is the error analysis vector diagram of the current sensor. is the angle between the secondary-induced electromotive force, , and the secondary current, . The angle between the excitation magnetic force and the magnetic flux density is the core loss angle, .
Here, is mainly determined by the impedance angle of the cement-based materials and the leakage reactance of the secondary side, and depends on the material of core II (core loss). If the frequency increases, and will increase at the same time.
The ratio difference, , can be defined in (6) as:
where is the number of turns in the excitation coil and is the number of turns in the detection coil.
The phase difference, , is usually very small, and it is shown in (7):
where is the impedance of the secondary side, is the effective cross-section of the iron core, is the permeability of the core, is the average length of the magnetic circuit of the iron core, and is the number of turns in the detection coil. From (6) and (7), it can be concluded that a large cross-section of the ring-shaped sample has a relatively good sensitivity to the current sensor. Nevertheless, the sensor geometry is limited by the maximum hole size of the magnetic core and the cost. Increasing the ring diameter increases , which will increase the measurement error of the current sensor and the interference of the environmental magnetic field. Increasing can also reduce the error, but a larger may lead to a weak effective current, , which will be overwhelmed by environmental noise.
The secondary current signal of the current transformer becomes a voltage signal by a current/voltage conversion circuit and an amplification circuit. After passing through the signal processing circuit, the current signal will produce a phase shift. Moreover, the parasitic capacitance of the secondary side wire exits especially in high frequency. Therefore, the software’s impedance modulus must be divided by a gain coefficient, . In the same way, the phase difference calculated by the same software must be subtracted by a phase difference, .
This gain coefficient, , and phase difference, , are determined by the current transformer parameters, the signal circuit, and the excitation frequency. The standard resistor calibration method determines the gain coefficients, , and phase differences, , under different frequencies. The calibration process is as follows: a series of standard resistors is selected ranging from 200 Ω to 200 kΩ instead of a ring-shaped sample and then the resistors are tested to form a dataset for different frequencies. For example, the standard resistor is . Then, the calculated impedance modulus is and the phase angle is .
The modulus and phase of cement impedance are calibrated by (8) and (9):
For different measurement frequencies, the values of and are different. Before the instrument is used for the first time, the software must be calibrated according to different measurement frequencies and the calibration information is stored in a text file. The software will read the calibration file every time before it runs.
4. Current Sensors with Different Core Materials
The current of the ring-shaped cement sample in NCACII is between –. It is difficult to detect the weak current accurately, especially at high frequency. The iron core material influences the performance of the current sensor. The optimal frequency of conventional Permalloy 1J85 is 50 Hz–10 kHz, while for nanocrystalline T37 it is 50 Hz–100 kHz. The frequency range of NCACII is 1–100 kHz. We designed a current sensor with an iron core using nanocrystalline T37. Compared with the current sensor with an iron core using Permalloy 1J85, apart from the fact that the magnetic core material is different, the other structures are all the same. Table 2 shows a performance comparison of the two magnetic materials. The phase angle error of the Permalloy 1J85 iron coil increases when the frequency of the measured signal exceeds 10 kHz. While the alloy core is fabricated with nanocrystalline T37, the fluctuation is lower than that of the Permalloy 1J85 between 1–100 kHz.
The impedance of stabilized cement is rarely measured in this field. Theoretically, the actual impedance of stabilized cement will lie in a range, and a standard value cannot be given to verify the accuracy of the impedance measured by NCACII.
Therefore, we chose a standard resistor with resistance values of 200–5000 Ω as the object to verify the accuracy of NCACII measurements. The impedance and phase accuracy experiments were as follows:
- (1)
- Standard resistors were selected to replace the ring-shaped sample to test the instrument’s accuracy;
- (2)
- Wire loops were connected in series with different standard resistances to simulate the impedance change in cement;
- (3)
- As the closed circuit of the ring-shaped cement sample, the series impedance wire passed through a transformer and current transformer to realize the accuracy of the impedance detection;
- (4)
- For setting the software parameters of NCACII, the excitation voltage amplitude was 1 V. Frequencies of 1 kHz, 64 kHz, and 128 kHz were selected as the measurement points, and several values of standard electrical resistance from 200 Ω to 5 kΩ were selected for testing.
There is no phase lag between the voltage and current for these resistors, and the theoretical phase angle is zero. In the experiment, the measurement accuracy of the instrument was ensured by comparing the measured values with the theoretical values.
The measured impedance values of different sensors under different frequencies are shown in Table 3. Table 4 shows the maximum relative error and phase error of resistance. As the AC excitation frequency increased, the impedance accuracy was improved. However, when the frequency was increased to 128 kHz, the measurement accuracy was reduced. The maximum sampling frequency of NCACII is 128 kHz, and the corresponding data points decreased in one cycle when the signal frequency was increased, which led to an increase in the computation error in the data fitting of the least square method. The relative error became large when the impedance was increased. The current in the ring-shaped sample reduced to a weak value as the resistance increased, which caused the current error to increase. With the use of nanocrystalline T37, the maximum measurement error of NCACII was less than 2% and the maximum phase error of NCACII was less than 2°. Compared to the NCRM with the use of Permalloy 1J85, the measurement accuracy was improved by 31.7%.
Figure 5 and Figure 6 show the impedance error and the phase error of different sensors at different frequencies. In general, the phase angle error of nanocrystalline T37 was smaller and fluctuates less than that of Permalloy 1J85, especially at high frequencies. The phase error is proportional to the magnetic loss. The phase error at individual points is due to large parasitic capacitance or inductance by accidental factors during the production of standard resistors. In addition, the higher the frequency of the measured signal, the larger the detected phase angle error. The main reason for this is that, the higher the frequency, the fewer sampling points in a signal cycle. After the comprehensive comparison of test results, the frequency range of NCACII was determined to be 1–100 kHz.
5. Experiments on Cement Materials
A picture of NCACII is shown in Figure 7. In this work, the molar ratio of :: in the cement paste was determined to be 8:1:20. A fresh paste with a total mass of 800 g was mixed at 45 r/m for 8 min. Then, the prepared cement paste was poured into the ring-shaped mold. The electrical impedance of the hydrated cement paste was evaluated. Here, the amplitude of the induced voltage was set to 0.8 V, and the applied frequency points were set to 1 kHz, 2 kHz, 4 kHz, 8 kHz, 16 kHz, 32 kHz, 64 kHz, 80 kHz, and 100 kHz. The interval between frequency points was 5 s. The cement-based materials begin to hydrate when water is added, and it is difficult to determine the degree of hydration at a macroscopic level. Therefore, during the experiment, 0.733 h, 3.86 h, 7.07 h, and 14 h were generally chosen as testing times [14] to represent different degrees of hydration of the same cement. However, the impedance values measured by these four states alone do not clearly reflect the impedance trend of the cement-based materials during hydration. Therefore, we decided to measure the impedance of the cement-based materials throughout the hydration. The cement hydration process was completed within 24–48 h. Thus, the monitoring time was set to one day. The pause time of NCACII was 1 min. After one day of monitoring, the electrical impedance data at different frequencies were acquired and analyzed. At the same time, this experiment was conducted at a constant temperature in order to avoid the effect of ambient temperature change on impedance measurements.
The same experiment was performed to compare the performance of two current sensors fabricated by Permalloy 1J85 and nanocrystalline T37. The data from the two sensors are shown in Figure 8, Figure 9, Figure 10 and Figure 11. The physical state of cement during hydration is shown in Figure 12.
Figure 8 and Figure 9 show the magnitude and the phase of impedance measured by NCACII using a current sensor made by Permalloy 1J85, and Figure 10 and Figure 11 show the magnitude and the phase of impedance measured by NCACII using the nanocrystalline T37 sensor. The curve fluctuation in Figure 9 is larger than in Figure 8. The different degree of fluctuations is caused by the different effects of the measurement error on the magnitude and the phase of impedance. When the frequency applied to the cement-based materials is higher than the optimal measurement band of Permalloy 1J85, the measurement error increases, but it has a small effect on the magnitude of impedance compared to the effect on the phase of impedance. From these figures, the accuracy of the current sensor made by nanocrystalline T37 is better than that of the sensor made by Permalloy 1J85, especially at high frequencies. At high frequencies, the iron loss of nanocrystalline T37 is small, so its characteristics have advantages at high frequency. The phase error is mainly related to the magnetic loss of the core, so the curves in Figure 11 are smoother than those in Figure 9.
Figure 8, Figure 9, Figure 10 and Figure 11 show the real time impedance measured by NCACII for the same cement sample as it hydrates. The degree of hydration of cement is difficult to be judged by direct observation, and the judgment of the hydration state of cement under macroscopic conditions involves subjective factors; therefore, the results are not objective. Figure 12 shows the observation diagram of cement hydration for different periods under microscopic conditions. Figure 12a–d represents different time points in a day, and AB, BC, CD, and D represent the midpoint of different time points. As time increases, the porosity of the cement decreases during hydration, and the cement-based materials become dense. This causes the magnitude of impedance to increase.
In addition, the magnitude curves of impedance at different frequencies are similar in the initial stage of cement hydration. As the hydration time increases, the curves at different frequencies gradually separate. A similar phenomenon also appears in the phase curve of impedance. In the initial stage of cement hydration, the dissolution of sulfate and magnesium ions is dominant, and the cement mainly shows resistance characteristics. Along with the hydration process, most of the main chemical reactions tend to be completed and the pore structure of some or all of the conductive solutions is gradually formed, causing the cement to exhibit capacitance and inductance characteristics, leading to a gradual separation of the curves. Detailed information related to the qualitative analysis of the pore structure of cement-based materials has been demonstrated in reference [8].
From the above figures, during the hydration of the cement-based materials, the magnitude of impedance increases if the cement-based materials exhibit only resistant and inductive properties. This is because the higher the frequency, the higher the inductance. However, at this time, the magnitude of the measurement at 100 kHz is the smallest compared to the other frequencies. This indicates that cement-based materials have capacitance properties at this time. If the cement-based materials exhibit only resistance and capacitance properties, the phase of impedance should be about −90°. Since the phase is greater than 0°, the cement-based materials have the characteristics of resistance, capacitance, and inductance at the same time during the hydration process. Additionally, with the above figures, we can understand the hydration process of the cement and can observe the variation in impedance with time by using NCACII.
6. Conclusions
In this study, we present a new non-contact multiple frequency AC impedance instrument to identify the pores of porous cement-based materials. Firstly, the excitation frequency range of this instrument is 1–100 kHz. Secondly, for this instrument, we designed a current sensor with a core fabricated using nanocrystalline T37. At a high frequency, the measurement error of NCACII is less than 2%, and compared to the NCRM, the measurement accuracy is improved by 31.7%. This improvement ensures that the NCACII accurately predicts pore structure changes during the hydration of cement-based materials. Thirdly, the instrument measures the variation in impedance with time. It reflects the impedance change during the hydration process of cement-based materials and provides a new way to study the pore structure of cement-based materials.
Author Contributions
Conceptualization, H.W. and T.W.; methodology, T.W., H.W. and S.T.; software, T.W. and H.W.; validation, T.W., F.W. and H.W.; formal analysis, H.W.; investigation, T.W. and H.W.; resources, S.T.; data curation, T.W.; writing—original draft preparation, J.S., T.W., H.W. and F.W.; writing—review and editing, J.S., T.W. and H.W.; visualization, T.W.; supervision, S.T., J.S. and J.Z.; project administration, S.T.; funding acquisition, T.W., S.T., J.S. and F.W. All authors have read and agreed to the published version of the manuscript.
Funding
This work was supported by National Natural Science Foundation of China under Grants 61873348, 62106240, and 51602229, the Natural Science Foundation of Hubei Province, China, under Grants 2020CFB556 and 2020CFA031, the 111 Project under Grant B17040.
Data Availability Statement
Not applicable.
Conflicts of Interest
The authors declare no conflict of interest.
References
- Andrei, S.; Gong, F.; Jacobsen, S. Frost durability of high-volume fly ash concrete: Relation liquid transport-damage. Cem. Concr. Res. 2023, 163, 107017. [Google Scholar]
- Akram, K.J.; Ahmed, A.; Islam, T. Fringing field impedance sensor for hydration monitoring and setting time determination of concrete material. IEEE Trans. Instrum. Meas. 2020, 69, 2131–2138. [Google Scholar] [CrossRef]
- Wang, L.; Zeng, X.; Yang, H.; Lv, X.; Shi, Y. Investigation and application of fractal theory in cement-based materials: A review. Fractal Fract. 2021, 5, 247. [Google Scholar] [CrossRef]
- Hunt, G.; Heiszwolf, J.; Sewell, M. Enhanced hydrated Lime-A simple solution for acid gas compliance. IEEE Trans. Ind. Appl. 2018, 54, 796-087. [Google Scholar] [CrossRef]
- Mihai, M.; Adriana, V.; Cristian, V.; Cristian, M.; Petru, P.; Ioan, A. Analyzing the Effects of calcium nitrate over white Portland Cement: A multi-Scale approach. Materials 2023, 16, 371. [Google Scholar]
- Wang, L.; Lu, X.; Liu, L.; Xiao, J.; Guo, F.; Li, L. Influence of MgO on the hydration and shrinkage behavior of low heat Portland cement-based materials via pore structural and fractal analysis. Fractal Fract. 2022, 6, 40. [Google Scholar] [CrossRef]
- Xiao, J.; Xu, Z.; Murong, Y.; Wang, L.; Lei, B.; Chu, L.; Jiang, H.; Qu, W. Effects of chemical composition of fine aggregate on the frictional behavior of concrete-soil interface under sulfuric acid environment. Fractal Fract. 2022, 6, 22. [Google Scholar] [CrossRef]
- He, Z.; Cai, R.; Chen, E.; Tang, S. The investigation of early hydration and pore structure for limestone powder wastes blended cement pastes. Constr. Build. Mater. 2019, 229, 116923. [Google Scholar] [CrossRef]
- Hu, J.; Kuang, Y.; Zhou, T.; Zhao, F. Influence of air entraining agent on strength and microstructure properties of cemented paste backfill. IEEE Access 2019, 7, 140899–140907. [Google Scholar] [CrossRef]
- Zhou, L.; Mernagh, T.; Li, Y.; Mo, B.; Lin, X.; Zhang, L.; Li, A.; Leys, C. Combined focused ion beam—Scanning electron microscope and synchrotron X-ray fluorescence analysis of multi-solid and melt inclusions from the super-giant Grasberg Cu-Au deposit, Indonesia. J. Geochem. Explor. 2022, 243, 107108. [Google Scholar] [CrossRef]
- Goncalves, B.; Exposito, C.; Ishikawa, T.; Koga, Y. X-ray diffraction study of the early hydration of Portland cements containing calcium carbonate by in-situ and ex-situ approaches. Constr. Build. Mater. 2023, 365, 129947. [Google Scholar] [CrossRef]
- Meng, Q.; Qin, Q.; Yang, H.; Zhou, H.; Wu, K.; Wang, L. Fractal characteristics of the pore structure of coral powder-cement slurry under different fractal models. Fractal Fract. 2022, 6, 145. [Google Scholar] [CrossRef]
- Chi, L.; Lu, S.; Yao, Y. Optimized electrode distributions of embedded four-electrode resistivity measurement in cement-based materials. IEEE Sens. Lett. 2020, 4, 6001304. [Google Scholar] [CrossRef]
- Xiao, L.; Li, Z. Early age hydration of fresh concrete monitored by non-contact electrical resistivity measurement. Cem. Concr. Res. 2008, 38, 312–319. [Google Scholar] [CrossRef]
- Luan, X.; Li, J.; Yang, Z. Effects of attapulgite addition on the mechanical behavior and porosity of cement-based porous materials and its adsorption capacity. Mater. Chem. Phys. 2020, 239, 121962. [Google Scholar] [CrossRef]
- Tang, S.; Li, Z.; Chen, E.; Shao, H. Impedance measurement to characterize the pore structure in Portland cement paste. Constr. Build. Mater. 2014, 51, 106–112. [Google Scholar] [CrossRef]
- Tang, S.; Chen, E.; Shao, H.; Li, Z. A fractal approach to determine thermal conductivity in cement pastes. Constr. Build. Mater. 2015, 74, 73–82. [Google Scholar] [CrossRef]
- Carminati, M. Advances in high-resolution microscale impedance sensors. J. Sens. 2017, 2017, 7638389. [Google Scholar] [CrossRef]
- Zhu, H.; Li, Y.; Guo, J.; Zheng, Q.; Fu, Z. Research on frequency response characteristics of zero flux sensor. In Proceedings of the 2019 IEEE Sustainable Power and Energy Conference, Beijing, China, 21–23 November 2019; pp. 2931–2934. [Google Scholar]
- Shi, Y.; Xin, Z.; Loh, P.; Blaabjerg, F. A review of traditional helical to recent miniaturized printed circuit board Rogowski coils for power electronic applications. IEEE Trans. Power Electron. 2020, 35, 12207–12222. [Google Scholar] [CrossRef]
- Sergey, G.; Yury, G.; Anastasya, P.; Vadim, T.; Evgeny, G.; Boris, L. Angle magnetization rotation for characterizing co-rich amorphous ferromagnetic microwires. Actuators 2021, 10, 93. [Google Scholar]
- Mengounou, M.; Jiosseu, L.; Lmano, M. Experimental investigation of partial discharges activities in palm kernel oil methyl ester and mineral oil by using a Rogowski coil. Electr. Power Syst. Res. 2022, 213, 108708. [Google Scholar] [CrossRef]
- Liu, X.; He, Y.; Huang, H.; Xu, Q.; Huang, T. A method for increasing the bandwidth of Rogowski coils without changing their size. IEEE Trans. Instrum. Meas. 2022, 71, 1501310. [Google Scholar] [CrossRef]
- Tsukada, K.; Haga, Y.; Morita, K.; Song, N.; Sakai, K.; Kiwa, T.; Cheng, W. Detection of inner corrosion of steel construction using magnetic resistance sensor and magnetic spectroscopy analysis. IEEE Trans. Magn. 2016, 52, 6201504. [Google Scholar] [CrossRef]
- Shafiq, M.; Stewart, B.; Hussain, A.; Hassan, W.; Choudhary, M.; Palo, I. Design and applications of Rogowski coil sensors for power system measurements: A review. Measurement 2022, 203, 112014. [Google Scholar] [CrossRef]
- Orr, P.; Niewczas, P.; Booth, C.; Fusiek, G.; Dyśko, A.; Kawano, F.; Nishida, T.; Beaumont, P. An optically-interrogated Rogowski coil for passive, multiplexable current measurement. IEEE Sens. J. 2013, 13, 2053–2054. [Google Scholar] [CrossRef]
- Wen, S.; Chung, D. Effect of admixtures on the dielectric constant of cement paste. Cem. Concr. Res. 2001, 31, 673–677. [Google Scholar] [CrossRef]
- Buerchler, D.; Elsener, B.; Boehni, H. Electrical resistivity and dielectric properties of hardened cement paste and mortar. MRS Online Proc. Libr. 1995, 411, 407–412. [Google Scholar] [CrossRef]
Figure 1.
The schematic illustration of NCACII.
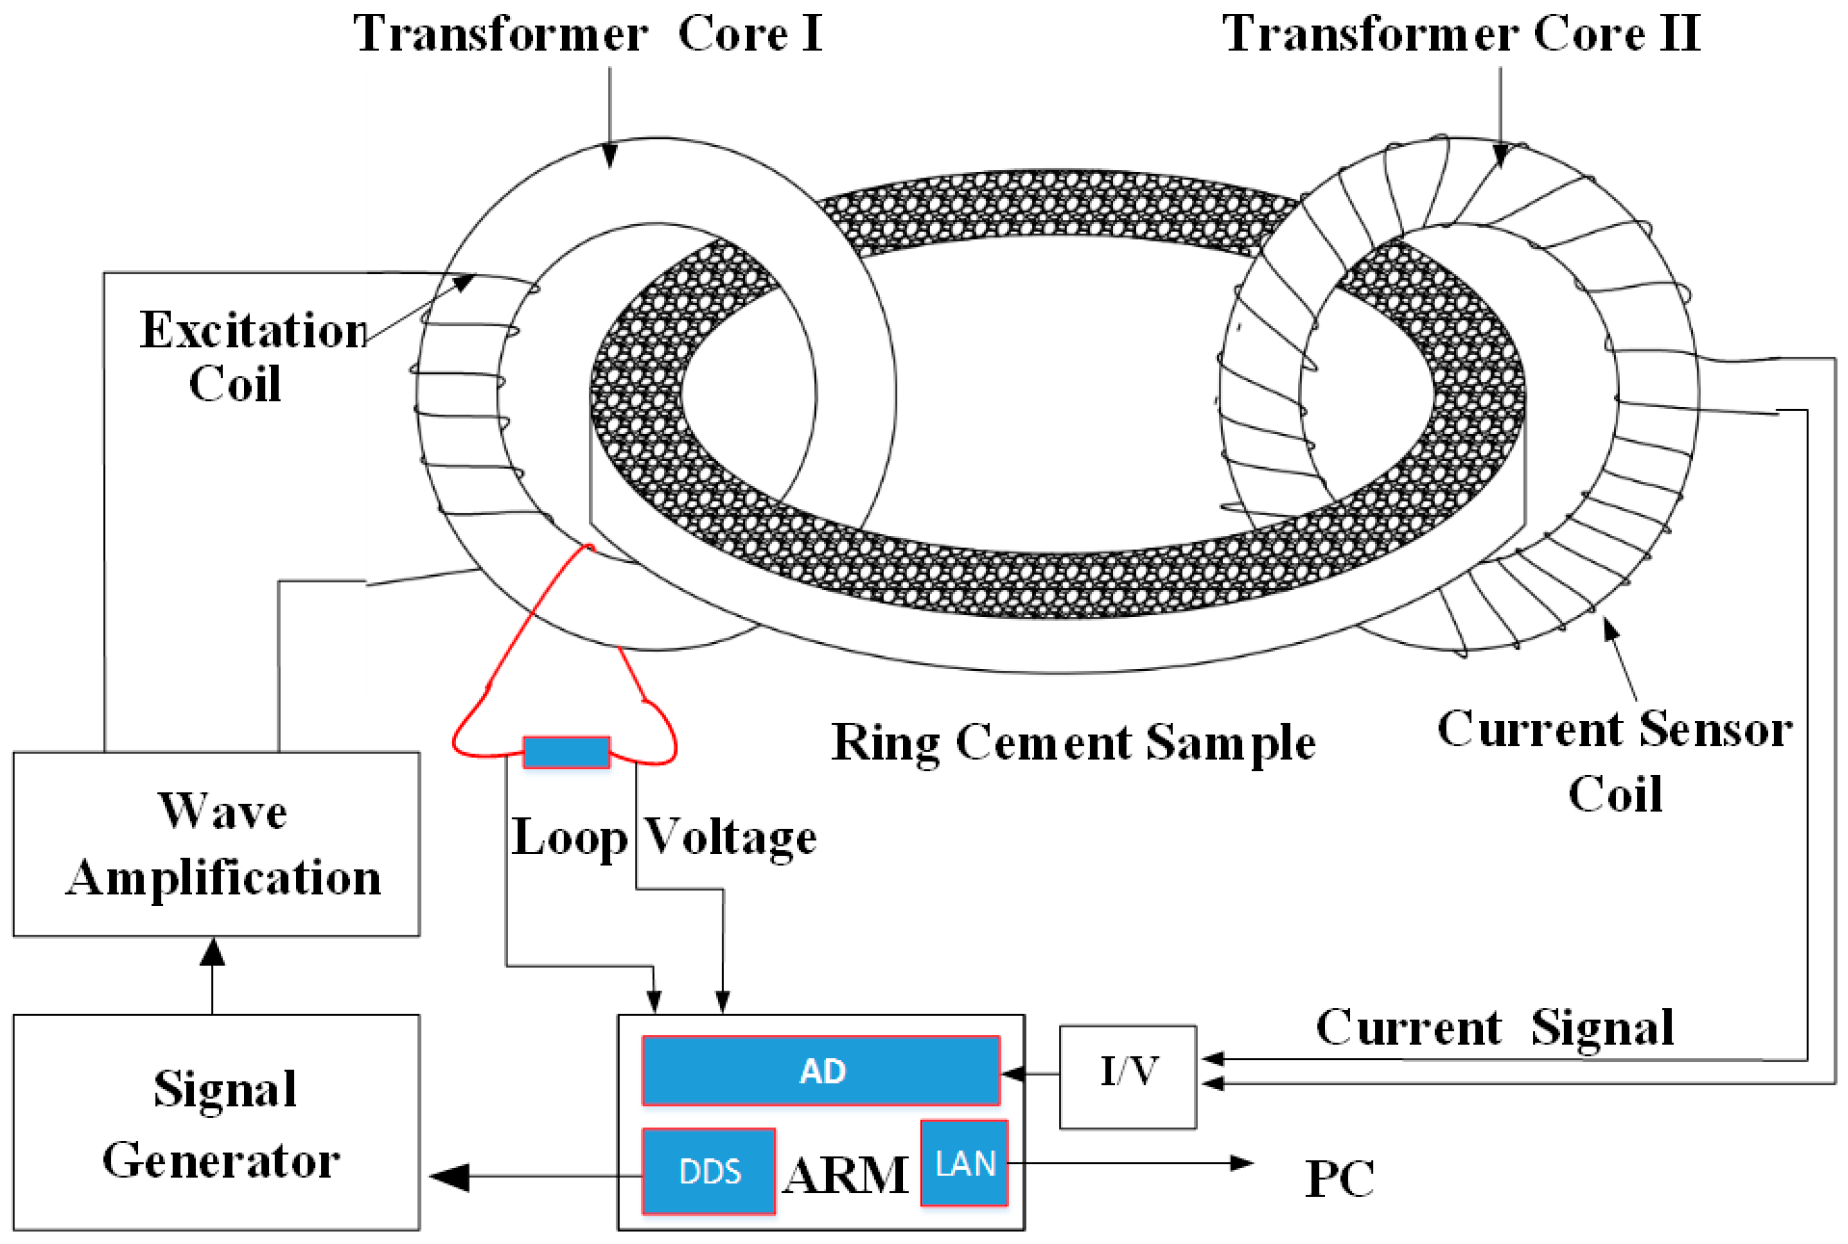
Figure 2.
The hardware circuit structure diagram of NCACII.

Figure 3.
The equivalent circuit model of cement-based materials.

Figure 4.
Error analysis vector diagram of the current sensor.

Figure 5.
The impedance error rate of different sensors under different frequencies.

Figure 6.
Phase errors of different sensors under different frequencies.

Figure 7.
(a) The physical appearance of NCACII and (b) NCACII working pictures.

Figure 8.
The magnitude curves of impedance of the Permalloy 1J85 current sensor.

Figure 9.
The phase curves of impedance by the Permalloy 1J85 current sensor.

Figure 10.
The magnitude curves of impedance by the nanocrystalline T37 current sensor.

Figure 11.
The phase curves of impedance by the nanocrystalline T37 current sensor.

Figure 12.
Pore change diagram of samples at different time points on a microscopic level.


Table 1.
The main structural dimensions and coil parameters.
| Parameters | Value | Units |
|---|---|---|
| Inner Dimension of Core I/Core II | 106 | mm |
| Outer Dimension of Core I/Core II | 146 | mm |
| Turns of Excitation Coil | 24 | - |
| Turns of Detection Coil | 100 | - |
| Section Width of Ring Mold | 50 | mm |
| Section Length of Ring Mold | 60 | mm |
| Dimension of Ring Mold | 300 | mm |
| Excitation Voltage | 36 | V |
Table 2.
Performance comparison of the two magnetic materials.
| Parameters | Nanocrystalline T37 | Permalloy 1J85 |
|---|---|---|
| Saturation magnetic induction, | 1.25 | 0.75 |
| Initial permeability, | ||
| Maximum permeability, | ||
| Resistivity, | 80 | 60 |
| Curie temperature, (°C) | 570 | 400 |
| Optimal frequency range, |
Table 3.
Impedance values of different sensors under different frequencies.
| R [Ω] | Nanocrystalline T37 | Permalloy 1J85 | ||||
|---|---|---|---|---|---|---|
| 200 | 199.5 | 199.6 | 201.5 | 199.3 | 199.7 | 202.1 |
| 300 | 299.3 | 299.2 | 302.6 | 298.8 | 300.4 | 304.5 |
| 400 | 401.5 | 401.4 | 403.3 | 401.8 | 402.4 | 405.9 |
| 500 | 502.2 | 501.5 | 504.2 | 501.9 | 503.3 | 507.1 |
| 600 | 597.8 | 598.0 | 604.9 | 596.5 | 595.6 | 608.4 |
| 700 | 694.7 | 697.4 | 706.6 | 693.4 | 705.1 | 709.9 |
| 800 | 792.1 | 797.3 | 807.4 | 791.9 | 805.9 | 788.3 |
| 900 | 890.6 | 896.3 | 908.9 | 890.7 | 892.8 | 912.1 |
| 1000 | 989.9 | 994.3 | 989.5 | 990.1 | 991.2 | 989.6 |
| 1500 | 1484.3 | 1510.0 | 1517.7 | 1481.6 | 1515.6 | 1520.6 |
| 2000 | 1978.3 | 2019.1 | 2026.3 | 1975.3 | 2020.3 | 2032.8 |
| 2500 | 2472.8 | 2523.4 | 2535.4 | 2469.7 | 2534.7 | 2542.2 |
| 3000 | 2967.3 | 3029.6 | 3044.4 | 2962.2 | 3042.6 | 3052.9 |
| 3500 | 3458.9 | 3542.2 | 3550.7 | 3459.0 | 3550.1 | 3573.5 |
| 4000 | 3940.3 | 4049.2 | 4056.9 | 3938.1 | 4058.1 | 4088.4 |
| 4500 | 4425.5 | 4557.6 | 4570.1 | 4429.4 | 4564.2 | 4598.2 |
| 5000 | 4912.7 | 5065.1 | 5079.1 | 4909.2 | 5078.1 | 5123.6 |
Table 4.
Maximum resistance error and phase error of different sensors under different frequencies.
| Nanocrystalline T37 | Permalloy 1J85 | |||||
|---|---|---|---|---|---|---|
| Maximum resistance error | 1.70% | 1.21% | 1.52% | 1.82% | 1.51% | 2.49% |
| Maximum phase error | 0.60° | 0.84° | 1.51° | 1.3° | 3.93° | 4.91° |
Disclaimer/Publisher’s Note: The statements, opinions and data contained in all publications are solely those of the individual author(s) and contributor(s) and not of MDPI and/or the editor(s). MDPI and/or the editor(s) disclaim responsibility for any injury to people or property resulting from any ideas, methods, instructions or products referred to in the content. |
© 2023 by the authors. Licensee MDPI, Basel, Switzerland. This article is an open access article distributed under the terms and conditions of the Creative Commons Attribution (CC BY) license (https://creativecommons.org/licenses/by/4.0/).
Share and Cite
MDPI and ACS Style
Wang, H.; Wu, T.; Tang, S.; She, J.; Wang, F.; Zhao, J. Non-Contact Multiple-Frequency AC Impedance Instrument for Cement Hydration Based on a High-Frequency Weak Current Sensor. Actuators 2023, 12, 26. https://doi.org/10.3390/act12010026
AMA Style
Wang H, Wu T, Tang S, She J, Wang F, Zhao J. Non-Contact Multiple-Frequency AC Impedance Instrument for Cement Hydration Based on a High-Frequency Weak Current Sensor. Actuators. 2023; 12(1):26. https://doi.org/10.3390/act12010026
Chicago/Turabian StyleWang, He, Tao Wu, Shengwen Tang, Jinhua She, Feng Wang, and Juan Zhao. 2023. "Non-Contact Multiple-Frequency AC Impedance Instrument for Cement Hydration Based on a High-Frequency Weak Current Sensor" Actuators 12, no. 1: 26. https://doi.org/10.3390/act12010026
Note that from the first issue of 2016, this journal uses article numbers instead of page numbers. See further details here.