
Flow Separation Control of Nacelle Inlets in Crosswinds by Dielectric Barrier Discharge Plasma Actuation

National Key Lab of Aerospace Power System and Plasma Technology, Air Force Engineering University, Xi’an 710038, China
*
Authors to whom correspondence should be addressed.
Actuators 2023, 12(6), 229; https://doi.org/10.3390/act12060229
Submission received: 30 April 2023
/
Revised: 23 May 2023
/
Accepted: 25 May 2023
/
Published: 31 May 2023
(This article belongs to the Section Aircraft Actuators)
Abstract
:Crosswinds will lead to large-scale flow separation in the nacelle inlets, which seriously affects the flight safety of the aircraft; there is an urgent need to develop flow control measures. As a plasma flow control method, the application of surface dielectric barrier discharge in the field of nacelle inlet separation control is of great significance for improving the intake quality. Based on the characteristic law of the baseline flow field, the flow control effect of the nacelle inlet separation flow field experiments with NS-DBD, and the influence of the actuation frequency on the flow control is discussed. A comparative experimental study of NS-DBD and AC-DBD is carried out. Finally, the flow control mechanisms for both are discussed. The results show that under the condition that the flow velocity of the wind tunnel is 35 m/s and the crosswind angle is 10°, the average total pressure loss coefficient and distortion index decrease by 29.62% and 44.14% by NS-DBD actuation. At the same time, exists an inherent optimal coupling frequency in NS-DBD, and the control effect of NS-DBD is better than that of AC-DBD. NS-DBD mainly through shock waves and induced vortices, while AC-DBD mainly through the induced generation of near-wall jets to reduce the inverse pressure gradient and improve nacelle flow separation.
1. Introduction
Inlet distortion on turbofan nacelles during crosswind and low-speed forward operation is an area of concern in the gas turbine engine community. [1]. Especially in the case of crosswind, the aircraft will not only have a sideslip, but also large-scale flow separation in the intake port, resulting in engine intake distortion, reduced steady margin, and even engine surge phenomenon, seriously affecting the flight safety of the aircraft.
In order to minimize the damage caused by crosswinds, extensive research has been carried out on the flow field characteristics of nacelles. In terms of experimental research, Motycka et al [2] explored the influence of Reynolds number and fan/inlet coupling on the distortion of subsonic transport inlet. Murphy et al [3] used three-dimensional particle image velocity measurement and total pressure measurement in the pipeline to conduct an experimental study on the formation of ground vortexes under crosswind conditions. Brix et al [4] established a jet engine model with a diameter of 0.1 m and measured the velocity distribution of the inlet vortex by two rapidly rotating optical fiber probes in the engine inlet. Zantopp et al [5] studied and proposed a detailed flow field model of the inlet vortex field under crosswind conditions by using numerical and experimental methods. Hall and Hynes [6] investigated the influence law of crosswind angle and ground clearance on flow field characteristics and found that airflow has an obvious hysteretic effect in the process of inlet separation and adhesion.
In terms of numerical simulations, Majic et al [7] used non-constant Reynolds-averaged Navier–Stokes simulations with climb and cruise flight conditions to effectively reduce the degree of total pressure distortion in the inlet flow field. Yeung et al [8] investigated a computational model for flow separation over the engine nacelle lip under off-design conditions with significant crosswinds. Minaker and Defoe [9,10] proposed a fan gas path and airframe force model design process, applied it to the problem of predicting flow separation over an engine nacelle lip caused by crosswinds, and used a body force model to assess the accuracy of the design process-based approach. Harjes et al [11] explored jet engine inlet distortions caused by crosswind conditions, and through comparative experiments, numerical studies showed that the isentropic peak Mach number depends on the Reynolds number as well as the size of the separation bubble that occurs.
However, rarely has any research been conducted on the use of flow control to suppress flow separation in nacelle intakes under crosswind conditions. Plasma is the fourth state of matter after solid, liquid, and gas. It has attracted wide attention in recent years and is widely used in biomedicine [12,13,14,15,16], environmental purification [17,18,19,20], catalytic technology [21,22,23,24], material handling [25,26,27], flow control, and other fields. Surface Dielectric Barrier Discharge (SDBD) [28] which has the advantages of easy adhesion, rapid response, and adjustable parameters, has been widely used in the fields of stall control [29,30,31,32,33,34], boundary layer rotation [35,36,37,38,39,40], lift enhancement [41,42,43], anti-icing [44,45,46,47,48] and other flow separation control applications. Surface dielectric barrier discharge is classified as Alternating Current Dielectric Barrier Discharge (AC-DBD), Microsecond Dielectric Barrier Discharge (μS-DBD), and Nanosecond Dielectric Barrier Discharge (NS-DBD), of which AC-DBD and NS-DBD are more widely used than μS-DBD. Therefore, the extension of surface dielectric barrier discharge actuation to the field of nacelle inlet flow control is of great significance in improving the air intake quality and flight performance of aircraft.
In this paper, the flow control effect of the nacelle inlet separation flow field is gained based on NS-DBD, and the influence law of actuation frequency on the flow control effect is discussed. Then the comparative experimental study of NS-DBD and AC-DBD actuation is carried out under the same plasma actuation power. Finally, the flow control mechanisms of NS-DBD and AC-DBD in the field of crosswind separation flow are analyzed to provide guidance for solving the flow separation problem in nacelles under crosswind conditions.
2. Experimental Systems
2.1. Experimental Systems for Nacelles
As shown in Figure 1, the experiment independently built the nacelle experiment system. The benchmark model of the experimental object is the DLR-F6 reduction model, which represents the mainstream model of the current transport aircraft [49,50,51,52]. The model adopted in this paper is a pure nacelle model obtained from the DCR-F6 benchmark model, and its structure is completely axisymmetric. The nacelle model is divided into two parts: the front section is the polyamide inlet lip model with a shrinkage ratio of 1:20, diameter of nacelle inlet Di = 200 mm after shrinkage, and the model is modified by 3D printing of synthetic resin materials. The rear section is the metal measurement section, obtained by machining, and fixed devices such as metal ribs are added. The windward side has been rounded transition and profile processing to reduce the disturbance of the convection field.
The Air Independent Power (AIP) section at 0.7 Di from the lip is fitted with a cross-pressure rake. The pressure-measuring harrow expands outward with the center of the tank as the origin, and seven pressure measuring points are set on a single harrow arm within the 20–100 mm interval, as shown in Figure 2. Driven by the rear stepper motor, the measuring rake rotated on the measured section at a rotation interval of 10°. The total pressure of the nacelle inlet section is measured by the probe arranged on the collecting rake.
When the flow passes through the nacelle inlet, the pressure of the nacelle inlet can be obtained through the pressure probe on the pressure rake, and the pressure can be transmitted to the differential pressure sensor acquisition module through the rubber catheter, and the pressure signal can be converted into an electrical signal. Then, the data acquisition card is transmitted to the Labview pressure acquisition program built by the computer to realize the real-time monitoring and acquisition of pressure at each point of the inlet. Finally, the data are calculated and processed, the cloud map of the average total pressure loss coefficient is drawn by interpolation fitting, and the average total pressure loss coefficient and distortion index are calculated to provide a basis for subsequent analysis.
2.2. Wind Tunnel Systems
In this experiment, the LSWT-1 low-speed closed circuit wind tunnel is used to simulate the external atmospheric environment of the aircraft inlet during the take-off phase. The tunnel is 19.79 m long and 10.16 m wide, and the wind velocity is continuously adjustable from 5 to 75 m/s. Under the designed wind velocity, the turbulence in the main flow area of the experimental section is less than 0.2%. In the experiment, the flow velocity of the far field in the wind tunnel is defined as , and the range of is set as 10 m/s ≤ ≤ 35 m/s, corresponding to the Reynolds number range is 1.325 × 10⁵ ≤ Re ≤ 4.638 × 10⁵ based on the diameter of the inlet lip. The rectangular section area of the test section of the reflux wind tunnel is 1.2 m × 1.0 m. Through the physical measurement of the experimental device, the blockage area of the experimental device is 1.42 × 10⁻⁴ m3, and the blockage coefficient is 4.6%, which meets the experimental requirements, and the influence can be ignored.
In most of the nacelle inlet crosswind experiments, crosswind interference is equivalent to simulated by means of crosswind angle. A wind tunnel is used to simulate far-field wind velocity, and the nacelle inlet model is fixed in the center of the wind tunnel experimental section through the positioning mechanism, ensuring that the central axis of the nacelle inlet fixing device is parallel to the central axis of the wind tunnel test section. Then, the crosswind angle is adjusted to the right by the angle adjustment and fixing device so that there is a large vertical component of the incoming flow at the nacelle entrance. Finally, by decomposing the central axis of the inlet fixing device and the vertical direction of the central axis, the wind velocity of the incoming flow perpendicular to the inlet section can be obtained, defined as a vertical crosswind. The wind velocity of the vertical crosswind is equal to that of the actual crosswind vertically entering the inlet section, as shown in Figure 3.
2.3. Plasma Actuation Systems
In terms of actuation power supply, high-voltage nanosecond pulse power is used for NS-DBD actuation, and AC sine wave power is used for AC-DBD actuation.
The high-voltage nanosecond pulse power supply is manufactured by China Xi’an Lingfengyuan Electronic Technology Co., Ltd. It is a parametric high-voltage nanosecond pulse power supply with 0–20 kV continuous adjustable voltage and 0–20 kHz continuous adjustable frequency. The rising and falling edges are adjustable at 50 ns–500 ns and the pulse width is 0 ns–1 ms. AC sine wave power supply is CTP-2000K, produced by Suman, Nanjing, China. During use, the control box is connected to realize continuous sine wave pulse modulation. The output voltage range is from 0 to 40 kv, and the frequency is from 6 kHz to 40 kHz.
In the experiment, the preparation procedure of the actuator is as follows: First, the low-voltage electrode is pasted on the lip of the model after cleaning, and then the high-voltage electrode is directly pasted with a large area of insulating dielectric layer. Finally, the distance between the electrodes is kept at 0, and the high-voltage electrode is pasted. In addition, under the wind velocity studied in this paper, the laying method of this actuator is not affected by the flow field after experimental verification and will not be modified due to repeated experiments, and the fitting is firm and reliable.
The detailed structure of the actuator is shown in Figure 4. It consists of two copper foil electrodes parallel to the upper and lower sides and an insulating dielectric layer in the middle. The dielectric layer is Kapton material with a thickness of 0.2 mm and a dielectric constant of 3.4. Two copper foil electrodes are high-voltage and low-voltage electrodes, which are placed on both sides of the dielectric layer. The high-voltage electrodes with a width of 5 mm and a thickness of 0.02 mm are distributed on the exposed upper surface of the insulating dielectric material and are connected with the high-voltage end of the actuation power supply. The low-voltage electrode with a width of 5 mm and a thickness of 0.02 mm is placed on the lower surface of the insulating dielectric material, between the insulating material and the surface of the model, and is connected to the low-voltage end of the actuation power supply.
2.4. Electrical Parameter Measurement System
The electrical parameter measurement system includes a high-voltage probe, a current probe, and an oscilloscope, as shown in Figure 5.
The maximum measuring range of the P6015A high-voltage probe is set as 20 kV DC voltage, 40 kV peak-to-peak voltage, and 100 ms voltage pulse width. The rise time is 4.0 ns, the compensation range is 7–49 pF, and the measurement bandwidth is up to 75 MHz. In the process of voltage measurement, the voltage uncertainty is 0.2 kV. The TCP0030 current probe can choose 5 A and 30 A current measurement ranges and measure 30 A maximum RMS current and 50 A peak pulse current. It can provide up to 1 mA precision measurement level and 120 MHz bandwidth; rise time is not more than 2.92 ns. In the NS-DBD actuation experiment, the uncertainty of current measurement is 0.2 A due to the large current and drastic change. The actuation current of AC-DBD is small and stable, and the uncertainty is 2 mA. The model of the oscilloscope used in the experiment is the DPO4104B oscilloscope, which has four acquisition channels. The oscilloscope can meet the requirements of various waveform analyses, automatically identify units and pre-calibrate, and the data storage is simple and efficient.
2.5. Flow Field Evaluation Index
The total pressure loss coefficient is a characteristic parameter for measuring airflow flow loss in the passage. By analyzing the distribution and magnitude of the total pressure loss coefficient, flow characteristics of airflow can be predicted. The expression is defined as:
where is the total far-field pressure, is the static far-field pressure, is the total pressure on the AIP section, is flow velocity, and is air density. In addition, is the average total pressure loss coefficient on the AIP section.
The distortion index is the representation quantity of the inlet flow field, and the total pressure distortion index is the index to measure the flow field distribution deviation from the uniform flow field of the inlet, which is used to represent the flow field quality of the outlet section, and is one of the crucial performance parameters of the inlet. The expression is defined as:
where is the average total pressure in the lowest sector of 60° total pressure on the AIP section, and is the average dynamic pressure on the AIP section.
3. Results and Discussion
3.1. Experiment on Nacelle Inlet under Crosswind Conditions
The experiment analyzes the characteristics of the separation flow field in crosswind by changing the characteristic parameters to obtain the main influence laws of the characteristic parameters of the separation flow field and provide a basis for flow control experiments by plasma actuation.
In the experiment, the flow velocity of the wind tunnel is first fixed at 15 m/s, and the crosswind angle is set at 10°, 14°, 18°, 22°, 26° and 30°. Experimental research is carried out under six flow conditions, and a cloud map of the total pressure loss coefficient is compared and analyzed, as shown in Figure 6.
The results show that when the crosswind angle is 10° and 14°, the total pressure distortion area is mainly distributed in the right windward edge area, and the degree of distortion is small in the affected crosswind area. When the crosswind angle reaches 18°, the distortion area forms a fan-shaped area of about 120°, and the degree of distortion increases rapidly and becomes more serious. When the crosswind angle reaches 22°, the distortion area basically coincides with the windward area on the right, forming a fan-shaped distortion area of about 180°. In this case, the total pressure distortion of the nacelle inlet is serious, the inlet quality of the flow field is poor, and there are serious safety risks. When the crosswind angle continues to increase, the distortion area remains essentially unchanged, showing a slightly expanding trend.
The data information in the total pressure loss cloud map is processed, and the average total pressure loss coefficient and the distortion index are calculated to draw the variation law, as shown in Figure 7.
The results show that when = 15 m/s, increases from 10° to 30°, increases from 0.148731 to 0.433628, and increases from 0.342898 to 1.155558. When = 10° or = 14°, is in the range 0.1–0.2, is in the range 0.3–0.5, and the degree of distortion is small. When continues to increase, and continues to increase and the degree of distortion increases. Combined with the cloud map in Figure 5, it is found that when reaches 22° and then increases further, although the distortion range remains essentially unchanged, and continue to increase, and the degree of distortion continues to be large.
To further improve the flow velocity, set to 25 m/s and 35 m/s, and set to 10°, 14°, 18°, 22°, 26°, and 30°. The experiment is carried out under six incoming flow conditions, and the variation law of the average total pressure loss coefficient and the distortion index under different crosswind angles is drawn, as shown in Figure 8.
Figure 7 shows that the variation law is basically the same under different flow velocities. When = 10° or = 14°, and increase slightly, with the further increase of , and increase rapidly. Longitudinal observation of Figure 7 shows that with the increase of , the difference of index values under different flow velocities gradually decreases. In particular, when = 30°, the index values under different flow velocities basically converge to one. Therefore, it can be concluded that with the increase of , the influence of on the distortion gradually decreases, and gradually dominates.
In order to further verify the conclusion, is increased to 18°, 22°, 26°, and 30°. The experiment is carried out under six incoming flow conditions, and the variation law is drawn, as shown in Figure 9.
In order to further verify the conclusion, is increased to 18°, 22°, 26°, and 30°. The experiment is carried out under six incoming flow conditions, and the variation law is drawn, as shown in Figure 8.
The results show that when = 10°, and decrease with the increase of the flow velocity. When increases further and gradually increases from 15 m/s to 30 m/s, and gradually decrease. However, when = 35 m/s, the distortion slightly increases compared with 30 m/s. When reaches 22°, the improvement of distortion is small with the increase of , and remain basically unchanged.
Therefore, the reasons can be analyzed as follows: in the case of a small crosswind angle, with the increase of the flow velocity, the flow capacity of the nacelle inlet is improved, the range of distortion is narrowed, and the total pressure distortion is improved. In this case, the influence of the flow velocity on total pressure distortion is dominant. However, the effect of improving the distortion by increasing the flow velocity is limited. When the crosswind angle increases further, the flow velocity has an optimal effect threshold. When the flow velocity exceeds this threshold, the improvement effect will gradually decrease. At this time, the leading role of flow velocity still exists but is limited. When the crosswind angle reaches a certain threshold, the effect of improving the total pressure distortion by increasing the flow velocity basically disappears. In this case, the crosswind angle plays a dominant role in the total pressure distortion, and the flow velocity has little influence. This also shows that, in the case of crosswind, with the increase of the crosswind angle, the leading role of the flow velocity on the distortion becomes weaker and weaker, and the influence of the flow velocity is determined by the crosswind angle, so there is a limit value of the crosswind angle on the effect of the flow velocity.
3.2. Flow Separation Control of Nacelle Inlets in Crosswinds by NS-DBD
Plasma actuation has made many achievements in the field of flow control, especially in controlling flow separation. Jia Yuhao et al. [53] found that the 120° circumferential actuation layout is adopted at the inlet lip of the nacelle, which has low actuation energy and a good plasma flow control effect. Therefore, 120° circumferential plasma actuators are layout on the windward side to explore the control effect of plasma actuation.
Based on the experimental results of the nacelle inlet under crosswind conditions, four experimental conditions with small distortion and one condition with large distortion are selected. The experimental conditions are shown in Table 1.
In the experiment, the peak-to-peak value of the actuation voltage is set to 10 kV, the rising edge to 100 ns, the pulse width to 300 ns, and the falling edge to 100 ns. By changing the actuation frequency, the influence law of NS-DBD plasma actuation frequency on the separation flow field is explored.
Firstly, the experiment is conducted under experimental condition 1 ( = 10°, = 15 m/s). Under the condition of = 10 kV, the actuation frequency is set as 500 Hz, 1000 Hz, 1500 Hz, and 2000 Hz. The average total pressure loss coefficient and the distortion index under different actuation conditions are calculated, and the cloud map of the total pressure loss coefficient and its variation law are drawn, as shown in Figure 10 and Figure 11.
The results show that when the total pressure distortion is improved under NS-DBD, and are reduced. As the actuation frequency increases, the degree of distortion first increases and then increases. At = 500 Hz, and reach a minimum near the point where decreases from 0.148731 to 0.125995 and decreases from 0.342898 to 0.276816. As the actuation frequency continuously increases, the improvement effect of actuation on and is reduced. Compared with = 500 Hz, and will increase. Especially, rises to 0.13278 and rises to 0.301035 at = 2000 Hz. Therefore, there is an optimal coupling frequency of NS-DBD. When the frequency is higher or lower than this frequency, the distortion improvement effect will be reduced, and the optimal coupling frequency will be located near 500 Hz.
Then the experiment is conducted under experimental condition 2 ( = 10°, = 35 m/s). Under the condition of = 10 kV, the actuation frequency is set as 500 Hz, 1000 Hz, 1500 Hz, and 2000 Hz. The experimental results are shown in Figure 12 and Figure 13.
The results show that the total pressure distortion is still improved under NS-DBD, and are reduced. At = 500 Hz, and reach a minimum near the point where decreases by 29.62% from 0.083813 to 0.05899, decreases by 44.14% from 0.221959 to 0.123999, and the total pressure distortion basically disappears. The increasing trend of actuation frequency is the same as that of condition 1, indicating that the optimal coupling frequency of plasma has not changed.
Then the experiment is continued under experimental conditions 3 and 4, and the results are compared with those under experimental conditions 1 and 2, as shown in Figure 14.
The results show that NS-DBD can effectively improve the distortion under four conditions, that is, when the distortion degree is small. Under different experimental conditions, the optimal coupling frequency of plasma actuation is around 500 Hz, but when the plasma actuation frequency increases, the actuation effect will decrease. However, of condition 2 ( = 10°, = 35 m/s) at = 2000 Hz changes from the baseline standard 0.221959 to 0.235424, and condition 4 ( = 14°, = 25 m/s) is changed from 0.337807 to 0.376613. This indicates that the improvement effect of the distortion may decrease when the actuation frequency is greater than the optimal coupling frequency and may even lead to the intensification of the distortion.
In order to verify the influence of plasma actuation, condition 5 with a large total pressure distortion degree is set. Under the condition of = 10 kV, the actuation frequency is set as 500 Hz, 1000 Hz, 1500 Hz, and 2000 Hz. The experimental results are shown in Figure 15 and Figure 16.
The experimental results show that the effect of NS-DBD is weakened, and the cloud map does not change significantly. Even when the actuation frequency is close to the optimum coupling frequency, only decreases from 0.251402 to 0.243847, a reduction of only 3.00%, while remains essentially unchanged.
It can be found from the above results that there is an inherent optimal coupling frequency of plasma actuation in the separation flow field. Under this optimal coupling frequency, plasma actuation has the best effect on improving the distortion. In the case of a separation flow field with a small crosswind angle and a small degree of distortion, the improvement effect of plasma actuation is more obvious. Especially in the case of large flow velocity, the distortion can be reduced. However, in the separation flow field with a large degree of distortion, the distortion degree is serious, and the effect of plasma actuation is weak. In this case, the aircraft cannot work normally. Therefore, plasma actuation should be applied to the condition of small distortion.
3.3. Comparative Experiment of Flow Control between NS-DBD and AC-DBD
In order to compare the control effect of AC-DBD and NS-DBD, comparisons should be made under the same energy requirements. However, there are several parameters for the two kinds of actuation. In the experiment, AC-DBD chooses a steady actuation mode. Under the premise of selecting the same actuation voltage, the actuation frequency f of AC-DBD is set to 6000 Hz. By changing the actuation frequency of NS-DBD, the same actuation energy of both is sought.
The plasma actuation voltage is determined to be 10 kV, 9 kV, and 8 kV. Three groups of NS-DBD and AC-DBD actuation conditions are determined on the premise of ensuring the same actuation energy. The actuation Settings are shown in Table 2.
According to the previous experimental results, the plasma flow control effect is better under experimental condition 3 ( = 10°, = 25 m/s), so the experiment in this section is first carried out under experimental condition 3. The cloud map of the total pressure loss coefficient is obtained, as shown in Figure 17.
From the actuation effect, both NS-DBD and AC-DBD can reduce the degree of distortion in the flow field and narrow the range of total pressure distortion. However, the distribution range and degree of distortion of NS-DBD are smaller than that of AC-DBD under the three actuation settings.
For further analysis, the average total pressure loss coefficient under different actuation conditions is calculated, and the comparison bar chart is drawn, as shown in Figure 18.
Experimental results show that the average total pressure loss coefficient decreases from 0.12618 to about 0.10 by AC-DBD and from 0.12618 to about 0.09 by NS-DBD. Therefore, under the same actuation energy condition, the actuation control effect of NS-DBD plasma is better than that of AC-DBD.
In order to further compare and analyze the flow control effect, experimental conditions 4 and 5 are selected for the experiment, where the total pressure distortion is more serious in experimental condition 5. Specific conditions are set up as shown in Table 3.
As shown in Figure 19, experimental results show that both NS-DBD and AC-DBD can achieve control effects under working conditions 3 and 4. Moreover, the average total pressure loss coefficient of NS-DBD is smaller under the same actuation power, so the control effect of NS-DBD is better than that of AC-DBD. However, the control effect of NS-DBD and AC-DBD is weak when the distortion is large. Therefore, it can be concluded that plasma actuation is more suitable for less distortion to improve flight quality.
3.4. Mechanism of Dielectric Barrier Discharge Flow Control in Crosswinds
Firstly, the discharge forms and energy output characteristics of AC-DBD and NS-DBD at the same discharge energy are analyzed to better reveal the mechanism. Observe the discharge pattern, as shown in Figure 20. The results show that NS-DBD is stronger than AC-DBD in terms of plasma region range, length, and brightness of ion channel, indicating that NS-DBD has stronger discharge capacity under the same energy.
In addition, the actuation intensity is also related to the actuation waveform of the two. As shown in Figure 21, under the same energy condition, the rising edge and falling edge of the voltage waveform of NS-DBD are steeper than that of AC-DBD. The steeper the rising and falling edge of the pulse voltage, the more drastic the voltage change. Thus, even after the first breakdown and discharge of the air gap, the voltage will continue to rise rapidly, making the discharge more intense; this may be the reason why NS-DBD is stronger than AC-DBD.
In previous studies [54,55,56,57], the main control and evolution mechanisms of AC-DBD and NS-DBD in the flow field are summarized. AC-DBD is mainly dominated by the “dynamic effect”, which induces initial vortexes at the beginning of actuation and eventually evolves into a near-wall jet. While NS-DBD is mainly dominated by the “shock effect”, the plasma layer will rapidly generate pressure waves and form energy deposition, which makes the surrounding air rapidly heated, causing local temperature and pressure fields to rise rapidly, inducing a vortex. The near-wall jet is also eventually generated, but the jet velocity is obviously smaller than AC-DBD.
However, previous studies on control mechanisms [29,30,58] mainly focused on flow separation caused by the over-stall state of the airfoil/wing. In the crosswind reference flow field, flow separation is different, but the essence remains the same. It is shown that the crosswind angle at the lip on the windward side of the nacelle is too large. After the boundary layer passes through the stagnation point, it detaches from the inner wall of the inlet under a large negative pressure gradient, forming an obvious shear layer and forming a large separation zoon under the shear layer.
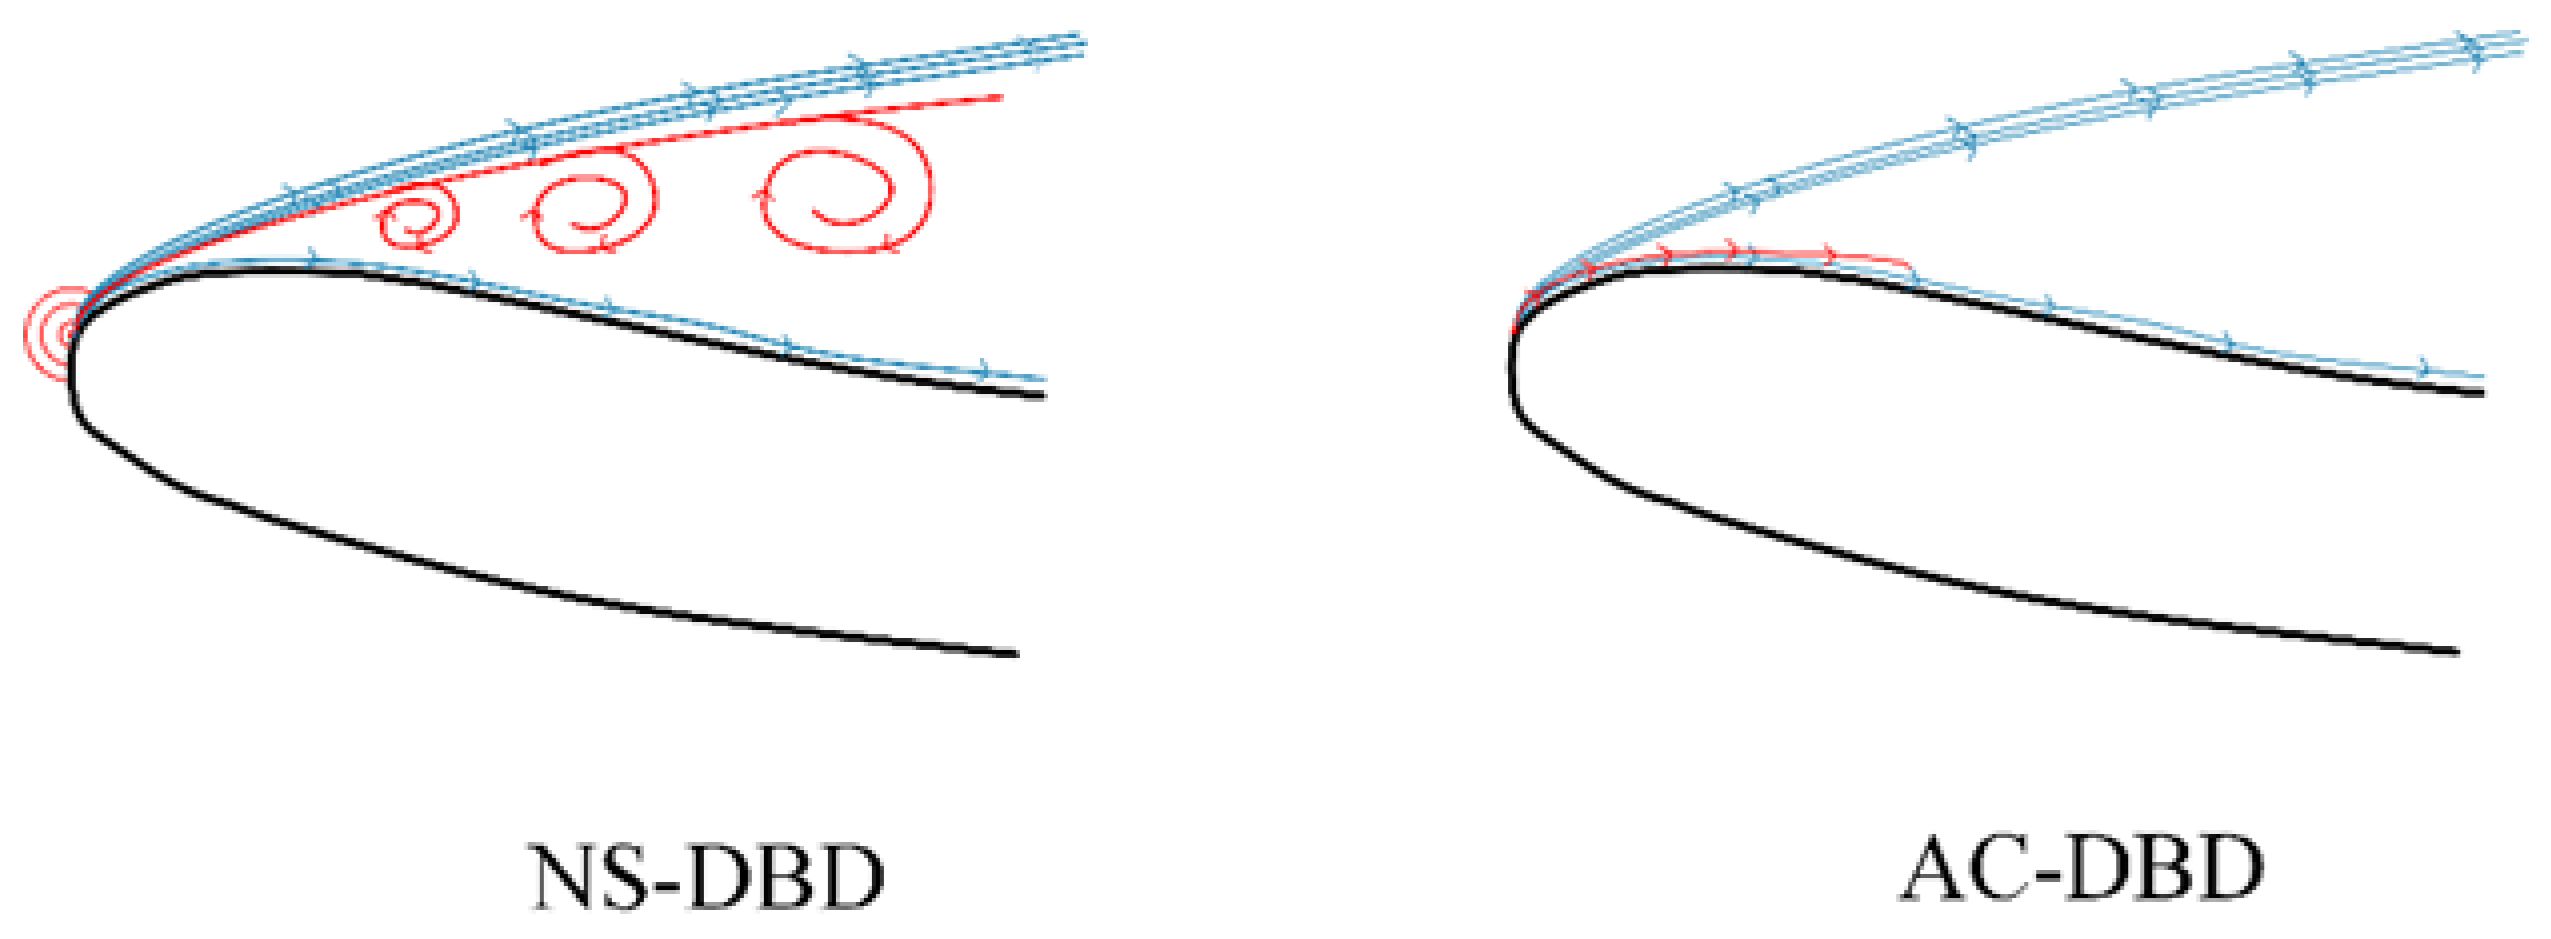
According to the experimental results, the flow separation control of NS-DBD is better than that of AC-DBD in crosswinds, and the reason is closely related to the internal flow control mechanism. According to the flow control characteristics of AC-DBD and NS-DBD, the control mechanism of the crosswind separation flow field in the nacelle can be refined, respectively, as shown in Figure 22. NS-DBD is performed near the interface between the main flow zone and the separation zone. On the one hand, there is the “shock effect”. Shock waves appear on the actuator surface, shock waves impact the shear layer, and the shear layer is subjected to rapid pressure disturbance. With the continuous impact on the shear layer, the shear layer gradually distorts and deforms or even cracks, which stimulates the K-H instability of the shear layer. On the other hand, there is “vortex control”, which is induced by plasma actuation. The disturbance of the induced vortex makes the high-energy fluid in the mainstream region suck into the boundary layer of the separation region. The low-energy fluid in the boundary layer of the separation zone is also sucked into the main flow zone, thus promoting the mixing momentum exchange between the main flow zone and the boundary layer of the separation zone. By injecting new energy into the boundary layer, the flow velocity in the boundary layer is increased, the negative pressure gradient and the accumulation of low energy flow are reduced, and the separation of the boundary layer caused by the increase of the negative pressure gradient and the increase of the thickness of the boundary layer caused by the increase of the negative pressure gradient is effectively prevented. While AC-DBD mainly relies on the volume force effect. Although starting vortex exists, its disturbance can also promote the mixing momentum exchange between the boundary layer in the mainstream region and the separation region; however, it is more important to induce the near-wall jet flow and increase the flow velocity in the boundary layer. Therefore, the negative pressure gradient and the accumulation of low energy flow are reduced, and the ability of the boundary layer to resist the negative pressure gradient is improved. However, the flow at the bottom of the boundary layer can only be accelerated, so the ability of boundary layer to resist the negative pressure gradient is limited.
In addition, the optimal coupling frequency of plasma actuation is about 500 Hz, and when the plasma actuation frequency is increased, the actuation effect will be reduced, and the further increase in frequency may even lead to the aggravation of the total pressure distortion. This is because NS-DBD belongs to impact flow control [59] and has the feature of “frequency coupling”. That is, the pulsed frequency of plasma aerodynamic actuation is close to the optimal coupling frequency of the flow field to achieve the optimal coupling of plasma aerodynamic actuation and the flow field.
Therefore, the reasons are analyzed: on the one hand, it may be related to the structure of the flow field. Under crosswind conditions, the flow is accompanied by the generation, development, and shedding of vortices. This requires that the control frequency should be combined with the main frequency of vortex shedding as best as possible. Since the experiment is conducted at low velocity, the main frequency of the vortex is naturally very low. On the other hand, actuation characteristics have a certain relationship with frequency. The spanwise vortex induced by low-frequency actuation can develop into a large-scale attached vortex structure. As the small-scale vortex spreads downstream, neighboring vortices will get closer. When the distance is close enough, the two vortices will fuse. If the actuation frequency exceeds the threshold, the shear layer is divided into several parts, and the mixing momentum exchangeability of the boundary layer between the mainstream region and the separation region becomes weak, which makes it difficult to maintain flow attachment.
Therefore, both NS-DBD and AC-DBD control flow separation by reducing the inverse pressure gradient, but the flow control mechanism differs. By inducing shock wave and vortex, NS-DBD could excite the K-H instability of the shear layer and promotes the mixing momentum exchange of the boundary layer between the main stream region and separation region. However, AC-DBD mainly induces near-wall jet flow and increases flow velocity in the boundary layer. In addition, compared with the low-frequency actuation, the high-frequency actuation has a smaller scale. The mixing momentum exchangeability is weaker, and the improvement effect is reduced.
4. Conclusions
On the basis of capturing the crosswind flow separation of the nacelle inlet, a 120° circumferential actuation layout is adopted in the experiment. Under different actuation frequencies, the flow control effect of NS-DBD is verified, and the influence rule of actuation parameters is studied. In addition, a comparative experimental study of NS-DBD and AC-DBD actuation is carried out, which provides an important basis for plasma actuation to improve separation flow field control. In the future, more detailed parameter studies are needed to guide the flow control of nacelle inlet to explore the optimal effect of flow separation control. The main conclusions are as follows:
- (1)
- NS-DBD can reduce the total pressure loss coefficient and flow separation range. Under the condition that = 10° and = 35 m/s, the total pressure distortion basically disappears;
- (2)
- There is an inherent optimal coupling frequency of NS-DBD, under which the total pressure distortion of the crosswind separation flow field is minimal;
- (3)
- NS-DB has an obvious flow control effect, mainly in the case of small separation distortion. However, the control effect on the separation field is limited when the separation distortion is large;
- (4)
- AC-DBD can also improve total pressure distortion, but under the same actuation power, the control effect of NS-DBD is better than AC-DBD;
- (5)
- Compared with AC-DBD, the “impact mechanism” and the attached vortex structure of NS-DBD are more conducive to promoting the mixing momentum exchange of the boundary layer between the mainstream zone and the separation zone, and the flow control effect is better. Therefore, NS-DBD should be preferred in the problem of flow separation of nacelles under crosswind conditions.
Author Contributions
D.Z. performed the experimental investigation; H.L. and Z.S. supervised the work and reviewed and edited the manuscript; D.Z. and H.Y. wrote the main manuscript; C.Z. and S.L. analyzed the results. All authors have read and agreed to the published version of the manuscript.
Funding
This research was funded by the National Science and Technology Major Project of China (Grant No. J2019-II-0014-0035).
Data Availability Statement
The data and materials are available upon request.
Acknowledgments
Thanks to Weiliang Kong from The Green Aerotechnics Research Institute of Chongqing Jiaotong University for the strong support and help for the experimental plan and paper modification.
Conflicts of Interest
The authors declare no conflict of interest.
References
- Vunnam, K.; Hoover, R. Modeling of Inlet Distortion using a Combined Turbofan and Nacelle Inlet Model during Crosswind and Low Speed Forward Operation. In Proceedings of the ASME 2011 Turbo Expo: Turbine Technical Conference and Exposition, Vancouver, BC, Canada, 6–10 June 2011. [Google Scholar]
- Motycka, D.L. Reynolds number and fan/inlet coupling effects on subsonic transport inlet distortion. J. Propuls. Power 1985, 1, 229–234. [Google Scholar] [CrossRef]
- Murphy, J.P.; MacManus, D.G. Ground vortex aerodynamics under crosswind conditions. Exp. Fluids 2011, 50, 109–124. [Google Scholar] [CrossRef]
- Brix, S.; Neuwerth, G.; Jacob, D. The inlet-vortex system of jet engines operating near the ground. In Proceedings of the 18th Applied Aerodynamics Conference, Denver, CO, USA, 14–17 August 2000. [Google Scholar]
- Zantopp, S.; MacManus, D.; Murphy, J. Computational and experimental study of intake ground vortices. Aeronaut. J. 2010, 114, 769–784. [Google Scholar] [CrossRef]
- Hall, C.A.; Hynes, T.P. Measurements of intake separation hysteresis in a model fan and nacelle rig. J. Propuls. Power 2006, 22, 872–879. [Google Scholar] [CrossRef]
- Majić, F.; Efraimsson, G.; O’Reilly, C.J. Potential improvement of aerodynamic performance by morphing the nacelle inlet. Aerosp. Sci. Technol. 2016, 54, 122–131. [Google Scholar] [CrossRef]
- Yeung, A.; Vadlamani, N.R.; Hynes, T.; Sarvankar, S. Quasi 3D nacelle design to simulate crosswind flows: Merits and challenges. Int. J. Turbomach. Propuls. Power 2019, 4, 25. [Google Scholar] [CrossRef]
- Minaker, Q.J.; Defoe, J.J. Prediction of crosswind separation velocity for fan and nacelle systems using body force models: Part 1: Fan body force model generation without detailed stage geometry. Int. J. Turbomach. Propuls. Power 2019, 4, 43. [Google Scholar] [CrossRef]
- Minaker, Q.J.; Defoe, J.J. Prediction of crosswind separation velocity for fan and nacelle systems using body force models: Part 2: Comparison of crosswind separation velocity with and without detailed fan stage geometry. Int. J. Turbomach. Propuls. Power 2019, 4, 41. [Google Scholar] [CrossRef]
- Harjes, L.; Bode, C.; Grubert, J.; Frantzheld, P.; Koch, P.; Friedrichs, J. Investigation of jet engine intake distortions caused by crosswind conditions. J. Glob. Power Propuls. Soc. 2020, 4, 48–62. [Google Scholar] [CrossRef]
- Laroussi, M.; Lu, X.; Keidar, M. Perspective: The physics, diagnostics, and applications of atmospheric pressure low temperature plasma sources used in plasma medicine. J. Appl. Phys. 2017, 122, 020901. [Google Scholar] [CrossRef]
- Laroussi, M.; Tendero, C.; Lu, X. Inactivation of bacteria by the plasma pencil. Plasma Process. Polym. 2006, 3, 470–473. [Google Scholar] [CrossRef]
- Woedtke, T.V.; Reuter, S.; Masur, K. Plasmas for medicine. Phys. Rep. 2013, 530, 291–320. [Google Scholar] [CrossRef]
- Hoffmann, C.; Berganza, C.; Zhang, J. Cold Atmospheric Plasma: Methods of production and application in dentistry and oncology. Med. Gas Res. 2013, 3, 1–15. [Google Scholar] [CrossRef] [PubMed]
- Xie, J.; Chen, Q.; Suresh, P. based plasma sanitizers. Proc. Natl. Acad. Sci. USA 2017, 114, 5119–5124. [Google Scholar] [CrossRef]
- Choudhury, B.; Revazishvili, T.; Lozada, M. Distributed compact plasma reactor decontamination for planetary protection in space missions. Sci. Rep. 2023, 13, 1928. [Google Scholar] [CrossRef] [PubMed]
- Penetrante, B.M.; Hsiao, M.C.; Bardsley, J.N. Electron beam and pulsed corona processing of volatile organic compounds in gas streams. Pure Appl. Chem. 1996, 68, 1083–1087. [Google Scholar] [CrossRef]
- Kim, H.H. Nonthermal plasma processing for air-pollution control: A historical review, current issues, and future prospects. Plasma Process. Polym. 2004, 1, 91–110. [Google Scholar] [CrossRef]
- Oda, T.; Takahashi, T.; Nakano, H. Decomposition of fluorocarbon gaseous contaminants by surface discharge-induced plasma chemical processing. IEEE Trans. Ind. Appl. 1993, 29, 787–792. [Google Scholar] [CrossRef]
- Jiang, Z.; Fang, D.; Liang, Y. Catalytic degradation of benzene over non-thermal plasma coupled Co-Ni binary metal oxide nanosheet catalysts. J. Environ. Sci. (China) 2023, 132, 1–11. [Google Scholar] [CrossRef]
- Toko, S.; Hasegawa, T.; Okumura, T. Optical emission spectroscopy study in CO2 methanation with plasma. Jpn J. Appl. Phys. 2023, 62, SI1008. [Google Scholar] [CrossRef]
- Wallis, A.E.; Whitehead, J.C.; Zhang, K. Plasma-assisted catalysis for the destruction of CFC-12 in atmospheric pressure gas streams using TiO2. Catal. Lett. 2007, 113, 29–33. [Google Scholar] [CrossRef]
- Guo, Y.F.; Ye, D.Q.; Chen, K.F. Toluene decomposition using a wire-plate dielectric barrier discharge reactor with manganese oxide catalyst in situ. J. Mol. Catal. A Chem. 2006, 245, 93–100. [Google Scholar] [CrossRef]
- Morozumi, J.; Goya, T.; Kuyama, T. In-situ electrical monitoring of SiO2/Si structures in low-temperature plasma using impedance spectroscopy. Jpn J. Appl. Phys. 2023, 62, SI1010. [Google Scholar] [CrossRef]
- Morshed, M.M.; Alam, M.M.; Daniels, S.M. Plasma treatment of natural jute fibre by RIE 80 plus plasma tool. Plasma Sci. Technol. 2010, 12, 325. [Google Scholar] [CrossRef]
- Vanneste, J.; Ennaert, T.; Vanhulsel, A. Unconventional pretreatment of lignocellulose with low-temperature plasma. ChemSusChem 2017, 10, 14–31. [Google Scholar] [CrossRef]
- Corke, T.C.; Post, M.L.; Orlov, D.M. Single-dielectric barrier discharge plasma enhanced aerodynamics: Concepts, optimization, and applications. J. Propuls. Power 2008, 24, 935–945. [Google Scholar] [CrossRef]
- Yang, H.; Liang, H.; Zhao, G.; Wang, B.; Zhang, S.; Kong, W. Experimental study on dynamic stall control based on AC-DBD actuation. Plasma Sci. Technol. 2021, 23, 115502. [Google Scholar] [CrossRef]
- Yang, H.; Zhao, G.; Liang, H.; Wei, B. Dynamic stall control over an airfoil by NS-DBD actuation. Chinese Phys. B 2020, 29, 105203. [Google Scholar] [CrossRef]
- Veerakumar, R.; Raul, V.; Liu, Y.; Wang, X.; Leifsson, L.; Hu, H. Metamodeling-based parametric optimization of DBD plasma actuation to suppress flow separation over a wind turbine airfoil model. Acta Mech. Sin. 2020, 36, 260–274. [Google Scholar] [CrossRef]
- Little, J.; Singh, A.; Ashcraft, T.; Durasiewicz, C. Post-stall flow control using nanosecond pulse driven dielectric barrier discharge plasma actuators. Plasma Sources Sci. Technol. 2019, 28, 014002. [Google Scholar] [CrossRef]
- Sekimoto, S.; Fujii, K.; Anyoji, M.; Miyakawa, Y.; Ito, S.; Shimomura, S.; Nishida, H.; Nonomura, T.; Matsuno, T. Flow Control around NACA0015 Airfoil Using a Dielectric Barrier Discharge Plasma Actuator over a Wide Range of the Reynolds Number. Actuators 2023, 12, 43. [Google Scholar] [CrossRef]
- Matsunuma, T. Effects of the Installation Location of a Dielectric Barrier Discharge Plasma Actuator on the Active Passage Vortex Control of a Turbine Cascade at Low Reynolds Numbers. Actuators 2022, 11, 129. [Google Scholar] [CrossRef]
- Geng, X.; Shi, Z.; Cheng, K.; Dong, H.; Zhao, Q.; Chen, S. Experimental investigations on characteristics of boundary layer and control of transition on an airfoil by AC-DBD. Mod. Phys. Lett. B. 2018, 32, 1850108. [Google Scholar] [CrossRef]
- Kriegseis, J.; Simon, B.; Grundmann, S. Towards in-flight applications? A review on dielectric barrier discharge-based boundary-layer control. Appl. Mech. Rev. 2016, 68, 020802. [Google Scholar] [CrossRef]
- Im, S.; Do, H.; Cappelli, M.A. Dielectric barrier discharge control of a turbulent boundary layer in a supersonic flow. Appl. Phys. Lett. 2010, 97, 041503. [Google Scholar] [CrossRef]
- Schatzman, D.M.; Thomas, F.O. Turbulent boundary-layer separation control with single dielectric barrier discharge plasma actuators. AIAA J. 2010, 48, 1620–1634. [Google Scholar] [CrossRef]
- Grundmann, S.; Tropea, C. Active cancellation of artificially introduced Tollmien–Schlichting waves using plasma actuators. Exp. Fluids 2008, 44, 795–806. [Google Scholar] [CrossRef]
- Arnob, D.G.; Subrata, R. Modification of energetic modes for transitional flow control. AIP Adv. 2022, 12, 035149. [Google Scholar]
- Yao, J.; Zhou, D.; He, H.; He, C.; Shi, Z.; Du, H. Experimental investigation of lift enhancement for flying wing aircraft using nanosecond DBD plasma actuators. Plasma Sci. Technol. 2017, 19, 044002. [Google Scholar] [CrossRef]
- Iranshahi, K.; Mani, M. Dielectric barrier discharge actuators employed as alternative to conventional high-lift devices. J. Aircr. 2018, 55, 2104–2113. [Google Scholar] [CrossRef]
- Xu, Z.; Wu, B.; Gao, C.; Wang, N. Numerical simulation of dynamic stall flow control using a multi-dielectric barrier discharge plasma actuation strategy. Phys. Plasmas 2022, 29, 103503. [Google Scholar] [CrossRef]
- Xie, L.; Liang, H.; Zong, H.; Liu, X.; Li, Y. Multipurpose distributed dielectric-barrier-discharge plasma actuation: Icing sensing, anti-icing, and flow control in one. Phys. Fluids 2022, 34, 071701. [Google Scholar] [CrossRef]
- Jia, Y.; Liang, H.; Zong, H.; Wei, B.; Xie, L.; Hua, W.; Li, Z. Ice shape modulation with nanosecond pulsed surface dielectric barrier discharge plasma actuator towards flight safety. Aerosp. Sci. Technol. 2022, 120, 631–651. [Google Scholar] [CrossRef]
- Rodrigues, F.; Abdollahzadehsangroudi, M.; Nunes-Pereira, J.; Páscoa, J. Recent Developments on Dielectric Barrier Discharge (DBD) Plasma Actuators for Icing Mitigation. Actuators 2023, 12, 5. [Google Scholar] [CrossRef]
- Moreira, M.; Rodrigues, F.; Cândido, S.; Santos, G.; Páscoa, J. Development of a Background-Oriented Schlieren (BOS) System for Thermal Characterization of Flow Induced by Plasma Actuators. Energies 2023, 16, 540. [Google Scholar] [CrossRef]
- Lilley, A.J.; Roy, S.; Michels, L. Performance recovery of plasma actuators in wet conditions. J. Phys. D 2022, 55, 155201. [Google Scholar] [CrossRef]
- Vassberg, J.; Tinoco, E.; Mani, M. Summary of the third AIAA CFD drag prediction workshop, 45th AIAA aerospace sciences meeting and exhibit. In Proceedings of the 45th AIAA Aerospace Sciences Meeting and Exhibit, Reno, NV, USA, 8–11 January 2007. [Google Scholar]
- Trapp, L.G.; Girardi, R. Evaluation of nacelle drag using Computational Fluid Dynamics. J. Aerosp. Technol. Manag. 2010, 2, 145–153. [Google Scholar] [CrossRef]
- Trapp, L.G.; Girardi, R.M. Characteristics of Inlet Trailing Vortex. J. Aircr. 2020, 57, 305–316. [Google Scholar] [CrossRef]
- Trapp, L.G. Crosswind effects on engline inlets: The inlet vortex. J. Aircr. 2010, 47, 577–590. [Google Scholar] [CrossRef]
- Jia, Y.; Liang, H.; He, Q.; Su, Z.; Song, G. Flow separation control of nacelle in crosswind by microsecond pulsed surface dielectric barrier discharge plasma actuator. Flow Turbul. Combust. 2021, 107, 631–651. [Google Scholar] [CrossRef]
- Zheng, H.; Liang, H.; Jie, C.; Zong, H.; Xiang, M.; Xie, L.; Li, Y. Experimental study on plasma actuation characteristics of nanosecond pulsed dielectric barrier discharge. Plasma Sci. Technol. 2021, 24, 015505. [Google Scholar] [CrossRef]
- Yang, Z.; Song, H.; Wang, H.; Guo, S.; Jia, M.; Wang, K. Aerodynamic actuation characteristics of radio-frequency discharge plasma and control of supersonic flow. Chin. Phys. B 2019, 28, 024701. [Google Scholar] [CrossRef]
- Li, Y.; Wu, Y.; Liang, H. Principle of plasma impingement flow control for improving the ability of in hibiting flow separation. Chin. Sci. Bull. 2010, 55, 3060–3068. [Google Scholar]
- Chen, J.; Liang, H.; Wei, B. Discharge Characteristics of Surface Dielectric Barrier Discharge Driven by Parameterized Nanosecond Pulsed Power Supply. High Volt. Eng. 2019, 45, 3365–3374. [Google Scholar]
- Correale, G.; Michelis, T.; Ragni, D. Nanosecond-pulsed plasma actuation in quiescent air and laminar boundary layer. J. Phys. D Appl. Phys. 2014, 47, 105201. [Google Scholar] [CrossRef]
- Li, Y.; Wu, Y.; Liang, H. The mechanism of plasma shock flow control for enhancing flow separation control capability. Chin. Sci. Bull. 2010, 55, 3060. [Google Scholar]
Figure 1.
The diagram of an experimental system for nacelles.

Figure 2.
The diagram of total pressure measuring points on the AIP section.

Figure 3.
The diagram of the relationship between the nacelle inlet model and wind direction.
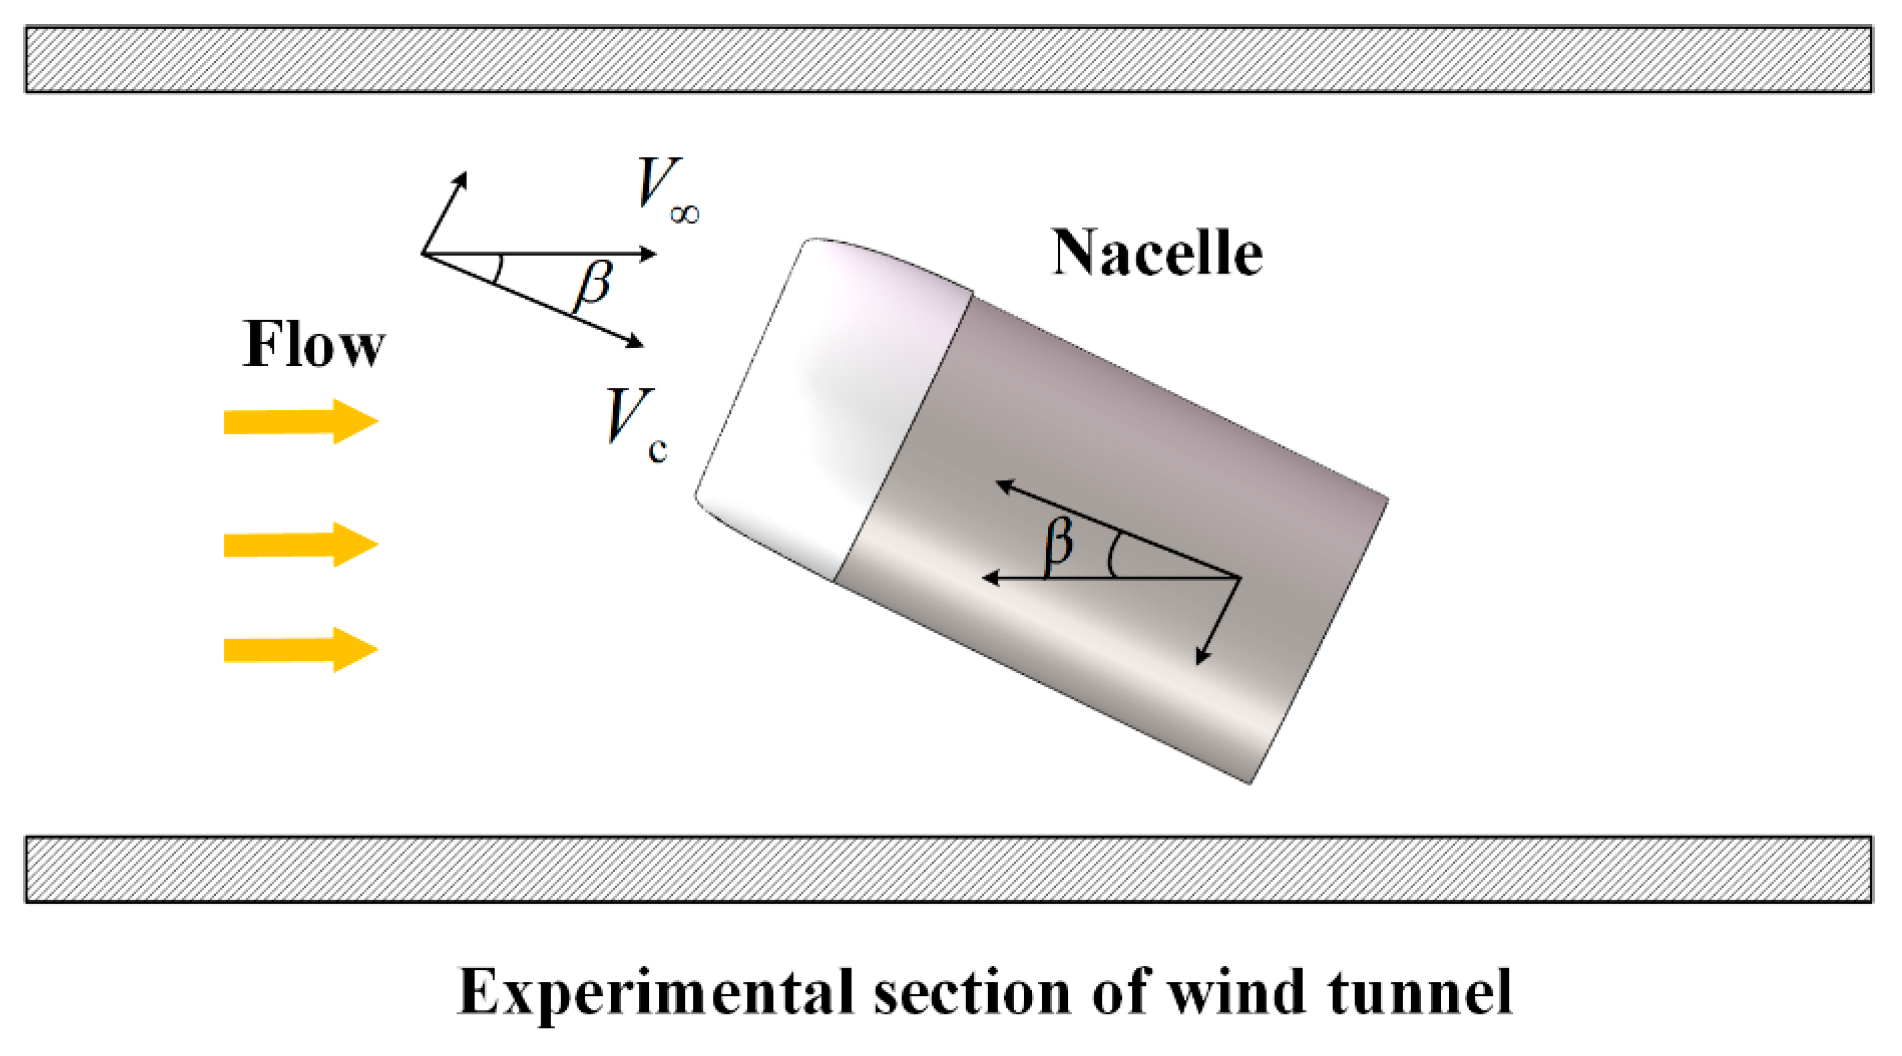
Figure 4.
The diagram of the DBD actuator layout.

Figure 5.
Electrical measuring equipment.
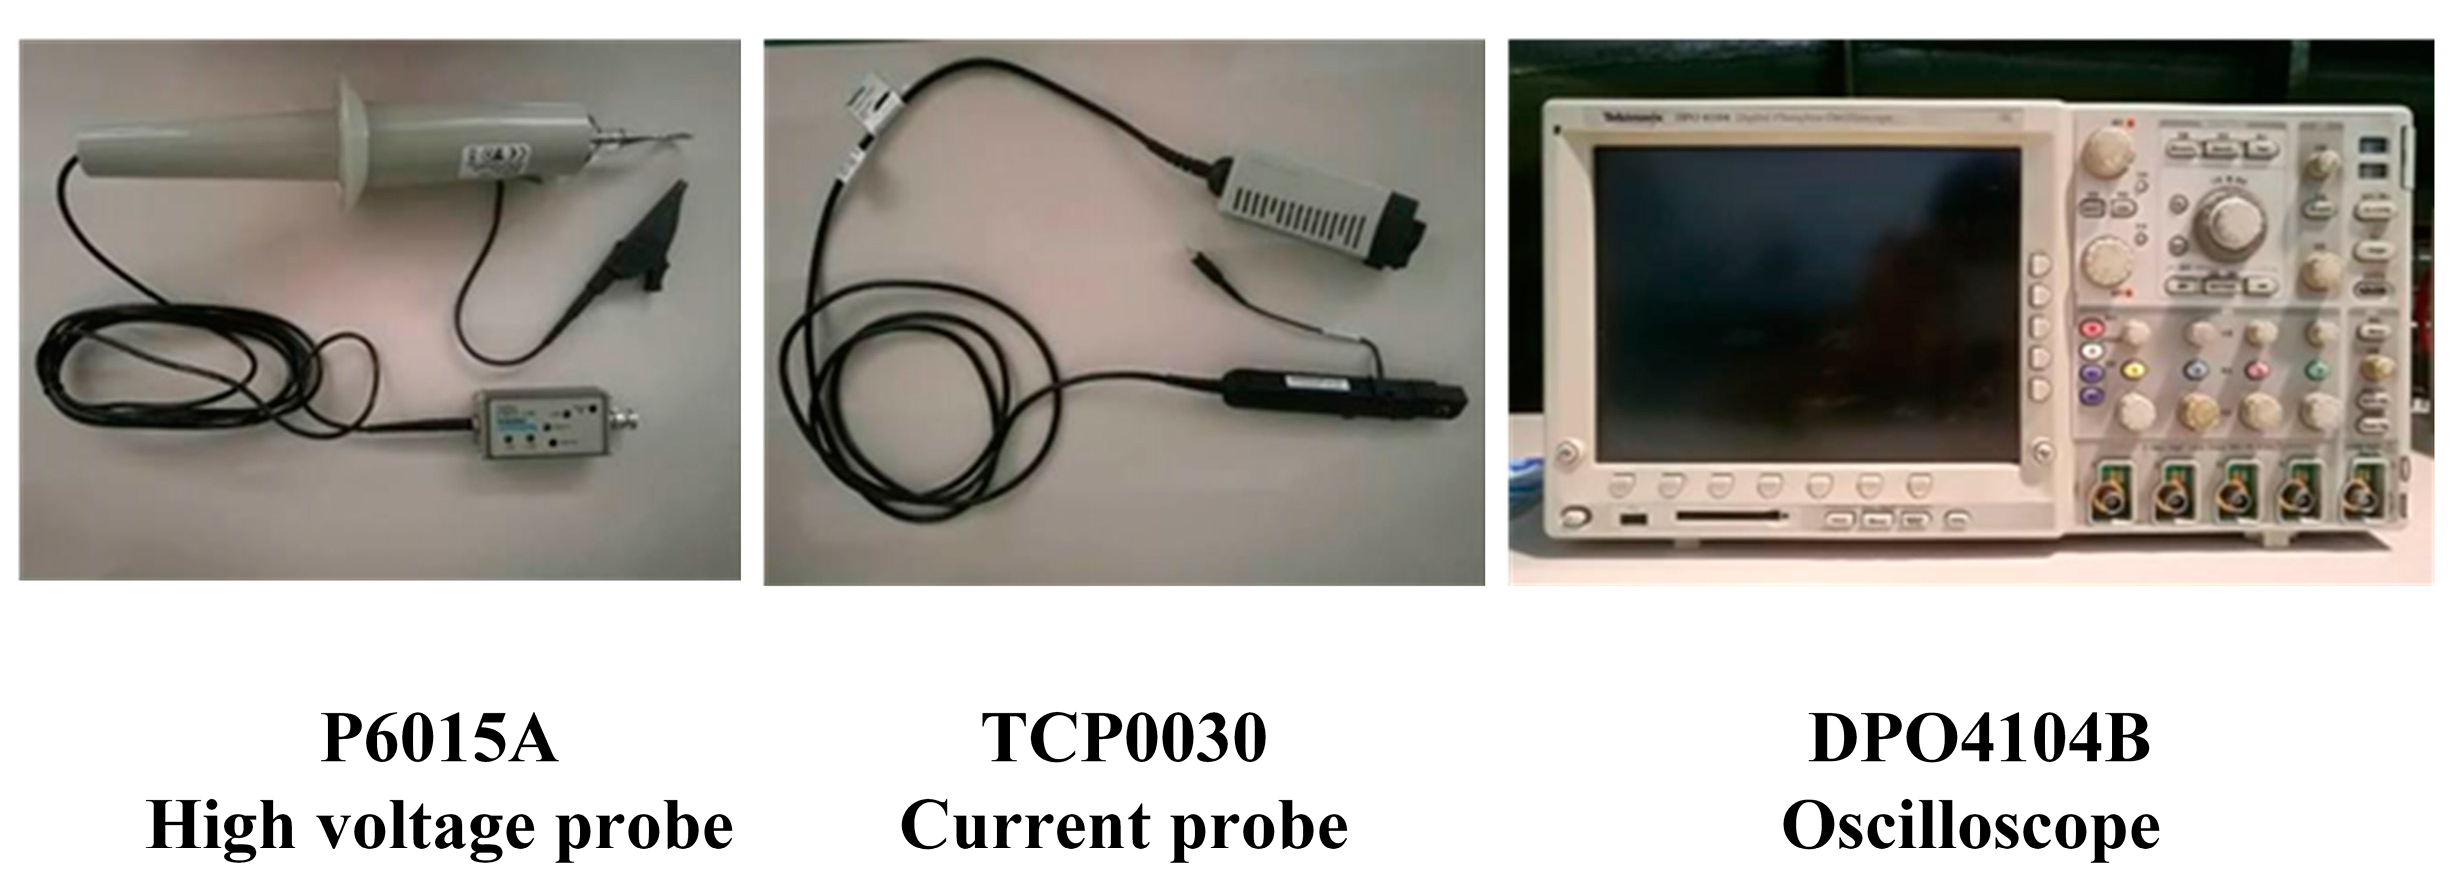
Figure 6.
Cloud map of total pressure loss coefficient at different crosswind angles when the flow velocity is 15 m/s.
Figure 6.
Cloud map of total pressure loss coefficient at different crosswind angles when the flow velocity is 15 m/s.
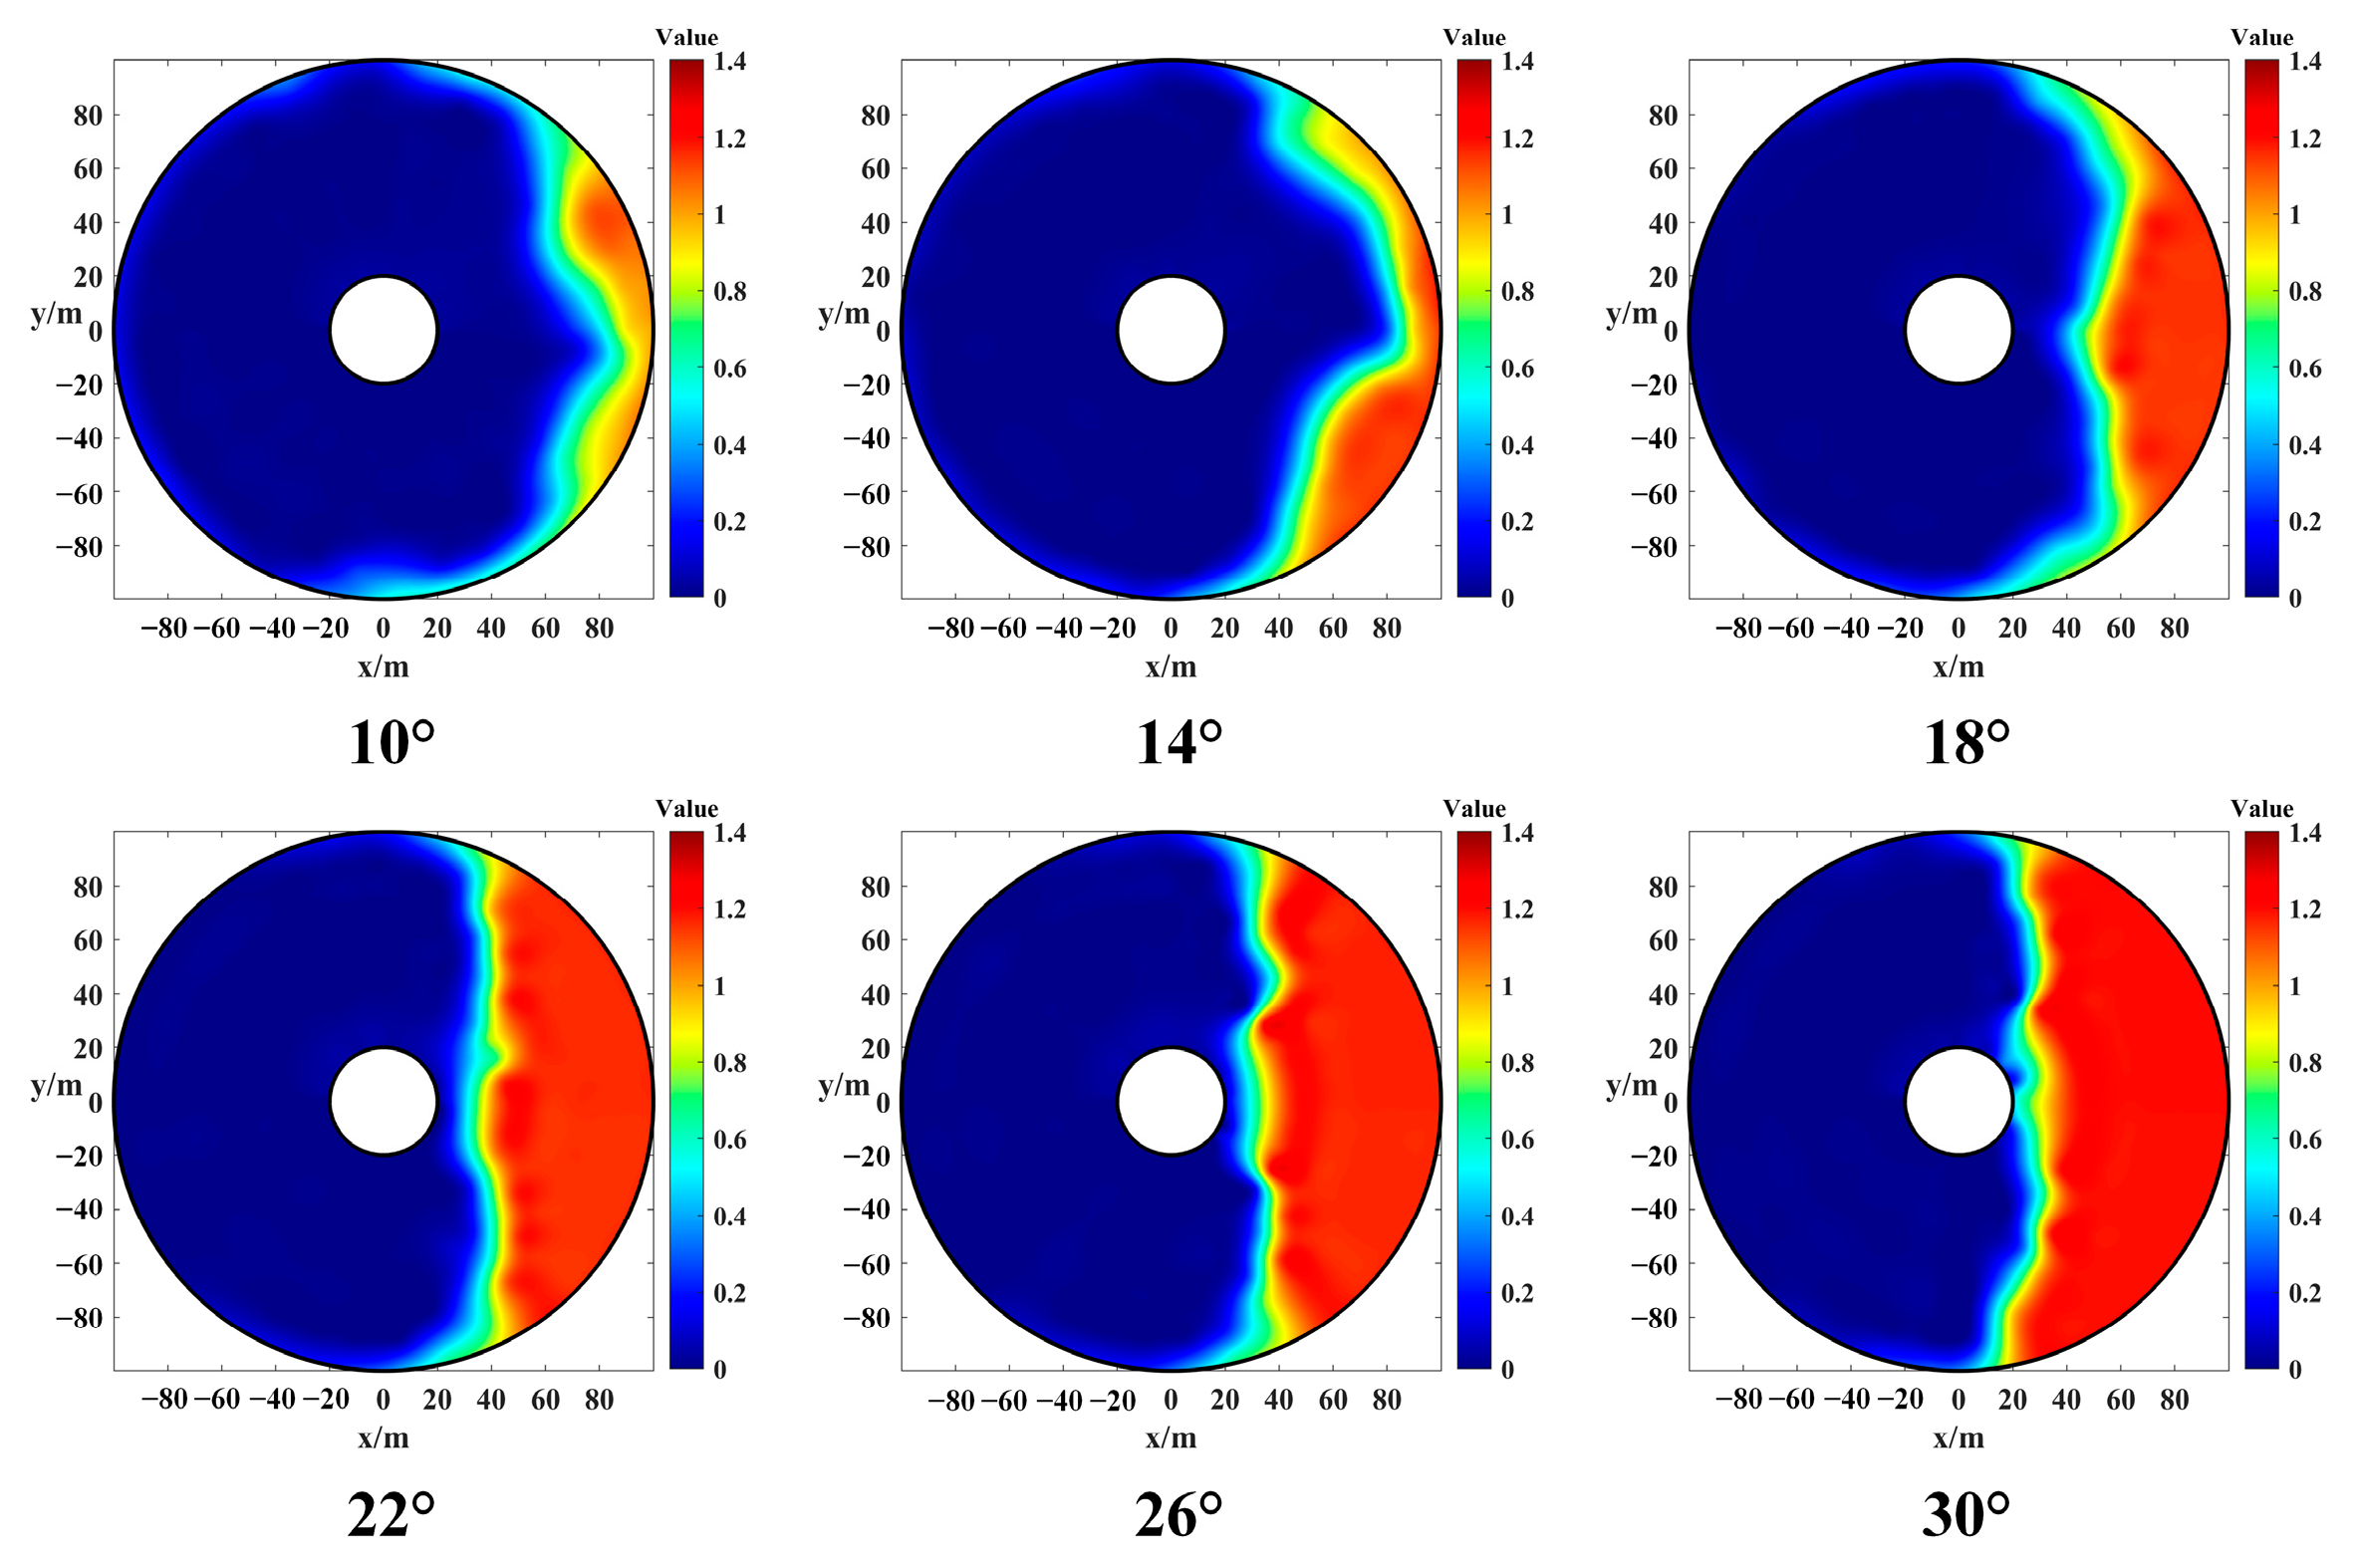
Figure 7.
The variation law of the average total pressure loss coefficient and distortion index when the flow velocity is 15 m/s.
Figure 7.
The variation law of the average total pressure loss coefficient and distortion index when the flow velocity is 15 m/s.
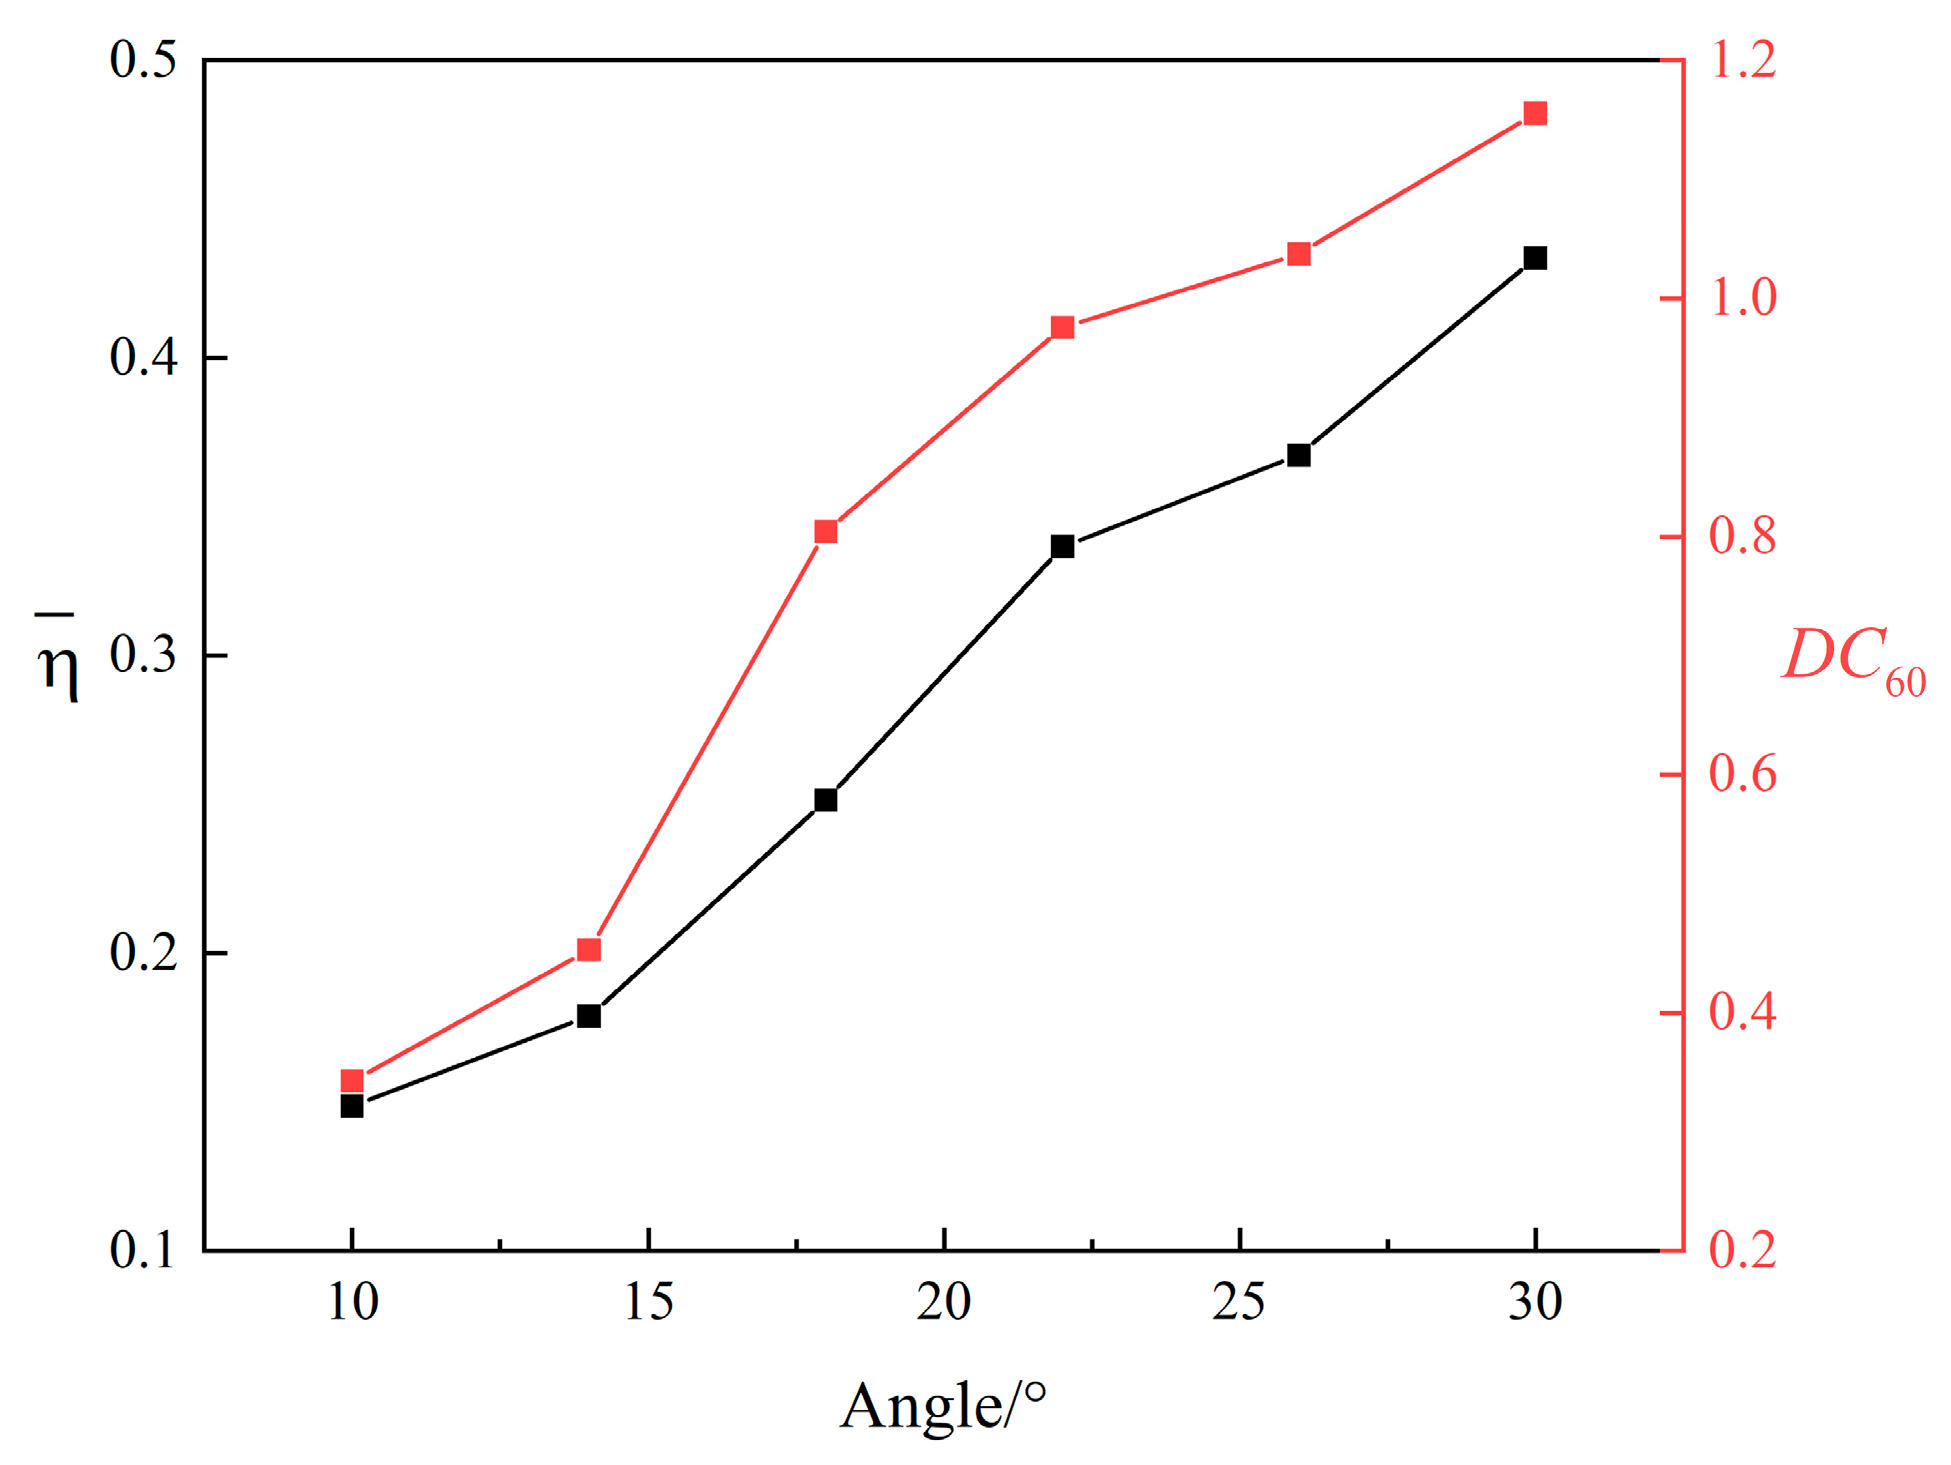
Figure 8.
The variation law of the average total pressure loss coefficient and the distortion index under different crosswind angles.
Figure 8.
The variation law of the average total pressure loss coefficient and the distortion index under different crosswind angles.

Figure 9.
The variation law of the average total pressure loss coefficient and the distortion index under different flow velocities.
Figure 9.
The variation law of the average total pressure loss coefficient and the distortion index under different flow velocities.
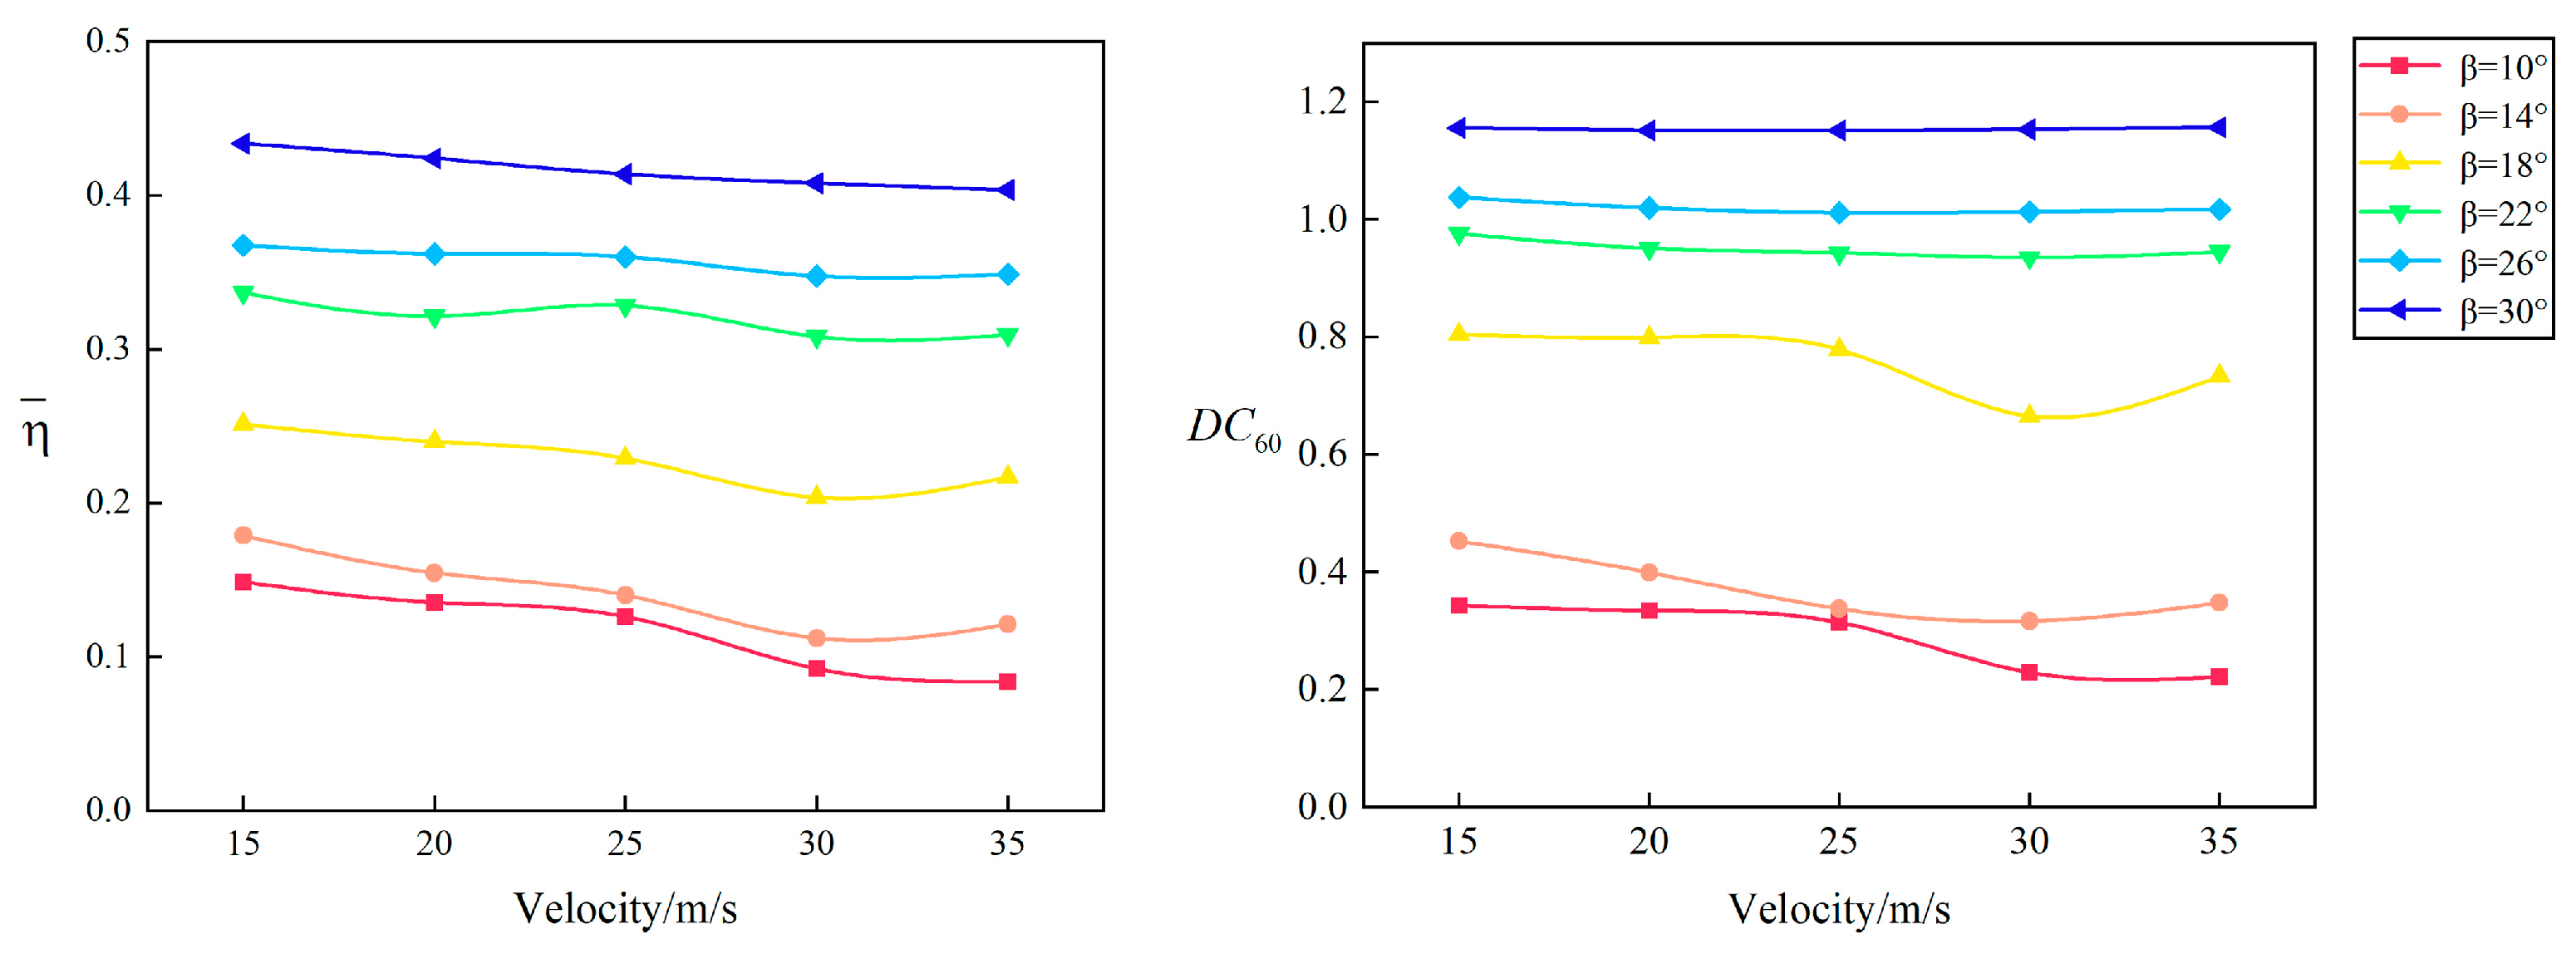
Figure 10.
Cloud map of total pressure loss coefficient at different actuation frequencies under experimental condition 1.
Figure 10.
Cloud map of total pressure loss coefficient at different actuation frequencies under experimental condition 1.
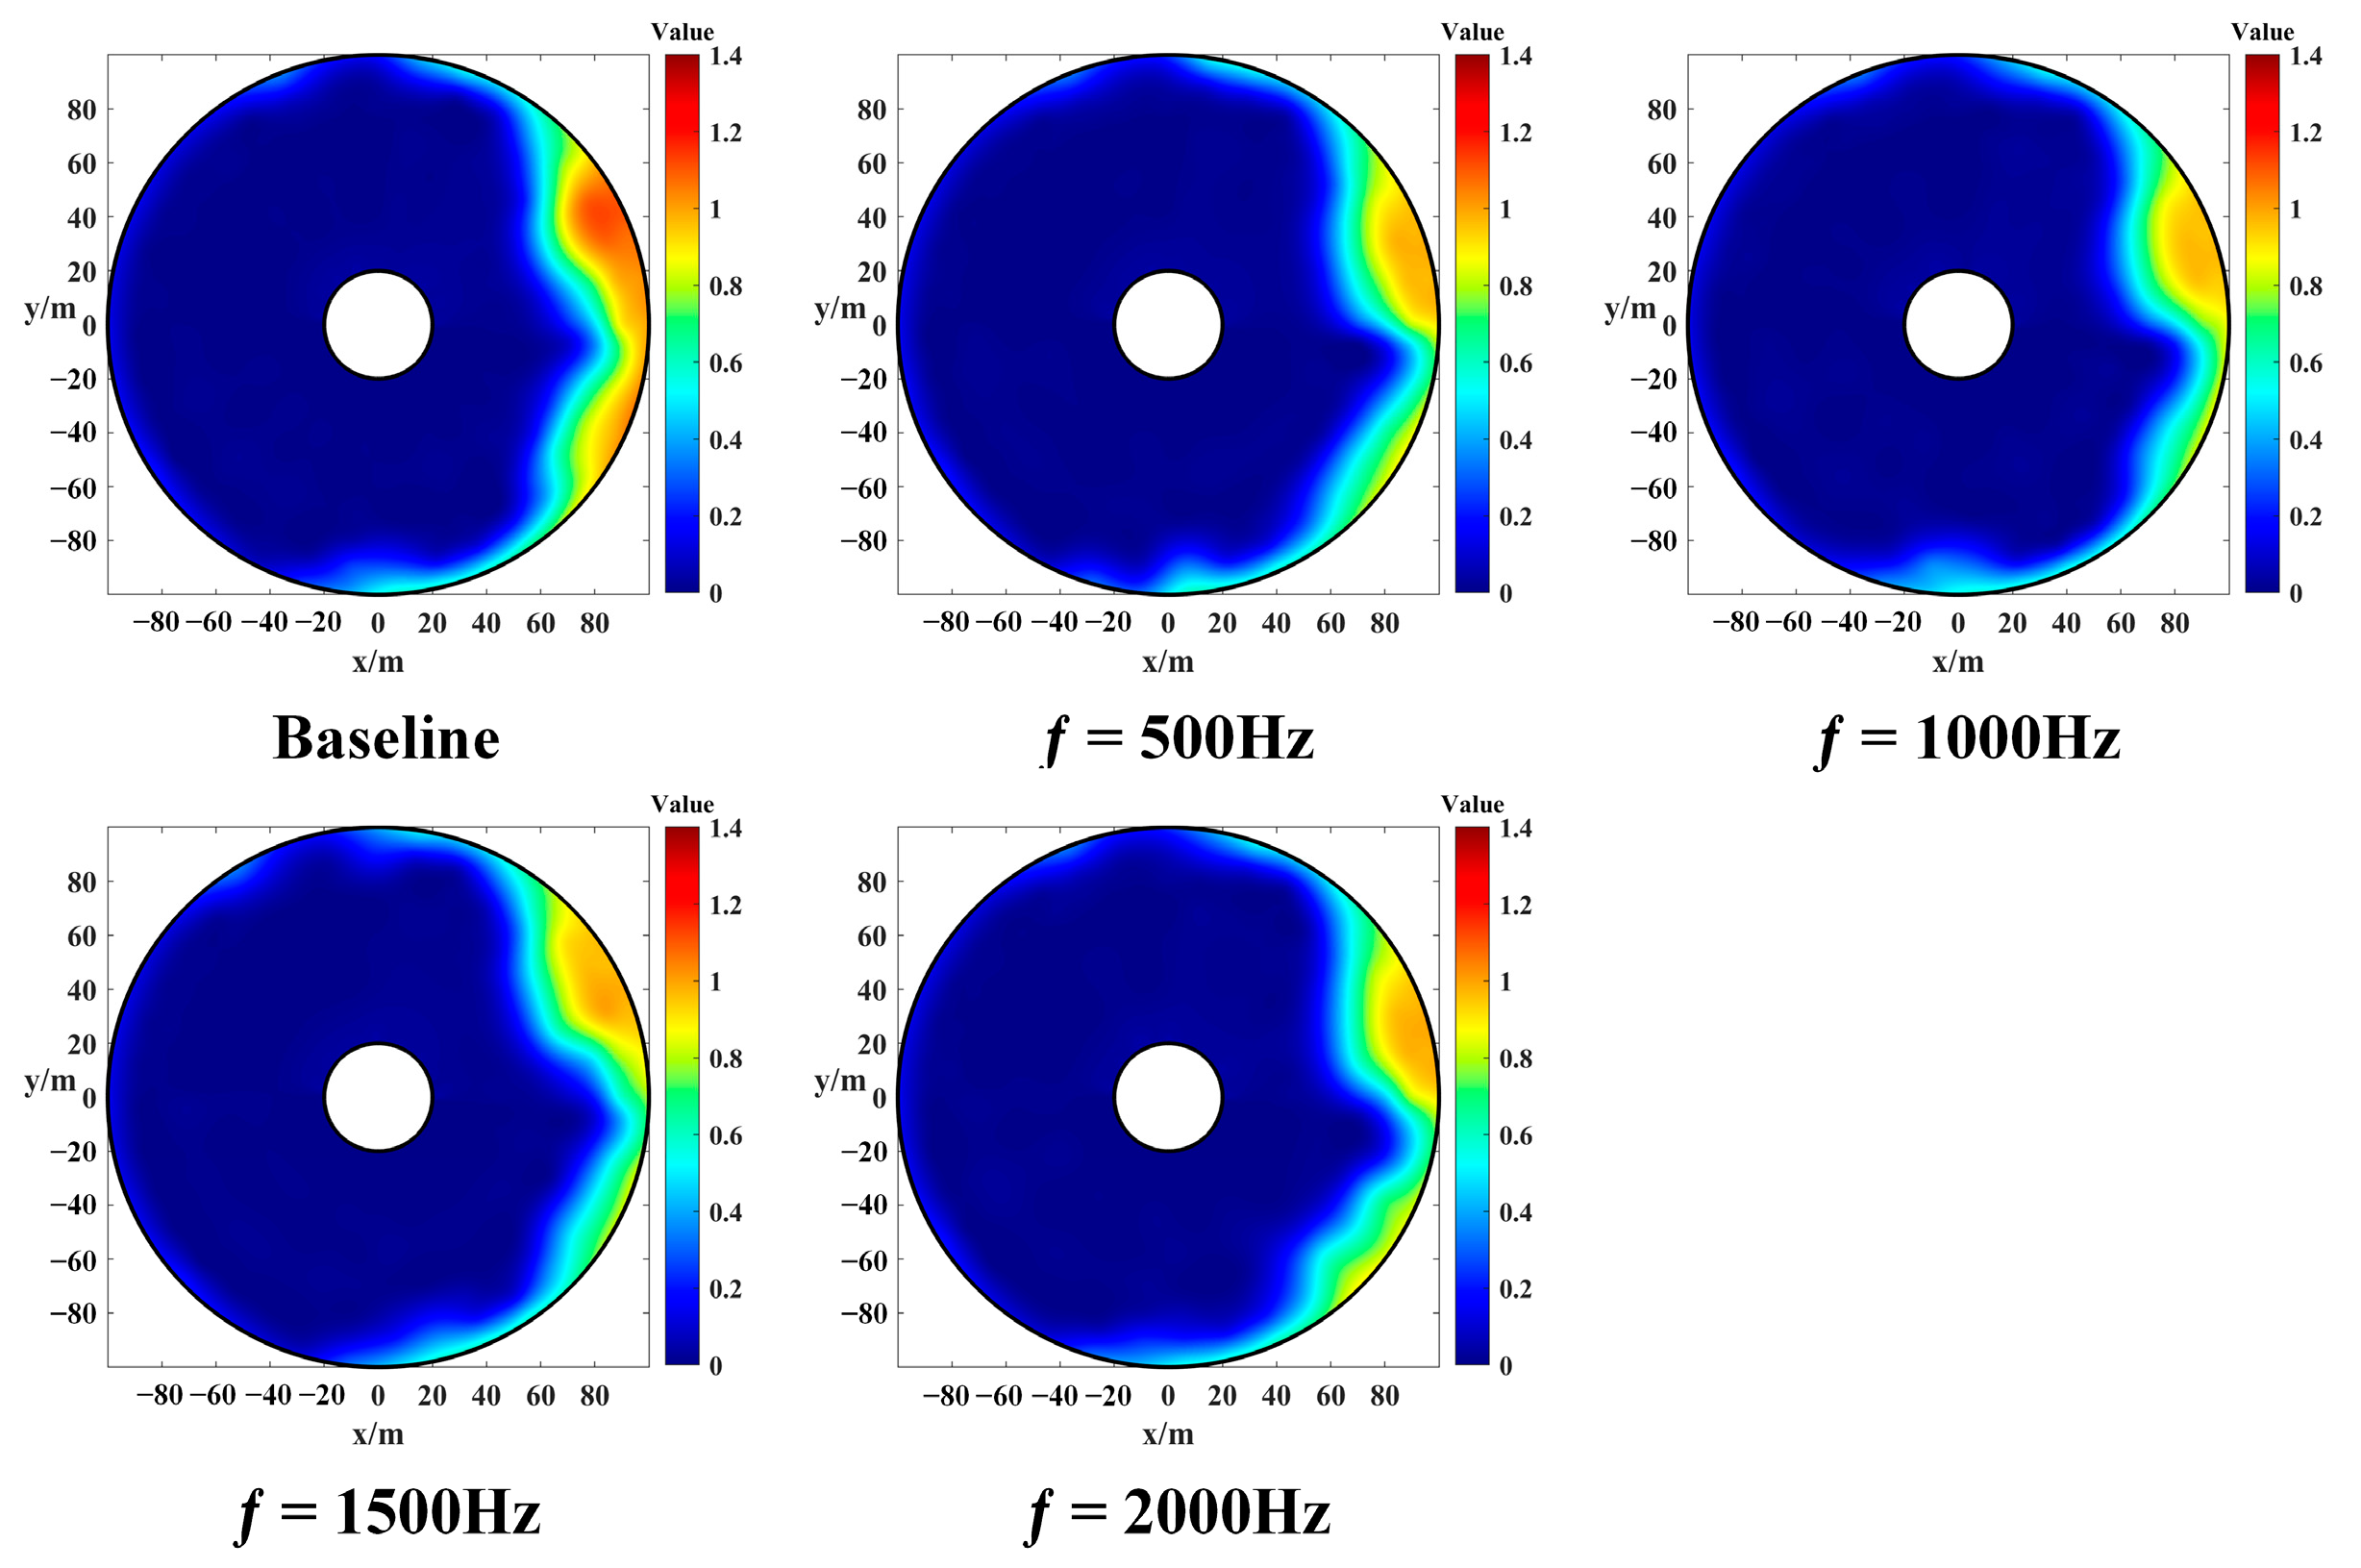
Figure 11.
The variation law of the average total pressure loss coefficient and the distortion index at different actuation frequencies under experimental condition 1.
Figure 11.
The variation law of the average total pressure loss coefficient and the distortion index at different actuation frequencies under experimental condition 1.
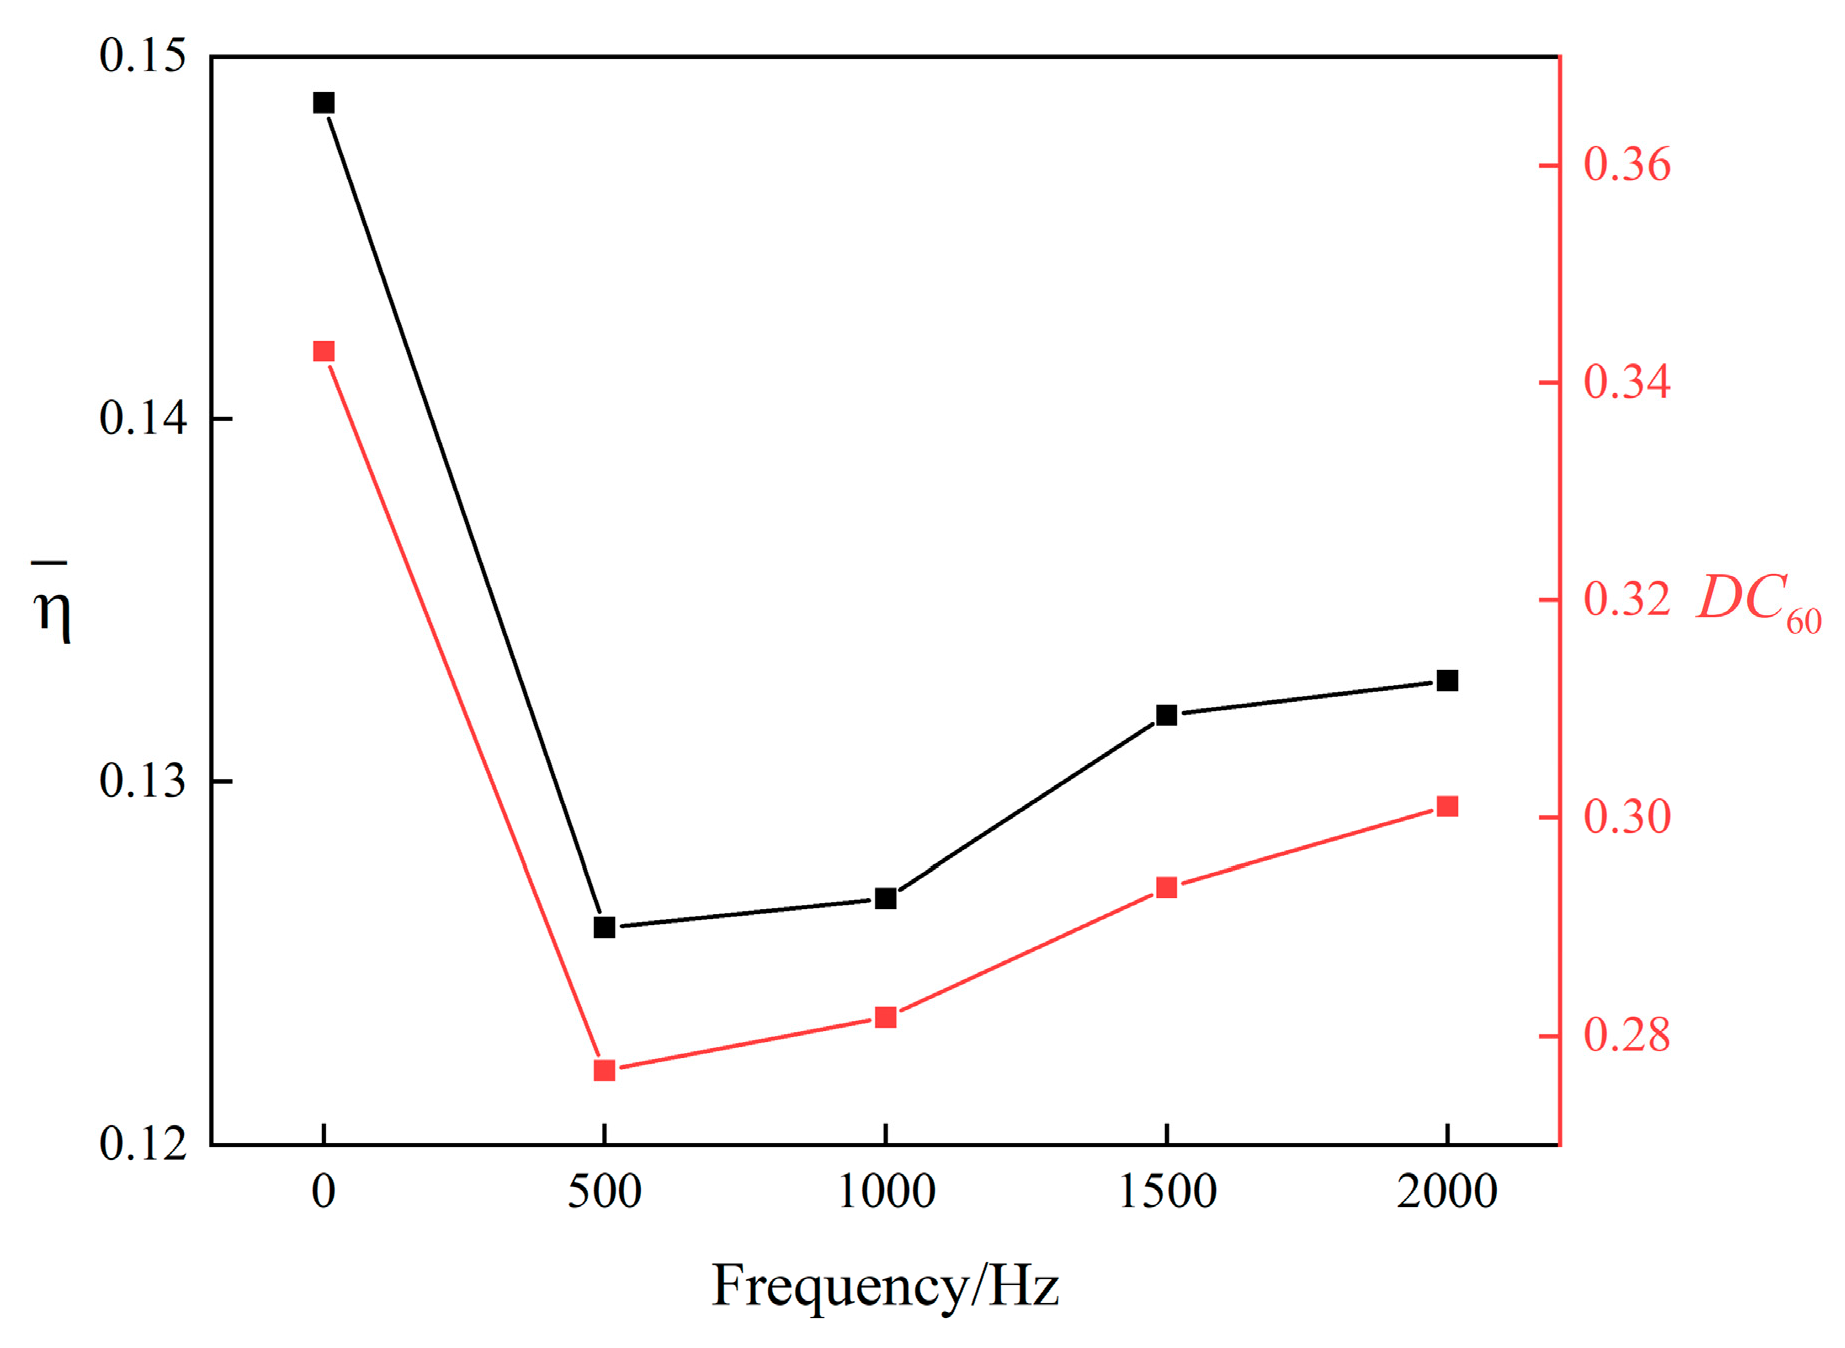
Figure 12.
Cloud map of total pressure loss coefficient at different actuation frequencies under experimental condition 2.
Figure 12.
Cloud map of total pressure loss coefficient at different actuation frequencies under experimental condition 2.
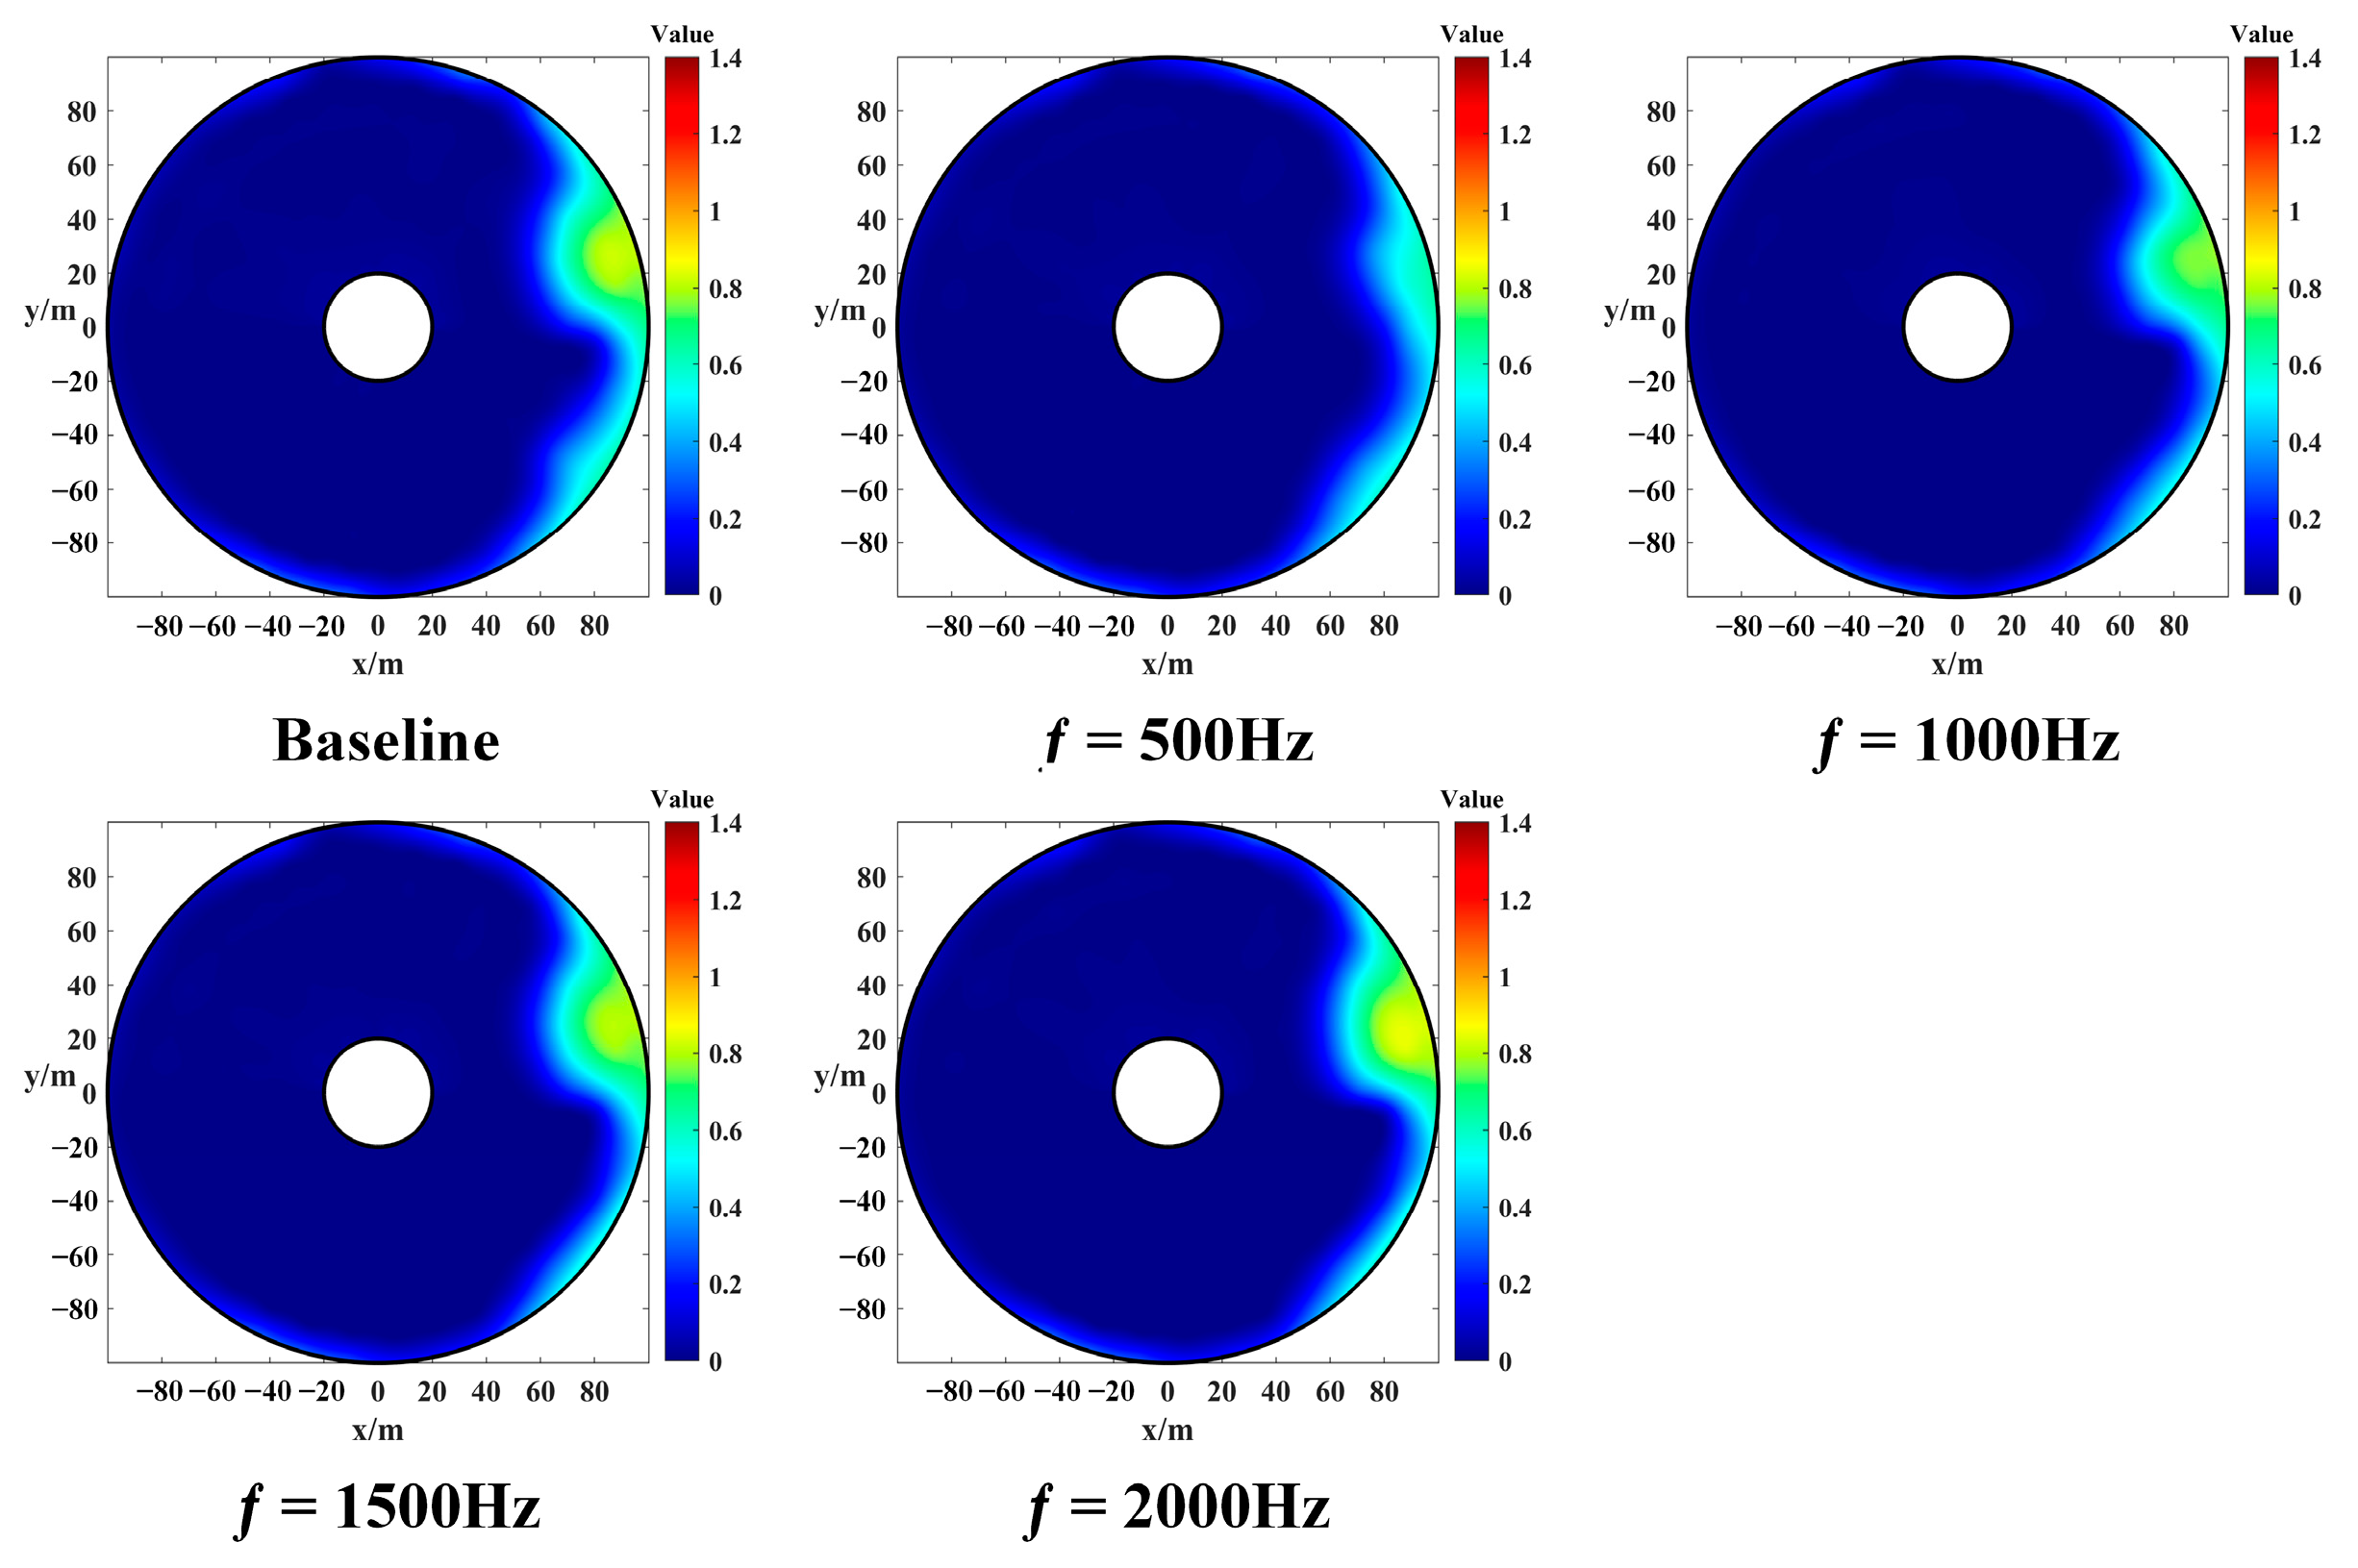
Figure 13.
The variation law of the average total pressure loss coefficient and the distortion index at different actuation frequencies under experimental condition 2.
Figure 13.
The variation law of the average total pressure loss coefficient and the distortion index at different actuation frequencies under experimental condition 2.
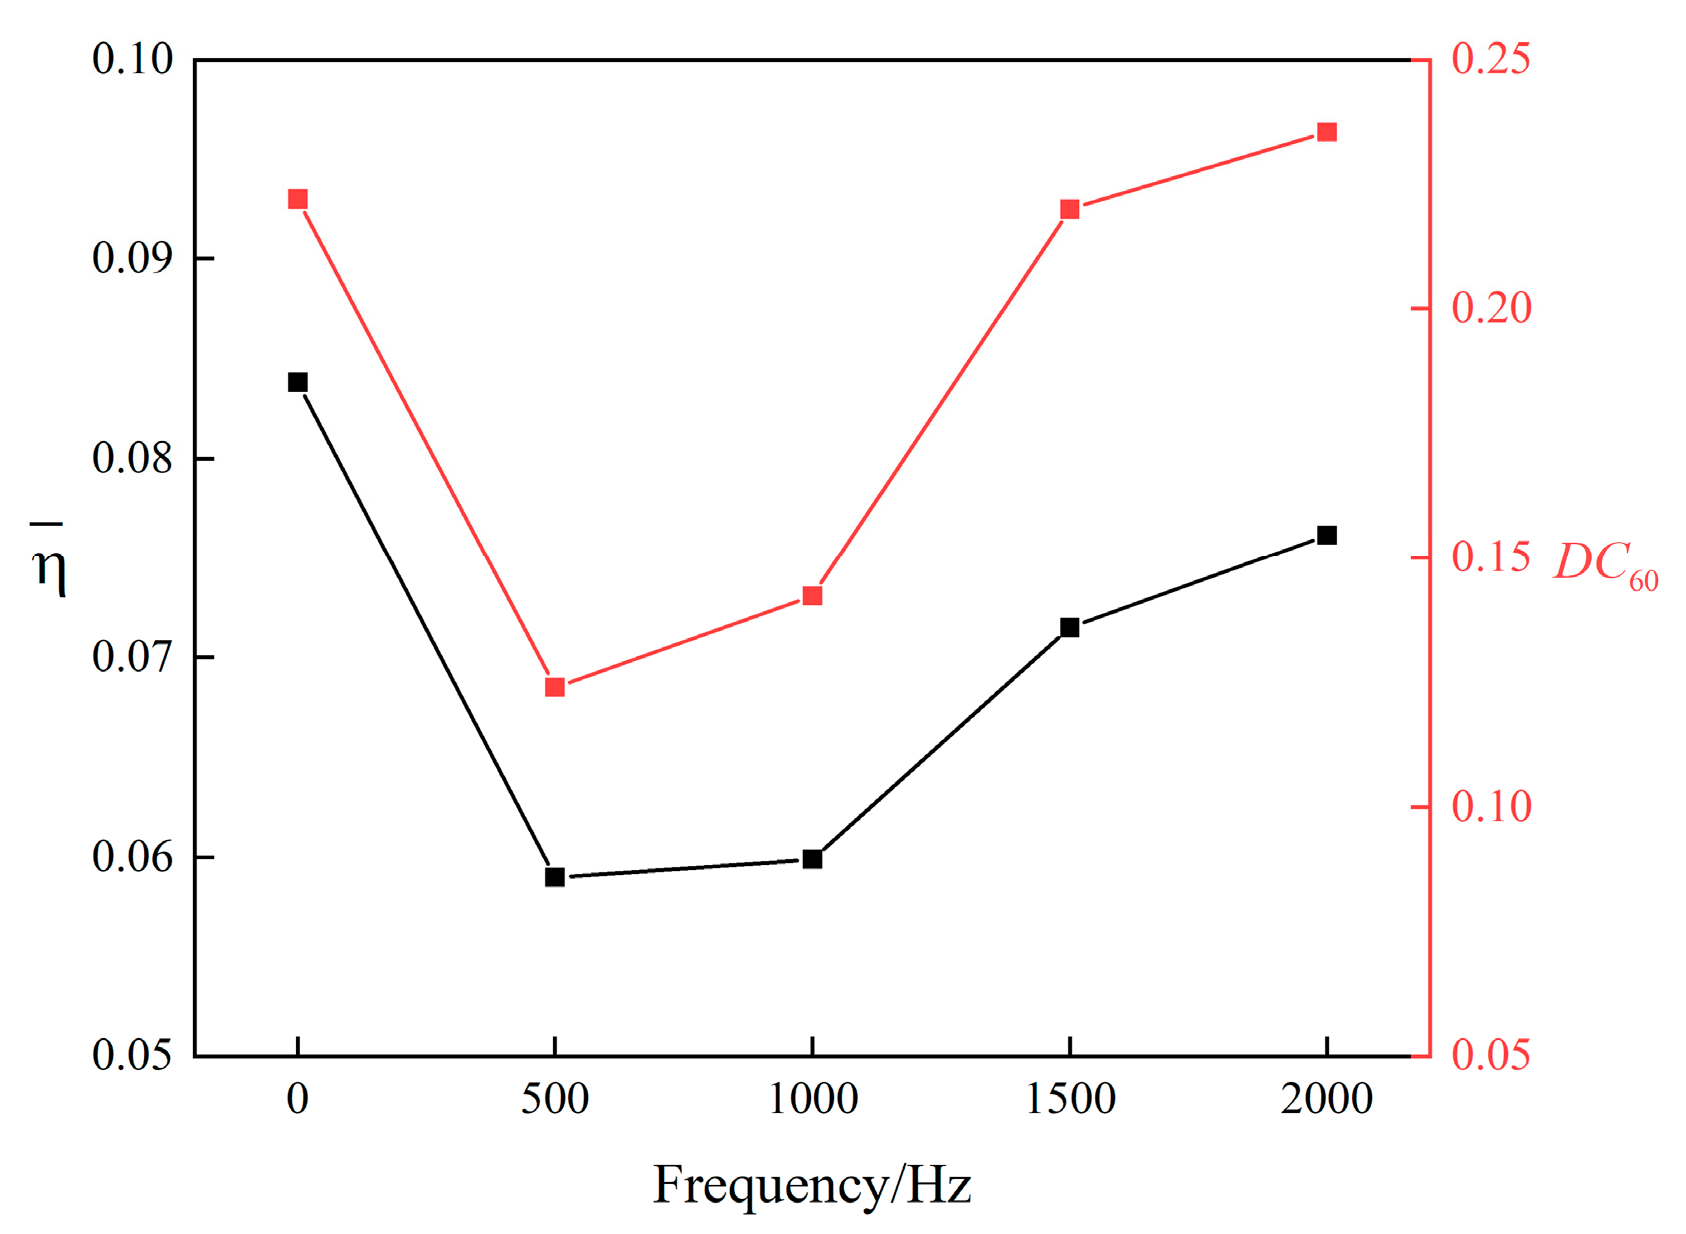
Figure 14.
The variation law of the average total pressure loss coefficient and the distortion index at different actuation frequencies.
Figure 14.
The variation law of the average total pressure loss coefficient and the distortion index at different actuation frequencies.
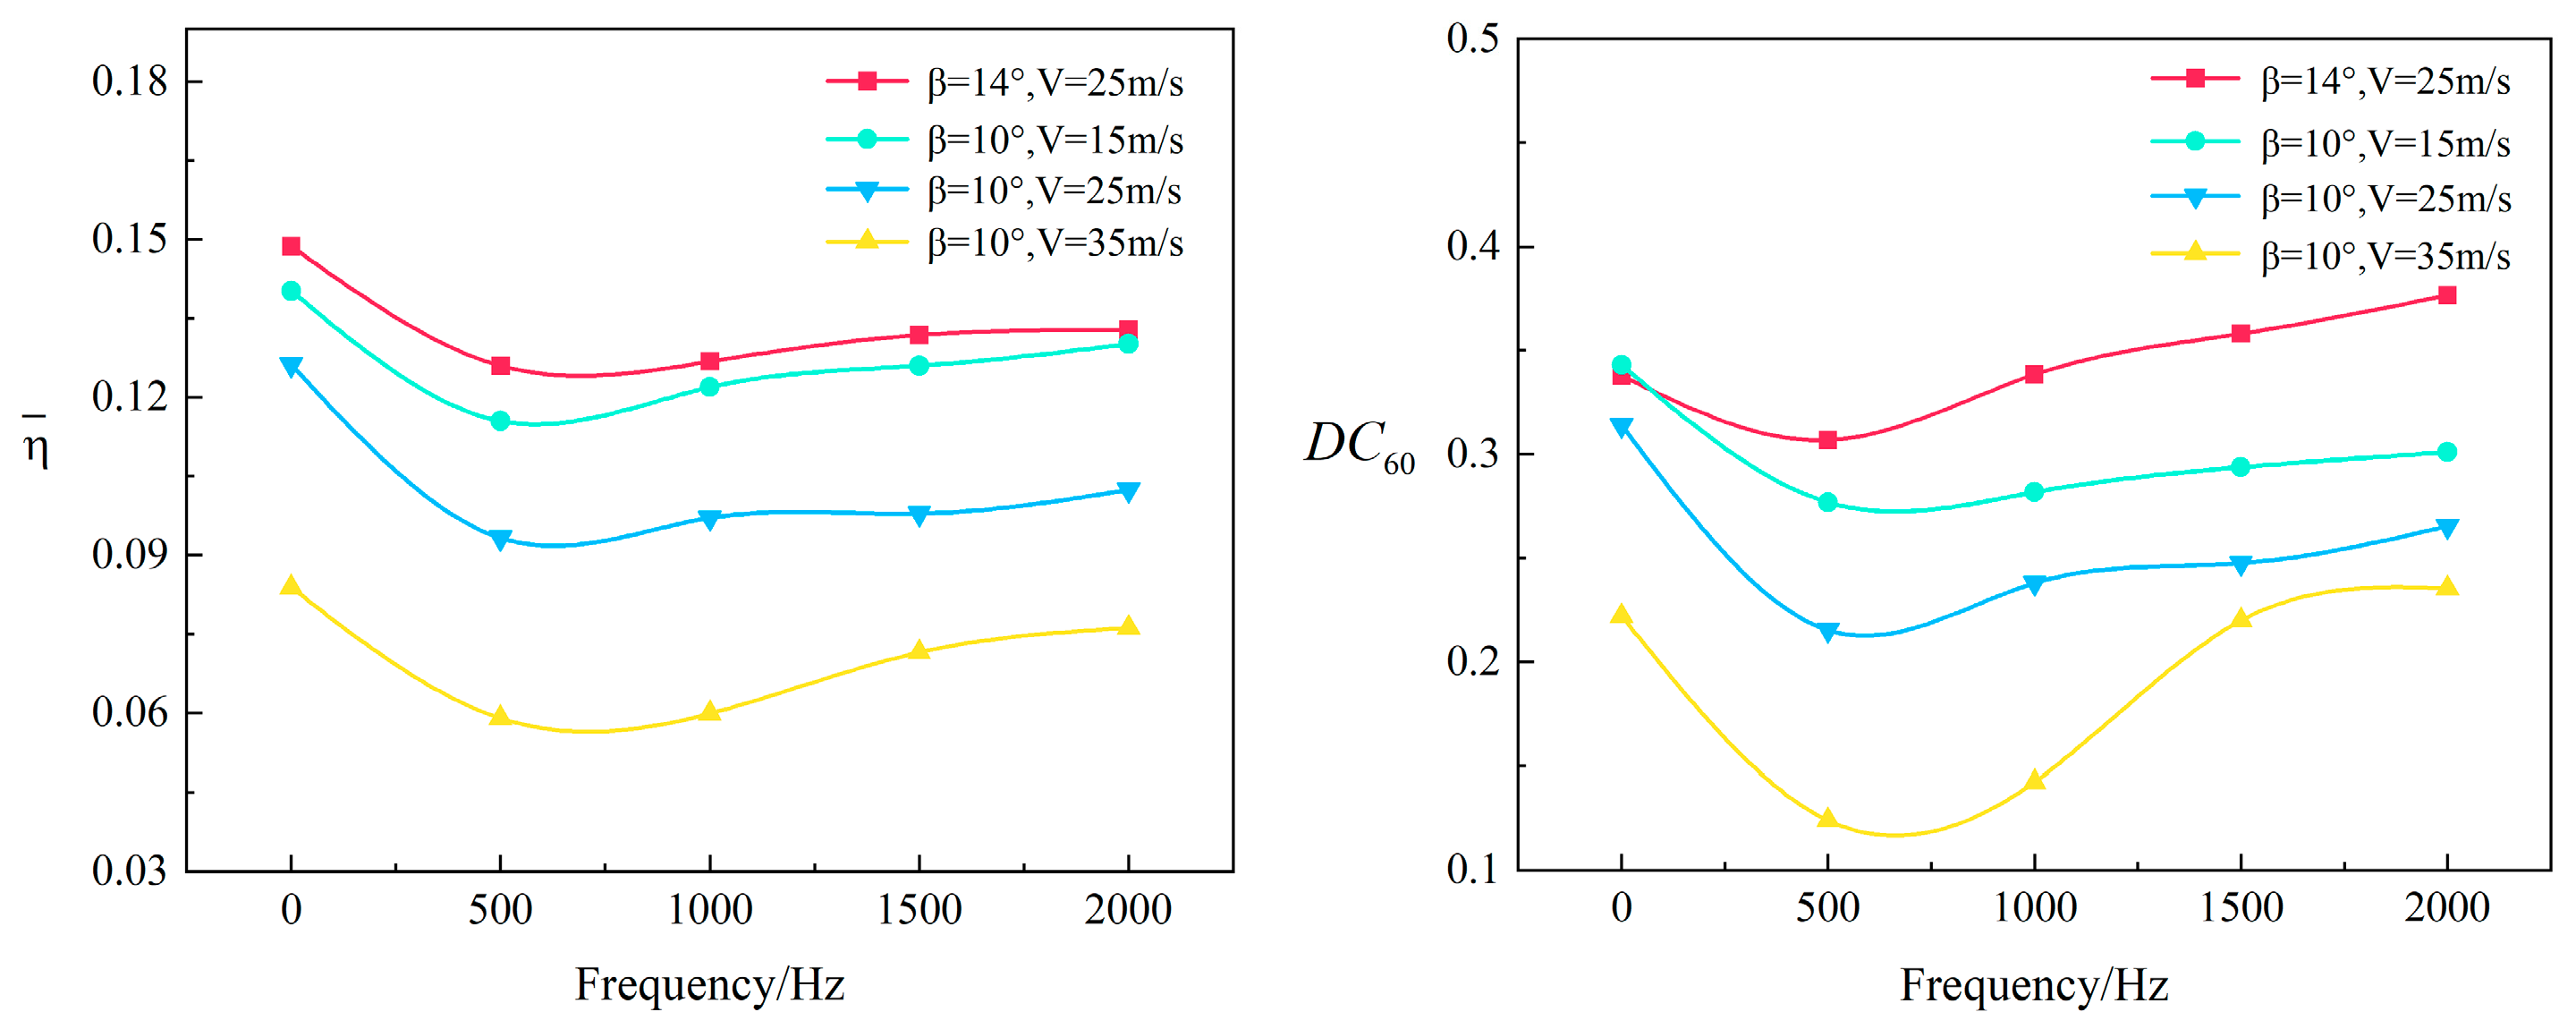
Figure 15.
Cloud map of total pressure loss coefficient at different actuation frequencies under experimental condition 5.
Figure 15.
Cloud map of total pressure loss coefficient at different actuation frequencies under experimental condition 5.
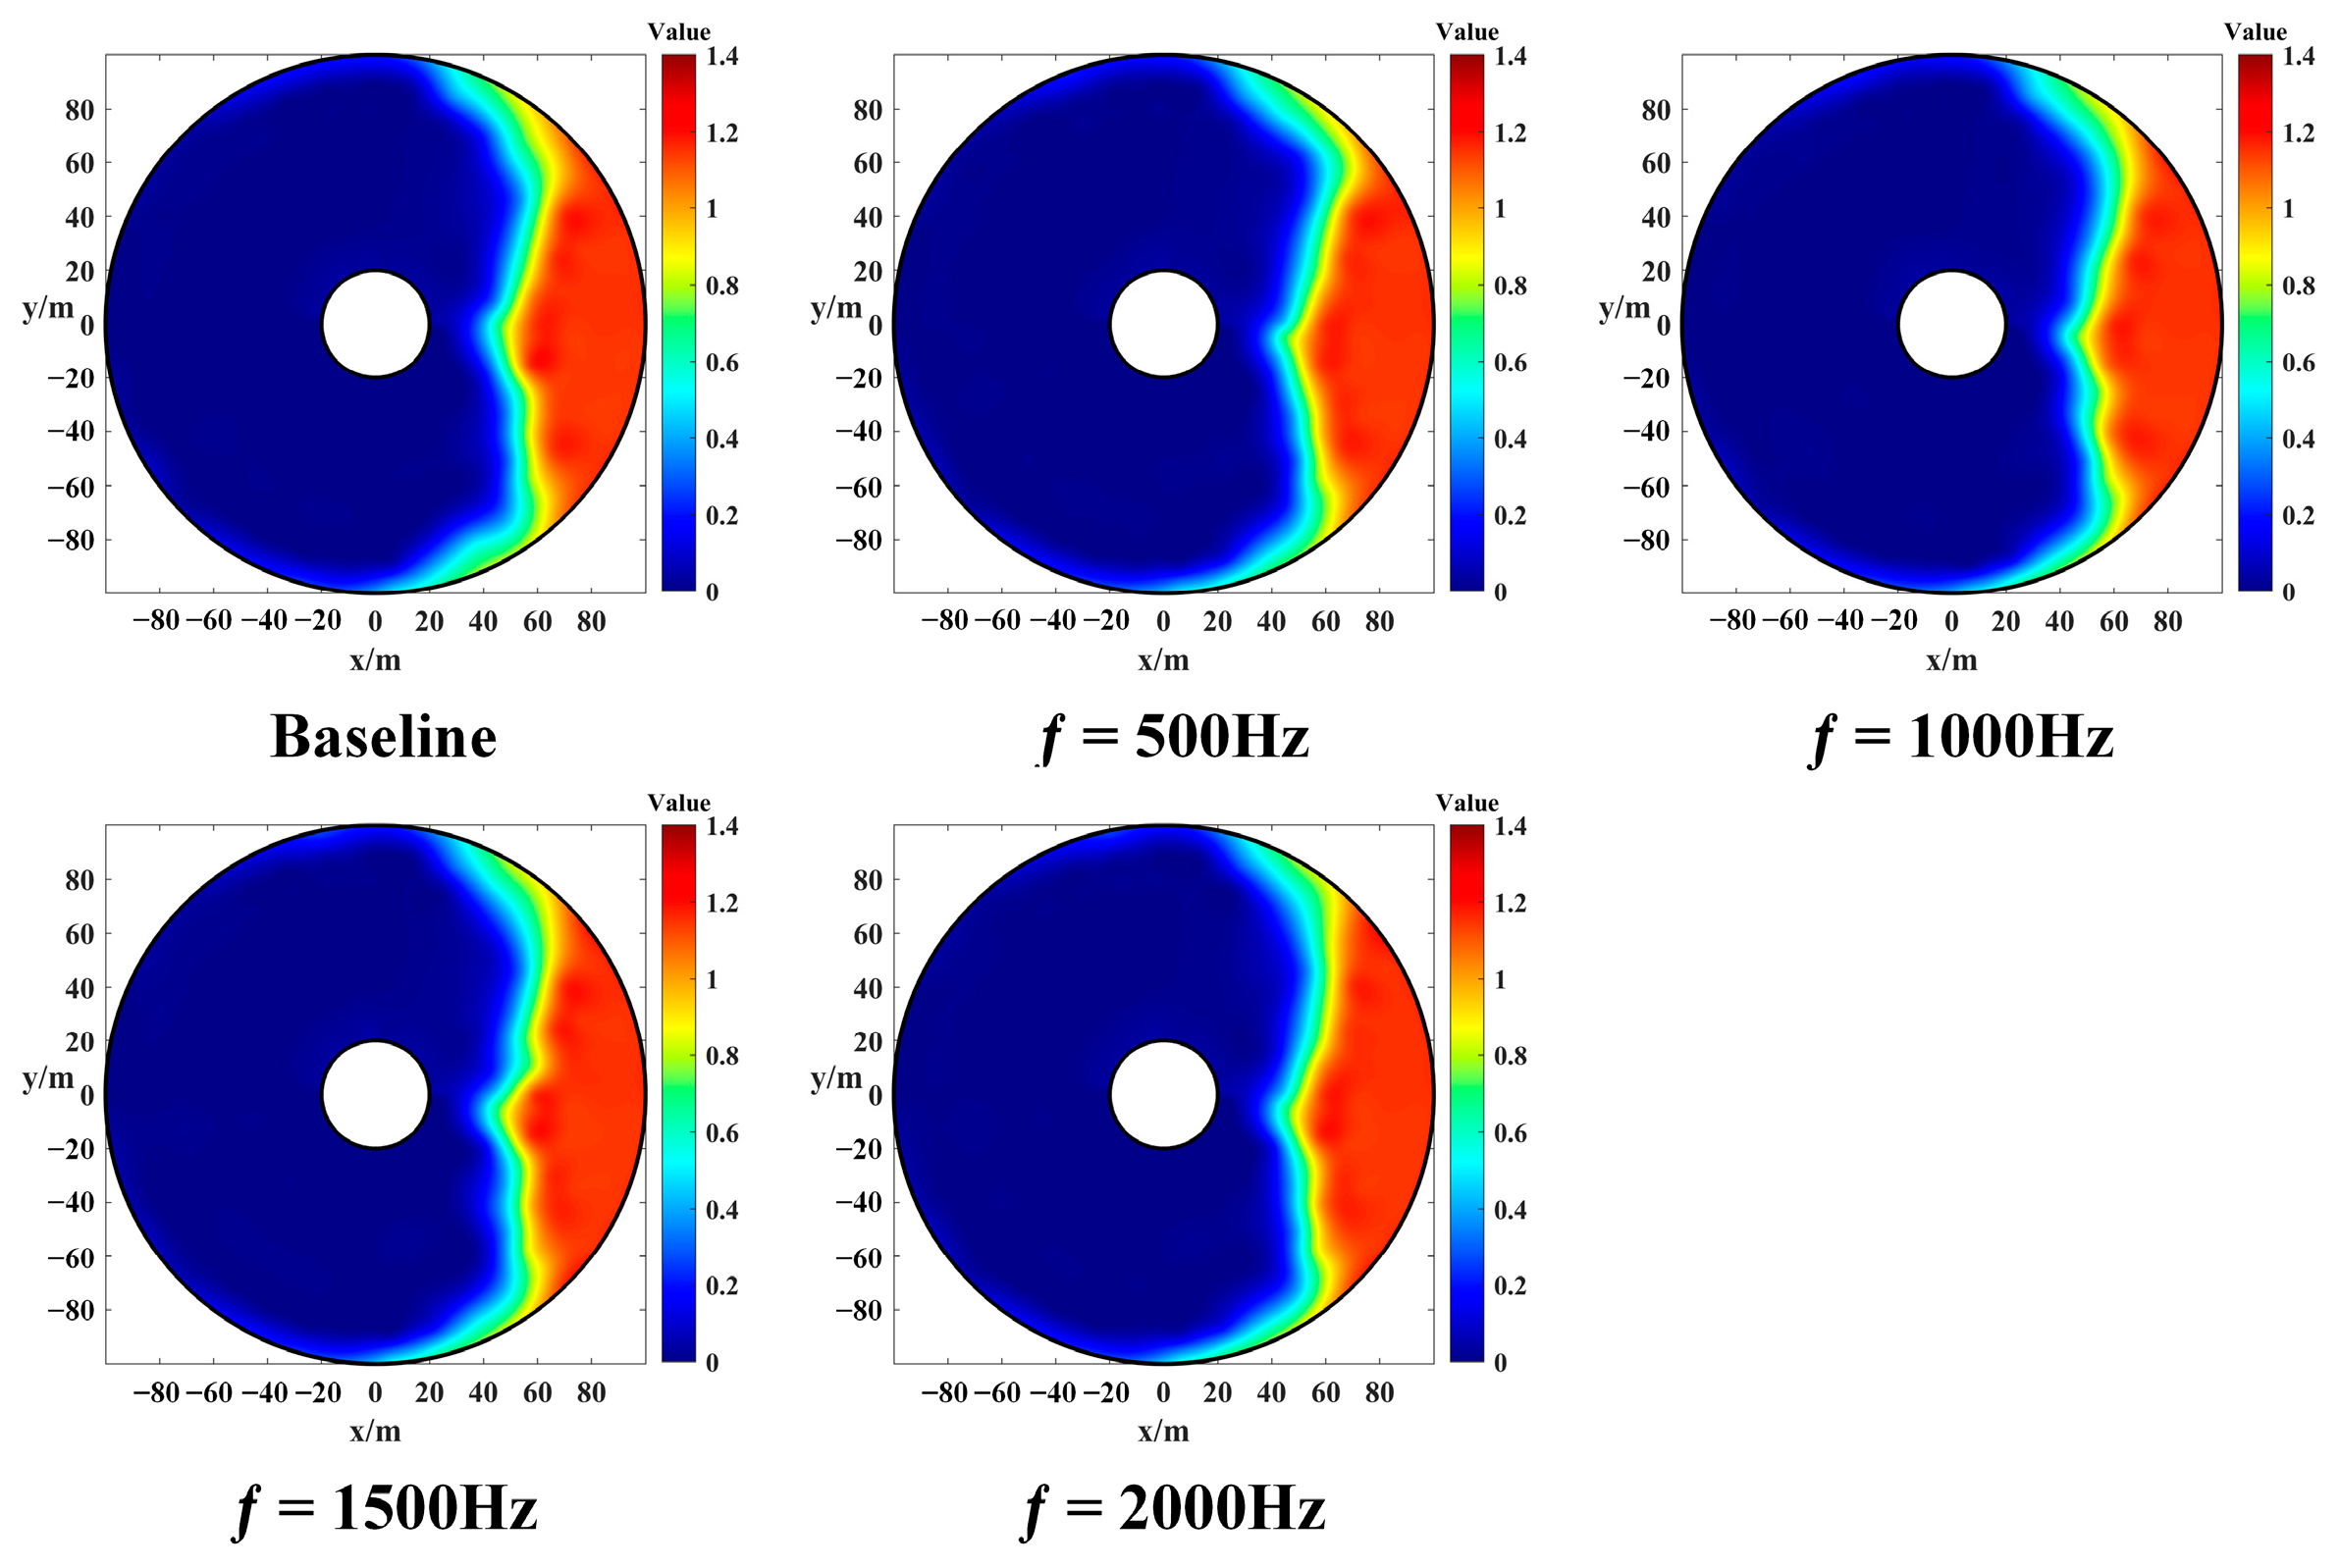
Figure 16.
The variation law of the average total pressure loss coefficient and the distortion index at different actuation frequencies under experimental condition 5.
Figure 16.
The variation law of the average total pressure loss coefficient and the distortion index at different actuation frequencies under experimental condition 5.
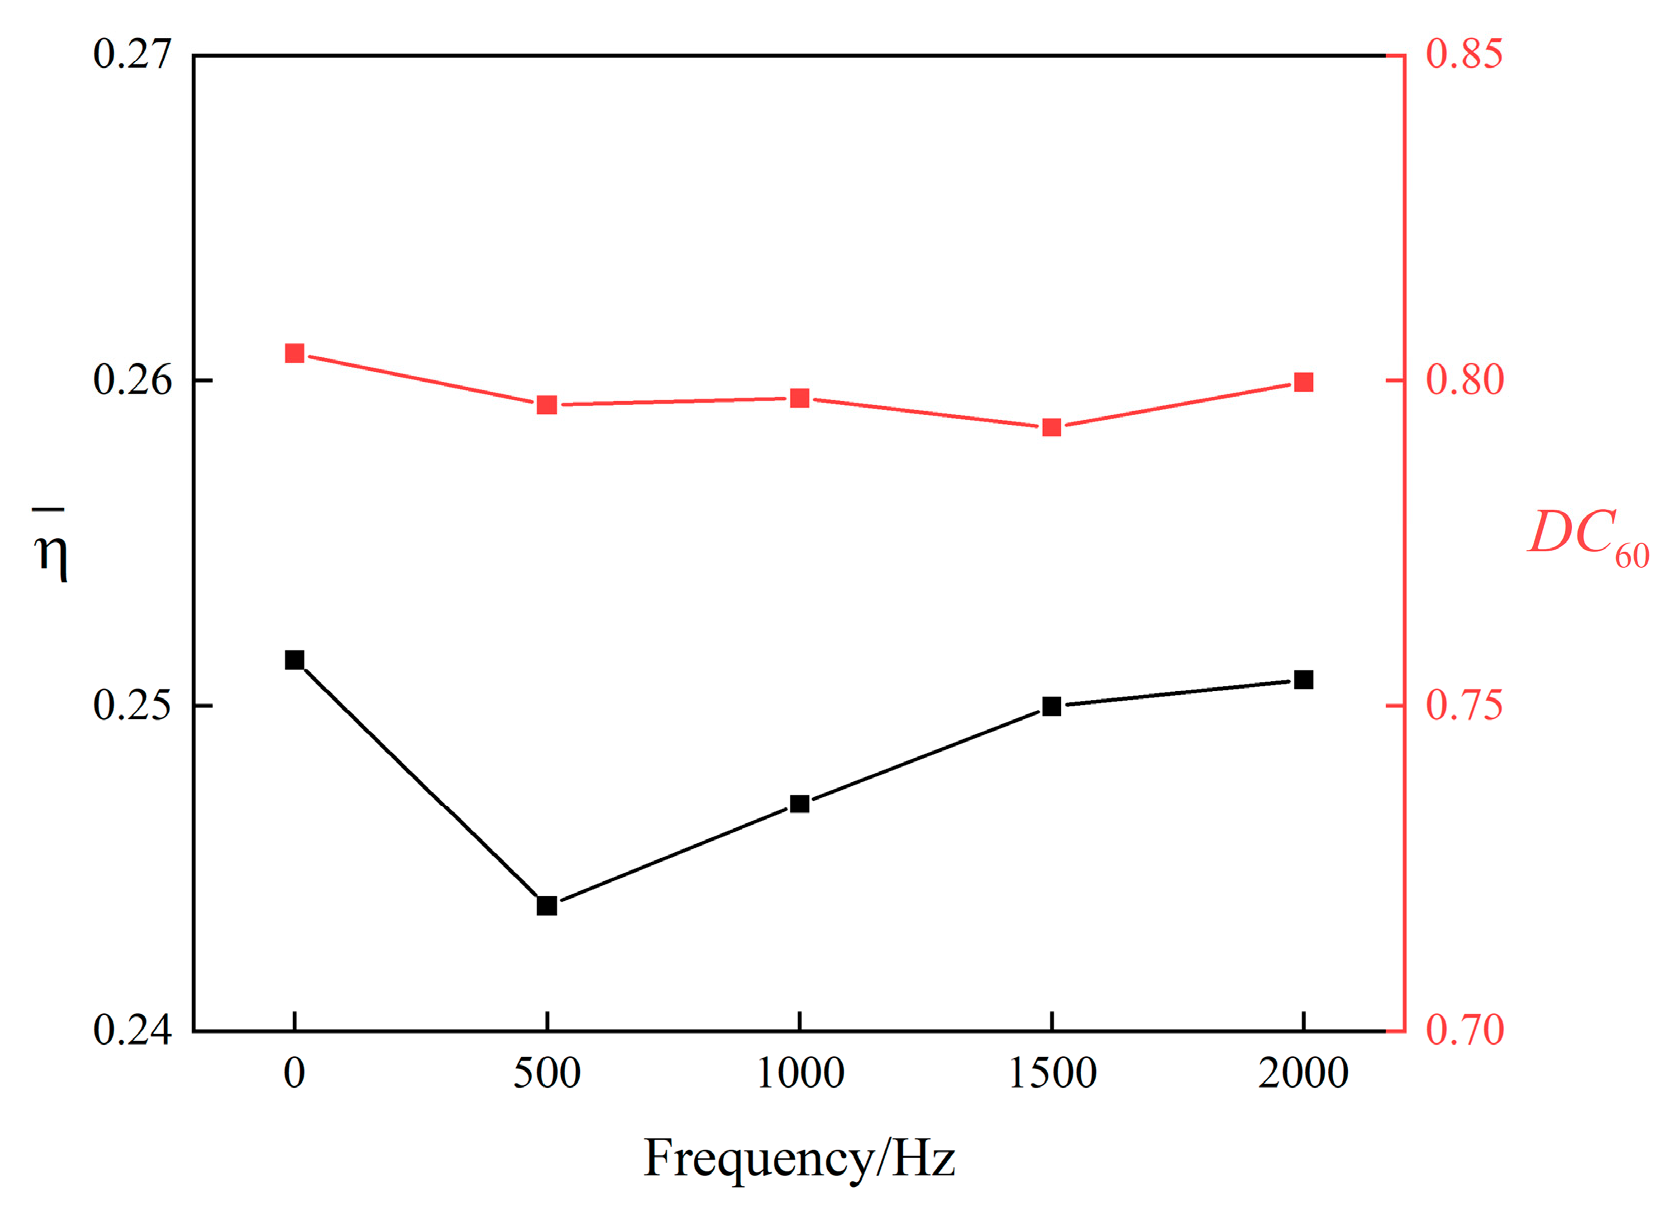
Figure 17.
Cloud map of actuation effect comparison between NS-DBD and AC-DBD under experimental condition 3.
Figure 17.
Cloud map of actuation effect comparison between NS-DBD and AC-DBD under experimental condition 3.
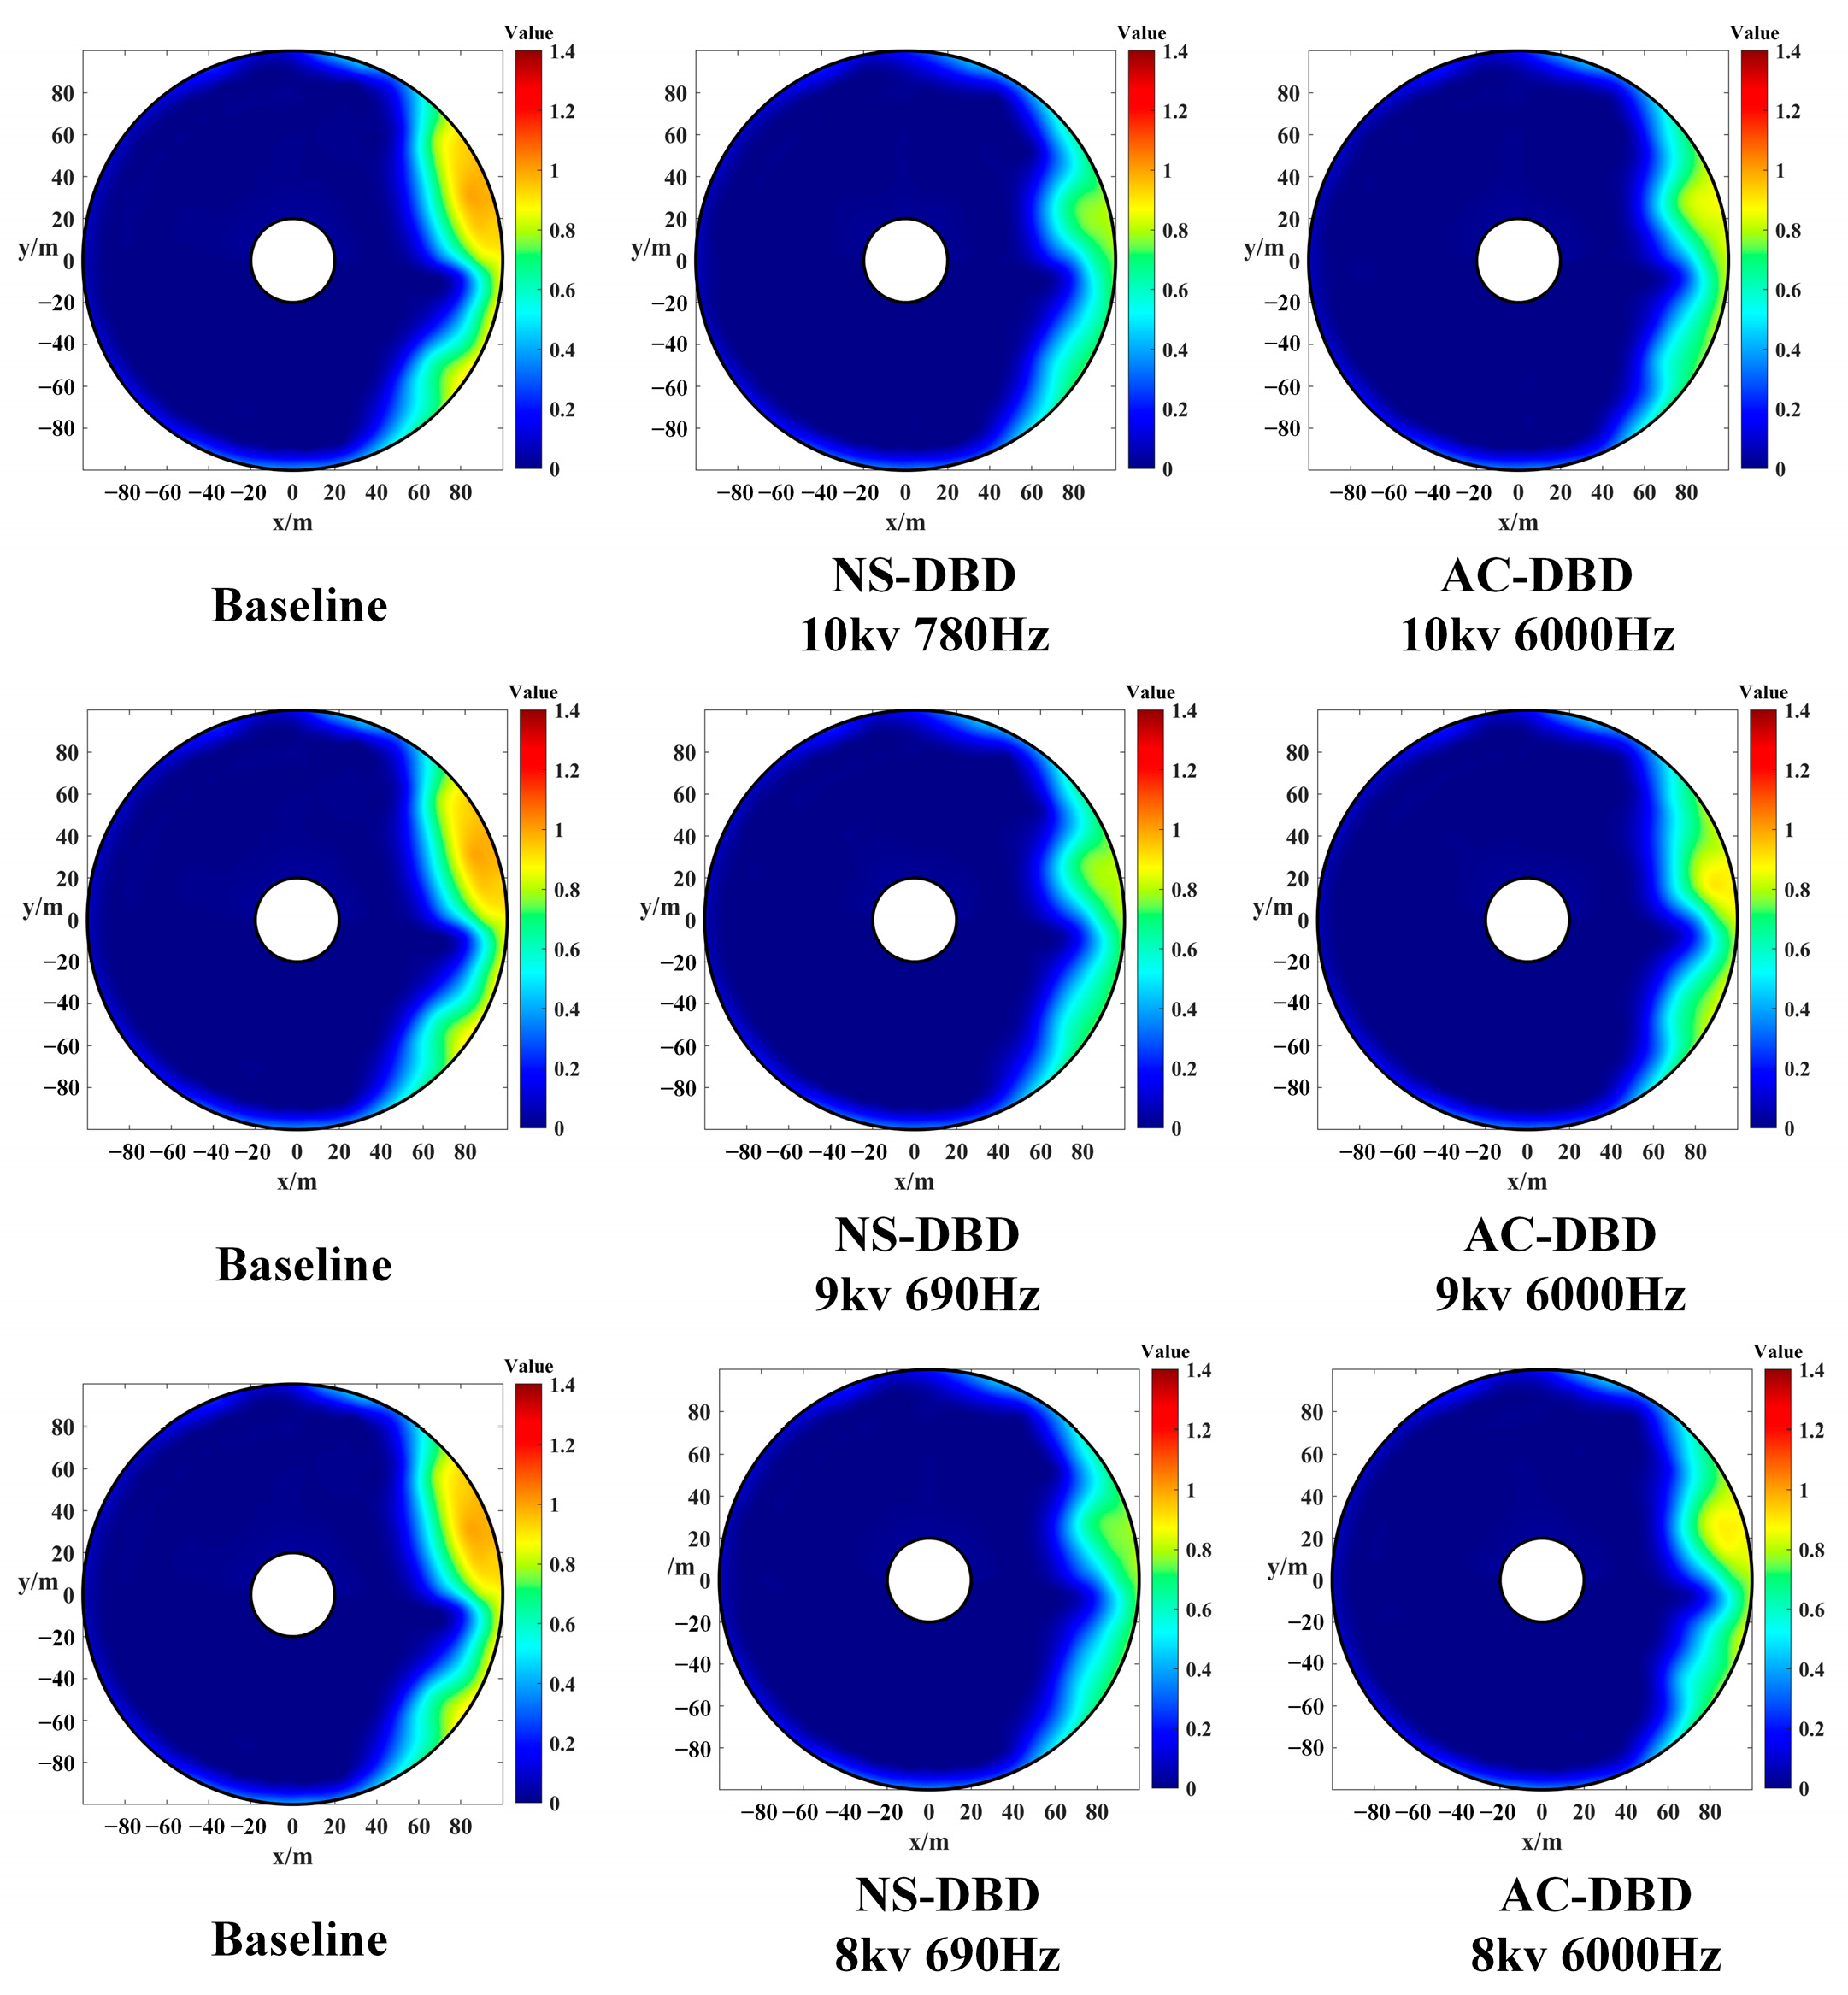
Figure 18.
Comparative histogram of the effect of NS-DBD and AC-DBD under experimental condition 3.
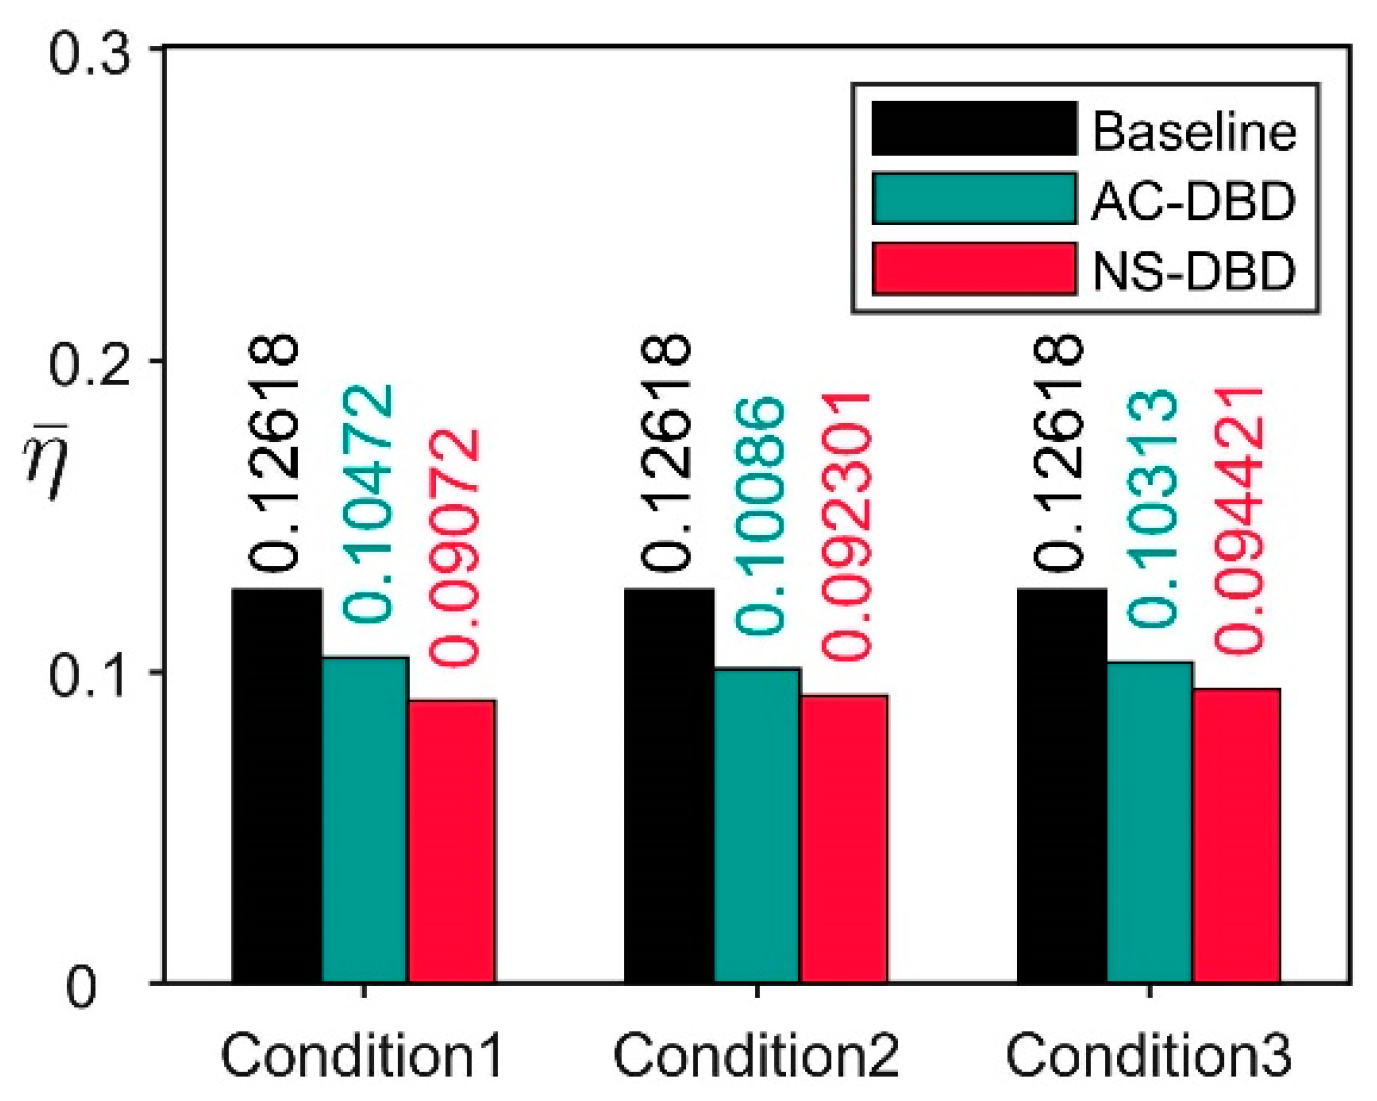
Figure 19.
Comparative histogram of the effect of NS-DBD and AC-DBD under different experimental conditions.
Figure 19.
Comparative histogram of the effect of NS-DBD and AC-DBD under different experimental conditions.
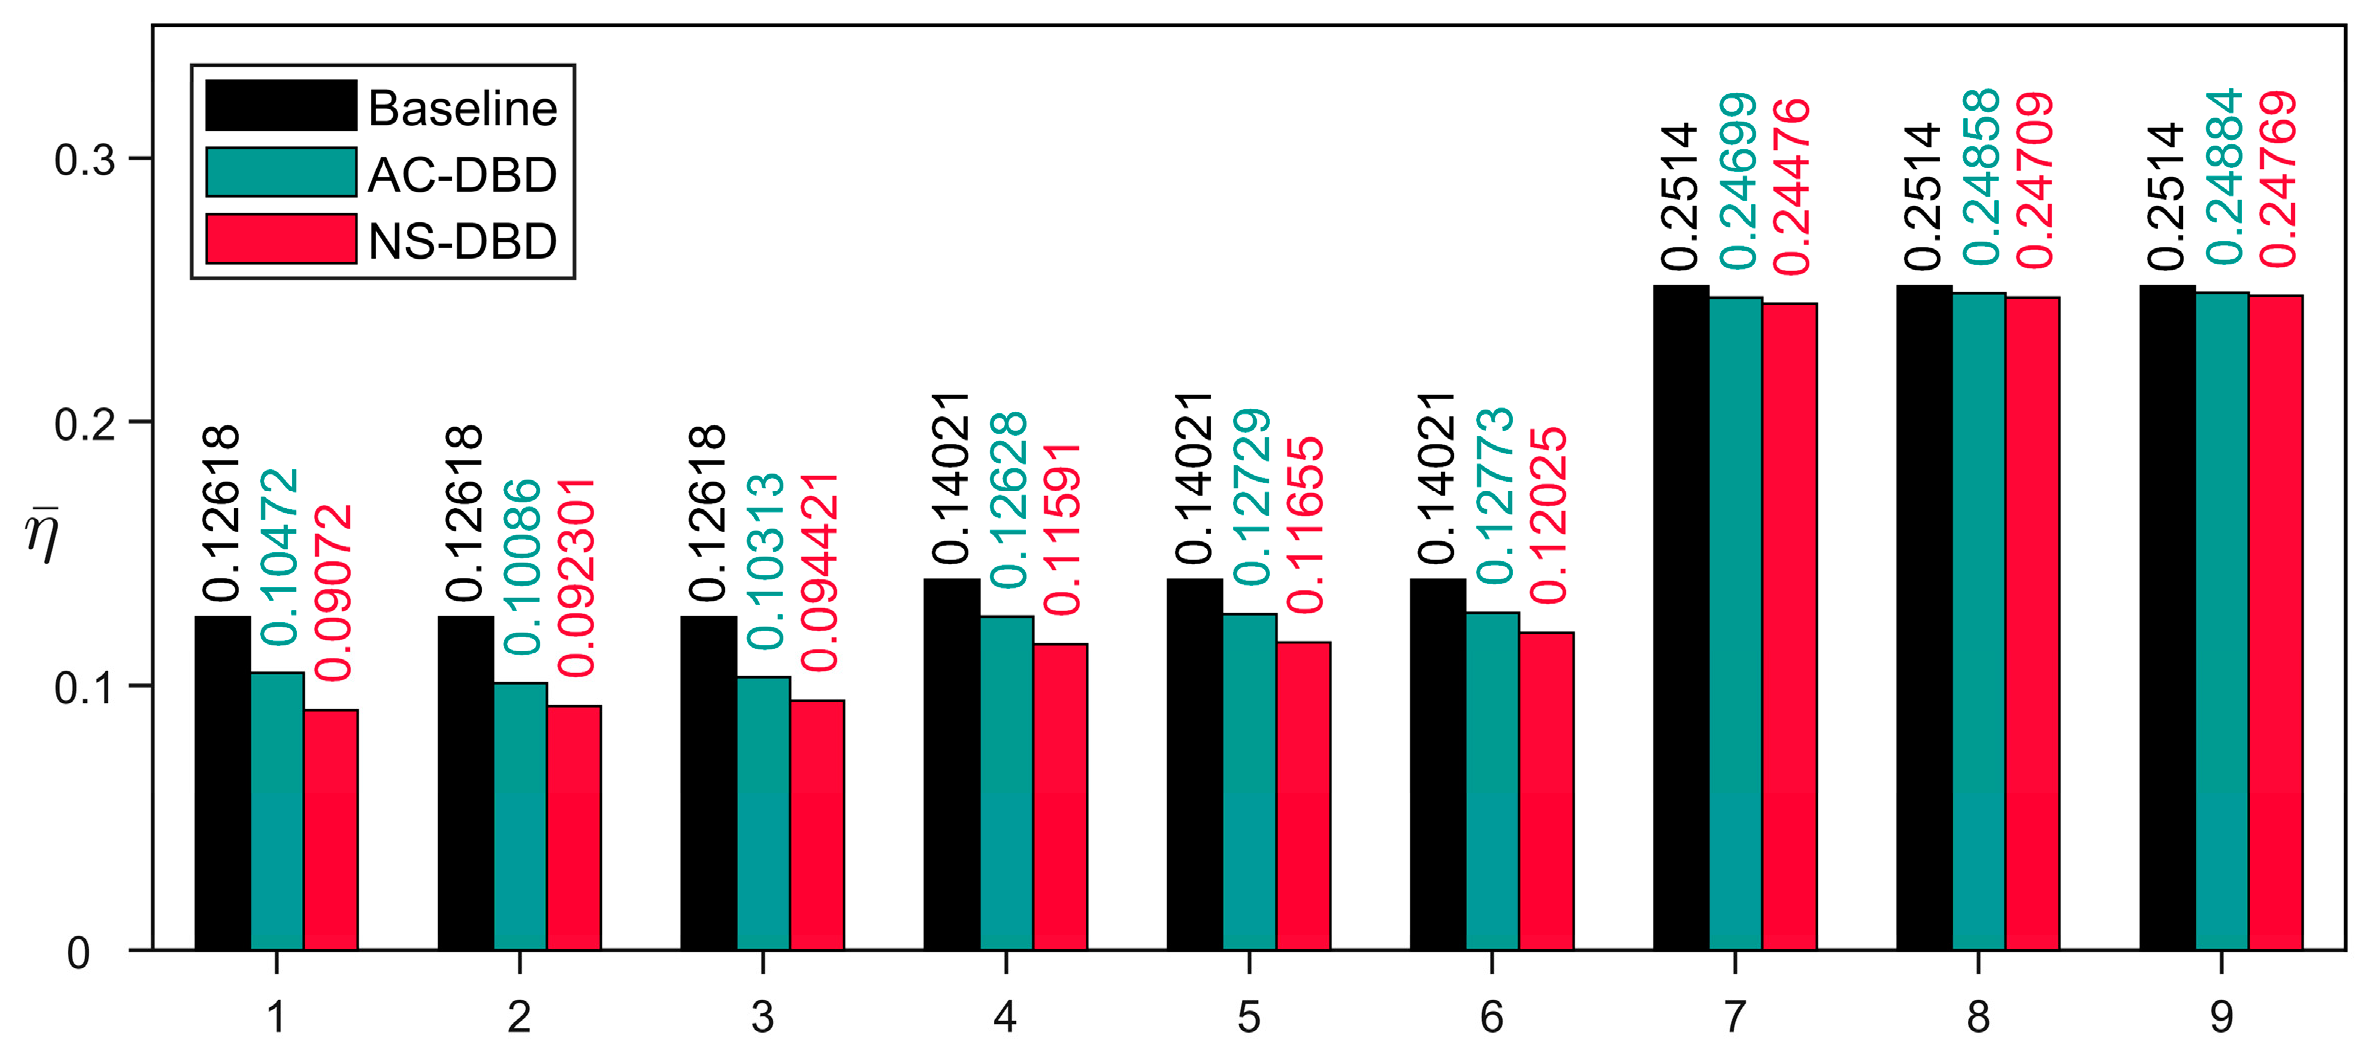
Figure 20.
Discharge image of NS-DBD and AC-DBD.
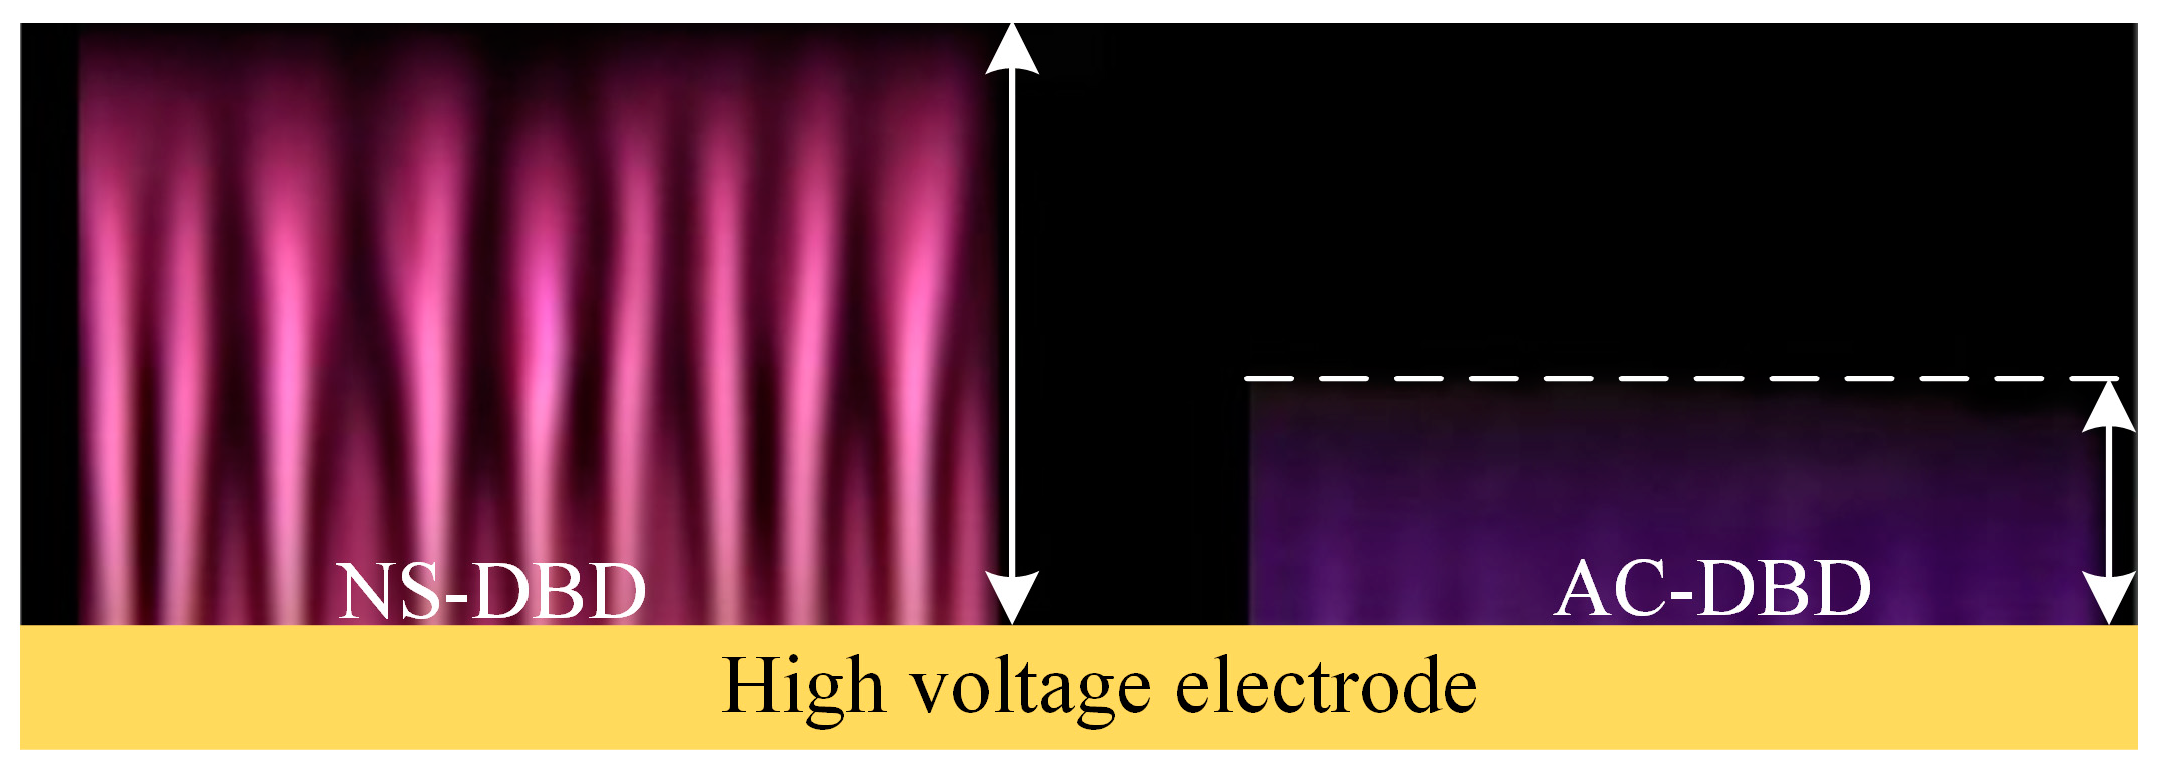
Figure 21.
Discharge waveform of NS-DBD and AC-DBD.

Figure 22.
Flow control mechanism of AC-DBD and NS-DBD.

Table 1.
The experimental conditions.
| Condition Number | ||
|---|---|---|
| 1 | 10° | 15 m/s |
| 2 | 10° | 35 m/s |
| 3 | 10° | 25 m/s |
| 4 | 14° | 25 m/s |
| 5 | 18° | 15 m/s |
Table 2.
The Actuation Settings.
| Number | Actuation Mode | Power | ||
|---|---|---|---|---|
| 1 | AC-DBD | 10 kV | 6000 Hz | 29.9704 |
| NS-DBD | 10 kV | 780 Hz | 29.8803 | |
| 2 | AC-DBD | 9 kV | 6000 Hz | 19.9858 |
| NS-DBD | 9 kV | 690 Hz | 20.1304 | |
| 3 | AC-DBD | 8 kV | 6000 Hz | 14.1942 |
| NS-DBD | 8 kV | 690 Hz | 14.2513 |
Table 3.
Condition Settings.
| Number | |||
|---|---|---|---|
| 1 | 10° | 25 m/s | 10 kV |
| 2 | 9 kV | ||
| 3 | 8 kV | ||
| 4 | 14° | 25 m/s | 10 kV |
| 5 | 9 kV | ||
| 6 | 8 kV | ||
| 7 | 18° | 25 m/s | 10 kV |
| 8 | 9 kV | ||
| 9 | 8 kV |
Disclaimer/Publisher’s Note: The statements, opinions and data contained in all publications are solely those of the individual author(s) and contributor(s) and not of MDPI and/or the editor(s). MDPI and/or the editor(s) disclaim responsibility for any injury to people or property resulting from any ideas, methods, instructions or products referred to in the content. |
© 2023 by the authors. Licensee MDPI, Basel, Switzerland. This article is an open access article distributed under the terms and conditions of the Creative Commons Attribution (CC BY) license (https://creativecommons.org/licenses/by/4.0/).
Share and Cite
MDPI and ACS Style
Zhang, D.; Liang, H.; Yang, H.; Su, Z.; Zhang, C.; Liu, S. Flow Separation Control of Nacelle Inlets in Crosswinds by Dielectric Barrier Discharge Plasma Actuation. Actuators 2023, 12, 229. https://doi.org/10.3390/act12060229
AMA Style
Zhang D, Liang H, Yang H, Su Z, Zhang C, Liu S. Flow Separation Control of Nacelle Inlets in Crosswinds by Dielectric Barrier Discharge Plasma Actuation. Actuators. 2023; 12(6):229. https://doi.org/10.3390/act12060229
Chicago/Turabian StyleZhang, Dongsheng, Hua Liang, Hesen Yang, Zhi Su, Chuanbiao Zhang, and Shimin Liu. 2023. "Flow Separation Control of Nacelle Inlets in Crosswinds by Dielectric Barrier Discharge Plasma Actuation" Actuators 12, no. 6: 229. https://doi.org/10.3390/act12060229
Note that from the first issue of 2016, this journal uses article numbers instead of page numbers. See further details here.