
West-Siberian Chernozem: How Vegetation and Tillage Shape Its Bacteriobiome

1
Institute of Soil Science and Agrochemistry, Siberian Branch of the Russian Academy of Sciences, 630090 Novosibirsk, Russia
2
Institute of Chemical Biology and Fundamental Medicine, Siberian Branch of the Russian Academy of Sciences, 630090 Novosibirsk, Russia
*
Author to whom correspondence should be addressed.
Microorganisms 2023, 11(10), 2431; https://doi.org/10.3390/microorganisms11102431
Submission received: 25 August 2023
/
Revised: 15 September 2023
/
Accepted: 26 September 2023
/
Published: 28 September 2023
(This article belongs to the Special Issue BRICS Soil Microbiome)
Abstract
:Managing soil biodiversity using reduced tillage is a popular approach, yet soil bacteriobiomes in the agroecosystems of Siberia has been scarcely studied, especially as they are related to tillage. We studied bacteriobiomes in Chernozem under natural steppe vegetation and cropped for wheat using conventional or no tillage in a long-term field trial in the Novosibirsk region, Russia, by using the sequence diversity of the V3/V4 region of 16S rRNA genes. Actinobacteria, Acidobacteria, and Proteobacteria summarily accounted for 80% of the total number of sequences, with Actinobacteria alone averaging 51%. The vegetation (natural vs. crop) and tillage (ploughed vs. no-till) affected the bacterial relative abundance at all taxonomic levels and many taxa, e.g., hundreds of OTUs. However, such changes did not translate into α-biodiversity changes, i.e., observed and potential OTUs’ richness, Shannon, and Simpson, excepting the slightly higher evenness and equitability in the top 0–5 cm of the undisturbed soil. As for the β-biodiversity, substituting conventional ploughing with no tillage and maintaining the latter for 12 years notably shifted the soil bacteriobiome closer to the one in the undisturbed soil. This study, presenting the first inventory of soil bacteriobiomes under different tillage in the south of West Siberia, underscores the need to investigate the seasonality and longevity aspects of tillage, especially as they are related to crop production.
Keywords:
16S rRNA genes; soil bacteria; undisturbed steppe; wheat; conventional tillage; no tillage1. Introduction
For quite some time by now, the importance of soil biodiversity in soil quality has been recognized [1,2]. Many agricultural techniques are currently employed to sustain agricultural soils, including managing soil biodiversity by reduced, minimal, or no tillage in attempts to partially reconcile agricultural production and biodiversity. No-till farming has established itself as a technology that cannot be ignored [3], also because lower carbon losses from no-till soil can mitigate the risks associated with global warming: for instance, results obtained on semi-arid lands showed that no-tillage had markedly higher soil organic carbon stocks [4,5].
The conversion of undisturbed steppe areas to cropped land drastically alters the aboveground community, as well as the physiochemical and biological environments. Consequently, such conversion also modifies soil environment for microorganisms, and changes their communities in composition and structure, i.e., diversity. As soil microorganisms are crucial for nutrient cycling, carbon mineralization and other ecosystem processes such as microbial diversity studies, facilitated by advances in sequencing methodology, have been drastically boosted in the last decades, and especially in diverse agrotechnological contexts, including tillage. Notably, even virus abundance and community structure were recently found to be influenced by land use and tillage practices [6].
As for the most functionally diverse component of soil microbiota, i.e., bacteria, so far there is no unequivocal conclusion about whether bacterial biodiversity increases or decreases, if it changes at all, due to reduced or no tillage. For instance, a positive effect of reduced tillage on biodiversity indices, other than richness, was revealed in an extensive study in France [7], whereas the negative impact of the no-till management on soil bacterial diversity was reported for long-term field experiments in the USA [8] and Belgium [9]. Moreover, we did not manage to find studies comparing soil bacterial diversity in cropped fields under different tillage regimes with soil bacterial diversity in the adjacent undisturbed ecosystem to grasp the magnitude of changes between them. Besides, studies of bacteriobiome diversity in arable soils in West Siberia, the important grain-producing region of Russia, are lacking, and nothing is known about soil bacterial taxonomic diversity there in relation to vegetation, tillage, and soil properties. The aim of this study was to reveal the bacteriobiome composition and structure in Chernozem under the condition of natural vegetation or having been cropped for wheat by conventional or no tillage in a long-term field experiment in the Novosibirsk region, Russia, by using 16S rRNA gene diversity.
2. Materials and Methods
2.1. Experimental Site and Conditions
The area where the field trial was performed was described earlier in our report about soil mycobiomes [10] (https://www.mdpi.com/2075-1729/12/8/1169, accessed on 23 August 2023). Briefly, the experimental field was located in the Novosibirsk region, Russia (54°4′6″ N, 79°36′3″ E) in the forest-steppe zone with a sharply continental climate and Luvic Endocalcic Chernozem (Siltic) [11] veing the most prevalent and agriculturally important soil of the region.
2.2. Experimental Setup
The field trial was also described earlier [10]. Briefly, it was started in 2009 on an area of 40 ha when a portion of the conventionally tilled soil (CT, mouldboard ploughing in the fall and disking in the spring) was subjected to the no-till technology (NT); both plots receiving the same rates of herbicides and fertilizers at the same time.
The wheat grain yield, harvested at the beginning of September, 2021, reached 4.8 t ha−1 in the NT field and 4.1 t ha−1 in the CT field. We also included in the study an undisturbed site (Un), adjacent to the experimental field and occupied by a true bunchgrass steppe (with Stipa capillata, Festuca valesiaca, some Poa spp., and Puccinella sp. prevailing) to obtain information about the zonal soil microbiome as a reference for the arable soil.
2.3. Soil Sampling and Chemical Analyses
Soil was sampled in October 2021 from 0–5 and 5–15 cm layers in five individual replicates from each layer. In total, 30 soil samples were collected and chemically analyzed as described before [10]. Briefly, soil pH ranged from 6.3 to 6.8, total soil carbon content ranged from 3.6 to 4.2%, and total soil nitrogen content was 0.29–0.37%.
2.4. DNA Extraction, Amplification and Sequencing
The DNeasy PowerSoil Kit (Qiagen, Hilden, Germany) was used for total DNA extraction according to the manufacturer’s instructions; the bead-beating was performed with the TissueLyser II (Qiagen, Hilden, Germany) for 10 min at 30 Hz. Agarose gel electrophoresis was used to assess the quality of the extracted DNA; further purification of DNA was not needed.
The 16S rRNA genes were amplified with the primer pair V3/V4, combined with Illumina adapter sequences [12]. PCR amplification was performed as described earlier [13]. A total of 200 ng PCR product from each sample was pooled together and purified through MinElute Gel Extraction Kit (Qiagen, Hilden, Germany). The obtained amplicon libraries were sequenced with 2 × 300 bp paired-ends reagents on MiSeq (Illumina, San Diego, CA, USA) in SB RAS Genomics Core Facility (ICBFM SB RAS, Novosibirsk, Russia). The read data reported in this study were submitted to the NCBI Short Read Archive under bioproject accession number PRJNA845814.
2.5. Bioinformatic Analysis
To analyze the obtained raw sequences, we employed UPARSE pipeline [14] and used Usearch v.11.0.667: the procedure involved length trimming; merging of paired reads and removing less than 350 nt; read quality filtering (-fastq_maxee_rate 0.005); discarding singleton reads; merging of identical reads (dereplication); removing chimeras. The UPARSE-OTU algorithm was used to perform operational taxonomic unit (OTU) clustering, and the clusters were taxonomically attributed by way of SINTAX [14] and 16S RDP training set v.16 [15] as a reference. Then, after eliminating archaeal sequences from the data matrix, we calculated the ratio of the number of taxon-specific sequence reads to the total number of sequence reads, to profile the relative abundance of taxa, expressed as percentage (taxonomic structure) of the obtained bacteribiome assemblages, i.e., a collection of different species at one site at one time [16].
The PAST software v. 4.12 [17] helped us to rarefy the obtained OTUs datasets for each field and soil layer: the individual rarefaction graphs (not given here) showed that bacterial OTU numbers plateaued as the number of sequences increased. Therefore, the sampling effort, being near saturation for all samples, allowed us to compare biodiversity [18].
2.6. Statistical Analyses
Statistical analyses (descriptive statistics, correlation analysis, ANOVA and PCA) were performed by using Statistica v.13.3 a (TIBCO Software Inc., Palo Alto, CA, USA) and PAST [17] software packages. OTUs-based α-biodiversity indices, as well as β-biodiversity (based on Bray-Curtis dissimilarity distance) were calculated using PAST [17]. Factor effects and mean differences in post hoc comparisons by Fisher’s LSD test were considered statistically significant at the p ≤ 0.05 level.
3. Results
3.1. General Taxonomic Diversity
After quality filtering and chimera removal, a total of 4116 different OTUs were identified at a 97% sequence identity level: the overwhelming majority (4100 OTUs) were Bacteria, with the rest representing the Archaea domain (removed from further analyses). In total, 23 bacterial phyla were found with 87 identified class-level clusters, of which 16 were not explicitly classified.
Most of the total number of bacterial OTUs belonged to the Proteobacteria phylum (817, or 20% of the OTU richness), with Actinobacteria (695 OTUs) and Acidobacteria (593 OTUs) being the second- and third-most OTU-rich phyla, accounting for 17 and 14% of the total number of OTUs, respectively. Notably, however, many of the OTUs (667 OTUs, or 16%) were not identified even to a phylum level.
As for the relative abundance, the dominance of Actinobacteria, Acidobacteria, and Proteobacteria phyla was much more pronounced: together, they accounted for 77–82% of the total number of sequences (Table 1). Actinobacteria was the ultimate dominant phyla in this study, with 55% of the relative abundance in the undisturbed soil and 42 and 48% in the ploughed and no-till soils, respectively. The relative abundance of bacterial sequence reads that could not be assigned below the domain level accounted for 7% of the total number of sequences in the soil bacteriobiome of the experimental fields. Verrucomicrobia, Gemmatimonadetes, Chloroflexi, and Bacteroidetes were the moderate dominants, i.e., accounting for 1–5% of the relative abundance in the studied soil samples.
At the class level, the dominance of Actinobacteria phyla translated into the dominance of its Thermoleophilia and Actinobacteria classes (Table 1), whereas the dominance of the Acidobacteria phylum mostly resulted from the dominance of its Group_6 and Group_16 classes. The Proteobacteria phylum was mainly represented by its Alphaproteobacteria class.
3.2. Bacterial Taxonomic Diversity as Related to the Experimental Fields
Actinobacteria were 1.3 times more abundant in the 0–5 cm soil with an undisturbed structure and plenty of plant residues, i.e., undisturbed soil and NT treatment as compared with the CT one (Table 1), whereas Proteobacteria did not demonstrate any tillage-related differential abundance in both layers. The Gemmatimonadetes and Chloroflexi were more abundant in the cropped soil as compared with the undisturbed one, where Verrucomicrobia prevailed as compared with the cropped fields. As for the class taxonomic level, the CT soil had a markedly higher Acidobacteria_Gp16 abundance than the other two soils (Table 1). Contrary to that, Actinobacteria class showed a 1.6–1.8 times increased abundance in the 0–5 cm layer of the undisturbed and NT soil, as compared with the CT soil. Alphaproteobacteria was 1.6 and 1.3 times more abundant in the bacteriobiome of the undisturbed and NT soils, respectively, than in the CT soil (Table 1).
The results for the order and family taxonomic levels are given in Tables S1 and S2.
As for the sequence reads clusters at the genus level, 179 genera were affected by tillage and/or the soil layer, with 41 other genera being close to that, i.e., having p-values in the 0.5–0.10 range. The representatives of Acidobacteria_Gp16 had a higher presence in the CT soil, as compared with the other two soils, in both layers, whereas Acidobacteria_Gp6 had an enhanced presence in the 0–5 cm layer. Except for the Solirubrobacter, all other dominant bacteriobiome genera were found to have differential abundances between the fields either in the 0–5 or 5–15 cm layers.
Overall, two-way PREMANOVA showed a statistically significant (with p-values lower than 0.01) influence of the field and soil layer at all taxonomic levels (Table 2), with the field and layer interaction being statistically significant at all levels below the phylum one. As sources of bacterial taxa abundance variance, the field and soil layer contributed about 1/3 each at the levels from class to OTU; at the phylum level, the field contributed almost half, with the layer contribution being only 12%.
The location of soil samples in the plane of the first two principal components visualizes very well the relationship between the fields and layers (Figure 1).
The OTUs, contributing ≥ 1.0% to the total number of sequence reads in a sample in the 0–5 cm soil layer, averaged 15, 14, and 12 OTUs, respectively, in the undisturbed, CT, and NT fields (Figure 2), summarily accounting for 27–29% of the total number of sequence reads. In the 5–15 cm layer, the number of dominant OTUs was 24 in the undisturbed and CT soils, and slightly less (20) in the NT soil, summarily accounting for 48, 42, and 36% of the sequence reads abundance. Over all soil samples, the assemblage of the dominant OTUs embraced 38: thus, the overwhelming majority (99%) of the total number of OTUs was minor or rare bacteriobiome members.
Some of the prevailing OTUs were specific for the studied experimental fields. The undisturbed soil had as its unique dominants Bacillus sp., Pseudonocardia sp., and unclassified representatives of Spartobacteria_gis, Acidobacteria_Gp4, Solirubrobacterales, and Rhizobiales. As its specific dominants, conventionally ploughed soil had three OTUs, unclassified to the species level and representing the Acidobacteria_Gp16 class. Notably, the no-till soil had no unique dominants at all (Table 3).
As for the OTUs which were common for the studied fields, there were three in the 0–5 cm layer and 16 in the 5–15 cm (Figure 2a). In the top layer, the common OTUs were Microlunatus sp., unclassified Solirubrobacterales, and Rubrobacter sp., each representing a different class of the Actinobacteria phylum (Actinobacteria, Thermoleophilia, and Rubrobacteria, respectively). Several hundreds of OTUs were differentially abundant between the fields (Figure 2b), in both soil layers the biggest difference was between the undisturbed and ploughed fields, and the smallest difference was revealed between the cropped fields.
As for the lower layer, most of its common-for-all-fields OTUs also represented Actinobacteria (11, with 5 of the Thermoleophilia class); two OTUs represented Acidobacteria (Groups 6 and 16), whereas Gemmatimonadetes and Proteobacteria were represented by one OTU each (unclassified below the phylum level in the case with Gemmatimonadetes and below the Rhizobiales order). Notably, almost twice as many dominants were found in the bacteriobiome of the lower layer, as compared with the top one (Figure 2a).
3.3. Bacteriobiome α- and β-Biodiversity
The α-biodiversity indices did not differ significantly, being practically similar in all studied fields, except for the bacteriobiome evenness and equitability, which were higher in the undisturbed field than in the cropped ones (Table 4).
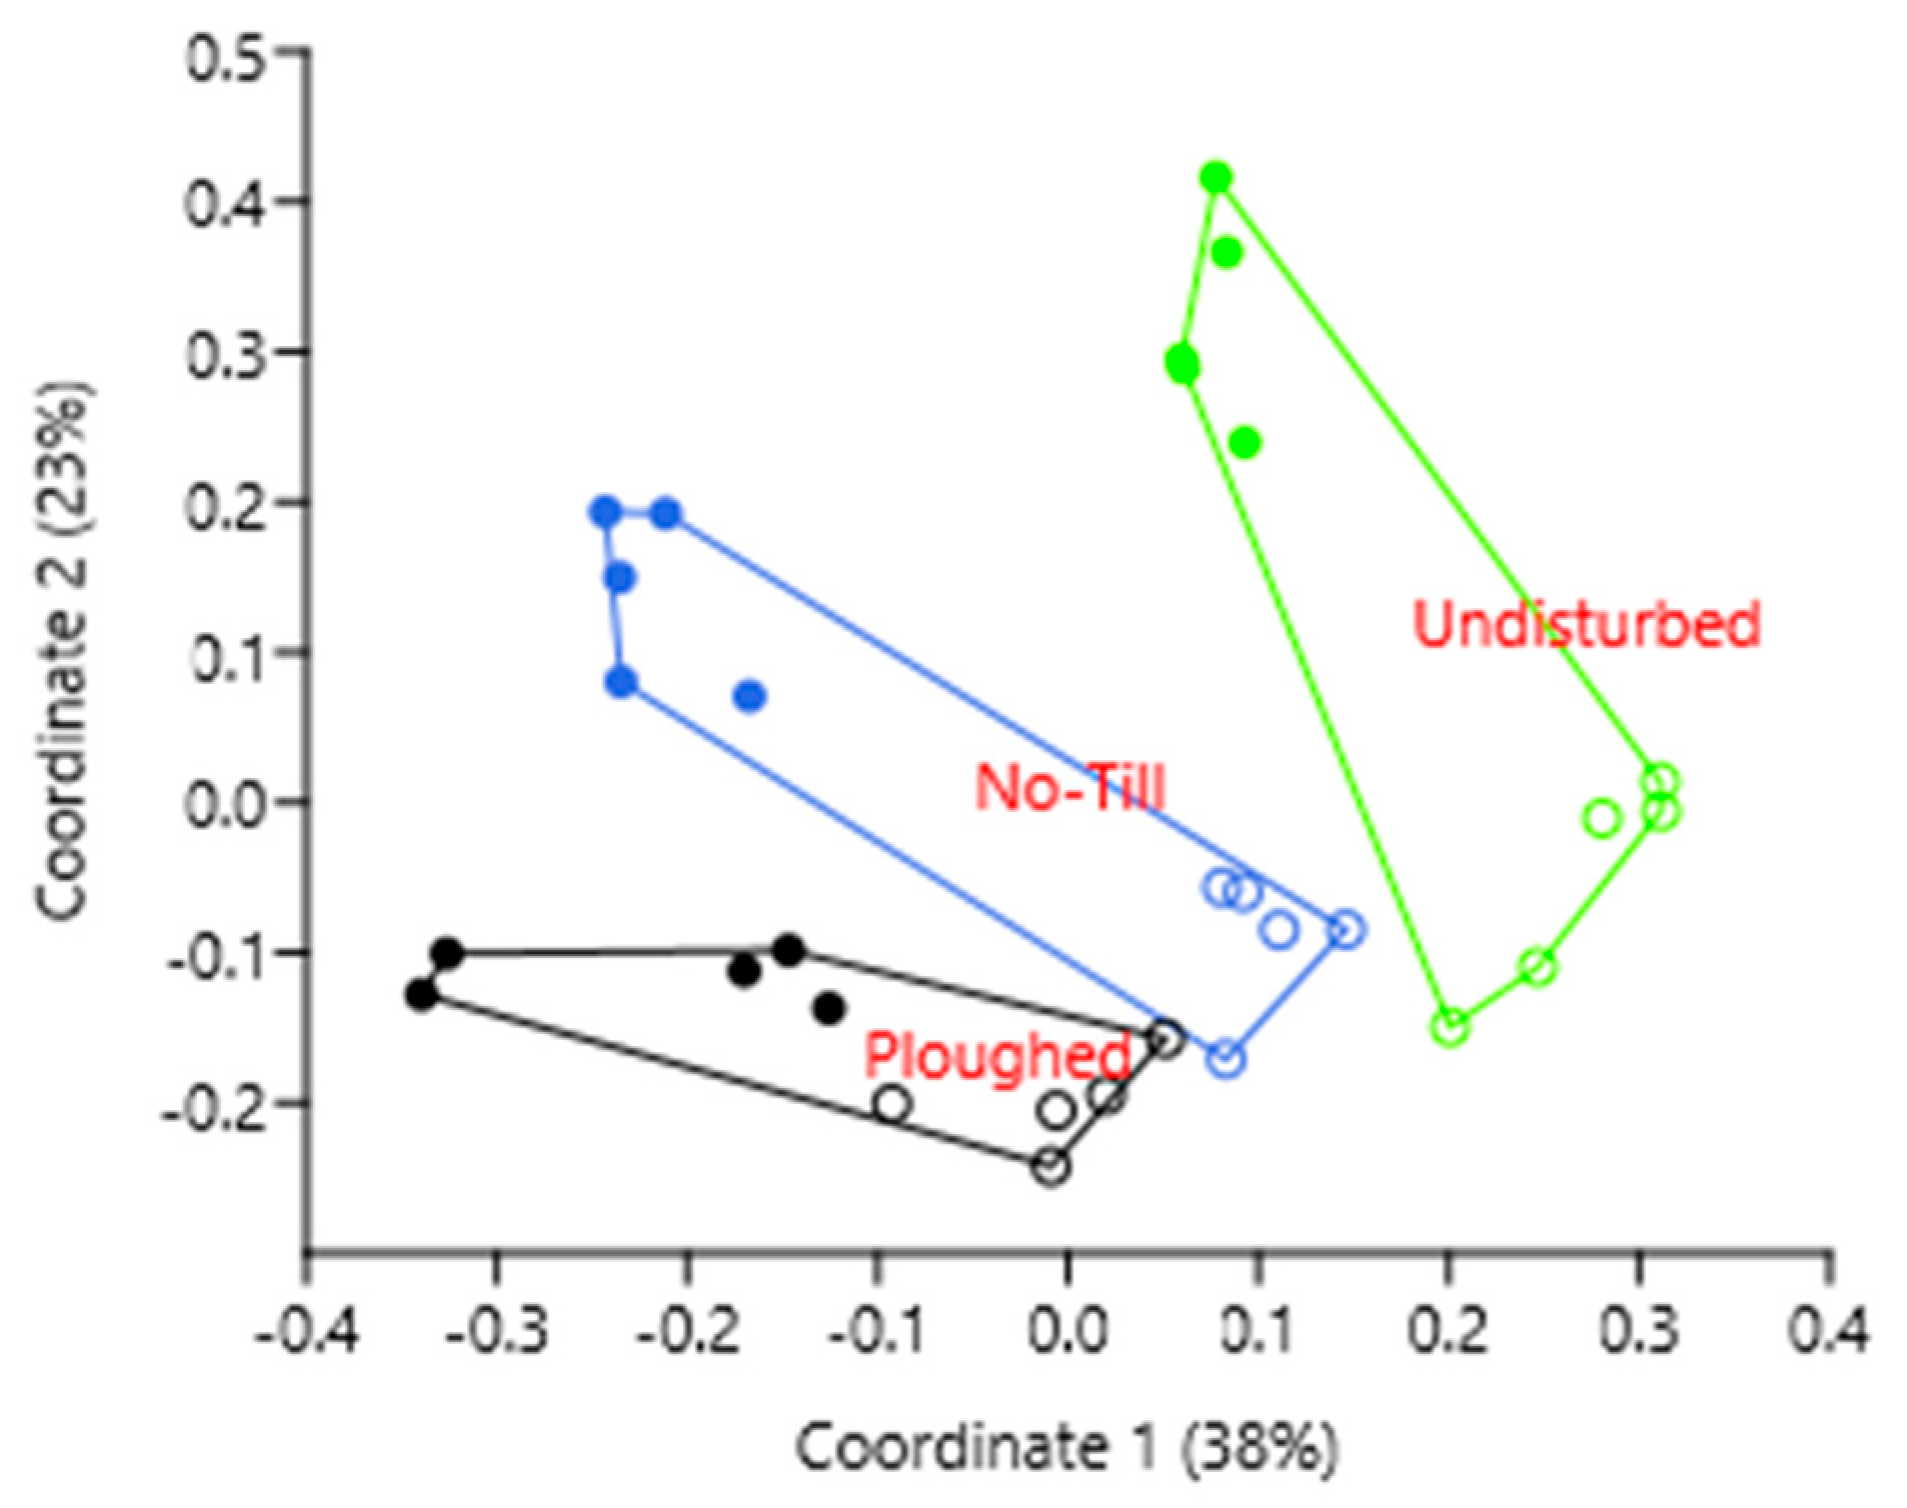
As for the β-biodiversity, the cropped samples were distant from the undisturbed soil samples under natural vegetation, but the no-till samples were separated from the conventionally ploughed one, despite being located closer to the ploughed field than to the undisturbed one (Figure 3).
4. Discussion
Our study provided the first inventory of soil bacteriobiomes in the south of West Siberia, unequivocally showing that undisturbed soil under natural steppe vegetation and wheat-cropped soil under different tillage regimes differed from each other in their bacteriobiome’s composition and structure.
4.1. Soil Bacteriobiome: General Outline
The finding of the Thermoleophilia class of the Actinobacteria phylum to be ultimately prevailing in the soil of all three fields was somewhat unexpected. The representatives of the class are often found in soils by metagenomics [19,20] and generally seem to prefer environments subjected to relatively low temperatures, a rather high UV influx, and/or low water activity [21]. Since the bacteria are difficult to isolate by conventional laboratory methods, which need to be modified to select slow-growing bacteria (oligotrophic media, extended incubation periods, etc.), not much is known about their physiology and ecological preferences. Yet, like other representatives of the Actinobacteria phylum, namely the Actinobacteria class, they are likely to be involved in cellulose and hemicellulose decomposition [22]. The high abundance of the Thermoleophilia actinomycetes in our study may have been due to the time of soil sampling: the soil was sampled at the end of October, more than a month after the wheat was harvested in the cropped fields in the region, and at the very end of the growing season in the undisturbed plot, with a rather low (+3.5 °C) average monthly temperature in the region, alternating between positive at daytime and negative at nights. Therefore, the environmental conditions with plenty of dead plant material, low temperatures, and enough moisture benefited Thermoleophilia in proceeding with plant material decomposition. This dynamics issue is indirectly corroborated by the results of Legrand et al. (2018) [7], who, after studying the effect of tillage on bacteriobiome diversity in soil samples collected in April, i.e., at least at the first trimester of the growing season in France, reported Actinobacteria as the third-ranked in relative abundance and OTUs’ richness as 11% and 12%, respectively: compare this with the 42–48% of the Actinobacteria sequence relative abundance in the cropped fields in this study (Table 1).
Our Shannon’s α-biodiversity estimate averaged 5.44 over all of the samples studied, being very close as [9,23] or lower [24,25,26] than the estimates obtained in other studies. Our finding that the soil bacteriobiome was equally diverse in all three fields does not fully agree with previously reported results, as there are no unequivocal conclusions concerning the effect of no-till on bacterial α-diversity indices. Some studies concluded that that no-till practices lower soil bacterial diversity [8,27,28], while other researchers found that no-till soil bacteriobiomes had a higher Shannon index [24]; in some reports, the Shannon index in the no-till soil seemed almost exceptionally high as compared with the one in the conventionally tilled soil (9.5 vs. 6.9 [25]). Yet other studies reported no difference in the Shannon index between the soils under conventional and reduced tillage [5,9]. There are also reports that no-till soil (from the longest no-till field experiment in the world) had a higher bacterial richness and five unique phyla [29], and that species richness and evenness were significantly higher in fields under minimum tillage practices in comparison with the fields under conventional tillage [7]. We believe that such ambiguity, alongside environmental, agronomical, and experimental variables, may be caused by the diversity of microbiome research methodology, especially bioinformatic pipelines and taxa clustering.
4.2. The Effect of Soil Tillage on Soil Bacteriobiome
Our finding that the no-till soil bacteriobiome was still closer to the conventionally ploughed soil bacteriobiome agrees with the recently published results of an extensive study in Sweden [30], which concluded that no-till soil communities, as compared with the conventional ones, revealed only a slightly higher similarity to abandoned fields and semi-natural grasslands; therefore, their contribution to biodiversity conservation was considered negligible.
Other studies assessing the impacts of long-term reduced tillage or no-till management on bacterial communities in agricultural soils revealed, by employing the same methodology, i.e., the sequencing of the 16S rRNA gene, that most variability in bacteriobiome composition was observed in its low abundance members [8]. Our finding that the relative abundance of bacterial sequence reads differed between the tillage treatments already at the high taxonomic levels, i.e., the dominant phyla’s relative abundance (Table 1 and Table S2), and lower taxa as well, which was confirmed by PERMANOVA at all taxonomic levels, clearly did not comply with that result. This discrepancy may be due to the different crop (wheat vs. soybean), the different soil (Chernozem vs. Commerce sandy loam, i.e., not very well-drained Mississippi alluvial soil), the time of the sampling, and other factors.
Some studies found Proteobacteria and Acidobacteria phyla to be the most abundant in reduced tillage and no-till soils [8,9,29]. This contrasts with our study where the Actinobacteria phylum was found to be ultimately dominating, with its relative abundance increasing from ploughed soil to the no-till soil to the undisturbed soil, accounting in the latter for more than half of the bacteriobiome. There can be little doubt that the Actinobacteria dominance in our study was due to plenty of plant residues being present for their decomposition and utilization at least for a month prior to sampling in our study, providing a key ecological niche [31].
Like the last three studies, referred to above, in our study, the representatives of the Acidobacteria phylum also ranked second in abundance. However, our finding that the phylum was 1.5 times more abundant in the conventionally ploughed soil than in the no-till and undisturbed ones could seem somewhat surprising, as the phylum was recently shown to be prevalent in the undisturbed Chernozem under birch forest in the forest steppe zone of the same region [32], and thus appeared to be associated with the undisturbed humus- and plant-matter-rich soil environment. However, translated to the class level, such phylum abundance did not seem surprising at all, as its higher presence in the ploughed soil was due to the increased presence of its Acidobacteria_Gp6 and Gp16 classes, i.e., precisely because of the ploughing, as these classes were shown to increase quite drastically from the topsoil to the underlying layers in the undisturbed Chernozem under birch forest, developed in the same forest-steppe zone on exactly the same parent rock as the Chernozem in our study [32]. The predominance of Acidobacteria in the subsoil was also revealed in the grasslands in Germany [33], and the enrichment of oligotrophic Acidobacteria under conventional tillage was also reported [7]. Our results showed that the higher prevalence of such dominant phyla as Gemmatimonadetes and Chloroflexi can be regarded as characteristic for both of the cropped soils studied, and specifically for wheat.
At the order level, Geodermatophilales, Gemmatimonadales, and Rhodospirillales were the dominant orders with higher abundance in the cropped soils. The Geodermatophilales (Actinobacteria/Actinobacteria) representatives mainly inhabit bulk and degraded soils but may be associated with plant rhizosphere and even found as plant endophytes. Culture-independent studies revealed their high diversity and frequent predominance in the ecosystems where these actinomycetes are believed to play a key role in biogeochemical cycles [34]. As for the taxa marking the cropped soils with their increased abundance, they were Actinobacteria for the no-till soil and Acidobacteria (Gp16 and Gp6) for the conventionally tilled soil.
4.3. Bacterial Genera and OTUs That Differentially Increased in the Undisturbed Soil
As for the undisturbed soil under natural steppe vegetation, the dominance of Actinobacteria and Acidobacteria in the bacteriobiome of this soil under natural vegetation with Stipa krylovii complied with the phyla dominance in soil under Stipa bungeana grassland in the Loess Hilly region in China [35]. The main dominant bacterial phyla with higher abundance than those in both cropped soils were Verrucomicrobia with its Spartobacteria class and Acidobacteria_Gp4. The substantial prevalence of the Actinobacteria and Verrucomicrobia phyla, as well as the Acidobacteria_Gp4 class, can be regarded as characteristic for undisturbed Chernozem under natural vegetation, at least late in the growing season. Our finding that the diversity and composition of soil Acidobacteria groups can indicate past land-use change from undisturbed steppe to arable land in general agrees with the results reported by Kim et al. (2021) [36] for forest conversion to farmland in Korea; however, specific patterns of acidobacterial diversity shifts were different between the studies, most likely due to different initial ecosystems (steppe vs. forest), agricultural practices (no manure vs. manure, resulting in the several-times higher organic matter content in the arable soils of the experimental field in [36]), longevity of the field trials, etc. Anyway, the Acidobacteria phylum, as one of the major bacteriobiome dominants in soil [37], and Chernozem in particular [38], undoubtedly deserves more research to obtain a better insight into its ecophysiology and behavior in agronomically important contexts.
4.4. General Comments
This study showed that substituting conventional ploughing with no-tillage and maintaining the latter for 12 years brought soil bacteriobiomes that were closer in β-biodiversity to the one in the undisturbed soil under natural steppe vegetation, clearly separating it from the soil bacteriobiome under conventional tillage. This finding agrees with the idea that the physicochemical properties of the soil environment, altered by no-tillage, provide more ecological niches and hence differentiation of the “opportunity space” [9,39] between the fields. Hopefully, over the following years of the experiment, the soil health will be improved [40], while the production performance will be sustained or increased.
The PERMANOVA analysis of the obtained data clearly showed the effect of tillage on the bacteriobiome relative abundance at all taxonomical levels for both soil layers, and ANOVA found hundreds of OTUs that were differentially abundant between the fields. We want to emphasize that here we did not correct for the multiple testing, as the main aim was to show the main trend, i.e., that the list of differentially abundant OTUs between the undisturbed and conventionally ploughed soil embraced twice-as-broad an OTUs spectrum as the one of the OTUs that were differentially abundant between the two similarly cropped, but differently tilled, fields.
The differences between the fields were revealed mostly for the OTUs that were rather far from notable prevalence; yet, we had expected at least a small effect on such bacteriobiome α-biodiversity indices as Shannon’s or Simpson’s. Our finding that the soil bacteriobiome α-biodiversity indices showed tillage-related differences only in evenness and equitability most likely resulted from much more diverse vegetation in the undisturbed steppe, which provided (a) many different microhabitats for microorganisms and (b) more chemically versatile plant matter input in the soil, thus benefiting a greater number of bacterial species and, consequently, bacteriobiome evenness and equitability. Other α-biodiversity indices (OTUs’ richness, Chao-1, Shannon, Simpson, Dominance, Berger-Parker) failed to differentiate the biodiversity at the field level, despite statistically significant differentiation in some OTUs’ relative abundance. As for the β-biodiversity, estimated by the dissimilarity index based on Bray–Curtis distance, it was more effective at catching differentiation among the fields, clearly separating the studied bacteriobiomes from each other, with the no-till soil being in between the conventionally ploughed and the undisturbed natural soils.
It is worth emphasizing that including the undisturbed soil into comparative soil metagenomic surveys, as we wrote before [10] (p. 14), “provides a very important reference, crucial for restoring and sustaining soil microbial biodiversity in future”. Other researchers also emphasized that no studies have combined microbiome analyses “with a reference dataset to address to what extent the soil communities of the agricultural soils bear resemblance to more natural habitats” [30] (p. 1023). We found one study of soils under no-till management in Argentina, in which plots under undisturbed natural vegetation were also included [41]. The inclusion of the undisturbed adjacent soil extended the ecological perspective and gave a positive aspect to our study. Therefore, the inclusion of the undisturbed adjacent soil extended the ecological perspective and gave a positive aspect to our study.
As for bacterial biomarkers that were specific to each tillage treatment, we did not attempt to study temporal dynamics, so the biomarkers we found might be regarded as such only for the same period. Undoubtedly, temporal dynamics should be included in any comprehensive diversity studies for a formal and structured quantification of their variation due to various environmental factors [42], providing better insights into microbial community behavior with their trends, causality, and prediction [43]. Thus, omitting (due to funding and human resources constraints) the longitudinal aspect of soil bacteriobiome in our study can be considered somewhat of a drawback, albeit the study making an interesting North Asian contribution into the global soil bacteriobiome data set.
Since rare sequences are hardly likely to seriously affect the ecological context [44], here, we presented results mainly for the dominant taxa, despite the vast sets of OTU clusters that were differentially abundant in the studied soils: often there is very limited, if any, ecophysiological knowledge pertinent even to the dominant OTUs, not to mention the minor or rare ones [45]. Thus, ecologically interpret OTU/species assemblages assessed by analysing environmental DNA less speculative and more factually justified, much research is yet necessary for improving the ecological annotation in the relevant reference databases.
To assess bacterial taxonomic diversity, we used one of the variable regions of the 16S rRNA gene, as such analysis has been, so far, the most common tool in bacterial taxonomic studies. However, the gene can have multiple copies within a genome [46,47], and hence, the presence of such multiple heterogeneous 16S rRNA gene copies may, and very likely does, over-estimate community biodiversity [48,49]. Our finding that the phyla Proteobacteria and Firmicutes were not prominent in the studied soils, together with the highest amount of variation in the copies of their 16S rRNA genes [50,51], suggests that the contribution of these phyla in the over-estimation of biodiversity, if any over-estimation occurred, was not at least maximal. Also, such phyla as Actinobacteria and Acidobacteria, ultimately dominating in our study and showing less variation in the copies of their 16S rRNA genes [50] implies low biodiversity over-estimation because of the phyla. Overall, there is a certain ambiguity concerning the effect of intragenomic sequence heterogeneity among multiple 16S rRNA genes, which may affect species classification [52], or may be unlikely to have a strong effect on the classification of taxa [53] due to the limited heterogeneity in the copies of the 16S rRNA genes [50].
At the same time, as variable regions of the 16S rRNA gene are unlikely to ever adequately discriminate between species [48], the true species richness of soil bacteriobiomes in our study may be underestimated. On the other hand, as discussed above, the intragenomic variation in the 16S gene can overestimate true bacterial diversity. However, as Werner Heisenberg put it, “In science … the object of research is no longer nature in itself, but rather nature exposed to man’s questioning…” [54] (p. 105). True values of species richness of soil microbiota are hardly ever attainable. Anyway, the fact that soil bacteriome diversity data, obtained here by sequencing amplicons of 16S rRNA genes, resulted in ecologically relevant and meaningful bacteriobiome patterns in the context of our study, proves that the methodology grasps a substantial portion of true bacterial diversity in soil.
The biodiversity indices, currently employed in microbiome studies as calculated on the basis of the number of nucleotide sequences reads in a study, provide a uniform method to describe and compare the biodiversity of different biomes, ecosystems, areas, and habitats. However, α-biodiversity indices, calculated with such data, do not always seem ecologically sensitive, probably due to the presence of multiple copies of the gene within a genome. Yet, recently, it was concluded that 16S rRNA gene copy number normalization (in order to bring sequence-derived biodiversity estimates closer to the population-derived ones) does not provide more reliable conclusions in metataxonomic surveys [55].
5. Conclusions
Here, we presented the first survey of the bacteriobiome diversity in Chernozem under different vegetation (undisturbed steppe vs. wheat) and tillage (conventional vs. no tillage) treatments. We found a clear effect of the tillage mode on the relative abundance of some taxa already at the high taxonomic levels, with three studied fields, i.e., natural steppe and wheat-cropped by conventional or no tillage, differing from each other. After 12 years of continuous no-tillage management, the soil bacteriobiome β-diversity differed among the fields, shifting the no-till one notably towards the undisturbed steppe, yet leaving it still closer to the bacteriobiome in conventionally ploughed soil. Further studies, focusing on the longitudal aspect of soil bacteriobiome variability, both seasonal and long-term, can be helpful in finding the main drivers shaping soil microbial diversity and its relationship with crop production.
Supplementary Materials
The following supporting information can be downloaded at: https://www.mdpi.com/article/10.3390/microorganisms11102431/s1, Table S1: Relative abundance (%, mean) of the dominant bacterial orders in Chernozem of the experimental fields in the south of West Siberia; Table S2: Relative abundance (%, mean) of the dominant bacterial families in Chernozem of the experimental fields in the south of West Siberia; the file OTUs_uparse.fa.
Author Contributions
Conceptualization, P.B. and N.N.; methodology, N.N.; software, M.K.; validation, O.B., O.R. and P.B.; formal analysis, N.N. and M.K.; investigation, O.B.; resources, P.B.; data curation, O.R.; writing—original draft preparation, N.N.; writing—review and editing, P.B. and M.K.; visualization, N.N.; supervision, M.K.; project administration, P.B. and M.K.; funding acquisition, M.K. All authors have read and agreed to the published version of the manuscript.
Funding
This research was funded by the MINISTRY OF SCIENCE AND HIGHER EDUCATION OF THE RUSSIAN FEDERATION (projects 121031700309-1 and 121031300042-1).
Data Availability Statement
The read data reported in this study were submitted to the GenBank under the study accession PRJNA845814 (https://www.ncbi.nlm.nih.gov/bioproject/ accessed on 23 August 2023).
Acknowledgments
The authors are very thankful to the private farmer A.E. Weiss for his permission to sample soils from the experimental fields.
Conflicts of Interest
The authors declare no conflict of interest. The funders had no role in the design of the study; in the collection, analyses, or interpretation of data; in the writing of the manuscript, or in the decision to publish the results.
References
- Brussaard, L.; De Ruiter, P.C.; Brown, G.G. Soil biodiversity for agricultural sustainability. Agric. Ecosyst. Environ. 2007, 121, 233–244. [Google Scholar] [CrossRef]
- Lin, J.S.; Sarto, M.V.M.; Carter, T.L.; Peterson, D.E.; Gura, C.; Mino, L.; Rohrs, M.; Lucas, H.; Clark, J.; Rice, C.W. Soil organic carbon, aggregation and fungi community after 44 years of no-till and cropping systems in the Central Great Plains, USA. Arch. Microbiol. 2023, 205, 84. [Google Scholar] [CrossRef] [PubMed]
- Derpsch, R.; Friedrich, T.; Kassam, A.; Li, H. Current status of adoption of no-till farming in the world and some of its main benefits. Int. J. Agric. Biol. Engin. 2010, 3, 1–25. [Google Scholar]
- Abbas, F.; Hammad, H.M.; Ishaq, W.; Farooque, A.A.; Bakhat, H.F.; Zia, Z.; Fahad, S.; Farhad, W.; Cerdà, A. A review of soil carbon dynamics resulting from agricultural practices. J. Environ. Manag. 2020, 268, 110319. [Google Scholar] [CrossRef] [PubMed]
- Behnke, G.D.; Zabaloy, M.C.; Riggins, C.W.; Rodríguez-Zas, S.; Huang, L.; Villamil, M.B. Acidification in corn monocultures favor fungi, ammonia oxidizing bacteria, and nirK-denitrifier groups. Sci. Total Environ. 2020, 720, 137514. [Google Scholar] [CrossRef]
- Cornell, C.R.; Zhang, Y.; Van Nostrand, J.D.; Wagle, P.; Xiao, X.; Zhou, J. Temporal Changes of Virus-Like Particle Abundance and Metagenomic Comparison of Viral Communities in Cropland and Prairie Soils. mSphere 2021, 6, e0116020. [Google Scholar] [CrossRef]
- Legrand, F.; Picot, A.; Cobo-Díaz, J.F.; Carof, M.; Chen, W.; Le Floch, G. Effect of tillage and static abiotic soil properties on microbial diversity. Appl. Soil Ecol. 2018, 132, 135–145. [Google Scholar] [CrossRef]
- Tyler, H.L. Bacterial community composition under long-term reduced tillage and no till management. J. Appl. Microbiol. 2019, 126, 1797–1807. [Google Scholar] [CrossRef]
- Degrune, F.; Theodorakopoulos, N.; Dufrêne, M.; Colinet, G.; Bodson, B.; Hiel, M.P.; Taminiau, B.; Nezer, C.; Daube, G.; Vandenbol, M. No favorable effect of reduced tillage on microbial community diversity in a silty loam soil (Belgium). Agric. Ecosyst. Environ. 2016, 224, 12–21. [Google Scholar] [CrossRef]
- Naumova, N.; Barsukov, P.; Baturina, O.; Rusalimova, O.; Kabilov, M. Soil Mycobiome Diversity under Different Tillage Practices in the South of West Siberia. Life 2022, 12, 1169. [Google Scholar] [CrossRef]
- IUSS Working Group. WRB, World Reference Base for Soil Resources 2015. International Soil Classification System for Naming Soils and Creating Legends for Soil Maps; FAO: Rome, Italy, 2015. [Google Scholar]
- Fadrosh, D.W.; Ma, B.; Gajer, P.; Sengamalay, N.; Ott, S.; Brotman, R.M.; Ravel, J. An improved dual-indexing approach for multiplexed 16S rRNA gene sequencing on the Illumina MiSeq platform. Microbiome 2014, 2, 6. [Google Scholar] [CrossRef] [PubMed]
- Naumova, N.; Alikina, T.; Tupikin, A.; Kalmykova, A.; Soldatova, G.; Vlassov, V.; Kabilov, M. Human Gut Microbiome Response to Short-Term Bifidobacterium-Based Probiotic Treatment. Indian J. Microbiol. 2020, 60, 451–457. [Google Scholar] [CrossRef] [PubMed]
- Edgar, R.C. UPARSE: Highly accurate OTU sequences from microbial amplicon reads. Nat. Methods 2013, 10, 996–998. [Google Scholar] [CrossRef] [PubMed]
- Wang, Q.; Garrity, G.M.; Tiedje, J.M.; Cole, J.R. Naïve Bayesian Classifier for Rapid Assignment of rRNA Sequences into the New Bacterial Taxonomy. Appl. Environ. Microbiol. 2007, 73, 5261–5267. [Google Scholar] [CrossRef] [PubMed]
- Fauth, E.; Bernardo, J.; Camara, M.; Resetarits, W.J., Jr.; Van Buskirk, J.; McCollum, S.A. Simplifying the Jargon of Community Ecology: A Conceptual Approach. Am. Nat. 1996, 147, 282–286. [Google Scholar] [CrossRef]
- Hammer, O.; Harper, D.A.T.; Ryan, P.D. PAST: Paleontological Statistics Software Package for Education and Data Analysis. Palaeontol. Electron. 2001, 4, 9. [Google Scholar]
- Hughes, J.B.; Hellmann, J.J. The Application of Rarefaction Techniques to Molecular Inventories of Microbial Diversity. Methods Enzymol. 2005, 397, 292–308. [Google Scholar] [CrossRef]
- Pulschen, A.A.; Bendia, A.G.; Fricker, A.D.; Pellizari, V.H.; Galante, D.; Rodrigues, F. Isolation of Uncultured Bacteria from Antarctica Using Long Incubation Periods and Low Nutritional Media. Front. Microbiol. 2017, 8, 1346. [Google Scholar] [CrossRef]
- Vasconcellos, R.L.F.; Romagnoli, E.M.; Taketani, R.G.; Santos, S.N.; Zucchi, T.D.; Melo, I.S. Impact of Inoculation with Pseudomonas aestus CMAA 1215T on the Non-target Resident Bacterial Community in a Saline Rhizosphere Soil. Curr. Microbiol. 2021, 78, 218–228. [Google Scholar] [CrossRef]
- Hu, D.; Zang, Y.; Mao, Y.; Gao, B. Identification of Molecular Markers That Are Specific to the Class Thermoleophilia. Front. Microbiol. 2019, 10, 1185. [Google Scholar] [CrossRef]
- Weiss, B.; Souza, A.C.O.; Constancio, M.T.L.; Alvarenga, D.O.; Pylro, V.S.; Alves, L.M.C.; Varani, A.M. Unraveling a Lignocellulose-Decomposing Bacterial Consortium from Soil Associated with Dry Sugarcane Straw by Genomic-Centered Metagenomics. Microorganisms 2021, 9, 995. [Google Scholar] [CrossRef] [PubMed]
- Goss-Souza, D.; Mendes, L.W.; Borges, C.D.; Baretta, D.; Tsai, S.M.; Rodrigues, J.L.M. Soil microbial community dynamics and assembly under long-term land use change. FEMS Microbiol. Ecol. 2017, 93, 10. [Google Scholar] [CrossRef]
- Schmidt, R.; Gravuer, K.; Bossange, A.V.; Mitchell, J.; Scow, K. Long-term use of cover crops and no-till shift soil microbial community life strategies in agricultural soil. PLoS ONE 2018, 13, e0192953. [Google Scholar] [CrossRef]
- Liu, C.; Li, L.; Xie, J.; Coulter, J.A.; Zhang, R.; Luo, Z.; Cai, L.; Wang, L.; Gopalakrishnan, S. Soil Bacterial Diversity and Potential Functions Are Regulated by Long-Term Conservation Tillage and Straw Mulching. Microorganisms 2020, 8, 836. [Google Scholar] [CrossRef] [PubMed]
- Behnke, G.D.; Kim, N.; Zabaloy, M.C.; Riggins, C.W.; Rodriguez-Zas, S.; Villamil, M.B. Soil Microbial Indicators within Rotations and Tillage Systems. Microorganisms 2021, 9, 1244. [Google Scholar] [CrossRef]
- Duan, N.L.; Li, L.; Liang, X.; Fine, A.; Zhuang, J.; Radosevich, M.; Schaeffer, S.M. Variation in Bacterial Community Structure under Long-Term Fertilization, Tillage, and Cover Cropping in Continuous Cotton Production. Front. Microbiol. 2022, 13, 847005. [Google Scholar] [CrossRef] [PubMed]
- Firth, A.G.; Brooks, J.P.; Locke, M.A.; Morin, D.J.; Brown, A.; Baker, B.H. Soil bacterial community dynamics in plots managed with cover crops and no-till farming in the Lower Mississippi Alluvial Valley, USA. J. Appl. Microbiol. 2023, 134, lxac051. [Google Scholar] [CrossRef]
- Sengupta, A.; Dick, W.A. Bacterial Community Diversity in Soil under two Tillage Practices as Determined by Pyrosequencing. Microb. Ecol. 2015, 70, 853–859. [Google Scholar] [CrossRef]
- Frøslev, T.G.; Nielsen, I.B.; Santos, S.S.; Barnes, C.J.; Bruun, H.H.; Ejrnæs, R. The biodiversity effect of reduced tillage on soil microbiota. Ambio 2022, 51, 1022–1033. [Google Scholar] [CrossRef]
- Kerdraon, L.; Balesdent, M.H.; Barret, M.; Laval, V.; Suffert, F. Crop Residues in Wheat-Oilseed Rape Rotation System: A Pivotal, Shifting Platform for Microbial Meetings. Microb. Ecol. 2019, 77, 931–945. [Google Scholar] [CrossRef]
- Naumova, N.B.; Belanov, I.P.; Alikina, T.Y.; Kabilov, M.R. Undisturbed Soil Pedon under Birch Forest: Characterization of Microbiome in Genetic Horizons. Soil Syst. 2021, 5, 14. [Google Scholar] [CrossRef]
- Will, C.; Thürmer, A.; Wollherr, A.; Nacke, H.; Herold, N.; Schrumpf, M.; Gutknecht, J.; Wubet, T.; Buscot, F.; Daniel, R. Horizon-specific bacterial community composition of German grassland soils, as revealed by pyrosequencing-based analysis of 16S rRNA genes. Appl. Environ. Microbiol. 2010, 76, 6751–6759. [Google Scholar] [CrossRef] [PubMed]
- Del Montero-Calasanz, M.C.; Meier-Kolthoff, J.P.; Zhang, D.-F.; Yaramis, A.; Rohde, M.; Woyke, T.; Kyrpides, N.C.; Schumann, P.; Li, W.-J.; Göker, M. Genome-Scale Data Call for a Taxonomic Rearrangement of Geodermatophilaceae. Front. Microbiol. 2017, 8, 2501. [Google Scholar] [CrossRef] [PubMed]
- Chen, M.L.; Zeng, Q.C.; Huang, Y.M.; Ni, Y.X. Effects of the Farmland-to-Forest/Grassland Conversion Program on the Soil Bacterial Community in the Loess Hilly. Region. Huan Jing Ke Xue 2018, 39, 1824–1832. (In Chinese) [Google Scholar] [CrossRef]
- Kim, H.; Lee, S.; Jo, H.Y.; Finneran, K.T.; Kwon, M.J. Diversity and composition of soil Acidobacteria and Proteobacteria communities as a bacterial indicator of past land-use change from forest to farmland. Sci. Total Environ. 2021, 797, 148944. [Google Scholar] [CrossRef]
- Yan, Y.; Sun, X.; Sun, F.; Zhao, Y.; Sun, W.; Guo, J.; Zhang, T. Sensitivity of soil fungal and bacterial community compositions to nitrogen and phosphorus additions in a temperate meadow. Plant Soil 2022, 471, 477–490. [Google Scholar] [CrossRef]
- Liu, J.J.; Sui, Y.; Yu, Z.; Shi, Y.; Chu, H.; Jin, J.; Liu, X.; Wang, G. High throughput sequencing analysis of biogeographical distribution of bacterial communities in the black soils of northeast China. Soil Biol. Biochem. 2014, 70, 113–122. [Google Scholar] [CrossRef]
- Cai, L.; Guo, Z.; Zhang, J.; Gai, Z.; Liu, J.; Meng, Q.; Liu, X. No tillage and residue mulching method on bacterial community diversity regulation in a black soil region of Northeastern China. PLoS ONE 2021, 16, e0256970. [Google Scholar] [CrossRef]
- Gabbarini, L.A.; Figuerola, E.; Frene, J.P.; Robledo, N.B.; Ibarbalz, F.M.; Babin, D.; Smalla, K.; Erijman, L.; Wall, L.G. Impacts of switching tillage to no-tillage and vice versa on soil structure, enzyme activities and prokaryotic community profiles in Argentinean semi-arid soils. FEMS Microbiol. Ecol. 2021, 97, fiab025. [Google Scholar] [CrossRef]
- Figuerola, E.L.; Guerrero, L.D.; Rosa, S.M.; Simonetti, L.; Duval, M.E.; Galantini, J.A.; Bedano, J.C.; Wall, L.G.; Erijman, L. Bacterial indicator of agricultural management for soil under no-till crop production. PLoS ONE 2012, 7, e51075. [Google Scholar] [CrossRef]
- Brunbjerg, A.K.; Bruun, H.H.; Dalby, L.; Classen, A.T.; Fløjgaard, C.; Frøslev, T.G.; Pryds Hansen, O.L.; Høye, T.T.; Moeslund, J.E.; Svenning, J.-C.; et al. Multi-taxon inventory reveals highly consistent biodiversity responses to ecospace variation. Oikos 2020, 129, 1381–1392. [Google Scholar] [CrossRef]
- Martínez Arbas, S.; Busi, S.B.; Queirós, P.; de Nies, L.; Herold, M.; May, P.; Wilmes, P.; Muller, E.E.L.; Narayanasamy, S. Challenges, Strategies, and Perspectives for Reference-Independent Longitudinal Multi-Omic Microbiome Studies. Front. Genet. 2021, 12, 666244. [Google Scholar] [CrossRef]
- Brown, S.P.; Veach, A.M.; Rigdon-Huss, A.R.; Grond, K.; Lickteig, S.K.; Lothamer, K.; Oliver, A.K.; Jumpponen, A. Scraping the bottom of the barrel: Are rare high throughput sequences artifacts? Fungal Ecol. 2015, 13, 221–225. [Google Scholar] [CrossRef]
- Brunbjerg, A.K.; Bruun, H.H.; Brøndum, L.; Classen, A.T.; Dalby, L.; Fog, K.; Frøslev, T.G.; Goldberg, I.; Hansen, A.J.; Hansen, M.D.D.; et al. A systematic survey of regional multi-taxon biodiversity: Evaluating strategies and coverage. BMC Ecol. 2019, 19, 43. [Google Scholar] [CrossRef] [PubMed]
- Dahllöf, I.; Baillie, H.; Kjelleberg, S. rpoB-based microbial community analysis avoids limitations inherent in 16S rRNA gene intraspecies heterogeneity. Appl. Environ. Microbiol. 2000, 66, 3376–3380. [Google Scholar] [CrossRef] [PubMed]
- Kang, Y.J.; Cheng, J.; Mei, L.J.; Hu, J.; Piao, Z.; Yin, S.X. Multiple copies of 16s rRNA gene affect the restriction patterns and DGGE profile as revealed by analysis of genome database. Mikrobiologiia 2010, 79, 664–671. [Google Scholar] [CrossRef]
- Johnson, J.S.; Spakowicz, D.J.; Hong, B.Y.; Petersen, L.M.; Demkowicz, P.; Chen, L.; Leopold, S.R.; Hanson, B.M.; Agresta, H.O.; Gerstein, M.; et al. Evaluation of 16S rRNA gene sequencing for species and strain-level microbiome analysis. Nat. Commun. 2019, 10, 5029. [Google Scholar] [CrossRef]
- Sun, D.-L.; Jiang, X.; Wu, Q.; Zhou, N.-Y. Intragenomic heterogeneity of 16S rRNA genes causes overestimation of prokaryotic diversity. Appl. Environ. Microbiol. 2013, 79, 5962–5969. [Google Scholar] [CrossRef]
- Větrovský, T.; Baldrian, P. The variability of the 16S rRNA gene in bacterial genomes and its consequences for bacterial community analyses. PLoS ONE 2013, 8, e57923. [Google Scholar] [CrossRef]
- Ibal, J.C.; Pham, H.Q.; Park, C.E.; Shin, J.H. Information about variations in multiple copies of bacterial 16S rRNA genes may aid in species identification. PLoS ONE 2019, 14, e0212090. [Google Scholar] [CrossRef]
- Lin, J.N.; Lai, C.H.; Lin, S.Y.; Lee, C.C.; Lee, N.Y.; Liu, P.Y.; Yang, C.H.; Huang, Y.H. Effect of Intragenomic Sequence Heterogeneity among Multiple 16S rRNA Genes on Species Identification of Elizabethkingia. Microbiol. Spectr. 2022, 10, e0133822. [Google Scholar] [CrossRef] [PubMed]
- Coenye, T.; Vandamme, P. Intragenomic heterogeneity between multiple 16S ribosomal RNA operons in sequenced bacterial genomes. FEMS Microbiol. Lett. 2003, 228, 45–49. [Google Scholar] [CrossRef] [PubMed]
- Heisenberg, W. The Representation of Nature in Contemporary Physics. Daedalus 1958, 87, 95–108. Available online: http://www.jstor.org/stable/20026454 (accessed on 13 September 2023).
- Starke, R.; Pylro, V.S.; Morais, D.K. 16S rRNA Gene Copy Number Normalization does not Provide More Reliable Conclusions in Metataxonomic Surveys. Microb. Ecol. 2021, 81, 535–539. [Google Scholar] [CrossRef] [PubMed]
Figure 1.
Principal component analysis (based on covariance) of the data matrix with soil samples as rows and bacterial phyla relative abundance as variables for analysis: location of soil samples in the plane of principal components 1 and 2 with convex hulls grouping either fields (a) or layers (b). Solid circles denote 0–5 cm layer, and open circles denote 5–15 cm layer.

Figure 2.
Venns diagram of (a) the number of the dominant bacterial OTUs in soil under different tillage treatments with the number of common OTUs (OTUs were considered dominant if they accounted for ≥1% of the total number of sequence reads), and (b) of the total number of OTUs and the number of differentially abundant OTUs (at p ≤ 0.05 level, Fisher’s LSD test).
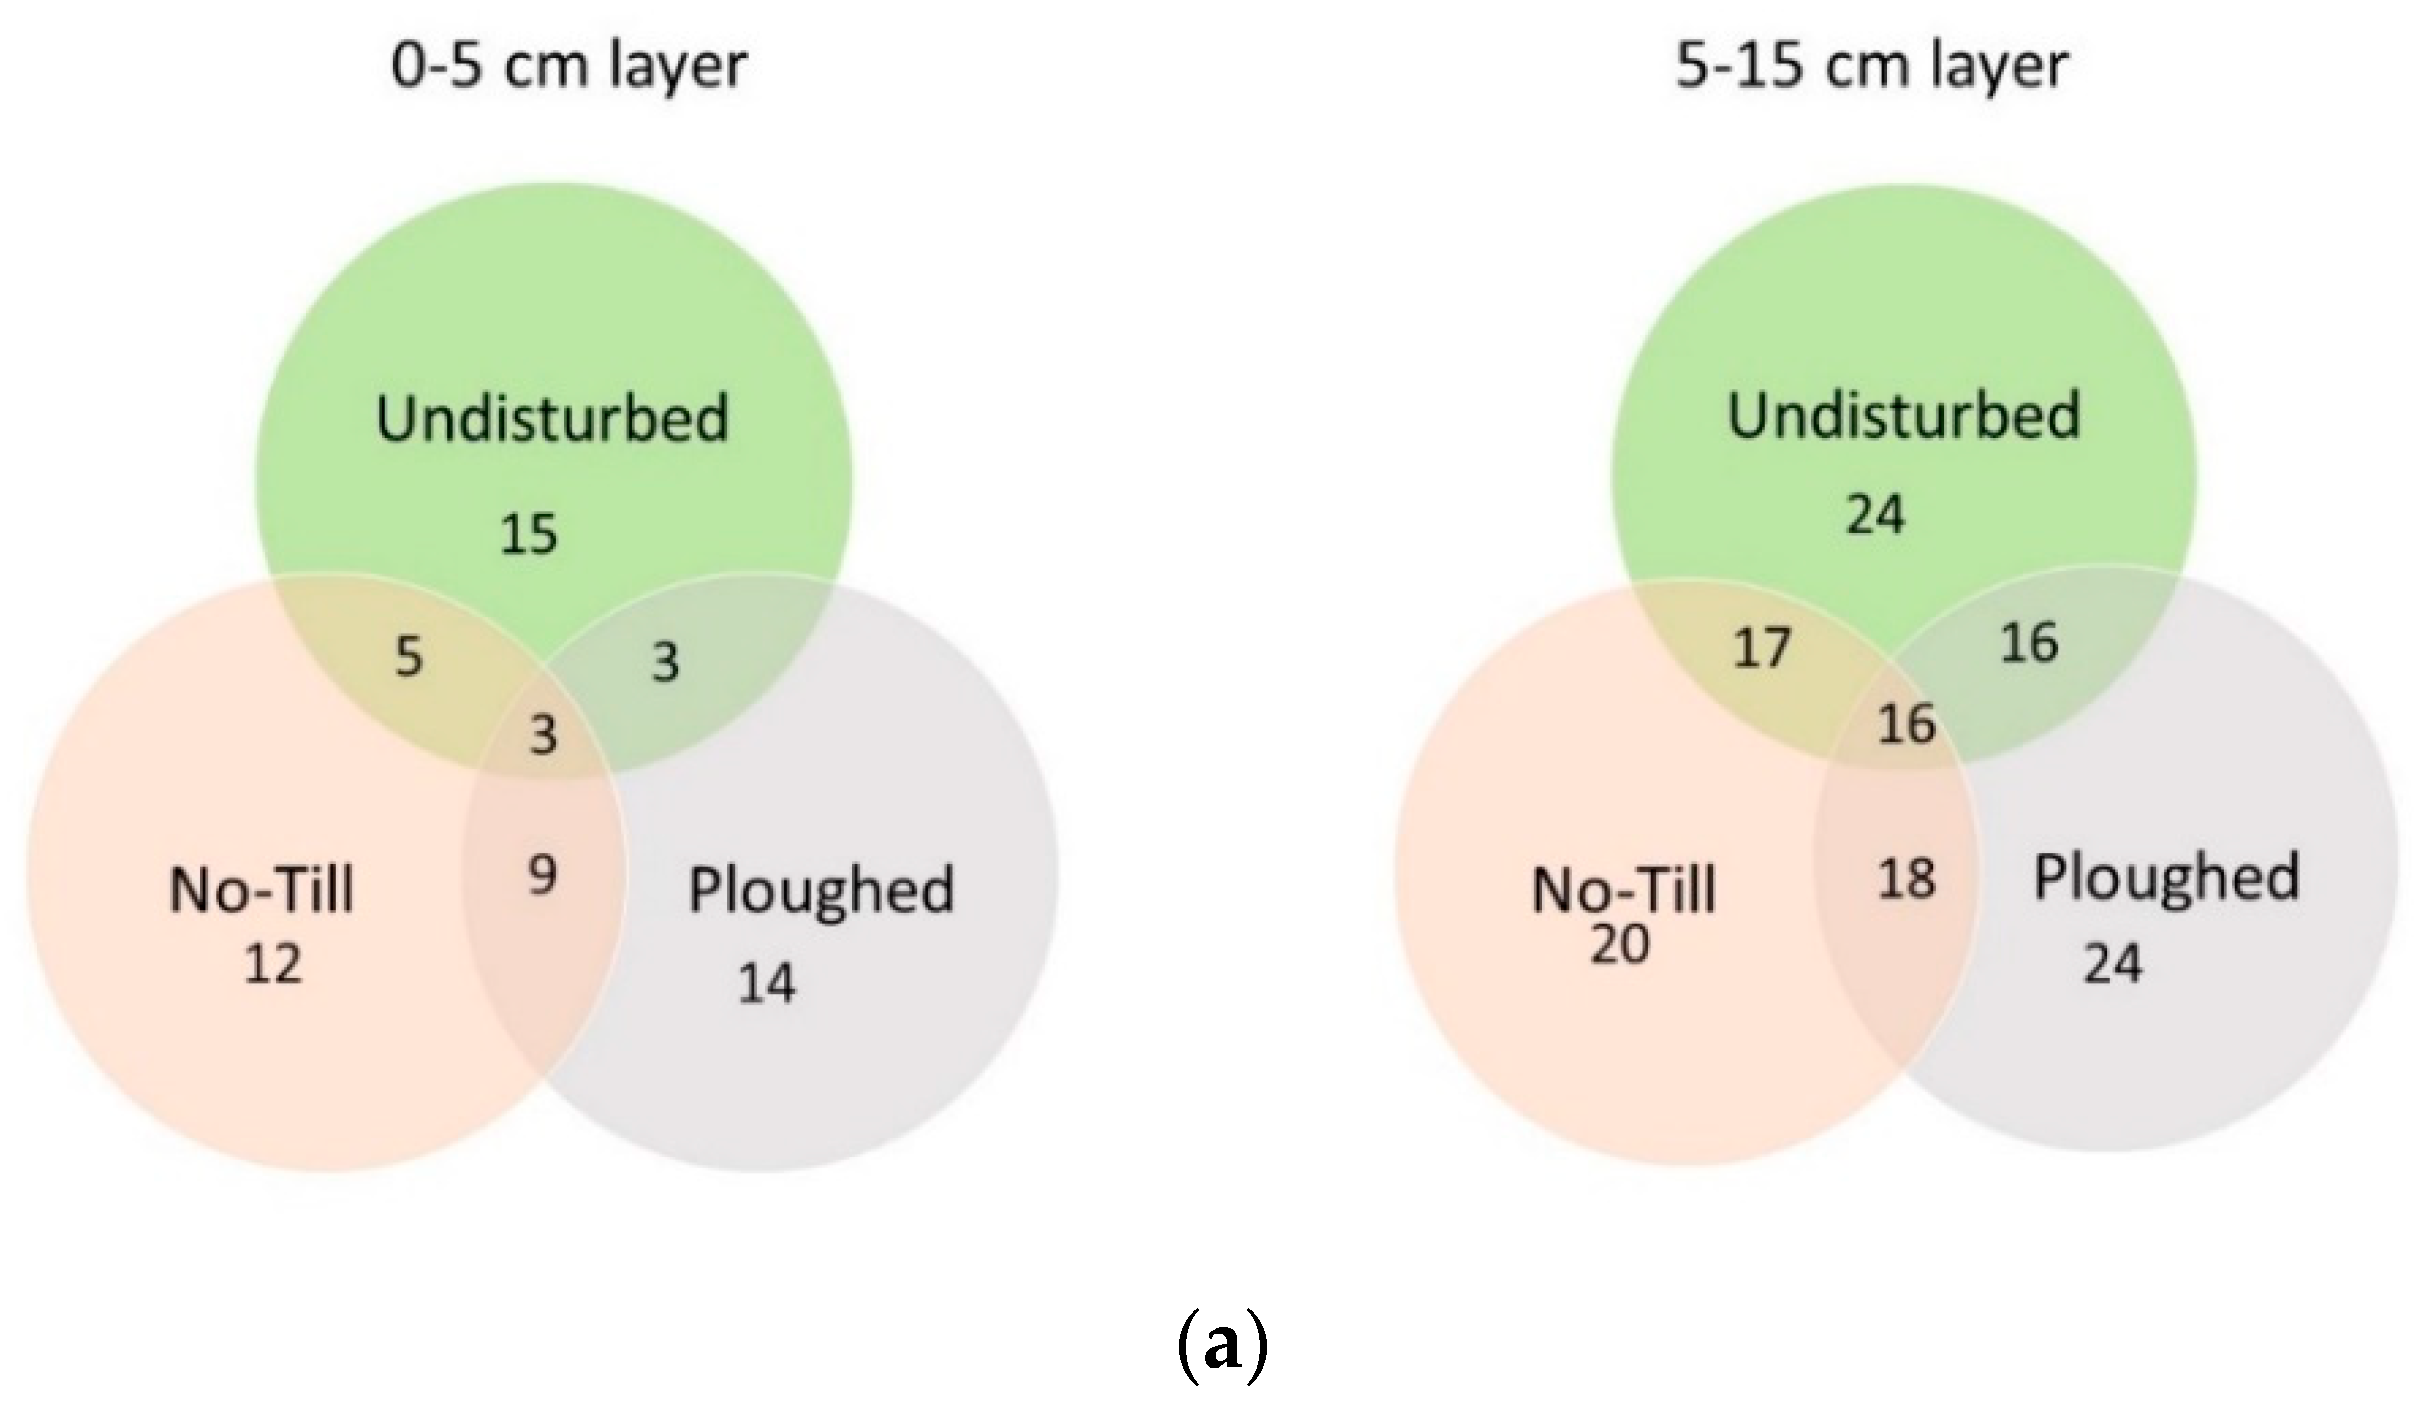
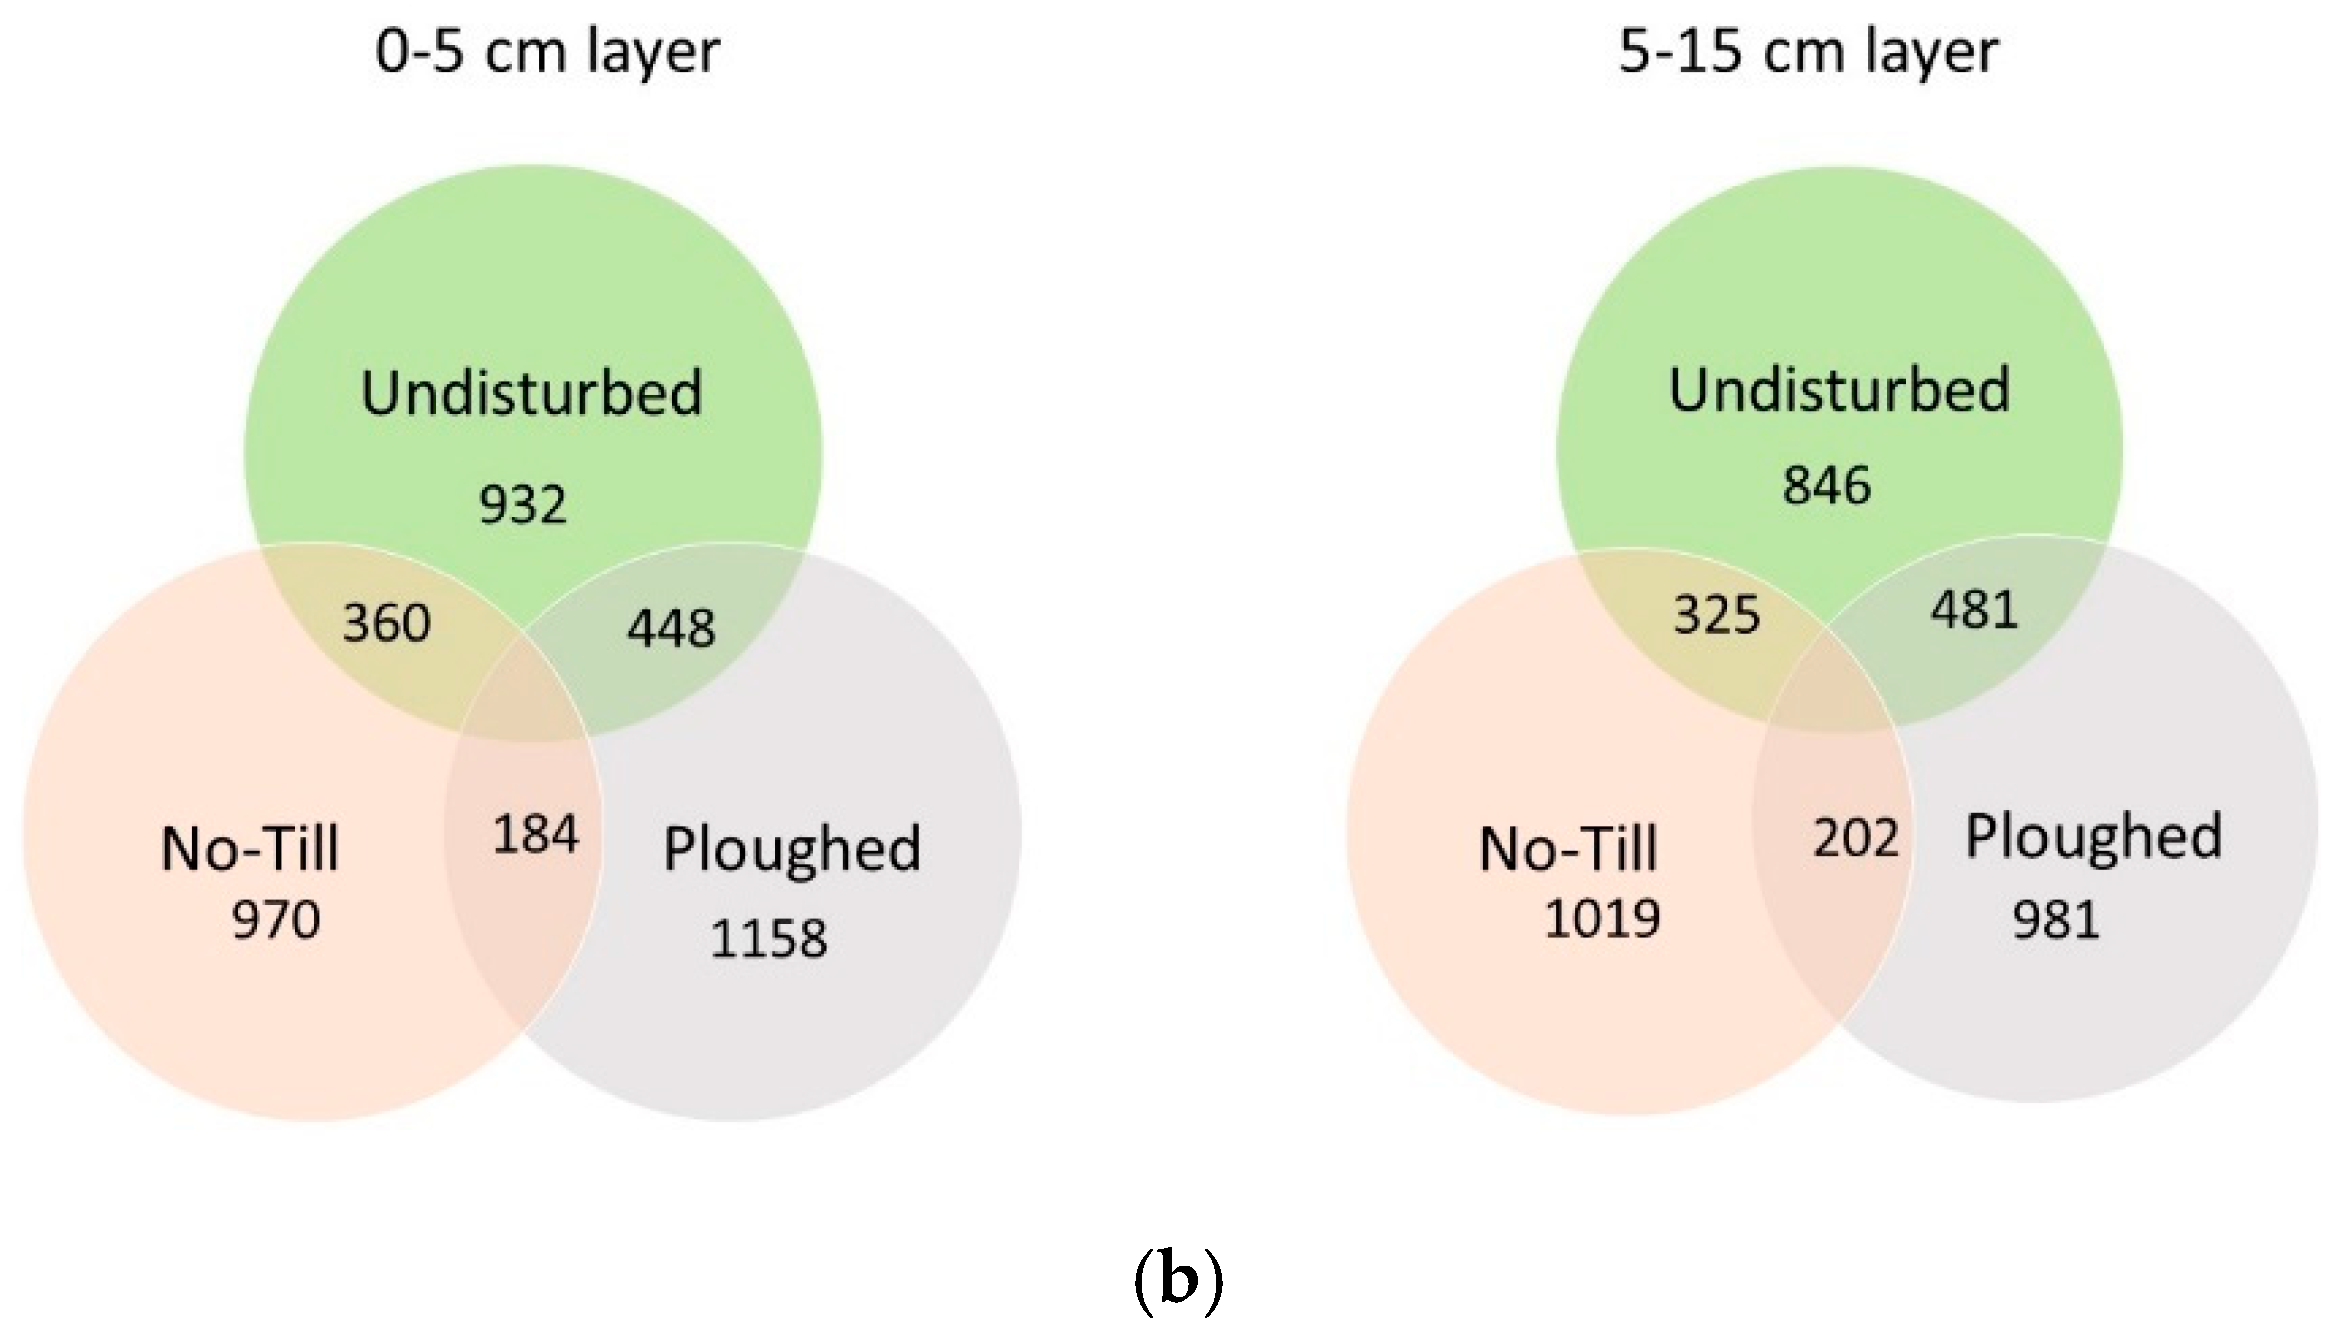
Figure 3.
Principal coordinates analysis of the soil bacteriobiome composition (genus level, Bray-Curtis dissimilarity distance) under different soil tillage management in the forest-steppe zone in West Siberia: location of samples in the plane of the first two coordinates. Symbols: solid circles denote 0–5 cm layer, open circles denote 5–15 cm layer.

Table 1.
Relative abundance (%, mean) of the dominant bacterial phyla and classes in Chernozem of the experimental fields in the south of West Siberia.
Table 1.
Relative abundance (%, mean) of the dominant bacterial phyla and classes in Chernozem of the experimental fields in the south of West Siberia.
| Taxon | Undisturbed | Ploughed | No Till | |||
|---|---|---|---|---|---|---|
| 0–5 cm | 5–15 cm | 0–5 cm | 5–15 cm | 0–5 cm | 5–15 cm | |
| Phylum level | ||||||
| Actinobacteria | 48.2 b 1 | 58.1 d | 38.0 a | 43.5 ab | 47.5 bc | 50.5 c |
| Acidobacteria | 19.6 a | 18.6 a | 32.9 b | 32.4 b | 18.7 a | 24.6 a |
| Proteobacteria | 12.7 b | 6.0 a | 9.3 ab | 5.9 a | 12.2 b | 6.3 a |
| Gemmatimonadetes | 1.9 a | 2.3 ab | 4.4 c | 4.3 c | 6.6 d | 3.5 bc |
| Chloroflexi | 1.3 a | 1.1 a | 3.2 d | 2.5 bc | 2.8 cd | 2.1 b |
| Verrucomicrobia | 4.9 c | 3.7 bc | 1.3 a | 1.3 a | 1.0 a | 1.8 ab |
| Bacteroidetes | 1.6 c | 0.3 a | 0.8 b | 0.4 a | 1.6 c | 0.5 ab |
| Class level | ||||||
| Thermoleophilia | 14.2 a | 29.1 c | 13.6 a | 20.4 b | 11.5 a | 20.6 b |
| Acidobacteria Gp6 | 10.9 ab | 7.1 a | 12.4 b | 14.8 b | 7.3 a | 13.6 b |
| Acidobacteria Gp16 | 2.1 a | 5.5 b | 12.4 c | 10.4 c | 4.6 ab | 4.3 ab |
| Actinobacteria | 22.0 c | 12.5 a | 14.0 b | 10.1 a | 24.5 c | 13.9 b |
| Alphaproteobacteria | 8.5 c | 5.0 ab | 5.4 ab | 4.0 a | 7.2 b | 4.6 ab |
| Spartobacteria | 4.6 b | 3.5 b | 1.0 a | 1.1 a | 0.7 a | 1.6 b |
| Rubrobacteria | 3.7 abc | 2.2 ab | 6.8 c | 4.4 b | 5.7 c | 3.1 ab |
| Acidobacteria | 0.4 a | 0.3 a | 3.1 cd | 2.8 c | 2.1 bc | 1.6 b |
| Gemmatimonadetes | 1.8 b | 0.6 a | 3.0 c | 1.8 b | 4.4 d | 1.6 b |
| Acidimicrobiia | 2.6 ab | 2.4 ab | 2.0 a | 2.4 ab | 2.0 a | 3.0 b |
| Acidobacteria Gp4 | 2.7 c | 2.9 c | 0.2 a | 0.4 a | 0.4 a | 1.5 b |
| Bacilli | 1.3 ab | 1.6 b | 0.2 a | 0.3 a | 0.5 a | 0.7 ab |
| Betaproteobacteria | 1.3 b | 0.3 a | 1.1 b | 0.5 a | 1.3 b | 0.4 a |
| Deltaproteobacteria | 2.2 d | 0.4 a | 1.7 c | 1.0 b | 2.4 d | 0.8 ab |
| Gammaproteobacteria | 0.7 b | 0.1 a | 0.9 c | 0.2 a | 1.2 c | 0.4 ab |
| Chitinophagia | 1.0 b | 0.2 a | 0.5 a | 0.3 a | 1.1 b | 0.4 a |
1 Different letters in rows indicate that the values are different (p ≤ 0.05, Fisher’s LSD test).
Table 2.
Two-way PERMANOVA results for bacterial taxa.
| Source | Sum of Squares | % In Variance | D.f. | Mean Square | F | p |
|---|---|---|---|---|---|---|
| Phylum level | ||||||
| Field | 1979.2 | 47 | 2 | 989.62 | 15.839 | 0.0001 |
| Layer | 543.91 | 13 | 1 | 543.91 | 8.7055 | 0.0018 |
| Interaction | 180.1 | 4 | 2 | 90.051 | 1.4413 | 0.2215 |
| Residual | 1499.5 | 36 | 24 | 62.479 | ||
| Total | 4202.7 | 100 | 29 | |||
| Class level | ||||||
| Field | 1271.2 | 27 | 2 | 635.61 | 10.515 | 0.0001 |
| Layer | 1689.8 | 35 | 1 | 1689.8 | 27.956 | 0.0001 |
| Interaction | 357.29 | 7 | 2 | 178.64 | 2.9554 | 0.0091 |
| Residual | 1450.7 | 30 | 24 | 60.445 | ||
| Total | 4769 | 100 | 29 | |||
| Order level | ||||||
| Field | 1295.3 | 31 | 2 | 647.67 | 11.778 | 0.0001 |
| Layer | 1185.7 | 28 | 1 | 1185.7 | 21.562 | 0.0001 |
| Interaction | 360.25 | 9 | 2 | 180.12 | 3.2755 | 0.002 |
| Residual | 1319.8 | 32 | 24 | 54.992 | ||
| Total | 4161.1 | 100 | 29 | |||
| Family level | ||||||
| Field | 1285.6 | 31 | 2 | 642.82 | 12.224 | 0.0001 |
| Layer | 1190 | 29 | 1 | 1190 | 22.631 | 0.0001 |
| Interaction | 362.79 | 9 | 2 | 181.4 | 3.4496 | 0.0012 |
| Residual | 1262.1 | 31 | 24 | 52.586 | ||
| Total | 4100.5 | 100 | 29 | |||
| Genus level | ||||||
| Field | 1270.4 | 32 | 2 | 635.2 | 12.198 | 0.0001 |
| Layer | 1112.6 | 28 | 1 | 1112.6 | 21.365 | 0.0001 |
| Interaction | 331.84 | 8 | 2 | 165.92 | 3.1862 | 0.0028 |
| Residual | 1249.8 | 32 | 24 | 52.073 | ||
| Total | 3964.6 | 100 | 29 | |||
| OTUs level | ||||||
| Field | 433.33 | 25 | 2 | 216.66 | 6.3671 | 0.0001 |
| Layer | 385.68 | 22 | 1 | 385.68 | 11.334 | 0.0001 |
| Interaction | 123.89 | 7 | 2 | 61.944 | 1.8203 | 0.0386 |
| Residual | 816.69 | 46 | 24 | 34.029 | ||
| Total | 1759.6 | 100 | 29 | |||
Table 3.
Relative abundance (%, mean) of the dominant bacterial genera in Chernozem of the experimental fields in the south of West Siberia.
Table 3.
Relative abundance (%, mean) of the dominant bacterial genera in Chernozem of the experimental fields in the south of West Siberia.
| Genus | Undisturbed | Ploughed | No Till | |||
|---|---|---|---|---|---|---|
| 0–5 cm | 5–15 cm | 0–5 cm | 5–15 cm | 0–5 cm | 5–15 cm | |
| Actinoplanes | 2.6 d, 1 | 0.0 a | 0.4 b | 0.0 a | 1.5 c | 0.1 ab |
| Bacillus | 1.0 b | 1.1 b | 0.1 a | 0.0 a | 0.2 ab | 0.3 ab |
| Blastococcus | 0.0 a | 0.0 a | 3.3 c | 1.4 b | 4.7 d | 1.5 b |
| Gaiella | 1.5 a | 13.9 d | 6.2 b | 11.7 c | 2.9 a | 10.2 c |
| Acidobacteria_Gp4 | 2.9 c | 2.9 c | 0.4 a | 0.5 a | 0.5 a | 1.6 b |
| Acidobacteria_Gp6 | 11.0 ab | 7.1 a | 12.4 b | 14.9 b | 7.3 a | 13.6 b |
| Acidobacteria_Gp16 | 2.1 a | 5.6 b | 13.0 c | 10.9 c | 4.7 ab | 4.4 ab |
| Kribbella | 1.0 b | 1.0 b | 0.4 a | 0.5 ab | 0.9 b | 0.8 ab |
| Microlunatus | 2.5 a | 4.1 ab | 1.9 a | 2.4 a | 5.1 b | 4.1 ab |
| Pseudonocardia | 3.2 c | 0.3 a | 0.7 a | 0.6 a | 2.0 b | 0.8 a |
| Rubrobacter | 3.7 ab | 2.2 a | 6.8 b | 4.4 ab | 5.7 b | 3.1 a |
| Solirubrobacter | 0.8 a | 1.5 a | 1.4 a | 1.3 a | 1.8 a | 1.0 a |
| Spartobacteria_gis | 4.6 b | 3.5 b | 0.9 a | 1.1 a | 0.7 a | 1.5 a |
| un. 2 Acidimicrobiales | 0.9 b | 1.4 c | 0.4 a | 1.0 b | 0.4 a | 1.4 c |
| un. Acidobacteria | 0.8 a | 0.7 a | 3.7 c | 3.4 bc | 3.1 b | 2.3 b |
| un. Actinobacteria | 9.2 c | 16.7 e | 3.0 a | 9.0 c | 5.5 b | 13.1 d |
| un. Chloroflexi | 0.4 a | 0.5 ab | 1.5 d | 1.0 c | 1.3 d | 0.7 b |
| un. Gemmatimonadaceae | 1.4 b | 0.5 a | 2.7 c | 1.7 b | 3.7 d | 1.5 b |
| un. Gemmatimonadetes | 0.1 a | 1.7 b | 1.3 ab | 2.5 b | 2.1 b | 1.9 b |
| un. Micromonosporaceae | 2.3 c | 0.9 b | 0.4 a | 0.5 ab | 0.6 ab | 0.8 b |
| un. Rhizobiales | 4.3 b | 4.2 b | 1.5 a | 1.8 a | 0.9 a | 2.3 a |
| un. Solirubrobacterales | 9.1 c | 8.9 c | 4.8 a | 5.5 ab | 5.8 ab | 7.0 b |
| un. Thermoleophilia | 2.6 c | 4.6 d | 1.0 a | 1.8 b | 0.8 a | 2.3 bc |
1 Different letters in rows indicate that the values are different (p ≤ 0.05, Fisher’s LSD test). 2 un. stands for unclassified.
Table 4.
Alpha-biodiversity indices (calculated on the OTU’s basis) of bacteriobiomes in the Chernozem of the experimental fields in the south of West Siberia.
Table 4.
Alpha-biodiversity indices (calculated on the OTU’s basis) of bacteriobiomes in the Chernozem of the experimental fields in the south of West Siberia.
| Index | Undisturbed | Ploughed | No Till | |||
|---|---|---|---|---|---|---|
| 0–5 cm | 5–15 cm | 0–5 cm | 5–15 cm | 0–5 cm | 5–15 cm | |
| OTU richness | 932 ab, 1 | 846 a | 1158 b | 981 ab | 970 ab | 1019 ab |
| Chao-1 | 1349 ab | 1160 a | 1562 b | 1415 ab | 1402 ab | 1399 ab |
| Simpson (S) | 0.989 b | 0.985 a | 0.986 ab | 0.988 ab | 0.987 ab | 0.988 ab |
| Shannon’s | 5.55 b | 5.11 a | 5.51 b | 5.32 ab | 5.47 b | 5.40 b |
| Evenness | 0.28 c | 0.20 a | 0.22 ab | 0.21 a | 0.25 b | 0.22 ab |
| Equitability | 0.81 d | 0.76 a | 0.79 bc | 0.77 ab | 0.80 c | 0.78 b |
| Berger-Parker | 0.05 a | 0.05 a | 0.07 b | 0.05 ab | 0.06 ab | 0.05 a |
| Dominance (1-S) | 0.011 a | 0.015 b | 0.014 ab | 0.012 ab | 0.013 ab | 0.012 ab |
1 Different letters in rows indicate that the values are different (p ≤ 0.05, Fisher’s LSD); the absence of letters after the values in a row indicates that there was no difference.
Disclaimer/Publisher’s Note: The statements, opinions and data contained in all publications are solely those of the individual author(s) and contributor(s) and not of MDPI and/or the editor(s). MDPI and/or the editor(s) disclaim responsibility for any injury to people or property resulting from any ideas, methods, instructions or products referred to in the content. |
© 2023 by the authors. Licensee MDPI, Basel, Switzerland. This article is an open access article distributed under the terms and conditions of the Creative Commons Attribution (CC BY) license (https://creativecommons.org/licenses/by/4.0/).
Share and Cite
MDPI and ACS Style
Naumova, N.; Barsukov, P.; Baturina, O.; Rusalimova, O.; Kabilov, M. West-Siberian Chernozem: How Vegetation and Tillage Shape Its Bacteriobiome. Microorganisms 2023, 11, 2431. https://doi.org/10.3390/microorganisms11102431
AMA Style
Naumova N, Barsukov P, Baturina O, Rusalimova O, Kabilov M. West-Siberian Chernozem: How Vegetation and Tillage Shape Its Bacteriobiome. Microorganisms. 2023; 11(10):2431. https://doi.org/10.3390/microorganisms11102431
Chicago/Turabian StyleNaumova, Natalia, Pavel Barsukov, Olga Baturina, Olga Rusalimova, and Marsel Kabilov. 2023. "West-Siberian Chernozem: How Vegetation and Tillage Shape Its Bacteriobiome" Microorganisms 11, no. 10: 2431. https://doi.org/10.3390/microorganisms11102431
Note that from the first issue of 2016, this journal uses article numbers instead of page numbers. See further details here.