Article

Application of Meta-Analysis and Machine Learning Methods to the Prediction of Methane Production from In Vitro Mixed Ruminal Micro-Organism Fermentation

by
Jennifer L. Ellis
1,*,
Héctor Alaiz-Moretón
2,
Alberto Navarro-Villa
3,4,
Emma J. McGeough
3,5,
Peter Purcell
3,
Christopher D. Powell
1,
Padraig O’Kiely
3,
James France
1 and
Secundino López
6,*
1
Centre for Nutrition Modelling, Department of Animal Biosciences, University of Guelph, 50 Stone Road East, Guelph, ON N1G 2W1, Canada
2
Departamento de Ingeniería Eléctrica de Sistemas y Automática, Escuela de Ingeniería Industrial e Informática, Universidad de León, Campus Universitario de Vegazana, 24071 León, Spain
3
Animal & Grassland Research and Innovation Centre, Teagasc, Grange, Dunsany, Co. Meath C15 PW93, Ireland
4
Trouw Nutrition R&D, Ctra. CM-4004 km 10.5, 45950 El Viso de San Juan, Spain
5
Department of Animal Science, University of Manitoba, Winnipeg, MB R3T 2N2, Canada
6
Instituto de Ganadería de Montaña (IGM), CSIC-Universidad de León, Departamento de Producción Animal, Universidad de León, 24007 León, Spain
*
Authors to whom correspondence should be addressed.
Animals 2020, 10(4), 720; https://doi.org/10.3390/ani10040720
Submission received: 10 April 2020 / Revised: 16 April 2020 / Accepted: 16 April 2020 / Published: 21 April 2020
(This article belongs to the Special Issue In Vitro Digestibility in Animal Nutritional Studies)

Abstract

:

Simple Summary

In vitro gas production systems are regularly utilized to screen feed ingredients for inclusion in ruminant diets. However, not all in vitro systems are set up to measure methane (CH4) production, nor do all papers report in vitro CH4. Therefore, the objective of this study was to develop models to predict in vitro production of CH4, a greenhouse gas produced by ruminants, from in vitro gas and volatile fatty acid (VFA) production data, and to identify the major drivers of CH4 production in these systems. Meta-analysis and machine learning (ML) methodologies were applied to predict CH4 production from in vitro gas parameters. Meta-analysis results indicate that equations containing apparent dry matter (DM) digestibility, total VFA production, propionate, valerate and feed type (forage vs. concentrate) resulted in best prediction of CH4. The ML models far exceeded the predictability achieved using meta-analysis, but further evaluation on an external database would be required to assess their generalization capacity. The models developed can be utilized to estimate CH4 emissions in vitro.

Abstract

In vitro gas production systems are utilized to screen feed ingredients for inclusion in ruminant diets. However, not all in vitro systems are set up to measure methane (CH4) production, nor do all publications report in vitro CH4. Therefore, the objective of this study was to develop models to predict in vitro CH4 production from total gas and volatile fatty acid (VFA) production data and to identify the major drivers of CH4 production in these systems. Meta-analysis and machine learning (ML) methodologies were applied to a database of 354 data points from 11 studies to predict CH4 production from total gas production, apparent DM digestibility (DMD), final pH, feed type (forage or concentrate), and acetate, propionate, butyrate and valerate production. Model evaluation was performed on an internal dataset of 107 data points. Meta-analysis results indicate that equations containing DMD, total VFA production, propionate, feed type and valerate resulted in best predictability of CH4 on the internal evaluation dataset. The ML models far exceeded the predictability achieved using meta-analysis, but further evaluation on an external database would be required to assess generalization ability on unrelated data. Between the ML methodologies assessed, artificial neural networks and support vector regression resulted in very similar predictability, but differed in fitting, as assessed by behaviour analysis. The models developed can be utilized to estimate CH4 emissions in vitro.

1. Introduction

Globally, greenhouse gas (GHG) emissions from the agriculture, forestry and other land use (AFOL) sector account for ~23% of the global anthropogenic GHG total emissions [1], with enteric methane (CH4) from fermentation in the forestomach of ruminants representing 32%–40% of that total [1] (thereby 7.4%–9.2% of the global anthropogenic total). From the farmer’s perspective, CH4 also represents an energy loss and an inefficiency of production, ranging from approximately 3.0 (feedlot cattle) to 7.0 (forage fed cattle) percent of gross energy intake, with a ±20% uncertainty [2]. As a result, and to meet public expectation for sustainably produced food products, the agriculture sector has mobilized to examine a large array of potential CH4 (as well as N and P excretion) mitigation strategies [3,4,5], to reduce the environmental impact of livestock and food production.
At the animal level, CH4 is produced as a byproduct of anaerobic fermentation in the rumen and hindgut of ruminants, whereby methanogens utilize H2 to obtain ATP by reducing CO2 to CH4 [6]. The removal of H2 through methanogenesis, the main H-sink in the rumen [6], prevents the inhibitory effect of H2 on ruminal fermentation and allows for the degradation and fermentation of feed to proceed. When methanogenesis is reduced, other pathways must be promoted to utilize H2 or otherwise fermentation, digestibility and intake may be negatively affected [6].
As animal experiments to evaluate feedstuffs and feed additives are costly, time consuming and do not guarantee conclusive outcomes, the in vitro gas production technique represents a viable option for prescreening or screening of feedstuffs/additives for potential inclusion in the ration of modern dairy cows, beef cattle and other ruminants. However, CH4 is often, but not always, included in the gases measured during in vitro incubation (particularly in developing countries where equipment may be unaffordable, unavailable or limited, for example). A reliable measure of CH4 from in vitro cultures of mixed ruminal micro-organisms would be a useful tool to assess the potential dietary effects on methanogenesis. Estimation of CH4 from the output of other fermentation end-products commonly measured in vitro could be a suitable alternative, and Jayanegara [7] proposed the use of the stoichiometric equations of Hegarty and Nolan [8] and of Moss et al. [9] to predict in vitro CH4. However, using this approach CH4 was generally overpredicted, presumably because in vitro H2 recovery observed in practice was substantially less than that assumed by the stoichiometric models. The objectives of this study were therefore to: (1) to develop empirical models to predict in vitro CH4 production from in vitro gas production measures—via meta-analysis (multiple linear regression) and machine learning (ML) methods (artificial neural networks, ANN, and support vector regression, SVR), and (2) to identify the fermentation parameters most closely related to CH4 production in vitro.

2. Materials and Methods

2.1. Database

The database compiled for this study consisted of 397 in vitro rumen fermentation bottle means (each the average of 3–5 replicate measurements), taken after 24 h of incubation, from 13 experiments reported in 10 publications [10,11,12,13,14,15,16,17,18,19] (experiments 1–3 were from publication [10]), plus 1 unpublished study [20]. As a result, experimental animals were not directly employed in this study. In accordance with the National Centre for the Replacement Refinement and Reduction of Animals in Research (NC3Rs), per Directive 2010/63/EU, all study data used were publicly available (with the exception of the one unpublished study) as reported in the aforementioned articles. Studies evaluated the in vitro gas and CH4 production from oven-dried feedstuffs, including ryegrass, forbs, grass silages, clover, maize silage and other whole-crop cereal silages and concentrate feeds (no feed additives or rumen modifiers were included in the database). Feed type (FT) was categorized as either forage (FT = 1) or concentrate (FT = 2). The database included in vitro measurements of CH4 gas production (CH4i, mL/g DM incubated, and CH4d, mL/g DM apparently digested), total gas production (TGP, mL/g DM incubated), apparent DM digestibility (DMD, g/g), volatile fatty acid production (VFA, mmol/g DM incubated), molar proportions of acetic acid (AC, mmol/mol VFA), propionic acid (PR, mmol/mol VFA), butyric acid (BT, mmol/mol VFA) and valeric acid (VL, mmol/mol VFA), the acetate to propionate ratio (C2C3) and the incubation medium final pH (pH). Daily production of each volatile fatty acid (ACp, PRp, BTp or VLp for mmol AC, PR, BT or VL produced per g DM incubated, respectively) was calculated from total VFA and the corresponding molar proportions. Variable abbreviations, units and descriptions are also summarized in Appendix A (Table A1). When digestibility is measured during in vitro batch cultures of mixed ruminal micro-organisms, it is assumed that DM disappearance after the incubation time (in this particular case 24 h) is an acceptable metric of apparent DM digestibility. Due to missing data, two studies [11,12], were removed from the database, leaving 354 observations from 11 experiments.
For model development and evaluation purposes, the dataset (n = 354) was divided into two subsets, the first one for training and model development purposes (70% of data, n = 247, with 4 outlier data points removed for meta-analysis), and the second one for model testing and evaluation (internal evaluation) purposes (30% of data, n = 107). Aside from 4 data points which were removed for the meta-analysis (statistical outliers), the ‘two’ developmental datasets were identical. Division of data points into the training or evaluation datasets was via random assignment, but each contained a proportional number of observations relative to the FT variable. Descriptive statistics for the training and evaluation datasets are provided in Table 1.
Independent testing of the model gives a measure of the model’s ‘generalization ability’ (‘test error’), or the ability to make predictions on unseen data. This is particularly important for some ML approaches, which may achieve very accurate predictions, but essentially model the noise in the data.

2.2. Model Fitting—Meta-Analysis

The main effects of in vitro fermentation variables (TGP, DMD, VFA, AC, ACp, PR, PRp, BT, BTp, VL, VLp, C2C3 and final pH) were analyzed for inclusion in predictive models using the PROC MIXED procedure of SAS [21] to predict CH4i (mL/g incubated DM), or CH4d (mL/g DM apparently digested). Equations were fitted to the training dataset (Table 1—meta-analysis).
The mixed model analysis was chosen because the data were compiled from multiple studies, and thus the experiment was considered as a random effect [22]. If, when running the model, the random covariance or the random slope was not significant, they were removed from the model or simplified [22], though the random intercept term was always retained. The dual quasi-Newton technique was used for optimization with an adaptive Gaussian quadrature as the integration method. Normal distribution of the random study effect was assessed via Q–Q distribution plot, and normality of residuals via examination of the residual plots (PROC MIXED).
Three approaches were taken to fitting mixed models to this dataset: (1) univariate analysis of each dependent–independent variable combination (explanatory variable in linear, quadratic or cubic form); (2) multivariate analysis, preceded by examination in PROC REG (MaxR) and assessment for collinearity between driving variables in PROC CORR/visual plotting; and (3) multivariate analysis based on known biological principles. Approaches (2) and (3) are not distinguished/presented separately in the results, as both are considered ‘multivariate’. A fourth approach was also included for comparison with the ML models (described below): (4) where all driving variables were included, irrespective of significance or collinearity (linear equation form). With the exception of approach (4), only equations with significant slope parameters (p < 0.05) and normally distributed residuals/random effects were retained and evaluated.

2.3. Model Fitting—Machine Learning

The in vitro fermentation variables (TGP, DMD, VFA, AC, PR, BT, VL, C2C3 and final pH) were retained as potential driving variables for development of ML-based predictive models for CH4i and CH4d. Predictive models were fitted on the training dataset (Table 1—Machine learning). The raw dataset was subjected to a preprocessing normalization process (standard scalar) [23] according to:
Z = ( X u ) / S
where Z is the normalized value, X is the raw value, u is the mean of the training samples and S is the standard deviation of the training samples. The objective of this normalization step was to improve the convergence of the training process in the regression methods utilized [24]. Subsequently, two ML techniques (support vector regression and artificial neural network) were implemented using the Scikit-learn software library [25] for the Python programming language [26]. For both ML approaches, a 10-fold cross-validation procedure was used to fit the predictive models to the training dataset (n = 247; the evaluation database, n = 107, was therefore not included in this analysis). The training dataset was subsequently randomly split into 10 equal subgroups, and the model was trained using nine of the subsets and validated on the remaining one part of the data to compute a performance measure. This holdout process was repeated for each of the 10-folds, such that each subset was utilized for validation, whereas the other nine subsets were pooled for the training, in turn. The error estimation was averaged over the 10 iterations to assess the fit performance.

2.3.1. Support Vector Regression

Support Vector Machine (SVM) is a ML technique based on supervised learning with a modality oriented for regression problems, namely Support Vector Regression (SVR), able to forecast continuous variables [27] (in this case, CH4 from in vitro cultures of mixed ruminal micro-organisms). The SVR method transforms the input data (previously normalized) into a multidimensional space by using nonlinear mapping, and a linear regression procedure is applied to each hyperplane obtained to calculate the desired output. The SVR method is developed by changing the kernel function and tuning the parameters C (the regularization parameter), γ (the kernel coefficient), Tol (tolerance for stopping criterion) and degree of the polynomial. Three ‘kernel’ functions were considered—linear, radial basis function and polynomial. The ranges of values used for the parameter optimization were C ∈ {1, 10, 100, 1000}, Tol ∈ {0.1, 0.01}, γ ∈ {1, 0.1, 0.01, 0.001} and degree (only for the polynomial function) ∈ {2, 3, 4, 5, 6}. Grid search combined with cross-validation [27] were used to achieve the best combination of parameters resulting in the optimal and most robust SVR model solution, on the basis of the ε-insensitive loss function. The best SVR models for both variables to be predicted (CH4i or CH4d) were obtained using the radial basis function as kernel, with the parameter values C = 1000, Tol = 0.1 and γ = 1.

2.3.2. Artificial Neural Network—Multilayer Perceptron

A multilayer perceptron (MLP) is a machine learning method based on supervised learning, and is a specific topology of a feedforward artificial neural network (ANN) [28]. The MLP network used for the current study was composed of three layers of nodes: the input layer, one hidden layer and an output layer. Achieving the optimal MLP architecture can require tuning a number of hyperparameters such as the number of hidden layers, neurons or iterations. For the current study, one hidden layer was applied and the rectified linear unit (ReLU) nonlinear activation function was implemented in each node (neuron) of this hidden layer (except the input nodes). On the other hand, the single neuron of the output layer utilized the linear activation function [28]. The training procedure was based on the backpropagation technique, using grid search combined with cross-validation [28] to derive the best combination of parameters resulting in the optimal and most robust MLP model solution. The square-error loss function and the limited-memory Broyden–Fletcher–Goldfarb–Shanno (L-BFGS) numerical method were used for optimization. The number of hidden neurons in the best MLP models was 26 and 27 for CH4i and CH4d predictions, respectively, (the range tested was from 12–30 neurons in the hidden layer). Other hyperparameters were included in the grid for tuning aiming to optimize the training of the ANN. The best results were observed when early stopping was activated (to prevent overfitting), any prior attributes stored on the estimator were cleared (“warm start” disabled), initial learning rate was set at 10−7 and kept constant, and the batch size for each iteration was equal to 1.

2.4. Model Evaluation

Model predictions developed in the current study (via meta-analysis, SVR or ANN) were evaluated using an independent data subset (internal evaluation, as the data are independent but related to the training dataset), described in Section 2.1 and in Table 1. Models were evaluated for their predictability using mean square prediction error (MSPE), calculated as:
MSPE = i = 1 n ( O i P i ) 2 n
where Oi is the observed value, Pi is the predicted value and n is the number of observations. Square root of the MSPE (RMSPE), expressed as a proportion of the observed mean (RMSPE, %), gives an estimate of the overall prediction error. The RMSPE was decomposed into random (disturbance) error (ED), error due to deviation of the regression slope from unity (ER), and error in central tendency due to overall bias (EB) [29]. The EB, ER and ED fractions of MSPE were calculated as:
EB = ( P ¯ O ¯ ) 2
ER = ( S p R × S o ) 2
ED = ( 1 R 2 ) × S o 2
where P ¯ and O ¯ are the predicted and observed means, Sp is the standard deviation of predicted values, So is the standard deviation of observed values and R is the Pearson correlation coefficient.
Correspondence between predicted and observed values was also assessed by the concordance correlation coefficient (CCC) [30], which was calculated as:
CCC = R × C b
where Cb is a bias correction factor (a measure of accuracy), and R is the Pearson correlation coefficient (a measure of precision). The Cb variable is calculated as:
C b = 2 ( ν + 1 ν + μ 2 )
where
ν = S o S p
μ = O ¯ P ¯ ( S o S p )
so that ν provides a measure of scale shift, while µ provides a measure of location shift. The ν value indicates the change in standard deviation, if any, between predicted and observed values. A positive µ value indicates underprediction, while a negative µ indicates overprediction. Predictions were further evaluated visually against observations (via predicted vs. observed plots) as well as against residuals (residual vs. predicted, not shown).
As one criticism of many ML methodologies remains their lack of transparency (i.e., no predictive equation is produced), models developed via ANN and SVR were further evaluated using behaviour analysis, where model inputs were systematically altered ±10% (in isolation) and the model’s ‘behavioural’ response (% change in output prediction) was assessed (direction and magnitude).

3. Results

3.1. Correlation Matrix Analysis

Potential X variables were evaluated against each other via correlation matrix analysis, to determine the extent of collinearity between X variables (Table 2). X variables that were highly collinear with each other (correlation >0.500) are highlighted in grey (Table 2). X variables that were highly collinear included TGP and DMD, TGP and VFA/ACp/PRp, VFA and ACp/PRp/BTp, AC and PR/PRp, ACp and PRp/BTp, PR and PRp, PRp and BTp, BT and BTp, pH and BTp. These combinations were therefore avoided in multivariate meta-analysis equation development.
Correlation analysis was also used to examine potential correlations between X and Y variables (Table 2). The X variables moderately correlated (>0.300) with CH4d included DMD (−0.408), AC (0.405), ACp (0.350) and PR (−0.396), while X variables moderately correlated (>0.300) with CH4i included DMD (0.399), TGP (0.755), VFA (0.472), ACp (0.472), PRp (0.326) and BTp (0.315).

3.2. Univariate Meta-Analysis Models

Seventy-eight univariate equations to predict CH4d or CH4i were developed and evaluated with the variables presented in Table 2, in linear, quadratic or cubic form. Those with nonsignificant slope parameters or model fitting (fixed or random) problems were discarded, and the remaining equations (n = 22) were assessed on the evaluation dataset. On average, the CH4i outcome was predicted with higher CCC and lower RMSPE values compared to the CH4d outcome (Table 3). The best six performing equations have their model evaluation results presented in Table 3. The best performing univariate equations included the X variables ACp, PRp, DMD, VLp, VFA and TGP. The best performing univariate equations were those predicting CH4i with TGP as a driving X variable, with a CCC on the evaluation database of 0.644 (quadratic) and 0.650 (linear) (Table 3).
The results of univariate equation development (Table 3) agreed roughly with the correlation analysis (Table 2), where the variables most highly correlated with CH4i (TGP, VFA, ACp, VLp, DMD) and CH4d (DMD, AC, C2C3, PR) (Table 2) appeared in the best performing univariate equations (Table 3). Some differences were evident, for example in the R-values, which may be explained by the difference in approach (correlation across all data points vs. correlation within study). The best performing univariate equations (U6, U12) were as follows:
CH4d (mL CH4/g DM digested) = 58.52 (± 3.210) − 21.24 (± 3.045) × DMD (DM digestibility) (U6)
CH4i (mL CH4/g DM incubated) = 3.00 (± 1.546) + 0.149 (± 0.005) × TGP (mL/g DM incubated) (U12)

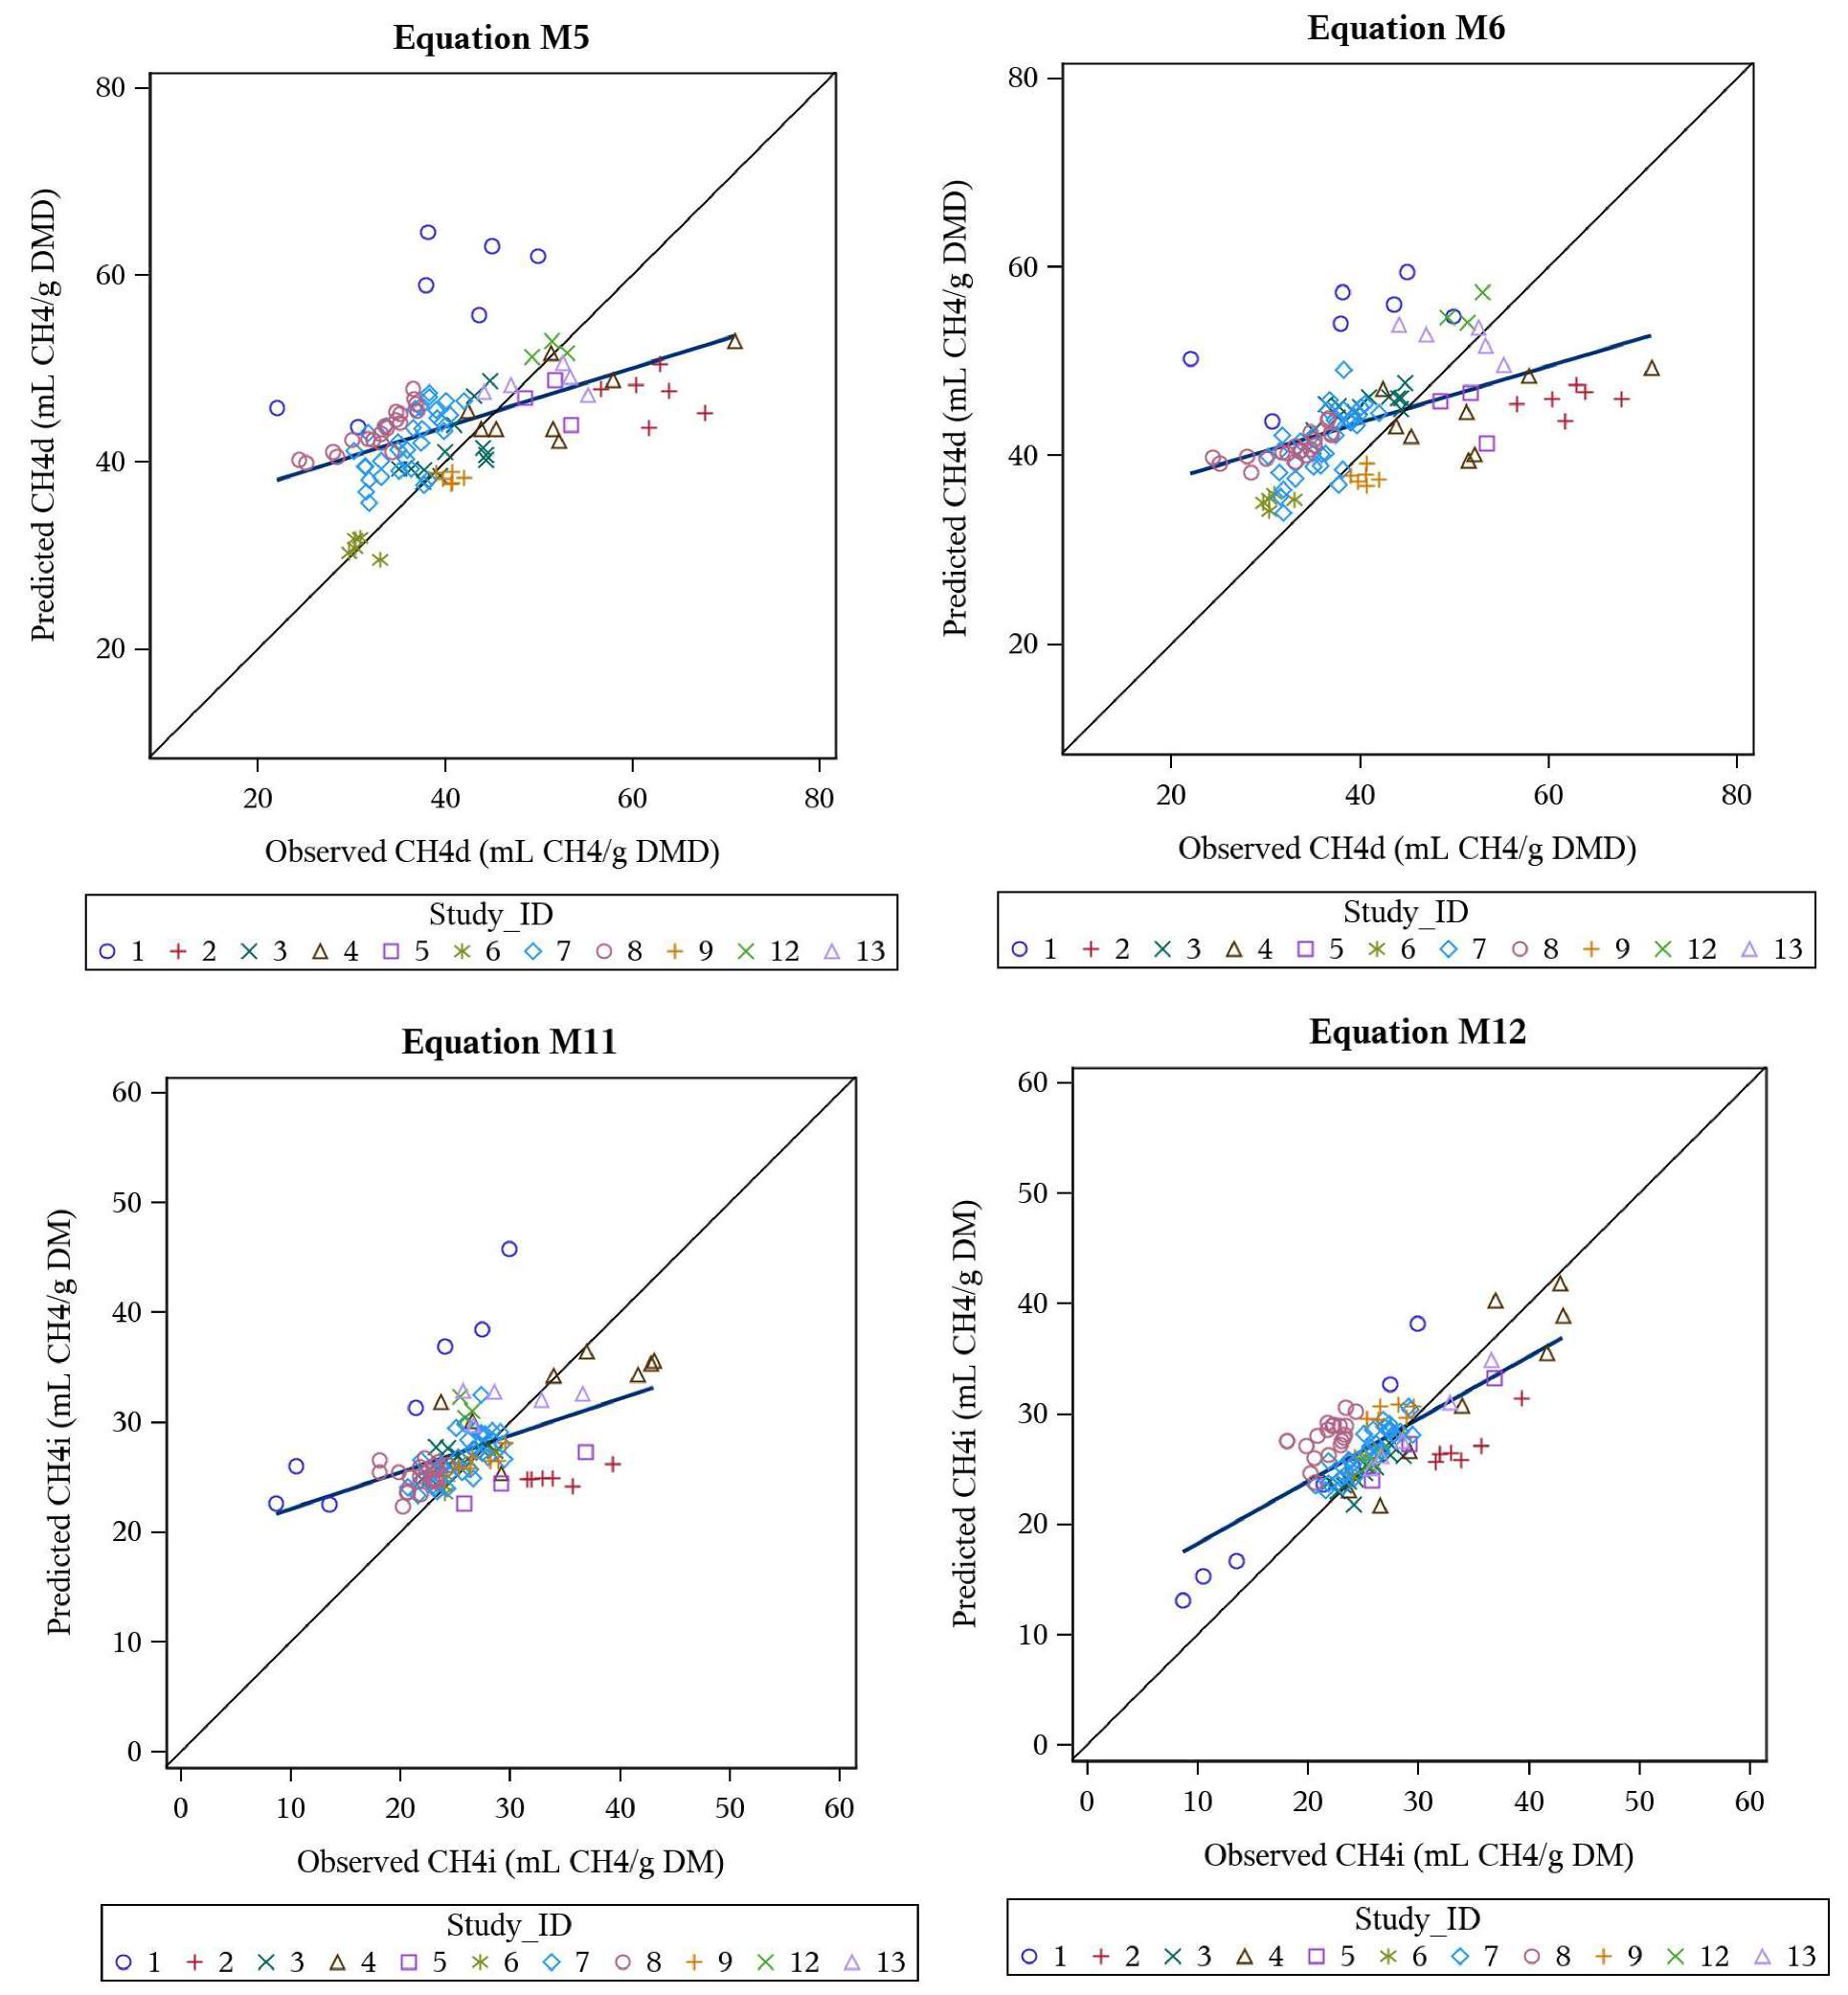
3.3. Multivariate Meta-Analysis Models

Seventy-two multivariate equations, to predict CH4d or CH4i, were developed and evaluated with the variables presented in Table 2, in linear combinations. Those with nonsignificant slope parameters, model fitting problems (fixed or random) or had multiple X variables which were previously deemed to be collinear (Table 2) were discarded, and the remaining equations (n = 29) were evaluated on the evaluation dataset. Evaluation of the top six performing multivariate equations (for each of CH4d and CH4i) is reported in Table 4.
Best performing equations for CH4d included (1) equation M5 (CCC = 0.419) with DMD, VFA, PR, FT and VL as X variables, as well as (2) M6 (CCC = 0.425) with DMD and VFA as X variables (Table 4). Best performing equations for CH4i included (1) equation M11 (CCC = 0.438) with VFA and FT as X variables, and (2) equation M12 (CCC = 0.703) with PR, VL and TGP as X variables (Table 4).
The overall best performing equations (from univariate or multivariate origin, CH4d, CH4i) are presented in Table 5, and their predicted vs. observed plots are illustrated in Figure 1.

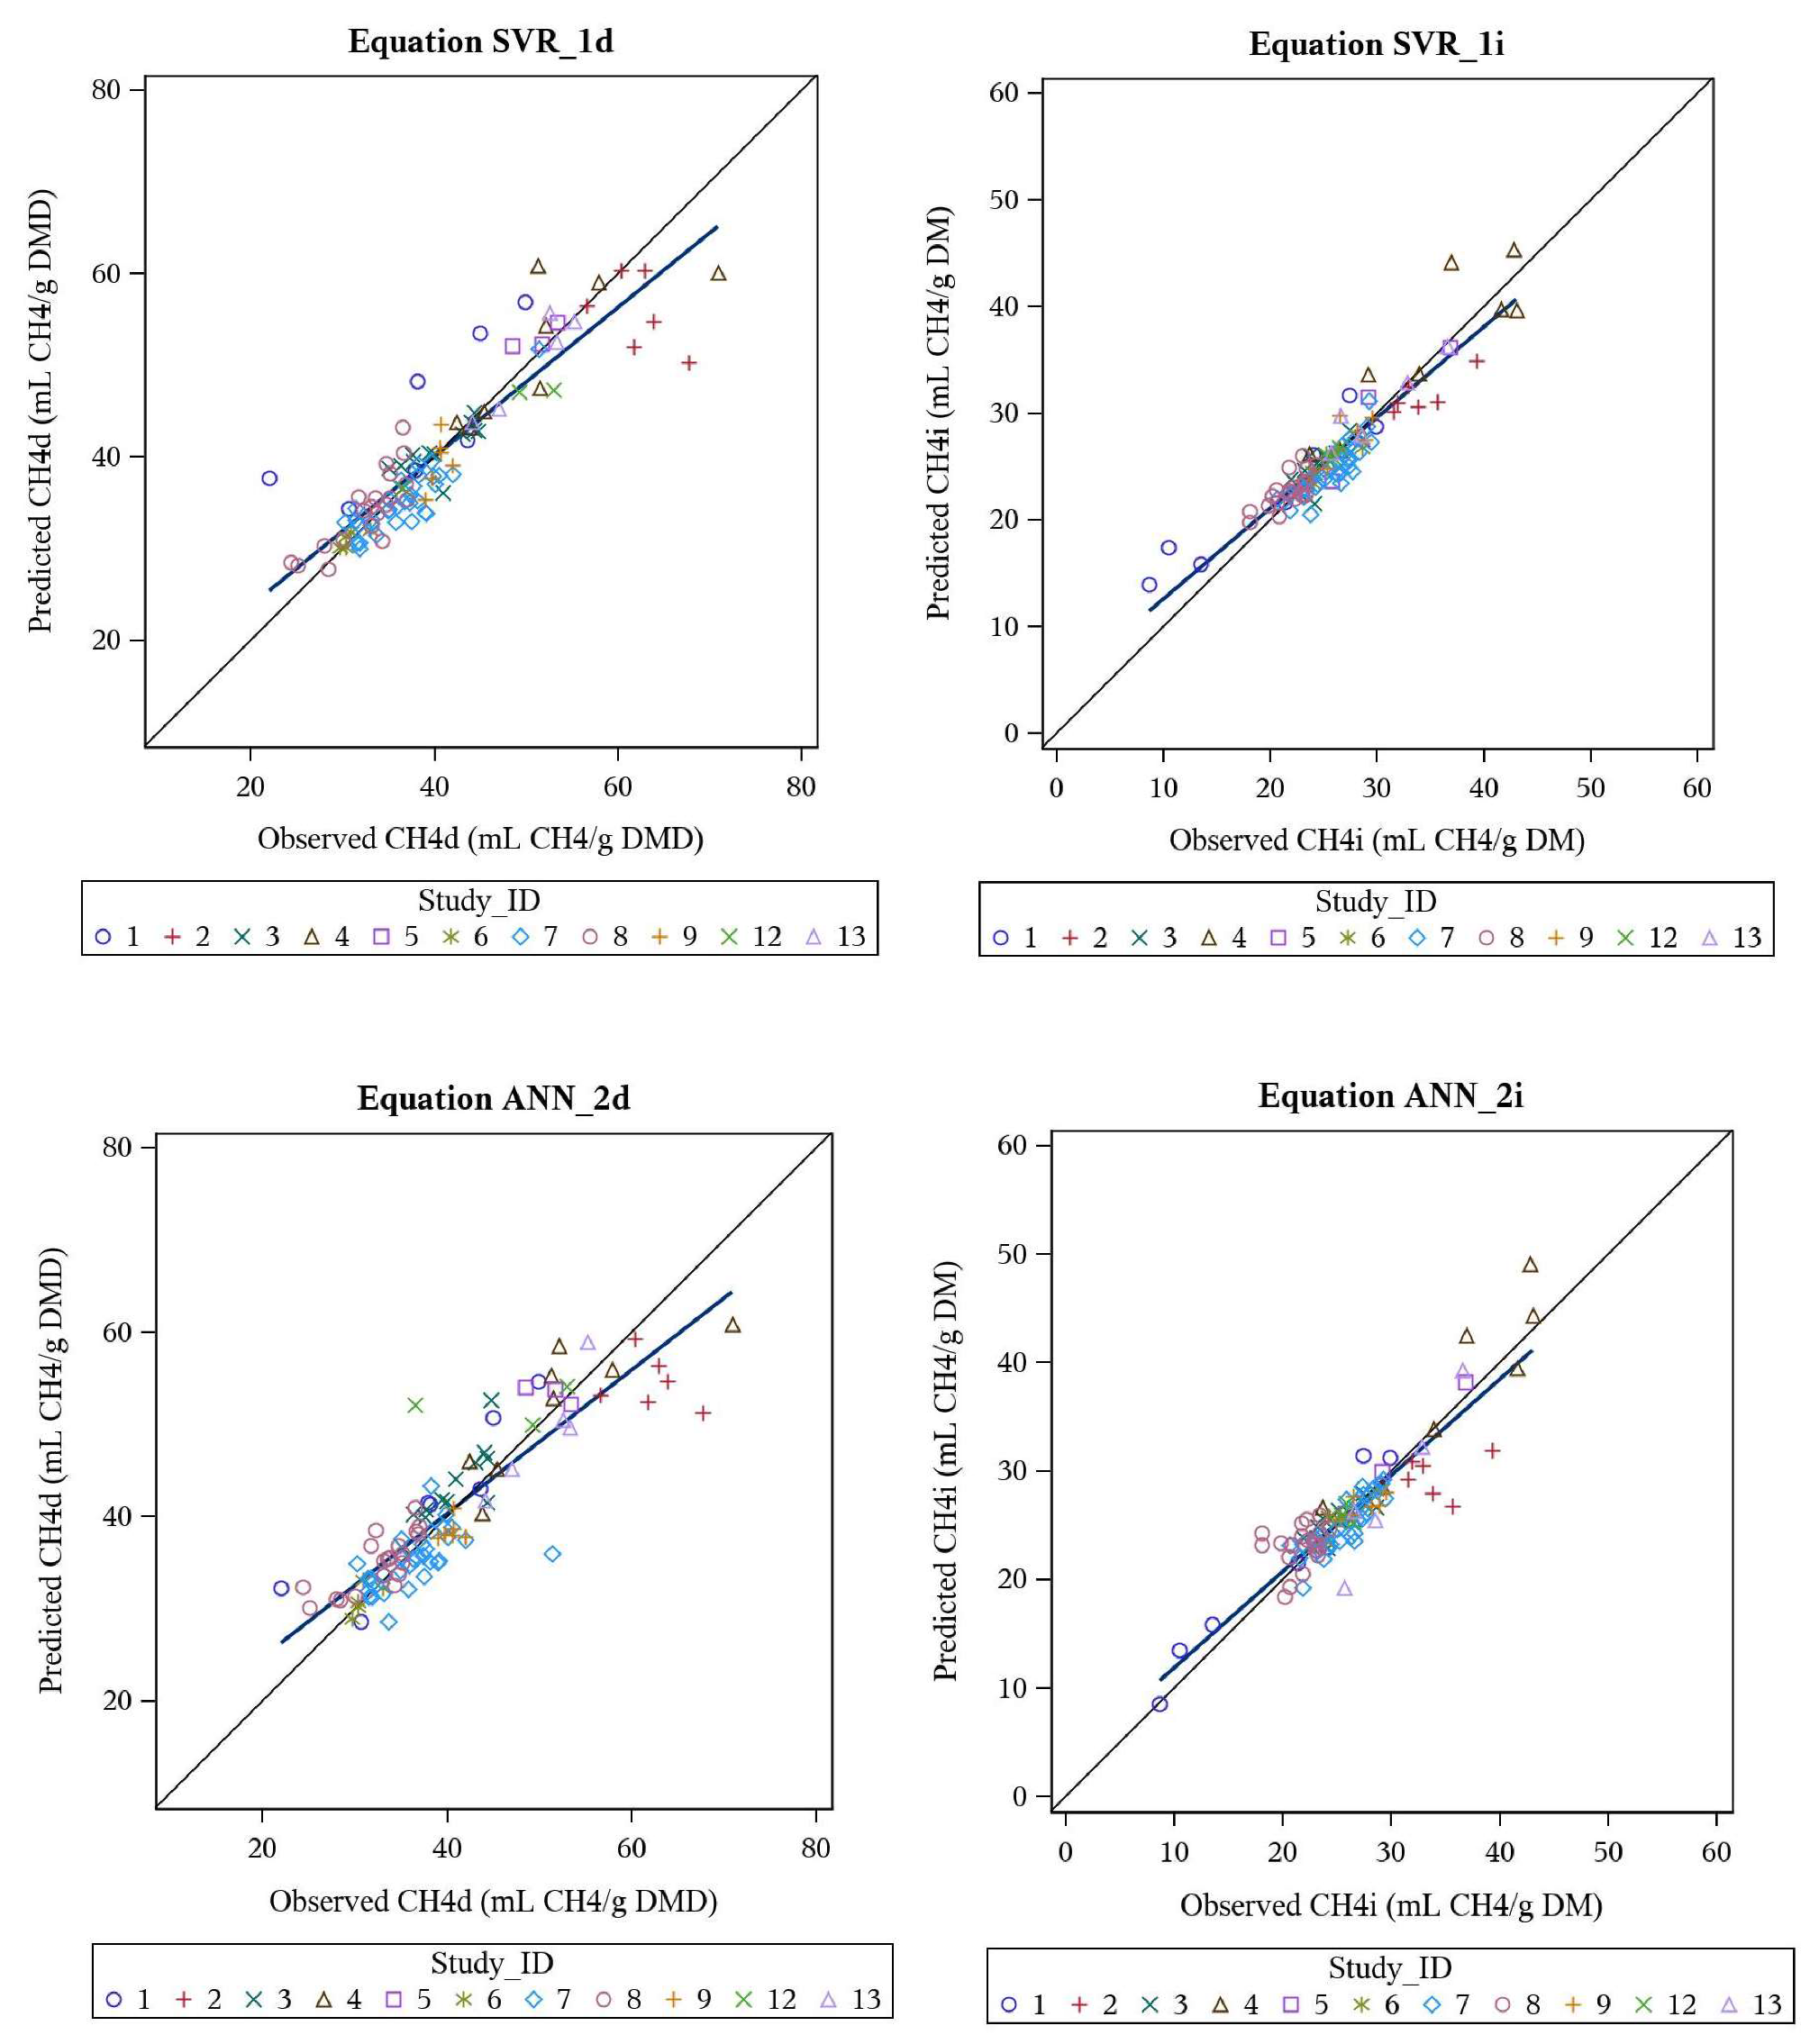
3.4. Support Vector Regression and Artificial Neural Network Models

Evaluation of SVR and ANN models developed are presented in Table 6. Both SVR and ANN models demonstrated high predictability on the test dataset, with CCC values >0.90 for both CH4d and CH4i. For comparison purposes, meta-analysis equations METd and METi were also developed, via meta-analysis, but included all X variables (in linear form, regardless of significance). The CCC values for these equations were 0.645 and 0.734, respectively (Table 6), indicating that the SVR and MLP models must consider a complex multiple-nonlinear response surface between the X variables and Y variables, in order to achieve substantially higher CCC values. The predicted vs. observed plots for these models are illustrated in Figure 2.

3.5. Behaviour Analysis—Machine Learning Models

Unlike the meta-analysis method that results in a predictive equation, the ML methods SVR and ANN do not have the same degree of transparency. To understand the causal pathways to obtain the predictive result, behaviour analysis was performed (Table 7) by systematically changing the inputs in isolation and determining the degree of change in the output prediction. This was performed at +10% and −10% to determine direction of change in the response variable.
Results show (Table 7) that the models ANN_2i and SVR_1i (predicting CH4i) were highly sensitive to the X variables pH and TGP, to varying extents (dependent on the model and FT). Secondary to these variables, the CH4i predictions were sensitive to AC, PR, BT and DMD. Each model (ANN, SVR) demonstrated different sensitivity to these driving variables, and the sensitivity differed between the FT 1 (forage) and FT 2 (concentrate) substrates (Table 7).
For the models ANN_2d and SVR_1d (predicting CH4d), these were shown to be highly sensitive to the X variables pH, DMD, TGP, AC and BT (Table 7), again dependent on the method (ANN, SVR) and the FT (forage vs. concentrate). Driving variables that differed greatly in sensitivity between models (ANN vs. SVR) included pH (14% and 36% vs. −6% and 5% change with ±10%, FT = 1, CH4i), DMD (0% vs. −5% and 9% change with ±10%, FT = 1, CH4i) and AC (11% and −11% vs. 2% and 0% change with ±10%, FT = 1, CH4d) (Table 7), indicating that each approach fit the data slightly differently.
Some responses had different directional effects in the different models. For example, increasing pH increased CH4i by 14% in ANN_2i, but decreased it by 6% in SVR_1i (FT = 1) (and similarly for FT = 2, pH increased CH4i in ANN_2i by 4% and by 30% in SVR_1i); increasing BT did not change CH4i in ANN_2i, but decreased CH4i by 6% in SVR1i (FT = 1); and increasing AC reduced CH4i by 3% in ANN_2i but increased CH4i by 7% in SVR_1i (FT = 2). Similar results were found for CH4d predictions, where, for example, increasing pH decreased CH4d with ANN_2d by 14%, but increased it by 9% with SVR_1d (FT = 1), and for FT = 2, raising pH increased CH4d by 11% with ANN_2d, and by 37% with SVR_1d.
Some behaviour responses within the ML methods were also directionally different between FT. For example, CH4i (ANN_2i) increased as pH was increased (+14%, FT = 1), but also increased when pH was decreased (+36%), indicating a nonlinear/polynomial response surface. This is in contrast to when FT = 2, where increasing pH increased CH4i by 4%, and decreasing pH decreased CH4i by 24% (Table 7). For CH4i (SVR_1i, FT = 1), increasing pH decreased CH4i by 6%, while increasing pH increased CH4i by 5%. This is in contrast to when FT = 2, where increasing pH increased CH4i by 30%, and decreasing it decreased CH4i by 39%. Similar directional differences were observed for CH4d (FT = 1 vs. 2).

4. Discussion

To predict CH4 (in vivo or in vitro) based on stoichiometry principles alone and considering a H recovery of 100%, Hegarty and Nolan [8] proposed the equation: CH4 (mmol/L) = 0.5AC + 0.5BT − 0.25PR − 0.25VL (where all VFAs are expressed in mmol/L). Similarly, Moss et al. [9], considering a H recovery of 90%, proposed the equation: CH4 (mmol/L) = 0.45AC − 0.275PR + 0.40BT (where all VFAs are expressed in mmol/L). These equations reflect the net production of H as a result of AC and BT synthesis by rumen microbes and the net utilization of H as a result of PR and VL synthesis by rumen microbes during fermentation of feed. The resulting H is utilized by methanogens to reduce CO2 to H2O (CO2 + 8H → CH4 + 2H2O). However, predicting CH4 from the above stoichiometric equations is only valid if (1) these VFAs are the only end-products of fermentation, (2) no free H2 accumulates or escapes, (3) the microbial digestion process is strictly anaerobic, and (4) H2 is not used in other reactions (e.g., reduction of sulphates to sulphides, or saturation of double bonds in fatty acids) [8]. In practice, the production of CH4 will be less than the stoichiometry prediction given by the above equations, because these assumptions are generally not held. Jayanegara et al. [7] used both stoichiometric equations to predict CH4 from VFA concentrations in vitro, and found that indeed, the equations overpredicted CH4, likely due to a much lower observed H recovery (observed range of 28.9% to 56.2%) compared to the recoveries assumed by the models (100% and 90%). In agreement with Jayanegara et al. [7], when the stoichiometric equations [8,9] were applied to the current test dataset, CH4i was overpredicted (observed CH4i (mmol/L) = 11.6 ± 2.44, using [8], predicted CH4i = 16.2 ± 3.07; using [9], predicted CH4i = 14.0 ± 2.68) and had poor CCC evaluation statistics (0.135 and 0.227 for [8,9], respectively). For the test dataset, the average H2 recovery, calculated according to [31], was 80%, a value that is substantially lower than the theoretical recovery rates [8,9], and also different from those observed by Jayanegara et al. [7], indicating the potential value of an empirical approach, such as those developed in our work.
The objective of the current study was to utilize meta-analysis and ML methodologies to predict CH4 emissions from in vitro gas and VFA production data. Results of this work found that via meta-analysis, the best predictive equations of in vitro CH4d included the variables − DMD + VFA, or − DMD + VFA − PR − FT − VL (Equations M6 and M5 respectively, Table 5), while the best predictive equations of in vitro CH4i included the variables + VFA − FT, or − PR + VL + TGP (Equations M11 and M12, respectively, Table 5). The significant positive sign on VL in Equation M12 is concerning, as stoichiometrically, the production of VL utilizes H and therefore is associated with a lower CH4 emission. This illustrates a limitation of empirical modelling (whether it be meta-analysis or a ML), that the resulting equations strive to find the best statistical relationship to the data, regardless of biological principles. It is possible this could be related to the relatively small contribution to total VFA made by VL, or correlation with specific feed ingredient properties.
The best performing univariate equations (U6 (CH4d), U12 (CH4i)) were based on DMD and TGP, respectively. The correlation between CH4d and TGP was low (Table 2), indicating that the DMD correction to CH4i (CH4d) accounted for much of the strong relationship between CH4i and TGP. Such simple regressions may be used when VFA data are not reported, but would miss considerable variance explained by defining the type of VFA being produced (see multivariate equations).
The models produced via ML methodologies, ANN and SVR, have much higher predictability (CCC, RMSPE analysis) of the CH4i and CH4d outcomes compared to the meta-analysis models. This was a result of the meta-analysis models being limited to including only significant X variables (p < 0.05), while the ML methodologies have no such limitation. As well, the ML methodologies mapped more complex response surfaces between multiple X variables and the Y variable, based on linear, radial or polynomial shapes. While this resulted in a greatly improved prediction on related (internal evaluation) data (Table 6), it may end up fitting noise or other unrelated data characteristics in the training dataset, resulting in a diminished predictability on unrelated data (external evaluation). Such an external evaluation would be a required next step to test the globalization ability of such ML models—in particular considering the relatively small size of the training dataset and the data hungry nature of ML models.
Unsurprisingly, in both meta-analysis and ML models TGP was a significant driving variable, as an indicator of the overall extent of fermentation occurring in vitro. Directionally, the meta-analysis and ML methods agree, whereby increasing TGP increases CH4i and CH4d. The variable DMD was particularly relevant with the CH4d models, where increasing DMD resulted in a lower CH4d (Table 5 and Table 7).
Interestingly, while pH did not appear in many highly significant meta-analysis equations (Table 3 and Table 4), it did appear to have a strong presence in the ML models, as illustrated by the behaviour analysis (Table 7). According to the pH dependent VFA stoichiometry of [32], an increase in ruminal pH causes a shift in soluble carbohydrate fermentation towards AC and away from PR and BT, and a shift in starch fermentation towards AC and BT and away from PR. For FT = 2 (concentrates), the ANN_2d and SVR_1d equations to predict CH4d show a tendency for CH4 to increase as pH increases (by 11% and 37%, respectively) (Table 7). In line, when pH is decreased, CH4d also decreased (Table 7). However, when FT = 1 (forages), and pH increases the ANN_2d prediction decreases (−14%), while the SVR_1d prediction increases (9%). For the ANN_2d equation, it is difficult to conceptualize where the −14% in CH4d comes from, aside from a nuance in the database.

5. Conclusions

The current study successfully delivered models (using both meta-analysis and ML methodologies) which can be used to estimate CH4 production from in vitro fermentation systems. Meta-analysis results indicate that equations containing DMD, VFA, PR, FT and VL resulted in the best prediction of CH4 on an internal evaluation dataset of in vitro data. The ML models by far exceed the predictability achieved using meta-analysis methods, but should be evaluated on an external database to assess predictability and generalization potential on unrelated data, in particular given the limited database size and the data hungry nature of such ML methodologies. Between the ML methodologies assessed, ANN and SVR resulted in very similar predictive performance, but differences in fitting, as assessed by behaviour analysis, were evident. The models developed may be utilized to estimate CH4 emissions in vitro, in instances where total gas and VFA production, but not CH4, are measured.

Author Contributions

Conceptualization, S.L. and J.F.; methodology, J.L.E. and H.A.-M.; software, J.L.E. and H.A.-M.; validation, J.L.E., H.A.-M. and S.L.; formal analysis, J.L.E., H.A.-M.; investigation, J.L.E.; resources, S.L.; data curation, S.L., A.N.-V., E.J.M., P.P. and P.O.; writing—original draft preparation, J.L.E.; writing—review and editing, J.L.E., S.L., H.A.-M., J.F., C.D.P., A.N.-V., E.J.M., P.P. and P.O.; visualization, J.L.E.; supervision, S.L. and J.F.; project administration, S.L.; funding acquisition, S.L. All authors have read and agreed to the published version of the manuscript.

Funding

The in vitro digestion study research was funded by the National Development Plan through the Research Stimulus Fund administered by the Department of Agriculture, Fisheries and Food, Ireland, grant number RSF 05 224, RSF 06 361 and RSF 07 517.

Conflicts of Interest

The authors declare no conflict of interest. The funders had no role in the design of the study; in the collection, analyses or interpretation of data; in the writing of the manuscript, or in the decision to publish the results.

Appendix A

Table A1. Summary of variable abbreviations and units/descriptions.
Variable AbbreviationUnitDescription
CH4imL CH4/g DM incubatedIn vitro methane production
CH4dmL CH4/g DM apparently digestedIn vitro methane production
pH-Final pH in the incubation medium
DMDg DM disappeared/g DM incubatedApparent dry matter (DM) digestibility
TGPmL gas/g DM incubatedTotal gas production
VFAmmol total VFA/g DM incubatedTotal VFA production
ACmmol AC/mol VFAAcetic acid, proportion of total VFA
PRmmol PR/mol VFAPropionic acid, proportion of total VFA
BTmmol BT/mol VFAButyric acid, proportion of total VFA
VLmmol VL/mol VFAValeric acid, proportion of total VFA
ACpmmol AC/g DM incubatedAcetic acid production
PRpmmol PR/g DM incubatedPropionic acid production
BTpmmol BT/g DM incubatedButyric acid production
VLpmmol VL/g DM incubatedValeric acid production
C2C3AC/PRAcetate to propionate ratio

References

  1. IPCC. Climate Change 2014 Synthesis Report. Contribution of Working Groups I, II and III to the Fifth Assessment Report of the Intergovernmental Panel on Climate Change; Core Writing Team, Pachauri, R.K., Meyer, L.A., Eds.; IPCC: Geneva, Switzerland, 2014; pp. 1–151. [Google Scholar]
  2. IPCC. 2019 Refinement to the 2006 IPCC Guidelines for National Greenhouse Gas Inventories; Volume 4: Agriculture, Forestry and Other Land Use - Chapter 10: Emissions from livestock and manure management; Calvo Buendia, E., Tanabe, K., Kranjc, A., Baasansuren, J., Fukuda, M., Ngarize, S., Osako, A., Pyrozhenko, Y., Shermanau, P., Federici, S., Eds.; IPCC: Geneva, Switzerland, 2019; pp. 10.1–10.209. [Google Scholar]
  3. Martin, C.; Morgavi, D.P.; Doreau, M. Methane mitigation in ruminants: From microbe to the farm scale. Animal 2010, 4, 351–365. [Google Scholar] [CrossRef] [PubMed] [Green Version]
  4. Kumar, S.; Choudhury, P.K.; Carro, M.D.; Griffith, G.W.; Dagar, S.S.; Puniya, M.; Calabro, S.; Ravella, S.R.; Dhewa, T.; Upadhyay, R.C.; et al. New aspects and strategies for methane mitigation from ruminants. Appl. Microbiol. Biotechnol. 2014, 98, 31–44. [Google Scholar] [CrossRef] [PubMed] [Green Version]
  5. Hristov, A.N.; Oh, J.; Firkins, J.L.; Dijkstra, J.; Kebreab, E.; Waghorn, G.; Makkar, H.P.S.; Adesogan, A.T.; Yang, W.; Lee, C.; et al. Special Topics—Mitigation of methane and nitrous oxide emissions from animal operations: I. A review of enteric methane mitigation options. J. Anim. Sci. 2013, 91, 5045–5069. [Google Scholar] [CrossRef] [PubMed] [Green Version]
  6. Ellis, L.L.; Dijkstra, J.; Kebreab, E.; Bannink, A.; Odongo, N.E.; McBride, B.W.; France, J. Aspects of rumen microbiology central to mechanistic modelling of methane production in cattle. J. Agric. Sci. 2008, 146, 213–233. [Google Scholar] [CrossRef] [Green Version]
  7. Jayanegara, A.; Ikhsan, I.; Toharmat, T. Assessment of methane estimation from volatile fatty acid stoichiometry in the rumen in vitro. J. Ind. Trop. Anim. Agric. 2013, 38, 103–108. [Google Scholar] [CrossRef]
  8. Hegarty, R.S.; Nolan, J.V. Estimation of ruminal methane production from measurement of volatile fatty acid production. In Measuring Methane Production from Ruminants; Makkar, H.P.S., Vercoe, P.E., Eds.; Springer: Dordrecht, The Netherlands, 2007; pp. 69–92. [Google Scholar]
  9. Moss, A.; Jouany, J.-P.; Newbold, J. Methane production by ruminants: Its contribution to global warming. Ann. Zootech. 2000, 49, 231–253. [Google Scholar] [CrossRef] [Green Version]
  10. McGeough, E.J.; O’Kiely, P.; O’Brien, M.; Kenny, D.A. An evaluation of the methane output associated with high-moisture grains and silages using the in vitro total gas production technique. Anim. Prod. Sci. 2011, 51, 627–634. [Google Scholar] [CrossRef]
  11. Navarro-Villa, A.; O’Brien, M.; López, S.; Boland, T.M.; O’Kiely, P. Modifications of a gas production technique for assessing in vitro rumen methane production from feedstuffs. Anim. Feed Sci. Technol. 2011, 166, 163–174. [Google Scholar] [CrossRef]
  12. Navarro-Villa, A.; O’Brien, M.; López, S.; Boland, T.M.; O’Kiely, P. In vitro rumen methane output of red clover and perennial ryegrass assayed using the gas production technique (GPT). Anim. Feed Sci. Technol. 2011, 168, 152–164. [Google Scholar] [CrossRef]
  13. Navarro-Villa, A.; O’Brien, M.; López, S.; Boland, T.M.; O’Kiely, P. In vitro rumen methane output of grasses and grass silages differing in fermentation characteristics using the gas-production technique (GPT). Grass Forage Sci. 2013, 68, 228–244. [Google Scholar] [CrossRef]
  14. Purcell, P.J.; O’Brien, M.; Boland, T.M.; O’Kiely, P. In vitro rumen methane output of perennial ryegrass samples prepared by freeze drying or thermal drying (40 °C). Anim. Feed Sci. Technol. 2011, 166, 175–182. [Google Scholar] [CrossRef]
  15. Purcell, P.J.; O’Brien, M.; Boland, T.M.; O’Donovan, M.; O’Kiely, P. Impacts of herbage mass and sward allowance of perennial ryegrass sampled throughout the growing season on in vitro rumen methane production. Anim. Feed Sci. Technol. 2011, 166, 405–411. [Google Scholar] [CrossRef]
  16. Purcell, P.J.; Boland, T.M.; O’Brien, M.; O’Kiely, P. In vitro rumen methane output of forb species sampled in spring and summer. Agric. Food Sci. 2012, 21, 83–90. [Google Scholar] [CrossRef]
  17. Purcell, P.J.; O’Brien, M.; Navarro-Villa, A.; Boland, T.M.; McEvoy, M.; Grogan, D.; O’Kiely, P. In vitro rumen methane output of perennial ryegrass varieties and perennial grass species harvested throughout the growing season: In vitro rumen methane output of perennial grasses. Grass Forage Sci. 2012, 67, 280–298. [Google Scholar] [CrossRef]
  18. Purcell, P.J.; Grant, J.; Boland, T.M.; Grogan, D.; O’Kiely, P. The in vitro rumen methane output of perennial grass species and white clover varieties, and associative effects for their binary mixtures, evaluated using a batch-culture technique. Anim. Prod. Sci. 2012, 52, 1077. [Google Scholar] [CrossRef]
  19. Purcell, P.J.; Boland, T.M.; O’Kiely, P. The effect of water-soluble carbohydrate concentration and type on in vitro rumen methane output of perennial ryegrass determined using a 24-hour batch-culture gas production technique. Irish J. Food Agric. Res. 2014, 53, 21–36. [Google Scholar]
  20. Navarro-Villa, A.; O’Brien, M.; López, S.; Boland, T.M.; O’Kiely, P. Determination of the in vitro rumen methane output of contrasting feeds using the gas production technique (GPT). (unpublished).
  21. SAS Institute Inc. SAS/STAT® 14.1 User’s Guide; SAS Institute Inc.: Cary, NC, USA, 2015. [Google Scholar]
  22. St-Pierre, N.R. Invited review: Integrating quantitative findings from multiple studies using mixed model methodology. J. Dairy Sci. 2001, 84, 741–755. [Google Scholar] [CrossRef]
  23. Coelho, L.P.; Richert, W.; Brucher, M. Building Machine Learning Systems with Python: Explore Machine Learning and Deep Learning Techniques for Building Intelligent Systems Using Scikit-Learn and TensorFlow; Packt Publishing: Birmingham, UK, 2018. [Google Scholar]
  24. Buitinck, L.; Louppe, G.; Blondel, M.; Pedregosa, F.; Mueller, A.; Grisel, O.; Niculae, V.; Prettenhofer, P.; Gramfort, A.; Grobler, J.; et al. API design for machine learning software: Experiences from the scikit-learn project. In Proceedings of the European Conference on Machine Learning and Principles and Practice of Knowledge Discovery in Databases, Workshop on Languages for Data Mining and Machine Learning, Prague, Czech Republic, 23–27 September 2013; pp. 108–122. Available online: https://arxiv.org/pdf/1309.0238.pdf (accessed on 15 April 2020).
  25. Pedregosa, F.; Varoquaux, G.; Gramfort, A.; Michel, V.; Thirion, B.; Grisel, O.; Blondel, M.; Prettenhofer, P.; Weiss, R.; Dubourg, V.; et al. Scikit-learn: Machine learning in Python. J. Mach. Learn. Res. 2011, 12, 2825–2830. [Google Scholar]
  26. Rossum, G.V. Python Tutorial Release 3.6.4; Python Software Foundation: Wilmington, DE, USA, 2018. [Google Scholar]
  27. Drucker, H.; Burges, C.J.C.; Kaufman, L.; Smola, A.J.; Vapnik, V. Support vector regression machines. In Advances in Neural Information Processing Systems 9; Mozer, M.C., Jordan, M.I., Petsche, T., Eds.; MIT Press: Cambridge, MA, USA, 1997; pp. 155–161. [Google Scholar]
  28. Paliwal, M.; Kumar, U.A. Neural networks and statistical techniques: A review of applications. Expert Syst. Appl. 2009, 36, 2–17. [Google Scholar] [CrossRef]
  29. Bibby, J.; Toutenburg, T. Prediction and Improved Estimation in Linear Models; John Wiley & Sons: Chichester, UK, 1977. [Google Scholar]
  30. Lin, L.I. A concordance correlation coefficient to evaluate reproducibility. Biometrics 1989, 45, 255–268. [Google Scholar] [CrossRef]
  31. Demeyer, D.; Van Nevel, C. Protein fermentation and growth by rumen microbes. Ann. Rech. Vet. 1979, 10, 277–279. [Google Scholar]
  32. Bannink, A.; France, J.; López, S.; Gerrits, W.J.J.; Kebreab, E.; Tamminga, S.; Dijkstra, J. Modelling the implications of feeding strategy on rumen fermentation and functioning of the rumen wall. Anim. Feed Sci. Technol. 2008, 143, 3–26. [Google Scholar] [CrossRef]
Figure 1. Predicted vs. observed plots for the top four performing meta-analysis equations M5 (CH4d), M6 (CH4d), M11 (CH4i) and M12 (CH4i), as evaluated on the evaluation dataset (n = 107).
Animals 10 00720 g001
Figure 2. Predicted vs. observed plots for the machine learning equations SVR_1d (CH4d), SVR_1i (CH4i), ANN_2d (CH4d) and ANN_2i (CH4i), as evaluated on the evaluation dataset (n = 107).
Animals 10 00720 g002
Table 1. Summary of the training (n = 247, 243) and internal evaluation (n = 107) datasets.
Variable 1pHDMDTGPCH4iCH4dVFAACPRBTVLC2C3
 Training Dataset (Machine learning, n = 247)
Mean6.590.6716326.640.75.48632.3238.594.831.82.7
Median6.640.6816025.338.05.33632.2237.794.431.82.7
Minimum5.450.20516.919.52.12477.6117.543.45.01.4
Maximum6.780.9127650.871.59.79812.1346.9181.379.37.0
 Training Dataset (Meta-analysis, n = 243)
Mean6.590.6716426.740.65.50631.7239.294.931.92.7
Median6.640.6816125.338.05.35632.1237.994.431.82.7
Minimum5.450.227111.219.52.12477.6117.560.010.31.4
Maximum6.780.9127650.871.59.79812.1346.9181.379.37.0
 Evaluation Dataset (Machine learning/Meta-Analysis, n = 107)
Mean6.600.6616226.040.25.51630.6241.594.531.82.7
Median6.640.6816225.437.95.25629.0238.596.432.52.7
Minimum5.490.21618.722.04.02503.7152.153.86.91.7
Maximum6.840.8724643.070.99.81787.5333.1178.960.85.1
1 Variables (units): pH = final pH in the incubation medium. DMD = apparent dry matter (DM) digestibility (g DM disappeared/g DM incubated). TGP = total gas production (mL gas/g DM incubated). CH4i = methane production (mL CH4/g DM incubated). CH4d = methane production (mL CH4/g DM apparently digested). VFA production (mmol total VFA/g DM incubated). AC = acetic acid (mmol AC/mol VFA). PR = propionic acid (mmol PR/mol VFA). BT = butyric acid (mmol BT/mol VFA). VL = valeric acid (mmol VL/mol VFA). C2C3 = acetate to propionate ratio.
Table 2. Correlation matrix (Pearson correlation coefficients, R) of dependent and independent variables, meta-analysis development dataset (n = 243) 1,2.
VariableCH4dCH4ipHDMDTGPVFAACACpPRPRpBTBTpVLVLp
pH0.0270.007
DMD−0.4080.399−0.060
TGP0.1460.755−0.2060.707
VFA0.2230.472−0.4370.2820.648
AC0.405−0.0140.208−0.474−0.341−0.159
ACp0.3500.472−0.3400.1360.5440.9440.168
PR−0.396−0.045−0.1250.4260.3160.094−0.863−0.184
PRp−0.0500.326−0.4310.4390.6630.817−0.6220.6050.640
BT−0.0350.045−0.3600.0650.1150.250−0.2790.136−0.1500.143
BTp0.1030.315−0.5660.2340.4820.798−0.2940.679−0.0010.6330.762
VL−0.1130.2230.2730.3690.0960.007−0.246−0.0710.0230.0160.1450.071
VLp0.0590.458−0.0210.4390.4350.555−0.2790.4580.0690.4650.2360.4910.820
C2C30.420−0.0380.070−0.516−0.373−0.1030.9210.194−0.924−0.606−0.078−0.133−0.186−0.198
1 Statistical significance of R values (n = 243): p < 0.05 if |R| > 0.126, p < 0.01 if |R| > 0.165, p < 0.001 if |R| > 0.210. Light grey boxes (for pairwise correlations between X variables) show |R| > 0.500, light blue boxes (for correlations between X and Y variables) show |R| > 0.300, 2 Variables (units): CH4i = methane production (mL CH4/g DM incubated). CH4d = methane production (mL CH4/g DM apparently digested). pH = final pH in the incubation medium. DMD = apparent dry matter (DM) digestibility (g DM disappeared/g DM incubated). TGP = total gas production (mL gas/g DM incubated). VFA production (mmol total VFA/g DM incubated). AC = acetic acid (mmol AC/mol VFA). ACp = AC production (mmol AC/g DM incubated). PR = propionic acid (mmol PR/mol VFA). PRp = PR production (mmol PR/g DM incubated). BT = butyric acid (mmol BT/mol VFA). BTp = BT production (mmol BT/g DM incubated). VL = valeric acid (mmol VL/mol VFA). VLp = VL production (mmol VL/g DM incubated). C2C3 = acetate to propionate ratio.
Table 3. Univariate equations—meta-analysis model evaluation via root mean square prediction error (RMSPE) and concordance correlation coefficient (CCC) analysis on the internal evaluation (n = 107) database.
Equation 1YXFormMean 2SEMRMSPE, %EB, %ER, %ED, %CCCRCb
U1CH4dC2C3Linear44.70.3725.7192790.1130.1940.579
U2CH4dPRQuad44.70.3525.9183780.1160.1850.623
U3CH4dACLinear44.80.2925.6201790.1240.2280.541
U4CH4dPRLinear44.80.3126.1194770.1280.1980.649
U5CH4dDMDQuad44.30.2324.0182810.1820.3910.466
U6CH4dDMDLinear44.40.2423.9193780.1960.4320.454
U7CH4iPRpQuad27.70.2921.0113870.3030.3770.803
U8CH4iDMDCubic28.20.1921.8154800.3050.3750.813
U9CH4iVLpQuad28.00.2620.7140850.3140.4200.747
U10CH4iVFALinear27.40.1620.977860.3460.3900.889
U11CH4iTGPQuad27.20.3315.5101900.6440.7170.898
U12CH4iTGPLinear27.30.3115.5100890.6500.7170.906
1 Equation ID corresponds to equations presented in subsequent tables, with Y as the response (predicted) variable [either CH4i (observed mean 26.0 ± 0.53 mL CH4/g DM incubated) or CH4d (observed mean 40.2 ± 0.91 mL CH4/g DM apparently digested) and X as the explanatory variable (see Table 1 and Table 2 for abbreviations and units of each variable), 2 Mean = mean of predicted values; SEM = standard error of the mean of predicted values; RMSPE = root mean square prediction error expressed as a percentage of the observed mean; EB, ER and ED = error due to bias, regression and disturbance, respectively (all as % of total MSPE); CCC = concordance correlation coefficient; R = Pearson correlation coefficient (measure of precision); Cb = bias correction factor (measure of accuracy).
Table 4. Linear multivariate equations—meta-analysis model evaluation via root mean square prediction error (RMSPE) and concordance correlation coefficient (CCC) analysis on the internal evaluation (n = 107) database.
Equation 1YXMean 2SEMRMSPE, %EB, %ER, %ED, %CCCRCb
M1CH4dBTp, DMD44.00.3622.7171820.3060.4760.643
M2CH4dPRp, VLp, DMD43.90.5122.6161830.3790.4730.800
M3CH4dPR, VL, VFA, DMD43.80.5522.9162820.3830.4610.830
M4CH4dDMD, VFA, pH, PR43.50.6523.3127810.4010.4480.896
M5CH4dDMD, VFA, PR, FT, VL43.80.5822.5162820.4190.4920.853
M6CH4dDMD, VFA43.50.5321.7141850.4250.5160.823
M7CH4ipH, DMD, VLp, FT, BTp28.50.3421.1213760.4070.4960.833
M8CH4ipH, DMD, PRp, VLp, FT28.40.3320.8212780.4100.5200.826
M9CH4ipH, DMD, BTp, FT28.30.3220.2201790.4280.5200.823
M10CH4iDMD, VFA, FT27.70.3219.4121870.4340.5140.844
M11CH4iVFA, FT27.40.3719.885870.4380.4840.905
M12CH4iPR, VL, TGP27.20.4014.8110890.7030.7520.936
1 Equation ID corresponds to equations presented in subsequent tables, with Y as the response (predicted) variable [either CH4i (observed mean 26.0 ± 0.53 mL CH4/g DM incubated) or CH4d (observed mean 40.2 ± 0.91 mL CH4/g DM apparently digested)] and X as the explanatory variables (see Table 1 and Table 2 for abbreviations and units of each variable; FT is feed type either forage or concentrate), 2 Mean = mean of predicted values; SEM = standard error of the mean of predicted values; RMSPE = root mean square prediction error expressed as a percentage of the observed mean; EB, ER and ED = error due to bias, regression and disturbance, respectively (all as % of total MSPE); CCC = concordance correlation coefficient; R = Pearson correlation coefficient (measure of precision); Cb = bias correction factor (measure of accuracy).
Table 5. Best performing equations from the meta-analysis 1.
Equation IDYInterceptX1 X2 X3 X4 X5
M5CH4d76.35 (± 4.511) −31.03 (± 3.922) × DMD3.21 (± 0.352) × VFA−0.094 (± 0.01202) × PR−3.017 (± 1.460) (if FT = 1)−0.133 (± 0.0380) × VL
M6CH4d51.35 (± 3.086)−41.98 (± 3.429) × DMD3.65 (± 0.390) × VFA
M11CH4i15.8 (± 2.614)3.06 (± 0.241) × VFA−5.70 (± 1.028) (if FT = 1)
M12CH4i11.58 (± 1.627)−0.0633 (± 0.0057) × PR0.0947 (± 0.01728) × VL0.172 (± 0.0046) × TGP
1 Variables (units): CH4i = methane production (mL CH4/g DM incubated). CH4d = methane production (mL CH4/g DM apparently digested). DMD = apparent dry matter (DM) digestibility (g DM disappeared/g DM incubated). TGP = total gas production (mL gas/g DM incubated). VFA production (mmol total VFA/g DM incubated). PR = propionic acid (mmol PR/mol VFA). VL = valeric acid (mmol VL/mol VFA). FT = feed type either forage or concentrate.
Table 6. Machine learning and meta-analysis (including all the X variables) model evaluation via root mean square prediction error (RMSPE) and concordance correlation coefficient (CCC) analysis on the internal evaluation (n = 107) database.
Equation 1YXMean 2SEMRMSPE, %EB, %ER, %ED, %CCCRCb
SVR_1dCH4dall, nonlinear40.20.829.90.5099.50.8990.9050.994
SVR_1iCH4iall, nonlinear26.10.498.30.60.199.30.9170.9200.997
ANN_2dCH4dall, nonlinear40.50.809.50.50.898.70.9070.9150.991
ANN_2iCH4iall, nonlinear26.00.529.102.997.10.9060.9061.000
METdCH4dall, linear42.90.5417.1166790.6430.7620.844
METiCH4iall, linear27.20.4014.0120880.7340.7820.939
1 Equation IDs with ‘d’ refer to CH4d, and ‘i’ refer to CH4i equations. METd and METi are meta-analysis equations. Y is the response (predicted) variable [either CH4i (observed mean 26.0 ± 0.53 mL CH4/g DM incubated) or CH4d (observed mean 40.2 ± 0.91 mL CH4/g DM apparently digested) and X are the explanatory variables (all variables included in this analysis for comparison purposes), 2 Mean = mean of predicted values; SEM = standard error of the mean of predicted values; RMSPE = root mean square prediction error expressed as a percentage of the observed mean; EB, ER and ED = error due to bias, regression and disturbance, respectively (all as % of total MSPE); CCC = concordance correlation coefficient; R = Pearson correlation coefficient (measure of precision); Cb = bias correction factor (measure of accuracy).
Table 7. Behaviour analysis 1 of the artificial neural network (ANN) and support vector regression (SVR) models.
X-VariableCH4i
(on Average 25.5 and 36.3 mL CH4/g Dry Matter Incubated,
for Forage and Concentrate, Respectively)
CH4d
(on Average 40.0 and 46.4 mL CH4/g Dry Matter Apparently
Digested for Forage and Concentrate, Respectively)
ANN (ANN_2i)SVR (SVR_1i)ANN (ANN_2d)SVR (SVR_1d)
Change in X-variable+10% 2−10% 3+10% 2−10% 3+10% 2−10% 3+10% 2−10% 3
Feed type = forage (FT = 1)
pH14%36%−6%5%−14%7%9%35%
DMD0%0%−5%9%−7%18%−13%18%
TGP12%−10%20%−16%15%−8%20%−16%
Total VFA−1%1%−1%0%−1%1%−1%0%
Acetate (AC)5%11%4%3%11%−11%2%0%
Propionate (PR)0%0%−2%2%−1%1%−1%2%
Butyrate (BT)0%0%−6%6%−1%1%−6%8%
Valerate (VL)−2%2%0%−1%−1%1%1%−1%
C2C3−1%1%1%0%−4%4%1%0%
Feed type = concentrate (FT = 2)
pH4%−24%30%−39%11%−23%37%−37%
DMD−2%−1%5%−2%−8%8%−3%5%
TGP11%−11%12%−10%10%−10%9%−8%
Total VFA−4%2%−3%2%−2%2%−2%1%
Acetate (AC)−3%3%7%−6%3%−3%6%−6%
Propionate (PR)−3%3%−4%4%−3%0%−3%3%
Butyrate (BT)2%−2%−1%1%2%−3%−2%2%
Valerate (VL)1%−1%0%0%1%−1%0%0%
C2C30%−2%1%−1%0%0%1%−1%
1 Expected change (in %) in the predicted variable (either CH4i or CH4d), with a ±10% change in the driving variable. Changes in the predicted variable exceeding |10%| are highlighted in grey, 2 Increase of 10% in the explanatory variable, 3 Decrease of 10% in the explanatory variable.

