

The Magmatic Patterns Formed by the Interaction of the Hainan Mantle Plume and Lei–Qiong Crust Revealed through Seismic Ambient Noise Imaging

Abstract
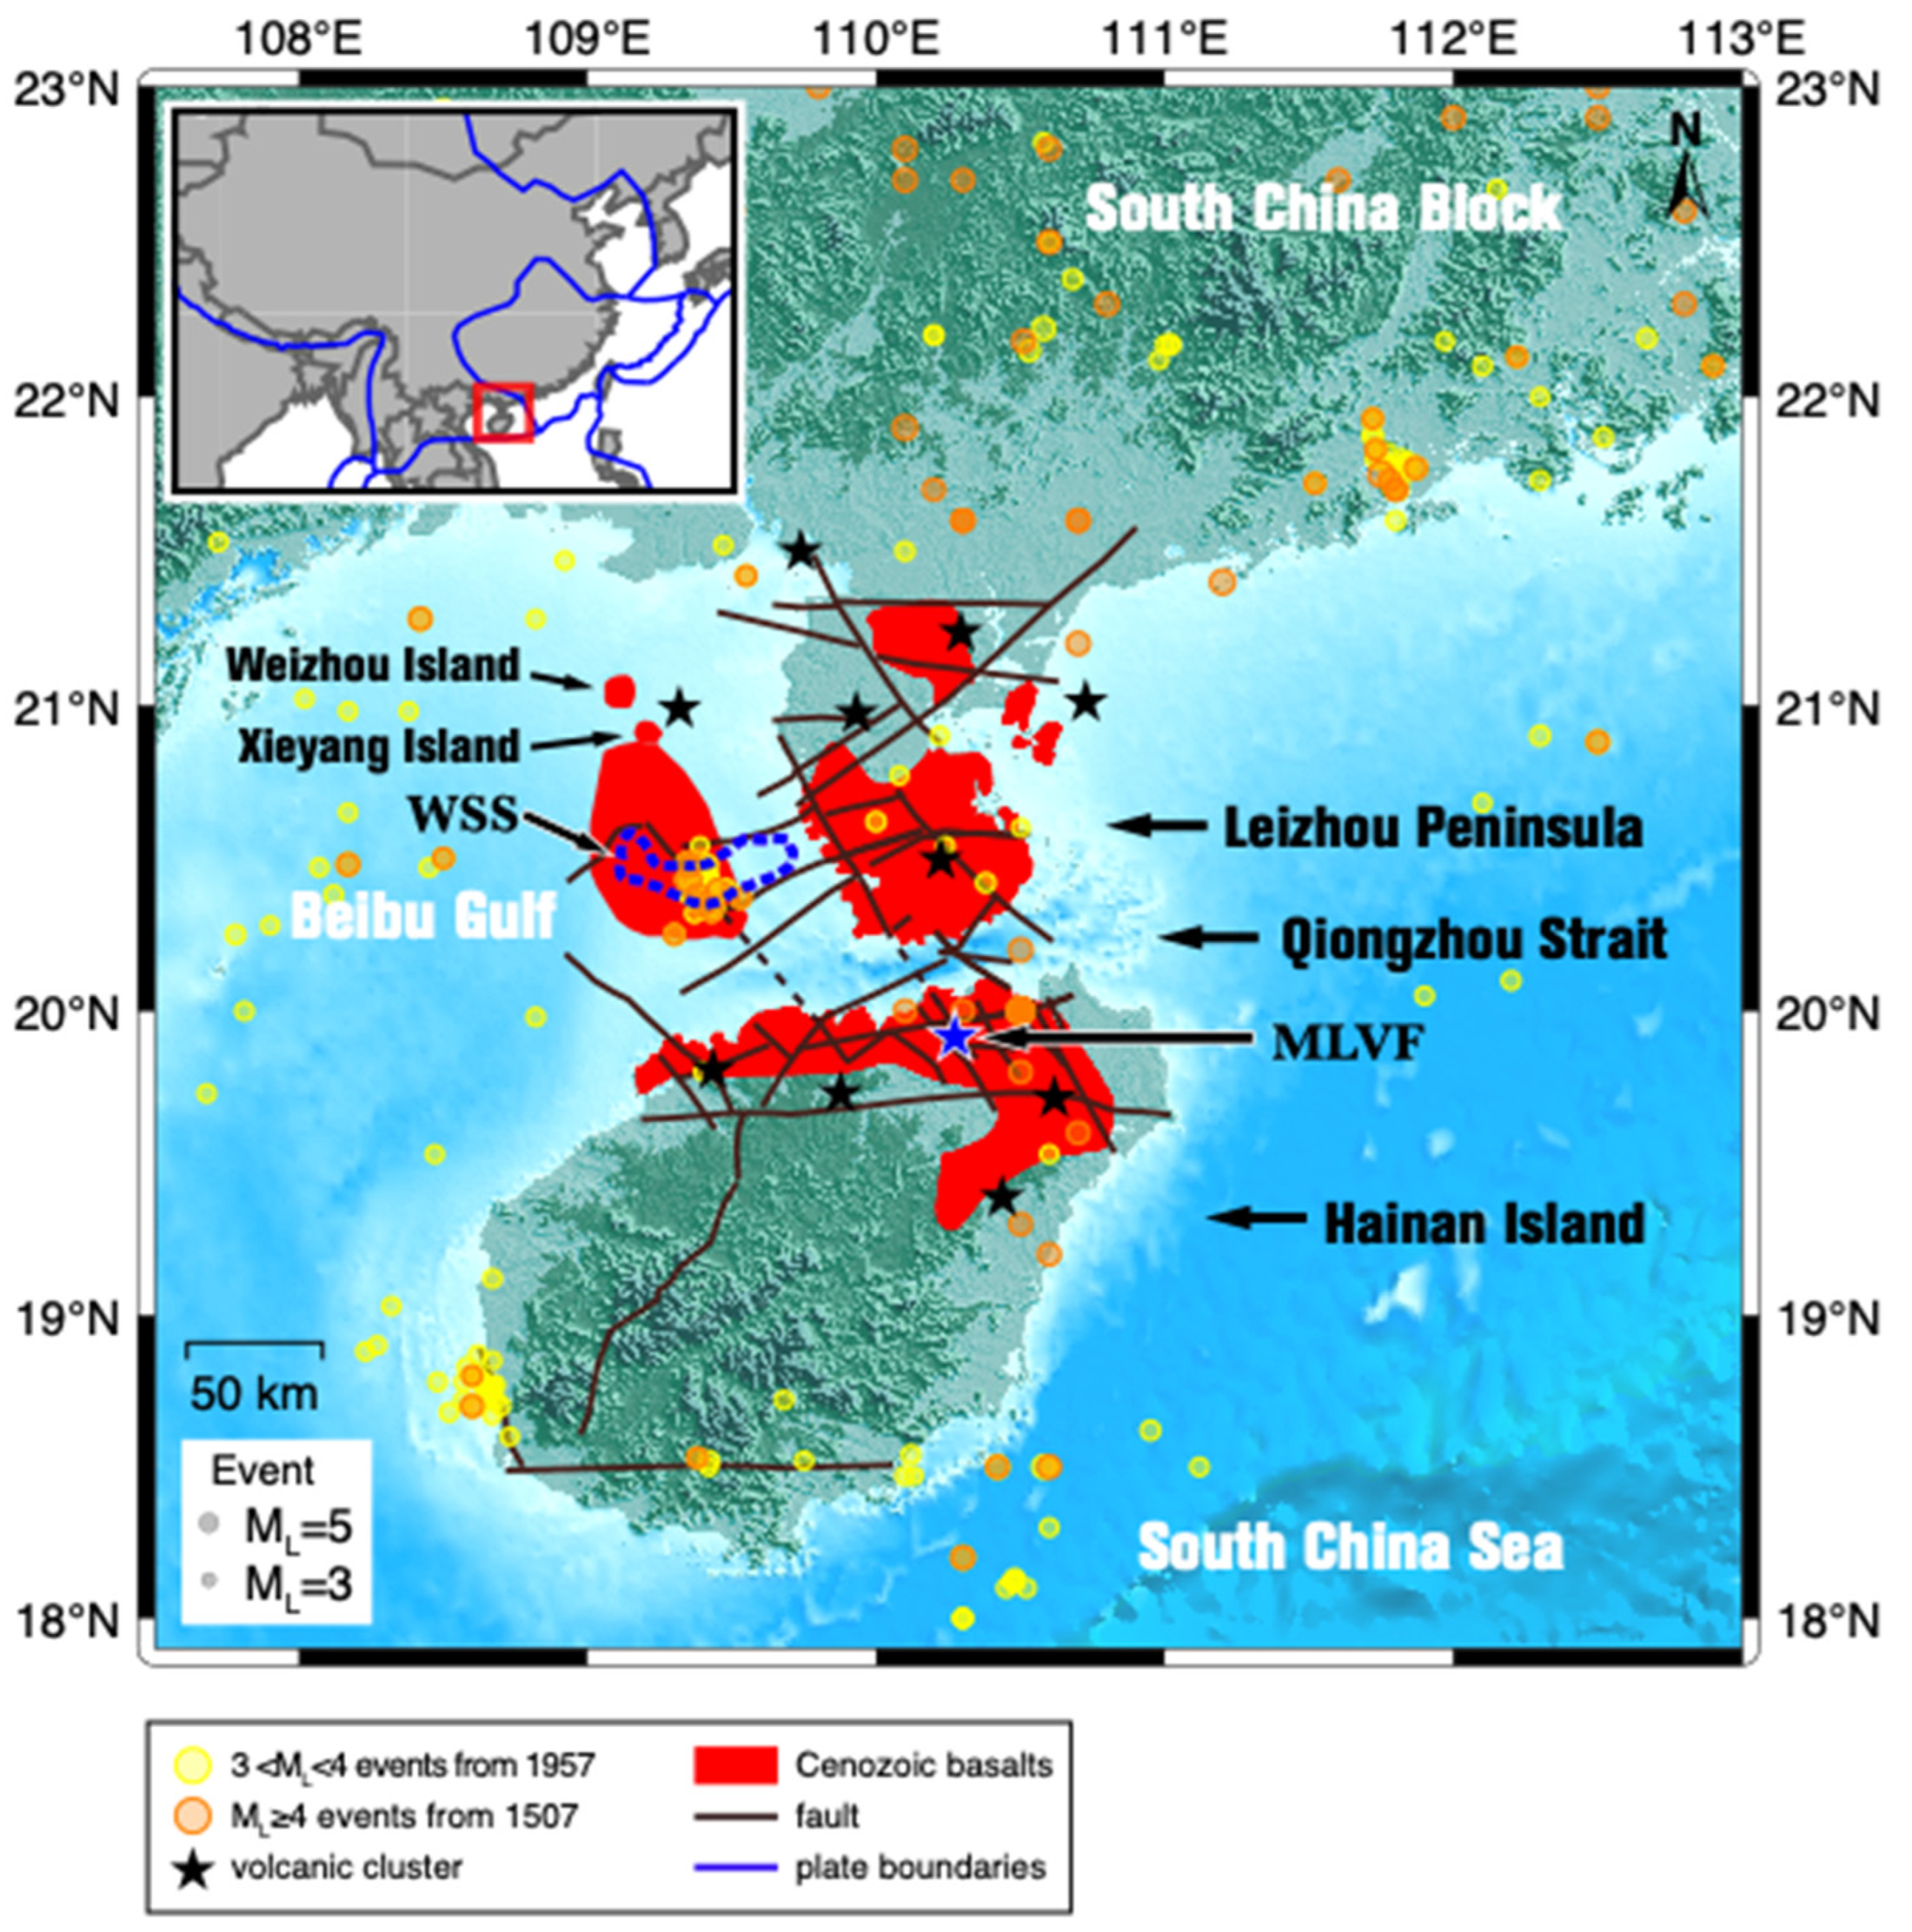
:1. Introduction
2. Materials and Methods
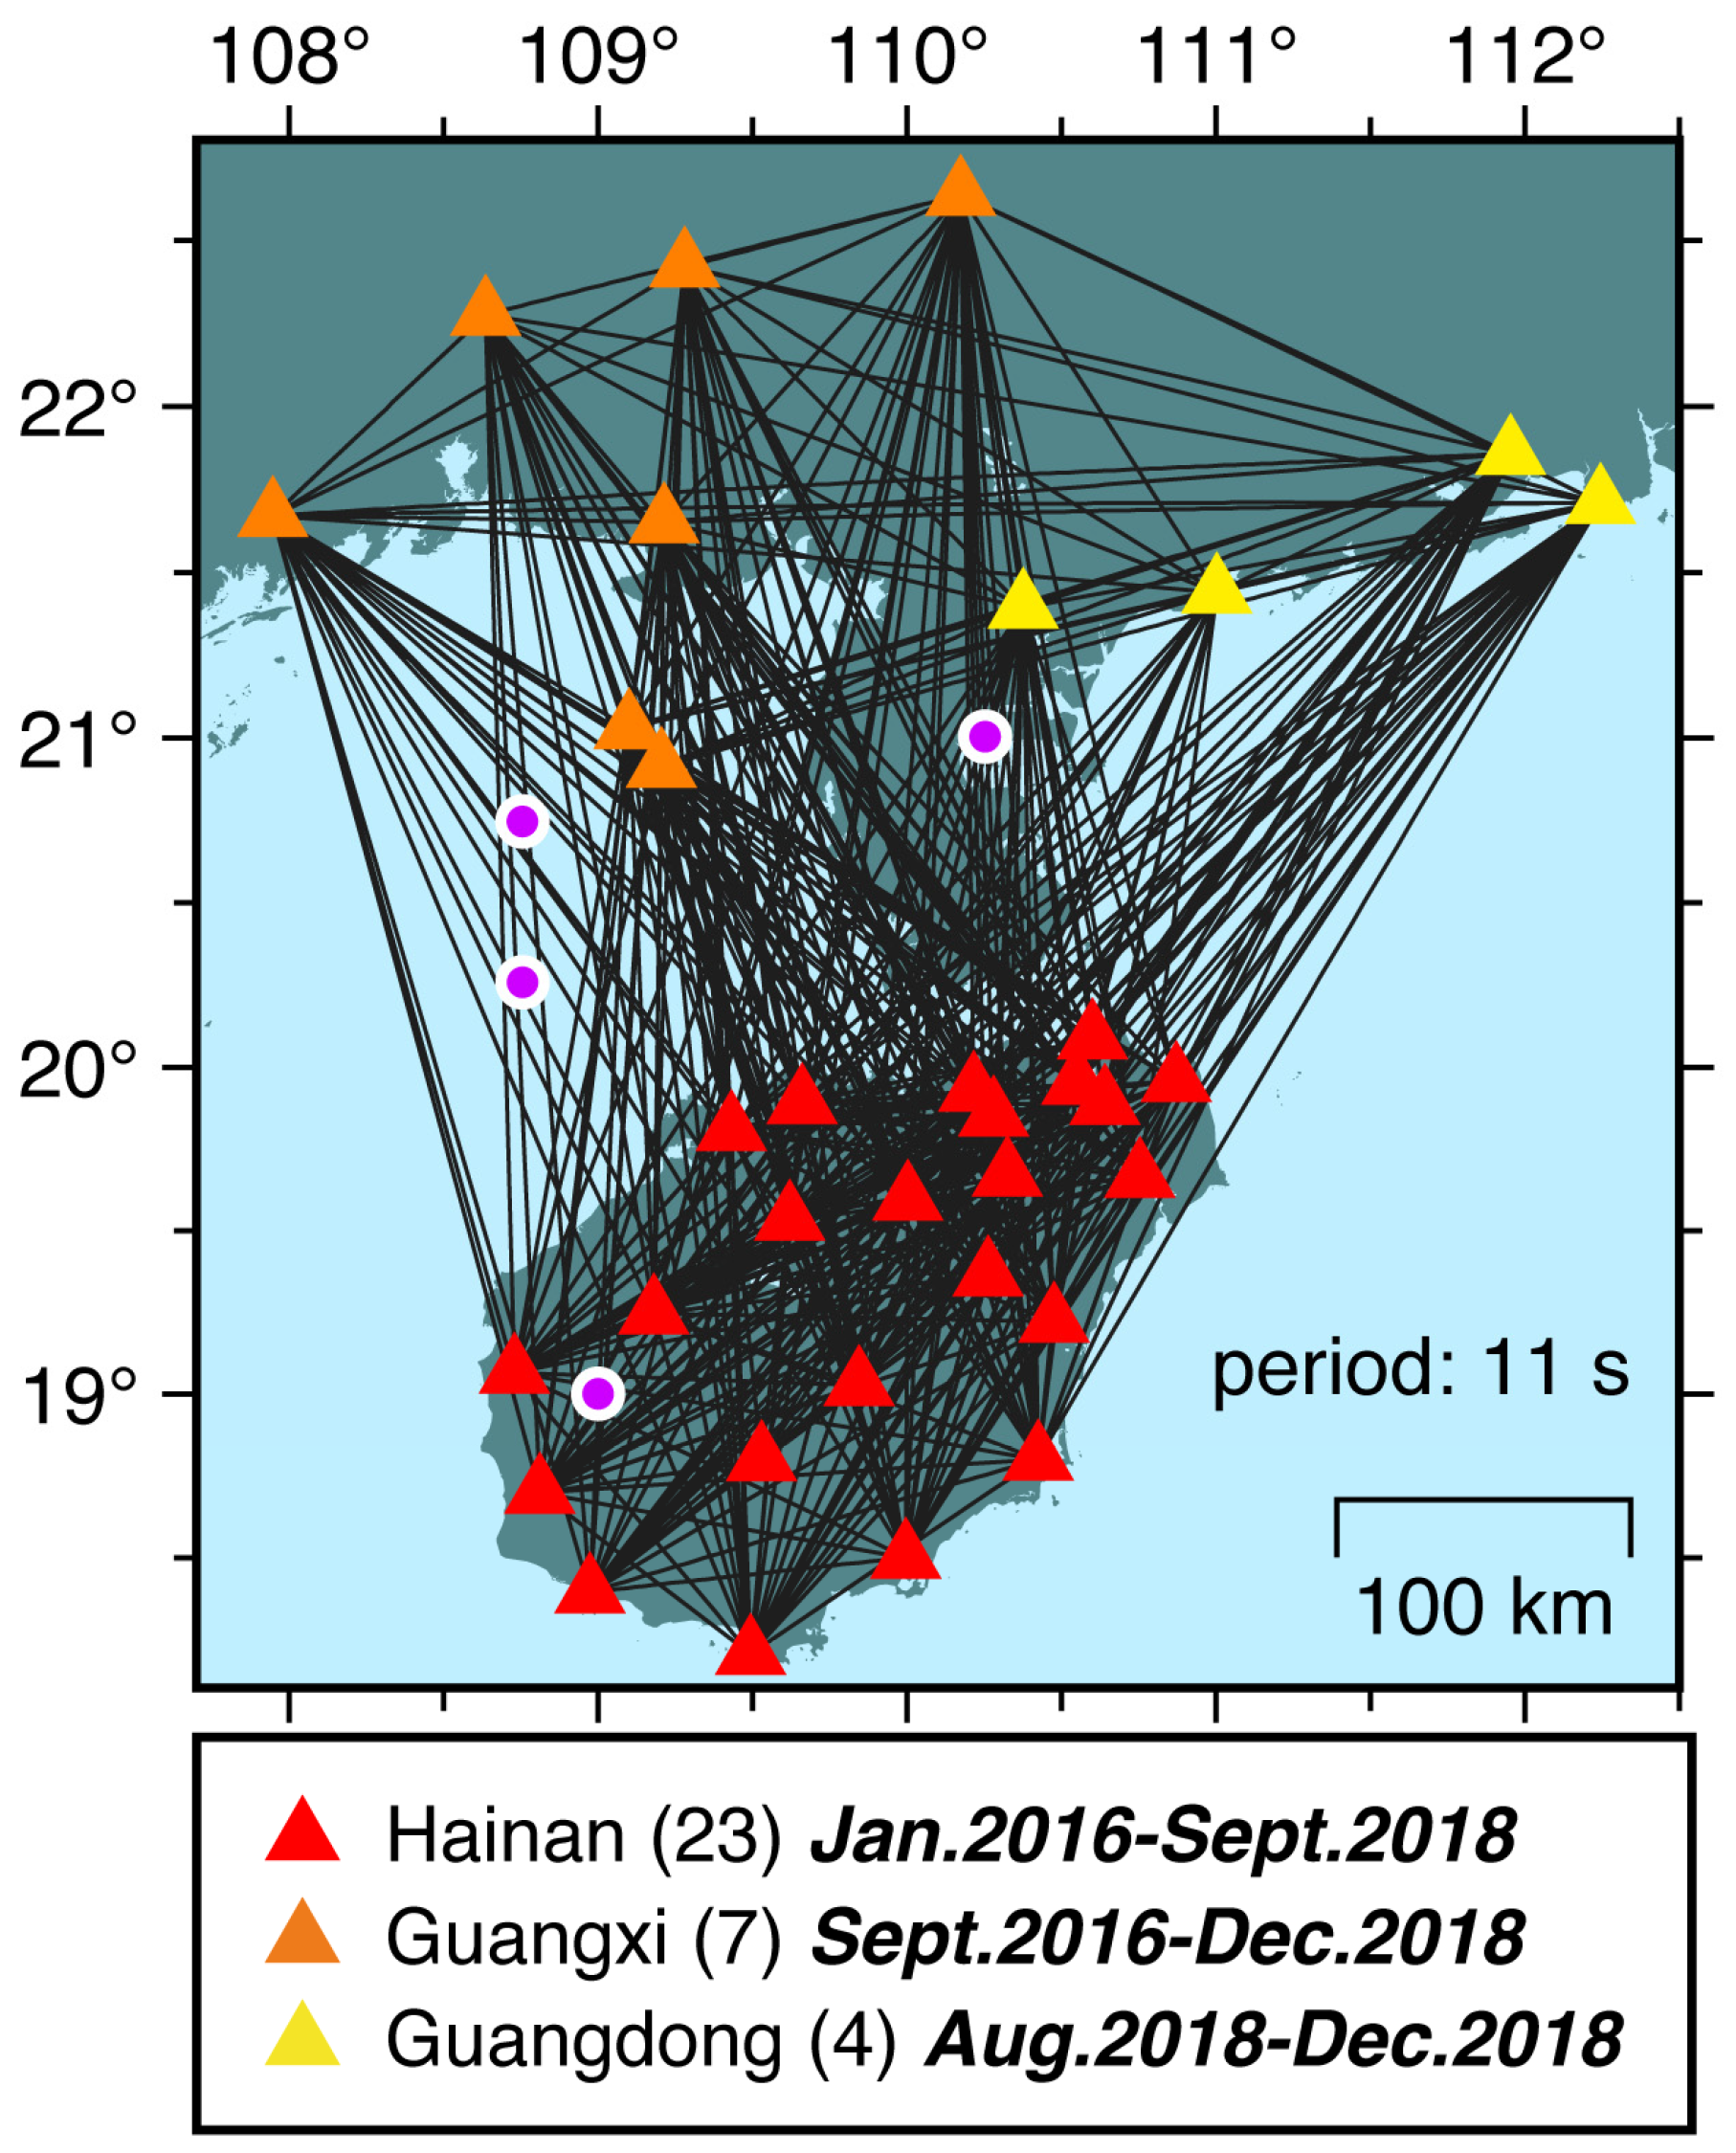
2.1. Data
2.2. Data Processing
2.3. Phase Velocity Inversion
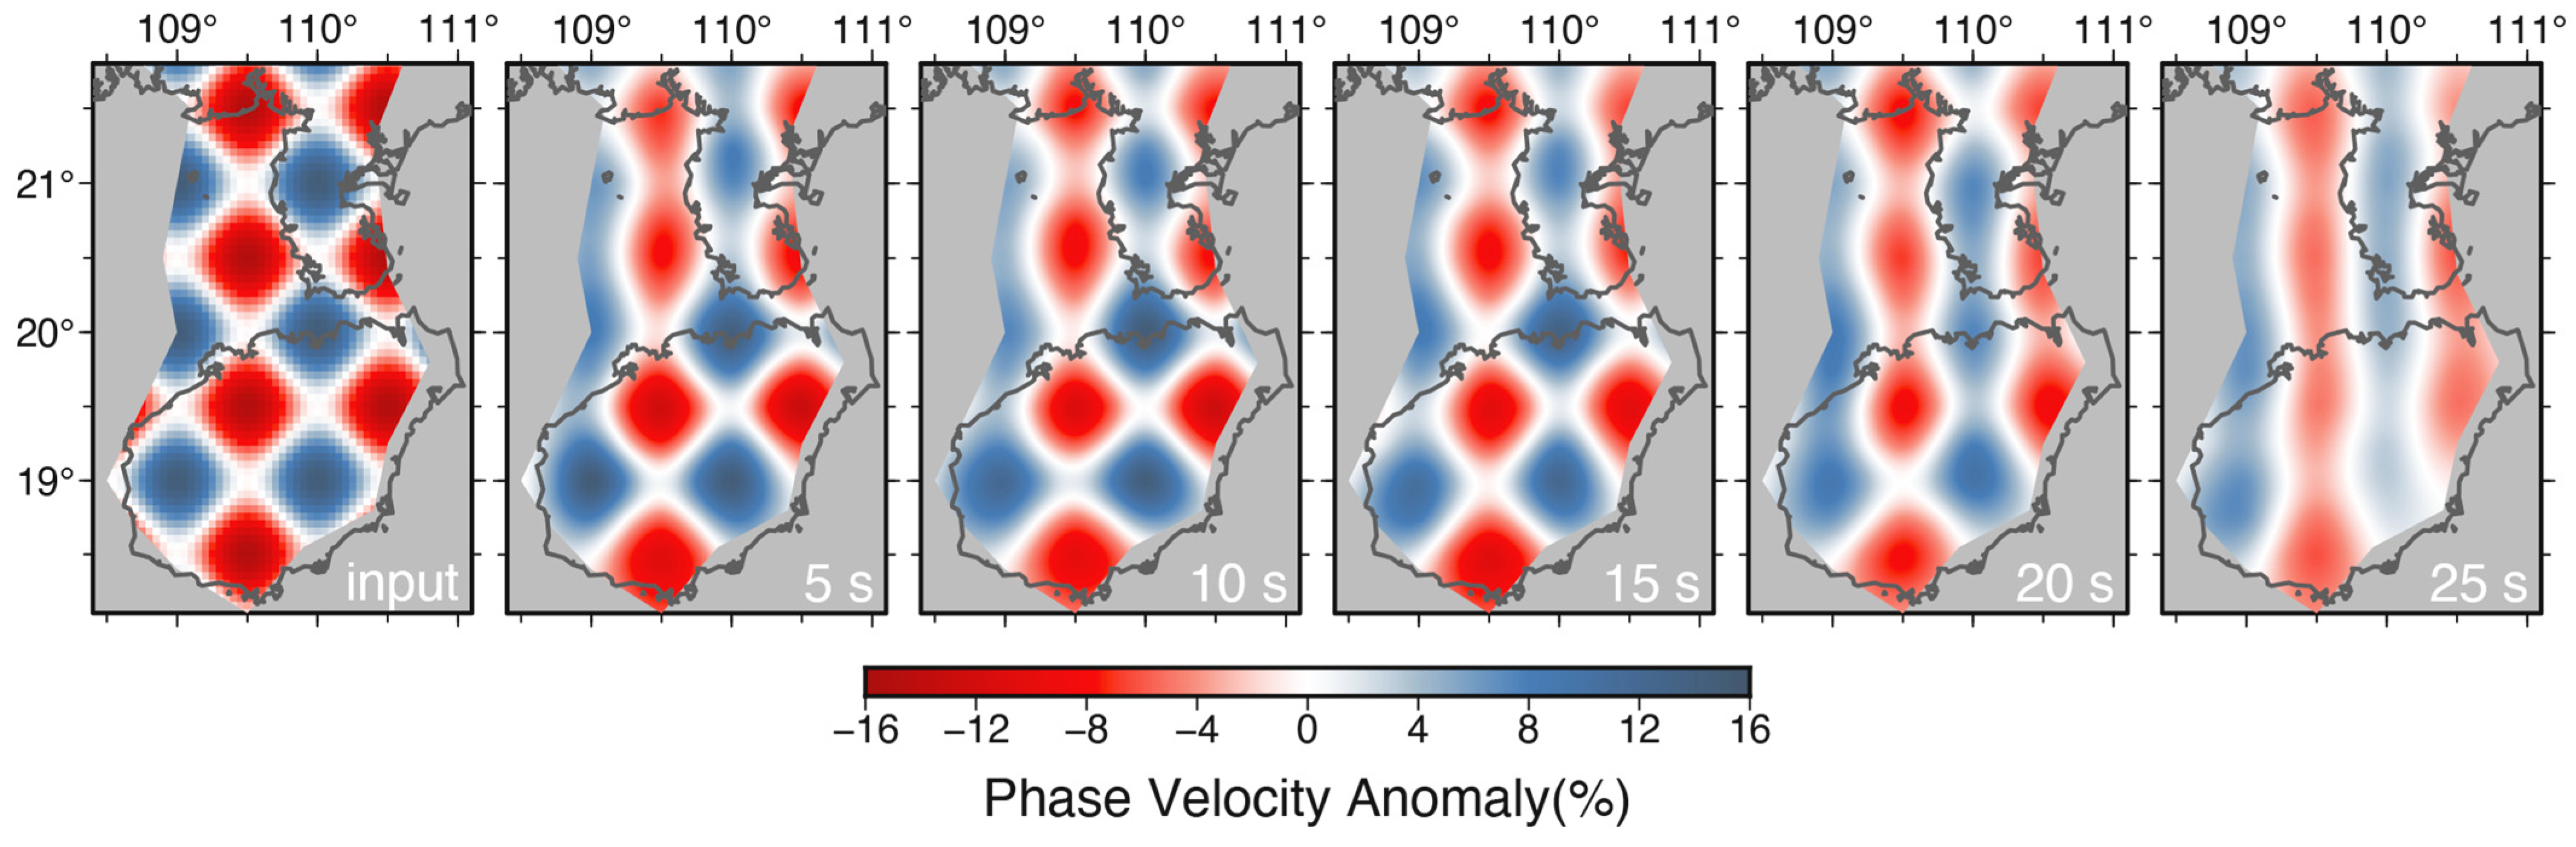
2.4. Resolution Tests
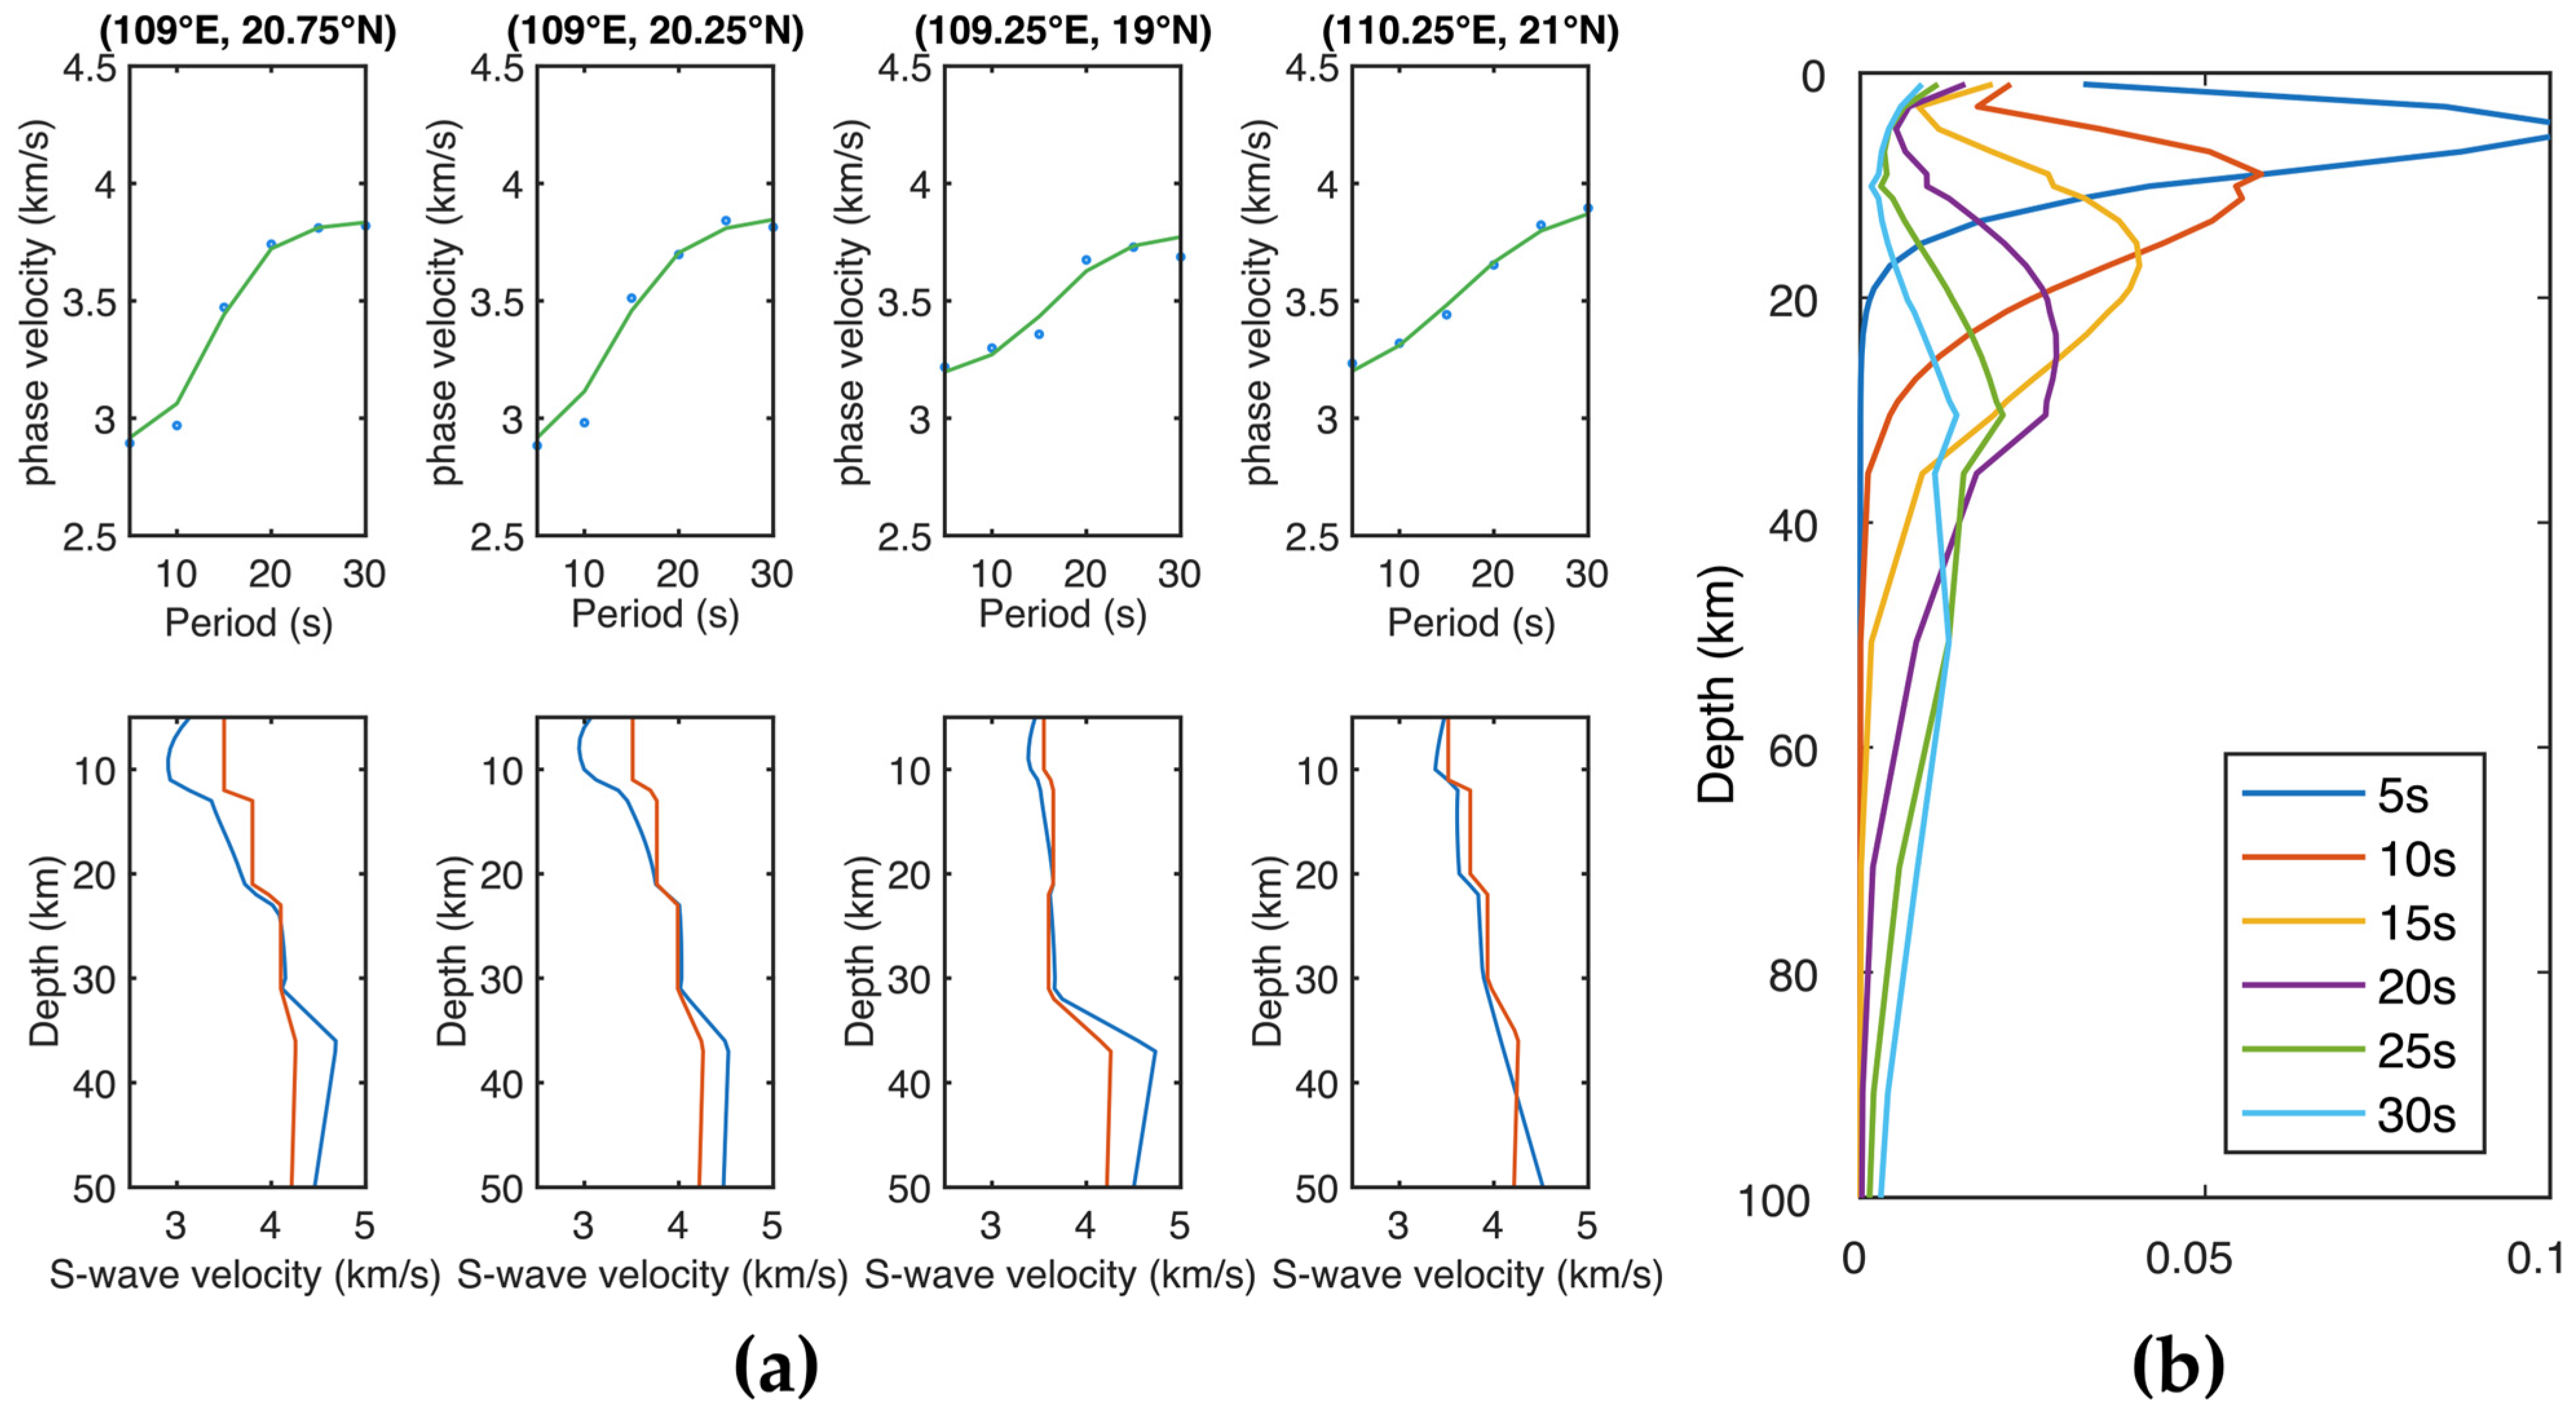
2.5. Shear Wave Inversions
3. Results
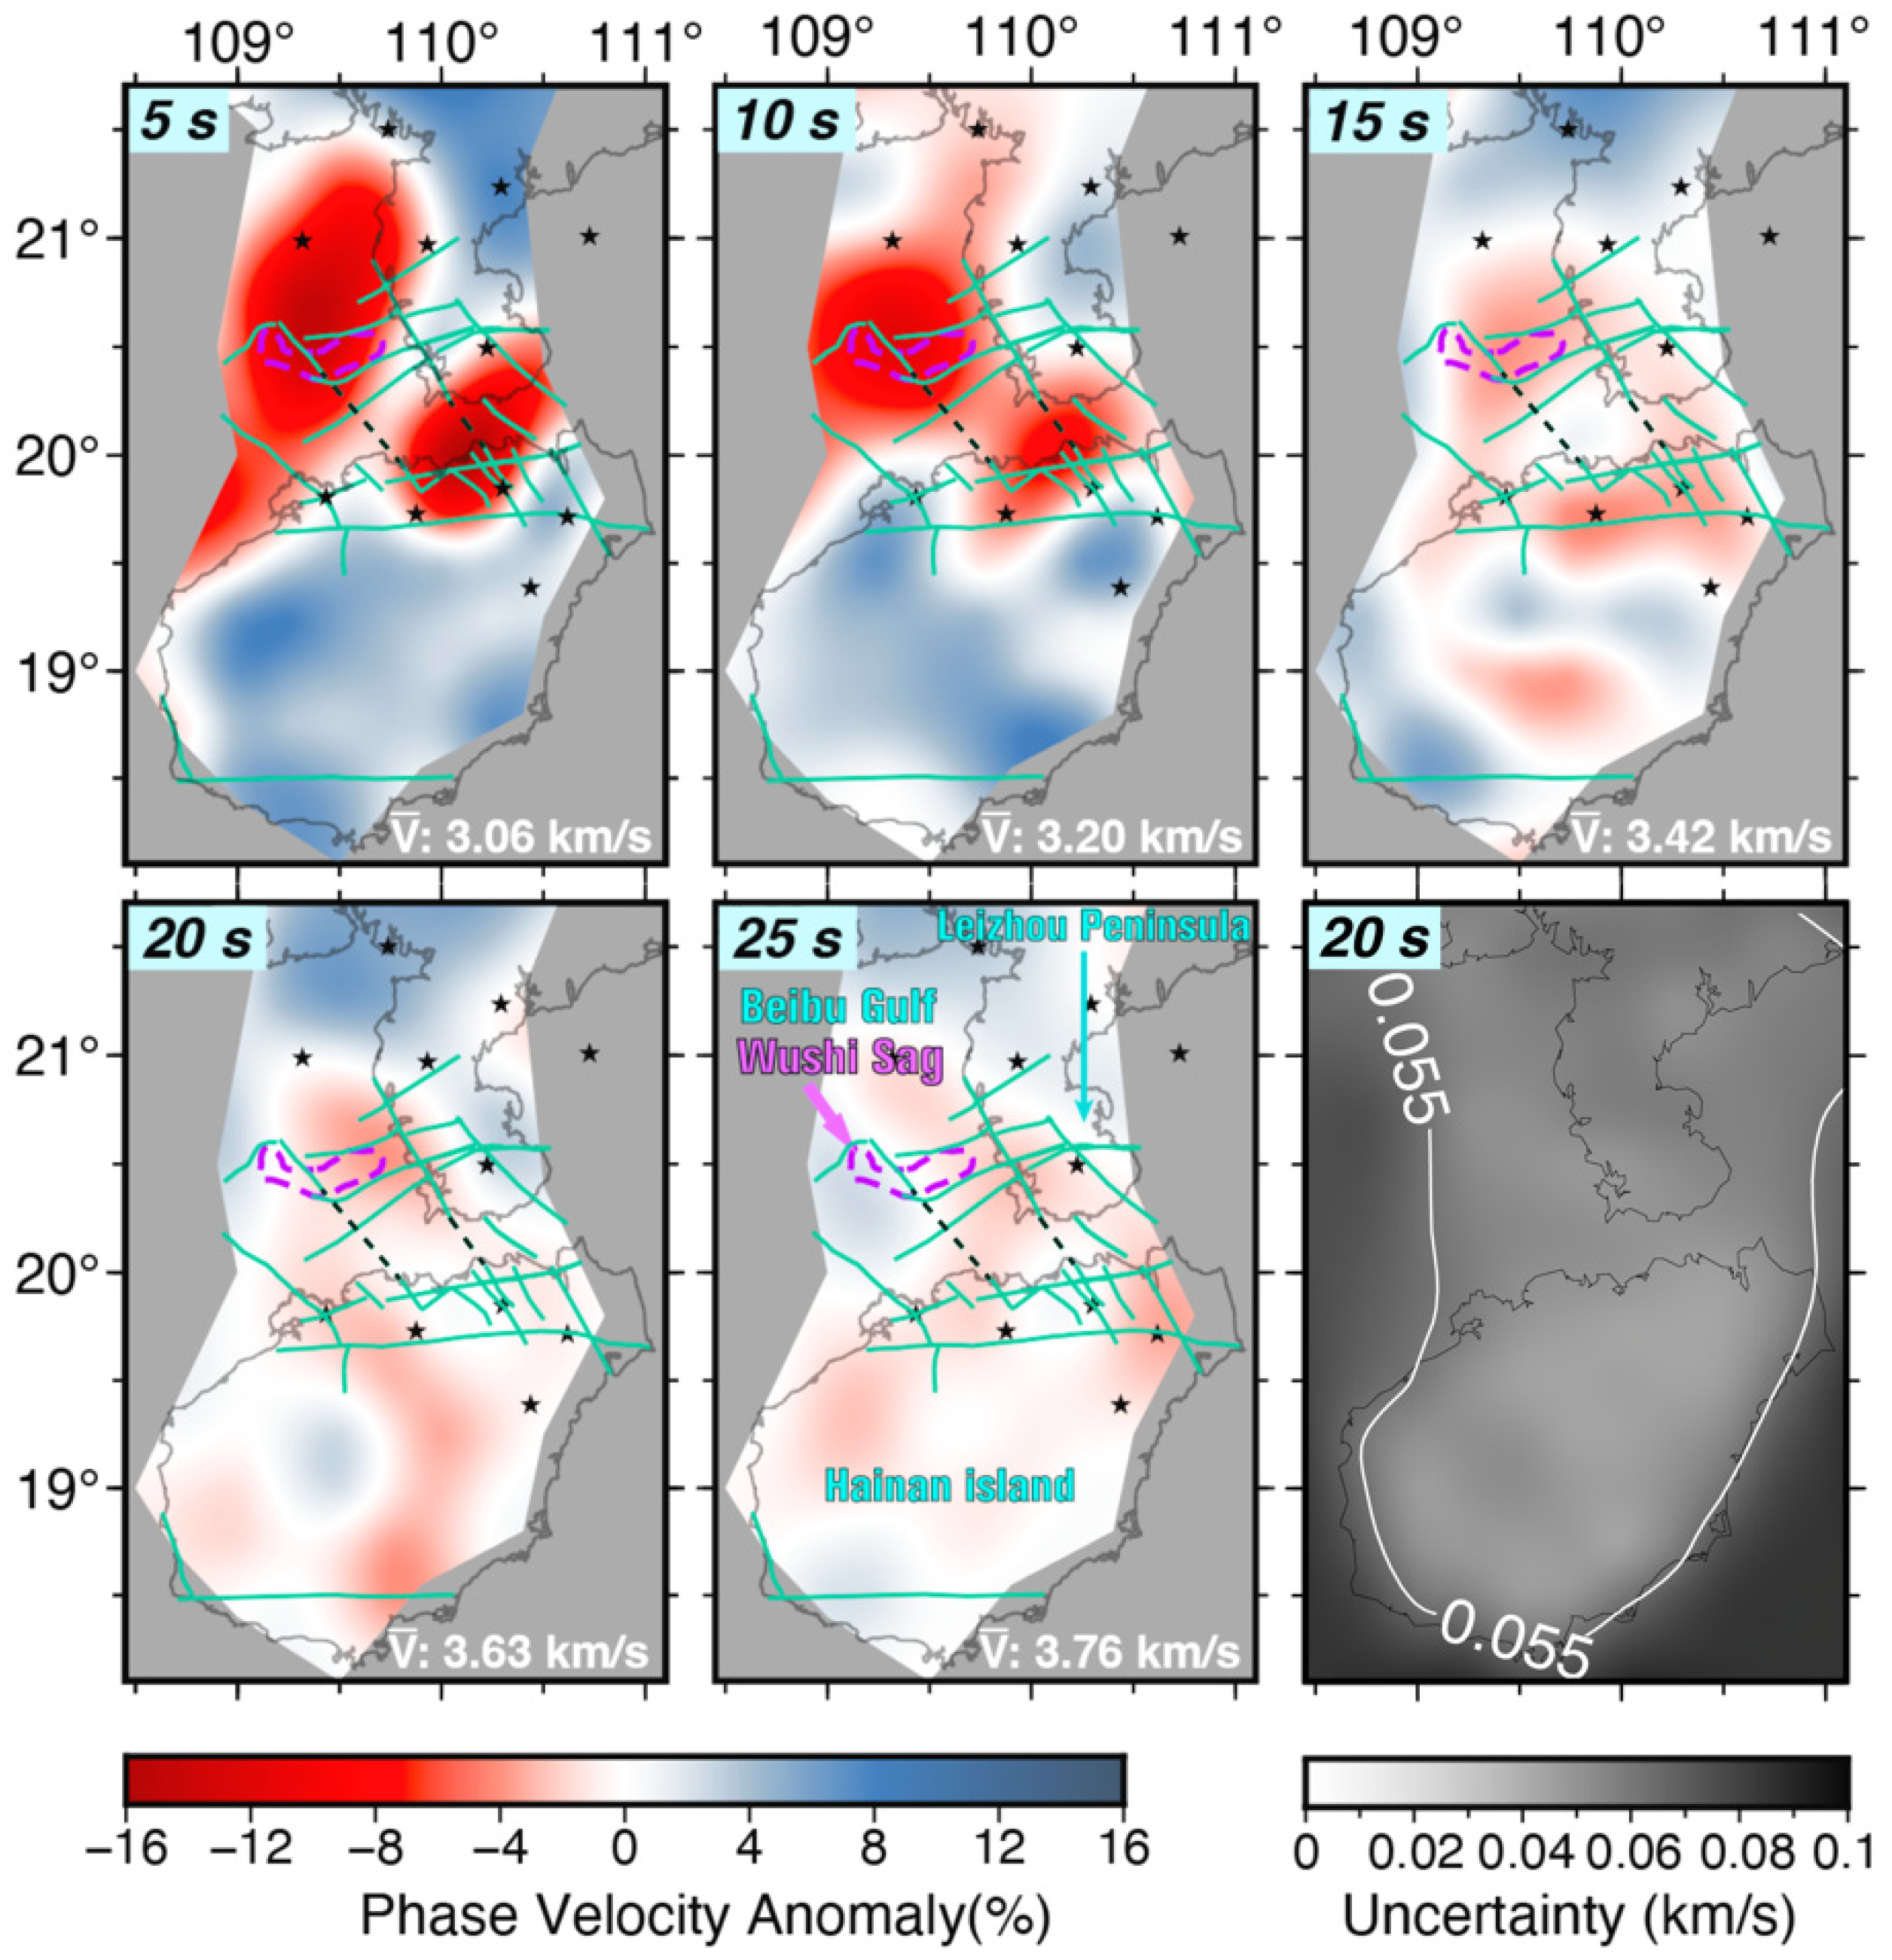
3.1. Phase Velocity Structure
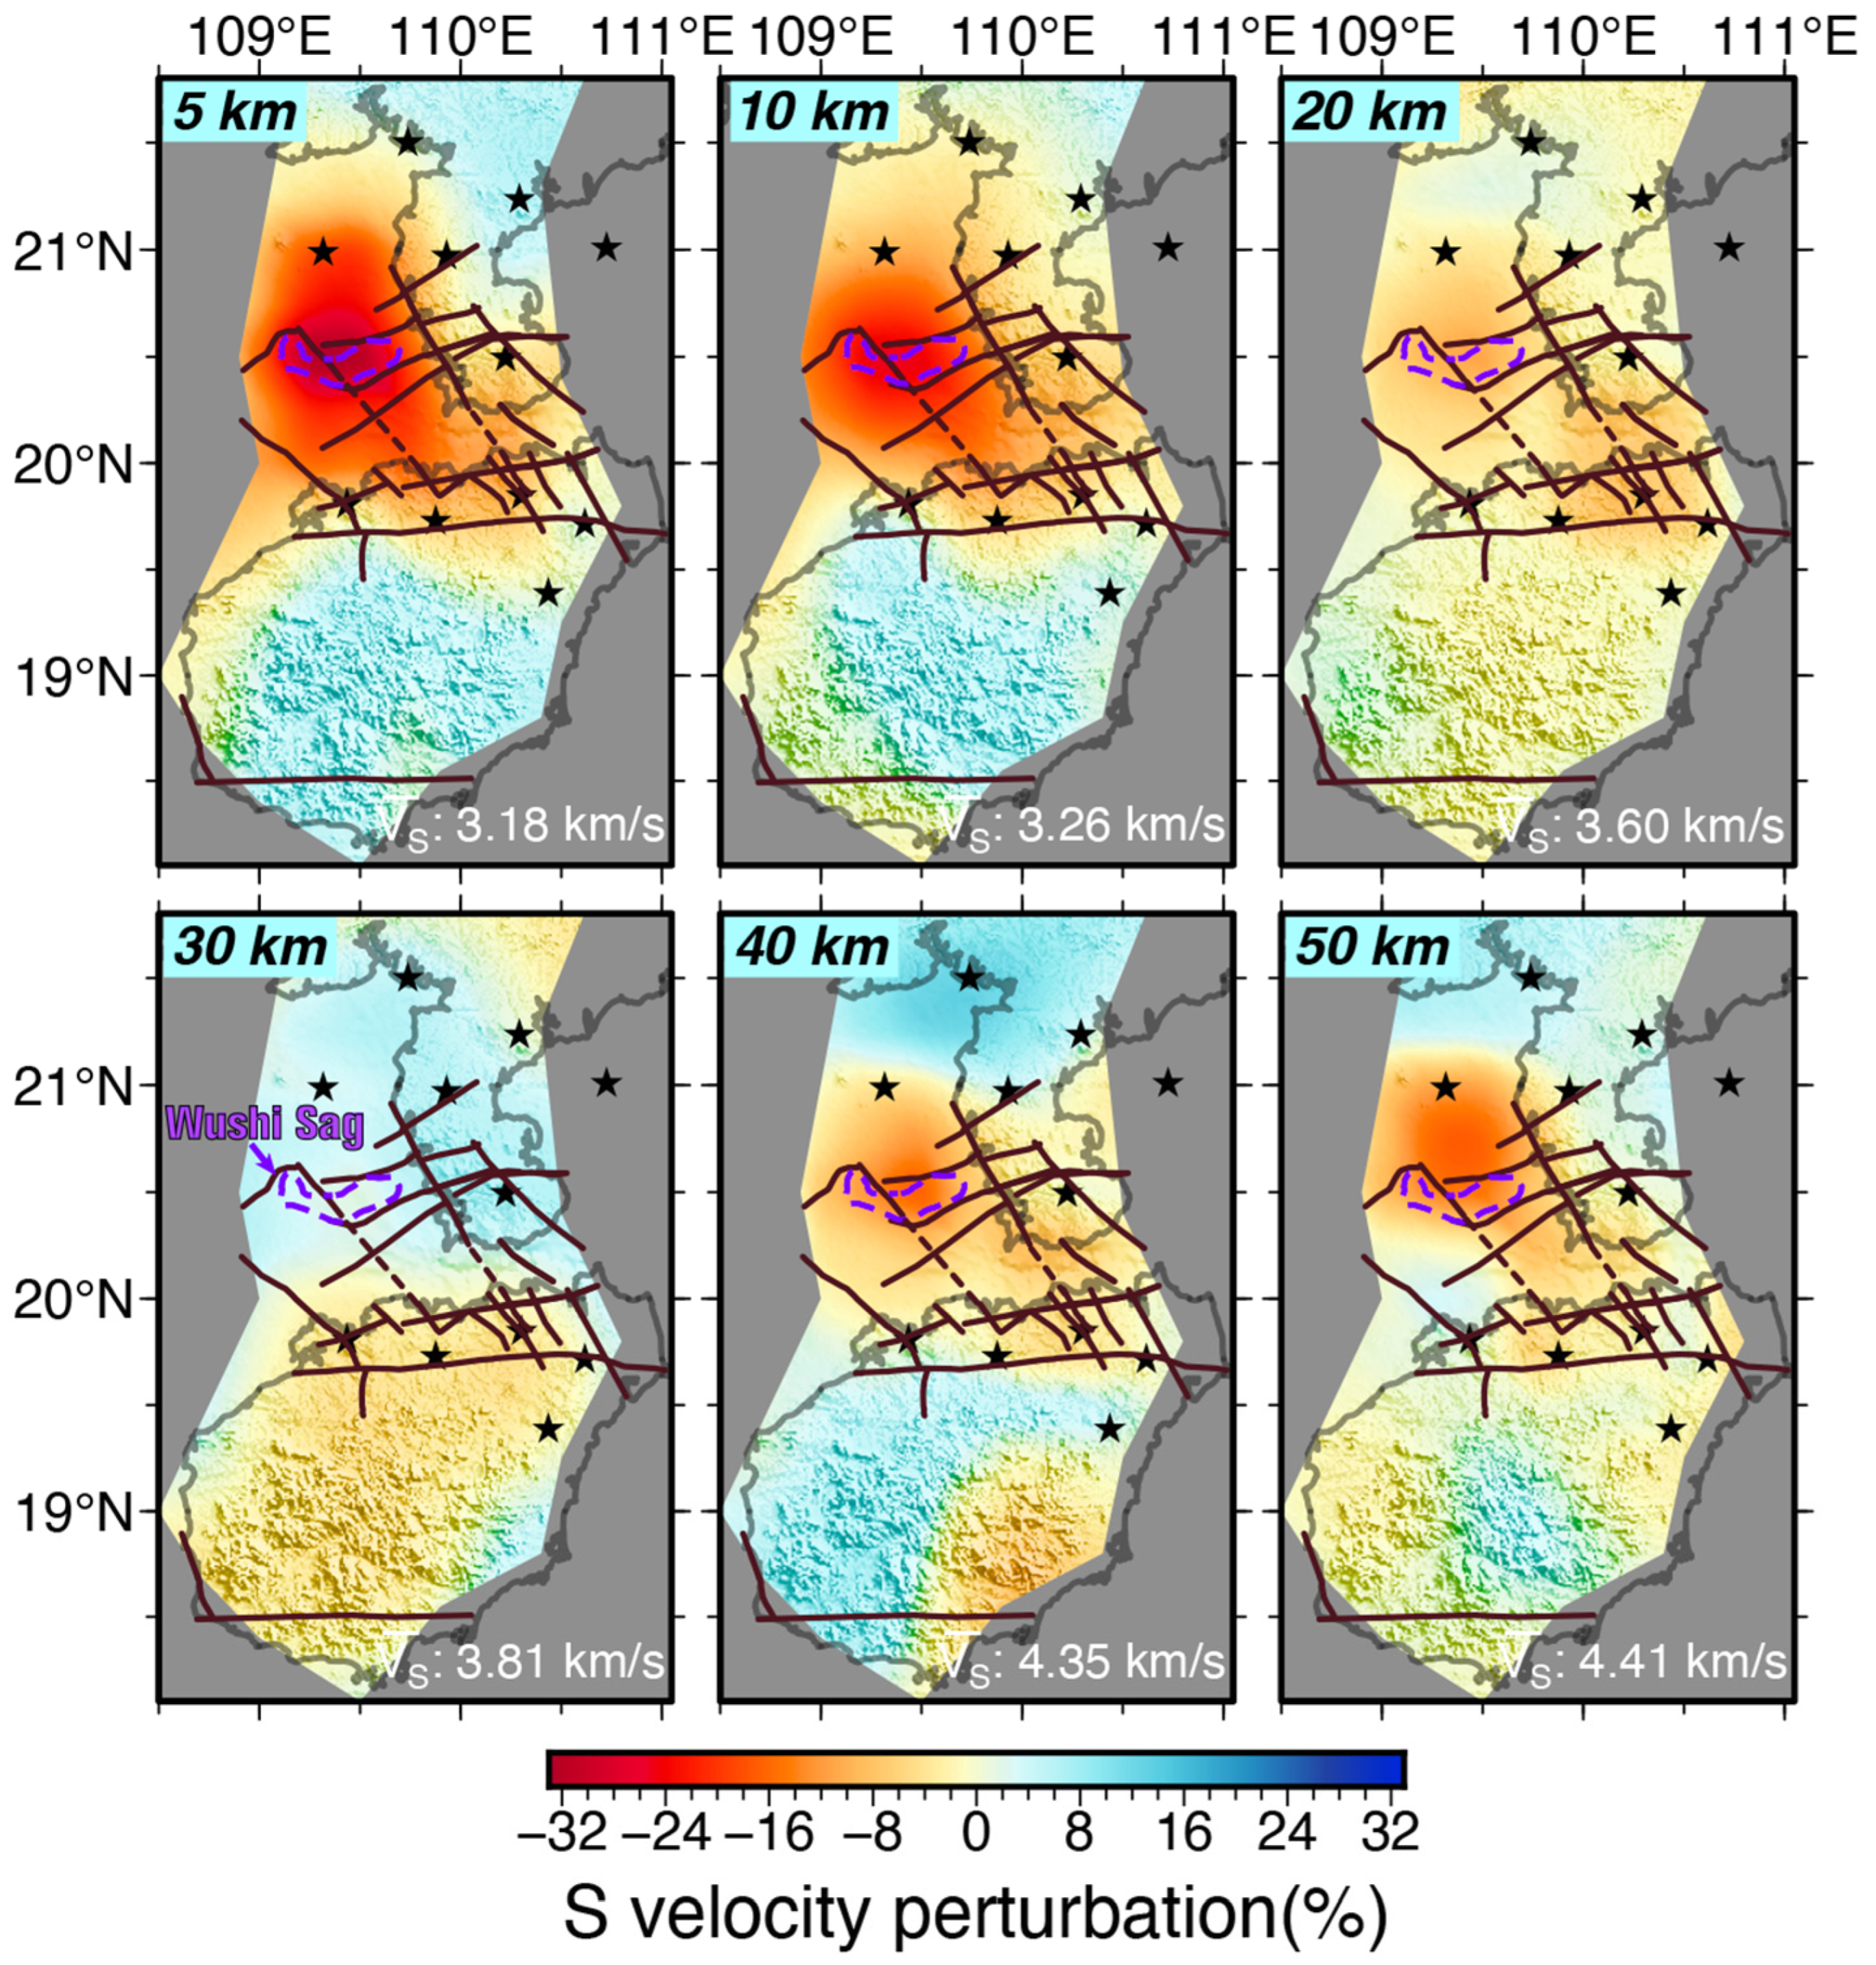
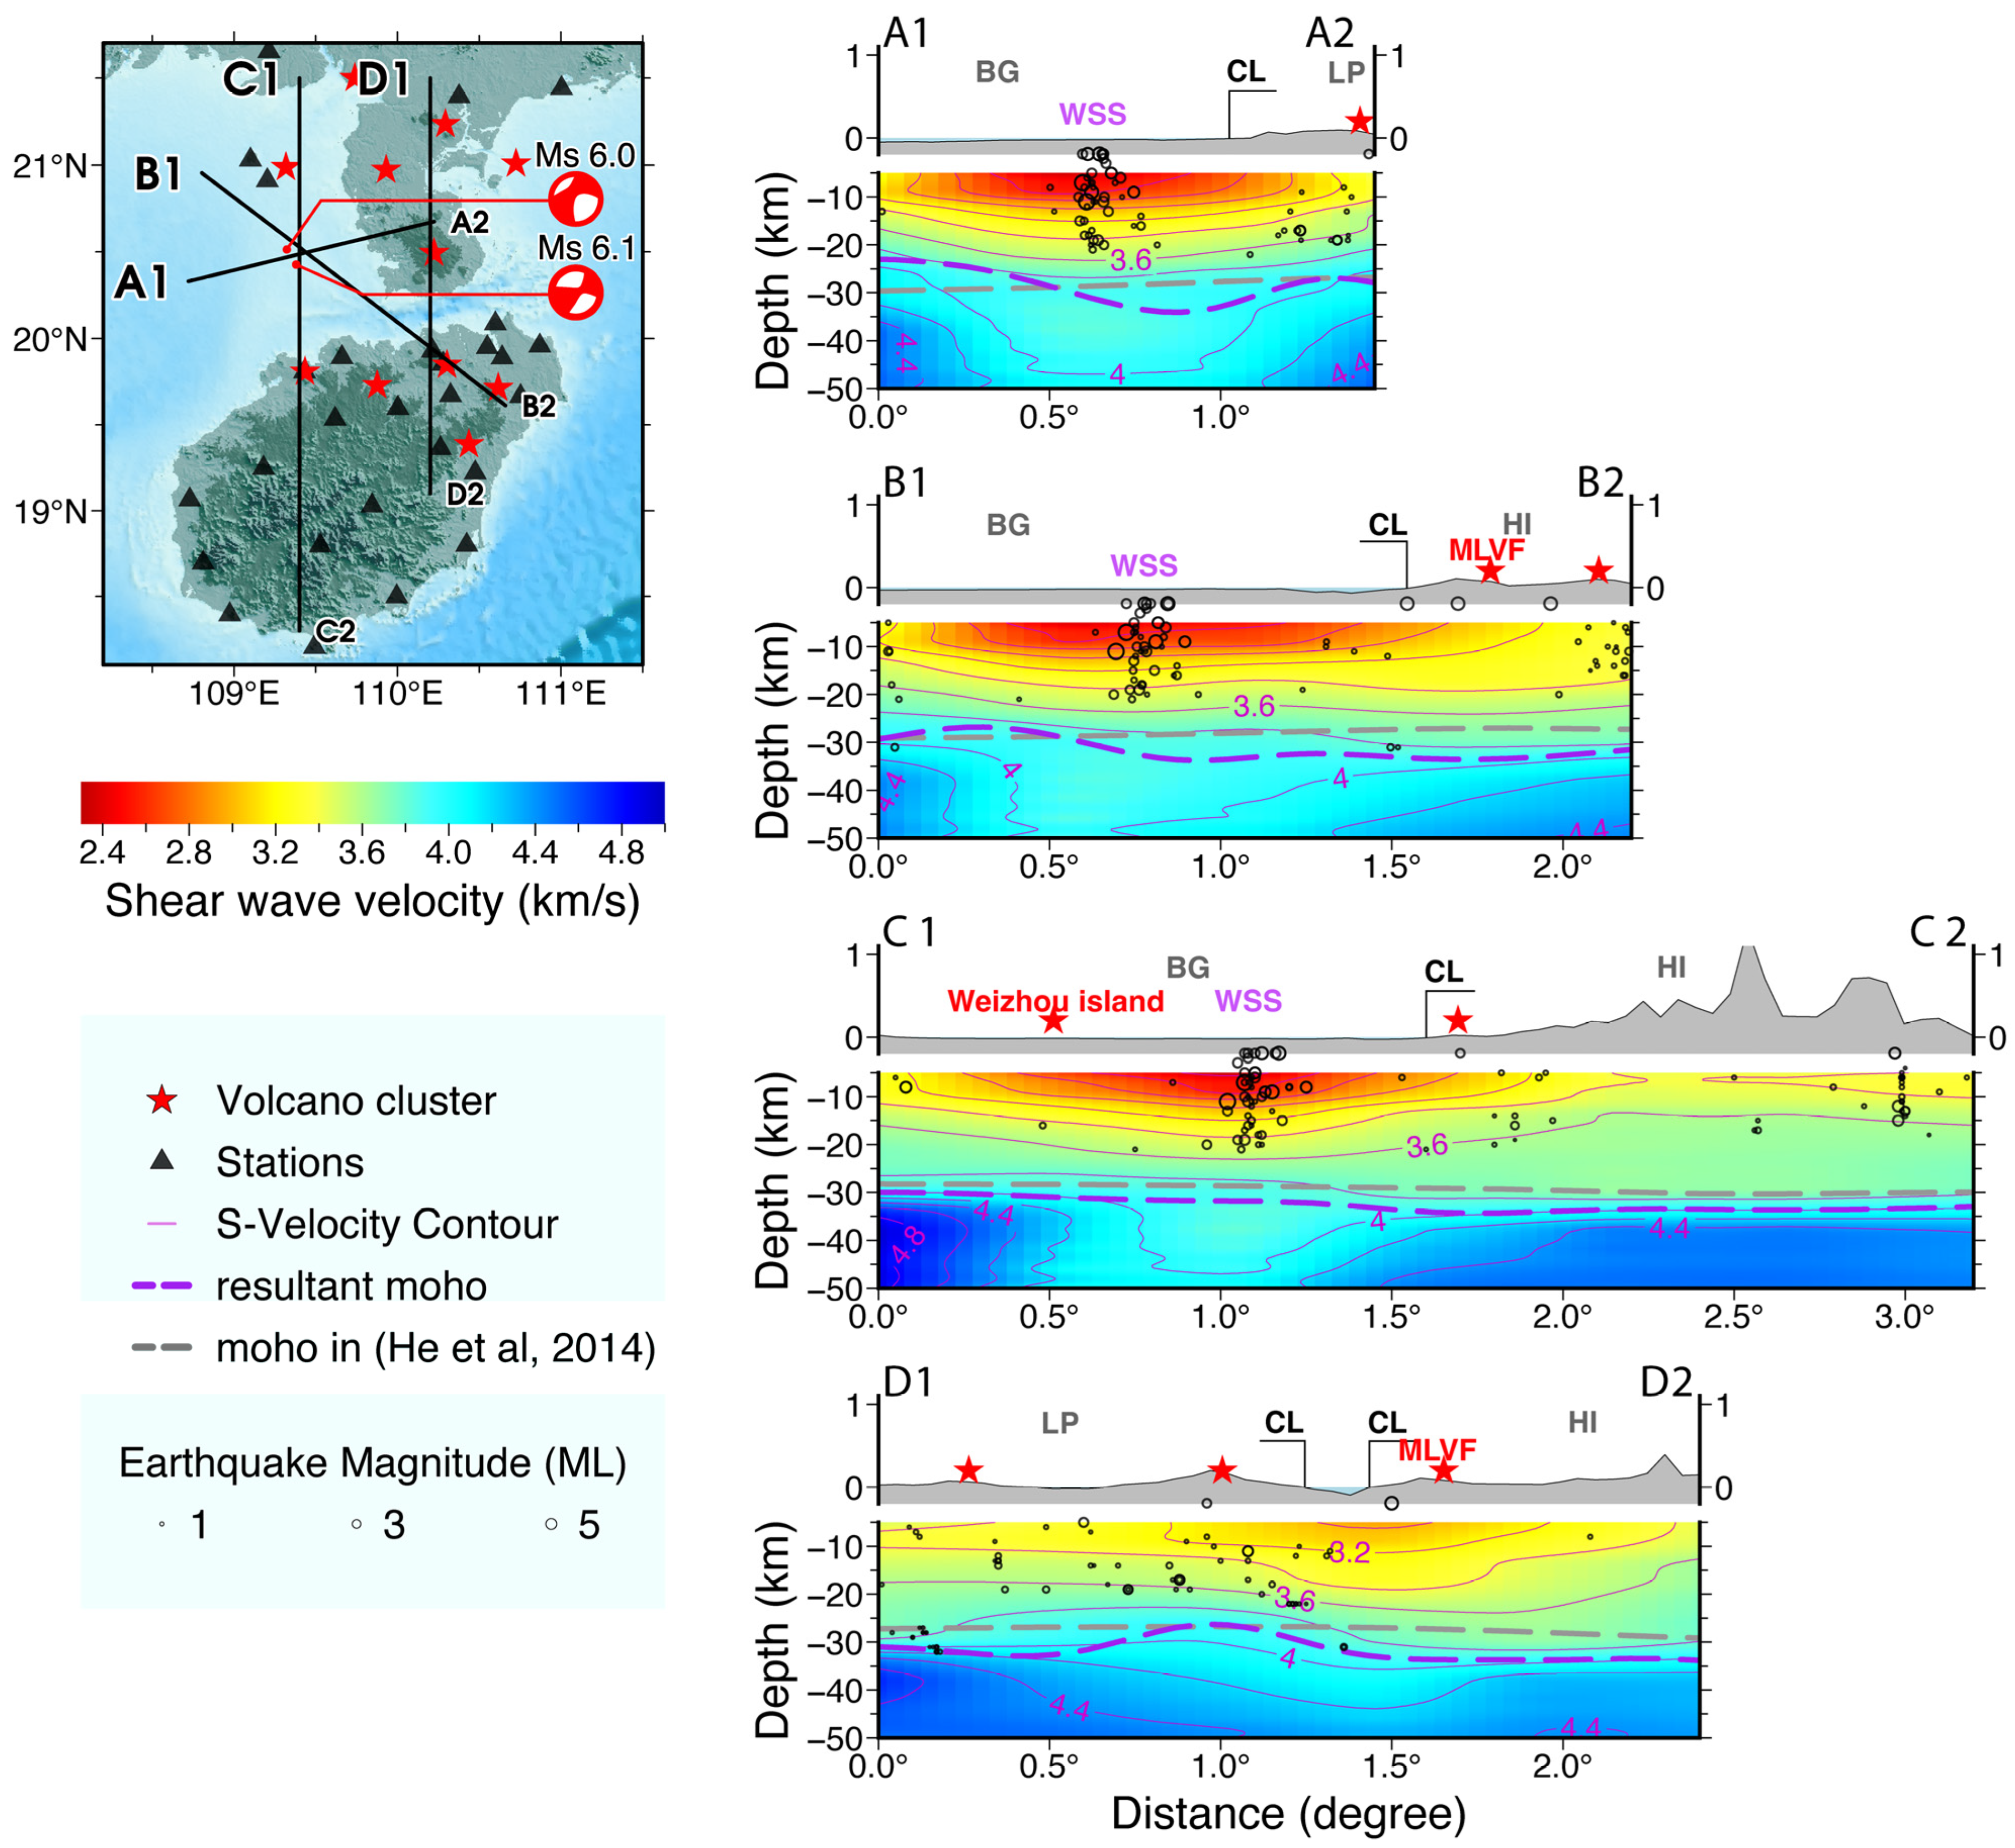
3.2. Shear Wave Velocity Structure
4. Discussion
4.1. Comparison with Previous Models
4.2. Predominant Low-Velocity Anomalies
4.3. Deepened Moho Indicative of Underplating
4.4. Conceptual Model for Crust and Magma Interactions Beneath Hainan Hotspot
5. Conclusions
Supplementary Materials
Author Contributions
Funding
Data Availability Statement
Acknowledgments
Conflicts of Interest
Appendix A

| Station Name | Province | Latitude | Longtitude | Sensor | Digitizer |
|---|---|---|---|---|---|
| JFL | Hainan | 18.6977 | 108.812 | BBVS-60 | edas-24IP/edas-GN |
| WET | Hainan | 19.9578 | 110.87 | BBVS-60 | edas-24IP/edas-GN |
| LSH | Hainan | 18.4998 | 109.996 | BBVS-60 | edas-24IP/edas-GN |
| LIG | Hainan | 19.89 | 109.66 | BBVS-60 | edas-24IP/edas-GN |
| SAY | Hainan | 18.204 | 109.493 | BBVS-60 | edas-24IP/edas-GN |
| WZS | Hainan | 18.7972 | 109.528 | BBVS-60 | edas-24IP/edas-GN |
| QSL | Hainan | 19.6656 | 110.754 | BBVS-60 | edas-24IP/edas-GN |
| CHM | Hainan | 19.5968 | 110.003 | BBVS-60 | edas-24IP/edas-GN |
| DOF | Hainan | 19.0655 | 108.729 | BBVS-60 | edas-24IP/edas-GN |
| WAN | Hainan | 18.8007 | 110.424 | BBVS-60 | edas-24IP/edas-GN |
| YML | Hainan | 19.853 | 110.28 | BBVS-60 | edas-24IP/edas-GN |
| SLL | Hainan | 19.8082 | 109.432 | BBVS-60 | edas-24IP/edas-GN |
| BSL | Hainan | 19.3633 | 110.262 | BBVS-60 | edas-24IP/edas-GN |
| QXL | Hainan | 20.0869 | 110.599 | BBVS-60 | edas-24IP/edas-GN |
| JUS | Hainan | 18.394 | 108.974 | BBVS-60 | edas-24IP/edas-GN |
| BSH | Hainan | 19.248 | 109.181 | BBVS-60 | edas-24IP/edas-GN |
| SHP | Hainan | 19.9487 | 110.55 | BBVS-60 | edas-24IP/edas-GN |
| QIH | Hainan | 19.2217 | 110.476 | BBVS-60 | edas-24IP/edas-GN |
| QZN | Hainan | 19.0291 | 109.844 | CTS-1 | EDAS-24IP |
| NAD | Hainan | 19.5337 | 109.619 | BBVS-60 | edas-24IP/edas-GN |
| DAN | Hainan | 19.67 | 110.324 | BBVS-60 | edas-24IP/edas-GN |
| HSK | Hainan | 19.9285 | 110.215 | BBVS-60 | edas-24IP/edas-GN |
| SAJ | Hainan | 19.8887 | 110.641 | BBVS-60 | edas-24IP/edas-GN |
| ZHJ | Gangdong | 21.3944 | 110.376 | KS-2000M-60 | TDE-324CI |
| SHD | Gangdong | 21.441 | 111.003 | KS-2000M-60 | TDE-324CI |
| YGJ | Gangdong | 21.8581 | 111.954 | KS-2000M-60 | TDE-324CI |
| YGD | Gangdong | 21.7113 | 112.245 | KS-2000M-60 | TDE-324CI |
| DXS | Guangxi | 21.6718 | 107.947 | CMG-3ESPC-60 | EDAS-24IP |
| YLS | Guangxi | 22.6351 | 110.173 | ? | ? |
| LNS | Guangxi | 22.4202 | 109.281 | JCZ-1 | EDAS-24L6 |
| BHS | Guangxi | 21.6525 | 109.213 | CMG-3ESPC-60 | EDAS-24IP |
| WZD | Guangxi | 21.0306 | 109.101 | ? | ? |
| XYD | Guangxi | 20.9123 | 109.204 | ? | ? |
| QZS | Guangxi | 22.2764 | 108.636 | ? | EDAS-24IP |
| “?” stands for unknown sensor or digitizer type. | |||||
References
- Zhao, D. Seismic images under 60 hotspots: Search for mantle plumes. Gondwana Res. 2007, 12, 335–355. [Google Scholar] [CrossRef]
- Le, B.M.; Yang, T.; Morgan, J.P. Seismic Constraints on Crustal and Uppermost Mantle Structure Beneath the Hawaiian Swell: Implications for Plume-Lithosphere Interactions. J. Geophys. Res. Solid Earth 2022, 127, e2021JB023822. [Google Scholar] [CrossRef]
- Thompson, R.; Gibson, S.A. Subcontinental mantle plumes, hotspots and pre-existing thinspots. J. Geol. Soc. 1991, 148, 973–977. [Google Scholar] [CrossRef]
- Yang, T.; Shen, Y. P-wave velocity structure of the crust and uppermost mantle beneath Iceland from local earthquake tomography. Earth Planet. Sci. Lett. 2005, 235, 597–609. [Google Scholar] [CrossRef]
- Huang, H.-H.; Lin, F.-C.; Schmandt, B.; Farrell, J.; Smith, R.B.; Tsai, V.C. The Yellowstone magmatic system from the mantle plume to the upper crust. Science 2015, 348, 773–776. [Google Scholar] [CrossRef] [PubMed]
- Ebinger, C.J.; Sleep, N.H. Cenozoic magmatism throughout east Africa resulting from impact of a single plume. Nature 1998, 395, 788–791. [Google Scholar] [CrossRef]
- Waite, G.P.; Smith, R.B. Seismic evidence for fluid migration accompanying subsidence of the Yellowstone caldera. J. Geophys. Res. Solid Earth 2002, 107, ESE 1-1–ESE 1-15. [Google Scholar] [CrossRef]
- Barley, M.E.; Krapez, B.; Groves, D.I.; Kerrich, R. The Late Archaean bonanza: Metallogenic and environmental consequences of the interaction between mantle plumes, lithospheric tectonics and global cyclicity. Precambrian Res. 1998, 91, 65–90. [Google Scholar] [CrossRef]
- Guo, M.; Yu, H.; Hu, J.; Wang, X.; Zheng, Z.; Wang, G. Progress in monitoring and research of activity of volcanoes in northern Hainan Island. Seismol. Geol. 2022, 44, 1128–1141. [Google Scholar] [CrossRef]
- Hu, Y.; Hao, M.; Ji, L.; Song, S. Three-dimensional crustal movement and the activities of earthquakes, volcanoes and faults in Hainan Island, China. Geod. Geodyn. 2016, 7, 284–294. [Google Scholar] [CrossRef]
- Lu, Y.; Wei, Q. Volcano monitoring and research in Qiongbei, Hainan. J. Coll. Disaster Prev. Tech. 2005, 7, 33–37. (In Chinese) [Google Scholar] [CrossRef]
- Huang, Z.; Chai, F. A New Approach to the Quaternary Volcanicity in the Leiqiong Area. Trop. Geogr. 1994, 14, 1–10. [Google Scholar]
- Fan, Q.; Sun, Q.; Sui, J.; Li, N. Trace-element and isotopic geochemistry of volcanic rocks and it’s techtonic implications in Weizhou Island and Xieyang Island, Northern Bay. Acta Petrol. Sin. 2008, 24, 1323–1332. [Google Scholar]
- Li, C.; Wang, F.; Zhong, C. Geochemistry of Quaternary basaltic volcanic rocks of Weizhou island in Beihai city of Guangxi and a discussion on characteristics of their source. Yanshi Kuangwuxue Zazhi (Acta Petrol. Mineralog.) 2005, 24, 1–11. [Google Scholar] [CrossRef]
- Li, C.; Wang, F. Holocene volcanic effusion in Weizhou Island and its geological significance. Miner. Pet. 2004, 4, 28–34. [Google Scholar] [CrossRef]
- Lin, J.; Xia, S.; Wang, X.; Zhao, D.; Wang, D. Seismogenic crustal structure affected by the Hainan mantle plume. Gondwana Res. 2022, 103, 23–36. [Google Scholar] [CrossRef]
- Li, Z.; Zhao, W.; Liu, G. A study on deep crust structures and stress situation of the 1605 Qiongshan strong earthquake. South China J. Seismol. 2006, 26, 28–36. [Google Scholar] [CrossRef]
- Zhou, R.-M.; Chen, Y.-T.; Wu, Z.-L. Moment tensor inversion for focal mechanism of the Beibuwan earthquakes. Acta Seismol. Sin. 1999, 12, 609–617. [Google Scholar] [CrossRef]
- Wei, S.S.; Chen, Y.J. Seismic evidence of the Hainan mantle plume by receiver function analysis in southern China. Geophys. Res. Lett. 2016, 43, 8978–8985. [Google Scholar] [CrossRef]
- Xu, X.; Xibing, Y.; Lin, H.U.; Shuicheng, L.; Shixin, F.; Shuai, Z. Characteristics of Fractures in Wushi Sag and Their Influence on Hydrocarbon Accumulation. Nat. Gas Technol. Econ. 2016, 10, 17–21. [Google Scholar] [CrossRef]
- Yan, Q.; Shi, X. Hainan mantle plume and the formation and evolution of the South China Sea. Geol. J. China Univ. 2007, 13, 311–322. [Google Scholar] [CrossRef]
- Yan, P.; Liu, H. Analysis on deep crust sounding results in northern margin of South China Sea. J. Trop. Oceanogr. (Chin.) 2002, 21, 1–12. [Google Scholar] [CrossRef]
- Clift, P.; Lin, J.; Barckhausen, U. Evidence of low flexural rigidity and low viscosity lower continental crust during continental break-up in the South China Sea. Mar. Pet. Geol. 2002, 19, 951–970. [Google Scholar] [CrossRef]
- Clift, P.D.; Sun, Z. The sedimentary and tectonic evolution of the Yinggehai-Song Hong basin and the southern Hainan margin, South China Sea: Implications for Tibetan uplift and monsoon intensification. J. Geophys. Res.-Solid Earth 2006, 111, B06405. [Google Scholar] [CrossRef]
- Sun, Z.; Zhong, Z.; Zhou, D.; Zeng, Z. Continent-ocean interactions along the Red River fault zone, South China Sea. Cont.-Ocean Interact. East Asian Marg. Seas Geophys. Monogr. 2004, 149, 109–120. [Google Scholar]
- Zhang, Y.; Sun, Z.; Zhou, D.; Guo, X.; Shi, X.; Wu, X.; Pang, X. Stretching characteristics and its dynamic significance of the northern continental margin of South China Sea. Sci. China Ser. D-Earth Sci. 2008, 51, 422–430. [Google Scholar] [CrossRef]
- Lebedev, S.; Nolet, G. Upper mantle beneath southeast Asia from S velocity tomography. J. Geophys. Res.-Solid Earth 2003, 108, 2048. [Google Scholar] [CrossRef]
- Lebedev, S.; Chevrot, S.; Nolet, G.; Van der Hilst, R. New seismic evidence for a deep mantle origin of the S. China basalts (the Hainan plume?) and other observations in SE Asia. Eos Trans. AGU 2000, 81, F1110. [Google Scholar]
- Wang, C.; Huang, J. Mantle transition zone structure around Hainan by receiver function analysis. Chin. J. Geophys. 2012, 55, 1161–1167. [Google Scholar]
- Le, B.M.; Yang, T.; Gu, S.Y. Upper mantle and transition zone structure beneath Leizhou-Hainan region: Seismic evidence for a lower-mantle origin of the Hainan plume. J. Asian Earth Sci. 2015, 111, 580–588. [Google Scholar] [CrossRef]
- Huang, J. P- and S-wave tomography of the Hainan and surrounding regions: Insight into the Hainan plume. Tectonophysics 2014, 633, 176–192. [Google Scholar] [CrossRef]
- Huang, J.; Zhao, D. High-resolution mantle tomography of China and surrounding regions. J. Geophys. Res.-Solid Earth 2006, 111, B09305. [Google Scholar] [CrossRef]
- Lei, J.; Zhao, D.; Steinberger, B.; Wu, B.; Shen, F.; Li, Z. New seismic constraints on the upper mantle structure of the Hainan plume. Phys. Earth Planet. Inter. 2009, 173, 33–50. [Google Scholar] [CrossRef]
- Montelli, R.; Nolet, G.; Dahlen, F.A.; Masters, G.; Engdahl, E.R.; Hung, S.H. Finite-frequency tomography reveals a variety of plumes in the mantle. Science 2004, 303, 338–343. [Google Scholar] [CrossRef]
- Wang, X.-C.; Li, Z.-X.; Li, X.-H.; Li, J.; Liu, Y.; Long, W.-G.; Zhou, J.-B.; Wang, F. Temperature, pressure, and composition of the mantle source region of Late Cenozoic basalts in Hainan Island, SE Asia: A consequence of a young thermal mantle plume close to subduction zones? J. Petrol. 2012, 53, 177–233. [Google Scholar] [CrossRef]
- He, R.; Shang, X.; Yu, C.; Zhang, H.; Van der Hilst, R.D. A unified map of Moho depth and Vp/Vs ratio of continental China by receiver function analysis. Geophys. J. Int. 2014, 199, 1910–1918. [Google Scholar] [CrossRef]
- Li, Z.; Lei, J.; Zhao, D.; Wu, B.; Shen, F.; Qiu, X. Three-dimensional P-wave velocity structure of the crust beneath Hainan Island and its adjacent regions, China. Earthq. Sci. 2008, 21, 441–448. [Google Scholar] [CrossRef]
- Liu, H.; Chen, F.; Leng, W.; Zhang, H.J.; Xu, Y.G. Crustal Footprint of the Hainan Plume Beneath Southeast China. J. Geophys. Res.-Solid Earth 2018, 123, 3065–3079. [Google Scholar] [CrossRef]
- Wu, H.-H.; Tsai, Y.-B.; Lee, T.-Y.; Lo, C.-H.; Hsieh, C.-H.; Van Toan, D. 3-D shear wave velocity structure of the crust and upper mantle in South China Sea and its surrounding regions by surface wave dispersion analysis. Mar. Geophys. Res. 2004, 25, 5–27. [Google Scholar] [CrossRef]
- Shen, W.S.; Ritzwoller, M.H.; Kang, D.; Kim, Y.; Lin, F.C.; Ning, J.Y.; Wang, W.T.; Zheng, Y.; Zhou, L.Q. A seismic reference model for the crust and uppermost mantle beneath China from surface wave dispersion. Geophys. J. Int. 2016, 206, 954–979. [Google Scholar] [CrossRef]
- Jia, S.; Li, Z.; Xu, Z.; Shen, F.; Zhao, W.; Yang, Z.; Yang, J.; Lei, W. Crustal structure features of the Leiqiong depression in Hainan Province. Chin. J. Geophys.-Chin. Ed. 2006, 49, 1385–1394. [Google Scholar] [CrossRef]
- Xia, S.; Zhao, D.; Sun, J.; Huang, H. Teleseismic imaging of the mantle beneath southernmost China: New insights into the Hainan plume. Gondwana Res. 2016, 36, 46–56. [Google Scholar] [CrossRef]
- Bensen, G.D.; Ritzwoller, M.H.; Barmin, M.P.; Levshin, A.L.; Lin, F.; Moschetti, M.P.; Shapiro, N.M.; Yang, Y. Processing seismic ambient noise data to obtain reliable broad-band surface wave dispersion measurements. Geophys. J. Int. 2007, 169, 1239–1260. [Google Scholar] [CrossRef]
- Huo, D.; Yang, T. Seismic ambient noise around the South China Sea: Seasonal and spatial variations, and implications for its climate and surface circulation. Mar. Geophys. Res. 2013, 34, 449–459. [Google Scholar] [CrossRef]
- Wang, Y.; Yang, T.; Wu, Y.; Liu, D.; Huang, X.; Wang, J.; Zhong, W.; Shou, H.; Zhou, Y.; Chen, Y. A new broad-band ocean bottom seismograph and characteristics of the seismic ambient noise on the South China Sea seafloor based on its recordings. Geophys. J. Int. 2022, 230, 684–695. [Google Scholar] [CrossRef]
- Xiao, H.; Xue, M.; Pan, M.; Gao, J. Characteristics of microseisms in South China. Bull. Seismol. Soc. Am. 2018, 108, 2713–2723. [Google Scholar] [CrossRef]
- Xiao, H.; Xue, M.; Yang, T.; Liu, C.; Hua, Q.; Xia, S.; Huang, H.; Le, B.M.; Yu, Y.; Huo, D. The characteristics of microseisms in South China Sea: Results from a combined data set of OBSs, broadband land seismic stations, and a global wave height model. J. Geophys. Res. Solid Earth 2018, 123, 3923–3942. [Google Scholar] [CrossRef]
- Yao, H.; Van Der Hilst, R. Analysis of ambient noise energy distribution and phase velocity bias in ambient noise tomography, with application to SE Tibet. Geophys. J. Int. 2009, 179, 1113–1132. [Google Scholar] [CrossRef]
- Froment, B.; Campillo, M.; Roux, P.; Gouédard, P.; Verdel, A.; Weaver, R.L. Estimation of the effect of nonisotropically distributed energy on the apparent arrival time in correlations. Geophysics 2010, 75, SA85–SA93. [Google Scholar] [CrossRef]
- Le, B.M.; Yang, T.; Chen, Y.J.; Yao, H. Correction of OBS clock errors using Scholte waves retrieved from cross-correlating hydrophone recordings. Geophys. J. Int. 2017, 212, 891–899. [Google Scholar] [CrossRef]
- Yao, H.; Gouédard, P.; Collins, J.A.; McGuire, J.J.; van der Hilst, R.D. Structure of young East Pacific Rise lithosphere from ambient noise correlation analysis of fundamental- and higher-mode Scholte-Rayleigh waves. Comptes Rendus Geosci. 2011, 343, 571–583. [Google Scholar] [CrossRef]
- Harmon, N.; Gerstoft, P.; Rychert, C.A.; Abers, G.A.; Salas de la Cruz, M.; Fischer, K.M. Phase velocities from seismic noise using beamforming and cross correlation in Costa Rica and Nicaragua. Geophys. Res. Lett. 2008, 35, L19303. [Google Scholar] [CrossRef]
- Yao, H.; Van Der Hilst, R.D.; Montagner, J.P. Heterogeneity and anisotropy of the lithosphere of SE Tibet from surface wave array tomography. J. Geophys. Res.-Solid Earth 2010, 115, B12307. [Google Scholar] [CrossRef]
- Liu, C.; Yao, H. Surface Wave Tomography with Spatially Varying Smoothing Based on Continuous Model Regionalization. Pure Appl. Geophys. 2017, 174, 937–953. [Google Scholar] [CrossRef]
- Montagner, J. Regional three-dimensional structures using long-period surface waves. Ann. Geophys 1986, 4, 283–294. [Google Scholar]
- Tarantola, A.; Valette, B. Generalized nonlinear inverse problems solved using the least squares criterion. Rev. Geophys. 1982, 20, 219–232. [Google Scholar] [CrossRef]
- Humphreys, E.; Clayton, R.W. Adaptation of Back Projection Tomography to Seismic Travel Time Problems. J. Geophys. Res.-Solid Earth Planets 1988, 93, 1073–1085. [Google Scholar] [CrossRef]
- Zhao, D.; Hasegawa, A.; Horiuchi, S. Tomographic Imaging of P-Wave and S-Wave Velocity Structure beneath Northeastern Japan. J. Geophys. Res.-Solid Earth 1992, 97, 19909–19928. [Google Scholar] [CrossRef]
- Saito, M. DISPER80: A subroutine package for the calculation of seismic normal-mode solutions. In Seismological Algorithm; Academic Press: Cambridge, MA, USA, 1988; pp. 293–319. [Google Scholar]
- Laske, G.; Ma, Z.; Masters, G.; Pasyanos, M. CRUST 1.0: An updated global model of Earth’s crust. Geophys. Res. Abstr. 2012, 14, 3743. Available online: https://meetingorganizer.copernicus.org/EGU2012/EGU2012-3743-1.pdf (accessed on 13 October 2023).
- Yang, H.; Liang, J.; Hu, W. Structural features and impacts on hydrocarbon accumulation in Wushi Sag. J. Southwest Pet. Univ. (Sci. Technol. Ed.) 2011, 33, 41–46. [Google Scholar] [CrossRef]
- Lü, J.; Xie, Z.; Zheng, Y.; Zha, X.; Hu, R.; Zeng, X. Rayleigh wave phase velocities of South China block and its adjacent areas. Sci. China Earth Sci. 2016, 59, 2165–2178. [Google Scholar] [CrossRef]
- Zhou, L.; Xie, J.; Shen, W.; Zheng, Y.; Yang, Y.; Shi, H.; Ritzwoller, M.H. The structure of the crust and uppermost mantle beneath South China from ambient noise and earthquake tomography. Geophys. J. Int. 2012, 189, 1565–1583. [Google Scholar] [CrossRef]
- Peng, J.; Huang, J.L.; Liu, Z.K.; Xing, K. Constraints on S-wave velocity structures of the lithosphere in mainland China from broadband ambient noise tomography. Phys. Earth Planet. Inter. 2020, 299, 106406. [Google Scholar] [CrossRef]
- Ren, Y.; Stuart, G.; Houseman, G.; Grecu, B.; Hegedüs, E.; Dando, B.; Lorinczi, P.; Gogus, O.; Kovács, A.; Torok, I.; et al. Crustal structure of the carpathian-pannonian region from ambient noise tomography. Geophys. J. Int. 2013, 195, 1351–1369. [Google Scholar] [CrossRef]
- Taylor, G.; Rost, S.; Houseman, G.A.; Hillers, G. Near-surface structure of the North Anatolian Fault zone from Rayleigh and Love wave tomography using ambient seismic noise. Solid Earth 2019, 10, 363–378. [Google Scholar] [CrossRef]
- Manu-Marfo, D.; Aoudia, A.; Pachhai, S.; Kherchouche, R. 3D shear wave velocity model of the crust and uppermost mantle beneath the Tyrrhenian basin and margins. Sci. Rep. 2019, 9, 3609. [Google Scholar] [CrossRef] [PubMed]
- Szanyi, G.; Gráczer, Z.; Balázs, B.; Kovacs, I. The transition zone between the Eastern Alps and the Pannonian basin imaged by ambient noise tomography. Tectonophysics 2021, 805, 228770. [Google Scholar] [CrossRef]
- Eberhart-Phillips, D.; Stanley, W.D.; Rodriguez, B.D.; Lutter, W.J. Surface seismic and electrical methods to detect fluids related to faulting. J. Geophys. Res. Solid Earth 1995, 100, 12919–12936. [Google Scholar] [CrossRef]
- Davies, J.H. Global map of solid Earth surface heat flow. Geochem. Geophys. Geosystems 2013, 14, 4608–4622. [Google Scholar] [CrossRef]
- Yu, L.; Zhang, J.; Chen, S.; Dong, M.; Xu, C. Thermal-gravity equilibrium adjustment mechanism of Zhenbei-Huangyan seamount chain. Acta Seismol. Sin. 2015, 37, 565–574. [Google Scholar]
- Dong, F.; Wu, K.; Cui, L.; Li, Y.; Zhou, P.; Dong, W. Identification and characteristics of structural transfer zones in the east area of Wushi Sag, Beibuwan Basin. Oil Geophys. Prospect. 2021, 56, 1180–1189. [Google Scholar] [CrossRef]
- Liang, G. A study of the genesis of Hainan Island. Geol. China 2018, 45, 693–705. [Google Scholar] [CrossRef]
- Zhao, G.; Unsworth, M.J.; Zhan, Y.; Wang, L.; Chen, X.; Jones, A.G.; Tang, J.; Xiao, Q.; Wang, J.; Cai, J.; et al. Crustal structure and rheology of the Longmenshan and Wenchuan Mw 7.9 earthquake epicentral area from magnetotelluric data. Geology 2012, 40, 1139–1142. [Google Scholar] [CrossRef]
- Julian, B.R.; Miller, A.D.; Foulger, G.R. Non-double-couple earthquakes 1. Theory. Rev. Geophys. 1998, 36, 525–549. [Google Scholar] [CrossRef]
- Brandsdóttir, B.; Menke, W.; Einarsson, P.; White, R.S.; Staples, R.K. Färoe-Iceland Ridge Experiment 2. Crustal structure of the Krafla central volcano. J. Geophys. Res. Solid Earth 1997, 102, 7867–7886. [Google Scholar] [CrossRef]
- Benz, H.M.; Smith, R.B. Simultaneous inversion for lateral velocity variations and hypocenters in the Yellowstone Region using earthquake and refraction data. J. Geophys. Res. Solid Earth 1984, 89, 1208–1220. [Google Scholar] [CrossRef]
- Lees, J.M.; Crosson, R.S. Tomographic inversion for three-dimensional velocity structure at Mount St. Helens using earthquake data. J. Geophys. Res. Solid Earth 1989, 94, 5716–5728. [Google Scholar] [CrossRef]
- Evans, J.R.; Zucca, J.J. Active high-resolution seismic tomography of compressional wave velocity and attenuation structure at Medicine Lake Volcano, Northern California Cascade Range. J. Geophys. Res. Solid Earth 1988, 93, 15016–15036. [Google Scholar] [CrossRef]
- Anderson, O.L.; Isaak, D.; Oda, H. High-temperature elastic constant data on minerals relevant to geophysics. Rev. Geophys. 1992, 30, 57–90. [Google Scholar] [CrossRef]
- Artemieva, I.M.; Billien, M.; Lévêque, J.-J.; Mooney, W.D. Shear wave velocity, seismic attenuation, and thermal structure of the continental upper mantle. Geophys. J. Int. 2004, 157, 607–628. [Google Scholar] [CrossRef]
- Takei, Y. Effects of partial melting on seismic velocity and attenuation: A new insight from experiments. Annu. Rev. Earth Planet. Sci. 2017, 45, 447–470. [Google Scholar] [CrossRef]
- Murase, T. Shear wave velocity in partially molten peridotite at high pressure. Year Book Carnegie Inst. Wash. 1980, 79, 307–310. [Google Scholar]
- Mengel, K.; Kern, H. Evolution of the petrological and seismic Moho-implications for the continental crust-mantle boundary. Terra Nova 1992, 4, 109–116. [Google Scholar] [CrossRef]
- Thybo, H.; Artemieva, I.M. Moho and magmatic underplating in continental lithosphere. Tectonophysics 2013, 609, 605–619. [Google Scholar] [CrossRef]
- Wei, F.; Wei, W.; Yu, H. The Cenozoic volcanic fields in northern Hainan Island and Leizhou Peninsula, South China: Eruption history, magma source and dynamic background. Geol. Soc. Lond. Spec. Publ. 2020, 510, 179–196. [Google Scholar] [CrossRef]
- Sun, X.; Zhan, Y.; Zhao, G.; Zhao, l.; Deng, Y.; Hu, Y.; Hu, J.; Xiang, X. Three-dimensional magnetotelluric imaging of the deep magmatic system beneath Maanling-Leihuling volcanic cluster area in northeast Hainan Province. Seismol. Geol. 2020, 42, 14. [Google Scholar] [CrossRef]
- Reyners, M.; Eberhart-Phillips, D.; Stuart, G. The role of fluids in lower-crustal earthquakes near continental rifts. Nature 2007, 446, 1075–1078. [Google Scholar] [CrossRef]


Disclaimer/Publisher’s Note: The statements, opinions and data contained in all publications are solely those of the individual author(s) and contributor(s) and not of MDPI and/or the editor(s). MDPI and/or the editor(s) disclaim responsibility for any injury to people or property resulting from any ideas, methods, instructions or products referred to in the content. |
© 2024 by the authors. Licensee MDPI, Basel, Switzerland. This article is an open access article distributed under the terms and conditions of the Creative Commons Attribution (CC BY) license (https://creativecommons.org/licenses/by/4.0/).
Share and Cite
Pan, M.; Yang, T.; Le, B.M.; Dai, Y.; Xiao, H. The Magmatic Patterns Formed by the Interaction of the Hainan Mantle Plume and Lei–Qiong Crust Revealed through Seismic Ambient Noise Imaging. Geosciences 2024, 14, 63. https://doi.org/10.3390/geosciences14030063
Pan M, Yang T, Le BM, Dai Y, Xiao H. The Magmatic Patterns Formed by the Interaction of the Hainan Mantle Plume and Lei–Qiong Crust Revealed through Seismic Ambient Noise Imaging. Geosciences. 2024; 14(3):63. https://doi.org/10.3390/geosciences14030063
Chicago/Turabian StylePan, Mohan, Ting Yang, Ba Manh Le, Yuhang Dai, and Han Xiao. 2024. "The Magmatic Patterns Formed by the Interaction of the Hainan Mantle Plume and Lei–Qiong Crust Revealed through Seismic Ambient Noise Imaging" Geosciences 14, no. 3: 63. https://doi.org/10.3390/geosciences14030063