

Comparison of the Piezocone Penetrometer (CPTU) and Flat Dilatometer (DMT) Methods for Landslide Characterisation


1
SPP d.o.o., Koprivnička 47, 42000 Varaždin, Croatia
2
Faculty of Geotechnical Engineering, University of Zagreb, Hallerova aleja 7, 42000 Varaždin, Croatia
*
Author to whom correspondence should be addressed.
Geosciences 2024, 14(3), 64; https://doi.org/10.3390/geosciences14030064
Submission received: 24 November 2023
/
Revised: 15 February 2024
/
Accepted: 22 February 2024
/
Published: 26 February 2024
(This article belongs to the Topic Geotechnics for Hazard Mitigation)
Abstract
:The increasing occurrence of landslides worldwide causes many human casualties and huge socio-economic losses. Therefore, the fastest and most accurate characterisation of landslides is important. The objective of this study is to compare how well the flat dilatometer (DMT) test and the piezocone penetration (CPTU) test can find the depth of a sliding zone. Inclinometers were used to measure horizontal changes in the soil to ensure the depth of the sliding zone was correct. The coincidence of the results of in situ static probes, and the displacements of the inclinometers is a sure confirmation of the depth of the sliding zone. In the example of Bedekovčina and Kravarsko landslides, in situ static probes were used to obtain values of input parameters on the sliding zone for parametric sensitivity analysis of parameters. Sensitivity analysis was performed by plotting the relationship between the above parameters and the vertical effective stress σ′vo on the sliding zone. The sensitivity analysis of the parameters of 11 tested samples shows that for the parameters of the obtained DMT probe, a higher sensitivity of the parameters is obtained, closer to the values concerning the expected range, and a minor standard deviation. The parameter Kd obtained by dilatometer probing is the best indicator of the depth of the sliding zone. The literature value Kd = 1.8–2.0 on the sliding zone in this paper is extended to the range Kd = 1.8–2.5, and its detection sensitivity is influenced by over-consolidation in shallow soil layers. In general, the research results show that the dilatometer probe has an advantage over the piezocone penetrometer test for the needs of landslide characterisation.
1. Introduction
In 1991, Cruden defined a landslide as the movement of a rock mass, debris, or earth down a slope [1]. Landslides have been recorded for centuries, especially in Asia and Europe. The oldest recorded landslides occurred in central China in 1767 BC and were caused by an earthquake [2]. The investigation presented in this paper was conducted in northwestern Croatia, where landslides are also often present. Due to extreme weather conditions during the winter and spring of 2013, more than 900 shallow landslides were (re)activated in the mentioned area [3]. Landslides are spread over a wide area in Europe [4,5,6], most prevalent in mountainous, hilly, and coastal regions [7]. In the neighbouring countries of Slovenia and Italy, problems of landslides also occur [8,9,10]. Because of all of the above, landslide investigation is a very current, interesting, and frequent topic.
Saturation of the soil with water is considered the primary natural cause of landslide activation [11]. As the groundwater level rises in the slope, pore pressures increase, which reduces the effective stress and thus the shear strength of the soil that builds the slope [12]. Landslides cause human, animal, and economic losses. They destroy or damage residential and industrial buildings as well as agricultural and forest lands. In addition, they have a negative impact on the water quality in rivers and streams. Landslides are actually responsible for much more significant socioeconomic loss than is generally recognized and/or acknowledged. Much of the damage from landslides is not documented because they are wrongly included as part of reports of earthquakes [13], floods, volcanic eruptions, etc. However, the cost of damage from landslides can exceed all costs combined from the other listed geohazards [14].
Complex landslides are created by joining several sliding zones (sliding surfaces) [15]. Precisely, such complex landslides from the territory of the Republic of Croatia are the investigation areas in this paper. The locations of the landslide at the cemetery in Bedekovčina (Krapinsko-zagorska County) and the landslide in Kravarsko (Zagrebačka County) are shown in Figure 1. In both locations, the soil is extremely heterogeneous, and the in situ probes are used for detecting problematic layers prone to sliding [16]. This research also shows that in addition to lithological and geological investigations, it is very important to put comprehensive research into the context of hydrogeological conditions because they are the most common trigger for the initiation of the sliding process.
In situ probes have proven to be very effective in the detection of sliding zones, insight into the soil composition, geotechnical characteristics of the soil in the area of the manifested landslide, and the creation of geotechnical soil profiles [17,18,19]. The above was confirmed by Potvin et al. Based on the CPTU research, they profiled and detected the sliding zone in sensitive clay landslides in detail [20]. Totani et al. used 1997 an in situ dilatometer (DMT) for soil characterisation in slope stability [21].

The novelty of this paper is the investigation of the sensitivity of an individual in-situ geotechnical static probe to the detection of sliding zones in a landslide, whereby the results of inclinometer observations are used for verification. The research sequence through three phases is shown in Figure 2. Based on the investigation results on the mentioned complex landslides, a parametric analysis of the soil inside the sliding area will be carried out by comparing the parameters of the probing results of two in situ methods, and it will be assessed which method gives better results for the characterisation of the landslide. The concept of landslide characterisation includes identifying the area affected by the landslide, as well as the geometry and determination of material properties. The purpose of characterisation is primarily to look at the problem from cause to effect. For this purpose, quantification of geometric relationships and material properties is required.
2. Investigation Area Description and Issue Presentation
2.1. Bedekovčina Landslide
Bedekovčina is a village and a municipality of the same name in Hrvatsko Zagorje (Krapinsko-zagorska County). The investigated area, the Bedekovčina cemetery, is located about 1200 m west of the inhabited area or about 1500 m northwest of the Krapina River (Figure 1). The area is morphologically hilly, and the gently sloping slopes belong to the southern slopes of the Ivančica mountain, at the transition to the Krapina river valley. The mentioned slopes are intersected by deeply incised gullies with steep sides and de-levelling that often exceeds 10 m [24].
In terms of lithology, the area of Bedekovčina is geologically built from Pliocene clastic deposits, sediments at the transition from the Pliocene to the older Quaternary (Pleistocene) and alluvial deposits in the valley of the Krapina river. The spatial arrangement of these deposits with corresponding lithological markings is shown on the overview geological profile in Figure 3. The description of the mentioned lithological members is as follows [25]:
- Lower Pliocene (Pl1)—these deposits consist of clastites characterised by alternating sand, silt, clay, and sandy marl. Blue–grey marls are found in the superpositionally lowest parts of the sequence. They are overlain by well-stratified sandy marls with lenses of powder and clay and, locally, may also contain layers of coal. According to existing data, the thickness of these deposits is 100–450 m [25].
- Plio-Pleistocene (Pl,Q)—fluvial-type deposits at the transition between the Pliocene and the Quaternary are discordant to older Pliocene deposits. The contact with the older Pliocene deposits is tectonic, and in some cases, the boundary is erosional. Regarding lithology, there are dusty sands and sands with clay lenses. The location of Bedekovčina cemetery is located exactly in these deposits.
- Holocene (al)—alluvial deposits are present along the Krapina river. Among the geological materials, unbound clasts predominate, the granulometric composition of which varies from gravel, sand and dust to clay.
From a hydrogeological point of view, the described Pliocene and Plioquaternary clastic deposits are practically impermeable. This is evidenced by the deeply cut gullies and the existing erosion net. Surface runoff is dominant, while underground flow is limited and of local significance. However, in the described clastic deposits, there is a surface part that has been changed by external meteorological factors concerning the original soil. Due to this altered material, rainwater infiltration occurs, which contributes to the destabilisation of weathered deposits on the slope. Instability is also contributed by the fact that fine-grained deposits have a hard time releasing the infiltrated water [24,25].
In the peripheral part of the investigated area, a morphological de-levelling was observed, which is the result of tectonic and erosion processes. The mentioned de-levelling is considered the limit of the surface local watershed since underground water inflows towards the cemetery from the north and west are impossible. Therefore, the groundwater that appears in the cemetery at a depth of 2–3 m originates from rainwater that has seeped into the surface erosion layer consisting of sand with clay lenses [24,25].
Figure 4 shows different types of clay that were sampled in the investigation area. Differences in sedimentation and composition are noticeable. Clays with high plasticity (first sample from left to right in Figure 4) are characterised by very low permeability, and when moisture is lost in the sample, shrinkage occurs (volume reduction). Clays with sand (fifth sample from left to right in Figure 4) have higher permeability than the previously described clay, while moisture loss does not result in shrinkage of the sample, or it is minimally expressed.
2.2. Kravarsko Landslide
Kravarsko municipality is in the southern part of Zagrebačka County, and an important road passes through its area (State Road D31 Zagreb—Velika Gorica—Pokupsko—Glina). Numerous landslides were recorded, and four that are in the area of Kravarsko were geotechnically processed and analysed in this paper (Figure 1).
The broader research area is made up of middle Pliocene deposits (Pl2), which are represented by clays and sands with interlayers of organic clay, peat, and lignite. Clays contain large amounts of dispersed organic substances (sometimes peat) and more or less silty and sandy components. Additionally, thinner and thicker layers of sand appear, which are mainly silty sandy and, in some places, bound with clay [26].
Specifically, extremely high groundwater levels in the piezometers were determined. The water levels reach almost to the surface, and some piezometers indicate artesian pressures (40 cm above the ground level). Recorded pressures are continuous. The structural-tectonic relations of the area are complex, so they significantly affect engineering-geological and hydrogeological conditions. The morphology of the area is, unfortunately, favourable for the formation of frequent landslides. Landslides in this area are not only present on the route of the state road, but soil sliding is a ubiquitous phenomenon of the area, conditioned by lithostratigraphic and hydrogeological conditions. The higher parts of the broken topography of the terrain are built by sands in which water is received by infiltration, and the disturbed continuity of the sandy layers in the lower parts of the terrain creates conditions for the formation of artesian aquifers. Sufosis (submergence) of surface streams and saturation of slopes with water that springs up at the foothills are frequent occurrences in Kravarsko [26,27].
3. Research Methodology
During in situ investigations, to characterise landslides at both investigation locations, the following geotechnical methods were used: the piezocone penetration test (CPTU), flat dilatometer test (DMT), and measurements of horizontal displacements with vertical inclinometers. The layout of the investigations carried out in the cemetery in Bedekovčina is shown in Figure 5. The investigation area is divided into two groups (Group 1 and Group 2).
In a very narrow area of each group, probing was carried out with CPTU and DMT probes as well as an exploratory well in which an inclinometer was installed. In this way, the comparison of the selected parameters of the in situ probes for the detection of the sliding zone, as well as the subsequent verification with the results of the inclinometer observations, was enabled.
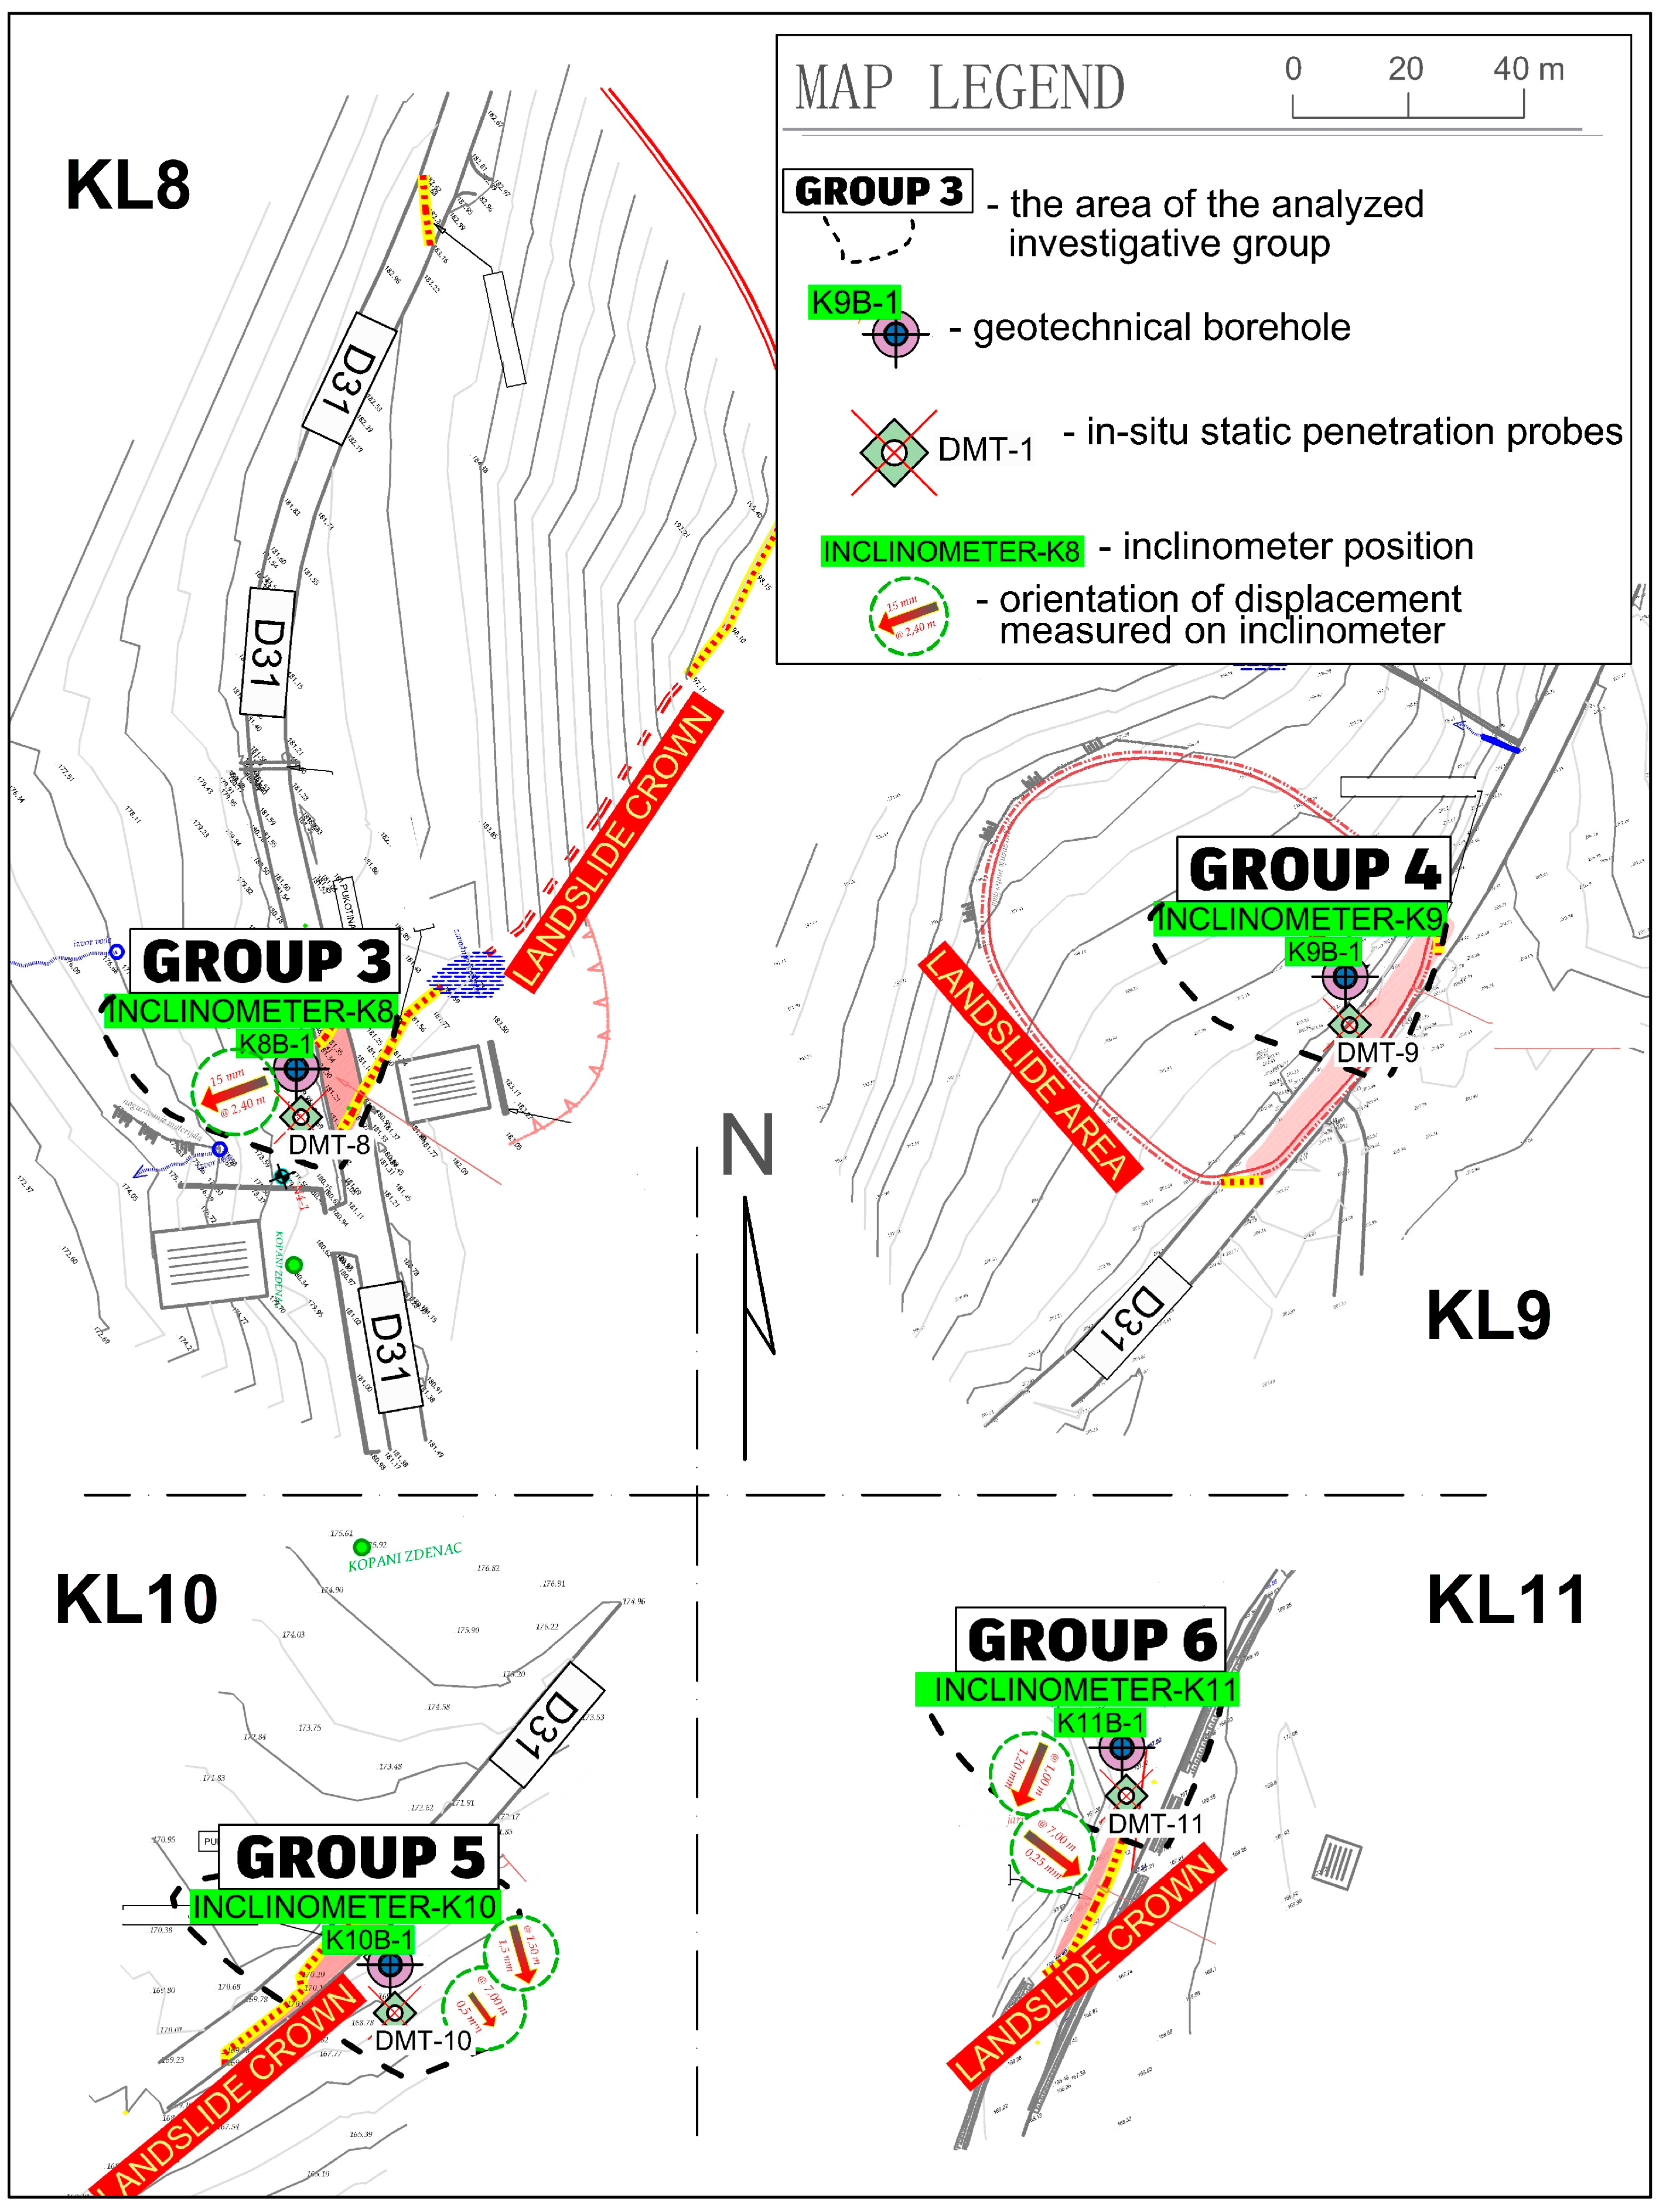
In the territory of Kravarsko municipality, four manifested landslides were analysed along the state road D31 (KL8, KL9, KL10, and KL11), so the investigation at this location was divided into four groups (from Group 3 to Group 6). The situations of in situ investigations for a particular landslide are shown in Figure 6.
3.1. Penetration Theory of Piezocone Penetrometer
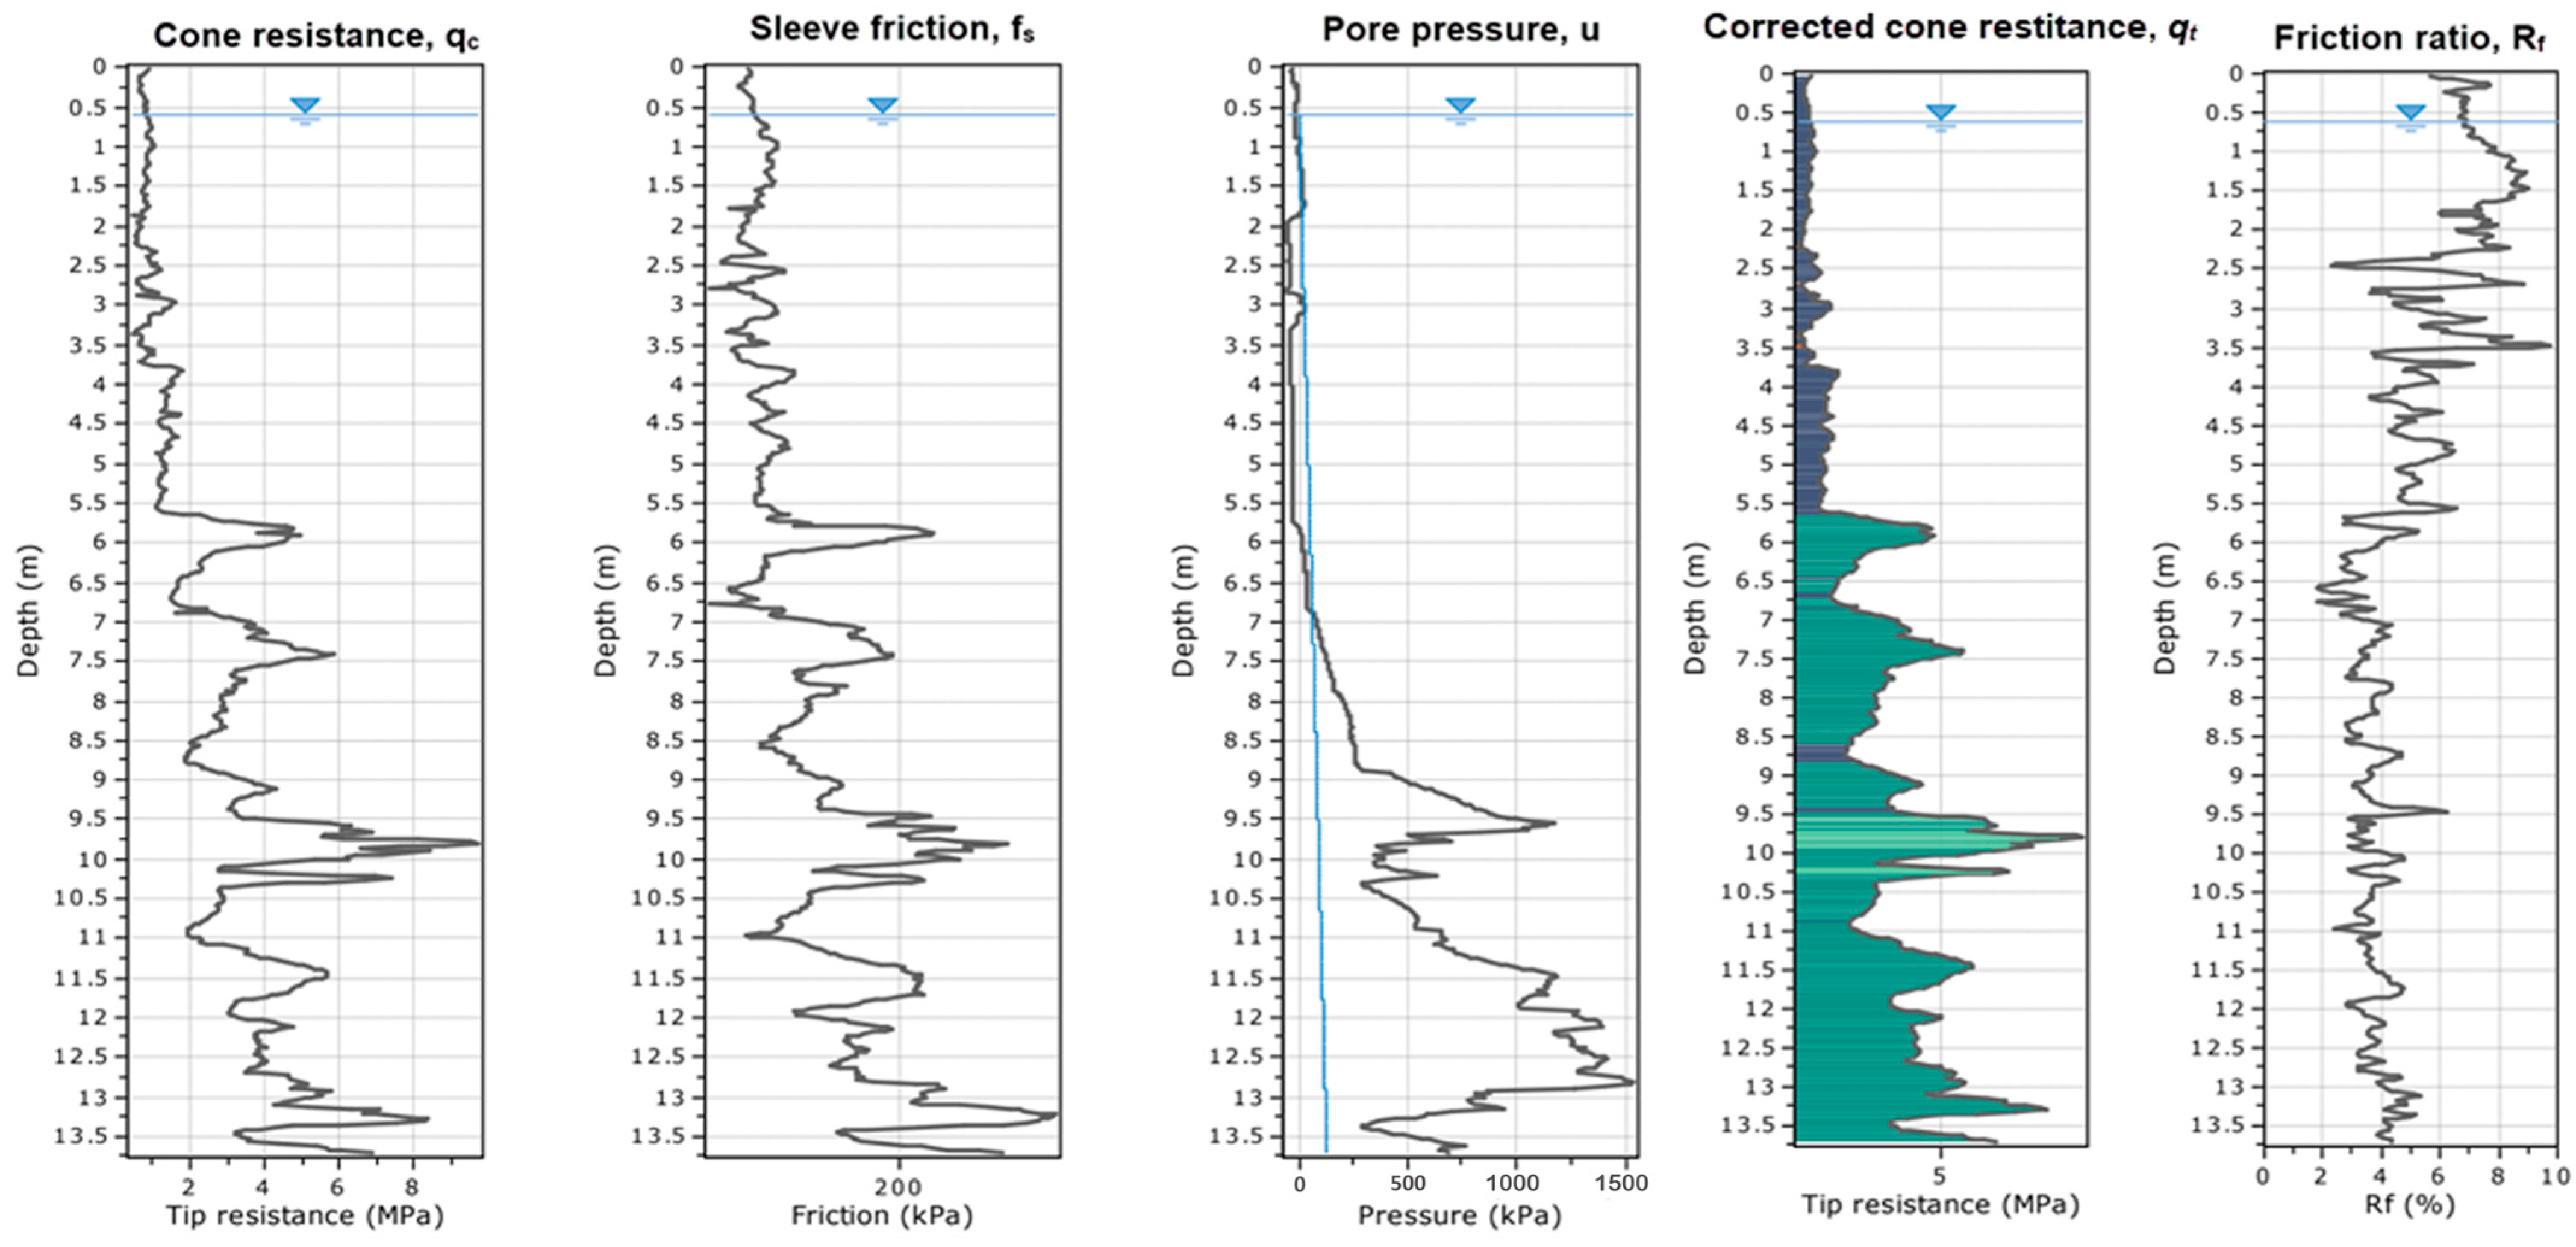
Testing with a CPTU is performed by pressing a measuring penetration piezocone (probe) at a constant velocity of 2 cm/s, using a hydraulic system and push penetration rods. The CPTU test is carried out according to HRN EN ISO 22476-1, “Geotechnical Investigation and Testing—Field Testing—Part 1: Electrical static penetration testing without pore pressure measurement and with pore pressure measurement” (ISO 22476-1:2012; EN ISO 22476:2012) [28]. All used equipment and investigation procedures are in accordance with the mentioned ISO norm. During indentation, the resistance to the probe tip (qc), the friction on the probe jacket (fs), the inclination of the accessory (i) and the pore pressure (u) on the filter above the probe tip are measured as standard [29,30].
Interpretation of CPTU results is carried out based on measured parameters and by applying conservative values of constants to ensure a lower and more conservative assessment of geotechnical parameters. Most of the correlations are semi-empirical, meaning they are supported by theoretical knowledge. Therefore, based on correlations, different geotechnical parameters are obtained [30,31]. To characterise landslides, undrained shear strength cu, soil compressibility modulus M and over-consolidation ratio coefficient OCR were analysed in this paper.
Undrained shear strength cu is the most commonly interpreted clay parameter in in-situ static cone penetration CPTU. Since the measured cone resistance qc is influenced by the pore pressure u, Lunne et al. in 1985 proposed the calculation of the cu based on the corrected cone resistance qt [32], which is related to the net cone resistance qnet. The qnet is obtained as the difference between the corrected cone resistance qt and the vertical stress σv0. The qt presents the difference between the measured spike resistance qc and the measured pore pressure u. Taking into account the previous statements, cu in the CPTU test is defined by the following equation [33]:
where is Nkt is the bearing factor of the net resistance at the tip (tip factor).
The range of the Nkt factor is in the range of 8 to 20 for different types of clay materials in different locations. If no additional data are available for the in situ sounding location, the initial value Nkt = 14 is adopted [34]. For interpretations of static cone penetration, and comparable to the results of undrained shear strength obtained with a flat dilatometer DMT, the cone factor Nkt = 18 was used at the research locations from this work.
Undrained shear strength cu is defined as a parameter of total stresses measured at a constant sample volume. The shearing mode affects the measured amount of shear strength in soft to stiff clays [34]. This effect must be known to the researcher to be able to realistically interpret the research results. Thus, settings and test types affect the undrained shear strength measurement result. Different laboratory and field tests give different results for the same materials and depths. This is illustrated in Figure 7, published by Hight et al. for results from the Bothkennar geotechnical test site in Great Britain [35].
Compressibility modulus M (edometer modulus or modulus of one-dimensional compression of fine-grained soil) results from soil density due to mineralogical composition, microstructure, orientation of particles and water. The water component is responsible for the consistent state of the material, and due to the size of the mineral particles that make up clays and silts, it participates as a building element. It can overcome the mechanical stresses acting between the particles [36].
Estimating the drained consolidation parameter such as the one-dimensional modulus, i.e., the tangent oedometer compressibility modulus M can contain serious errors using the resistance parameter qc in undrained conditions. Total undrained penetration stresses are difficult to correlate without relating them to measured pore pressures. Additionally, certain local experiences may correct the suggested correlations. The compressibility modulus M is calculated according to Equation (2) [37]:
where αM is the cone factor and qc is the probe tip resistance in MPa.
The over-consolidation ratio is defined as the ratio of the highest vertical stress in the previous period and the stress to which the soil is exposed at the observed moment. It is abbreviated as OCR (over-consolidation ratio). In relation to the over-consolidation coefficient, normally consolidated soils (OCR = 1) and over-consolidated (1 < OCR) are distinguished. In the static conical penetration CPTU test, the over-consolidation coefficient is determined from the resistance to the cone using the over-consolidation factor kOCR. The expression for calculating the preconsolidation coefficient then reads [38]:
where σv0 is the vertical in situ stress in MPa; qt is the corrected cone resistance in MPa; qnet represents the net cone resistance in MPa [38].
CPTU probing for this paper was carried out with a Pagani-type hydraulic indentation device (Figure 8). The interpretation of the measured data obtained by CPTU probing was carried out with the computer program CpeT-IT v.3.3.2.17 (2007), GeoLogismiki. Based on the CPTU data, the software performs interpretation by the type of soil behaviour (SBTn) and various geotechnical parameters, all following published empirical correlations according to Lunne et al. [39].
3.2. Penetration Theory of Flat Dilatometer
Investigation with a flat dilatometer was developed in 1980 by the Italian Silvano Marchetti and is used to determine the strength and deformation properties of soil. The basis of the test is the stopping of the measuring steel probe (flat vane) at certain depths to measure specific pressures using a membrane built into the probe. In Croatia, testing is carried out according to HRN EN ISO 22476-11:2017, “Geotechnical Investigation and Testing—Field Testing—Part 11: Flat Dilatometer Testing. The test suits clays, silts and soft rocks” [40].
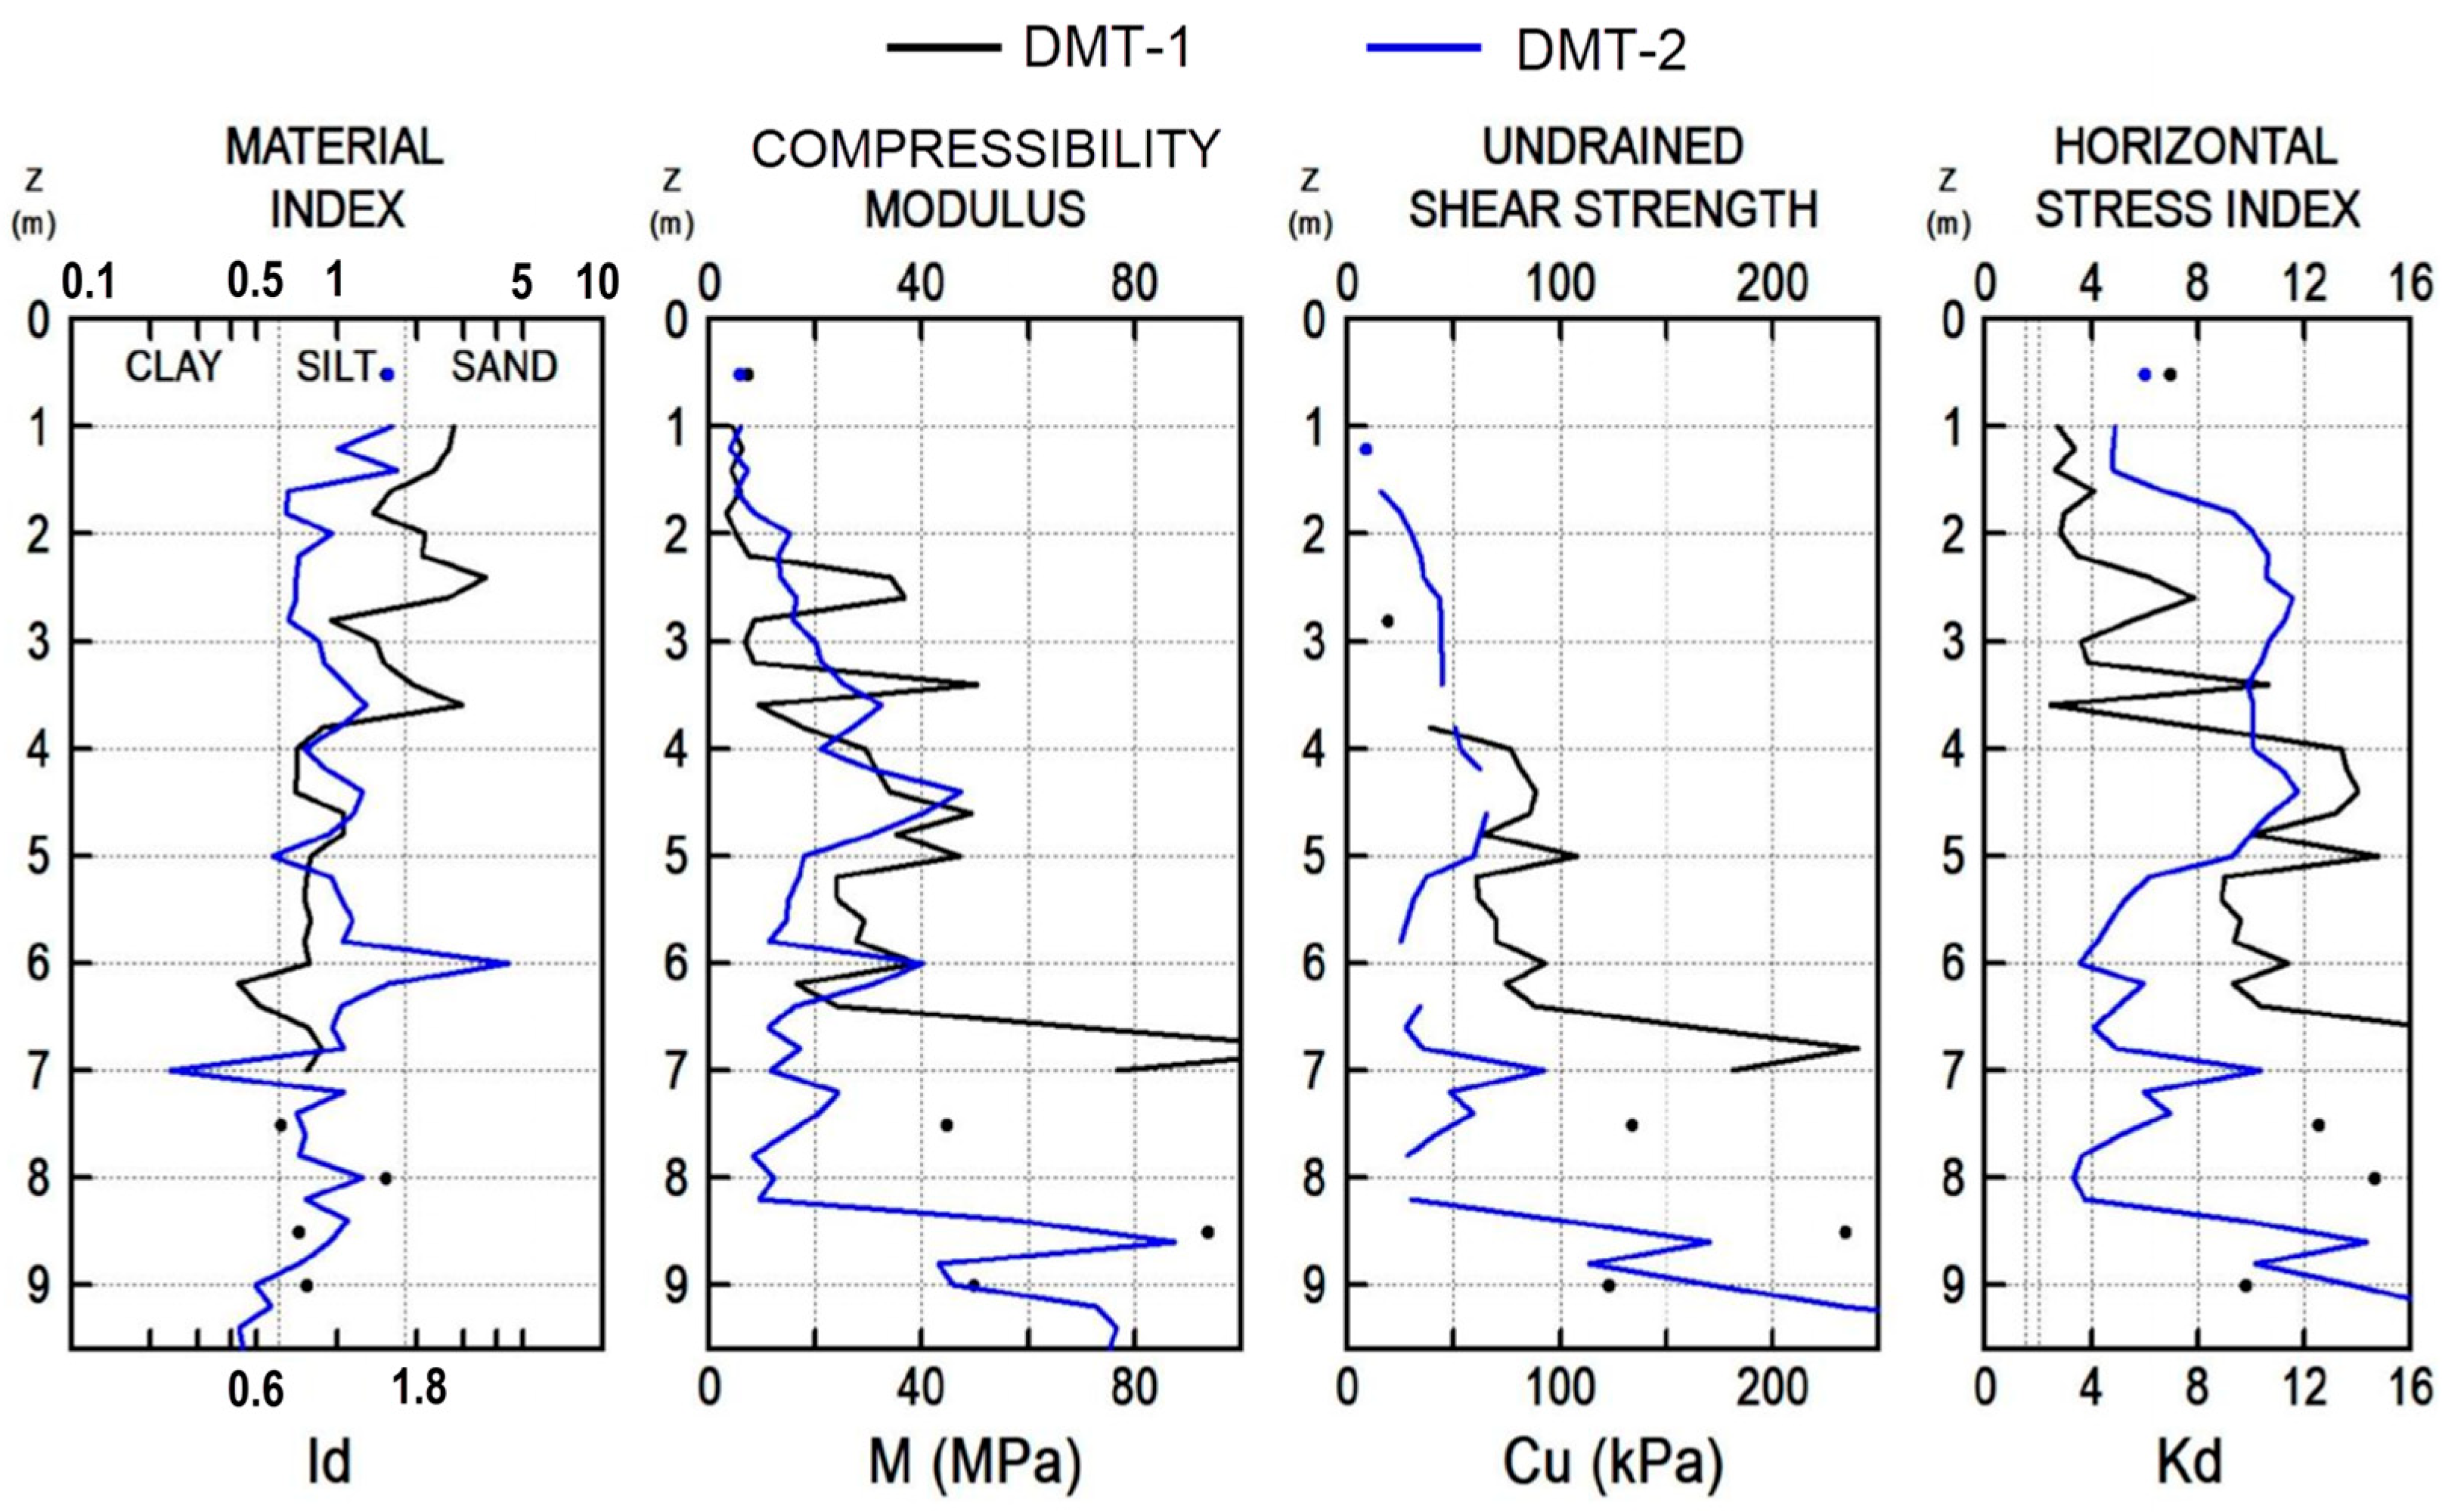
By combining the measured dilatometer pressures (p0—initial pressure at membrane displacement 0 mm and p1- the pressure at which the membrane is displaced by 1.1 mm), the value of in situ pore water pressure u0 and the effective value of vertical stresses σv0, other parameters can be determined, such as the value of the material index ID, the horizontal stress index Kd and the dilatometer modulus ED [40].
Horizontal stress index Kd is related to the in situ horizontal soil stress. In the case of a landslide, it indicates a disturbed layer corresponding to the sliding zone, where the value is Kd ≈ 2 (1.8–2.0) [21,41,42]. Figure 9 shows an example of detecting a sliding zone by depth. At the depth at which the soil slide occurred, the value of the index Kd is 2, as shown in the profile in the lower right quarter of Figure 9.
The index Kd is obtained according to Equation (4) [41]:
where p0 is the lifting pressure in kPa; u0 represents the pore water pressure in kPa; σ’v0 is the vertical effective in-situ stress in kPa.
Over-consolidation Ratio OCR coefficient is highly dependent on the vertical effective stress because it shows the ratio of the stress to which the soil was exposed in the past to the stress to which the soil is exposed today. The correlation between the horizontal stress index Kd of the DMT and the over-consolidation coefficient OCR is of great importance. For normally consolidated materials, the value Kd = 2 corresponds to the value OCR = 1 [17,41,42]. The correlation mentioned above shows that the disturbed (squashed) material inside the sliding zone has lost all traces of ageing, structuring, or cementation. An increase in the Kd index indicates the presence of some form of ageing or cementation [40].
The original correlation for deriving the over-consolidation ratio OCR from the horizontal stress index Kd was proposed by Marchetti [43]:
The compressibility modulus obtained from dilatometer sounding is determined according to the equation [41,43]:
where RM is a parameter that depends on the material index ranges ID; ED represents the dilatometer modulus in MPa.
In the area of the Bedekovčina landslide, two Marchetti-type DMT probes were carried out (positions shown in Figure 5). During the investigations in Kravarsko, one DMT probing was performed on each of the four landslides (Figure 6). The interpretation of the measured data obtained by DMT probing was carried out with the SDMT Elab program produced by Studio Prof. Marchetti.
3.3. Inclinometer Observations
A vertical inclinometer is a device for measuring the horizontal displacement of the normal to the axis of the pipe through which it passes. The device has a built-in sensor that works on the principle of measuring the deflection of the inclinometer tube from the vertical (normal). Inclinometers determine the size, velocity, direction and depth of sliding. This is important for understanding the causes, behaviour and rehabilitation of landslides. The results of inclinometer observations are presented as two diagrams, cumulative and incremental displacements. The diagram of cumulative displacements, analysed in this paper, shows the total (added) displacements measured at each measurement to the reference (zero measurement) [44].
To observe horizontal displacements during the phase of investigations and after the rehabilitation of the landslide in Bedekovčina, inclinometer tubes were installed in some exploration boreholes. Two inclinometers were analysed, and their positions are shown in Figure 5. In the Kravarsko municipality, four installed inclinometers were observed, one on each of the four analysed landslides. The positions of those inclinometers are shown in Figure 6. ABS inclinometer tubes manufactured by SISGEO S.rl., Milan, type model 0S131006000 ABS, with an outer diameter of 71.0 mm and an inner diameter of 60.0 mm were used at both investigation locations.
4. Prognostic Profiles Based on In Situ Geotechnical Probing Results
The following figures show results for Group 1 and Group 2 of the research area (the Bedekovčina landslide). Figure 10 shows the results of CPTU-1, and Figure 11 for CPTU-2. Figure 12 shows the overlay of the DMT-1 and DMT-2 investigation results for interpreted parameters. Figure 13 shows the raw data of DMT investigation for po, p1 and interpreted data for Ed for the Kravarsko landslides (KL8, KL9 and KL10.) Figure 14 shows the interpreted parameters of DMT investigation for the Kravarsko landslides (KL8, KL9, KL10 and KL11).
Based on the results of CPTU and DMT probing, prognostic profiles of selected parameters for the sliding zone detection were created. Four parameters were chosen for analysis: undrained shear strength cu, over-consolidation ratio OCR, compressibility modulus M and horizontal stress index Kd (only with DMT probing; CPTU probing does not provide Kd). During each analysis, potential sliding zones were identified.
As an example of the creation of prognostic profiles and the analysis of the obtained data, below is Figure 15, which shows the values of the analysed parameters by depth in the first group of the investigation area in Bedekovčina (DMT-1 and CPTU-1). Two potential sliding zones were detected at depths of 2.8 m and 5.6 m, and parameter values on the sliding zones were extracted.
They are characterised by small values of the analysed parameters or their sudden drop, with the Kd parameter being approximately 2. Other results of the extracted parameters on the detected potential sliding zones for all studied research groups, including Group 1, are presented in Table 1.
5. Verification of In Situ Probe Results with Displacements on Inclinometers
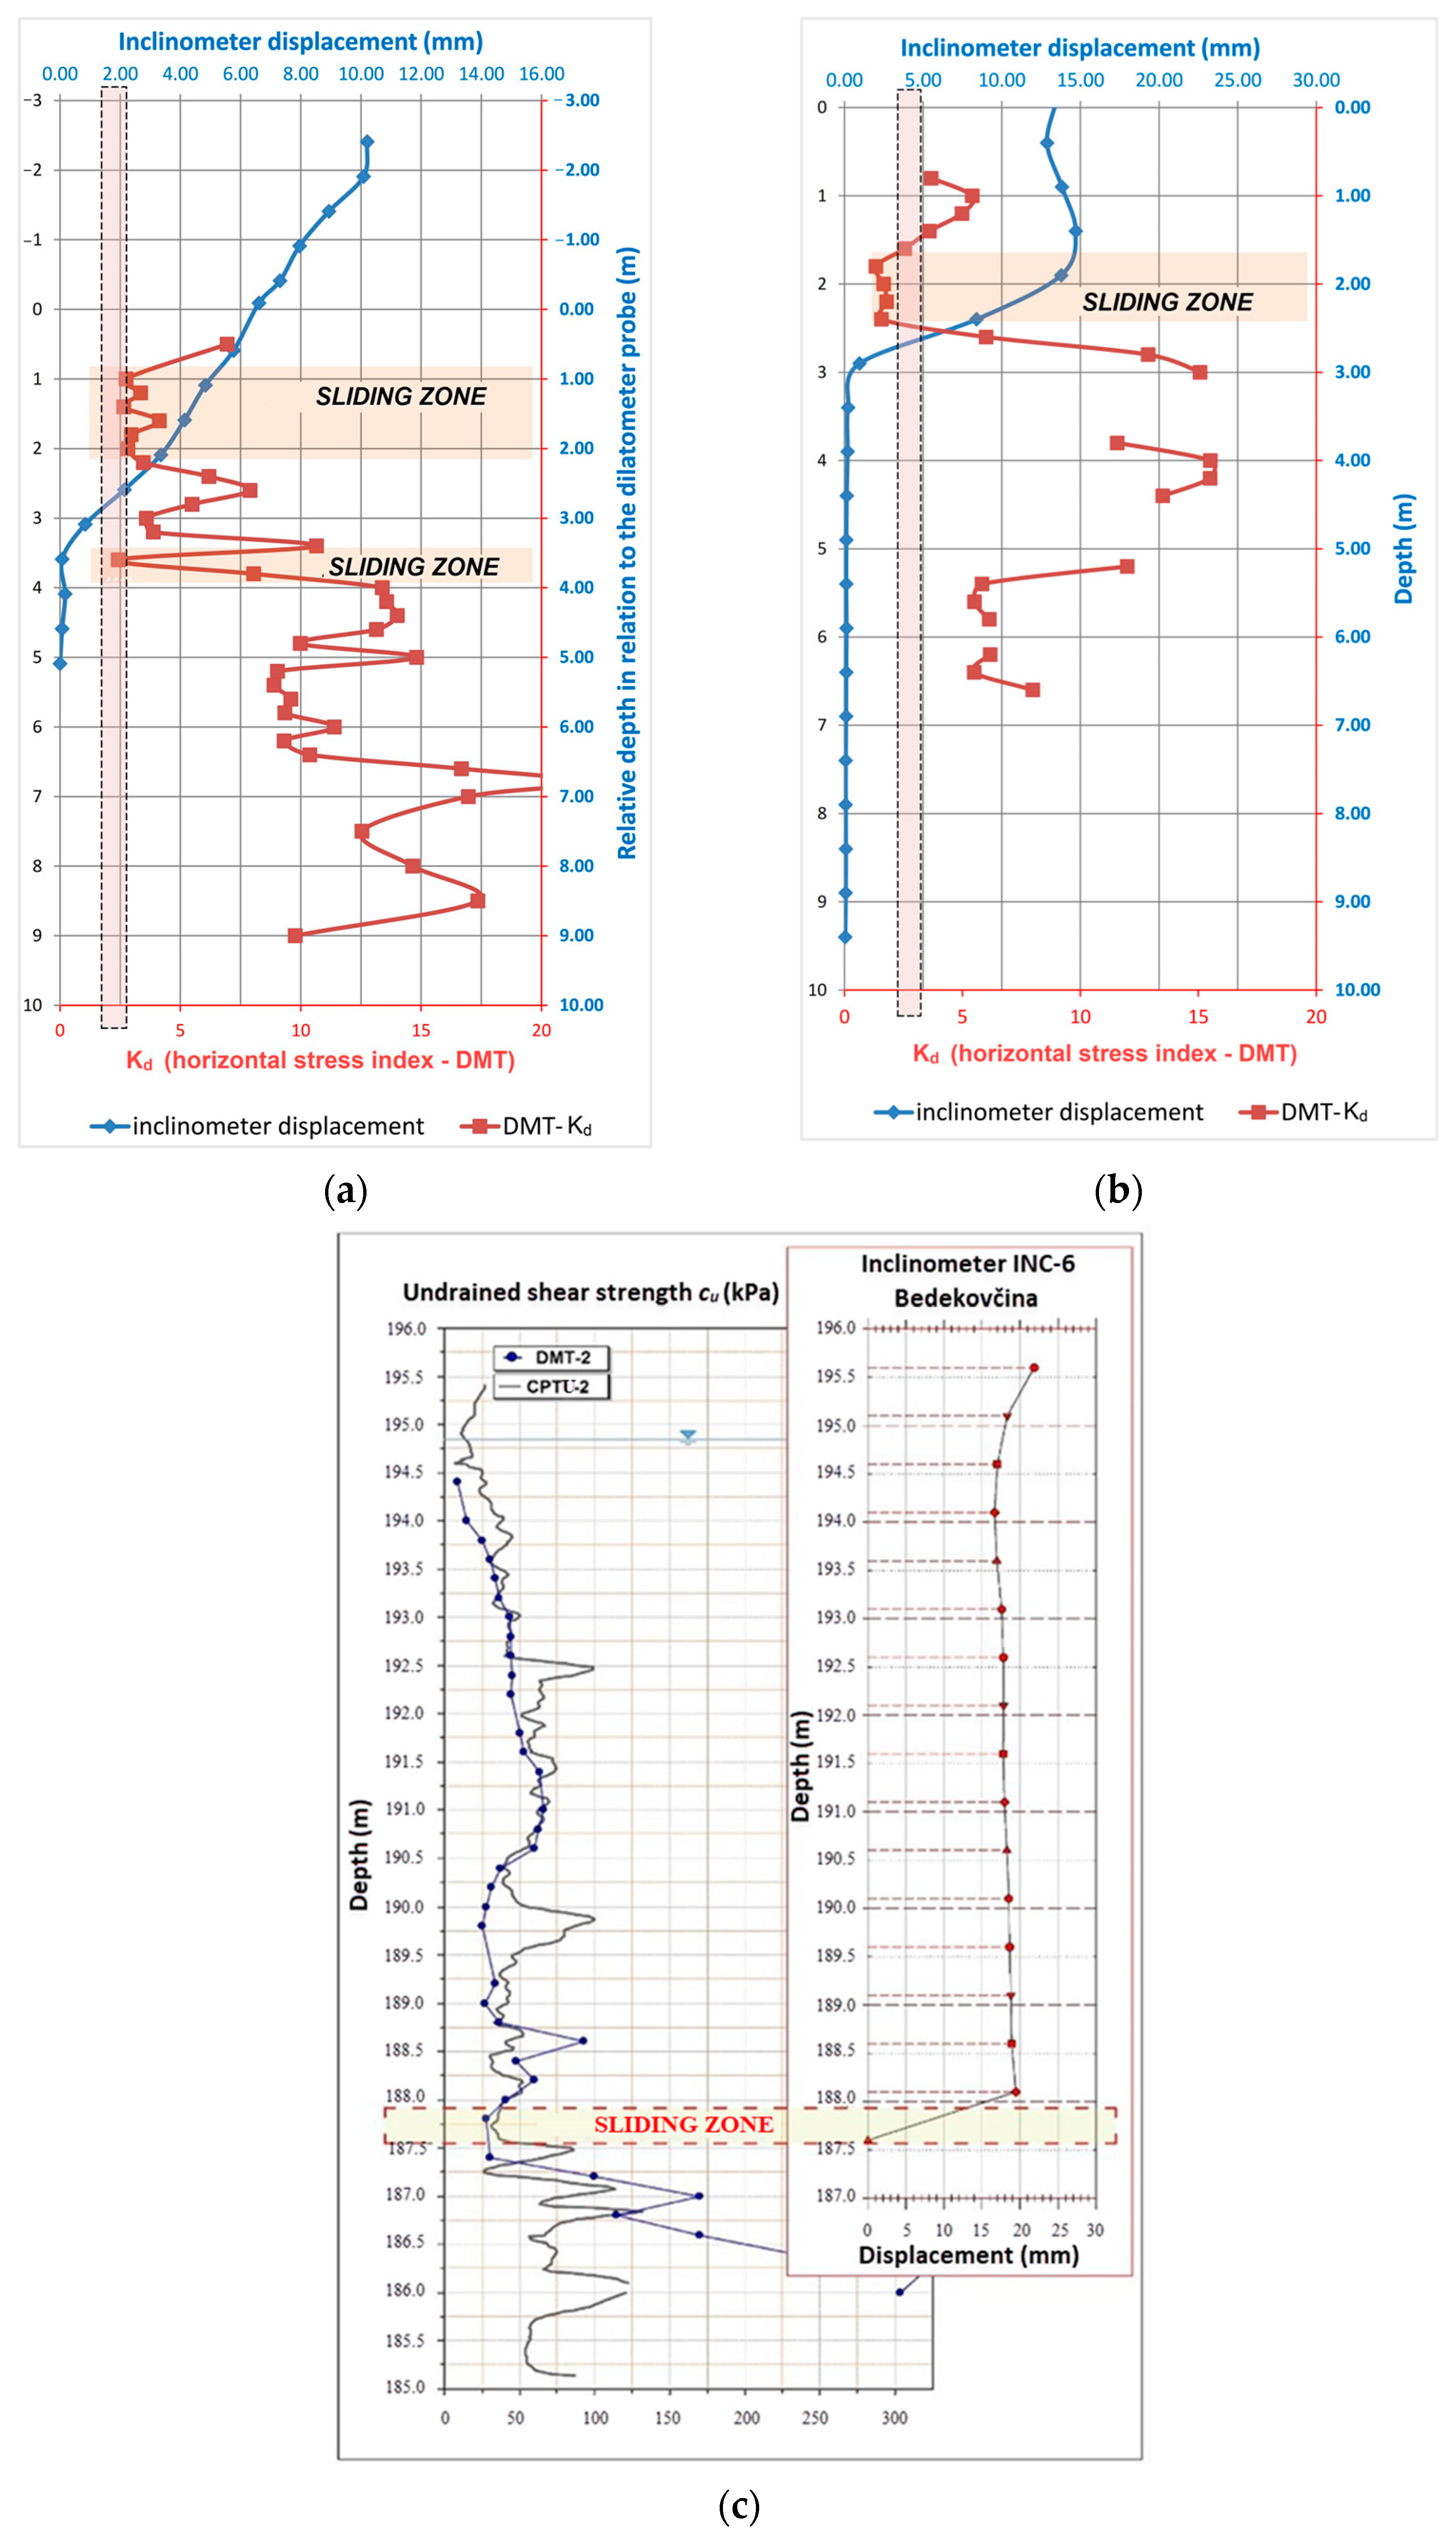
In order to verify the results of in situ probing, a comparison was made with the obtained values of horizontal displacements on inclinometers. Given that the Kd index is a good indicator of the sliding zone, diagrams were created for both investigation locations with overlaps of Kd values and horizontal displacements on the inclinometers. In Bedekovčina, in addition to DMT probing, CPTU probing was additionally performed, which does not provide a Kd index. Therefore, the values from the inclinometers were compared with the measured undrained shear strengths cu.
Figure 16 shows selected examples of the comparison. Thus, Figure 16a shows the overlap of the depth profile of Kd index values with horizontal displacements for Group 1 data. Figure 16b shows the overlap of the same dana types but for data Group 3 (landslide KL8 on road DC31 in Kravarsko). Figure 16c shows the overlap of undrained shear strength values obtained by CPTU probing in Bedekovčina and horizontal displacements obtained by inclinometers for Group 2 data.
Figure 17 shows an example of the geotechnical soil profile, which refers to the KL10 landslide (for Group 5 data). The section shows the types of materials that build the slope on the KL10 landslide, as well as their properties and classification. The values and directions of movement on the inclinometers are also marked.
6. Data Analysis
Diagrams for comparative analysis were obtained with the Microsoft Excel tool using the extracted data from Table 1. The sensitivity of a particular parameter is considered as the ability to accurately predict its state in relation to a given range (criterion). The goal of the procedure is to identify the fit of a specific parameter measured on the sliding zone in the expected ranges.
6.1. Analysis of the Horizontal Stress Index
From the diagram in Figure 18, it is evident that sliding zones can be classified in the expected range for vertical effective stresses σ′vo > 60 kPa. When analysing shallow sliding zones or landslides where the groundwater level is high (conditions of low effective stresses σ′vo ≤ 60 kPa), the measured horizontal stress index Kd can be significantly higher than the literature range (Kd = 1.8–2.0) [21,39,40]. This finding is significant from interpreting the Kd index on shallow landslides.
The fit of the results in the expected range or sensitivity is defined as the ratio of the number of samples within the criteria to the total number of samples. Data from the sensitivity analysis of the parameter Kd are presented in Table 2. Analysis of the results from this table confirmed the validity of the proposal made by Larsson et al. in 1989. They proposed a depth interval of 2.5 m as the boundary of the zone of influence on geotechnical parameters [45].
6.2. Analysis of the Undrained Shear Strength Parameter
The correlation diagram between undrained shear strength cu and vertical effective stresses σ′vo is shown in Figure 19. The data for the cu parameter in the diagram are separated because they were collected in two ways: CPTU and DMT probing.
In geotechnical practice, it is considered that within the interval in which sliding occurs, the undrained shear strength should not exceed the value cu ≤ 40 kPa.
This limit can be regarded as relative because the result can be influenced by the residual strength of the surrounding soil above and below the sliding zone itself. The sensitivity analysis of the undrained shear strength for the DMT and CPTU probing is presented in Table 3.
Comparing the two in situ methods concerning the undrained shear strength parameter measurement within the sliding zone, it can be concluded that the DMT penetration test is superior to the CPTU test.
6.3. Analysis of the Over-Consolidation Ratio
Figure 20 shows the relationship between the measured values of the over-consolidation ratio OCR on the sliding zones and the vertical effective stresses σ′vo for two types of in situ static probes (DMT and CPTU). In geotechnical practice, it is common to consider soil over-consolidation conditions that are the result of surface soil erosion. For this reason, in most cases, shallower soil layers show a higher degree of over-consolidation, while in deeper layers, the influence of over-consolidation weakens. Based on experience, the criterion can be set that only slightly over-consolidated materials up to occur within the sliding zone. The sensitivity analysis values of the OCR parameter are shown in Table 4.
Comparing the OCR values obtained by the DMT and CPTU probe on the considered samples, concerning sensitivity, the mean value of the set and the expected range of results, the DMT probe is again in advantage over the CPTU probe.
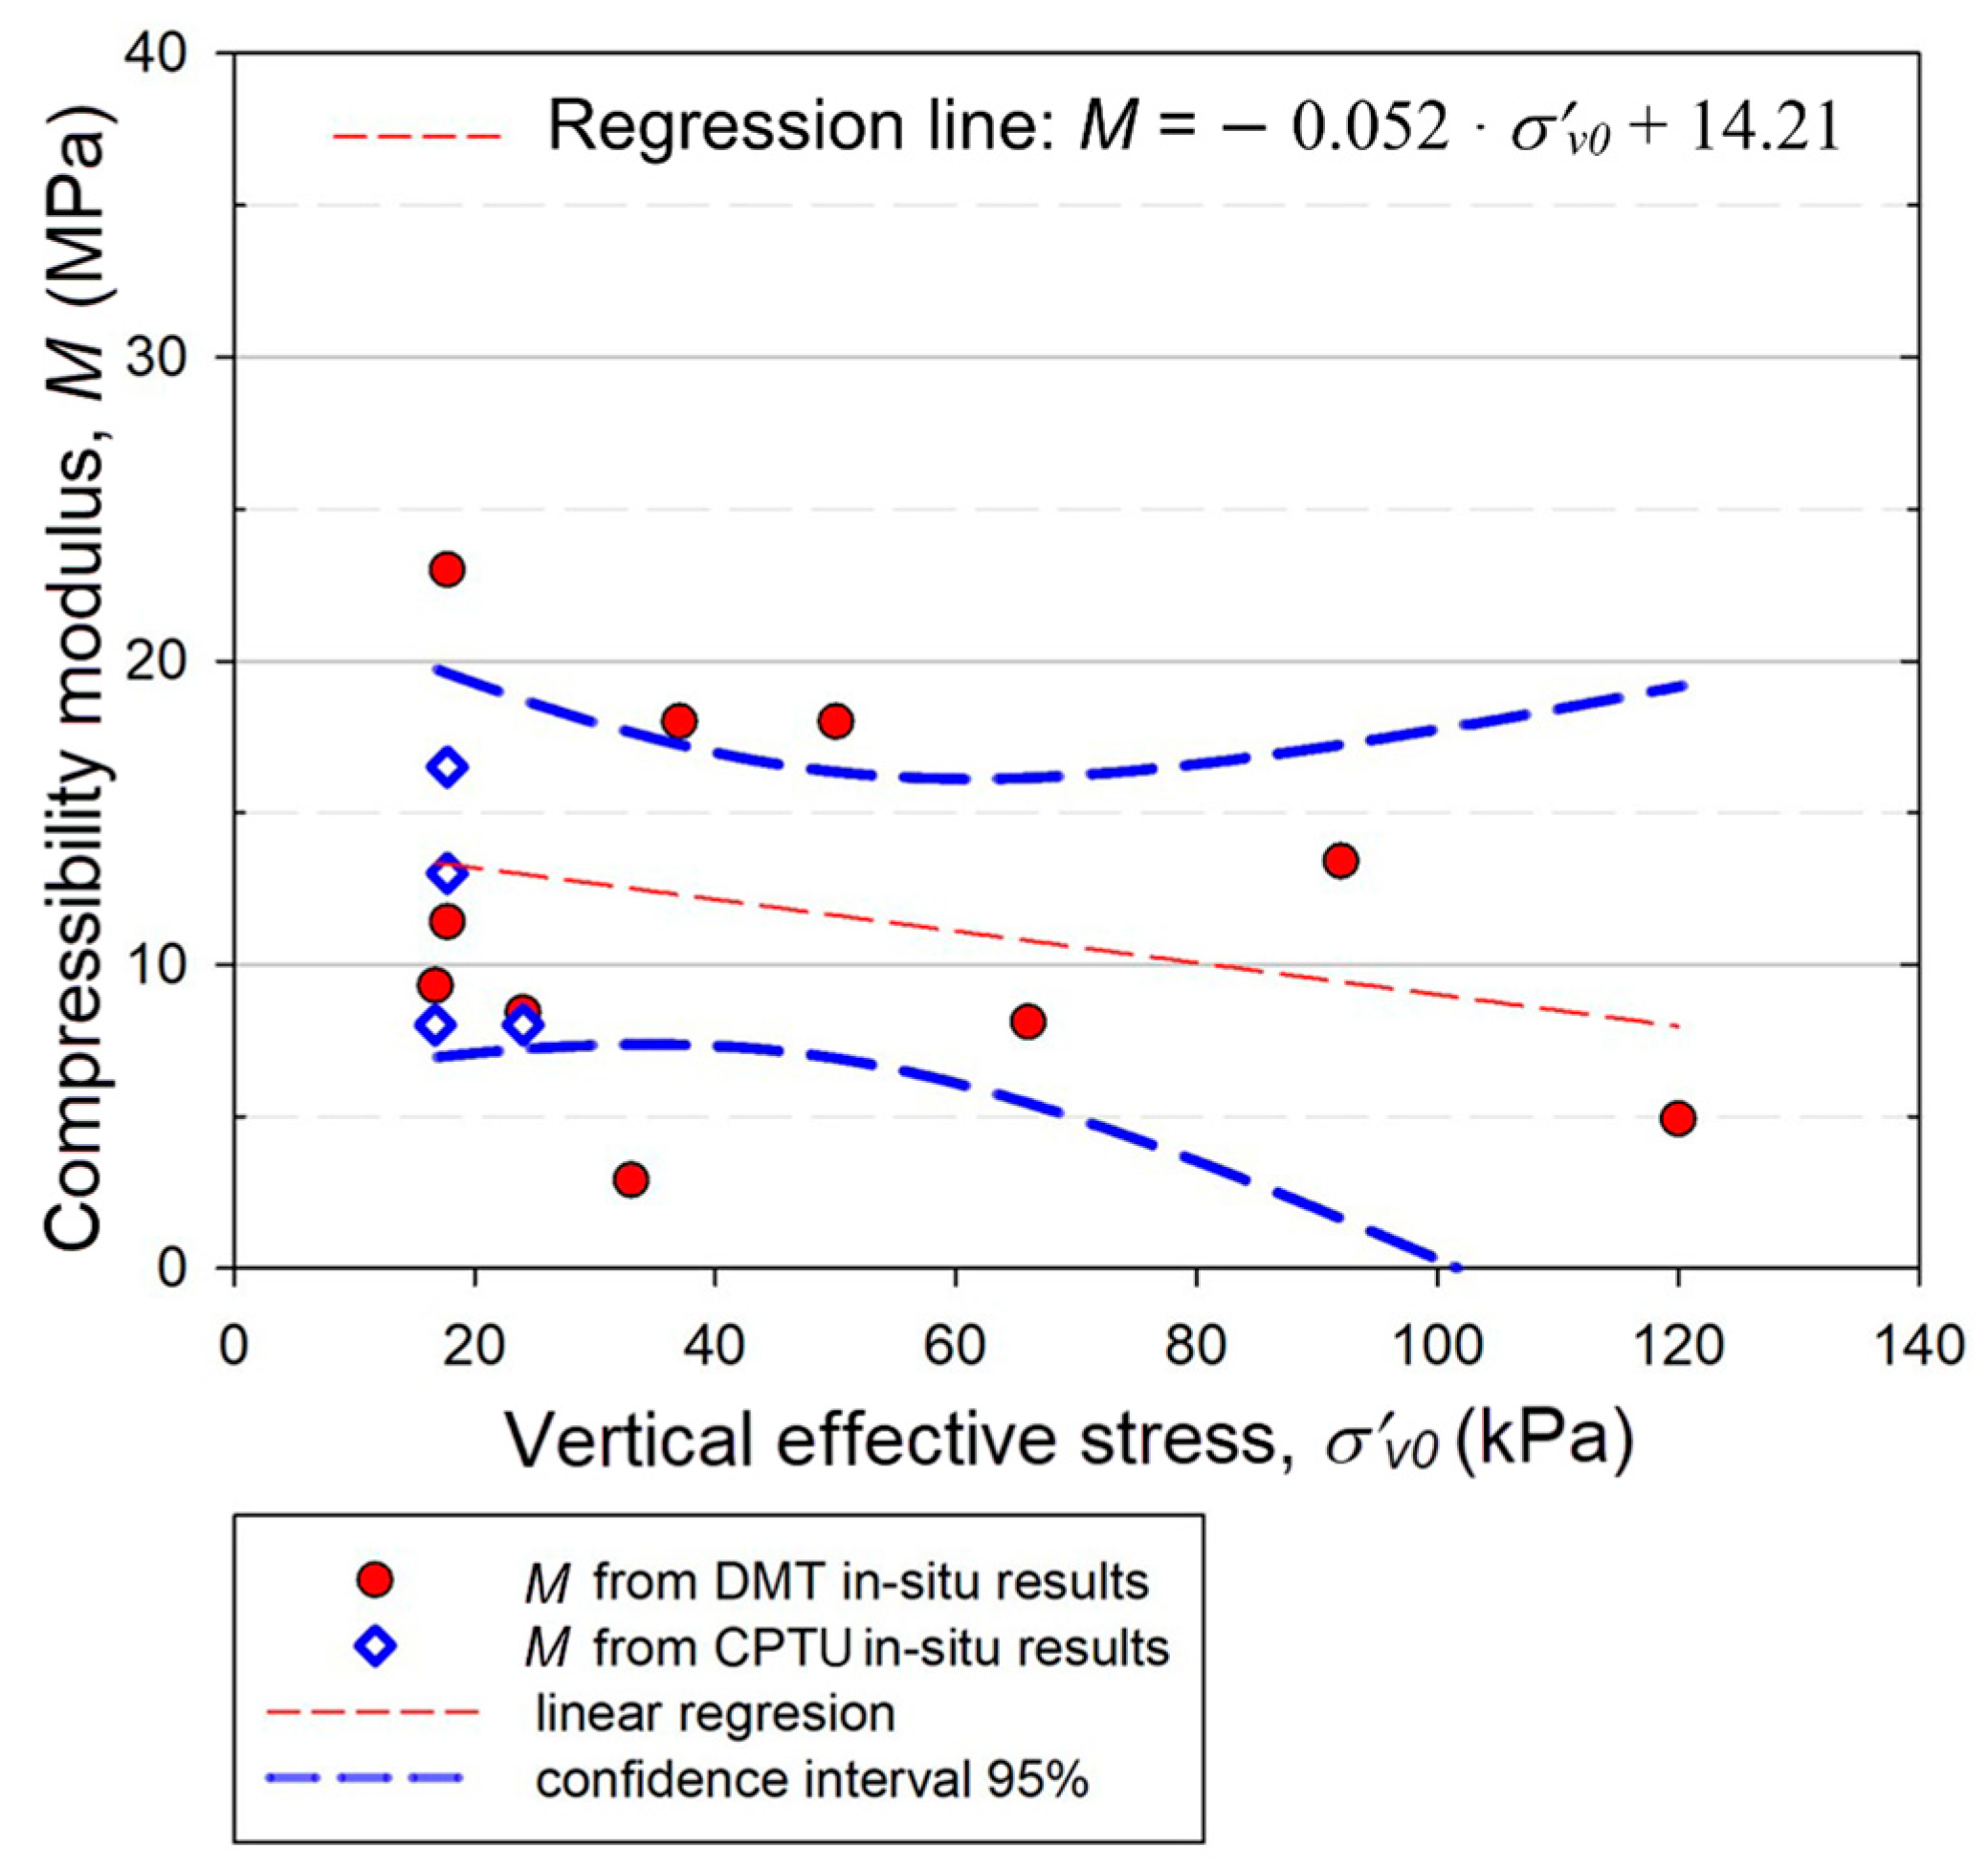
6.4. Analysis of the Compressibility Modulus
In this analysis, the basic assumption is that the soil structure has changed within the sliding zone, and consequently, the value of the compressibility modulus has changed. Based on the author’s experience, the soil on the sliding zone is identified with soft compressible clay with a compressibility modulus M < 6 MPa. The correlation diagram between compressibility modulus M and vertical effective stresses σ′vo is shown in Figure 21. Specific high values of the compressibility modulus were by no means to be expected, so it can be said that they are a surprise in this research.
The sensitivity analysis values of the OCR parameter from the DMT and CPTU probing are presented in Table 5. The obtained results indicate the fact that during sliding, the soil particles are oriented in the direction of movement. At the same time, this process does not negatively affect the compressibility modulus but even increases it. Thus, it can be concluded that the sliding process consolidates the soil with respect to the compressibility modulus by reorientating the soil particles in the sliding direction.
7. Conclusions
Two methods, the piezocone penetration test (CPTU) and the flat dilatometer test (DMT), are most often used to investigate landslides. The main goal of this paper is to determine which of these methods is more suitable for determining the parameters of the sliding zone. For this to be possible, it was first necessary to conduct an in-situ investigation and collect data for analysis. Landslides from Bedekovčina and Kravarsko were selected for the investigation locations. DMT and CPTU probing were carried out at the relevant landslide locations, and vertical inclinometers were installed in the investigation boreholes. Later, the depths of potential sliding zones obtained by probing were verified by overlaying them with the results of horizontal displacements in inclinometers.
Four parameters (undrained shear strength cu, over-consolidation ratio OCR, compressibility modulus M, and horizontal stress index Kd) were measured with the probes on the sliding zones, whose concordance with the expected range was assessed by means of sensitivity analysis. In the parametric analysis, relationship diagrams were created with regard to the effective vertical stress σ′vo for each of the four parameters mentioned.
The characteristic scientific contributions of this research are as follows:
- For the results of the DMT probe, a higher parameter sensitivity is generally obtained, closer to the expected range values, and the standard deviation (deviation from the arithmetic mean) is smaller.
- The observed trend of the regression direction in the mentioned correlations has a negative direction coefficient for all considered parameters. From the above, it can be concluded that the detection of changes within the soil disturbed by sliding is more pronounced in the case of deeper sliding zones.
- The measured parameters on deeper sliding zones fit more into the expected value ranges. This can be explained by the fact that almost every geotechnical investigated soil shows over-consolidated characteristics in the shallower layers. The described characteristic dominantly affects the results of static penetration at lower depths, i.e., at smaller amounts of vertical effective stresses.
- The value of the effective vertical stress in sliding zones does not exceed 50 kPa, i.e., σ′vo ≤ 50 kPa. This means that the parameters measured by in situ penetration on the slip surface in the presented cases do not detect the slip surface within the expected parameter ranges. In the paper, the problematic case of shallow slips in the soil is particularly highlighted. Then, there are specific phenomena of high levels of groundwater or seepage water. It is shown that in such a case, the vertical effective stresses are extremely small.
- The reorientation of soil particles caused by sliding primarily affects the lateral stresses in the soil. Regarding the stresses in the soil, the conducted research showed that in situ static penetrations do not detect soil over-consolidation in shallower layers.
- It is confirmed that the horizontal stress index Kd is the parameter that best detects the sliding zones. However, the results show that the range of the expected value of the Kd index on the sliding zone can be extended. The range mentioned in the literature is Kd = 1.8–2.0. From the results of this paper, it is clear that the upper limit should definitely be raised. Figure 18 shows the linear regression of the results for Kd from Table 1, and it is concluded that the upper value should be increased by 0.5 to the range of Kd = 1.8–2.5. Another important conclusion can be drawn by looking at Figure 18. As the test depth increases (the vertical effective stress), the deviation of the measured Kd values from the shown regression line decreases. This means that various surface disturbances on the landslide influence the measured Kd values at lower depths.
- It was shown that the detection sensitivity of the Kd index is also influenced by over-consolidation in shallow soil layers. However, the results of this research show that caution should be exercised when establishing a relationship between Kd and OCR. A value of Kd = 2 corresponds to OCR = 1 only when testing normally consolidated clay. The surrounding soil significantly influences OCR, and in the zone of soil reorientation within the layer of the sliding surface, it reacts according to the type of material and the sliding process on the surface itself. Therefore, on landslides in which significant movements have already occurred, the clay in the sliding zone is completely disturbed (crushed), so the obtained values for OCR are much higher (OCR = 3–6) and can be unrealistically high (OCR > 10). From the above, it can be concluded that the measurement of the OCR coefficient by the DMT and CPTU methods cannot be a parameter for detecting a sliding zone.
In the end, it is pointed out once again that the penetration methods used for this research are of unequal sensitivity for the detection of the sliding zone, and it has been proven that the DMT dilatometer probe is superior to the CPTU piezocone penetrometer for the purposes of landslide characterisation.
Author Contributions
Conceptualization, K.G. and J.J.; methodology, K.G., A.B. and J.J.; software, K.G. and A.B.; validation, K.G., J.J., A.B. and S.S.; formal analysis, K.G. and A.B.; investigation, K.G. and A.B.; resources, S.S.; writing—original draft preparation, J.J. and A.B.; writing—review and editing, K.G. and S.S.; visualization, K.G. and A.B.; supervision, J.J. and S.S.; project administration, S.S.; funding acquisition, J.J. and S.S. All authors have read and agreed to the published version of the manuscript.
Funding
This research received no external funding.
Data Availability Statement
The data used in this research work are available upon request from the corresponding author.
Acknowledgments
Institutional projects GFV-IP-2024, Faculty of Geotechnical Engineering, University of Zagreb, Hallerova aleja 7, Varaždin (42000), Croatia.
Conflicts of Interest
The authors declare no conflicts of interest.
References
- Cruden, D.M. A Simple Definition of a Landslide. Bull. Int. Assoc. Eng. Geol. 1991, 43, 27–29. [Google Scholar] [CrossRef]
- Turner, A.K.; Schuster, R.L. Landslides: Investigation and Mitigation (Report 247); National Academy Press: Washington, DC, USA, 1996. [Google Scholar]
- Mihalić Arbanas, S.; Arbanas, Ž.; Krkač, M.; Bernat Gazibara, S.; Vivoda Prodan, M.; Đomlija, P.; Jagodnik, V.; Dugonjić Jovančević, S.; Sečanj, M.; Peranić, J. Landslide risk reduction in Croatia: Scientific research in the framework of the WCoE 2014–2017, IPL-173, IPL-184, ICL ABN. In Advancing Culture of Living with Landslide, Proceedings of 4th World Landslide Forum, Ljubljana, Slovenija, 2017; Sassa, K., Mikoš, M., Yin, Y., Eds.; Springer: Berlin/Heidelberg, Germany, 2017. [Google Scholar]
- European Commision. Joint Research Centre. Lessons Learnt from Landslide Disasters in Europe. Available online: https://esdac.jrc.ec.europa.eu/ESDB_Archive/eusoils_docs/other/eur20558EN.pdf (accessed on 3 May 2023).
- Van Den Eeckhaut, M.; Hervas, J.; Jaedicke, C.; Malet, J.P.; Montanarella, L.; Nadim, F. Statistical modelling of Europe-wide landslide susceptibility using limited landslide inventory data. Landslides 2012, 9, 357–369. [Google Scholar] [CrossRef]
- Gunther, A.; Van den Eeckhaut, M.; Malet, J.P.; Reichenbach, P.; Hervas, J. Climatephysiographically differentiated pan-european landslide susceptibility assessment using spatial multi-criteria evaluation and transnational landslide information. Geomorphology 2014, 224, 69–85. [Google Scholar] [CrossRef]
- Haque, U.; Blum, P.; da Silva, P.H.; Andersen, P.; Pilz, J.; Chalov, S.R.; Malet, J.P.; Auflič, M.J.; Andres, N.; Poyiadji, E.; et al. Fatal landslides in Europe. Landslides 2016, 12, 1545–1554. [Google Scholar] [CrossRef]
- Jordanova, G.; Gariano, S.L.; Melillo, M.; Peruccacci, S.; Brunetti, M.T.; Jemec Auflič, M. Determination of Empirical Rainfall Thresholds for Shallow Landslides in Slovenia Using an Automatic Tool. Water 2020, 12, 1449. [Google Scholar] [CrossRef]
- Corsini, A.; Borgatti, L. Mountain Landslides: Monitoring, Modeling, and Mitigation. Geosciences 2019, 9, 365. [Google Scholar] [CrossRef]
- Tofani, V.; Bicocchi, G.; Rossi, G.; Segoni, S.; D’Ambrosio, M.; Casagli, N.; Catani, F. Soil characterization for shallow land-slides modeling: A case study in the Northern Apennines (Central Italy). Landslides 2017, 14, 755–770. [Google Scholar] [CrossRef]
- Pilecka, E.; Szwarkowski, D.; Stanisz, J.; Blockus, M. Analysis of a Landslide on a Railway Track Using Laser Scanning and FEM Numerical Modelling. Appl. Sci. 2022, 12, 7574. [Google Scholar] [CrossRef]
- Bogard, T.A.; Greco, R. Landslide hydrology: From hydrology to pore pressure. WIREs Water 2016, 3, 439–459. [Google Scholar] [CrossRef]
- Schuster, R.L.; Highland, L.M. Socioeconomic and Environmental Impacts of Landslides in the Western Hemisphere; Open-File Report 01-276; U.S. Geological Survey: Denver, CO, USA, 2001. Available online: https://pubs.usgs.gov/of/2001/0276/report.pdf (accessed on 9 May 2023).
- Sim, K.B.; Lee, M.L.; Wong, S.Y. A review of landslide acceptable risk and tolerable risk. Geoenviron. Disasters 2022, 9, 3. [Google Scholar] [CrossRef]
- Miklin, L.; Podolszki, L.; Gulam, V.; Markotić, I. The Impact of Climate Changes on Slope Stability and Landslide Conditioning Factors: An Example from Kravarsko, Croatia. Remote Sens. 2022, 14, 1794. [Google Scholar] [CrossRef]
- Grabar, K.; Strelec, S.; Špiranec, M.; Dodigović, F. CPT—DMT Correlations on Regional Soils from Croatia. Sensors 2022, 22, 934. [Google Scholar] [CrossRef]
- Špiranec, M.; Grabar, K.; Strelec, S. Determination slip surface in situ by dilatometer (DMT) test (“Kd method”). In Proceedings of the 7th conference of Croatian Geotechnical Society with international participation, Varaždin, Croatia, 10–12 November 2016. [Google Scholar]
- Strelec, S.; Mesec, J.; Grabar, K.; Jug, J. Implementation of in-situ and geophysical investigation methods (ERT and MASW) with the purpose to determine 2D profile of landslide. Acta Montan. Slovaca 2017, 22, 345–358. [Google Scholar]
- Rocha, B.P.; Yacoub, J.D.; Fernandes, J.B.; Rodrigues, R.A.; Giacheti, H.L. Geotechnical site characterization by DMT and laboratory tests on an unsaturated tropical soil site for slope stability analysis. Soils Rocks 2023, 46, e2023005123. [Google Scholar] [CrossRef]
- Potvin, J.J.; Woeller, D.; Sharp, J.; Take, W.A. Stratigraphic profiling, slip surface detection, and assessment of remolding in sensitive clay landslides using the CPT. Can. Geotech. J. 2021, 59, 1146–1160. [Google Scholar] [CrossRef]
- Totani, G.; Marchetti, S.; Paola, M.; Calabrese, M. Use of in-situ flat dilatometer (DMT) for ground characterization in the stability analysis of slope. In Proceedings of the XIV International Conference on Soil Mechanics and Foundation Engineering, Hamburg, Germany, 6–12 September 1997; Balkema: Rotterdam, The Netherlands, 1997; Volume 1, pp. 607–610, ISBN 90-5410-891-6. [Google Scholar]
- Google Maps. Municipality Bedekovčina and Kravarsko. Available online: https://www.google.com/maps (accessed on 9 May 2023).
- Hrvatska.eu. Zemlja i Ljudi. Politički Ustroj. Županije. Available online: https://croatia.eu/index.php?view=article&id=30&lang=1 (accessed on 8 May 2023).
- Hrvatski Geološki Institut; Zavod za Mineralne Sirovine. Rudarsko-Geološka Studija Krapinsko-Zagorske Županije. Zagreb. 2016. Available online: https://kzz.hr/sadrzaj/dokumenti/izvjesca-o-radu/2016/10.%20Rudarsko-geoloska-studija-KZZ.pdf (accessed on 3 May 2023).
- Aničić, B.; Muriša, M. Osnovna Geološka Karta SFRJ List Rogatec, M 1:100000, L 33–68 [Base Geological Map Page Rogatec]; Geološki zavod: Ljubljana, Slovenia; i geološki zavod Zagreb: Zagreb, Croatia, 1985; pp. 1971–1981. [Google Scholar]
- Pikija, M. Osnovna Geološka Karta SFRJ List Sisak, M: 1: 100 000, L 33–93 [Base Geological Map Page Sisak]; Geološki zavod Zagreb: Zagreb, Croatia, 1975–1976. [Google Scholar]
- Juraić Mucko, J.; Mucko, I. ARHITEKTONSKI ATELIER DESET d.o.o. za Arhitekturu i Urbanizam Zagreb. Prostorni Plan Uređenja Općine Kravarsko. Plan br. 0301. Available online: https://www.kravarsko.hr/download/Obrazlozenje.pdf (accessed on 10 May 2023).
- HRN EN ISO 22476-1; Geotehničko Istraživanje i Ispitivanje—Terensko Ispitivanje—1. Dio: Ispitivanje Električnim Statičkim Prodiranjem Bez Mjerenja Pornog Tlaka i s Mjerenjem Pornog Tlaka (-). Available online: https://www.iso.org/standard/57728.html (accessed on 23 November 2023).
- Schneider, J.A.; Randolph, M.F.; Mayne, P.W.; Ramsey, N.R. Analysis of Factors Influencing Soil Classification Using Normalized Piezocone Tip Resistance and Pore Pressure Parameters. J. Geotech. Geoenviron. Eng. 2008, 134, 1569–1586. [Google Scholar] [CrossRef]
- Robertson, P.K.; Cabal, K.L. Guide to Cone Penetration Testing for Geotechnical Engineering, 6th ed.; Gregg Drilling & Testing, Inc.: Signal Hill, CA, USA, 2015; pp. 38–71. [Google Scholar]
- Mayne, P.W. Evaluating effective stress parameters and undrained shear strength of soft-firm clays from CPT and DMT. Aust. Geomech. J. 2016, 51, 27–55. [Google Scholar]
- Lunne, T.; Christoffersen, H.P.; Tjelta, T.I. Engineering use of piezocone data in North Sea clays. In Proceedings of the 11th International Conference on Soil Mechanics and Foundation Engineering, San Francisco, CA, USA, 12–16 August 1985; Volume 2, pp. 907–912. [Google Scholar]
- Mayne, P.W.; Peuchen, J. CPTu bearing factor Nkt for undrained strength evaluation in clays. In Proceedings of the Fourth International Symposium on Cone Penetration Testing (CPT’18), Delft, The Netherlands, 21–23 June 2018. [Google Scholar]
- Hight, D.W.; Mcmillan, F.; Powell, J.J.M.; Jardine, R.J.; Allenou, C.P. Some characteristics of London Clay. In Proceedings of the 1st International Workshop on Characterisation and Engineering Properties of Natural Soils, Singapore, 29 November–1 December 2006; Tan, T.S., Phoon, K.K., Hight, K.W., Leroueil, S., Balkema, A.A., Eds.; Swets & Zeitlinge: Lisse, The Netherlands, 2023; pp. 851–907. [Google Scholar]
- Bagheri, M.; Rezania, M. Geological and Geotechnical Characteristics of London Clay from the Isle of Sheppey. Geotech. Geol. Eng. 2021, 39, 1701–1713. [Google Scholar] [CrossRef]
- Robertson, P.K. Interpretation of Cone Penetration Tests a Unified Approach. Can. Geotech. J. 2009, 46, 1337–1355. [Google Scholar] [CrossRef]
- Mayne, P.W.; Kemper, J.B. Profiling OCR in Stiff Clays by CPT and SPT. Geotech. Test. J. 1998, 11, 139–147. [Google Scholar] [CrossRef]
- Lunne, T.; Robertson, P.K.; Powell, J. Cone Penetration Testing in Geotechnical Practice. Soil Mech. Found. Eng. 1997, 46, 237. [Google Scholar] [CrossRef]
- HRN EN ISO 22476-11:2017; Geotehničko Istraživanje i Ispitivanje—Terensko Ispitivanje—11. Dio: Ispitivanje Plosnatim Dilatometrom. 2017. Available online: https://www.iso.org/standard/66434.html (accessed on 23 November 2023).
- Marchetti, S. The Flat Dilatometer: Design Applications. Keynote Lecture. In Proceedings of the 3rd International Geotechnical Engineering Conference, Colombo, Sri Lanka, 10–11 August 2020; Cairo University: Giza, Egypt, 2020; pp. 421–448. [Google Scholar]
- Totani, G.; Marchetti, S.; Monaco, P.; Calabrese, M. Use of the Flat Dilatometer Test (DMT) in Geotechnical Design; In situ; Faculty of Engineering, University of L’Aquila: L’Aquila, Italy, 2001. [Google Scholar]
- Löfroth, H. Undrained shear strength in clay slopes—Influence of Stress Conditions. A Model and Field Test Study. Ph.D. Thesis, Swedish Geotechnical Institute, Göteborg, Sweden, 2008. Available online: https://www.researchgate.net/publication/321528042 (accessed on 10 May 2023).
- Marchetti, S. In Situ Tests by Flat Dilatometer. J. Geotech. Eng. Div. 1980, 106, 299–321. [Google Scholar] [CrossRef]
- Vassallo, R.; Calcaterra, S.; D’Agostino, N.; De Rosa, J.; Di Maio, C.; Gambino, P. Long-Term Displacement Monitoring of Slow Earthflows by Inclinometers and GPS, and Wide Area Surveillance by COSMO-SkyMed Data. Geosciences 2020, 10, 171. [Google Scholar] [CrossRef]
- Larson, W.E.; Blake, G.R.; Allmaras, R.R.; Voorhees, W.B.; Gupta, S.C. Mechanics and Related Processes in Structured Agricultural Soils; NATO Applied Science; Kluwer Academic Publishers: Dordrecht, The Netherlands, 1989; Volume 172, p. 273. [Google Scholar]
Figure 2.
Investigation flow chart.

Figure 3.
Geological profile of the wider area around the investigation location in Bedekovčina [20].
Figure 3.
Geological profile of the wider area around the investigation location in Bedekovčina [20].

Figure 4.
Different clay samples from the area of the Bedekovčina landslide.

Figure 5.
Plan view of in-situ investigations on the Bedekovčina landslide.

Figure 6.
Situation plan of in-situ investigations on landslides in Kravarsko.

Figure 7.
Groups of cu profiles measured at the geotechnical test site of soft clays, Bothkennar in Great Britain. The tags are: FV—downhole wing probe; TC—triaxle compression (CKoUC); DSS—triaxle simple shear; TE—triaxle extension [35].
Figure 7.
Groups of cu profiles measured at the geotechnical test site of soft clays, Bothkennar in Great Britain. The tags are: FV—downhole wing probe; TC—triaxle compression (CKoUC); DSS—triaxle simple shear; TE—triaxle extension [35].

Figure 8.
Self-propelled machine for hydraulic pressing of CPTU probe, Pagani TG 63-150.

Figure 9.
Detection of the sliding zone based on the index Kd [41].
Figure 9.
Detection of the sliding zone based on the index Kd [41].

Figure 10.
Results of DMT-1 investigation—Bedekovčina landslide.

Figure 11.
Results of for DMT-2 investigation—Bedekovčina landslide.

Figure 12.
Overlay of research results obtained by DMT-1 and DMT-2 sounding—Bedekovčina landslide.

Figure 13.
Results of DMT investigation for p0, p1, and interpreted data for ED: (a) KL8; (b) KL9; (c) KL10.
Figure 13.
Results of DMT investigation for p0, p1, and interpreted data for ED: (a) KL8; (b) KL9; (c) KL10.

Figure 14.
Results of DMT investigation on the Kravarsko landslides.

Figure 15.
Prognostic profiles and the analysis of the obtained data by depth in the first group of the investigation area in Bedekovčina: (a) undrained shear strength cu; (b) over-consolidation ratio OCR; (c) compressibility modulus M; (d) horizontal stress index Kd.
Figure 15.
Prognostic profiles and the analysis of the obtained data by depth in the first group of the investigation area in Bedekovčina: (a) undrained shear strength cu; (b) over-consolidation ratio OCR; (c) compressibility modulus M; (d) horizontal stress index Kd.


Figure 16.
Comparison diagrams of in situ probing results with the obtained values of horizontal displacements on inclinometers: (a) Group 1 data Kd—horizontal displacements; (b) Group 3 data Kd—horizontal displacements; (c) Group 3 data cu—horizontal displacements.
Figure 16.
Comparison diagrams of in situ probing results with the obtained values of horizontal displacements on inclinometers: (a) Group 1 data Kd—horizontal displacements; (b) Group 3 data Kd—horizontal displacements; (c) Group 3 data cu—horizontal displacements.

Figure 17.
Geotechnical soil profile for KL10 landslide on road DC31 in Kravarsko.

Figure 18.
The relationship between the horizontal stress index Kd and the vertical effective stress σ’vo on the detected sliding zones.
Figure 18.
The relationship between the horizontal stress index Kd and the vertical effective stress σ’vo on the detected sliding zones.

Figure 19.
The relationship between the undrained shear strength cu and vertical effective stresses σ’vo on the detected sliding zones.
Figure 19.
The relationship between the undrained shear strength cu and vertical effective stresses σ’vo on the detected sliding zones.

Figure 20.
The relationship between the over-consolidation ratio OCR and vertical effective stresses σ′vo on the detected sliding zones.
Figure 20.
The relationship between the over-consolidation ratio OCR and vertical effective stresses σ′vo on the detected sliding zones.

Figure 21.
The relationship between the compressibility modulus M and vertical effective stresses σ’vo on the detected sliding zones.
Figure 21.
The relationship between the compressibility modulus M and vertical effective stresses σ’vo on the detected sliding zones.


Table 1.
Extracted parameters on the detected potential sliding zones for all analysed research groups.
Table 1.
Extracted parameters on the detected potential sliding zones for all analysed research groups.
| Data Group | Location | Sliding Zone Depth (m) | GWL (m) | σ′v0 (kPa) | CPTU DMT cu (kPa) | CPTU DMT OCR (-) | CPTU DMT M (MPa) | DMT Kd (-) | |||
|---|---|---|---|---|---|---|---|---|---|---|---|
| Group 1 | Bedekovčina | 2.8 | 0.5 | 24.0 | 23.0 | 19.0 | 10.0 | 4.8 | 8.0 | 8.4 | 2.4 |
| 5.6 | 0.5 | 17.7 | 55.0 | 70.0 | 9.8 | 10.2 | 13.0 | 23.0 | 2.2 | ||
| Group 2 | Bedekovčina | 6.0 | 0.5 | 17.7 | 47.0 | 25.0 | 7.5 | 3.1 | 16.5 | 11.4 | 3.5 |
| 8.2 | 0.5 | 16.7 | 26.0 | 28.0 | 3.5 | 2.5 | 8.0 | 9.3 | 3.7 | ||
| Group 3 | DC31, KL8 | 2.0 | 2.2 | 33.0 | - | 33.0 | - | 6.0 | - | 2.9 | 1.7 |
| Group 4 | DC31, KL9 | 2.2 | 2.3 | 37.0 | - | 13.0 | - | 2.0 | - | 18.0 | 2.8 |
| 3.2 | 2.3 | 45.0 | - | 44.0 | - | 7.1 | - | 44.0 | 3.8 | ||
| Group 5 | DC31, KL10 | 3.0 | 6.8 | 50.0 | - | 50.0 | - | 7.0 | - | 18.0 | 4.2 |
| 5.4 | 6.8 | 92.0 | - | 40.0 | - | 2.4 | - | 13.4 | 2.2 | ||
| 7.2 | 6.8 | 120.0 | - | 20.0 | - | 0.8 | - | 4.9 | 1.6 | ||
| Group 6 | DC31, KL11 | 3.8 | 3.0 | 66.0 | - | 21.0 | - | 14.0 | - | 8.1 | 1.7 |
Table 2.
Data analysis and parameter sensitivity for Kd.
| Total Number of Samples, N | Mean Value of Data Set, | Sample Standard Deviation, “s” | Expected Range of Correct Result (Extended) | Parameter Sensitivity on the Total Data Sample | Sample Sensitivity, σ′vo > 60 kPa |
|---|---|---|---|---|---|
| 11 | 2.75 | 0.94 | 1.8–2.5 | ≅60% | 100% |
Table 3.
Data analysis and parameter sensitivity for cu.
| Total Number of Samples, N | Mean Value of Data Set, | Sample Standard Deviation, “s” | Expected Range of Correct Result | Sample Sensitivity | |||||
|---|---|---|---|---|---|---|---|---|---|
| DMT | CPTU | DMT | CPTU | DMT | CPTU | DMT | CPTU | DMT | CPTU |
| 11.0 | 4.0 | 32.27 | 37.75 | 15.14 | 15.69 | 5.0–40.0 | 5.0–40.0 | ≅70% | ≅50% |
Table 4.
Data analysis and parameter sensitivity for OCR.
| Total Number of Samples, N | Mean Value of Data Set, | Sample Standard Deviation, “s” | Expected Range of Correct Result | Sample Sensitivity | |||||
|---|---|---|---|---|---|---|---|---|---|
| DMT | CPTU | DMT | CPTU | DMT | CPTU | DMT | CPTU | DMT | CPTU |
| 11.0 | 4.0 | 4.59 | 7.70 | 2.95 | 3.02 | 1.0–4.0 | 1.0–4.0 | ≅45% | ≅25% |
Table 5.
Data analysis and parameter sensitivity for M.
| Total Number of Samples, N | Mean Value of Data Set, | Sample Standard Deviation, “s” | Expected Range of Correct Result | Sample Sensitivity | |||||
|---|---|---|---|---|---|---|---|---|---|
| DMT | CPTU | DMT | CPTU | DMT | CPTU | DMT | CPTU | DMT | CPTU |
| 11.0 | 4.0 | 11.74 | 11.37 | 6.35 | 4.20 | 1.0–8.0 | 1.0–8.0 | ≅35% | ≅50% |
Disclaimer/Publisher’s Note: The statements, opinions and data contained in all publications are solely those of the individual author(s) and contributor(s) and not of MDPI and/or the editor(s). MDPI and/or the editor(s) disclaim responsibility for any injury to people or property resulting from any ideas, methods, instructions or products referred to in the content. |
© 2024 by the authors. Licensee MDPI, Basel, Switzerland. This article is an open access article distributed under the terms and conditions of the Creative Commons Attribution (CC BY) license (https://creativecommons.org/licenses/by/4.0/).
Share and Cite
MDPI and ACS Style
Grabar, K.; Jug, J.; Bek, A.; Strelec, S. Comparison of the Piezocone Penetrometer (CPTU) and Flat Dilatometer (DMT) Methods for Landslide Characterisation. Geosciences 2024, 14, 64. https://doi.org/10.3390/geosciences14030064
AMA Style
Grabar K, Jug J, Bek A, Strelec S. Comparison of the Piezocone Penetrometer (CPTU) and Flat Dilatometer (DMT) Methods for Landslide Characterisation. Geosciences. 2024; 14(3):64. https://doi.org/10.3390/geosciences14030064
Chicago/Turabian StyleGrabar, Kristijan, Jasmin Jug, Anja Bek, and Stjepan Strelec. 2024. "Comparison of the Piezocone Penetrometer (CPTU) and Flat Dilatometer (DMT) Methods for Landslide Characterisation" Geosciences 14, no. 3: 64. https://doi.org/10.3390/geosciences14030064
Note that from the first issue of 2016, this journal uses article numbers instead of page numbers. See further details here.