1. Introduction
Soils play an important role in the growth of natural resources. Soil erosion is a natural process in which the topsoil is removed from its original location [
1]. The accelerated soil erosion that has been found worldwide is an environmental problem related to land use for agricultural and forestry practices and is linked to population growth. The problem of forest fires is also an aggravating factor in this context [
2,
3,
4]. According to Borelli et al. (2017) [
5], soil erosion may cause damage to nutrient loss, the carbon cycle, land productivity, and socio-economic conditions. These long-term practices, without proper management, can cause environmental degradation and intense erosive processes [
6,
7].
The reduction in soil porosity is one of the reasons for erosive processes, reducing the capacity for water retention and infiltration, causing an increase in surface runoff and sediment transport, and causing the siltation of water bodies [
1,
8,
9].
With the natural impacts that can be intensified by social conditions, soil erosion and degradation, which are global problems, have been causing a great inconvenience to Brazil. The effects can be observed both in urban and rural areas, can cause social, economic, and environmental impacts, such as reduced water quality and loss of soil fertility, and can also spoil food security. Therefore, research related to soils and their conservation for future generations is becoming increasingly relevant [
6,
10,
11].
Soil erosion is an ancient process and, although it is a natural event, it is also directly related to land use and cover. The passage from nomadism to the sedentary lifestyle of human activities leaves the soil more exposed to the actions of erosive factors [
8,
12]. Brazil is a country that has global prominence as food supplier of agricultural products. This scenario is directly related to investments of the private sector and the government infrastructure and agribusiness in the Brazilian savannah,
Cerrado, an area with more than 200 million hectares, livestock, a mineral water reservoir, and logging for coal production [
8,
13,
14,
15].
Cerrado has a high degree of biodiversity and its coverage mainly involves savana (
campo sujo,
campo Cerrado, and
Cerrado sensu stricto), pasture (
campo limpo), and forest (
Cerradão) [
16].
This biome is located in the central region of Brazil, covers the states of Goiás, Tocantins, Mato Grosso, Mato Grosso do Sul, Minas Gerais, Bahia, Distrito Federal, Maranhão, Piauí, Rondônia, São Paulo, and Paraná, and borders other biomes, which results in a high degree of biodiversity. The
Cerrado soil is usually deficient in nutrients and requires techniques that involve anthropic intervention to make it more fertile, but these actions can bring about different consequences. The results obtained by Cerqueira and Gomes (2023) [
13] indicate that, in Piauí state in northeastern Brazil, there has been an expansion of land use for agriculture, pasture, and non-vegetated areas, which include urbanization, mining, and beaches and dunes over 987.03, 177.15, and 24.43 hectares, respectively. However, soil erosion is facilitated and accelerated by inadequate management practices, which contribute to unproductive land use, affecting food insecurity [
1,
7,
17,
18].
The Universal Soil Loss Equation (USLE), introduced in the mid-1960s [
19], was originally created to estimate the average annual rate of soil loss at the level of standard soil loss plots. It was improved in the late 1970s [
20] and is possibly the most widely applied and accepted empirical model of erosion in the world [
17].
This model uses the analysis factors rainfall erosivity (
R), soil erodibility (
K), the topographic factor (
LS), land use and cover (
C), and management and conservation practices (
P) [
7,
17,
18,
20]. The impact of rainfall is one of the main factors in aggregate breakdown as well as the shear stress of water flow. This process generates soil erosion from the transport of sediment [
10,
11,
21]. Erodibility is related to the susceptibility of soils to erosion by rainwater and runoff, is a parameter of great importance for predicting soil loss, and is associated with soil physical and chemical properties [
21,
22,
23]. The topographic factor is an essential parameter in determining the influence of slope (factor
S) and slope length (
L) in order to quantify the erosion generated by the influence of the water velocity from surface runoff [
24,
25].
Another important parameter of the USLE is the
CP factor, which indicates the land use, management, and conservation practices and is entirely related to the use of the land and vegetation cover of the study area. It determines the anthropic factors of the equation, indicating the susceptibility of the soil surface to water erosion considering that soil management and conservation practices can reduce or intensify erosive processes [
13,
26,
27]. Potential erosion is analyzed from the integration of
R,
K, and
LS, which indicate the natural potential of the environment for erosive processes, and the integration of potential erosion and factors
C and
P generates real/current erosion from the estimation of soil loss, being related to natural physical aspects and anthropogenic actions [
8,
9].
In recent decades, the USLE has undergone major changes, resulting in improved versions, such as the Revised USLE (RUSLE) [
7,
28], enabling the application of the equation at the watershed level and the development of maps that identify areas susceptible to water erosion. This model provides a clear perspective for understanding the interaction between erosion and its causal factors, is a computer-based model, and has benefited greatly from advances in Geographic Information System (GIS) and remote sensing technologies [
1,
13,
14,
24,
25,
26,
27]. Rasanen et al. (2023) [
28] used the RUSLE in Finland to estimate the soil erosion on different spatial scales. Kumar et al. (2022) [
29] carried out a global-scale application of the RUSLE and outlined the suitability of the model under varying conditions.
In a study conducted by Rathnayaka and Weerasinghe (2023) [
30], the effectiveness of using the RUSLE and estimating the sediment production in the Attanagalu Oya Watershed in Sri Lanka was demonstrated. The equation was employed to quantify the soil erosion and map the spatial variation in the soil erosion risk over a twenty-year period. The recent international literature [
29,
31,
32,
33,
34] suggests that empirical models like the RUSLE provide a simple and comprehensive methodology for assessing soil erosion. These studies outline the potential integration of a Geographic Information System (GIS) and, in particular, remote sensing for soil erosion detection.
Allois et al. (2022) [
31] provide an overview of the developmental milestones in soil loss estimation using the RUSLE model. The authors found that the model’s parameterization has been thoroughly reviewed over the years, with a strong emphasis on the challenges and successes associated with deriving each individual factor. The study found that researchers have developed various equations to effectively tailor the five factors encompassed by the model. These equations consider different variations that depict the soil erosion process.
Sathiyamurthi et al. (2023) [
35] highlight the potential for estimating soil loss in semi-urban watersheds using geospatial techniques associated with the RUSLE model. The study, conducted in Tamil Nadu, India, identified a 43.52% increase in the erosion risk over different years (2004 to 2009). Other authors have also applied the RUSLE in diverse spatial contexts [
1,
36,
37,
38,
39], demonstrating the model’s versatility and its globally efficient and adaptive nature.
The choice of the RUSLE for this research is based on its versatility and ability to assess soil loss at different scales. Through the adaptation of the model, we can provide an assessment of the soil erosion in the Parnaíba river basin, allowing for a comprehensive understanding of erosion processes on a broader scale considering the erosion factors that are fundamental in understanding this topic.
This study aimed to analyze the soil erosion downstream of the Parnaíba river watershed, which is located in the central-western region of Piauí state in the Brazilian
Cerrado, a zone of morphoclimatic transition between the Maranhão and Piauí states. In order to understand the soil loss and map the potential erosion and actual erosion, this study was conducted to provide qualitative and quantitative results, support the planning and territorial management of this important natural resource, and serve as a basis for further studies in the region. This area was chosen due to the lack of a survey on this topic in this area and the economic and social importance of the region. This area receives large amounts of sediment produced in the main riverbed and in the areas of contribution of the tributaries of the upper and middle stream arising from the inadequate removal of the vegetation cover for the expansion of the agricultural field, making the soil vulnerable to erosion [
40].
The justification for this research is based mainly on the significant influence that soil erosion exerts on vegetation, natural resources, and, consequently, local communities providing subsidies for research on this topic in the region, which is still scarce today. In addition, the choice of this specific area, located in the Brazilian Cerrado biome, provides an opportunity to apply geotechnologies and geoprocessing tools through the RUSLE in the assessment of soil erosion. This approach not only enriches the academic literature on this topic in the area but also offers crucial insights for the efficient management and planning of the watershed in addition to enabling comparative analyses with other regions of similar context.
The data were analyzed using an approach that allowed us to detail the factors related to the erosive processes that generate soil loss by surface erosion, including database and spatial modeling of soil erosion, the classification and interpretation of results considering the natural parameters of the environment (R, K, and LS) and the interaction with anthropic factors (CP), data interpretation, and analysis of soil loss with a technical–scientific basis.
2. Materials and Methods
The Revised Universal Soil Loss Equation methodology was used, and the factors were processed using the ArcGIS 10.3
® software [
41] licensed from the Laboratory of Environmental Geomorphology and Soil Degradation (LAGESOLOS) of the Federal University of Rio de Janeiro (UFRJ). The maps were created in the projected coordinate system Geocentric Reference System for the Americas (SIRGAS) 2000 using Universal Transverse Mercator (UTM) Projection and Zone 23 South (S) (
Figure 1).
2.1. Study Area Location
The downstream area of the Parnaíba river in Piauí state is a strip of land that lies between the geographical coordinates 5°1′20.06″ S/42°50′43.95″ W and 3°7′41.42″ S/41°55′32.98″ W, parallel to the Parnaíba river. It begins in Teresina City and stretches to the confluence of the sub-basin of the Longá river in the Buriti dos Lopes municipality. The study was carried out for this stretch, which is approximately 6075.48 km
2 in size; however, the downstream area continues to the coastal strip on the Atlantic Ocean (
Figure 2).
The climate of the region is hot and humid and the average temperature in the area is 27 °C. As for the geology, rocks emerge in this area to a greater extent in the sedimentary basin of Parnaíba and in a smaller area of the Barreiras Group (clayey siltic sandstone and conglomeratics). In terms of geomorphology, most of the area is a domain of wide and gentle hills, with the presence of a dissected plateau to the north and flattened surfaces to the south [
40,
42].
2.2. Database
The database was obtained from the United States Geological Survey (USGS). Rainfall data were acquired from Nascimento et al. (2020) [
43] and updated using the HidroWeb tool of the National Water Resources Information System (SNIRH), which is managed by the National Water Agency (ANA). These databases are as follows:
The drainage comes from the digital cartographic base of the ANA (2006) [
44];
Images with topographic data of the area were obtained from the Images Shuttle Radar Topography Mission (SRTM) at a spatial resolution of 30 m. The images were generated by cooperation among the National Aeronautics and Space Administration (NASA), the National Imagery and Mapping Agency (NIMA), the Department of Defense (DoD) of the United States of America, and the space agencies of Germany and Italy and have been made available by the United States Geological States Survey (USGS);
The vector cartographic base of the soils, in
shapefile format, was obtained from the National Spatial Data Infrastructure (INDE) website [
45] at the original scale of 1:250,000 and is associated with information on the soil profiles contained in the soil exploratory–recognition survey of Piauí State [
46].
Erosivity was surveyed by gathering monthly rainfall data [
43] and yearly rainfall data from the Rainfall Atlas of Brazil [
47] at a scale of 1:5,000,000 between 1977 and 2006. The data were updated using the HIDROWEB tool [
44] of the ANA, corresponding to Basin 3–Atlantic, North and Northeast. The rainfall stations used in this study were spatialized as shown in
Figure 3.
In this work, we obtained images from the LANDSAT-5 and LANDSAT-8 satellites that are available on the website of the United States Geological Survey (USGS) (
http://earthexplorer.usgs.gov/ accessed on 22 August 2021). Images with similar weather conditions that corresponded to the same time of the year were selected. Images from the LANDSAT-5 satellite (Thematic Mapper (TM) sensor, 30 m spatial resolution, orbit/point 219/64 and 219/63 of 29 August 2006) and the LANDSAT-8 satellite (orbit/point 219/63 and 219/62 of 22 August 2021 and 25 September 2021) were used. Visible and near/mid-infrared images with a spatial resolution of 15 to 30 m from the Operational Terra Image (OLI) sensor were used for the generation of the color compositions.
2.3. Soil Erosion Spatial Modeling
The maps were made using the USLE model [
19,
20], which seeks to quantify soil losses due to sheet erosion. This model was adapted for use in Brazil by Lombardi Neto and Moldenhauer in 1977 [
12]. This model and its variation (the RUSLE) allow us to estimate water erosion using GIS tools based on the interaction between rainfall erosivity factors, soil erodibility, landform influences, and soil cover and management. Therefore, it is widely used to estimate the average annual soil loss on large scales and presents an acceptable level of accuracy [
1,
8,
27,
48,
49]. The equation is defined as
where
is the index that represents the soil loss per unit area (t.ha
−1.year
−1),
corresponds to the rainfall erosivity (MJ mm ha
−1 h
−1 year
−1),
is the soil erodibility (t h MJ
−1 mm
−1),
indicates the slope length factor (dimensionless),
is the slope angle factor (dimensionless),
indicates the factor relative to soil use and management (dimensionless), and
corresponds to the factor relative to the conservation practice adopted (dimensionless).
The choice of the RUSLE as the main methodology is supported by its improvements over the original USLE, making it possible to apply it to large river basins. The RUSLE incorporates technological advancements such as a geographic information system (GIS) and remote sensing, allowing for a more accurate and efficient analysis of soil erosion at different geographic scales. However, we recognize some limitations, such as the sensitivity to the parameters used and the need for accurate data for effective modeling [
50,
51].
2.4. Validation
Soil erosion measurements and field data are needed to calibrate and validate erosion models in a trustworthy and accurate manner [
2,
52]. Due to the size of the area studied and the lack of extensive erosion plots, we were compelled to take a careful approach in the selection and utilization of existing data. We admit that, given the significant dimensions of the Parnaíba river basin, the implementation of erosion plots throughout the area would be challenging and impractical.
To compensate for the absence of traditional experimental data, we resorted to alternative validation methods, such as comparison with observational data (fieldwork, historical measurements, and experimental data), internal consistency analysis, comparison with previous studies, and the sensitivity of the results to variations in model parameters. These strategies are commonly employed in studies covering large river basins in order to minimize uncertainties and obtain more reliable results.
The estimation of the soil erosion in the downstream Parnaíba river area in Piauí state was calculated using the ArcGIS 10.2 Raster Calculator tool, which performs algebraic operations on raster images, enabling the generation of a soil loss potential map considering only the factors R, K, and LS. The current soil loss map was obtained by considering all of the factors of the USLE, including C and P. However, to obtain each factor of the equation, the following steps were taken.
2.5. Rainfall Erosivity Factor (R)
The rainfall erosivity factor is calculated as an average of the kinetic energy intensity values. These values are estimated from a precipitation history to identify the apparent cyclic pluviometric patterns [
20]. Some authors indicate a contribution of about 80% in soil loss [
53]. To obtain the
R factor, the following equation (E2) was used [
20], which was adapted to the natural conditions in Brazil [
12].
where
R is the erosivity in MJ.mm.h
−1.ha
−1.year
−1,
r corresponds to the total monthly average in millimeters, and
P is the total annual average of rainfall in millimeters. It is noteworthy that
r and
P were obtained from the rainfall data of the stations presented in
Figure 3. Subsequently, the rainfall erosivity values were obtained for each rainfall season. These data were interpolated using the Inverse Distance Weighted (IDW) method in the ArcGIS Spatial Analyst Tools.
2.6. Soil Erodibility Factor (K)
Erodibility is defined by the soil’s resistance to the forces of dispersion, splashing, and abrasion and the transport of soil particles by water and also considers the speed of infiltration, permeability, and water storage capacity in the soil [
10,
12,
22].
Despite the limitations to obtaining the factor
K, several researchers have developed experiments to make this factor applicable to the most varied types of Brazilian soils [
26,
54,
55,
56]. In this research, we chose to adopt the soil erodibility factors available in the literature, taking into account the soil classes in the downstream Parnaíba watershed area.
The soil map of this study was created from the Brazilian exploratory soil map [
45,
46].
K was associated with the soil classes of the study area [
46] and later interpolated by the inverse distance method, forming a matrix layer with the spatialization of the USLE erodibility factor.
Soil samples play a crucial role in understanding the complexity of soils in an area, being fundamental pieces in the diagnosis of degradation and ongoing erosive processes. This study involved the collection of disturbed samples of the A horizon at eight strategically distributed points along the basin covering several geographical conditions, including central areas, northern sectors, and southern sectors. These sites are spatialized in the soil map and, from the K factor presented in the Results section, they are numbered according to the chronological sequence of collection. The samples were analyzed at the Laboratory of Environmental Geomorphology, Maria Regina Mousinho de Meis, of the Department of Geography of the Federal University of Rio de Janeiro and at the Laboratory of the Agricultural College of the Federal University of Piauí. This approach allowed for a particle size characterization providing information on the heterogeneity of soils in the region.
The data related to the
K factor, crucial for the calculations of the Universal Soil Loss Equation (RUSLE), were obtained from the study by Aquino and Oliveira (2017) [
56]. This work outlined a detailed method for the determination of the weighted average erodibility of soil associations in Piauí state. The procedure involved the identification of representative profiles for each soil type in the soil associations based on comparisons between the characteristics presented in the soil descriptions and those of the profiles described by Jacomine (1986) [
46].
Subsequently, the erodibility calculation was performed for each soil profile, considering its contribution to the soil types in the associations. The
K values for each type were determined by the arithmetic mean of the individual values of the soils considered. The erodibility of the soil association was then calculated as a weighted average, taking into account the average erodibility of each soil type and its percentages in the association. The results obtained were grouped into classes, adapting the description of Mannigel et al. (2002) [
22], as shown in
Table 1.
2.7. Topographic Factor (LS)
In the RUSLE, the influence of topography on erosion rates can be analyzed through the
factor, where
is the length of the slope measured in meters and
is the slope angle index of the terrain expressed as a percentage [
12,
24,
25].
The development of methodologies supported by the use of a GIS and digital elevation models (DEMs) has favored the determination of the factor
in large areas, such as watersheds. This factor in this research is based on the RUSLE model employed in the methodology proposed by Moore and Burch (1986) and Engel (1999) and also applied by other researchers in the literature [
8,
9,
27,
57].
In this context, to obtain the topographic factor in a three-dimensional area, a digital elevation model (DEM) was used, combined with calculation procedures via the Raster Calculator Tool in the ArcGIS software version 10.3, which is based on Equation (3):
where
fa is the accumulated flow,
mr is the cell size of the DEM (m) (flow length), sin is the sine, and
d is the slope in radians.
2.8. Land Use, Land Cover, and Management of Conservation Practices Factor (CP)
The land use and management and conservation practices factors (
C and
P) in Equation (1) are entirely related to the land use and vegetation cover. They determine the anthropic factors of the equation [
48,
49,
58]. Factors
C and
P may vary over the years because of changes in the form and intensity of this use.
Factor C reflects the effects of the cultivation and management of conservation practices on soil erosion in agricultural areas in addition to the effect of vegetation cover on the reduction in erosion in forested areas. In this research work, this information was obtained from the analysis of landscape use.
The landscape analysis was based on the use map of the Annual Mapping of Land Use and Cover in Brazil project, Mapbiomas [
59], which was based on a mosaic of Landsat satellite images from the years 2006 and 2021. The validation of the use and coverage map was conducted using the accuracy of the data that were produced from the cross-tabulation of the sample frequencies of the mapped and real classes. The statistical result on the global accuracy of the 7.0 collection of Mapbiomas, Level 1, was 93.3% [
59].
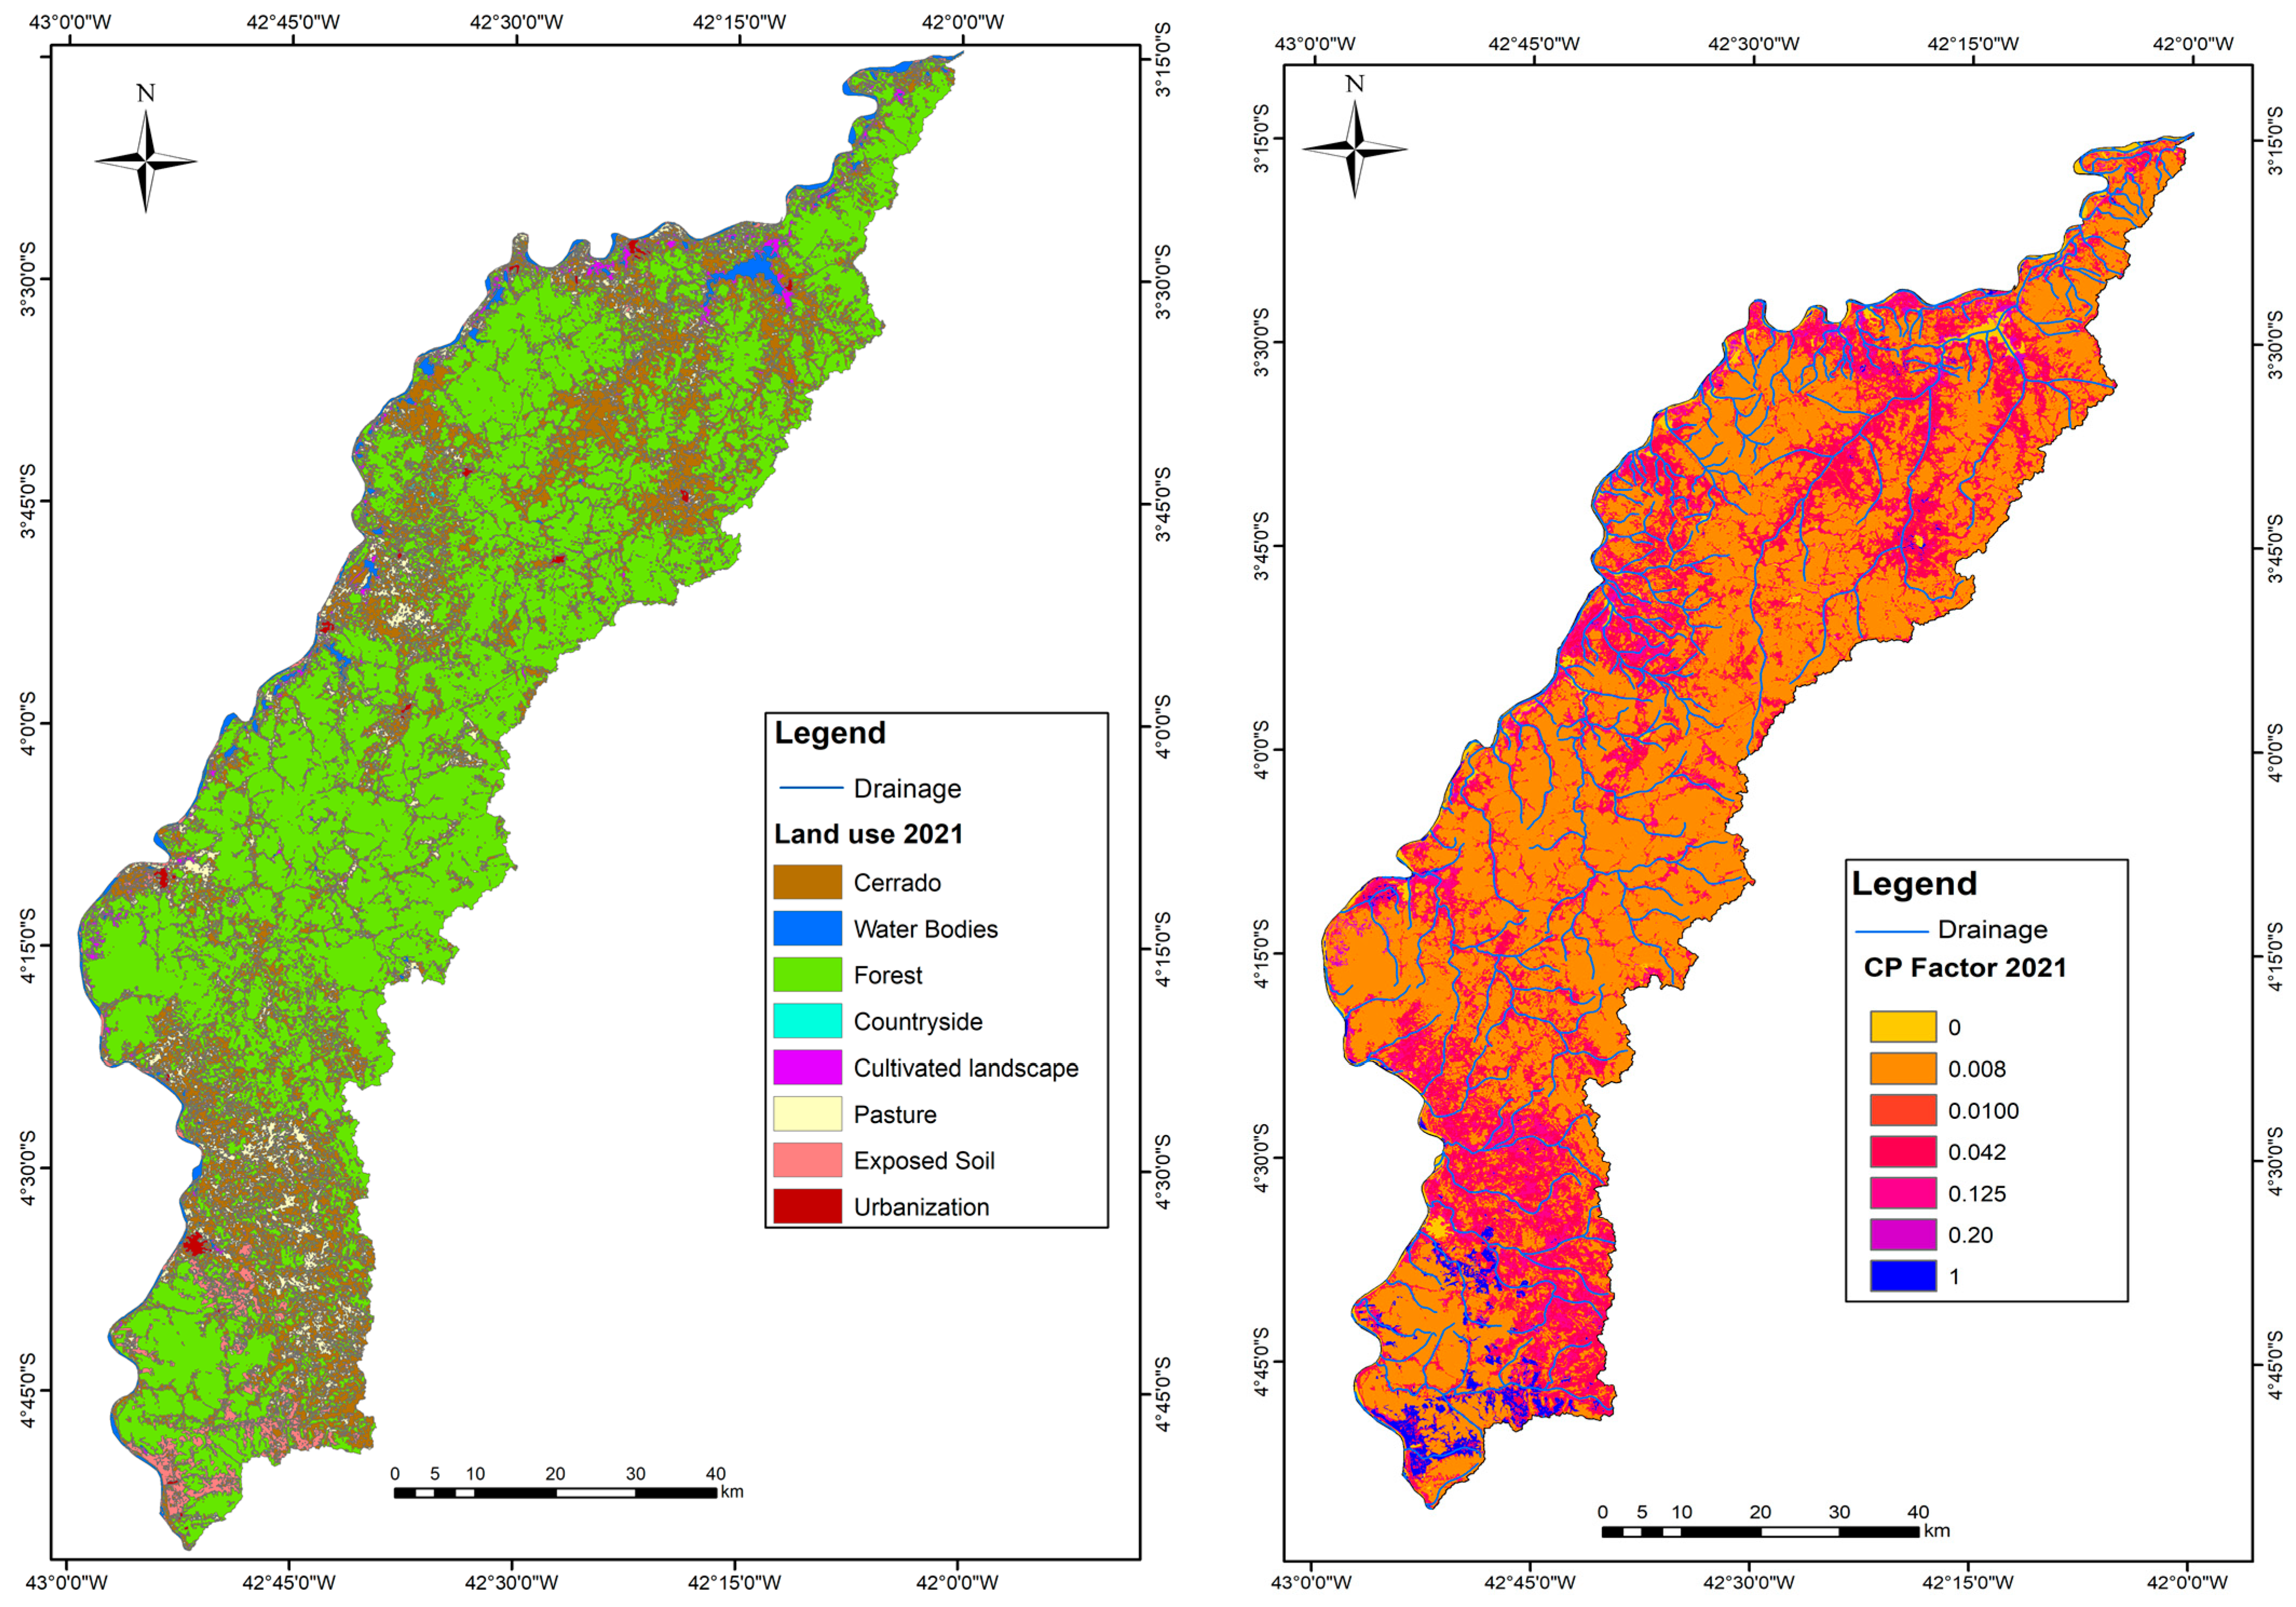
The coverage classes included in this classification were cultivated landscape, forest,
Cerrado, pasture (in this context, pasture refers to both grazing land and areas used for animal grazing), countryside, exposed soil, water bodies, and urbanization. The anthropic factors
C and
P were integrated and formed a single product (
CP) considering that the factor
P was equal to 1 as observed in the literature [
9,
57,
60,
61].
Due to the extent of the area, it was not possible to identify the conservationist practices. This choice was based on practical reasons, since obtaining detailed data on management and conservation practices across the entire length of the basin would be logistically challenging and time-consuming. We decided to focus our efforts on utilizing land use and land cover data, which are more widely available and can offer relevant insights into the spatial distribution of management practices.
The landscape sample set was analyzed based on fieldwork, an interpretation of the Landsat satellite imagery, and Google Earth Pro software 7.3.6. The samples were obtained by training the algorithm. The spatialization of the results on the CP factor is directly related to the use and vegetation cover of the downstream Parnaíba watershed area, and the indices were defined based on references with land use and vegetation cover similar to those of the study area.
2.9. Classification and Interpretation of the Results
The results on the potential erosion, which considers the factors
R,
K, and
LS, were reclassified and interpreted according to Morais and Silva (2020) [
62] and ranged from very low to very high. The results for soil loss (actual erosion) were reclassified and interpreted taking into account the data obtained for the local context as well as research on the subject [
26,
27,
61].
The actual erosion was also compared with the proposed classification of the United Nations Food and Agriculture Organization (FAO), the United Nations Environment Program (UNEP), and the United Nations Educational, Scientific and Cultural Organization (UNESCO) [
14] (
Table 2). The reclassification of the results was necessary to better understand the processes that involve potential erosion and soil loss, consider the factors of the RUSLE, make it possible to present cartographic products that help in understanding this event and the identification of areas that require the implementation of soil management and conservation practices, and, therefore, support the planning and management of water resources.
3. Results and Discussion
3.1. Erosivity (R)
The results of the rainfall erosivity analyses for the downstream Parnaíba river area reveal an average value of 9051.52 MJ.mm.h
−1.ha
−1.year
−1 and a standard deviation of 148.33, demonstrating the high erosive potential of rainfall in this region. Keeping in mind the due differences in these areas, databases, and historical series, the erosivity values in this study corroborate those obtained by Morais and Silva (2020) [
62] for the Longá river watershed, a tributary of the Parnaíba river located to the east of the study area, where the critical values ranged from 8865 to 9540 MJ.mm.h
−1.ha
−1.year
−1.
Therefore, the
R factor calculated for the Parnaíba river downstream area ranged from 7943.46 to 10,081.61 MJ.mm.h
−1.ha
−1.year
−1, with the intensity ranging from average to very strong as can be observed in
Table 3.
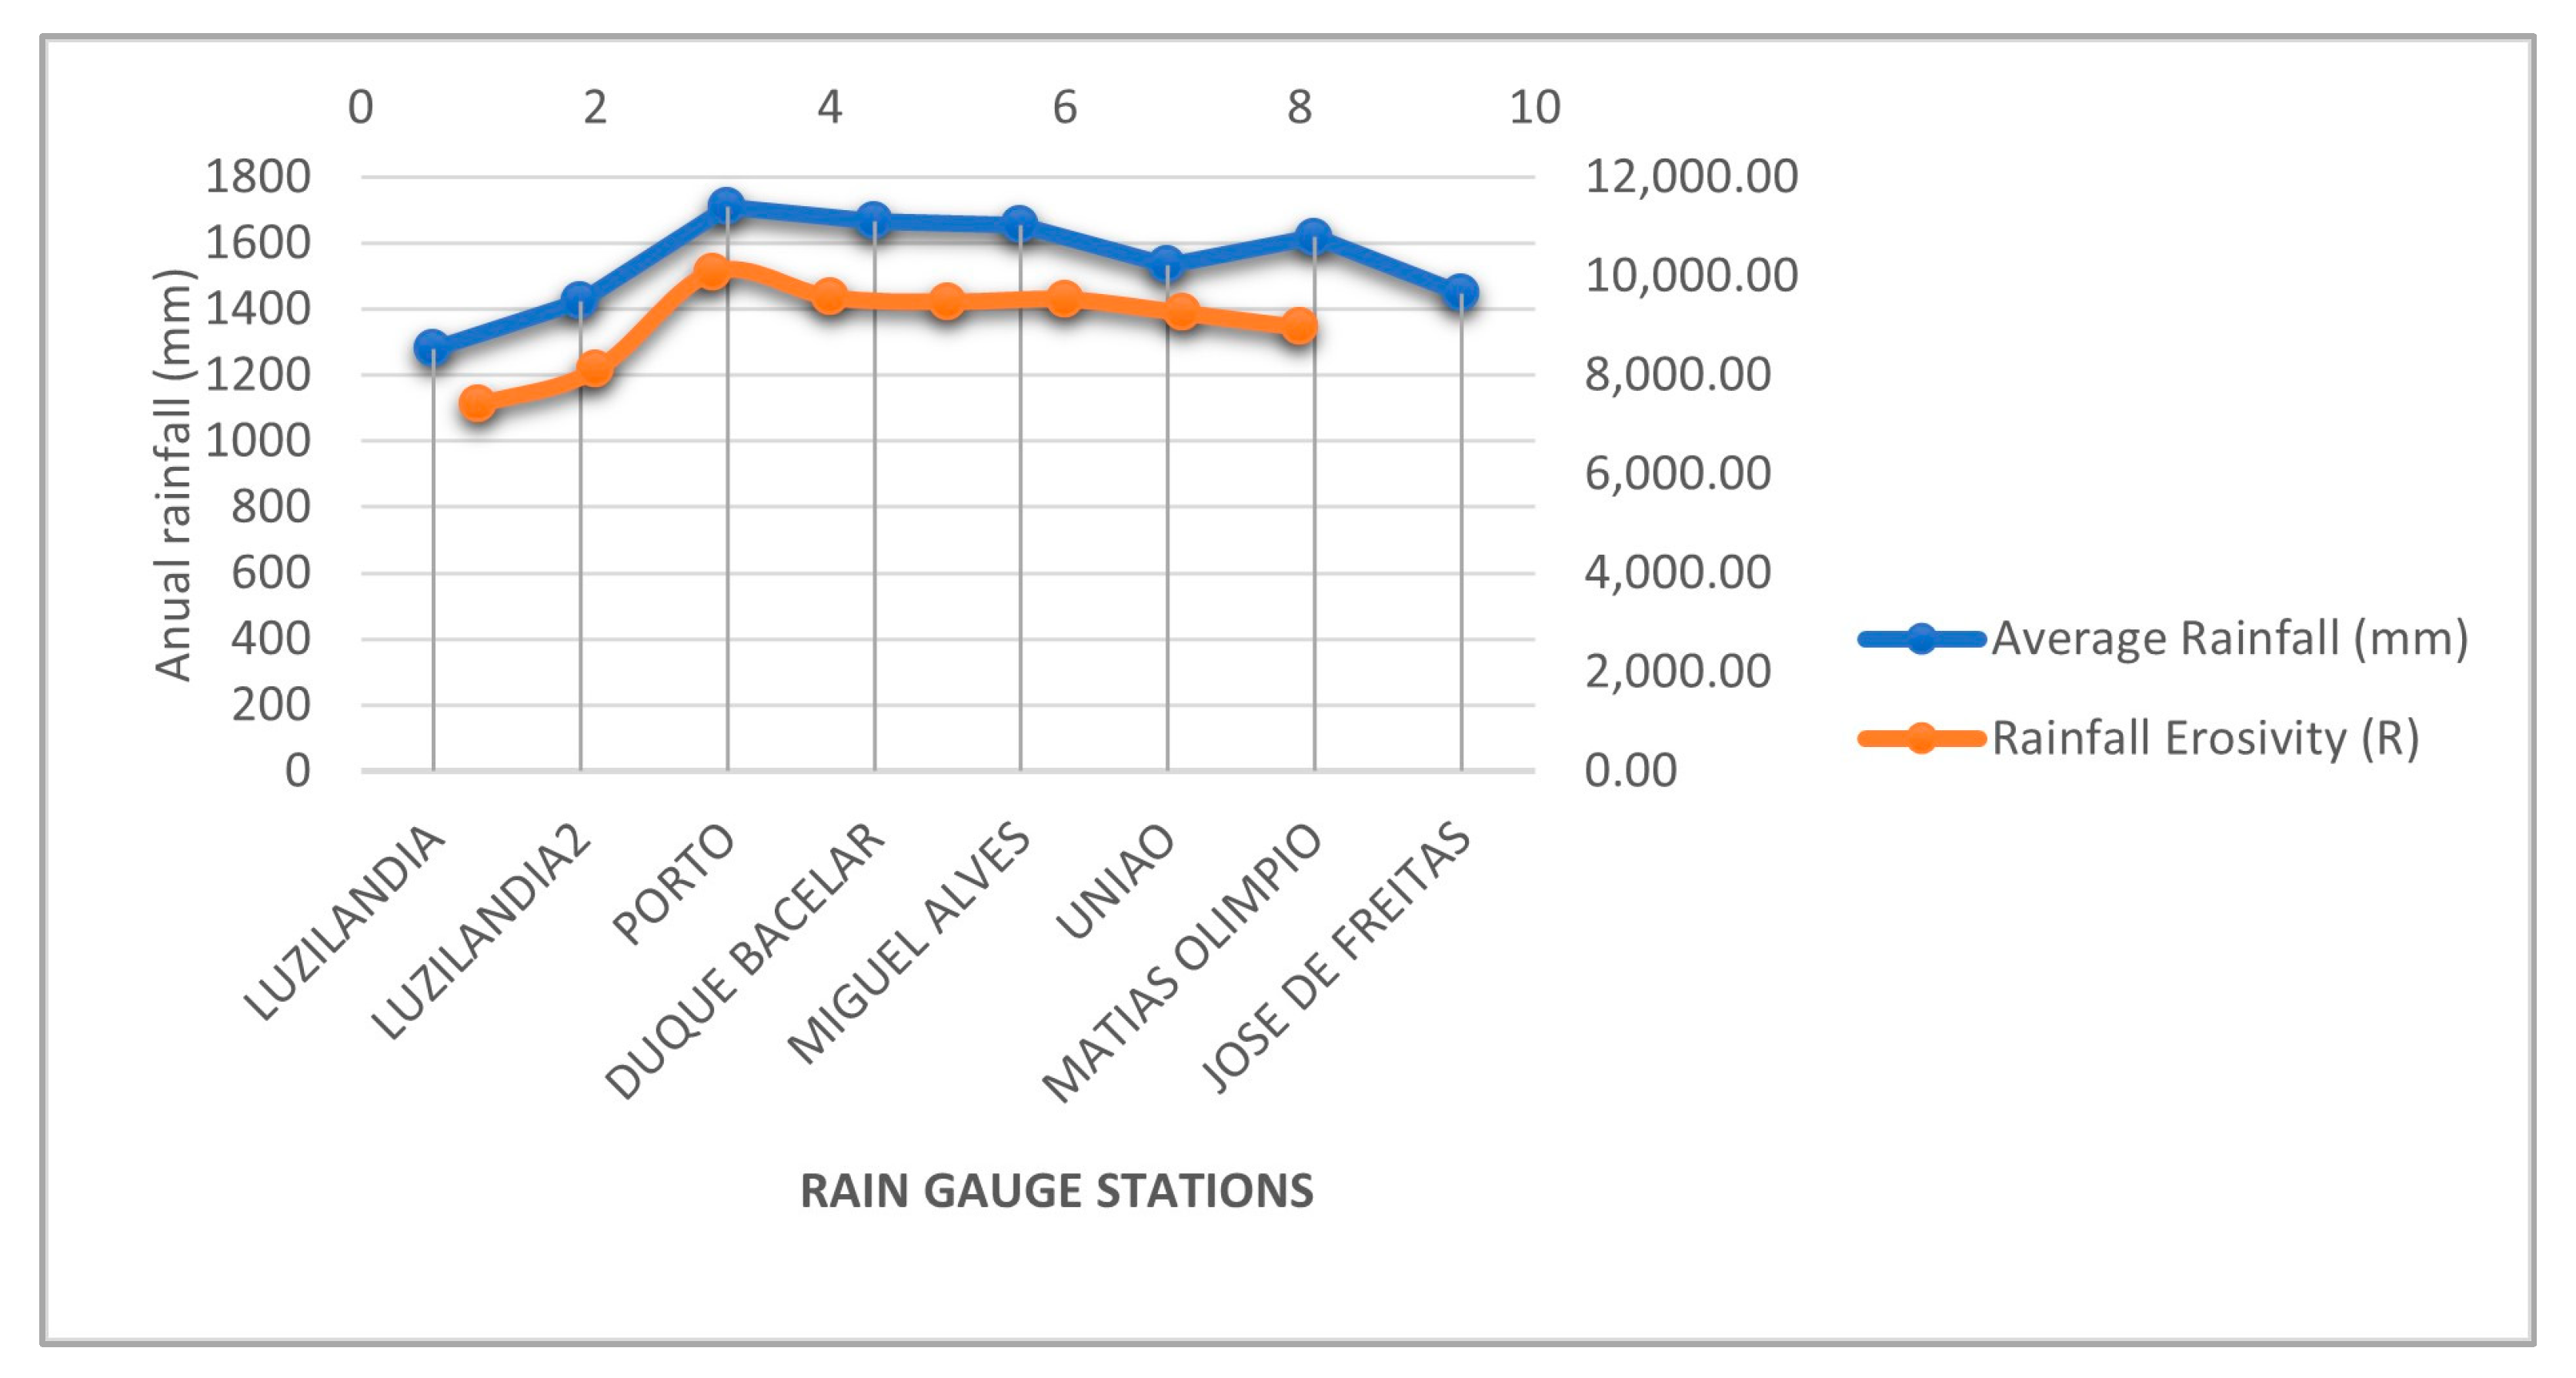
The spatialization map of the
R factor demonstrates the great spatial variability in these rains as can be observed in
Figure 4. From the data linked to the individual rains monitored by automatic and conventional stations in Piauí, [
43] highlights that, in Piauí state, the largest volumes of annual rainfall are concentrated in the north and northwest regions, reaching values higher than 1500 mm, with the months of February to August being the rainiest, verifying the high values of
R found in this research for this region. In the Parnaíba river downstream area, the specific values varied approximately from 1279 to 1710 mm as can be seen in
Figure 4.
The analysis of the monthly variation in rainfall based on the rainfall seasons in the study area reveals distinct seasonal patterns as can be seen in
Scheme 1. The months of July to November stand out as the least rainy, characterizing a drier season, while the months of January to March have the highest rainfall, configuring a wetter season. This seasonal distribution is crucial for understanding critical periods of susceptibility to erosion.
Scheme 2, which relates erosivity (the
R factor) to the average annual rainfall in the rainfall seasons, shows an interesting convergence between these two parameters. The proximity and similarity in the patterns of these lines indicate that, despite monthly variations, the erosivity remains relatively consistent throughout the year. This observation suggests an intrinsic correlation between rainfall erosivity and annual rainfall volumes. Understanding this relationship is essential to assessing the erosive potential of rainfall at different times of the year and it is essential for soil erosion prevention and control strategies.
This joint analysis of seasonal rainfall patterns and their relationship with erosivity provides a comprehensive view of the environmental conditions in the lower Parnaíba basin, contributing to a more accurate interpretation of erosion processes in the region.
3.2. Erodibility (K)
The combination of rainfall, strong erosivity, and unprotected fragile soils favors the triggering of erosive processes.
Table 4 presents the soil classes found in the Parnaíba river downstream area, followed by the erodibility values associated with their area in the basin.
The spatialization of soil classes and erodibility is shown in
Figure 5. The values of soil erodibility (factor
K) ranged from 0.025 to 0.050 t h.MJ
−1.Mm
−1 with a predominance, according to studies developed in the area [
56], of the medium to very high erodibility class. The class of Ultisols is the one with the largest area (>50%) and the highest variability in the K factor with a predominance of the high erodibility class (0.031–0.042 t h.MJ
−1.mm
−1). Areas in this class are situated in a flat to undulating relief with a slope ranging from 3 to 20%, indicating a susceptibility to erosive processes.
It can be observed that soils classified as having low erodibility, according to
Table 4 [
22], do not appear in the study area, and the middle class presents the lowest values of factor
K (
Table 4). In addition to the Ultisols class, the other soil classes that showed “very high” erodibility in the watershed are the Alfisols (7.65%) and the Mollisols (2.55%) classes. These soils reached 0.50 t h.MJ
−1.mm
−1, the maximum value of the K factor in this analysis, and are mainly located near water bodies. In the study area, these soils have an argillic subsurface horizon like those in the Ultisols class.
The soil classes with average erodibility are the Oxisols classes, which correspond to 11.50% of the area and have a K factor ranging from 0.025 to 0.035 t h.MJ−1.mm−1. It was noted that the topography directly influenced the erosive processes of these soils. The Parnaíba river downstream area is mainly formed by wide and gentle hills, a dissected plateau, and degraded flattened surfaces.
According to the map shown in
Figure 5 and
Table 4, there is a predominance of
K values located in the high and very high erodibility classes in the Parnaíba river downstream area, which corroborates studies on the
K factor developed in the area [
56] in which the authors concluded that about 94.4% of the soils in Piauí state fall into the high and very high erodibility classes.
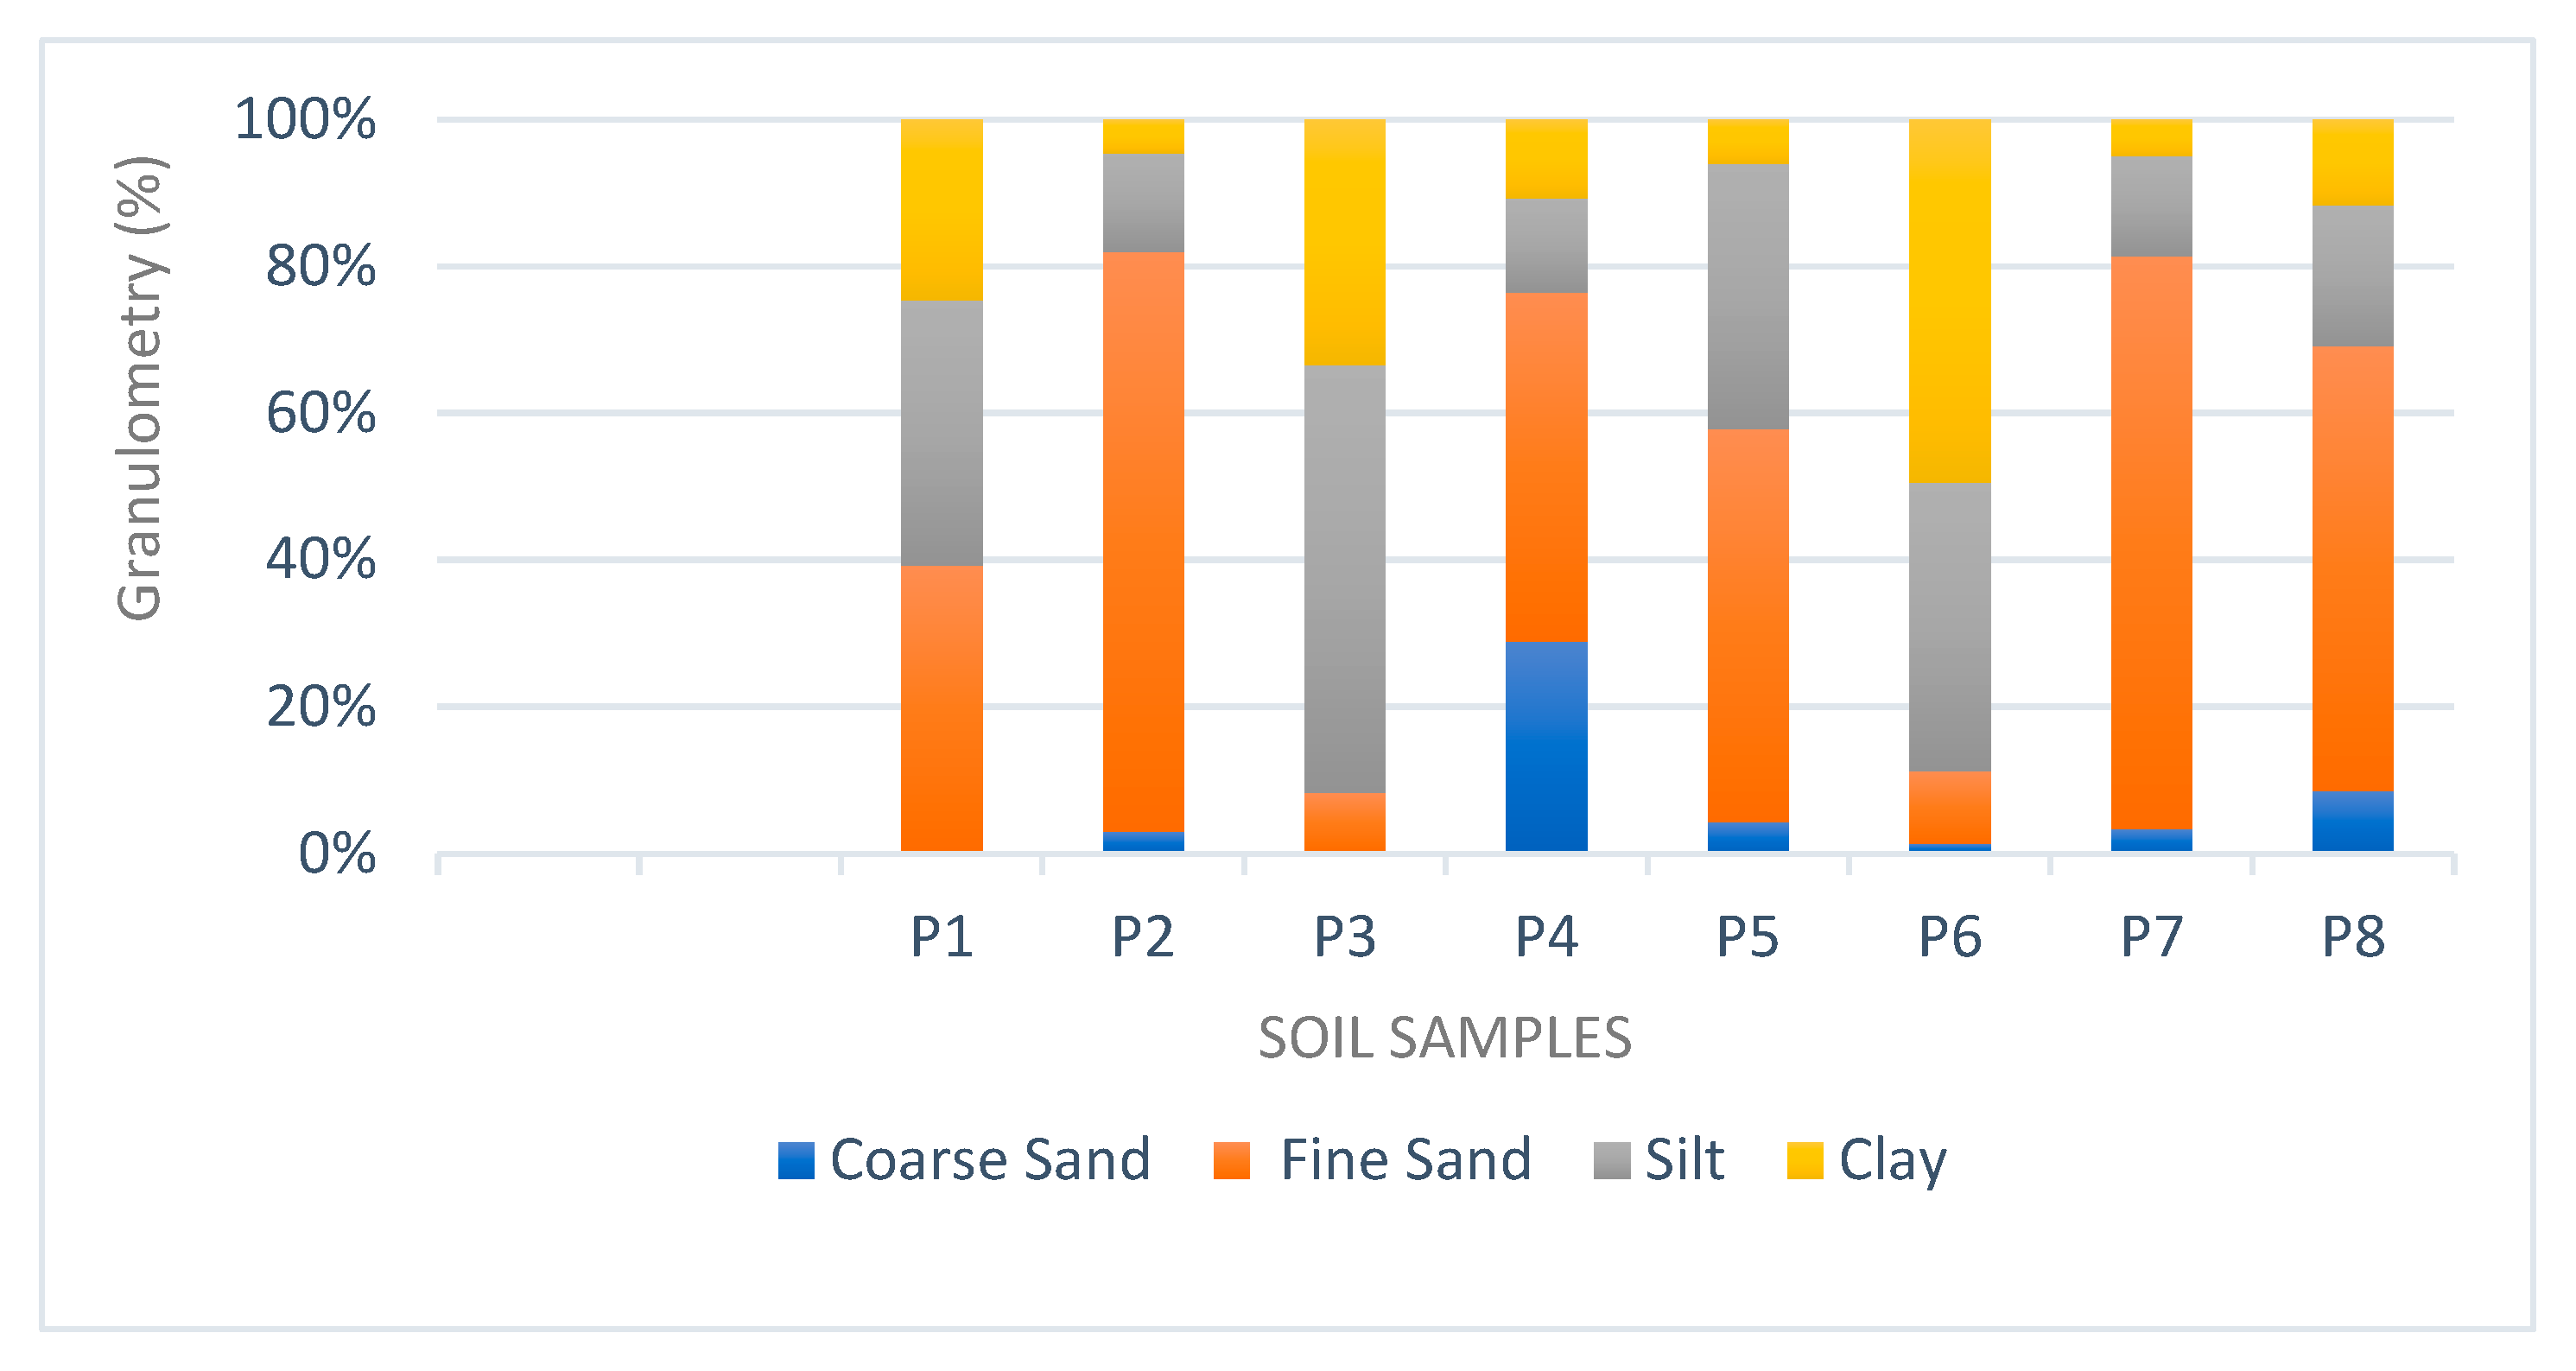
In an effort to broaden our understanding of soil variability in the watershed of the Parnaíba river downstream area, an analysis of particle size was incorporated into our investigation. Despite our recognition of the limited number of samples analyzed, the inclusion of a particle size analysis plays an important role in the characterization of soils in the region.
Scheme 3, delineating the variations in the coarse sand, fine sand, silt, and clay fractions at eight strategically selected sites, offers a more detailed view of the textures.
The variation in particle size data suggests a diversity in soil characteristics in the basin. This diversity can influence erosion processes, since different soil textures respond differently to water erosion. The presence of areas with higher coarse sand content may indicate greater permeability in these regions, while areas with more clay may have a higher water holding capacity. The spatial distribution of these different textures can contribute to a better understanding of the area’s susceptibility to erosion and support more specific management measures for each region. Further analysis is recommended, possibly through statistical techniques and more soil samples, to identify significant patterns or correlations between the contents of different soil fractions and the erosion processes observed in the area.
It is important to highlight that the inclusion of particle size data does not provide a broad representation of the entire basin, but rather a deeper understanding of soil characteristics in specific areas. This approach contributes to our understanding of soil types in the context of erosion by linking these particle size data to the analysis of the K factor of the RUSLE, and it is recognized that the collection sites are located in areas of medium to high erodibility along the basin. This perspective of a more comprehensive analysis between the physical properties of soils and erosive processes places our investigation on a more solid basis for soil characterization in the watershed of the Parnaíba river downstream area.
3.3. Topographic Factor (LS Factor)
The
LS factor, as previously mentioned, can be estimated through field measurements or with a digital elevation model (DEM), which reconciles the length factors of the
L ramp with the slope
S. In this context, the
L factor represents a linear dimension that theoretically indicates a distance corresponding to the beginning of the formation of the flow (the Hortonian flow) to the point where it finds a favorable condition for the deposit of sediment or a channel [
7,
24,
27,
58].
The
LS values ranged from 0.01 in the parts with the lowest slope to 3.0 in the parts with the steepest slope, but the areas with an
LS factor value between 0.6 and 3.0 accounted for only 0.01% of the entire area, in which 80.75% obtained an
LS factor between 0 and 0.01. In addition, 18.55% of the watershed presented an
LS factor between 0.01 and 0.08. Therefore, a large part of the basin presents areas with a decrease in erosive potential (
LS < 1) as can be seen in
Table 5.
Therefore, it is possible to notice that the
LS is higher in the steeper areas with longer ramp lengths and lower LS values appear in areas of gentle relief, such as in the vicinity of the drainage network. The spatialization of the
LS factor can be observed in
Figure 3 [
24,
27,
48].
In terms of spatialization, the highest values of the factor LS (0.2–3.0, dimensionless) occur in a mixed manner throughout the watershed, concentrating more in the central-south region. These values are related to areas of wavy to strong undulating relief with wide and smooth hills and flattened and conserved surfaces further south of the basin as shown in
Figure 6.
The spatial distribution of the LS factor showed that a large part of the basin has LS values less than 1, indicating a low influence of the factor on potential and current erosion. From the results obtained, it can be observed that less than 1% of the basin presented LS values greater than 1; however, in the field, we observed the presence of sloped areas that are influenced by the topographic dividers of the diffuse watershed of Parnaíba river acting on the dynamics of erosive processes.
3.4. Land Use and Coverage (CP Factor)
The spatialization of the results on the
CP factor is directly related to the land use and land cover in the watershed of the Parnaíba river downstream area, northwest of Piauí state. The indices were defined based on references with land use and vegetation cover similar to those of the study area. Therefore, the values related to the land use and cover and management and soil conservation practices (factor
CP) vary between 0 and 1 as per [
9,
12,
26,
64,
65,
66].
In the validation of the classification of land use and coverage, the statistical result on the global accuracy of the 7.0 collection of Mapbiomas, Level 1, was 91.3% [
59]. The lowest values are related to the conditions of non-exposure of the soil, such as zero
CP, or low exposure (low
CP) to erosive processes, such as paved highways, rural and urban construction, and native vegetation, such as forests. The highest values are related to the classes where the soil is most exposed to water erosion, such as pasture, cultivated land, and bare soils.
The spatialization of the
CP factor in 2006 indicates that the categories with zero and low
CP values can be observed in several localities from the north to the south of the watershed and correspond to approximately 64.56% of the total area. The most significant values are associated with cultivated land, pasture, and the
Cerrado biome (35.9%). It is noteworthy that the
Cerrado of Piauí witnessed an expansion of land uses for agriculture, pasture, and non-vegetated areas. Since 1990, the transformation of the landscape of the
Cerrado biome has intensified, changing by more than 409,000 hectares between the years 2010 and 2019 (
Table 4,
Figure 7) [
13].
In 2021, there was a change in the distribution of the
CP factor compared with 2006. The most representative values increased in proportion in relation to the total area, such as pasture (in 2021 it was 5.34%, whereas in 2006 it was 1.36%), corroborating the discussion presented before [
13] on agricultural expansion in the
Cerrado of Piauí. Its total area in the basin decreased from 32.01% in 2006 to 26.55% in 2021. Another significant change observed was in the maximum
CP corresponding to the exposed soil (CP = 1), which in 2006 was 0.35% and in 2021 was 2.09%. Therefore, the data verify the scenario of degradation of the
Cerrado and the increase in the probability of the occurrence of erosive processes due to the greater soil exposure (
Table 6,
Figure 8).
Keeping in mind the different scales of analysis of land use and land cover, it is noteworthy that similar results were obtained in the upstream region of the Parnaíba watershed in the Piauí–Maranhão states [
26]. The reference highlights land use and vegetation density type as important factors that react to erosion and sediment transport [
13,
57,
64].
3.5. Estimation of Potential Soil Erosion and Actual Erosion in the Watershed of the Parnaíba River Downstream Area, Northwest of Piauí State
Erosive processes are events that occur naturally, but they can be intensified by human activity [
10,
11]. In this sense, the analysis of natural factors makes factors such as erodibility (factor
K), erosivity (factor
R), and the topographic factor (factor
LS) essential to studies on soil loss. Despite any limitations to the method, this analysis helps us interpret the influence of these elements on water erosion.
The natural potential for soil erosion ranged from very low (61.13%) to very high (2.06%). The predominant areas for the occurrence of potential erosion in the watershed are areas of potential fragility in the “very low” class, followed by areas with low, moderate, high, and very high erosion potential. The latter class obtained values greater than 1600 t.ha
−1.year
−1 of potential soil loss, with an average loss of approximately 4.13 t.ha
−1.year
−1 as shown in
Table 7 and
Figure 9.
In general, the basin presented relatively low natural erosion potential, resembling the topographic factor (
LS) of the region and presenting a low level of correlation with soil types present in the area, which are sandier and have high erodibility. Despite this scenario, it is important to highlight that the occurrence of reliefs with escarpments is a condition that will always result in high values for the
LS factor, devaluing the influence of factor
K and rainfall erosivity (factor
R), which are recognized for their significant role in triggering erosive processes [
54,
62,
67].
Actual erosion indicates the soil losses that occur due to water erosion and considers the potential erosion and the current conditions of land use, that is, the values of the
CP factor. In this study, these conditions were analyzed from the temporal dynamics of the years 2006 and 2021. Due to the limitations of the method for large areas, the data were analyzed qualitatively [
9].
Soil loss, indicated by the actual erosion in the watershed of the Parnaíba river downstream area, ranged from 0.01 t.ha
−1.year
−1 to >100 t.ha
−1.year
−1. According to the adapted interpretation table [
68], there was a predominance of areas with soil loss in the light category in 2006, with 71.82% of the total area and 4.21% in the areas corresponding to the high, very high, and extremely high categories, and an actual mean erosion of approximately 0.0816 t.ha
−1.year
−1 in 2006 and 0.164 in 2021. It is important to highlight that the widely accepted limits of average soil formation lie between 0.3 and 1.4 t.ha
−1.year
−1 [
2]. This means that, in this context, the actual erosion in the study area does not pose a major threat to the landscape. This variation indicates that the soil use characteristics of the basin, together with the physical characteristics, indicate different areas with greater or lesser susceptibility to soil loss (
Table 8 and
Figure 10).
In 2021, there was an increase in the erosion in the “moderate–high” classes that corresponded to 16.17% of the total area. The high erosion class also increased to 2.05% with soil loss ranging from 0.5 to 1 t.ha
−1.year
−1. There was also a decrease in the area considered to have “little” erosion, which was in the range of 0.01 t.ha
−1.year
−1 and in this case corresponded to 46.47% of the studied area. This indicates a change in the land use over the years in order to favor an increase in areas with greater fragility to the occurrence of erosive processes, such as pasture, cultivated, and urban areas, that influence the dynamics of physical factors and increase the risk of erosion [
9,
11,
61].
It was found that, between the years 2006 and 2021, there was a considerable difference in the moderate soil loss class (in 2006 it was 14.84 and in 2021 it was 32.41%) as well as the “moderate–high” class that had an increase of 3.55% between the years 2006 and 2021. This may be directly related to the loss of areas with little soil loss as mentioned earlier.
The analysis of data on the sediment yield and transport in the Parnaíba river watershed offers a valuable analytical perspective on erosion processes in the region. The data provided in the article by Morais (2015) [
69], which highlights the upper sector of the Parnaíba River basin (downstream) as the main source of sediment with a specific production of 94.8 t/km
2/year, are complementary and benefit the discussion of the results obtained by the RUSLE.
These data provide an empirical validation of the RUSLE estimates, confirming that, in fact, the Parnaíba River downstream area is a significant source of sediment. The difference between the specific sediment yield and the soil losses indicated by the RUSLE suggests that, while the region contributes substantially to the total sediment load, most of it can be transported without causing significant soil losses in the immediate production area.
The joint analysis of these data allows for the identification of critical areas where the sediment yield is more intense, but the soil loss remains relatively low. These areas can be strategic targets for management practices aimed at reducing the sediment yield without compromising the productive capacity. The difference between the sediment yield and soil losses underscores the importance of addressing not only local production erosion, but also transport and deposition processes throughout the basin.
In view of the above, it was observed that the geomorphological conditions of the watershed of the Parnaíba river downstream area, interpreted from the behavior of the topographic factor (
LS), the erosive potential of rainfall, and the fragility of soils to erosion, are directly related to the occurrence of water erosion [
54,
62,
67]. This indicates that land use is a factor that influences this issue and should be monitored in order to preserve its quality and minimize its exposure to the direct impact of the heavy rainfall to which the area is predisposed [
8,
9,
10,
26,
48].
Figure 11 and
Figure 12 present examples of soil losses identified by the RUSLE, such as surface erosion and the presence of gullies, in areas with highly erodible soil, such as Ultisols and Entisols, respectively.
In the context of the landscape units, it can be seen from
Figure 13 that, in this area, there is a predominance of flattened surfaces, preserved, degraded, broad, and smooth hills, and plateaus. The erosive features P1 and P2, spatialized in this map, are in flattened and degraded and conserved surface areas, respectively. These units correspond to horizontalized surfaces resulting from erosive actions. They represent the inheritance of previous surfaces and are witnesses to the evolution of the reliefs created by internal dynamics (tectonism, volcanism) that are also known as peneplanes, pediplanes, or ultiplanes. As previously highlighted, they are associated with Ultisols and Oxisols [
70,
71].
The erosive features P3 and P4 are in domains of broad and smooth hills that, according to Pelech et al. (2019) [
72], are convex top structures with low values of drainage density and incision deepening. These areas are also associated with sandy loam soils and a deficiency in organic matter, making them prone to erosive processes.
The erosive features P5 and P6 are situated in areas bordering the domain of broad hills and fluvial or fluvial–lacustrine plains. These areas are characterized as transition environments between aquatic and terrestrial environments, which are periodically flooded, where the Mollisols class occurs [
73]. These geomorphological features play an important role in our understanding of the erosion dynamics presented by the RUSLE.
The analysis using the RUSLE to determine the potential for soil loss associated with the GIS allowed us to verify the impact that some activities may have on the dynamics of erosive processes and the consequent soil loss in the basin, which can result in a decrease in fertility, nutrient loss, and the siltation of water bodies. Soil removal can negatively affect the ecosystem’s natural dynamics, destroying natural habitats and causing biodiversity losses.
In view of the analyses and discussions presented, it will be important to continue investigations into the Parnaíba river downstream area, aiming at improving our understanding of erosive processes and the effectiveness of management practices. We propose, for future research, to carry out more detailed studies on soil and vegetation conservation practices in different areas of the basin, considering the climate variability and specific factors that influence erosion. In addition, an evaluation of the effectiveness of erosion control strategies, such as the implementation of sustainable agricultural practices and conservation measures, could contribute significantly to the development of policies and actions more targeted at the preservation of natural resources in the region.
4. Conclusions
The RUSLE, when adjusted to the GIS environment, showed satisfactory results in the estimation of the potential erosion in large basins and efficiency in the integration of data in order to identify areas prone to erosion. Soil loss is a factor that influences the environmental fragility of a region since degradation directly affects the natural balance of the ecosystem.
The quality of the soil affects the economic system in the municipalities that make up the watershed of the Parnaíba river downstream area because the impoverishment of the soil impairs food production due to the loss of the surface layer that concentrates the largest amount of nutrients and organic matter, which are primordial elements in the maintenance of this suitability.
The method used to obtain the factors R and LS produced adequate results in terms of the values obtained, especially regarding the spatial representation through mapping, which allowed for a better appreciation of erosion classes. The maps of potential erosion and actual erosion allowed for the identification of areas at risk of accelerated erosion, giving the government insights for spatial planning in order to prioritize soil conservation and the water in the watershed of the Parnaíba river downstream area.
The potential erosion in the watershed ranged from “very low” in areas with smooth reliefs and close to the drainage yield and “very high” in topographic dividers of watercourses and areas with more rough reliefs; so, the most critical areas, with respect to erosive potential, were areas associated with higher altitudes.
The results on the actual erosion indicate a predominance of the class of “little” erosion, but a decrease in this area was observed over the years. Classes such as “moderate–high”, “high”, and “very high” increased in terms of area in 2021 compared with 2006, indicating changes in land use that favor an increase in vulnerability to the occurrence of erosive processes. These changes are associated with the loss of areas such as forest and native vegetation areas, an increase in pasture and cultivated areas, and population growth in urban and rural areas.
Sites with visible erosive features, such as rills and gullies, were identified along the basin in both urban and rural areas, mainly verifying the K factor, which indicated soils with a high probability of being eroded. Some of these features were located near highways and others near residences, indicating imminent danger to the surrounding population.


 ,
, 


