Article

A Meteorological Drought Migration Model for Assessing the Spatiotemporal Paths of Drought in the Choushui River Alluvial Fan, Taiwan

Department of Resources Engineering, National Cheng Kung University, Tainan 701, Taiwan
*
Author to whom correspondence should be addressed.
Geosciences 2024, 14(4), 106; https://doi.org/10.3390/geosciences14040106
Submission received: 30 January 2024 / Revised: 4 April 2024 / Accepted: 17 April 2024 / Published: 19 April 2024

Abstract

:
Understanding drought evolution and its driving factors is crucial for effective water resource management and forecasting. This study enhances the analysis of drought probability by constructing bivariate distributions, providing a more realistic perspective than single-characteristic approaches. Additionally, a meteorological drought migration model is established to explore spatiotemporal paths and related characteristics of major drought events in the Choushui River alluvial fan. The results reveal a significant increase in the probability of southward-moving drought events after 1981. Before 1981, drought paths were diverse, while after 1981, these paths became remarkably similar, following a trajectory from north to south. This is primarily attributed to the higher rainfall in the northern region of the Choushui River alluvial fan from February to April, leading to a consistent southward movement of drought centroids. This study proposes that climate change is a primary factor influencing changes in the spatiotemporal paths of drought. It implies that changes in rainfall patterns and climate conditions can be discerned through the meteorological drought migration model. As a result, it provides the potential for simplifying drought-monitoring methods. These research findings provide further insight into the dynamic process of drought in the Choushui River alluvial fan and serve as valuable references for future water resource management.

1. Introduction

According to the 2022 Emissions Gap Report from the United Nations Environment Program [1], the current temperature increase may reach 2.4–2.6 °C by the end of this century. Rising temperatures will have a devastating impact on the global environment, leading to an increase in the frequency of natural extreme events, such as heatwaves, floods, and droughts. What is even more challenging to adapt to is the abrupt transition from one extreme event to another [2]. Rapid changes in extreme events will have a more pronounced impact on society and the economy, potentially causing devastating damage. Therefore, it becomes crucial to explore the relationship between climate change and extreme events [3].
Drought is one of these extreme events which leads to greater economic losses compared to other natural disasters [4]. This phenomenon is observed worldwide and tends to recur. It has adverse effects on water resources [5], agricultural production [6], ecosystems [7], and human health [8]. Droughts are typically classified into four types [9,10], including meteorological drought, hydrological drought, agricultural drought, and socioeconomic drought. Among them, meteorological drought is determined by the dryness of a region, usually caused by prolonged insufficient rainfall. It tends to precede and lead to the occurrence of the other three types of drought. The identification and characterization of drought events are essential prerequisites for drought frequency analysis and spatiotemporal variability analysis. However, accurate identification and characterization of drought events still face significant challenges [11]. Since the definition of drought is difficult to unify across different regions, establishing robust drought indices is crucial for the identification and characterization of drought events [10,12]. Over the past few decades, various meteorological drought indices, such as the Standardized Precipitation Index (SPI) [13], the Palmer Drought Severity Index (PDSI) [14], and the Standardized Precipitation Evapotranspiration Index (SPEI) [15], have been continually developed. Among these indices, the SPI is widely employed in various studies. Despite criticism for its assumption of the dominance of precipitation in drought impact, SPI remains widely used due to its flexibility in time scale, straightforward calculation, and comparability across different climatic regions [16,17]. On the other hand, the Palmer Drought Severity Index (PDSI) is a drought index based on the balance between water supply and demand. It is heavily influenced by current climatic conditions, and the parameters needed for its calculation are obtained from meteorological data. However, its applicability to other regions may be limited, and adjustments may be necessary based on the specific conditions of the study area. Additionally, the SPEI is based on SPI, incorporating potential evapotranspiration (PET) for assessment. Under conditions of global warming, the SPEI is considered to be more effective in monitoring actual drought conditions. However, calculating PET can be challenging due to its involvement of multiple factors [18]. Results obtained from different PET calculation formulas may vary widely, and there is also a risk of overestimating the influence of a certain factor [19]. Because the SPEI requires a significant amount of data, its uncertainty and complexity far exceed that of the SPI, which can be calculated solely based on precipitation data. In Taiwan, many studies have used the SPI to analyze drought characteristics [20,21] and establish drought warning systems [22], demonstrating the reliability of the SPI in studying meteorological drought in Taiwan. For this study, the SPI was chosen for drought analysis due to its convenience and accuracy in data acquisition, as well as its recognized sensitivity in identifying extreme drought events in previous studies [23,24,25].
Examining the probability characteristics of drought performance is an important method for understanding water resource scarcity [26]. Current drought studies often employ univariate frequency analysis to quantify the probability characteristics and magnitude of drought, providing valuable insights into the severity and likelihood of drought events. However, this approach overlooks the fact that extreme events are typically multivariate rather than univariate. Since defining multivariate distributions is challenging and comes with high uncertainty, this study employs copula functions to establish the joint distribution of bivariate drought characteristics. Copula functions offer the advantage of independently selecting appropriate marginal distributions for two drought variables. They also allow for the choice of suitable models to capture the dependency relationship between the two [27]. Compared to other bivariate functions, such as bivariate normal distribution [28,29], bivariate gamma distribution [30], bivariate exponential distribution [31], and bivariate extreme value distribution [32,33], Copula functions exhibit superior flexibility and fitting performance.
Currently, drought-monitoring methods mainly involve analyzing the time series of drought indices to investigate drought conditions in specific regions. However, these simplified methods can only independently discuss the temporal and spatial changes of drought and cannot describe the spatiotemporal structure of drought [19]. In order to track spatial drought in real time and enhance our understanding of the spatiotemporal development of drought, it is essential to conduct research on key drought characteristics including duration, intensity, and spatial extent [12,19,34]. Based on these studies, an analytical framework for the spatiotemporal dynamics of drought can be formed to obtain information on the spatiotemporal paths of drought. This analytical framework identifies the drought status of each grid by dividing the study area into multiple grids, calculating drought indicators in the spatial context, and establishing their thresholds. The overall dynamic behavior of drought in the study area can be described according to the spatial migration path of drought clusters, onset and end time, and drought characteristics [35,36]. While this method has found extensive application in large-scale analyses, its effectiveness in capturing the spatiotemporal evolution characteristics at relatively smaller spatial scales remains a challenge. Zhou et al. [37] proposed a drought migration research method based on topological spatial relationships, which effectively analyzed the spatial clusters, migration trajectories, and migration directions of meteorological droughts in the Poyang Lake Basin, China. However, the drought cluster identification method (DCI) used in their study tends to be complex in calculation and is often subject to limitations imposed by parameters and conditional assumptions. Therefore, Han et al. [38] proposed a drought migration model to characterize the spatiotemporal distribution characteristics of drought and describe the process of drought characterized by the track, path, direction, and velocity of gravity migration under the unconditional assumption. It not only analyzes the factors affecting agricultural drought through spatiotemporal dynamic migration of the drought centroids in the Loess Plateau but also provides a reference for agricultural drought early warning, prevention, and mitigation of drought losses in the Loess Plateau from the perspective of time and space.
Describing the spatiotemporal evolution (paths, directions, etc.) of drought not only helps us understand its development process and driving force but also allows for further improvements in drought-monitoring methods, thereby reducing the impact of drought [12,35,38]. However, the current drought research in Taiwan focuses on evaluating the characteristics of drought through different drought indicators, and the grasp of the spatiotemporal development and path characteristics of drought is still insufficient. Therefore, to enhance insights into the spatiotemporal development of drought, this study employs the Standardized Precipitation Index to identify the temporal and spatial characteristics of drought events. Through a two-dimensional copula function, it establishes the joint probability distribution of extreme drought coverage and duration to select major drought events. Subsequently, this study conducts an in-depth analysis of the frequency distribution, spatiotemporal paths, and degree of variation in major drought events through the implementation of a meteorological-based drought migration model.

2. Materials and Methods

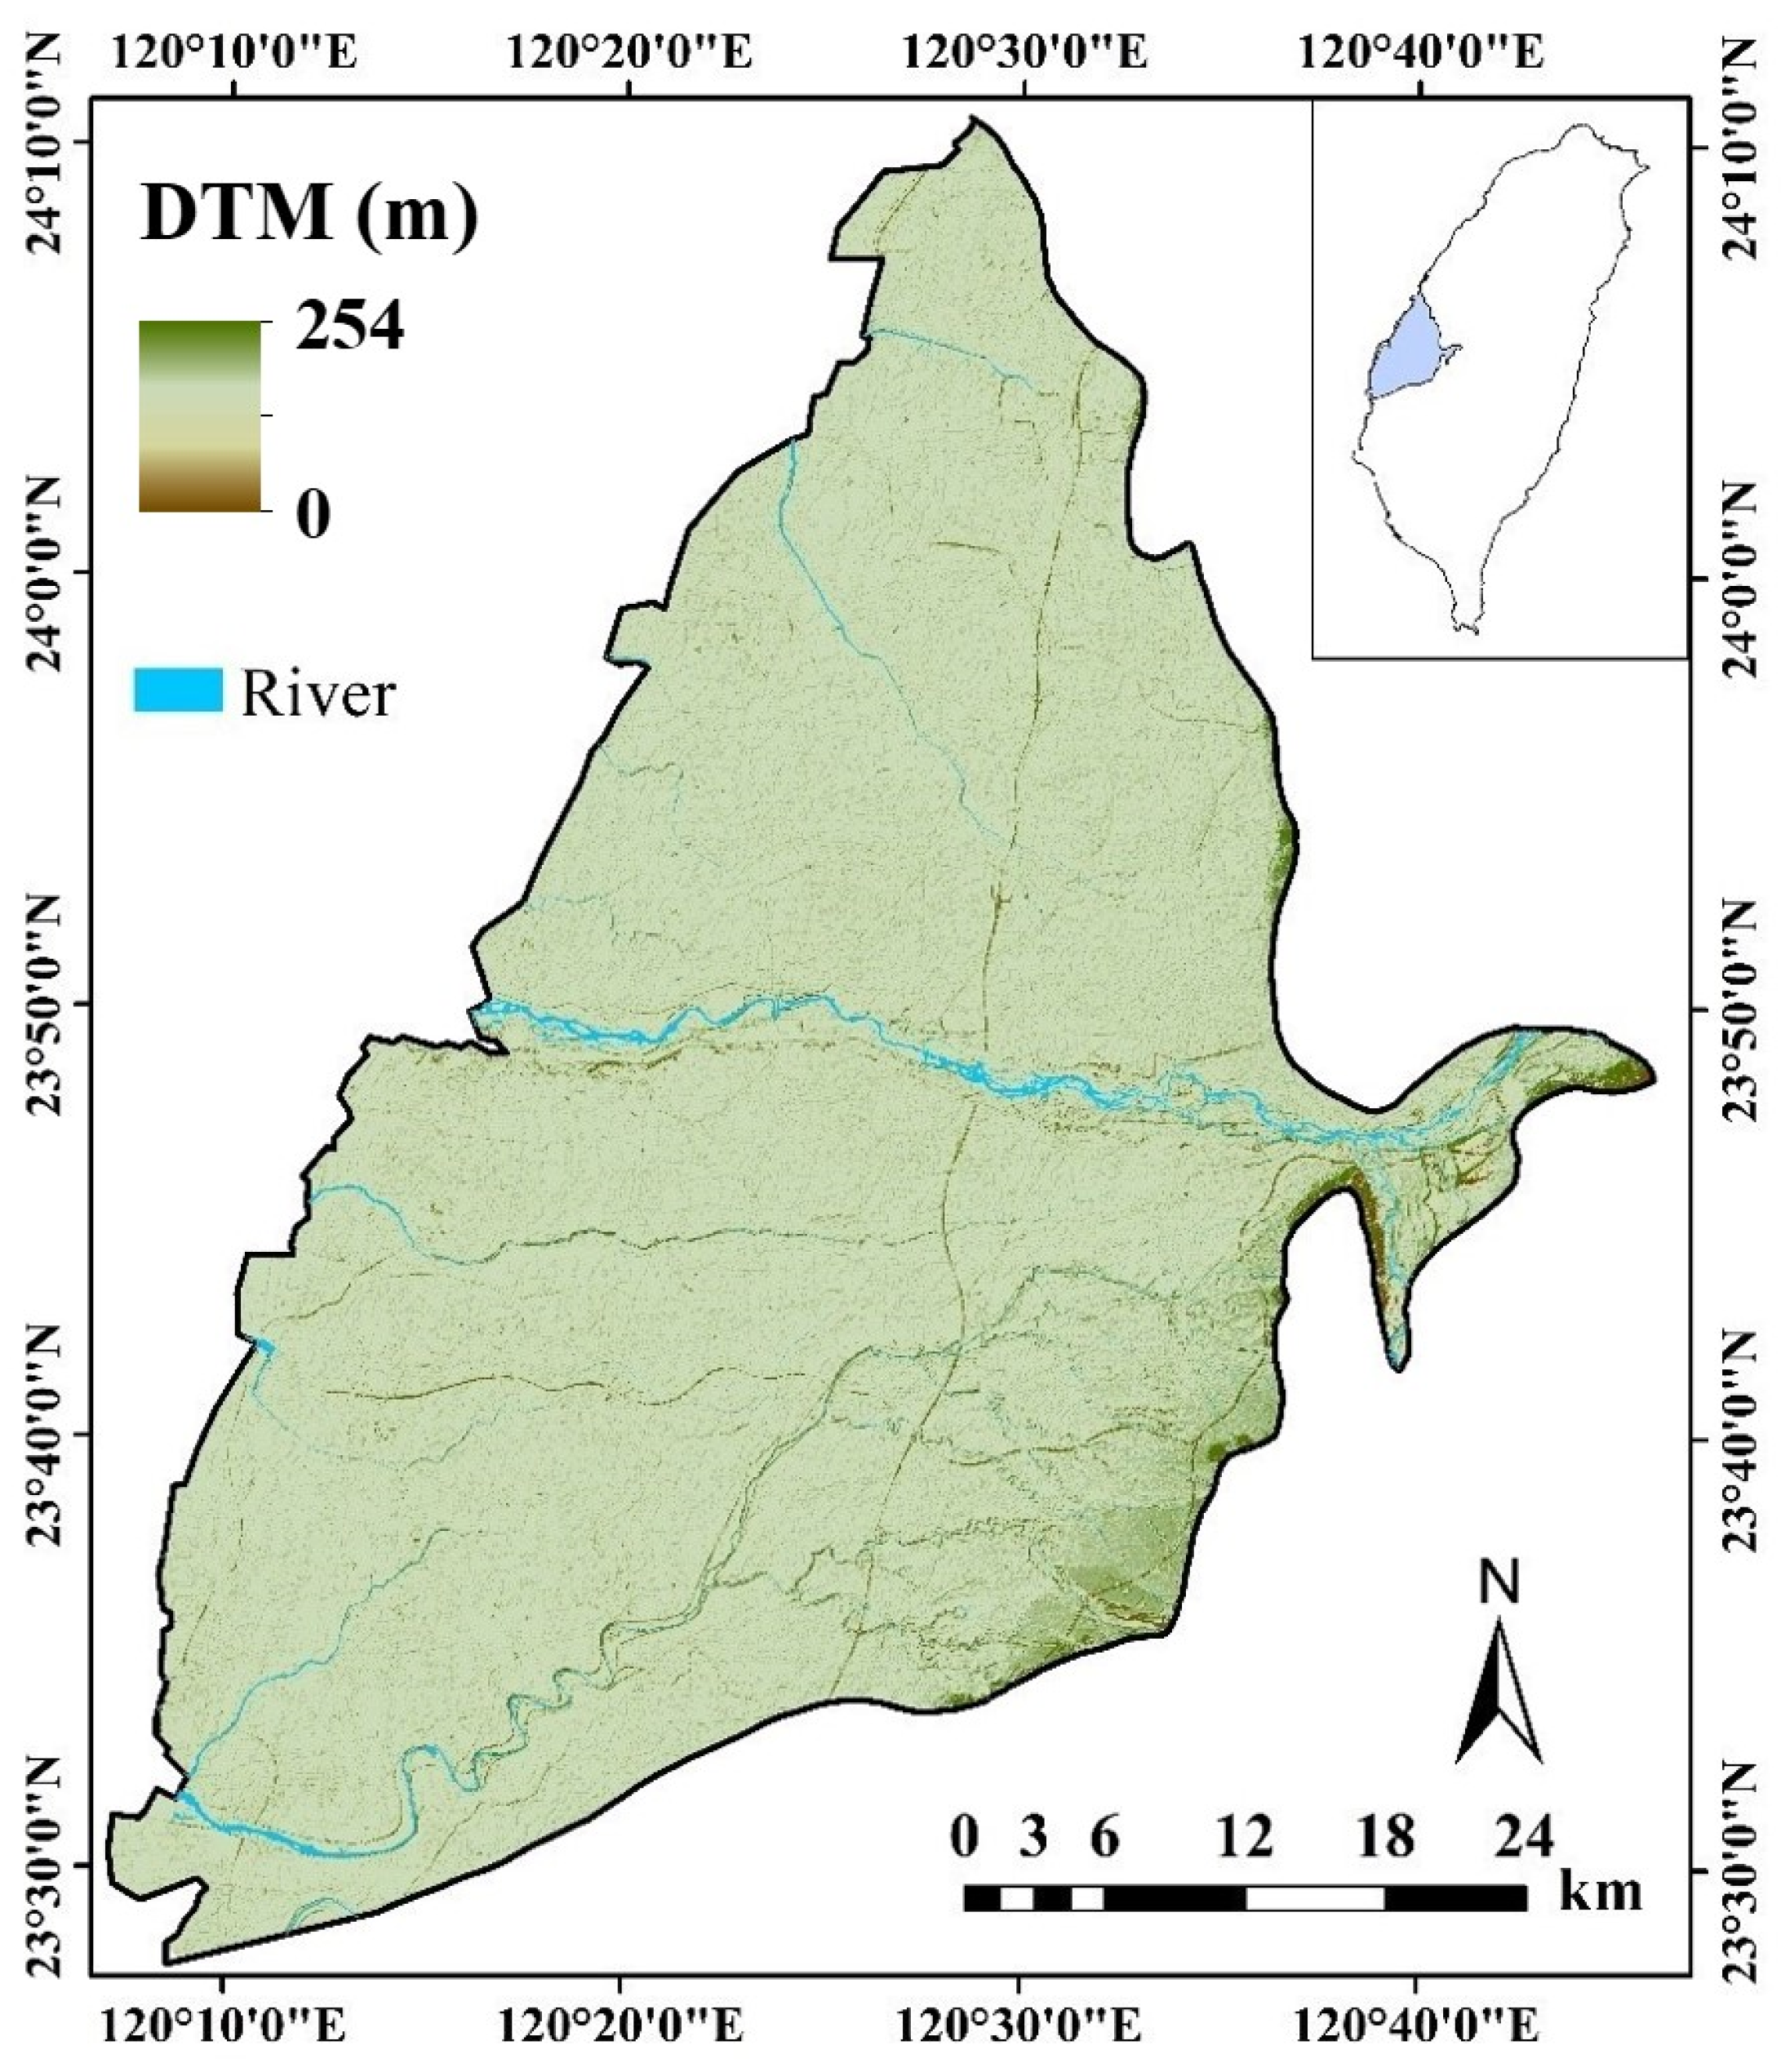
2.1. Study Area and Data

This study selected the Choushui River alluvial fan to analyze the spatiotemporal paths of drought. The Choushui River alluvial fan is located on the central–western coast of Taiwan, encompassing parts of Changhua County, Yunlin County, and the northern region of Chiayi County. It stretches approximately 70 km in length and 40 km in width, covering a total area of about 1800 square kilometers [39]. The terrain in this area slopes gently, with elevations ranging from sea level to 100 m above sea level, as depicted in Figure 1. Subject to the influence of the southwest monsoon and typhoons, the area experiences a wet season from May to October, while the period from November to the following April constitutes a dry season due to the obstruction of the Central Mountain Range. This study compiles data on the annual precipitation from 1960 to 2021. The distribution of annual precipitation ranges from 910 mm to 1940 mm, with a tendency for greater rainfall in the eastern areas compared to the west due to topographical effects. The uneven spatial and temporal distribution of precipitation, compounded by anomalies attributed to climate change, has resulted in insufficient surface water supply in the region. The monthly rainfall data from 1960 to 2021 used in this study were obtained from the Taiwan Climate Change Projection and Information Platform (TCCIP), which provides about 5 km grid (the spatial resolution is 0.05° × 0.05°) rainfall data. These grid data use the coordinate system GCS_WGS_1984. It should be noted that each data point represents the average value within the grid range centered around the latitude and longitude of that data point. For example, for a grid data point with a latitude and longitude of 119.45° E, 23.2° N and a resolution of 0.05 degrees, it represents the average value within the range of 119.425° E–119.475° E, 23.175° N–23.225° N.

2.2. Standardized Precipitation Index (SPI)

In this study, drought is calculated by the Standardized Precipitation Index (SPI), with four drought intensities being used to identify meteorological drought events at different time scales [13,40]. These intensities include the following: mild (−1.0 < SPI ≤ 0), moderate (−1.5 < SPI ≤ −1.0), severe (−2.0 < SPI ≤ −1.5), and extreme (SPI ≤ −2.0) drought.
Generally, a one-month-scale SPI exhibits high spatiotemporal variability as it essentially standardizes monthly precipitation, resulting in a higher frequency of shorter individual drought events [37]. While it has the advantage of quickly tracking drought occurrence, it is less suitable for generating subsequent drought paths. Therefore, in this study, a three-month-scale SPI (SPI-3) is used to characterize drought conditions in the Choushui River alluvial fan.

2.3. Drought Coverage (Dc)

Drought coverage is defined as the extent of drought occurrence in the study area over a specific period [38]. In this study, a grid of 0.05° is utilized to represent the extent of the study area. Drought coverage is expressed as the ratio of the number of drought grids for the current month to the total number of grids, as shown in Equation (1):
D c = m TD × 100 %
where m represents the number of grids experiencing drought in the current month, and TD represents the total number of grids in the study area. A higher Dc value indicates a larger area affected by drought. Additionally, four drought scales are classified as follows: no obvious drought (Dc < 10%), partial drought (10% ≤ Dc < 25%), regional drought (25% ≤ Dc < 50%), and regional-wide drought (Dc ≥ 50%).

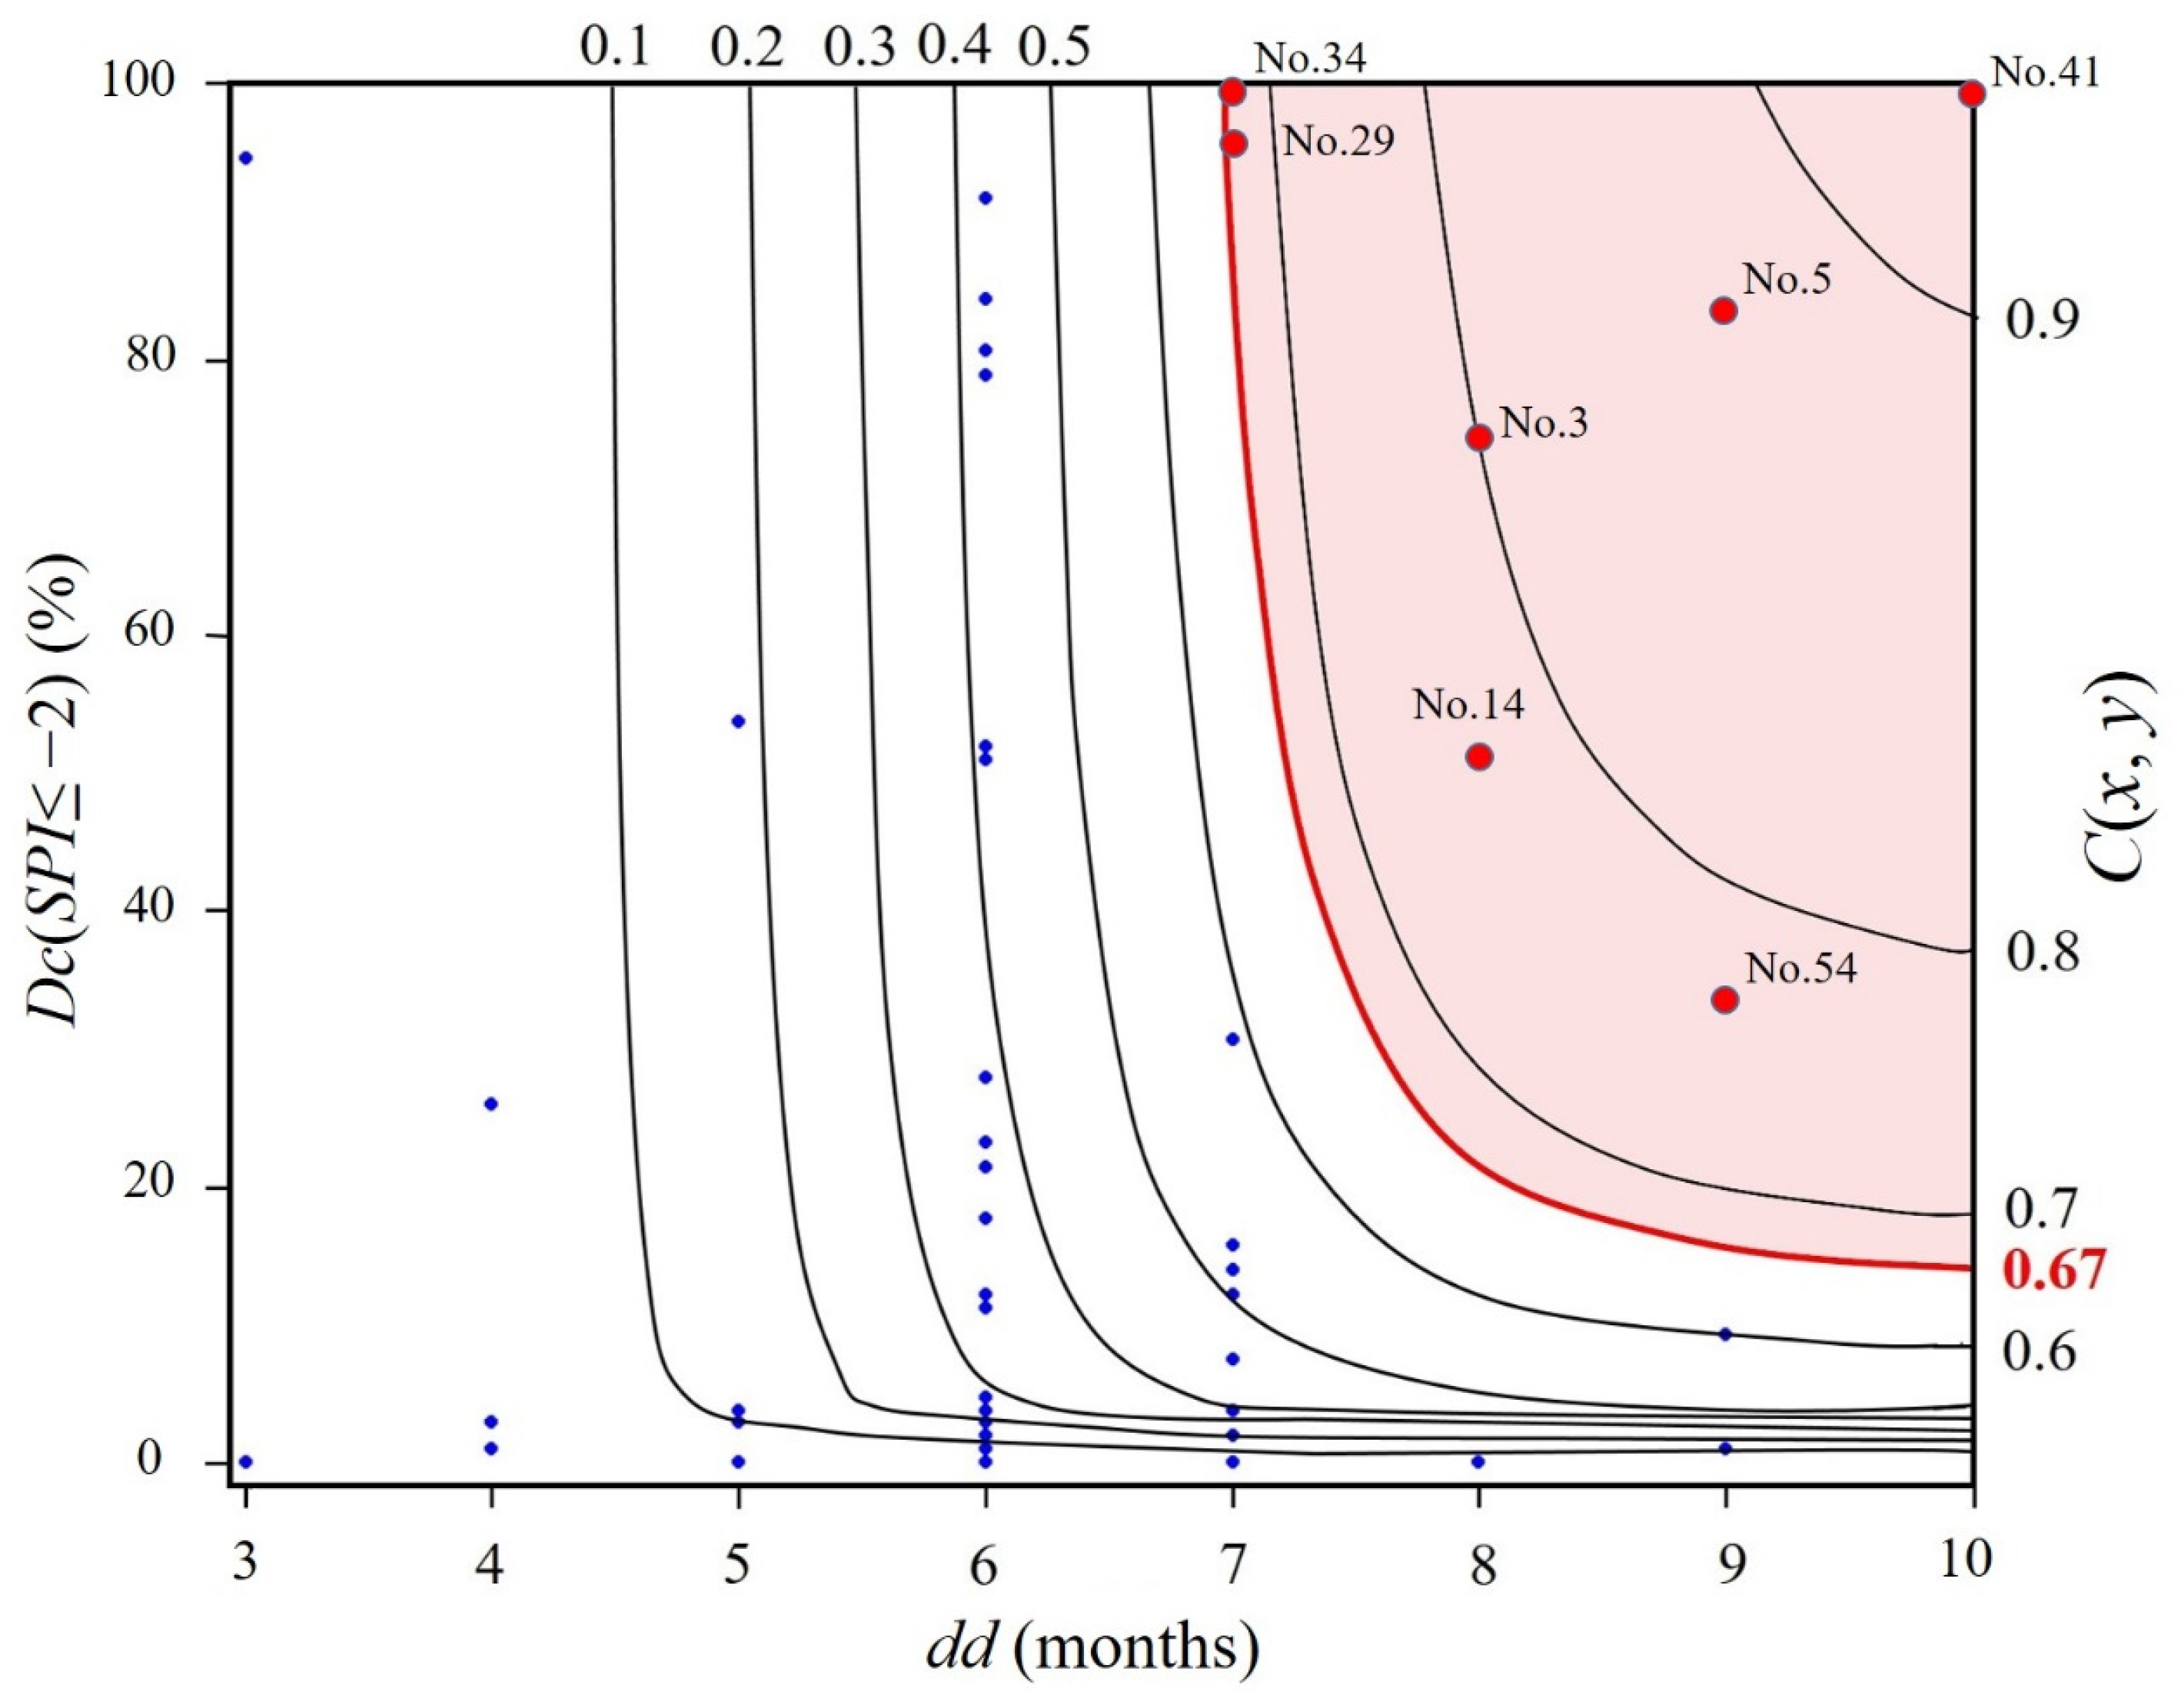
2.4. Selection of Major Drought Events

A drought event is defined as a continuous negative SPI value over a period of time, including cases where SPI is less than −1 [13]. The threshold for the occurrence of drought events was set at a drought coverage of 10%. Drought events with a Dc below 10% were considered as having no drought occurrence. Combined with these two conditions, the duration of drought events (dd) can be calculated based on their onset and end times.
Compared to general drought events, major drought events occur less frequently but often result in more significant impacts on the study area. Therefore, they are the focal point of discussion in this study. The selection of major drought events is conducted using a bivariate distribution established through the copula function [41]. The choice of an appropriate copula is based on methodologies outlined in prior research [42,43]. The main process for selecting major drought events in this study follows these steps:
(1)
Select drought characteristics as drought variables to assess the magnitude and frequency of drought events.
(2)
Construct the marginal distributions of the two random variables separately [27,44].
(3)
Fit the copula function and estimate its parameters [45].
(4)
Perform goodness-of-fit tests to choose the optimal copula function [46].
(5)
Determine major drought events through thresholding of joint distribution probabilities.
The variables used to evaluate drought magnitude include severity, duration, and spatial extent [47]. Given that the primary objective of this study is to delve into the spatiotemporal characteristics and dynamic processes of drought events, the criteria for selecting major drought events in this study prioritize drought coverage and duration. This approach is more conducive to subsequently establishing a drought migration model and conducting spatiotemporal characteristic analyses. Additionally, to ensure the selection of major drought events based on their intensities, this study utilizes the drought coverage of extreme drought (Dc(SPI ≤ −2)) as a characteristic to describe the spatial extent of drought in the Choushui River alluvial fan. The joint probability distribution constructed in this section allows for the quantification of the occurrence probability for various combinations of extreme drought coverage (Dc(SPI ≤ −2)) and duration (dd), aiding in the selection of major drought events. In this study, major drought events are defined as those falling within the first third of the drought events, where the joint probability distribution of Dc(SPI ≤ −2) and dd is greater than or equal to 67%.

2.5. Spatiotemporal Paths of Drought Events

The application of centroids is an important method for studying spatial distribution in research related to the migration of matter and energy [48]. Using the drought migration model to determine the spatial migration path of drought is essential for analyzing the spatiotemporal characteristics of the drought in the Choushui River alluvial fan. The drought migration model comprises the following four steps:
(1)
Identifying drought events: Drought events are defined as a continuous negative value of SPI for a period of time, including the occurrence of an SPI less than −1 [13]. In this study, the minimum drought area threshold was set at 10%.
(2)
Screening of the grid: The study area is divided into multiple grids for analysis. Each grid is evaluated based on the drought index to determine if it experiences drought (SPI < 0). If drought occurs, the drought state (Ds) is assigned a value of 1; otherwise, it is assigned a value of 0, as shown in Equation (2):
Ds ( t ) = 1   if   S P I < 0 0   if   S P I 0
where Ds is the drought state.
(3)
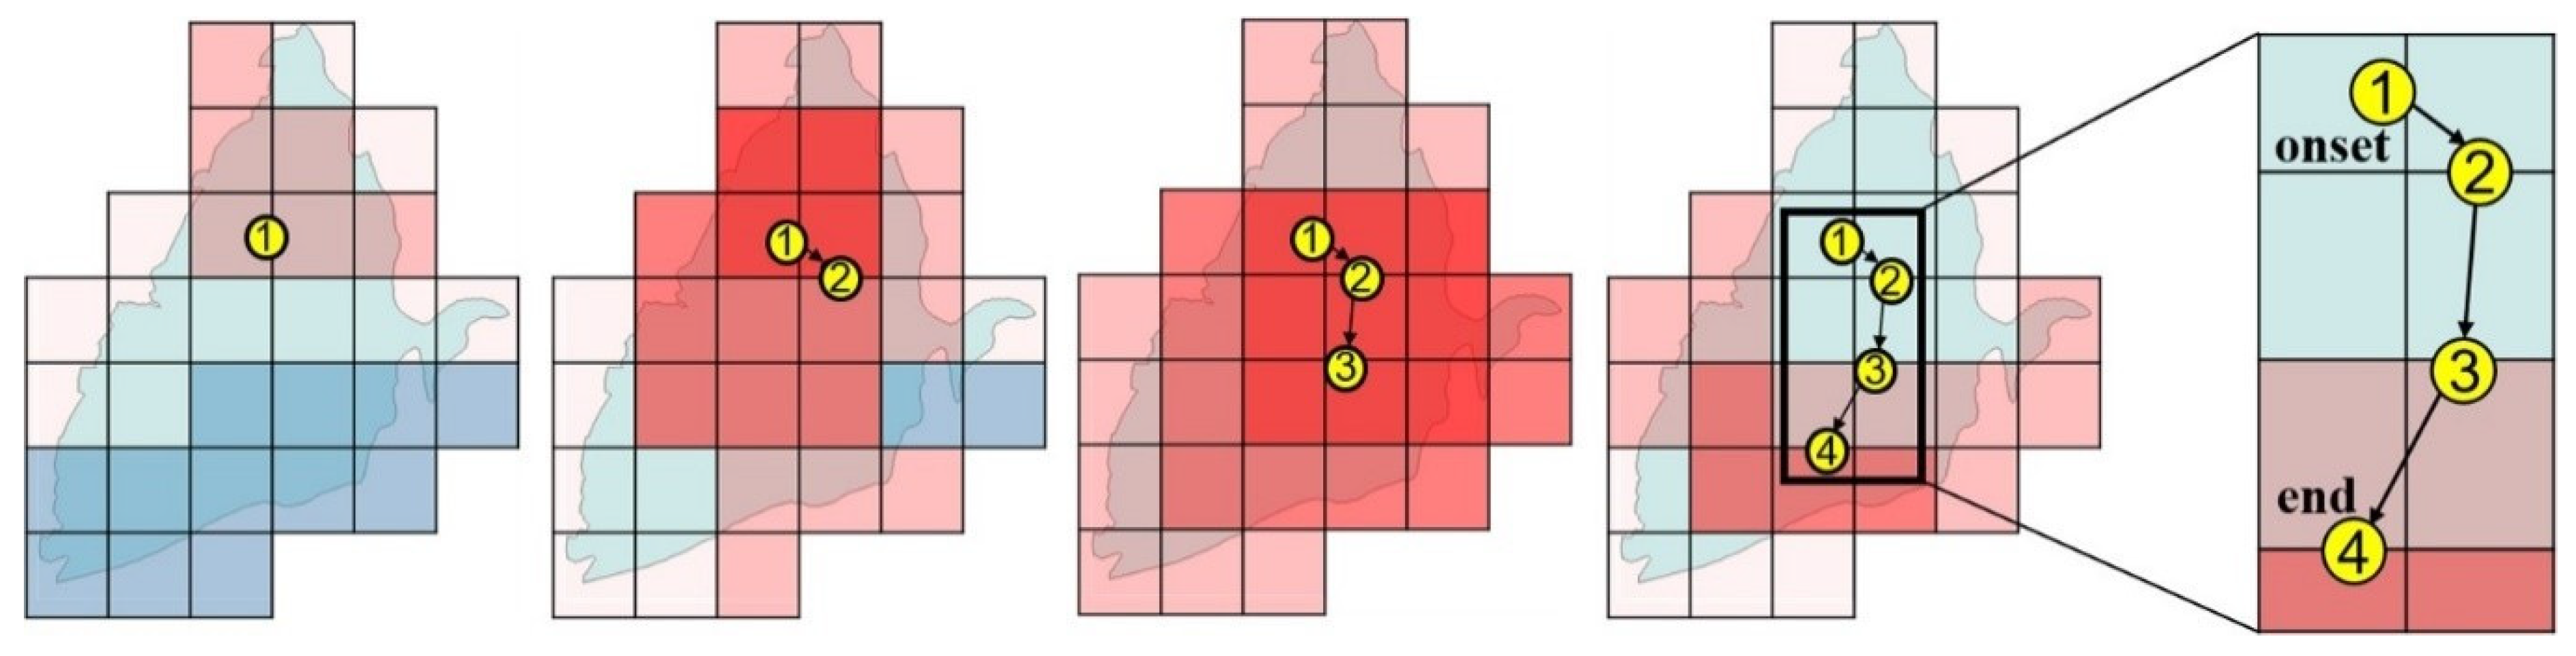
Determining the location of the drought centroids: The drought area is determined by grids where Ds is equal to 1. To account for the different weights of the SPI, the SPI values within each drought grid are recorded. The centroid coordinates are used to represent the spatial location of the drought event in that month, as shown in Equation (3):
( X ,   Y ) = { X = i = 1 n SPI i X i / i = 1 n SPI i Y = i = 1 n SPI i Y i / i = 1 n SPI i
where X and Y represent the longitude and latitude of the drought centroid in the study area, respectively; Xi and Yi represent the longitude and latitude of the ith grid center, respectively; and Pi represents the SPI of the ith grid.
(4)
Connecting centroids: By connecting the centroids of drought events, it is possible to comprehensively describe the path, length, and velocity characteristics of drought events.
Figure 2 depicts the schematic diagram of the drought migration model. In general, the position of the drought centroid for each month is determined by the Standardized Precipitation Index (SPI) values of the drought grids. Darker red areas on the diagram indicate more severe drought conditions with smaller SPI values, causing the drought centroid to move closer to these regions. Blue grids represent the absence of drought, and they do not affect the centroid’s position. Connecting the centroids of each month during a drought event forms the spatiotemporal path, from which drought characteristics such as onset and end locations, path length, velocity, and direction can be derived. In this study, the direction (i.e., direction of migration) is defined as the direction from the onset location to the end location of the drought event, independent of the path of the drought. In this study, eight compass directions are used for classification.

2.6. Spatial Distribution of Drought

This study quantifies the monthly drought frequency of each grid using the SPI. Its value can be calculated based on the Ds defined in Section 2.5, as shown in Equation (4):
p i = t = 1 N D s ( t ) N
where pi represents the monthly drought frequency of each grid, and N represents the total number of months in the study period. Since Ds(t) can only take values of 0 or 1, pi ranges between 0 and 1. Subsequently, Ordinary Kriging is employed for the spatial interpolation of monthly drought frequencies to describe the spatial distribution of drought conditions and trends across the entire region. This method is known for its ease of computation and interpretation, along with providing good interpolation accuracy [49].

3. Results and Discussion

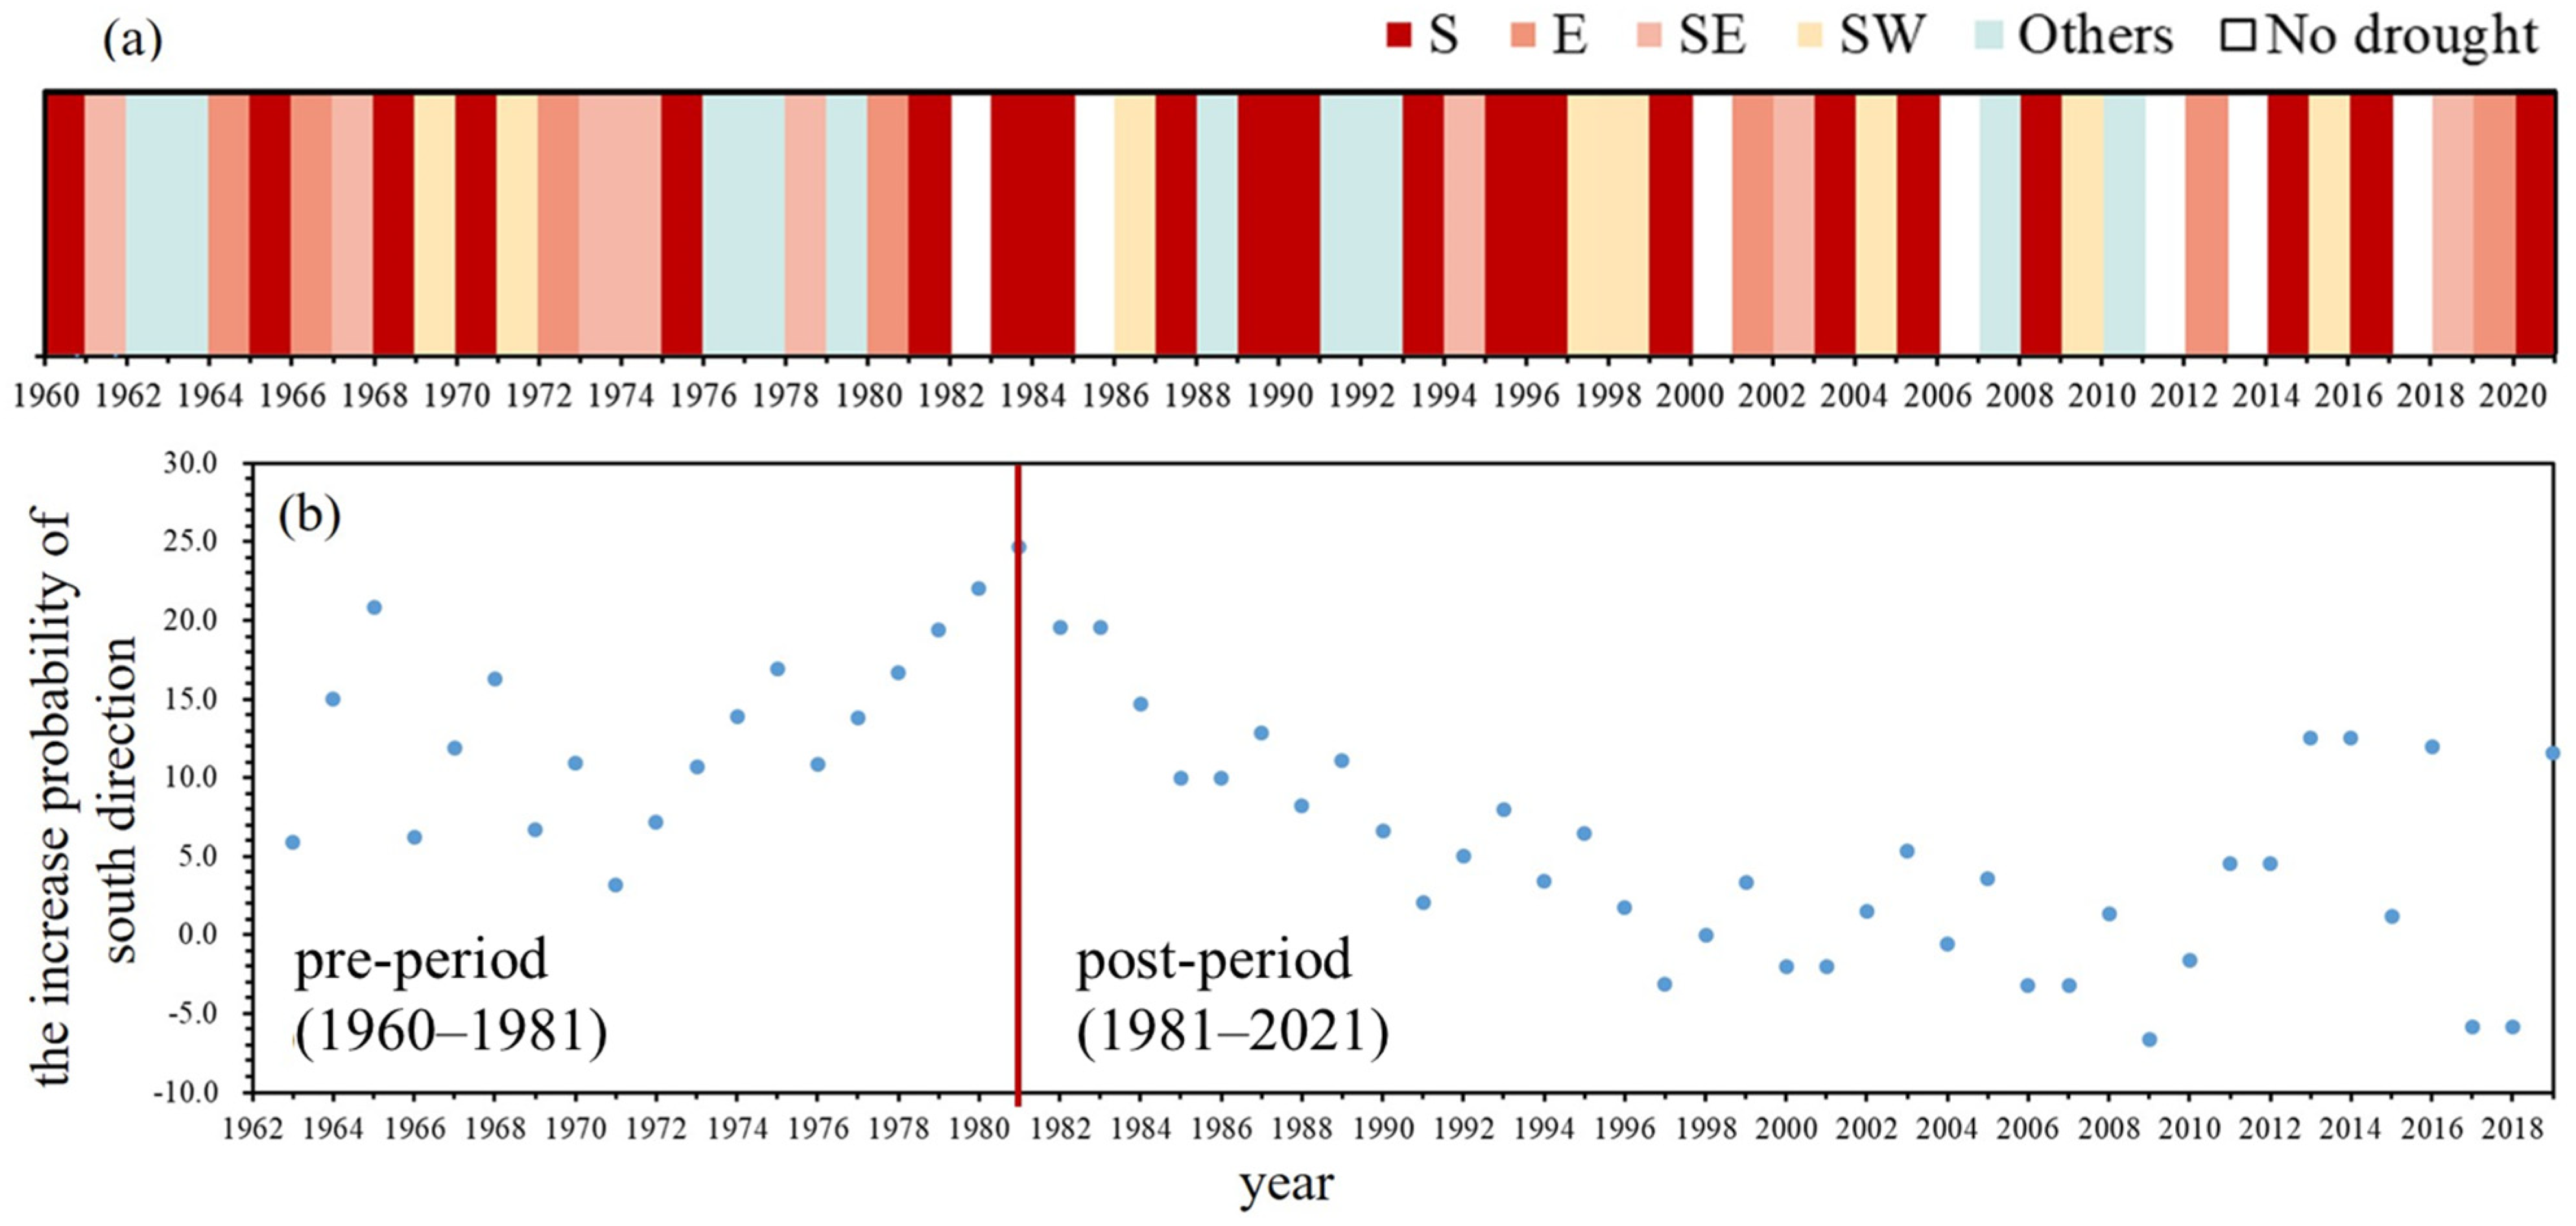
3.1. Direction of Drought Events

Based on the SPI results and the drought event identification method, a total of 54 drought events occurred in the Choushui River alluvial fan from 1960 to 2021. In order to better understand the spatial characteristics of these drought events, the relative positions of the onset locations and end locations of the drought events are depicted in Figure 3. The onset locations of drought events are mostly distributed to the north of the centroid of the Choushui River alluvial fan, while the end locations are mostly distributed to the south, indicating a general south direction. Figure 4a illustrates the directions of drought events, with the south direction being the most common, occurring in a total of 21 events. There are only eight events each for the east, southeast, and southwest directions. Since other directions occur less frequently, they are combined for further discussion.
In addition, this study analyzes changes in the probability of a south direction, as shown in Figure 4b. The results indicate that after 1981, there was a significantly higher probability of south directions compared to before 1981, suggesting that a change in climate conditions occurred in that year. Therefore, this study divides the entire study period into pre-1981 and post-1981 periods. Table 1 presents the probabilities of different directions in the entire study period (all), the pre-period (1960–1981), and the post-period (1981–2021). The results reveal that in the pre-period, the probabilities for south, east, and southeast directions were all 23.8%, with no significant differences among directions. However, the probability of the south direction in the post-period increased from 23.8% to 48.5%, indicating that approximately half of the drought events during the post-period exhibited a south direction. In addition, the probability of a southwest direction increased from 9.5% to 18.2%, while the probabilities for the remaining directions decreased. Specifically, the probabilities for the east and southeast directions decreased from 23.8% to 9.1%.

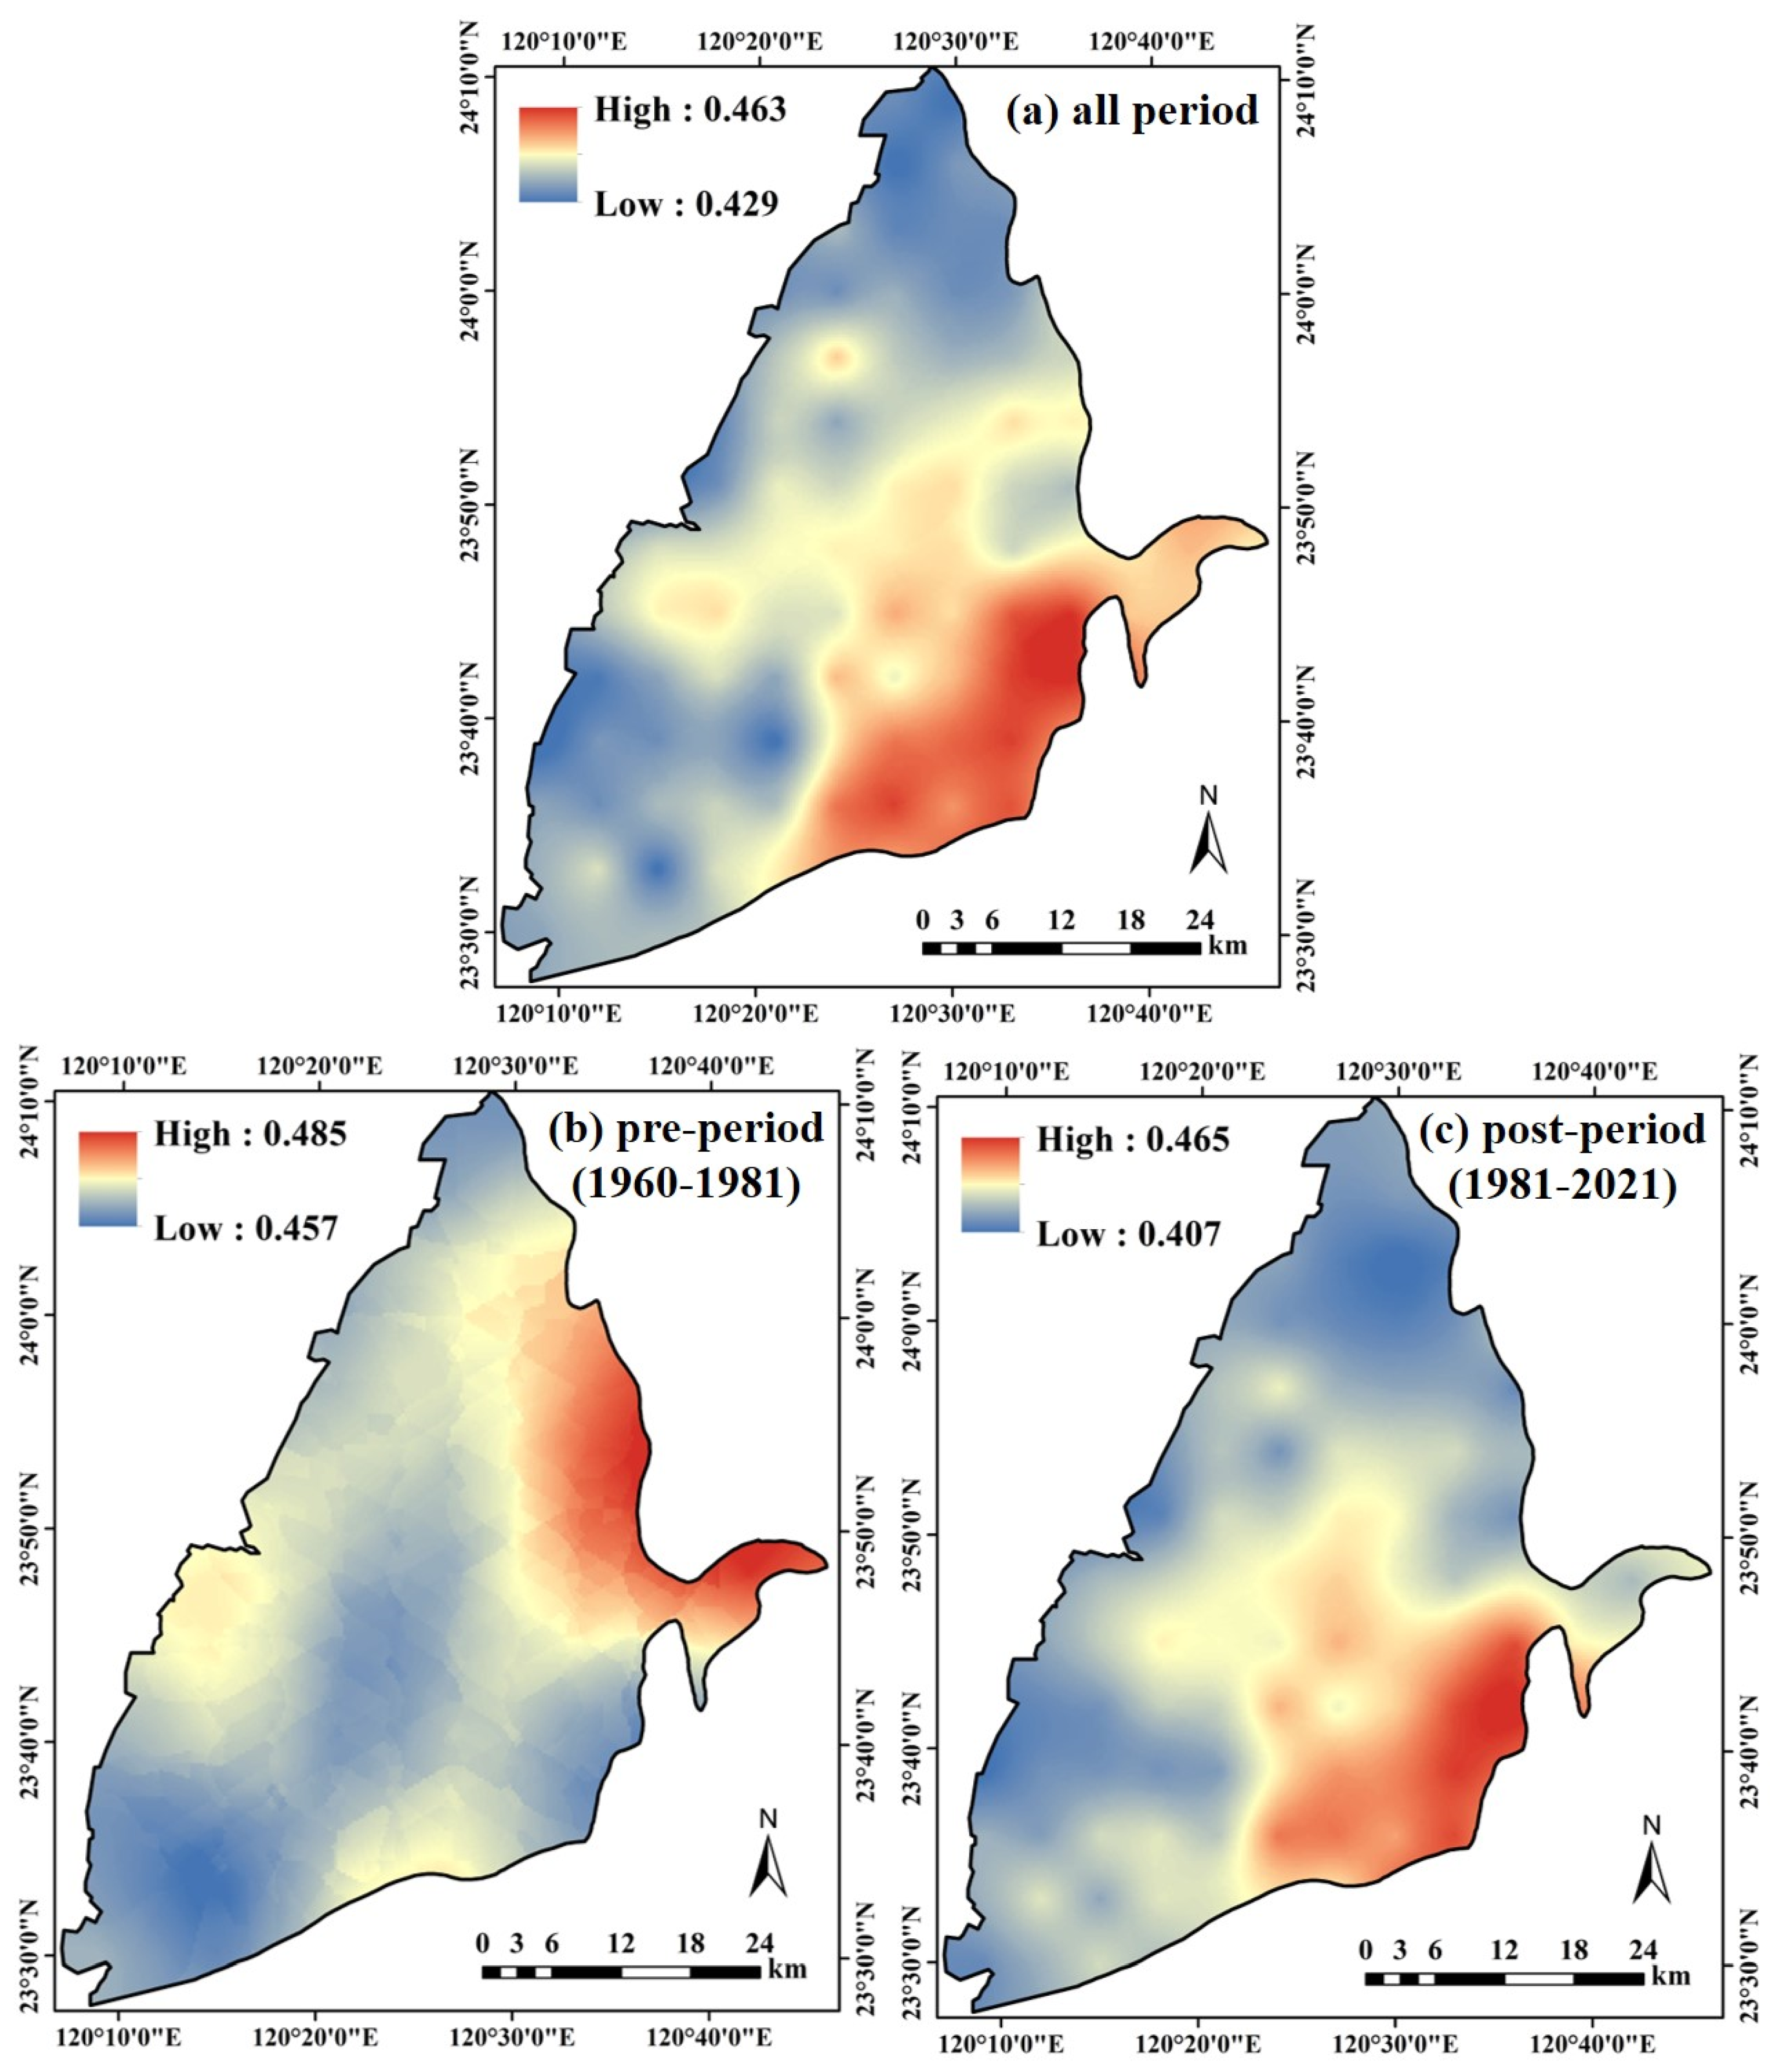
3.2. Spatial Distribution of Drought Frequency in Different Periods

Visualizing drought frequency enables us to comprehend the spatial distribution of droughts across different time periods. This section explores the spatial distribution of drought frequency in the entire study period (all period), pre-period (1960–1981), and post-period (1981–2021), as shown in Figure 5. The spatial distribution clearly reveals significant variations in drought frequency between the pre-period and post-period. During the pre-period, a higher drought frequency accumulates in the northeast of the Choushui River alluvial fan. In contrast, in the post-period, a higher drought frequency accumulates in the southeast. Since the post-period constitutes about two-thirds of the entire study period, it significantly influences the drought frequency for the entire study period, concentrating it in the southeast of the Choushui River alluvial fan. Nevertheless, it also reflects the Impact of drought frequency during the pre-period, indicating a tendency to extend northward.
Regarding drought frequency throughout the entire study period, the range is from 0.429 to 0.463. In the pre-period, it ranges from 0.457 to 0.485, while in the post-period, it ranges from 0.407 to 0.465. This indicates that droughts were more frequent in the pre-period compared to the post-period. This observation aligns with the analysis of drought event occurrence periods. Over the 61-year study period, there were 54 drought events, averaging approximately 0.885 events per year. In the pre-period, there were 21 drought events, averaging 1 event per year; In the post-period, there were 33 drought events, averaging approximately 0.825 events per year. This implies a higher frequency of drought events during the pre-period.

3.3. Joint Probability Distribution and Major Drought Events

To determine the most suitable distribution for fitting drought variables, cumulative distribution functions (CDFs) of the exponential, lognormal, gamma, and Weibull distributions were applied to both Dc(SPI ≤ −2) and dd. This study evaluated the goodness of fit of the marginal functions through logarithmic likelihood ratio, AIC, and BIC values. A higher logarithmic likelihood ratio and lower AIC and BIC values indicate a better fit, as shown in Table 2. The results indicate that the most suitable distribution functions for drought duration (dd) are the gamma distribution and Weibull distribution, while for extreme drought coverage (Dc(SPI ≤ −2)), the gamma distribution is appropriate. Therefore, this study selects the gamma distribution as the marginal distribution for further bivariate copula analysis. Additionally, the Archimedean copula function family, including Gumbel, Clayton, and Frank copulas, is widely applied in drought research due to its properties of uniformity and tail-dependence [50,51]. Therefore, this study employs maximum likelihood estimation to estimate the parameters (θ) of the Clayton, Frank, and Gumbel copula functions. The parameters estimated for these three copula functions are 0.32, 1.22, and 1.3, respectively. The AIC and BIC values are employed to select the best-fitting function. Among these copula functions, the Gumbel copula shows the lowest AIC and BIC values, as shown in Table 3. This indicates that the Gumbel copula provides the optimal fit for the joint distribution of Dc(SPI ≤ −2) and dd. Therefore, in this study, the Gumbel copula is chosen to construct the joint distribution function for Dc(SPI ≤ −2) and dd.
A joint probability distribution is depicted to select the major drought events, as shown in Figure 6. This study selected the joint probability distribution in the first third, i.e., events with Dc(SPI ≤ −2) and dd greater than or equal to 67%, as the main focus for further discussion. A total of seven drought events were selected, labeled as No.3, No.5, No.14, No.29, No.34, No.41, and No.54. These events were further classified as the major drought events in the Choushui River alluvial fan during the study period.

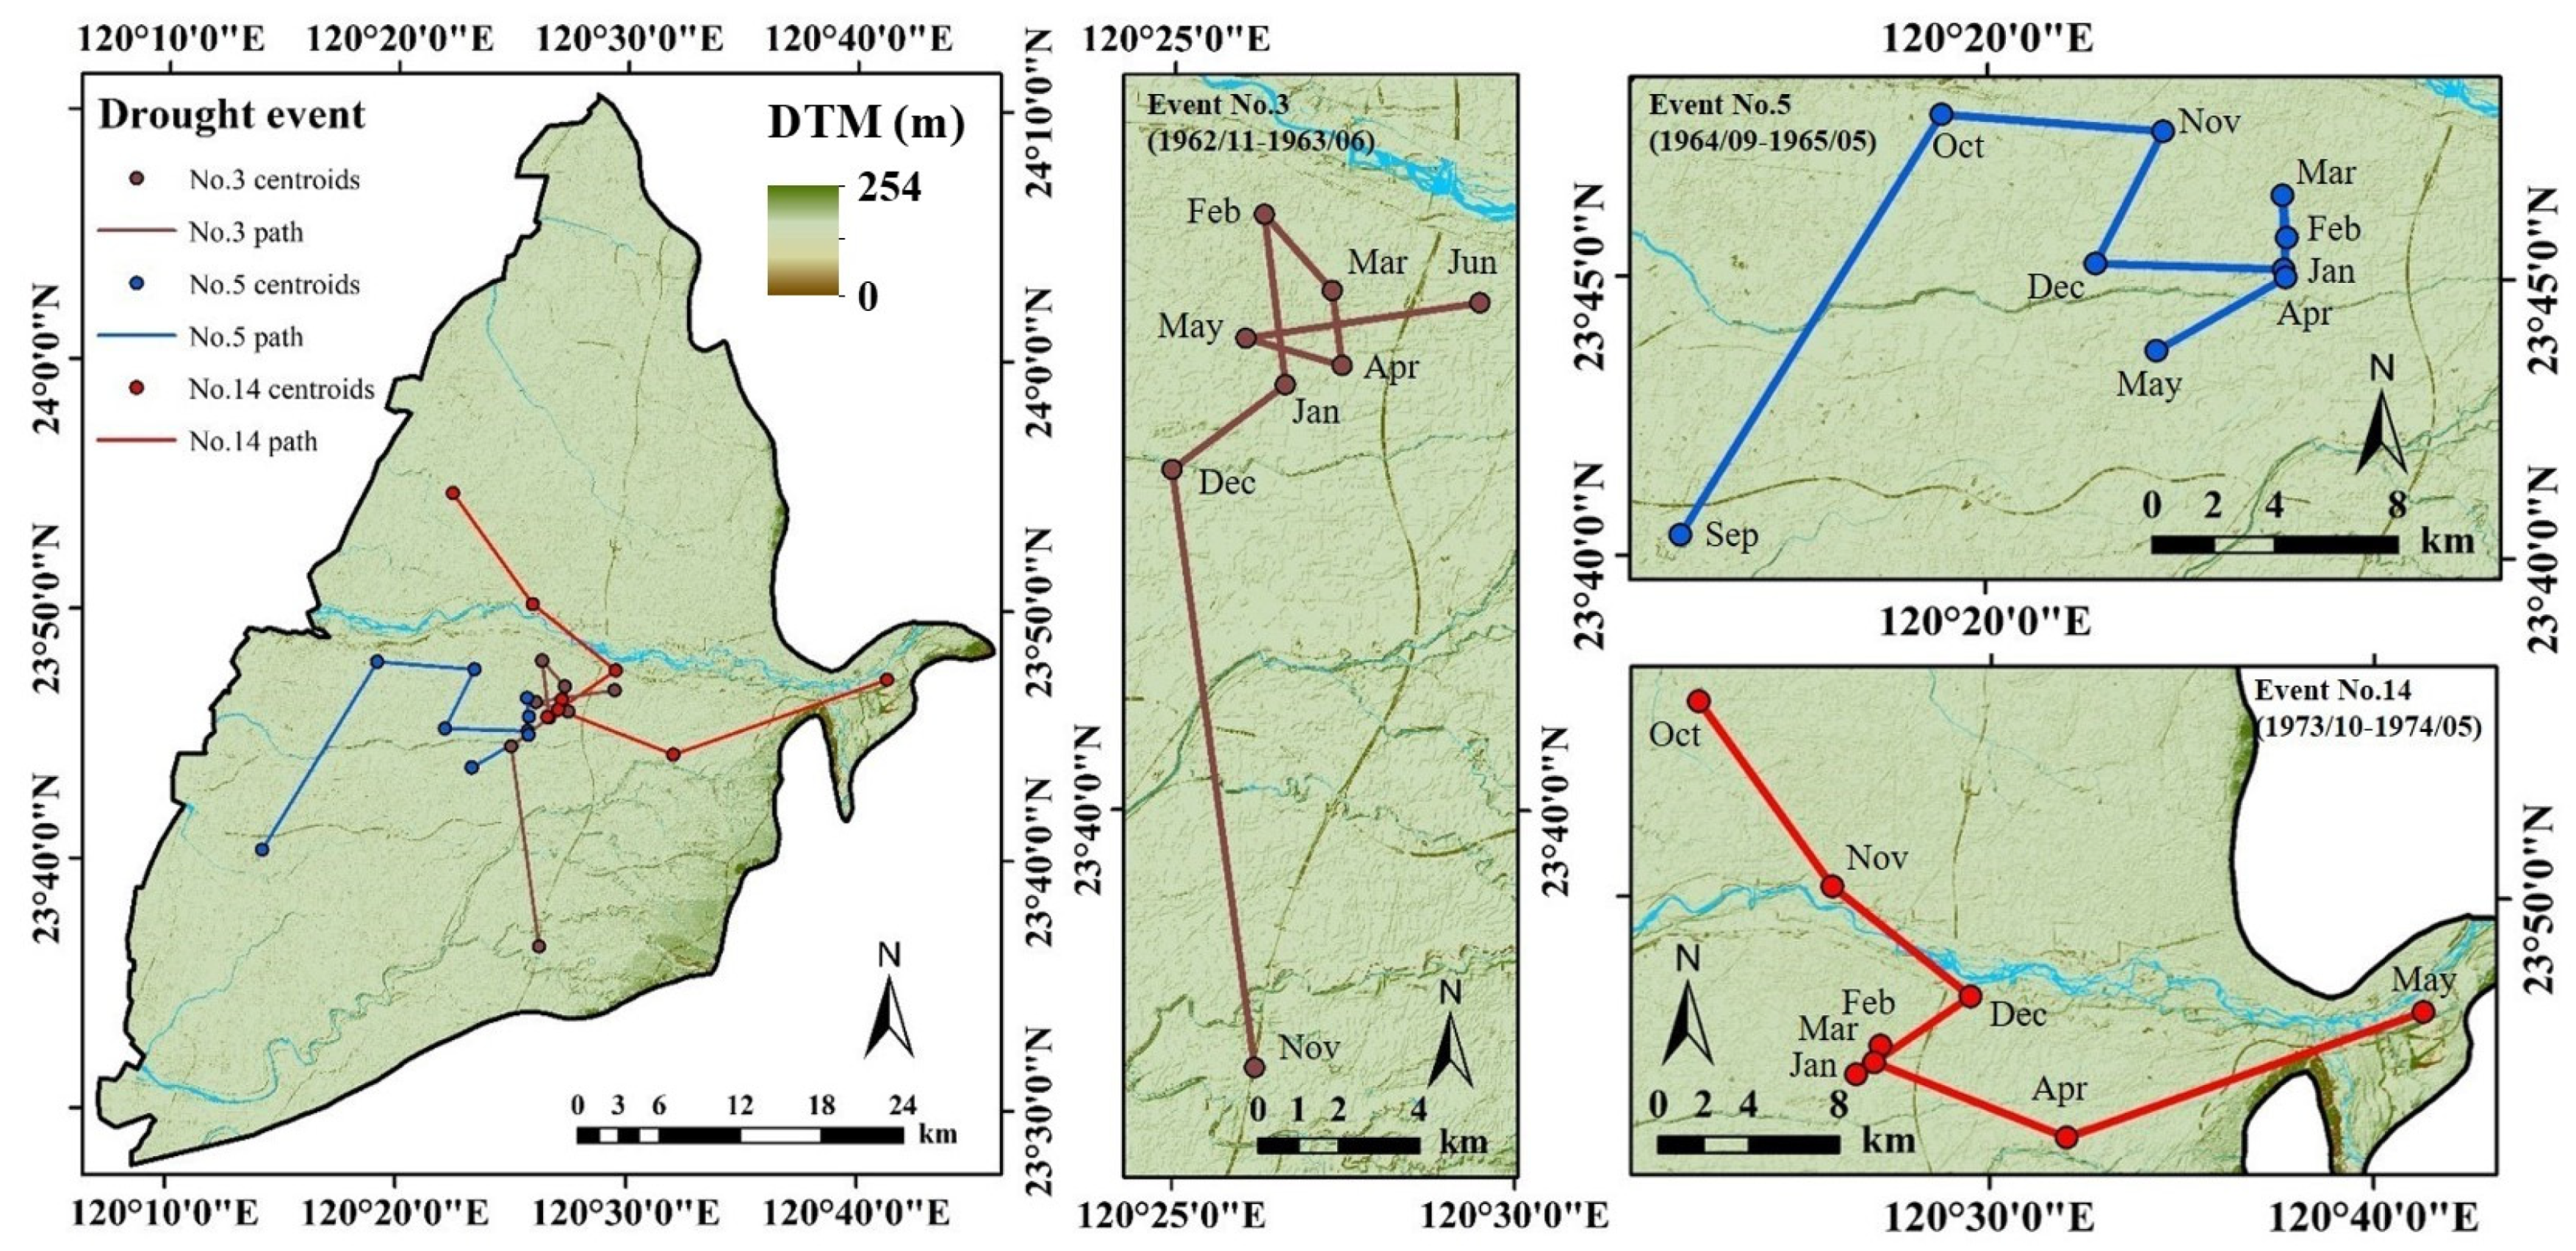
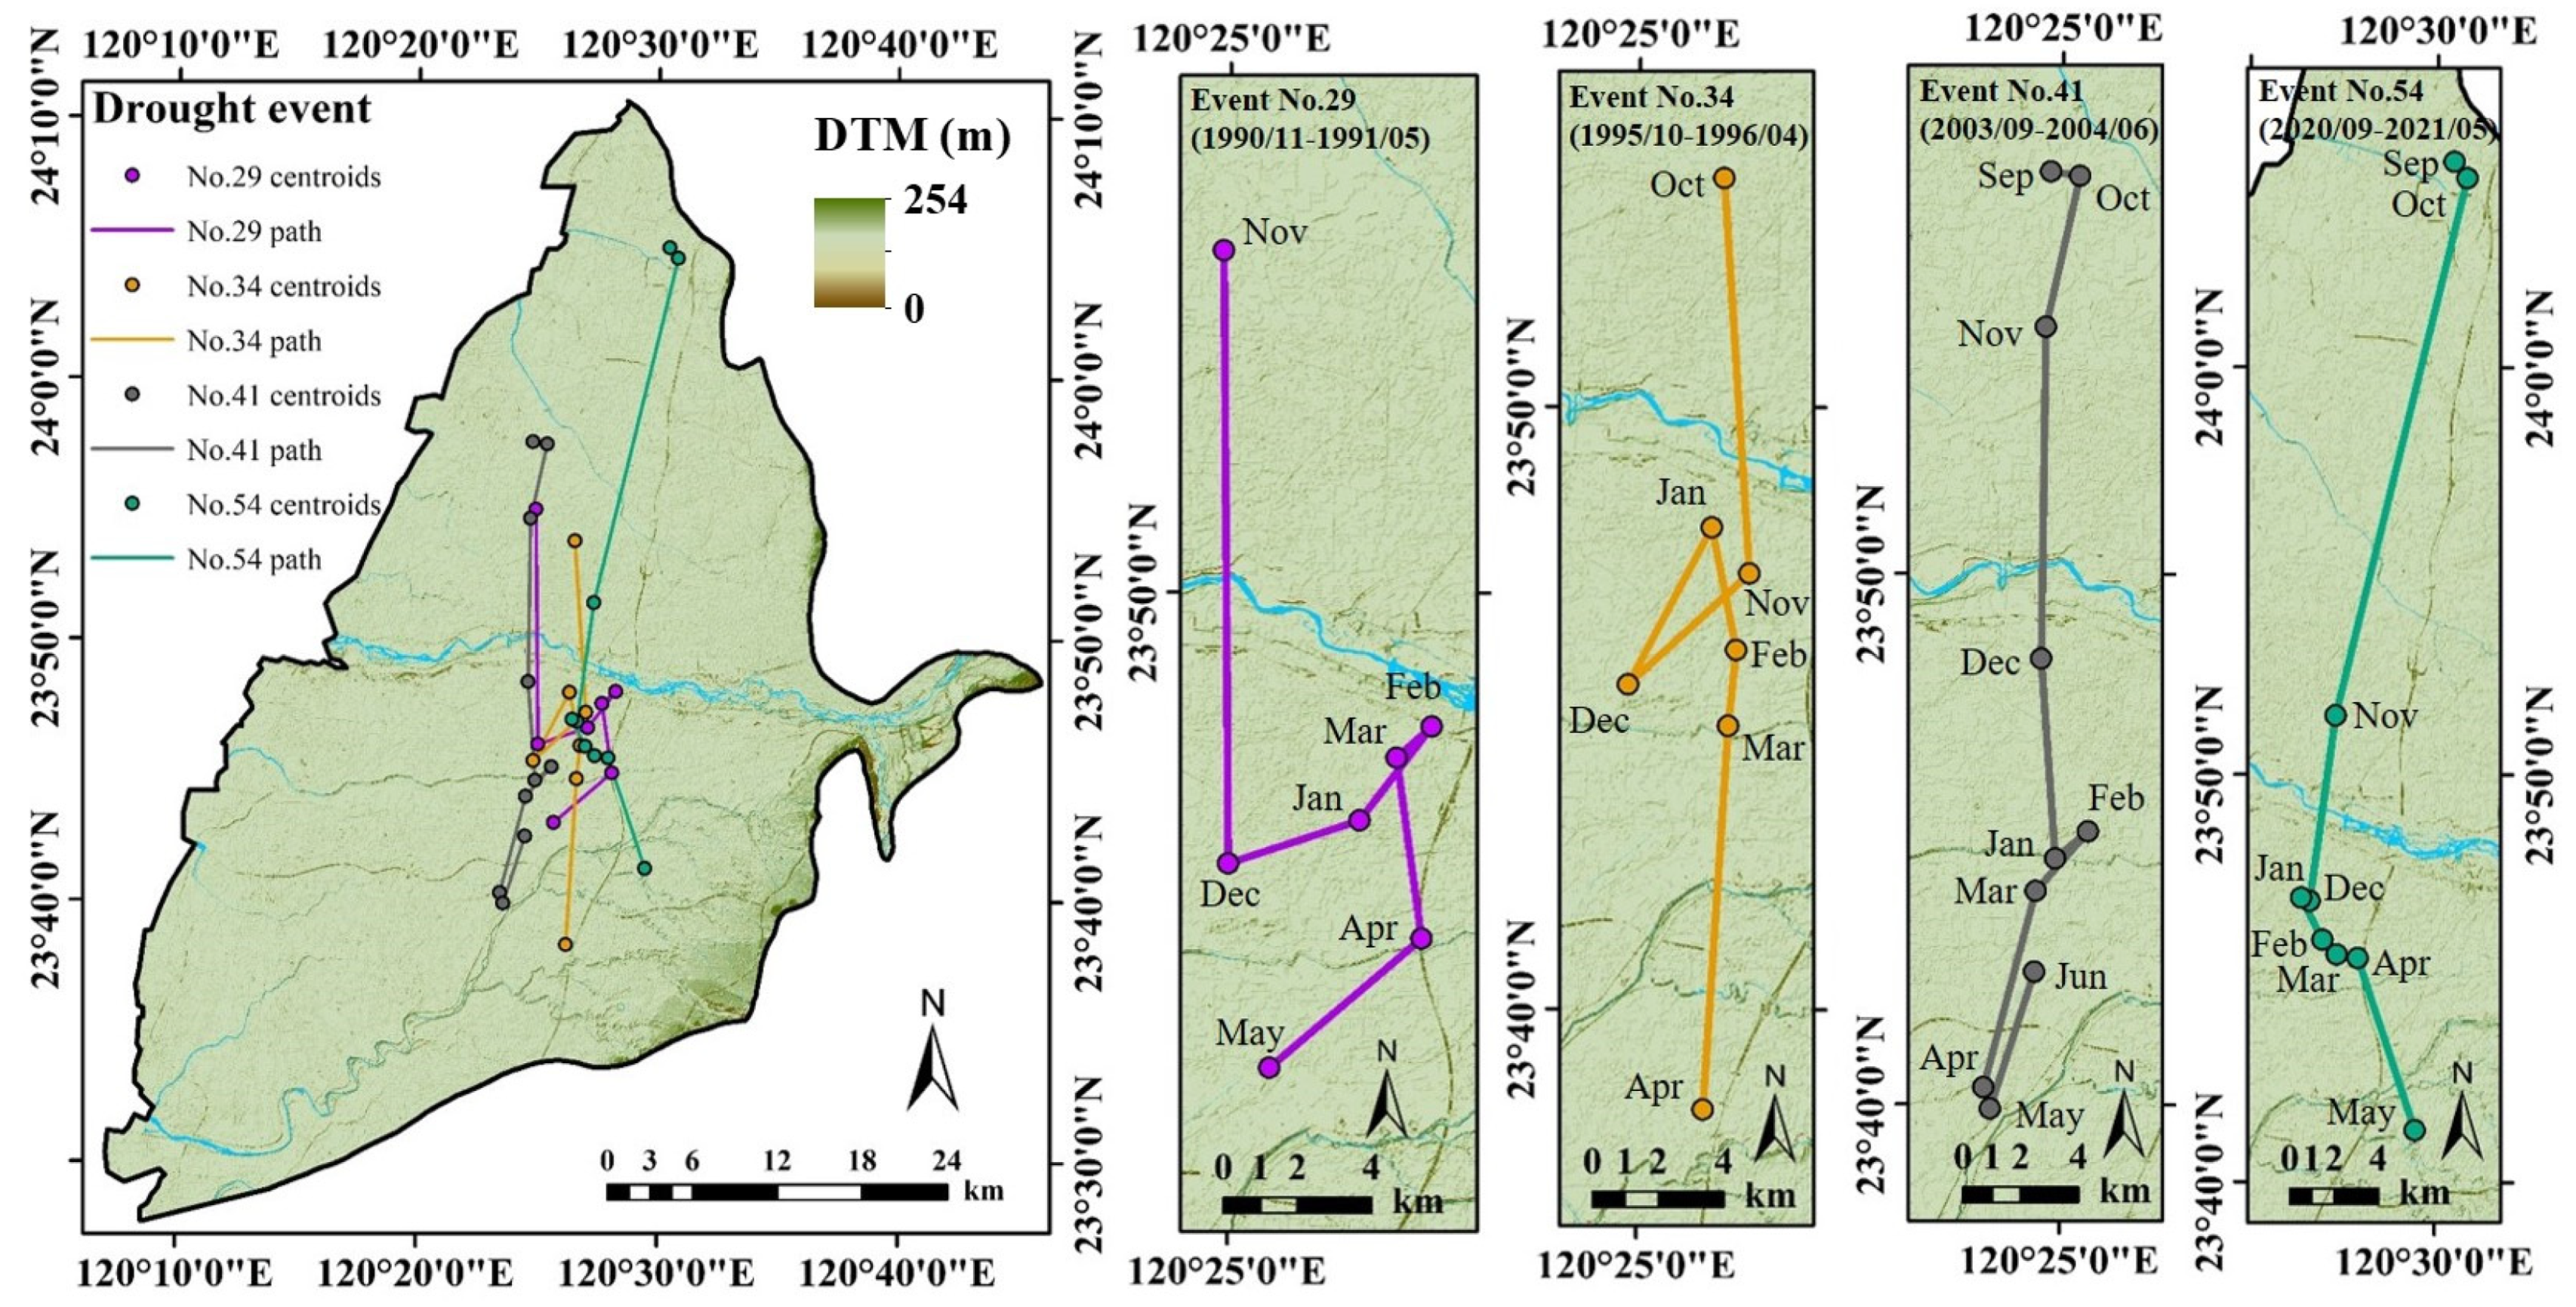
3.4. Spatial Migration Process of Major Drought Events

In this study, a drought migration model is established to analyze the drought spatiotemporal paths of seven selected major drought events, as shown in Figure 7 and Figure 8. Notably, the paths in the pre-period exhibit distinct directions, including north, east, and southeast. However, in the post-period, these paths become remarkably similar, following a trajectory from north to south.
In the early stages of all major drought events, the drought centroids rapidly approach the region near the centroid of the Choushui River alluvial fan, with migration velocities of 15.0, 16.3, 10.1, 16.6, and 12.1 km per month, respectively. Except for the drought events No.41 and No.54, the migration velocities in the first month are particularly slow, only 1.0 km per month. The drought centroids accelerate towards the centroid of the Choushui River alluvial fan before the third month, with migration velocities of 11.4 km per month and 25.1 km per month, respectively. Subsequently, the drought centroids continue to approach the region near the centroid of the Choushui River alluvial fan, but the migration velocity decreases, ranging from 3 km to 10 km per month. They reach the vicinity of the centroid of the Choushui River alluvial fan 1 to 3 months later. In the No.34 drought event, the drought centroid did not move closer to the centroid of the Choushui River alluvial fan from December to January. Instead, it shifted 5.5 km to the northeast; however, this change only persisted for one month. From January to February, the drought centroid resumed its approach to the region near the centroid of the Choushui River alluvial fan, moving 3.8 km southward towards the vicinity of the centroid of the Choushui River alluvial fan. The centroids of all seven major drought events will reach the region near the centroid of the Choushui River alluvial fan in February or March (the mid-term of the drought event). At this time, the migration velocities decrease to within 3 km per month. The direction will also be irregular, with instances of stagnation; however, this situation will only persist for 1 to 3 months. Finally, in the last 1 to 3 months before the end of the drought (the late stages of drought events), the drought centroids accelerate and move away from the centroid of the Choushui River alluvial fan. Among these major drought events, the directions in the pre-period differ: the No.3 event moves eastward, the No.5 event moves southwestward, and the No.14 event initially moves eastward before turning northeastward; however, the directions in the post-period all accelerate southward and leave the centroid of the Choushui River alluvial fan. Specifically, the No.29 event moves at a velocity of 5.4 km per month, the No.34 event at 11.8 km per month, and the No.54 event at 8.2 km per month. Despite the No.41 event, from March to April, the drought centroid moves southward at a velocity of 7.1 km per month and departs from the vicinity of the centroid of the Choushui River alluvial fan; however, the migration velocity drastically drops from April to May, moving only 0.8 km to the east. Then, from May to June, it suddenly shifts northward by 5.0 km. Nevertheless, the overall drought path still remains in a south direction.
From observing the spatiotemporal paths of the seven major drought events, it can be discerned that the drought paths in the early and late stages are long and the velocity is high. In contrast, during the mid-term of drought events, the paths are shorter and the spatial distribution of centroids is denser. In the early and late stages of a drought event, due to significant fluctuations in drought coverage, the migration velocity is generally higher. However, during the mid-term of a drought event, the drought coverage reaches its peak, resulting in a noticeable slowdown in migration velocity. Based on this pattern, it is evident that when the drought coverage increases, the drought path length shortens. This is because, with a larger expanse of drought area, the distance between centroids decreases, leading to slower migration velocity. Conversely, when the drought coverage is lower, the distance between centroids increases, resulting in a longer path length and higher migration velocity.

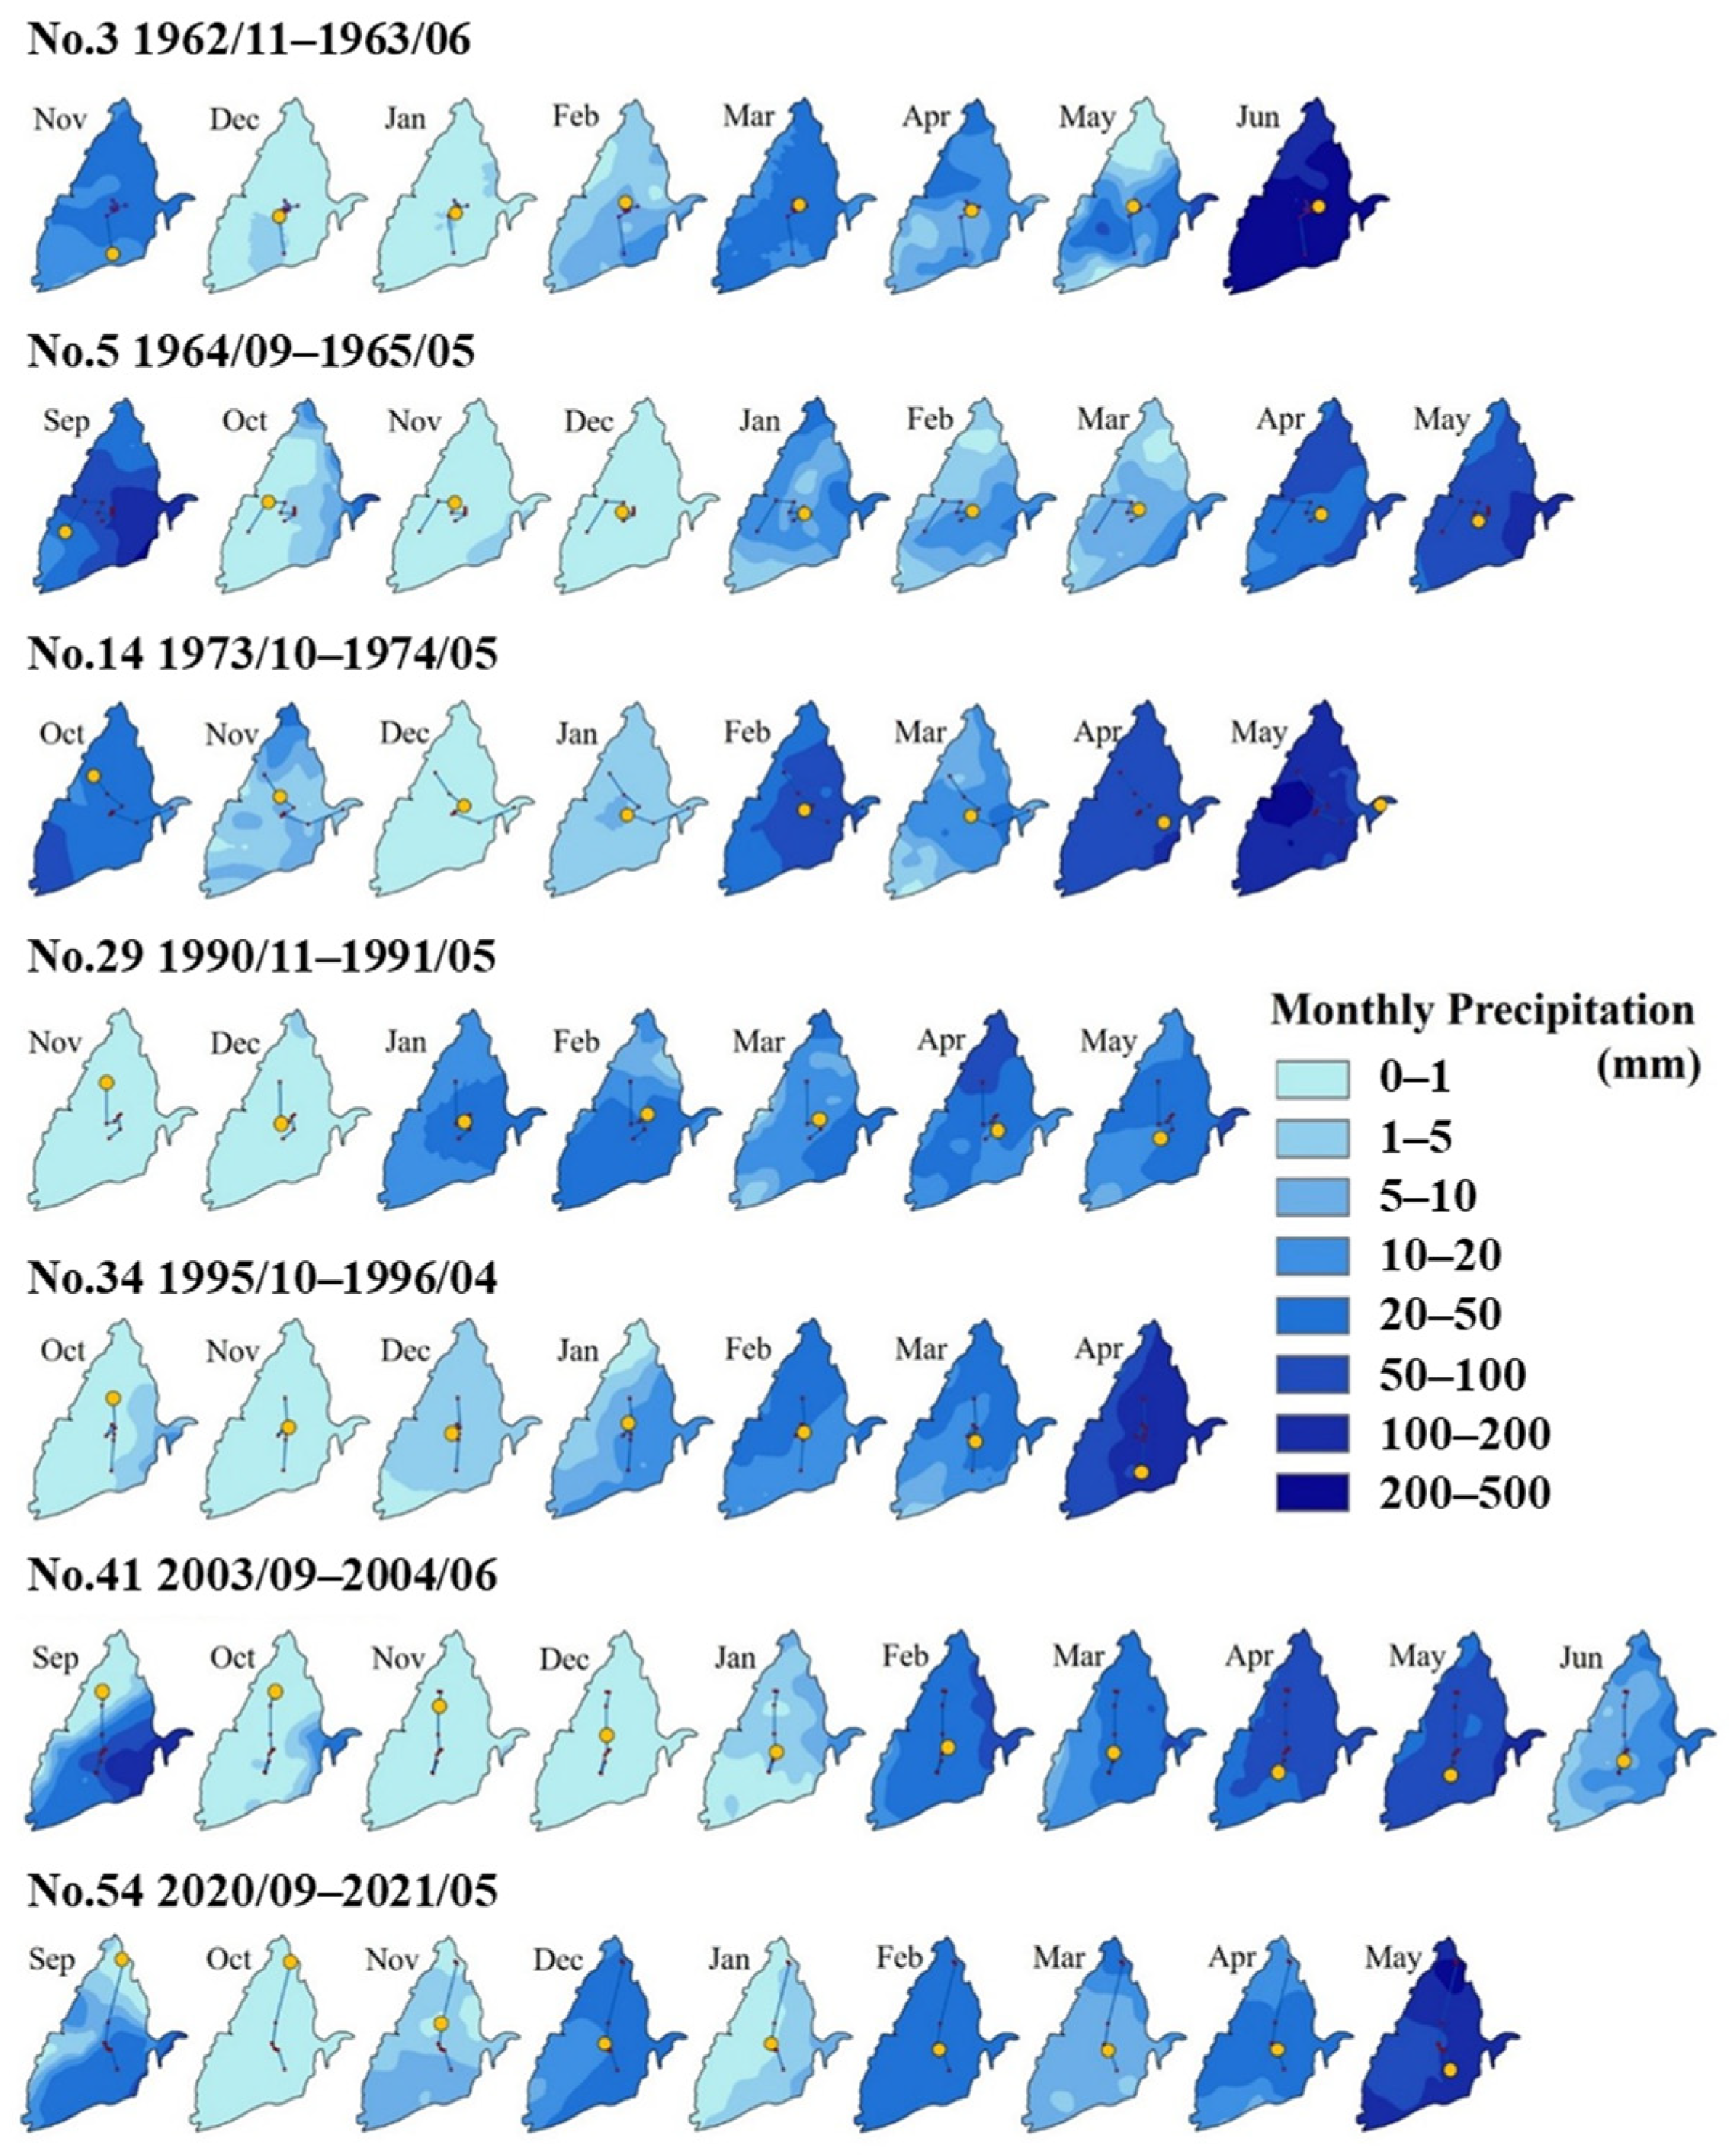
3.5. Links between Rainfall Patterns and Drought Paths

In order to understand the relationship between drought spatiotemporal paths and rainfall patterns, Figure 9 illustrates the monthly rainfall distribution during major drought events. The results highlight substantial spatial variations in rainfall between the northern and southern regions each month. To better understand how these differences influence the trajectory of drought paths, the Choushui River alluvial fan is divided into northern and southern regions based on its centroid location. Rainfall amounts are computed separately for the two regions. Figure 10 shows the cumulative percentage of rainfall in the northern and southern regions of the Choushui River alluvial fan. This analysis explores how the disparity in north–south rainfall distribution impacts the spatial migration process.
In the pre-period, major drought events exhibit significant divergence in spatiotemporal paths, with onset and end locations widely separated. Generally, the onset locations of drought events are significantly influenced by the monthly rainfall distribution. During the winter, drought centroids tend to approach and linger around the centroid of the Choushui River alluvial fan due to scarce winter rainfall in the whole study area. However, major drought events in the post-period follow the trajectory from north to south in the post-period. They all begin in the northern region of the Choushui River alluvial fan. During the winter, the drought centroids tend to approach and linger around the centroid of the Choushui River alluvial fan. In the late stage of drought events, the drought centroids tend to move southward and ultimately end in the southern region of the Choushui River alluvial fan, because the cumulative rainfall percentage in the northern region significantly exceeds that in the southern region.
Figure 10 indicates that in the post-period, there was a higher accumulation of rainfall from February to April, which may be related to the Pacific Decadal Oscillation (PDO). Numerous studies have highlighted that during positive phases of the PDO index, sea surface temperatures in the tropical central and eastern Pacific are warmer. This warming induces anomalous flow patterns of low-level anticyclones over the Philippine Sea. This leads to more spring rainfall in Taiwan [52,53]. These findings align with the results of this study, indicating that the pre-period is mainly characterized by the negative PDO phase, whereas the post-period is predominantly associated with the positive PDO phase. Additionally, another factor influencing the interannual variation in spring rainfall is the El Niño–Southern Oscillation (ENSO). The ENSO, with a shorter periodicity compared to PDO, has a more profound impact on extreme events [54]. Jiang et al. [55] point out that since the late 1970s, there has been a significant positive correlation between Niño-3 SST during the cold season and subsequent spring rainfall in western Taiwan. Researchers found that there are substantial differences in the large-scale environmental conditions associated with heavy spring rainfall events during strong El Niño years compared to non-El Niño years. The intrusion of weak mid-latitude front systems into the eastern coastal areas of China, coupled with the low-level anticyclone over the Philippine Sea in the troposphere, is the primary factor leading to more heavy spring rainfall events in Taiwan during strong El Niño years.

4. Conclusions

This study employs the 3-month-scale Standardized Precipitation Index (SPI-3) to identify drought events in the Choushui River alluvial fan from 1960 to 2021. The SPI-3 is considered a suitable indicator for establishing a drought migration model. Appropriate marginal distribution functions and copula functions are used to construct a bivariate probability distribution and select major drought events. Additionally, a drought migration model is established for these seven major drought events to further analyze their development processes and spatiotemporal characteristics. The results reveal a total of 54 drought events. Regarding the spatiotemporal characteristics of drought events, our study indicates a notable difference in drought direction between the pre- and post-periods. In the pre-period, irregular directions are observed, while in the post-period, the probability of droughts moving southward is more than twice that of the pre-period. In terms of spatial distribution, there is also a noticeable difference in drought frequency between the pre- and post-periods. Subsequently, this study explores the probability of drought occurrence and selects seven major drought events through the construction of a bivariate probability distribution, providing a more realistic analysis of drought conditions compared to analyzing based on a single drought characteristic. Finally, the drought migration model demonstrates that the paths in the pre-period are diverse, while the paths in the post-period of drought events all follow a trajectory from north to south. This is primarily attributed to higher rainfall in the northern region from February to April, leading to a consistent southward movement of drought centroids. It implies that changes in rainfall patterns and climate conditions can be discerned through the meteorological drought migration model. This study proposes that climate change is a primary factor influencing changes in the spatiotemporal paths of drought. Additionally, it provides potential for simplifying drought-monitoring methods. However, this study only relies on historical precipitation data to establish the drought migration model and assess changes in the climatic conditions of the study area. To deepen our understanding of drought conditions in the Choushui River alluvial fan and provide guidance for future government water resource management, this study contends that establishing a drought migration model for future drought events can estimate their development and forecast their distribution, enabling early implementation of water resource management and adaptation strategies to mitigate the adverse impacts of drought. These findings provide further insight into the dynamic process of drought and serve as valuable references for future water resource management.

Author Contributions

H.-F.Y. and X.-Y.L. carried out the conception of this work. C.-C.H. and H.-Y.C. performed material acquisition, interpretation, and curation. X.-Y.L. performed the data visualization and prepared the original draft. H.-F.Y. supervised the writing, reviewing, and editing. All authors have read and agreed to the published version of the manuscript.

Funding

This research was funded by the National Science and Technology Council, grant number 111-2621-M-006-004.

Data Availability Statement

The data that support the findings of this study are available from the corresponding author, H.-F.Y., upon reasonable request.

Conflicts of Interest

The authors declare no conflicts of interest.

References

  1. UNEP. UNEP Emissions Gap Report; UNEP: Nairobi, Kenya, 2022. [Google Scholar]
  2. Qing, Y.; Wang, S.; Yang, Z.-L.; Gentine, P. Soil moisture−atmosphere feedbacks have triggered the shifts from drought to pluvial conditions since 1980. Commun. Earth Environ. 2023, 4, 254. [Google Scholar] [CrossRef]
  3. Beniston, M.; Stephenson, D.B. Extreme climatic events and their evolution under changing climatic conditions. Glob. Planet. Change 2004, 44, 1–9. [Google Scholar] [CrossRef]
  4. Smith, A.B.; Matthews, J.L. Quantifying uncertainty and variable sensitivity within the US billion-dollar weather and climate disaster cost estimates. Nat. Hazards 2015, 77, 1829–1851. [Google Scholar] [CrossRef]
  5. Pokhrel, Y.; Felfelani, F.; Satoh, Y.; Boulange, J.; Burek, P.; Gädeke, A.; Gerten, D.; Gosling, S.N.; Grillakis, M.; Gudmundsson, L.; et al. Global terrestrial water storage and drought severity under climate change. Nat. Clim. Chang. 2021, 11, 226–233. [Google Scholar] [CrossRef]
  6. Liu, X.; Ma, Q.; Yu, H.; Li, Y.; Li, L.; Qi, M.; Wu, W.; Zhang, F.; Wang, Y.; Zhou, G.; et al. Climate warming-induced drought constrains vegetation productivity by weakening the temporal stability of the plant community in an arid grassland ecosystem. Agric. For. Meteorol. 2021, 307, 108526. [Google Scholar] [CrossRef]
  7. Ji, Y.; Li, Y.; Yao, N.; Biswas, A.; Zou, Y.; Meng, Q.; Liu, F. The lagged effect and impact of soil moisture drought on terrestrial ecosystem water use efficiency. Ecol. Indic. 2021, 133, 108349. [Google Scholar] [CrossRef]
  8. Mehdipour, S.; Nakhaee, N.; Zolala, F.; Okhovati, M.; Foroud, A.; Haghdoost, A.A. A systematized review exploring the map of publications on the health impacts of drought. Nat. Hazards 2022, 113, 35–62. [Google Scholar] [CrossRef]
  9. Wilhite, D.; Glantz, M. Understanding: The drought phenomenon: The role of definitions. . Water Int. 1985, 10, 111–120. [Google Scholar] [CrossRef]
  10. Mishra, A.K.; Singh, V.P. A review of drought concepts. J. Hydrol. 2010, 391, 202–216. [Google Scholar] [CrossRef]
  11. Wood, E.F.; Schubert, S.D.; Wood, A.W.; Peters-Lidard, C.D.; Mo, K.C.; Mariotti, A.; Pulwarty, R.S. Prospects for Advancing Drought Understanding, Monitoring, and Prediction. J. Hydrometeorol. 2015, 16, 1636–1657. [Google Scholar] [CrossRef]
  12. Guo, H.; Bao, A.; Ndayisaba, F.; Liu, T.; Jiapaer, G.; El-Tantawi, A.M.; Maeyer, P.D. Space-time characterization of drought events and their impacts on vegetation in Central Asia. J. Hydrol. 2018, 564, 1165–1178. [Google Scholar] [CrossRef]
  13. McKee, T.B.; Doesken, N.J.; Kleist, J. The relationship of drought frequency and duration to time scales. In Proceedings of the 8th Conference on Applied Climatology, Anaheim, CA, USA, 17–22 January 1993; Volume 17, pp. 179–183. [Google Scholar]
  14. Palmer, W.C. Meteorological Drought; US Department of Commerce, Weather Bureau.: Silver Spring, MD, USA, 1965; Volume 30.
  15. Vicente-Serrano, S.M.; Beguería, S.; López-Moreno, J.I. A Multiscalar Drought Index Sensitive to Global Warming: The Standardized Precipitation Evapotranspiration Index. J. Clim. 2010, 23, 1696–1718. [Google Scholar] [CrossRef]
  16. Ashraf, M.; Routray, J.K. Spatio-temporal characteristics of precipitation and drought in Balochistan Province, Pakistan. Nat. Hazards 2015, 77, 229–254. [Google Scholar] [CrossRef]
  17. Damberg, L.; AghaKouchak, A. Global trends and patterns of drought from space. Theor. Appl. Climatol. 2014, 117, 441–448. [Google Scholar] [CrossRef]
  18. Allen, R.; Pereira, L.; Raes, D.; Smith, M. Crop Evapotranspiration-Guidelines for Computing Crop Water Requirements-FAO Irrigation and Drainage Paper 56; FAO: Rome, Italy, 1998; Volume 300.
  19. Xu, K.; Yang, D.; Yang, H.; Li, Z.; Qin, Y.; Shen, Y. Spatio-temporal variation of drought in China during 1961–2012: A climatic perspective. J. Hydrol. 2015, 526, 253–264. [Google Scholar] [CrossRef]
  20. Yeh, H.-F. Spatiotemporal Variation of the Meteorological and Groundwater Droughts in Central Taiwan. Front. Water 2021, 3, 636792. [Google Scholar] [CrossRef]
  21. Yeh, H.-F. Using integrated meteorological and hydrological indices to assess drought characteristics in southern Taiwan. Hydrol. Res. 2019, 50, 901–914. [Google Scholar] [CrossRef]
  22. Yeh, H.-F.; Hsu, H.-L. Stochastic Model for Drought Forecasting in the Southern Taiwan Basin. Water 2019, 11, 2041. [Google Scholar] [CrossRef]
  23. Li, L.; She, D.; Zheng, H.; Lin, P.; Yang, Z.-L. Elucidating Diverse Drought Characteristics from Two Meteorological Drought Indices (SPI and SPEI) in China. J. Hydrometeorol. 2020, 21, 1513–1530. [Google Scholar] [CrossRef]
  24. Naz, F.; Dars, G.H.; Ansari, K.; Jamro, S.; Krakauer, N.Y. Drought Trends in Balochistan. Water 2020, 12, 470. [Google Scholar] [CrossRef]
  25. Lloyd-Hughes, B.; Saunders, M.A. A drought climatology for Europe. Int. J. Climatol. A J. R. Meteorol. Soc. 2002, 22, 1571–1592. [Google Scholar] [CrossRef]
  26. Mishra, A.K.; Singh, V.P. Drought modeling—A review. J. Hydrol. 2011, 403, 157–175. [Google Scholar] [CrossRef]
  27. Genest, C.; Favre, A.-C. Everything You Always Wanted to Know about Copula Modeling but Were Afraid to Ask. J. Hydrol. Eng. 2007, 12, 347–367. [Google Scholar] [CrossRef]
  28. Goel, N.K.; Seth, S.M.; Chandra, S. Multivariate Modeling of Flood Flows. J. Hydraul. Eng. 1998, 124, 146–155. [Google Scholar] [CrossRef]
  29. Yue, S. Applying bivariate normal distribution to flood frequency analysis. Water Int. 1999, 24, 248–254. [Google Scholar] [CrossRef]
  30. Yue, S.; Ouarda, T.B.M.J.; Bobée, B. A review of bivariate gamma distributions for hydrological application. J. Hydrol. 2001, 246, 1–18. [Google Scholar] [CrossRef]
  31. Singh, K.; Singh, V.P. Derivation of bivariate probability density functions with exponential marginals. Stoch. Hydrol. Hydraul. 1991, 5, 55–68. [Google Scholar] [CrossRef]
  32. Yue, S.; Ouarda, T.B.M.J.; Bobée, B.; Legendre, P.; Bruneau, P. The Gumbel mixed model for flood frequency analysis. J. Hydrol. 1999, 226, 88–100. [Google Scholar] [CrossRef]
  33. Shiau, J.T. Return period of bivariate distributed extreme hydrological events. Stoch. Environ. Res. Risk Assess. 2003, 17, 42–57. [Google Scholar] [CrossRef]
  34. Le, H.M.; Corzo, G.; Medina, V.; Diaz, V.; Nguyen, B.L.; Solomatine, D.P. A Comparison of Spatial–Temporal Scale between Multiscalar Drought Indices in the South Central Region of Vietnam. In Spatiotemporal Analysis of Extreme Hydrological Events; Elsevier: Amsterdam, The Netherlands, 2019; pp. 143–169. [Google Scholar] [CrossRef]
  35. Diaz, V.; Perez, G.A.C.; Lanen, H.A.J.V.; Solomatine, D.; Varouchakis, E.A. Characterisation of the dynamics of past droughts. Sci. Total Environ. 2020, 718, 134588. [Google Scholar] [CrossRef]
  36. Herrera-Estrada, J.E.; Satoh, Y.; Sheffield, J. Spatiotemporal dynamics of global drought. Geophys. Res. Lett. 2017, 44, 2254–2263. [Google Scholar] [CrossRef]
  37. Zhou, H.; Liu, Y.; Liu, Y. An Approach to Tracking Meteorological Drought Migration. Water Resour. Res. 2019, 55, 3266–3284. [Google Scholar] [CrossRef]
  38. Han, Z.; Huang, Q.; Huang, S.; Leng, G.; Bai, Q.; Liang, H.; Wang, L.; Zhao, J.; Fang, W. Spatial-temporal dynamics of agricultural drought in the Loess Plateau under a changing environment: Characteristics and potential influencing factors. Agric. Water Manag. 2021, 244, 106540. [Google Scholar] [CrossRef]
  39. Wang, Y.-L. Characterizing Subsurface Hydraulic Characteristics at Zhuoshui River Alluvial Fan, Taiwan; The University of Arizona ProQuest Dissertations Publishing: Tucson, AZ, USA, 2016. [Google Scholar]
  40. Yeh, H.-F.; Chang, C.-F. Using Standardized Groundwater Index and Standardized Precipitation Index to Assess Drought Characteristics of the Kaoping River Basin, Taiwan. Water Resour. 2019, 46, 670–678. [Google Scholar]
  41. Sklar, A. Random variables, joint distribution functions, and copulas. Kybernetika 1973, 9, 449–460. [Google Scholar]
  42. Guo, Y.; Zhang, J.; Li, K.; Aru, H.; Feng, Z.; Liu, X.; Tong, Z. Quantifying hazard of drought and heat compound extreme events during maize (Zea mays L.) growing season using Magnitude Index and Copula. Weather Clim. Extrem. 2023, 40, 100566. [Google Scholar] [CrossRef]
  43. Brunner, M.I. Floods and droughts: A multivariate perspective. Hydrol. Earth Syst. Sci. 2023, 27, 2479–2497. [Google Scholar] [CrossRef]
  44. Pandey, V.; Pandey, P.K.; Lalrammawii, H.P. Characterization and return period analysis of meteorological drought under the humid subtropical climate of Manipur, northeast India. Nat. Hazards Res. 2023, 3, 546–555. [Google Scholar] [CrossRef]
  45. Nelsen, R.B. An Introduction to Copulas; Springer: Berlin/Heidelberg, Germany, 2006. [Google Scholar]
  46. Genest, C.; Rémillard, B.; Beaudoin, D. Goodness-of-fit tests for copulas: A review and a power study. Insur. Math. Econ. 2009, 44, 199–213. [Google Scholar] [CrossRef]
  47. Tsakiris, G.; Kordalis, N.; Tigkas, D.; Tsakiris, V.; Vangelis, H. Analysing Drought Severity and Areal Extent by 2D Archimedean Copulas. Water Resour. Manag. 2016, 30, 5723–5735. [Google Scholar] [CrossRef]
  48. Friedman, M. On the analysis and solution of certain geographical optimal covering problems. Comput. Oper. Res. 1976, 3, 283–294. [Google Scholar] [CrossRef]
  49. Johnston, K.; Hoef, J.V.; Krivoruchko, K.; Lucas, N. Using ArcGIS Geostatistical Analyst; Esri Press: Washington, DC, USA, 2001. [Google Scholar]
  50. Dai, M.; Huang, S.; Huang, Q.; Leng, G.; Guo, Y.; Wang, L.; Fang, W.; Li, P.; Zheng, X. Assessing agricultural drought risk and its dynamic evolution characteristics. Agric. Water Manag. 2020, 231, 106003. [Google Scholar] [CrossRef]
  51. Kao, S.-C.; Govindaraju, R.S. A copula-based joint deficit index for droughts. J. Hydrol. 2010, 380, 121–134. [Google Scholar] [CrossRef]
  52. Hung, C.-w.; Hsu, H.-H.; Lu, M.-M. Decadal oscillation of spring rain in northern Taiwan. Geophys. Res. Lett. 2004, 31. [Google Scholar] [CrossRef]
  53. Hau, N.-X.; Sano, M.; Nakatsuka, T.; Chen, S.-H.; Chen, I.-C. The modulation of Pacific Decadal Oscillation on ENSO-East Asian summer monsoon relationship over the past half-millennium. Sci. Total Environ. 2022, 857, 159437. [Google Scholar] [CrossRef] [PubMed]
  54. Weng, S.-P. Constructing a 1-km Gridded Multi-Scalar Drought Index Dataset (1960–2012) in Taiwan Based on the Standardized Precipitation Evapotranspiration Index-SPEI. Terr. Atmos. Ocean. Sci. 2016, 27, 625–648. [Google Scholar] [CrossRef]
  55. Jiang, Z.; Chen, G.T.-J.; Wu, M.-C. Large-Scale Circulation Patterns Associated with Heavy Spring Rain Events over Taiwan in Strong ENSO and Non-ENSO Years. Mon. Weather Rev. 2003, 131, 1769–1782. [Google Scholar] [CrossRef]
Figure 1. The geographical information map of the Choushui River alluvial fan.
Geosciences 14 00106 g001
Figure 2. Schematic diagram of drought migration model.
Geosciences 14 00106 g002
Figure 3. The relative positions of onset and end locations of drought events. The purple star represents the centroid of the Choushui River alluvial fan, red triangles indicate the onset locations, and blue circles indicate the end locations.
Geosciences 14 00106 g003
Figure 4. (a) Directions of drought events in each year; (b) the increased probability of southward-moving drought events after each year.
Geosciences 14 00106 g004
Figure 5. Spatial distribution of drought frequency in the (a) entire study period, (b) pre-period, and (c) post-period.
Geosciences 14 00106 g005
Figure 6. The joint probability distribution of Dc(SPI ≤ −2) and dd. Drought events located in the pink region are selected as the major drought events. Blue dots represent non-major drought events, and red dots represent major drought events.
Geosciences 14 00106 g006
Figure 7. Spatiotemporal paths of major drought events in the pre-period (before 1981).
Geosciences 14 00106 g007
Figure 8. Spatiotemporal paths of major drought events in the post-period (after 1981).
Geosciences 14 00106 g008
Figure 9. Distribution of rainfall and drought paths for major drought events. Red dots denote the centroids of drought events for all months within the drought event, yellow dots represent the drought centroids in the current month, and blue lines depict the drought paths.
Geosciences 14 00106 g009
Figure 10. Cumulative percentage of rainfall for major drought events in the northern and southern regions of the Choushui River alluvial fan.
Geosciences 14 00106 g010
Table 1. Probability of directions for drought events.
TimeSESESWOthers
all38.9%14.8%14.8%14.8%16.7%
pre-period
(1960–1981)
23.8%23.8%23.8%9.5%19.0%
post-period
(1981–2021)
48.5%9.1%9.1%18.2%15.2%
Table 2. The log-likelihood ratio, AIC, and BIC values for marginal functions.
dd
DistributionsLoglikelihoodAICBIC
exponential−153.358308.7158310.7048
lognormal−98.49200.97204.95
gamma−97.08198.16202.14
Weibull−97.08198.16202.14
Dc(SPI ≤ −2)
DistributionsLoglikelihoodAICBIC
exponential−229.61461.21463.20
lognormal−167.55339.09343.07
gamma−143.38290.76294.73
Weibull−153.32310.63314.61
Table 3. The θ, AIC, and BIC values for Archimedean copula functions.
Clayton CopulaGumbel CopulaFrank Copula
θ0.321.221.3
AIC0.47−2.580.11
BIC2.44−0.612.08
Disclaimer/Publisher’s Note: The statements, opinions and data contained in all publications are solely those of the individual author(s) and contributor(s) and not of MDPI and/or the editor(s). MDPI and/or the editor(s) disclaim responsibility for any injury to people or property resulting from any ideas, methods, instructions or products referred to in the content.

