Article

Mapping the Flood Vulnerability of Residential Structures: Cases from The Netherlands, Puerto Rico, and the United States

by
Nicholas D. Diaz
1,2,*,
Yoonjeong Lee
1,2,
Baukje L. M. Kothuis
3,4,
Ismael Pagán-Trinidad
5,
Sebastiaan N. Jonkman
4 and
Samuel D. Brody
1,2
1
Institute for a Disaster Resilient Texas, Texas A&M University, College Station, TX 77843, USA
2
Department of Marine and Coastal Environmental Science, Texas A&M University at Galveston, Galveston, TX 77553, USA
3
Netherlands Business Support Office, Houston, TX 77002, USA
4
Department of Hydraulic Engineering and Flood Risk, Faculty of Civil Engineering and Geosciences, Delft University of Technology, 2628 CN Delft, The Netherlands
5
URPM Coastal Resilience Center, Department of Civil Engineering and Surveying, University of Puerto Rico, P.O. Box 9041, Mayagüez 00681, Puerto Rico
*
Author to whom correspondence should be addressed.
Geosciences 2024, 14(4), 109; https://doi.org/10.3390/geosciences14040109
Submission received: 6 March 2024 / Revised: 11 April 2024 / Accepted: 16 April 2024 / Published: 19 April 2024
(This article belongs to the Special Issue Flood Risk Reduction)

Abstract

:
Floods are consistently ranked as the most financially devastating natural disasters worldwide. Recent flood events in the Netherlands, Caribbean, and US have drawn attention to flood risks resulting from pluvial and fluvial sources. Despite shared experiences with flooding, these regions employ distinct approaches and flood management strategies due to differences in governance and scale—offering a three-site case study comparison. A key, yet often lacking, factor for flood risk and damage assessments at the parcel level is building elevation compared to flood elevation. First-floor elevations (FFEs) are a critical element in the vulnerability of a building flooding. US-based flood insurance policies require FFEs; however, data availability limitations exist. Drone-based FFEs were measured in all locations to assess the flood vulnerabilities of structures. Flood vulnerability profiles revealed 64% of buildings were vulnerable to a form of inundation, with 40% belonging to “moderate” or “major” inundation, and inundation elevation means (IEMs) of −0.55 m, 0.19 m, and 0.71 m within the US, Netherlands, and Puerto Rico sites, respectively. Spatial statistics revealed FFEs were more responsible for flood vulnerabilities in the US site while topography was more responsible in the Netherlands and Puerto Rico sites. Additional findings in the Puerto Rico site reveal FFEs and next highest floor elevations (NHFEs) vulnerable to future sea level rise (SLR) flood elevations. The findings within the Netherlands provide support for developing novel multi-layered flood risk reduction strategies that include building elevation. We discuss future work recommendations and how the different sites could benefit significantly from strengthening FFE requirements.

1. Introduction

Floods remain the costliest and most frequently occurring natural disaster globally. Communities must prepare for and respond to both acute events, such as hurricanes, as well as more chronic urban flooding episodes [1,2,3,4,5]. Coastal flooding occurs when low-lying land is inundated by rising seawater due to climate change, ocean wind-driven waves, astronomical tides, storm surges, and tsunamis. More recently, nuisance flooding in urban environments from pluvial (rainfall) or fluvial (riverine) sources has become a greater concern [6]. Regardless of coastal or inland influence, independent sources of flooding can, and often do, compound, resulting in simultaneous, non-linear increases in flood impacts [7]. Coastal megacities are positioned perfectly to receive impacts from compound flooding due to the natural spatial proximity to (sometimes encompassing) river delta regions. Future flood impacts within these cities are expected, exacerbated by expanding development, sea level rise (SLR), and rises in rainfall intensity and frequency [8,9,10,11]. Consequently, flood risk analysis remains a critical component in influencing flood-mitigative measures and promoting flood resilience within vulnerable regions [12,13,14,15].
While various tools and assessments have been developed, in general, three components inform flood risk analysis: (1) flood hazard, (2) exposure, and (3) vulnerability [16,17,18]. A flood hazard is the threat of a natural or human-exacerbated flood event often expressed in probability and magnitude such as flood occurrence, depth, velocity, and other flood conditions and parameters. Exposure identifies which individuals and assets are expected to have a threat to life or economic loss relationship with a flood hazard based on geospatial proximity. Vulnerability examines individual and asset preparedness, sensitivity, and other socioeconomic or physical measures that mitigate against or inflict loss of life and financial damage. This study aims to address physical exposure and physical vulnerability by investigating the elevational component of buildings. Physical exposure to floods often references floodplain delineation-intersecting individuals or assets (buildings); however, lacking knowledge on building characteristics misinforms us about whether the individuals and buildings are physically vulnerable to floods [19,20]. In other words, a building may be exposed (or not) to a floodplain (horizontal); however, this does not necessarily inform that the building will experience flood damage based on the elevational (vertical) component, and to what magnitude.
Elevational flood risk concerns building elevation and the individuals within, relative to the flood elevation. First-floor elevations (FFEs) are critical measures to assess elevational flood risk and perform flood damage assessments. FFEs, also referred to as finished-floor elevation or lowest-floor elevation, can be defined as the minimum elevation of the first enclosed serviceable floor, including basements, relative to a vertical datum [19]. Thus, FFEs inform the vulnerability to flood damage and threat to life of individuals within residential buildings. Better thought, if the flood elevation is above the FFE, inundation of the building occurs. Inversely, inundation does not occur if a building maintains a “freeboard” or the FFE is above the flood elevation. Flood insurance policies for homeowners within floodplain designations set FFEs as requirements within the United States (US) and Puerto Rico (PR). In the Netherlands (NL), these measures are often referred to as “ground floor” and are not required for homeowners under any policies. Due to the lack of availability, uncertainties, and limitations inherent in US insurance-based elevation certificates (ECs), demand for alternative sources for building elevation information is increasing. Traditional tacheometric surveying methods during and post-construction are time-consuming and costly, requiring hours to days and sometimes exceeding USD 500 (2024) per structure. Advancements in scanning and remote sensing technologies have allowed researchers to collect enormous amounts of accurate geospatial data that can be leveraged to derive building elevation data in a more efficient, cost-effective manner [21,22,23]. Multi-rotor drones and vehicle-based light detection and ranging (LiDAR) are especially scalable and adaptable to urban environments [24,25,26,27]. FFEs and other structural elevations accurate to traditional measures have been derived or imputed utilizing a variety of remote sensing and machine learning methodologies [28,29,30,31,32]. In this study, a comparative multinational case study analysis of residential communities is presented using a drone-based methodology to derive FFEs and assess parcel-level flood vulnerability. Specifically, we address elevational flood risk at multiple scales and the degree FFEs are considered in avoiding flood inundation and reducing flood vulnerability within the three distinct international study sites. We address the following research questions:
i.
What is the flood vulnerability of structures located in each country? And how do FFEs compare to water surface elevations, respectively?
ii.
What additional building elevation information should be considered to reduce flood vulnerabilities in the future?

1.1. From Tulips to the Tropics: Flood Management in the Netherlands, Puerto Rico, and the US

The Netherlands (NL) is recognized as a global leader in flood defense and resilience due to the country’s rich history and relationship with water [33,34,35,36]. The jurisdictional boundary of the NL captures a substantial portion of delta regions, including major rivers, such as the Rhine and Meuse, shared with adjacent countries Germany and Belgium. The Rhine River splits into other river branches, such as the Waal and Ijssel. In addition, there are smaller regional rivers, such as the Dommel and the Geul, within the NL. As a result, the country is dominated by a low-lying geography, with approximately 26% of the country residing below sea level and 55% being flood prone. Dutch flood management using dikes and embankments as well as land reclamation extends back to medieval times such as events like the St. Elizabeth’s Flood of 1421 and the All-Saints’ Flood of 1570 [37]. After the historic 1953 North Sea Flood, Dutch water management was advanced and intensified under the Delta Works—a system consisting of a series of dams and storm surge barriers protecting the southwest of the country against coastal flooding. Notable features of this initiative include the Veerse Gatdam (1961), Oosterscheldekering (Eastern Scheldt Barrier, 1986), Brouwersdam (1972), Haringvlietdam 1971, and the Maeslantkering (Maeslant Barrier, 1997), all spanning and connecting the southern coastal delta sand spits. Rijkswaterstaat (RWS), a Dutch executive agency of the Ministry of Infrastructure and Water Management, is responsible for the planning, construction, maintenance, and overall management of projects like the Delta Works throughout the NL. Recently, in December 2023, the Maeslantkering was officially closed for the third time (outside function testing) since its construction, in response to the high North Sea level. This event validated both the efficacy of protection measures and the system’s resilience to sea level rise resulting from climate change.
The Dutch approach has proven successful in preventing and reducing coastal flood risks, providing economic stability, and fostering a “living with water” ethos embedded in the relationship with water, rather than against it. However, the NL faces unpredictable challenges, alongside the rest of the world, with rapid growth and development synergized with environmental pressures (i.e., SLR, rainfall intensification) [38]. Impacts from these global challenges are echoed in the more recent pluvial and fluvial flooding events within the NL. Major flooding occurred on the Meuse River in 1993, 1995 and 2021, causing mass evacuation and significant damage to adjacent communities, particularly within Limburg. The flood events of 1993 and 1995 occurred in the winter, while that of 2021 occurred in the summer. The 2021 summer floods affected both the Meuse River as well as smaller regional rivers [39]. Flood damage was estimated at EUR 400M within Limburg alone (Figure 1b) [40]. Total flood damage estimates across the watershed, encompassing multiple countries, exceeded EUR 2B.
Puerto Rico (PR) is a Caribbean archipelago, with some of the furthest islands from the American continents within the North Atlantic Ocean. Thus, PR is naturally positioned and prone to a variety of natural disasters, caused by extreme rainfall due to hurricanes and tropical storms, earthquakes, and riverine and coastal flooding, including tsunamis. Cascading effects from these events include landslides and debris flows due to the steep slope variability originating from the mountainous island core [41]. Although records of major hurricanes extend back to the pre-Columbian era, flood mitigation efforts were limited prior to the mid-20th century [42,43]. Hurricane San Ciriaco in 1899, one of the deadliest hurricanes in Puerto Rico history, drew attention to the urgent need for improved flood defense measures. The Spanish–American War occurred just the year before (1898), whereby Puerto Rico became an unincorporated territory of the US under the Treaty of Paris. In 1952, a constitution was enacted providing for internal self-government. Since then, Puerto Rico has been an incorporated, organized territory of the United States with commonwealth status. The governing history of PR and constant occurrence of major hurricanes have contributed to a fluctuating social wellbeing status and other economic challenges that make flood mitigation implementation difficult [44,45].
Post-1950s, PR implemented significant flood mitigation, water management, and river basin planning initiatives, including the construction of 36 artificial lakes and dams since the beginning of the 20th century. Although many of these lakes were built with a particular objective, several have been modified, and they serve water supply, irrigation, sediment control, hydropower, fishing, recreation, and flood control. Carraízo (1954) and the La Plata (1974) dams are located on the south urban edge of San Juan and have assisted in protecting critical infrastructure, residential properties, and cultural resources near the San Juan Metropolitan area [46] (Figure 1c). Dos Bocas (1942) is south of Arecibo city on the north coast and has mitigated part of the Rio Grande de Arecibo floods. Most recently, Toa Vaca (1972), Cerrillos (1992) and Portuguez (2014) were built to protect and mitigate frequent catastrophic floods in the coastal city of Ponce on the Island’s south coast. They also serve water supply and other purposes. Agencies responsible for the planning, construction, and maintenance of these projects include PR Department of Natural and Environmental Resources (PRDNER), the Federal Emergency Management Agency (FEMA), the US Geological Survey (USGS), and the US Army Corps of Engineers (USACE) along with other federal, state, and local actors. Despite these measures, flood defense is ongoing, and PR continues to experience catastrophic hurricane events while relying on recovery as the primary vehicle for disaster preparedness [47]. Some more recent and notable hurricanes include Hurricane Georges (1998), Hurricane Irma (2017), Hurricane Maria (2017) and Hurricane Fiona, causing USD 11.3B, 62B, 111.6B, and 1.2B in damage, respectively (2023 USD adjusted). The Government of PR has worked closely with FEMA over the past 15 months to provide direct assistance to citizens to municipalities, government agencies and non-profit institutions through the Central Office for Recovery, Reconstruction and Resiliency (COR3) and its Working Capital Advance (WCA) Program [48]. For PR policyholders, recovery for flood damage occurs through the US-based FEMA National Flood Insurance Program (NFIP).
The US occupies approximately 40% of the North American continent exhibiting vast geographic diversity and high coastal exposure with three coastal regions—the Atlantic Ocean, the Gulf of Mexico (GoM), and the Pacific Ocean. More than half of the US states share oceanic or Great Lakes coastlines, and these geographic factors render sizable portions of the country prone to hazards, especially flooding [49,50,51]. States disconnected from the mainland, such as Alaska and Hawaii, also experience flooding from glacial and oceanic sources [52,53]. The 1900 Galveston Hurricane and 1927 Great Mississippi Flood prompted federal interest in investing in flood control measures along the river and associated tributaries [54]. After a decade of efforts and continued flood events, the Flood Control Act of 1936 gave the USACE authority over federal flood control projects, marking a significant step in the development of national flood defense. After World War II, increased urbanization and development in flood-prone areas gave passage to the National Flood Insurance Act of 1968, which created the NFIP. While other acts, such as the Water Resources Development Act of 1986 encouraged more comprehensive and sustainable ecosystem restoration measures for flood defense, the NFIP became the predominant mechanism for flood mitigation and recovery [55,56].
From 1978 to 2022, three of the top five states responsible for approximately 67% of total flood insurance claims, are within the GoM region: (1) Texas, (2) New York, (3) New Jersey, (4) Louisiana, and (5) Florida (Figure 1a)—with GoM counties Harris (TX), Jefferson (LA), Orleans (LA), Miami-Dade (FL), and Galveston (TX) representing the top five recipient counties [57]. Notable hurricanes that contributed to these claims and sparked reevaluation for flood defense strategies, include Hurricanes Andrew (1992), Katrina (2005), Ike (2008), Sandy (2012), Harvey (2017), and Maria (2017) amounting to USD 58.9B, 195B, 42B, 86.5B, 155B, and 111.6B in estimated damage, respectively (2023 USD adjusted). Today, the US continues to explore flood defense strategies that complement the NFIP to reduce the increasing occurrence of billion-dollar disasters.

1.2. Current Flood Risk Standards within the NL, PR, and the US

The NL approach generally focuses on prevention, while the US and PR approach relies heavily on recovery for flood risk reduction [58,59]. While political and cultural contexts contribute to these differences in approach, both approaches have great utility under various flood sources and scenarios. However, this study does not aim to compare these approaches; rather, it aims to dive deeper into the technical intricacies of how FFEs situate within both prevention and recovery interfacing with flood risk estimation and reduction. Flood extents, depths and probabilities within the NL are provided through the National Water and Floods Information System (LIWO) a product of the Netherlands Water Management Center (WMCN), all managed under RWS [60]. Classifications for flood risk depth scenarios are expressed in meters (m) or centimeters (cm) above ground height for a location. Classifications for (acceptable) flood risks are expressed on a probability per year basis ranging from “High probability: >1/30 per year” to “Extremely small probability: <1/100,000 per year”. Under Dutch national flood policy, the accepted minimal safety standard for major coastal and riverine flooding is expressed based on an acceptable probability of flood occurrence [61]. Across most of the NL, this is typically 1/10,000 per year for high-value coastal and river areas. Other smaller areas with lower flood impacts maintain safety standards of 1/000 per year and 1/100 per year, respectively. For local pluvial or nuisance flooding from direct rainfall or flooding of smaller regional rivers typical standards range from 1/100 per year for urban areas to 1/10 per year for agricultural areas.
The spatial extent of different water surface elevations (WSEs) and temporal scenarios are computationally modeled using probabilistic hydrologic and hydraulic (H&H) software (i.e., HydroMT, Hydra-NL) [62,63,64]. These models produce flood depths in gridded-cell form through simulated dike failures by “stress testing” under conditions such as overflow, geotechnical instability (i.e., structure, erosion, slope), and other mechanisms. A more comprehensive review of well-known H&H and flood modeling tools, such as ADCIRC, Delft3D, Mike and more, can be seen in [65,66]. While this modeling is highly technical and occurs over large scales, uncertainties can exist at smaller scales within urban outputs due to the low-resolution spatial and topographic inputs [67,68]. High-resolution (0.5–1 m) satellite-based LiDAR digital terrain models (DTMs) struggle to capture urban hydraulic control features accurately (i.e., bridges, curbs, drainage infrastructure, etc.), giving rise to complimentary terrestrial and airborne remote sensing technologies that assist in reducing uncertainties at these scales [69,70,71,72,73]. However, these outputs still do not inform which structures are vulnerable to the flood elevation and to what degree. Thus, creating further uncertainty in flood risk estimation and damage analyses, which has been a common limitation in relevant literature [74,75,76,77]. In addition to the flood protection standards, Dutch flood policy also includes the concept of “multi-layer safety” indicating that flood protection should be combined with land use planning and emergency management [78]. Further, there is increasing attention to adapt land use and new housing developments to flood and drought hazards. Despite these developments, the Netherlands does not have direct requirements or policies for building elevations for flood mitigation. Table 1 presents the regulatory flood risk standards for the NL, PR, and the US.
Regulatory flood extents, depths and probabilities for PR and the US are provided under FEMA-NFIP. WSEs, often referred to as advisory base flood elevations (ABFEs), are expressed in meters (m) or feet (ft) above a tidal or geodetic vertical control [79,80]. Higher resolution topographic elevations at the watershed scale are provided where base-level engineering (BLE) data are available [81]. ABFEs designate two primary classifications of flood extents and probabilities, or flood zones, also provided within FIRMs and are expressed on a chance per year basis. Zones with the highest risk of flooding are special flood hazard areas (SFHAs) and maintain a ABFE with a 1-percent annual exceedance probability (AEP), often referred to as the 100-year floodplain. Zones with lower risk of flooding are outside the limits of SFHAs but maintain an ABFE with a 0.2 percent AEP, often referred to as the 500-year floodplain. Like the NL, these elevations and floodplain extents are also generated using various H&H modeling software, such as the Hydrologic Engineering Center-River Analysis System (HEC-RAS) and face similar uncertainties within the built environment pertaining to low-resolution spatial and terrain data [82,83]. HEC-RAS has been widely used for various applications, including dam breach analysis, flood impact assessment, flood risk and hazard studies, and flood mitigation planning [84,85,86]. However, contrariwise to the NL, these flood depths and extents serve as regulatory thresholds for writing flood insurance premiums for homeowners located in SFHAs. A critical measure for estimating flood insurance premiums relative to the ABFE, is a structures’ FFE [87]. Using a total station (a mechanical or electrical surveying instrument used to trigonometrically measure horizontal and vertical axis and points with millimeter accuracy and precision), land surveyors and engineers assist in professionally measuring a structures’ FFE to sign and complete ECs [88] (Figure 2).
ECs serve as an essential tool for homeowner compliance, discounted rates, and voluntary participation in other flood mitigation programs, such as the community rating system (CRS), under the NFIP [89,90]. However, ECs, and the building elevation information within (i.e., FFEs), present a variety of data availability limitations and interpretation uncertainties for flood risk estimation [31,75]. First, ECs did not become mandatory until October 2000; therefore, copious amounts of the current and historical US building stock were not captured. Second, ECs of captured homes are limited to physical paper form under private insurance companies or local municipalities, making digitally recorded data even less available. Third, ECs have been completed by a variety of surveying and engineering contractors across multiple decades under different NFIP regulations and interpretations for FFE and flood zones, resulting in inconsistent data across large household datasets. Finally, FFEs within ECs are measured based on flood damage to property and contents, rather than flood risk to individuals. Under the NFIP, a FFE is defined as the first enclosed, serviceable floor, including basements. Structural foundation types, boarding and housing materials, and flood zones also determine the interpretation of an FFE. While these building elevations are critical for flood damage estimation, they do not necessarily accurately inform where the water will infiltrate, nor where a homeowner will experience threat to life. Flood damage and vulnerability estimation may differ based on elevation scenario and structural characteristics. For example, if a basement is recorded as the FFE, this elevation may not represent where water infiltrates to flood the basement, say from a broken peak window or the entry from the next highest floor. Further, if a floor is flooded, homeowners will resort to the next highest floor elevation (NHFE), or rooftop access, if available. In other words, FFEs are a critical measure for evaluating structure vulnerability; however, incorporating additional building information within ECs as well as more building information outside of ECs, is required for flood risk to individuals living within.

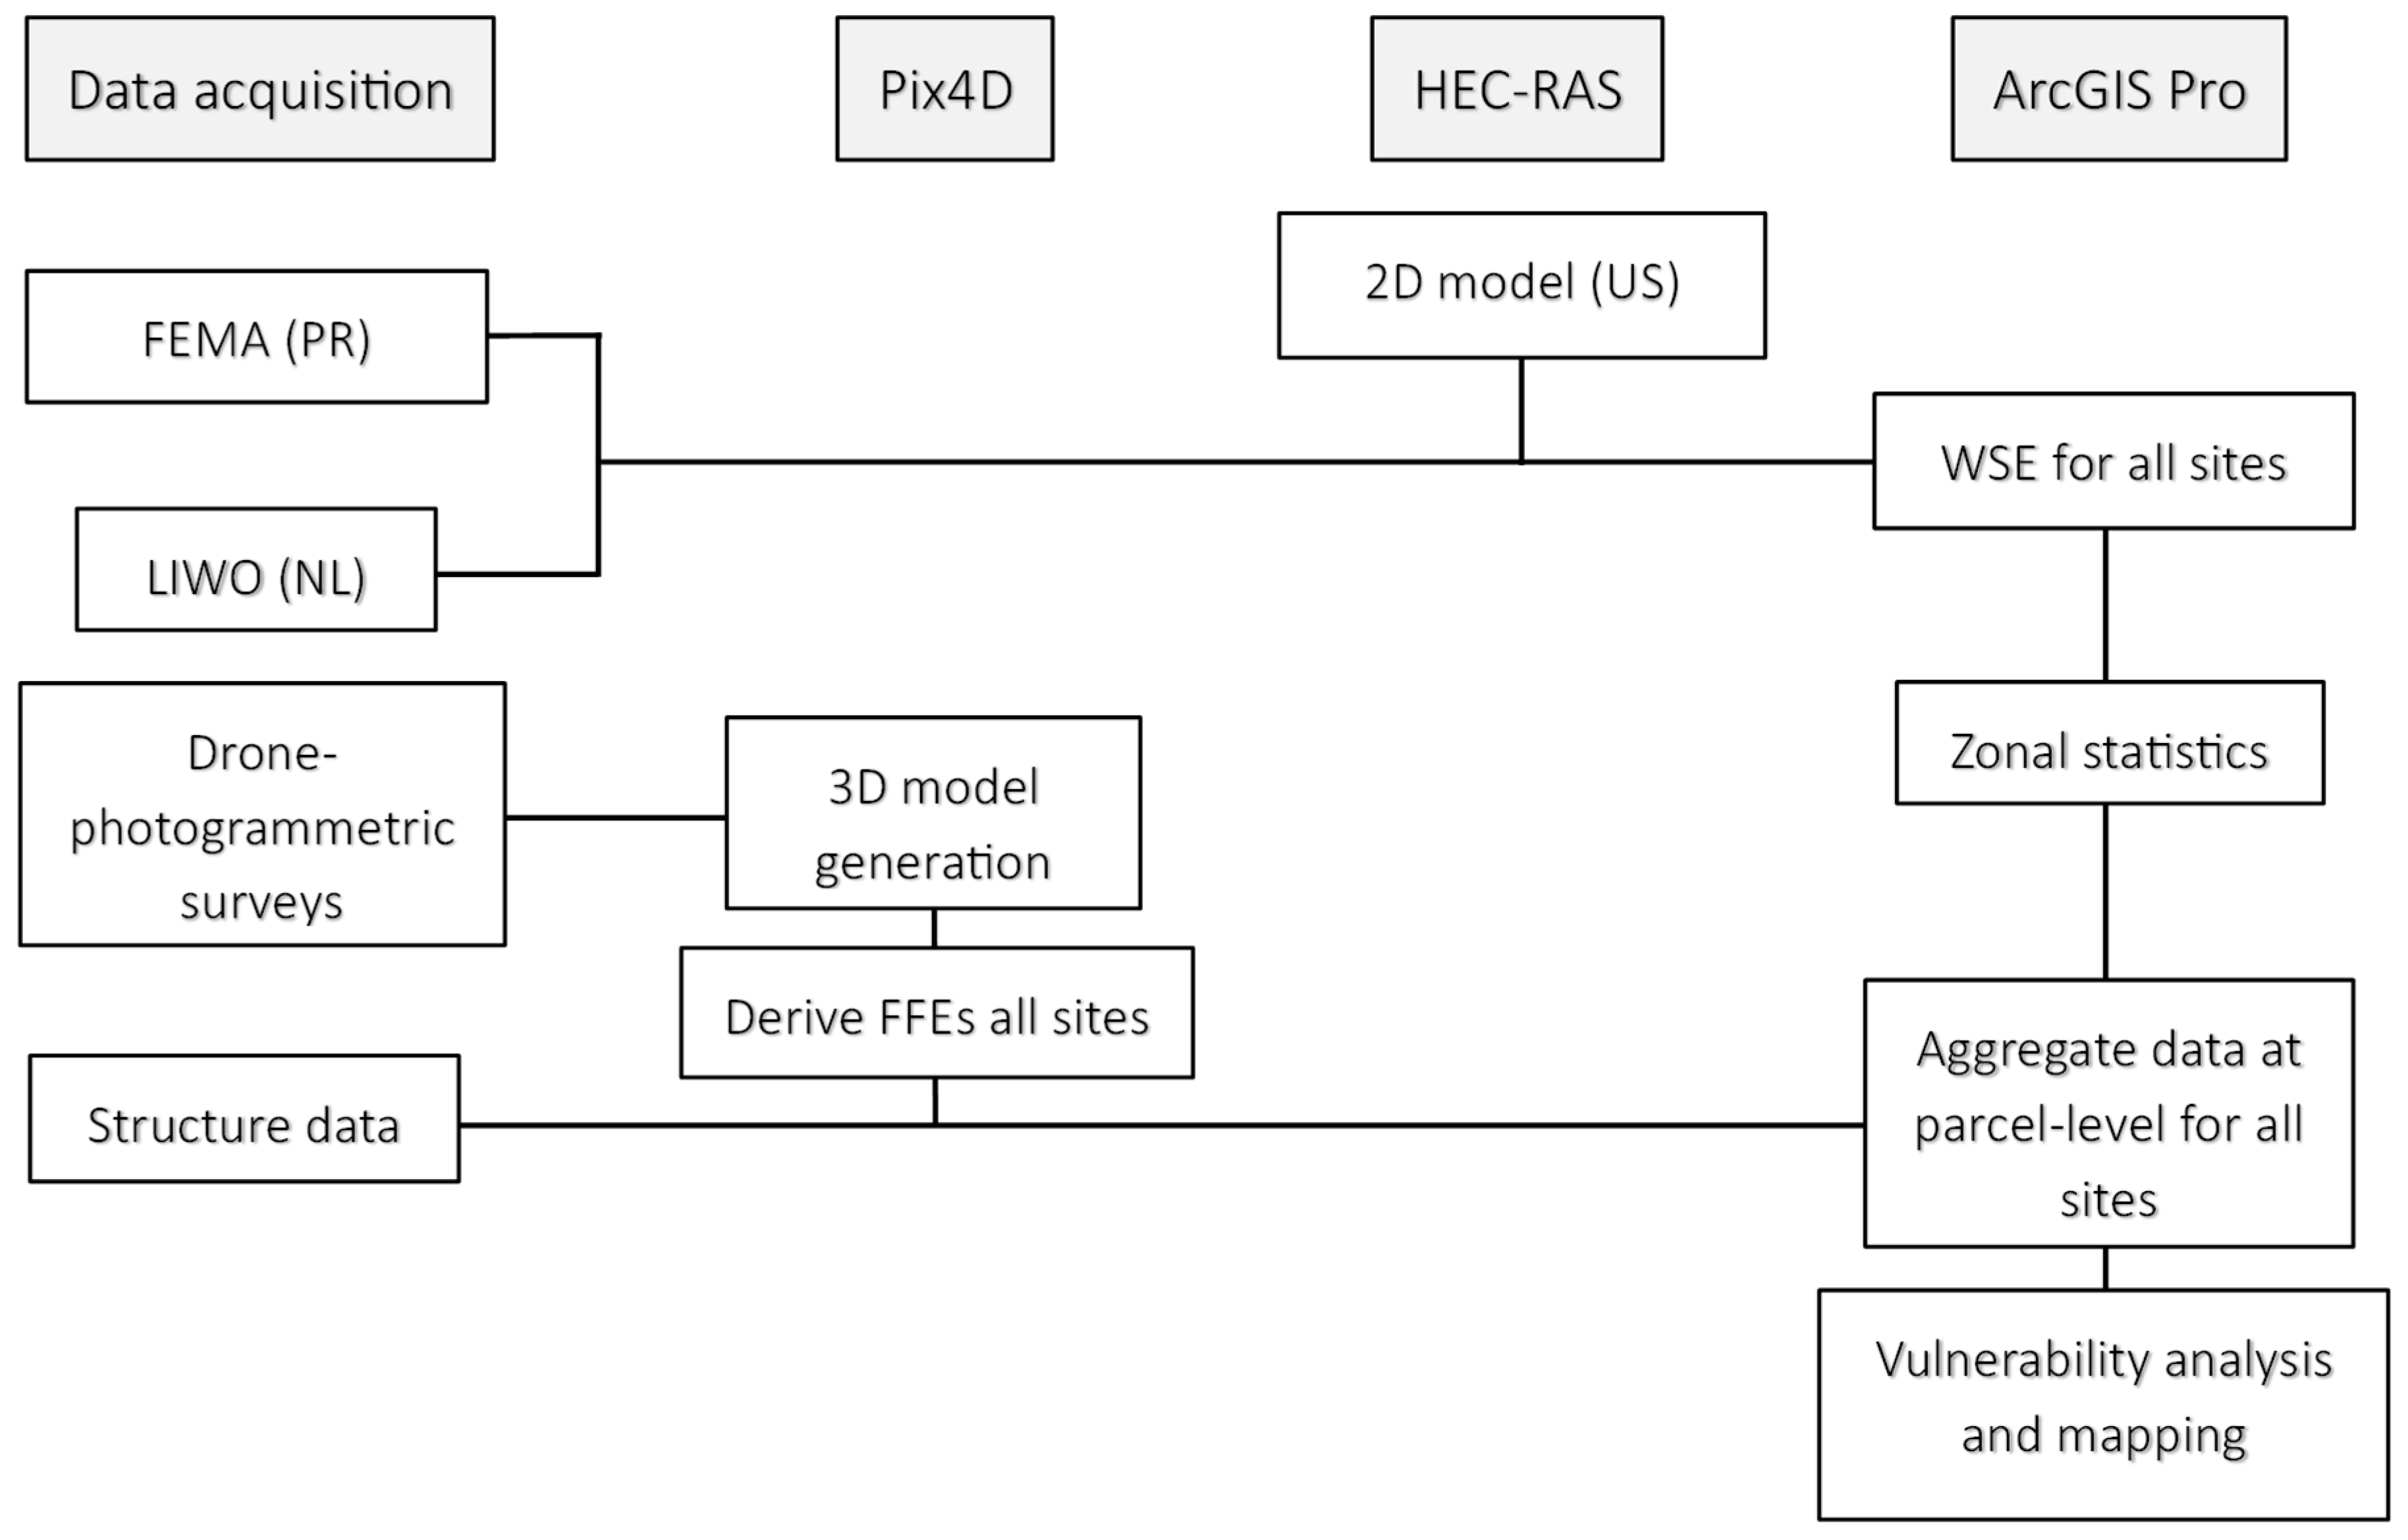
2. Materials and Methods

2.1. Site Selection

Three sites were selected for this study: Meyerland (a), Old Empel (b), and Cataño Pueblo (c) (Figure 3). Meyerland is a historic neighborhood built in the 1960s containing approximately 6000 residential buildings in southwest Houston. The City of Houston is located on the upper Texas coast just north of the coastal barrier island Galveston and is subject to flooding from Galveston Bay surge traversing up port channels as well as rainfall events due to low, flat topography. River and bayou systems transect the city traversing towards larger bodies of water, such as Galveston Bay. Furthermore, the greater Houston area encompasses two of the top five FEMA-NFIP claim counties Harris and Galveston [57]. An eastern section of Meyerland containing 424 structures was selected for analysis based on flooding impacts from Brays Bayou during Hurricane Harvey in 2017 as well as changes in housing foundations post-disaster.
Old Empel is a historic neighborhood with approximately 1100 residential structures and is in the city of Den Bosch. Den Bosch is in the province of North Brabant which occupies the southern portion of the NL and borders the province of Limburg and the country Belgium. Den Bosch is of special interest for elevational and fluvial flood risk due to the confluence of rivers that transect the city, some originating from the province of Limburg. Rivers such as the Dommel, Aa, and Meuse all converge within a five-kilometer radius. A western portion of Old Empel containing 306 structures was selected for analysis based on LIWO flood probability scenarios.
Cataño Pueblo is a historic district in Puerto Rico, highly exposed to flooding with approximately 1400 residential structures and is located on the southwestern side of San Juan Bay. The district is within the Municipality of Cataño which borders other coastal Municipalities such as San Juan, Toa Baja, and Guaynabo. Cataño Pueblo experiences compound flooding due to intense rainfall events and coastal surge from San Juan Bay, rendering the district an ideal site for elevational flood risk analysis. In coordination with the National Park Service (NPS) National Center for Preservation and Technology (NCPTT) and the PR State Historic Preservation Office, a site of 295 structures were selected based on previous impact assessments from Hurricanes Irma and Maria in 2017.

2.2. Data Acquisition

2.2.1. Building Inventories and Elevation Information

This study deployed a high-precision, drone-photogrammetric methodology to collect and derive building elevation data, previously determined to be not significantly different from that of traditional measures [75]. The drone used for data acquisition was a DJI Phantom 4 RTK (real-time kinematics—utilizing a network of global positioning or navigation system satellites) which maintained ± 2 cm and ± 5 cm horizontal and vertical accuracies, respectively, while capturing aerial imagery (Figure 4). From these images, highly accurate 3D point clouds and models (digital twins) were created of the sites selected. Building elevation information was then manually derived from these models by selecting points directly representing or indicators indirectly representing the desired measure. For example, a point at the bottom of the front door was a direct representation of a FFE, while a porch or patio would be an indirect representation of an FFE. These tacheometric approaches and principles are utilized within traditional ground surveying. Building elevation data were collected and derived in the summers of 2021, 2022, and 2023 within Meyerland, Cataño, and Old Empel, respectively. Drone scans within the US and PR referenced tidal and geodetic datums provided by the National Oceanic and Atmospheric Administration (NOAA) National Geodetic Survey (NGS) and Continuously Operating Reference Stations (CORS) for vertical control. Drone scans within the NL referenced tidal and geodetic datums under Public Services on the Map (PDOK). Drone-based building elevation data (nearest cm) were appended to existing building inventories replacing assumption-based (nearest half ft) or non-existent elevation data for flood risk analysis and visual mapping.
Building inventories for the US and PR sites were obtained through the FEMA USA structures public online download tool. NL building inventories were obtained through the PDOK Basic Registration of Addresses and Buildings (BAG) online download tool. Building inventories and geoinformation using satellite-based scans were quality control checked using drone-based models. Some building boundary polygons within the geodatabase inventories were considered “not applicable” or removed for the following reasons: (1) the building was not the primary, livable unit (i.e., storage, garage, outdoor pavilion, etc.) or (2) building elevations were not obtainable (i.e., structure no longer present, dense tree coverage surrounding the building, etc.). Meyerland contained high tree coverage, resulting in mismatched structure presence and boundary extents to that of structures identified in drone-based models. Thus, parcel data obtained through the Texas Natural Resources Information System (TNRIS) were used to replace the building polygon boundaries. This process did not affect building elevation information, rather assisted with visualization purposes only. Lastly, a small portion of buildings and parcels were added to inventories due to newly constructed units’ post-disaster events, particularly in Meyerland and Cataño.

2.2.2. Water Surface Elevations

For all three sites, WSEs were analyzed for the 100-year return period event using local data sources (see Table 2 and text below).
Meyerland—WSE estimation for Hurricane Harvey 100-year conditions were calculated using HEC-RAS software (version 6.2). Numerous recent studies have extensively employed HEC-RAS for flood risk assessment in the Greater Houston region [92,93,94]. The flood elevation utilized in this study offers more recent HEC-RAS advancements such one-dimensional (1D)/two-dimensional (2D) coupled unsteady flow simulations, replacing the 1D regulatory flood elevations available through FEMA-NFIP (Hydrologic Engineering Center, 2023). While 1D models demand less computational and data requirements, 2D models can simulate both fluvial and pluvial flooding over the entire computational mesh, and therefore provide a more accurate picture of inundated areas and their flood drivers. The topographic data used in this HEC-RAS 2D model includes a 3 m (10 ft) digital elevation model derived from satellite-based LiDAR. Land use, land cover data were used from the 2016 National Land Cover Dataset (NLCD). Both the drone-based building elevation values and the HEC-RAS flood elevation reference NAVD88 for vertical control.
Old Empel—The main source is flooding from a levee breach in the nearby Meuse River. Flood depth above ground from the Meuse River were obtained through LIWO 2022 flood probability online tool which shows probabilities of flooding depth scenarios for a given location. The 0.5 m (1.64 ft) flood depth scenario was determined appropriate based on 1/100 probability, comparable to the US and PR probabilities. However, the flood depths do relate to the field (or grade) level and do not reference the Amsterdam Ordinance Datum or Normaal Amsterdams Peil (NAP), which is the tidal vertical datum used in the NL. To compute WSEs and reduce uncertainty for ground topography elevations, high-resolution (4 cm ground sampling distance) DTMs were created using the drone scans. Ground elevation measures for each building were extracted from the DTMs and appended to building inventory. The flood depth scenario value (0.5 m) was then added to the extracted DTM values to compute WSE for each building. This ensured that both the drone-derived FFEs and the WSEs referenced NAP for vertical control.
Cataño Pueblo—The flood source is primarily sourced by coastal wave action within the San Juan Bay and surge traversing up the San Fernando Channel. WSEs were obtained through FEMA’s National Flood Hazard Layer (NFHL) online viewer tool. Within each flood hazard zone, ABFE values were extracted, units converted, and appended to the building inventory. Data availability within PR to perform alternative flood elevation computations is limited. Both the drone-based building elevation values and the FEMA ABFEs reference the PR vertical datum of 2002 (PRVD02).

2.3. Flood Vulnerability Analysis

Building FFEs and other elevation estimations derived via drone were compared to flood elevations for each locality, respectively. Specifically, FFEs were subtracted from WSEs to compute the flood inundation for a given building (Equation (1)).
F l o o d   i n u n d a t i o n = W S E F F E
where W S E is the water surface elevation (m), and F F E is the first-floor elevation (m).
The flood inundation values in meters were used to quantify flood vulnerabilities at the parcel level. The Getis–Ord General G statistic was used to determine if the flood vulnerabilities were spatially random or clustered at the local level [95]. The spatial relationships for each site were conceptualized using k-nearest neighbors, which assigned a uniform number of closest neighbors for each observation. Based on FFE data sensitivity and number of structures in each site, 20 neighbors were used for Meyerland while 17 neighbors were included for Old Empel and Cataño Pueblo. Mapping of the flood vulnerabilities assisted in visualizing these spatial patterns.

2.4. Flood Vulnerability Classification and Mapping Rubric
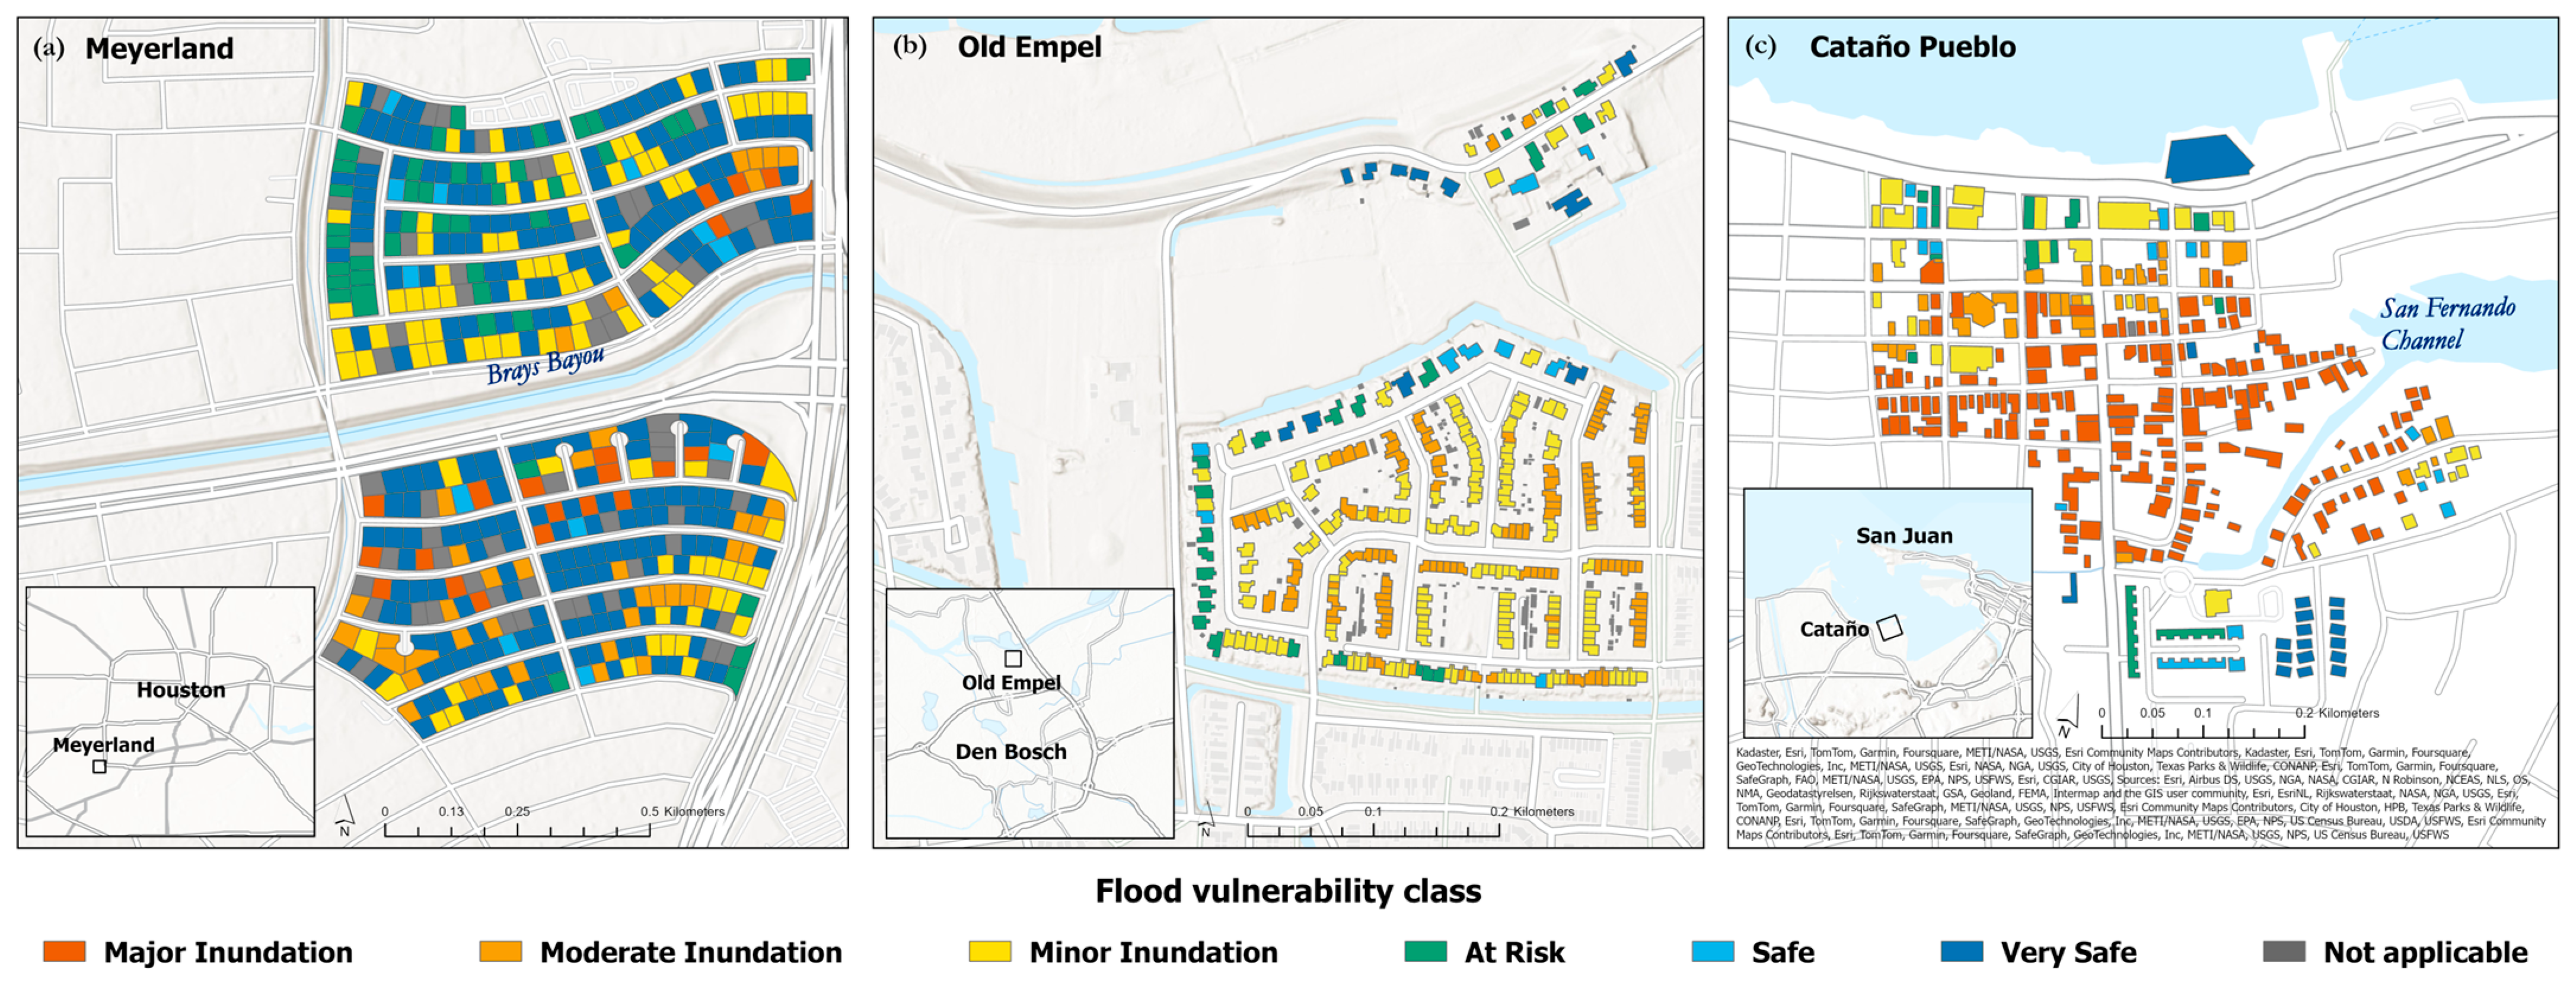
Flood inundation computations for each building were represented by six flood vulnerability classifications: “Major Inundation” if the inundation depth exceeded 0.61 m (2 ft), “Moderate Inundation” ranging between 0.61 m and 0.3 m (1 ft), and “Minor Inundation” if it was less than 0.3 m (1 ft) (Table 3. In other words, these classifications represent buildings that had a positive (+) computation using Equation (1), meaning a positive case for inundation.
Alternatively, buildings that had a negative (−) computation for inundation, and thus were above the flood inundation depth, were classified inversely as “At risk”, “Safe”, and “Very Safe”. This is often referred to as a buildings’ freeboard, or lowest floor height above flood depth [96]. Risk communication literature supported flood vulnerability classification word choice and color palette selection considering broad audience demographics and color blindness [97,98,99,100,101,102]. Classification thresholds were influenced by USACE flood depth damage functions [103,104,105], calculating flood damage to the building and content loss per foot above the FFE. Additional influence comes from the lowest flood depth threshold by The State of New South Wales [106], which defines the lowest flood hazard threshold as being within 0.3 m (approximately 1 ft), generally considered unsafe for small vehicles if flood depths exceed that threshold. A 0.6 m (approximately 2 ft) flood hazard presents risk to children, adults, and any vehicle (including 4 × 4). The report also presents flood depths above floors for buildings; however, these values were modeled for building stability, rather than risk and damage to individuals and contents due to inundation. It is important to note that their thresholds considered velocity for the stability of pedestrians and vehicles, while ours accounted for flood inundations. These flood vulnerability classifications were assigned a symbology for each building within the selected sites to display using digital mapping within ArcGIS Pro. An example cross-section schematic of the flood vulnerability classifications is seen in Figure 5, while the complete methodological workflow is seen in Figure 6.

3. Results

3.1. Flood Vulnerability Analysis

All structures within the selected sites were successfully scanned via drone, allowing for the derivation of FFEs from the photogrammetric point cloud models. Elevation differences between the building FFEs and the respective flood depth elevations were computed using Equation (1). Flood vulnerability profiles are seen in Figure 7, where percent of buildings by vulnerability classification and inundation elevation means (IEMs) are displayed.

3.1.1. Meyerland

Meyerland showed heterogeneity in vulnerability while also containing the highest number of “Very Safe” buildings. This finding was anticipated due to the implementation of a 2 ft freeboard above the 500-year flood elevation by the City of Houston post-Harvey. Reconstructed or newly built homes have since followed the building elevation requirements. This phenomenon also explains the resulting −0.55 m IEM of Meyerland. In other words, on average, the buildings within the selected Meyerland maintain a freeboard of 0.55 m, suggesting most of the community is near compliance with the new city ordinance. Identification of the 151 buildings (36%) that still exhibit flood vulnerabilities are seen in Figure 8a. In addition to high heterogeneity, the vulnerabilities were statistically random spatially (p = 0.588). This result suggests the building FFEs were more responsible, compared to the topography or flood exposure, in the contribution to flood vulnerabilities to within Meyerland.

3.1.2. Old Empel

Old Empel showed high homogeneity in vulnerability, with most buildings classified as “Minor” or “Moderate Inundation”; however, it contained zero buildings of the “Major Inundation” classification. This resulted in an 0.19 m IEM for the site. This means, on average, the buildings within Old Empel are subject to 0.19 m of flood inundation. The vulnerabilities were statistically highly clustered (p = 0.000), suggesting that the topography or flood exposure may be more responsible than building FFEs in contributing to flood vulnerabilities. This phenomenon is visualized in Figure 8b. The buildings located on the outskirts and dike resemble lower vulnerabilities compared to the inner clusters. Homes that were not subject to flood inundation revealed two characteristic trends: (1) detached buildings and (2) built more recently by five years on average. The oldest (1912) and newest (2022) buildings are on the dike and were not exposed to the flood hazard. The naturally “flat” topography of the NL is likely responsible for large clusters of buildings experiencing similar flood vulnerabilities. The inclusion of building elevation information in the NL demonstrated differences in flood-vulnerable buildings compared to assuming buildings were at ground (or field) level (Figure 9). Excluding FFEs overestimated the percent of buildings that were subject to “Moderate Inundation” and underestimated percent of buildings within the remaining flood vulnerability classifications (excluding “Major Inundation”). The resulting 0.49 m IEM also reflects the uniform flood depth across the site when building elevation information is excluded. Overall, these results support the inclusion of building elevation information within flood damage and risk assessment in NL, which is generally ignored. By doing so, the NL can more accurately identify and estimate the number of buildings vulnerable to flood inundation and to what magnitude, providing a more robust flood damage and risk assessment.

3.1.3. Cataño Pueblo

Cataño Pueblo showed the highest count of buildings subject to “Major Inundation”. This resulted in a 0.71 m IEM, meaning that on average the buildings within this site are subject to 0.71 m flood inundation. The vulnerabilities were statistically highly clustered (p = 0.000). Given that the entire site is exposed to the flood hazard, these results suggest that the topography may contribute more to the flood vulnerabilities for these buildings than the FFEs. The buildings subject to the highest flood vulnerabilities from the San Fernando Channel can be seen in Figure 8c. The safer buildings revealed building characteristic trends like Old Empel: detached or newer buildings. Due to high flood vulnerabilities within this coastal site, scenario mapping was performed for future SLR scenarios (Figure 10). This was implemented by increasing the local flood depths by 0.14 m using the median bounding SLR scenarios, accounting for baseline of 2000, for the Caribbean provided in the NOAA 2022 report [107].
The 2050 SLR scenario resulted in an increase of 23 buildings exposed to a form of inundation vulnerability, specifically, an increase of 20 in “Major Inundation” buildings and an increase of 3 in “Minor Inundation” buildings (Figure 9). These buildings were shifted from every other vulnerability classification except “Very Safe”, resulting in a building count difference of 0 and maintaining the same parcels. To account for this increased vulnerability, we derived and mapped NHFEs (Figure 10b). This revealed that the next highest floor was present in approximately 137 (47%) of the total buildings. The majority of the NHFEs exhibited “Very Safe” classifications, with two still below the flood elevation, which resulted in an −2.07 m IEM (Figure 11). This meant that on average, the NHFEs were 2.07 m above the flood elevation. Inversely, absent next higher floor buildings that were subject to inundation, or presented an inundated NHFE, resulted in a 1.06 m IEM, which meant that, on average, these buildings were subject to 1.06 m of flood inundation. Buildings that were subject to a form of inundation and were absent NHFE were statistically clustered (p = 0.000), suggesting these buildings were subject to some of the highest flood vulnerabilities with no alternative floor to avoid such vulnerabilities. These 130 (44% of total) buildings were identified and mapped (Figure 10c).

4. Discussion

The methods deployed in this study support the use of alternative scanning technologies to those of traditional methods to capture accurate building elevation information across multiple sites. The use of a survey-grade drone proved scalable, adaptable, and efficient within diverse environments in capturing a variety of building types. In particular, multiple facades of buildings allowed for more robust capturing of elevation points while simultaneously allowing for the generation of other topographic products, such as the DTMs. The data and results presented fulfill data gaps and reduce uncertainty in the current flood risk analysis literature estimating vulnerability and inundation risk, especially at the parcel level, through the identification of flooded buildings and the magnitude (“by how much” each building will be flooded).
The results showed flood vulnerability profiles for the three selected sites: (1) Meyerland (US), Old Empel (NL), and (3) Cataño Pueblo. The inclusion of accurate FFEs, replacing assumption-based or non-existent building elevation information, strongly supported accurately identifying flood vulnerabilities and magnitudes at the parcel level. Most buildings within Meyerland were not vulnerable to inundation; however, the spatial randomness of the vulnerabilities suggests increased first-floor elevations (FFEs) within this site can contribute more to reducing flood vulnerabilities. The low-lying nature of the NL is reflected within Old Empel as minor-to-moderate flood vulnerabilities were clustered together, while safer buildings were detached, more recently built, and located on the perimeter or dike. Increased FFEs can compensate for the flat and low-lying topography in which the clustered, vulnerable buildings reside. In the NL, building elevation requirements (e.g., freeboard) are not yet a major element in flood management policy. The observations and analysis here could support the development of an “elevation-based” flood mitigation component as part of multi-layer flood management in the NL. Cataño Pueblo contained the highest proportion of most vulnerable buildings. These buildings were spatially clustered along the streets connected to the San Fernando Channel, which is an inlet from the San Juan Bay. Due to the coastal influence, a 2050 SLR scenario was performed for this site in addition to the collection of next highest floor elevations (NHFEs) to identify and quantify buildings with the highest vulnerability. The results showed that 44% of the total buildings were clustered, subject to flood inundation, and were NHFE-absent. Addressing and planning to mitigate elevational flood risk can be challenging within historic districts, as buildings are sought to be preserved with the original materials and architecture to maintain historical and cultural significance [108,109]. However, individuals are still presented with flood vulnerability resorting to higher elevations or building floors. Deriving NHFEs provides further insights to identify which structures lack this characteristic and are vulnerable to flood inundation. Furthermore, if parcel level elevational flood avoidance or mitigation is not available, alternative flood mitigation structures, along with the elevation requirements, can be implemented around a building or block of buildings (i.e., permanent, or temporary, flood barriers and flood-proofing alternatives).
Policy- and decision-makers can use quantitative findings such as the ones presented here to (a) understand risk at multiple scales, (b) plan around these risks spatially, and (c) estimate the necessary freeboard requirements for newly built or reconstructed buildings within a flood-prone region. The spatial clustering of building vulnerabilities utilizing FFE data can inform the importance of this measure, compared to the topography or flood hazard exposure, for a particular site. Future studies can build off this analysis to inform the spatial and urban planning of existing or newly constructed sites. Emergency response teams can also utilize these vulnerability maps to identify which structures are most at risk to plan search, rescue, and recovery efforts more efficiently. NHFEs, often overlooked, served as a valuable measure in this study for estimating flood vulnerability for both buildings and the individuals within. Especially in coastal margins, NHFEs and other building elevation information could be of great use for current and future risk assessments when considering SLR. Coastal parcels under a traditional mortgage could experience drastic vulnerabilities in the near future. If building elevation information for a unit is unavailable, either through elevation certificates (ECs) or other sources, additional building elevation information should be derived in addition to FFEs to allow for a more robust inundation risk profile for both the building and residents. Particularly, NHFEs, height differences between the streets and the lowest floors (HDSLs) [28] and basement elevations. Basement elevation captures were a limitation to this study, as is for any exterior scanning approach. While Meyerland and Puerto Rico did not contain any basements, Old Empel may have contained older structures and others exist in other US states, particularly the mid-west. If basements are recorded as the FFE, as they are in ECs, future studies should explore the definition and capture of an infiltrating floor elevation (IFE). Additionally, since this study focused on elevational flood vulnerability, other flood inundation metrics were not considered (i.e., flow velocity, wave action, debris flow, etc.) [110]. Thus, the methods provided in this study may not be suitable for communities in hilly, mountainous (higher topographic slope) areas where the effect of flow velocity and other flood metrics should be more heavily considered. Future studies can integrate the results of this study into existing flood risk analyses, which has implications for reducing uncertainties in flood damage and risks (see [111]), especially studies that seek additional analysis for future SLR scenarios (i.e., year 2100). Alternative scanning methods can also be synergized to overcome current limitations, provide redundant sources for building elevation information, and estimate a more robust inundation risk.
Other limitations using exterior scanning to consider include tree coverage and other static objects surrounding buildings. Visual assessments before exterior scanning operations should occur to ensure building elevations maintain line of sight with scanning equipment. Special considerations when adopting drone-based methods are regulatory certification and airspace compliance for a given nation in addition to any other state, as well as local and property laws and regulations relevant to the area of interest. Lastly, while scanning the selected sites was efficient, the manual derivation of building elevation estimations is time-consuming given the number of buildings. Future studies should explore automating the derivation process to enable quicker data acquisition times.

5. Conclusions

Our study sought to determine the elevational flood vulnerability of buildings located in the Netherlands (NL), Puerto Rico (PR), and United States (US). This was achieved by collecting building elevation information, including FFEs, using a high-precision drone-photogrammetric methodology. These values were then compared to flood elevations that were modeled or obtained for the unique sites, representing the primary flood sources, respectively: fluvial (Old Empel, North Brabant (NL)), coastal (Cataño Pueblo, Cataño (PR)), and pluvial (Meyerland, Texas (US)). The results provided flood vulnerability profiles for each of the sites, which quantified and identified elevational flood vulnerabilities at the parcel level. Spatial statistics were also assessed for building vulnerabilities to inform the importance of FFEs in reducing flood vulnerabilities for each site, respectively. The inundation elevation means were −0.55 m, 0.19 m, and 0.71 m for Meyerland, Den Bosch, and Cataño Pueblo, respectively. In other words, on average, Meyerland’s buildings maintained a freeboard above the flood elevation of 0.55 m, while Den Bosch and Cataño Pueblo’s buildings were subject to flood inundation of 0.19 m and 0.71 m, respectively. The spatial statistics revealed that FFEs may be more influential in reducing flood vulnerability in Meyerland, while they serve as a multi-layered risk reduction strategy within Old Empel and Cataño Pueblo. Especially regarding historic preservation within Cataño Pueblo, alternative flood mitigation strategies at larger scales can be planned more effectively utilizing FFE data. This study also mapped flood vulnerabilities at the parcel level, which provided further geospatial insights critical for identifying buildings most vulnerable to flood inundation. Building characteristic trends revealed that more recently built, detached buildings were less vulnerable to flood inundation. Lastly, due to coastal proximity and high vulnerabilities, we performed SLR scenario mapping within Cataño Pueblo and derived the next highest floor elevations (NHFEs). This allowed the identification of highly vulnerable individuals and buildings where (a) the next highest floor was absent and (b) which were subjected to a form of flood inundation accounting for nearly half of the buildings within the site. Across all sites, 64% of buildings were vulnerable to a form of inundation, with 40% belonging to “moderate” or “major” inundation.
Overall, the findings for the selected sites echo a common global trend—FFEs do not account for current and future flood depths, respectively. Despite current or historical flood mitigation approaches (prevention or recovery), the elevational avoidance of flood vulnerabilities can serve as a primary or redundant strategy. The analysis presented here could be performed for other flood scenarios for the same sites (i.e., other flood sources, return periods, building elevations, etc.) and could be employed to assess other sites. Researchers and other flood risk analyses can integrate data and results, like this study, to identify and quantify flood inundation vulnerabilities at the parcel level more accurately, thereby reducing uncertainties in flood damage and risk estimation. The results also provide support and guidance to policy-makers developing freeboard requirements at the community level. Disaster and emergency response and planning entities could leverage this information to better prepare and strategize the allocation of equipment, personnel, and resources. Lastly, the insights provided by these data support the planning and implementation of flood mitigation strategies and effectively communicating to the public, fostering a more flood-resilient environment.

Author Contributions

Conceptualization, N.D.D., Y.L., B.L.M.K. and S.D.B.; methodology, N.D.D. and S.N.J.; software, N.D.D.; validation, N.D.D., I.P.-T. and S.N.J.; formal analysis, N.D.D.; investigation, N.D.D.; resources, N.D.D., Y.L., B.L.M.K. and S.D.B.; data curation, N.D.D.; writing—original draft preparation, N.D.D.; writing—review and editing, Y.L., B.L.M.K., I.P.-T., S.N.J. and S.D.B.; visualization, N.D.D., Y.L. and S.N.J.; supervision, Y.L. and S.D.B.; project administration, Y.L. and B.L.M.K.; funding acquisition, Y.L. and S.D.B. All authors have read and agreed to the published version of the manuscript.

Funding

This research was supported by the National Science Foundation (NSF) Award 2153710: Collaborative Research: IRES Track I: Flood Resilience Program—Integrated research experiences to foster understanding on how to increase resilience in flood-prone communities.

Data Availability Statement

The raw data supporting the conclusions of this article will be made available by the authors on request.

Conflicts of Interest

The authors declare no conflicts of interest.

References

  1. Brody, S. The characteristics, causes, and consequences of sprawling development patterns in the United States. Nat. Educ. Knowl. 2013, 4, 2. [Google Scholar]
  2. Brody, S.D.; Zahran, S.; Highfield, W.E.; Grover, H.; Vedlitz, A. Identifying the impact of the built environment on flood damage in Texas. Disasters 2008, 32, 1–18. [Google Scholar] [CrossRef]
  3. Shuster, W.D.; Bonta, J.; Thurston, H.; Warnemuende, E.; Smith, D. Impacts of impervious surface on watershed hydrology: A review. Urban Water J. 2005, 2, 263–275. [Google Scholar] [CrossRef]
  4. Cao, W.; Zhou, Y.; Güneralp, B.; Li, X.; Zhao, K.; Zhang, H. Increasing global urban exposure to flooding: An analysis of long-term annual dynamics. Sci. Total Environ. 2022, 817, 153012. [Google Scholar] [CrossRef]
  5. Miller, J.D.; Hutchins, M. The impacts of urbanisation and climate change on urban flooding and urban water quality: A review of the evidence concerning the United Kingdom. J. Hydrol. Reg. Stud. 2017, 12, 345–362. [Google Scholar] [CrossRef]
  6. Kundzewicz, Z.W.; Pińskwar, I. Are Pluvial and Fluvial Floods on the Rise? Water 2022, 14, 2612. [Google Scholar] [CrossRef]
  7. Sebastian, A. Compound flooding. In Coastal Flood Risk Reduction; Elsevier: Amsterdam, The Netherlands, 2022; pp. 77–88. [Google Scholar]
  8. Pfahl, S.; O’Gorman, P.A.; Fischer, E.M. Understanding the regional pattern of projected future changes in extreme precipitation. Nat. Clim. Chang. 2017, 7, 423–427. [Google Scholar] [CrossRef]
  9. Hada, C.; Shaw, R. Chapter 35: Integrating disaster and climate change in risk sensitive land use planning. In Handbook on Climate Change and Disasters; Edward Elgar Publishing: Cheltenham, UK, 2022; pp. 462–469. [Google Scholar]
  10. Gersonius, B.; Ashley, R.; Pathirana, A.; Zevenbergen, C. Climate change uncertainty: Building flexibility into water and flood risk infrastructure. Clim. Chang. 2013, 116, 411–423. [Google Scholar] [CrossRef]
  11. Donat, M.G.; Lowry, A.L.; Alexander, L.V.; O’Gorman, P.A.; Maher, N. More extreme precipitation in the world’s dry and wet regions. Nat. Clim. Chang. 2016, 6, 508–513. [Google Scholar] [CrossRef]
  12. English, E.C.; Chen, M.; Zarins, R.; Patange, P.; Wiser, J.C. Building resilience through flood risk reduction: The benefits of amphibious foundation retrofits to heritage structures. Int. J. Archit. Herit. 2021, 15, 976–984. [Google Scholar] [CrossRef]
  13. Berkes, F. Understanding uncertainty and reducing vulnerability: Lessons from resilience thinking. Nat. Hazards 2007, 41, 283–295. [Google Scholar] [CrossRef]
  14. Paton, D.; Smith, L.; Violanti, J. Disaster response: Risk, vulnerability and resilience. Disaster Prev. Manag. Int. J. 2000, 9, 173–180. [Google Scholar] [CrossRef]
  15. Nicholls, R.J.; Branson, J. Coastal resilience and planning for an uncertain future: An introduction. Geogr. J. 1998, 164, 255–258. [Google Scholar] [CrossRef]
  16. Diaconu, D.C.; Costache, R.; Popa, M.C. An overview of flood risk analysis methods. Water 2021, 13, 474. [Google Scholar] [CrossRef]
  17. Díez-Herrero, A.; Garrote, J. Flood risk analysis and assessment, applications and uncertainties: A bibliometric review. Water 2020, 12, 2050. [Google Scholar] [CrossRef]
  18. Apel, H.; Aronica, G.; Kreibich, H.; Thieken, A. Flood risk analyses—How detailed do we need to be? Nat. Hazards 2009, 49, 79–98. [Google Scholar] [CrossRef]
  19. Papathoma-Köhle, M.; Schlögl, M.; Dosser, L.; Roesch, F.; Borga, M.; Erlicher, M.; Keiler, M.; Fuchs, S. Physical vulnerability to dynamic flooding: Vulnerability curves and vulnerability indices. J. Hydrol. 2022, 607, 127501. [Google Scholar] [CrossRef]
  20. Grahn, T.; Nyberg, L. Assessment of pluvial flood exposure and vulnerability of residential areas. Int. J. Disaster Risk Reduct. 2017, 21, 367–375. [Google Scholar] [CrossRef]
  21. Cook, K.L. An evaluation of the effectiveness of low-cost UAVs and structure from motion for geomorphic change detection. Geomorphology 2017, 278, 195–208. [Google Scholar] [CrossRef]
  22. Colomina, I.; de la Tecnologia, P.M. Towards a new paradigm for high-resolution low-cost photogrammetryand remote sensing. In Proceedings of the ISPRS XXI Congress, Beijing, China, 3–11 July 2008; pp. 1201–1206. [Google Scholar]
  23. Fortenberry, B. Digital documentation in historic preservation education and research: Prospects and perils. Preserv. Educ. Res. 2019, 11, 81–116. [Google Scholar] [CrossRef]
  24. Rakha, T.; Gorodetsky, A. Review of Unmanned Aerial System (UAS) applications in the built environment: Towards automated building inspection procedures using drones. Autom. Constr. 2018, 93, 252–264. [Google Scholar] [CrossRef]
  25. Erenoglu, R.C.; Akcay, O.; Erenoglu, O. An UAS-assisted multi-sensor approach for 3D modeling and reconstruction of cultural heritage site. J. Cult. Herit. 2017, 26, 79–90. [Google Scholar] [CrossRef]
  26. Colomina, I.; Molina, P. Unmanned aerial systems for photogrammetry and remote sensing: A review. ISPRS J. Photogramm. Remote Sens. 2014, 92, 79–97. [Google Scholar] [CrossRef]
  27. Wang, J.; Li, C. Acquisition of UAV images and the application in 3D city modeling. In Proceedings of the International Symposium on Photoelectronic Detection and Imaging 2007: Image Processing, Beijing, China, 9–12 September 2007; pp. 280–290. [Google Scholar]
  28. Ho, Y.-H.; Lee, C.-C.; Diaz, N.D.; Brody, S.D.; Mostafavi, A. ELEV-VISION: Automated Lowest Floor Elevation Estimation from Segmenting Street View Images. arXiv 2023, arXiv:2306.03050. [Google Scholar]
  29. Xia, J.; Gong, J. Computer vision based first floor elevation estimation from mobile LiDAR data. Autom. Constr. 2024, 159, 105258. [Google Scholar] [CrossRef]
  30. Gao, G.; Ye, X.; Li, S.; Huang, X.; Ning, H.; Retchless, D.; Li, Z. Exploring flood mitigation governance by estimating first-floor elevation via deep learning and google street view in coastal Texas. Environ. Plan. B Urban Anal. City Sci. 2024, 51, 296–313. [Google Scholar] [CrossRef]
  31. Guo, M.; Gong, J.; Whytlaw, J.L. Large-scale cloud-based building elevation data extraction and flood insurance estimation to support floodplain management. Int. J. Disaster Risk Reduct. 2022, 69, 102741. [Google Scholar] [CrossRef]
  32. Taghinezhad, A.; Friedland, C.J.; Rohli, R.V.; Marx, B.D. An imputation of first-floor elevation data for the avoided loss analysis of flood-mitigated single-family homes in Louisiana, United States. Front. Built Environ. 2020, 6, 138. [Google Scholar] [CrossRef]
  33. Brody, S.; Lee, Y.; Kothuis, B. Coastal Flood Risk Reduction: The Netherlands and the US Upper Texas Coast; Elsevier: Amsterdam, The Netherlands, 2022. [Google Scholar]
  34. Molenveld, A.; van Buuren, A. Flood risk and resilience in the Netherlands: In search of an adaptive governance approach. Water 2019, 11, 2563. [Google Scholar] [CrossRef]
  35. Kothuis, B.; Jonkman, S.; Sebastian, A. Delta planning and design in the Houstan Galveston Bay region, Texas. In Delta Interventions: Design and Engineering in Urban Water Landscapes; Nillesen, A., Kothuis, B., Meyer, H., Palmboom, F., Eds.; Delft University Publishers: Delft, The Netherlands, 2016. [Google Scholar]
  36. Jonkman, S.N.; Kok, M.; Vrijling, J.K. Flood risk assessment in the Netherlands: A case study for dike ring South Holland. Risk Anal. Int. J. 2008, 28, 1357–1374. [Google Scholar] [CrossRef]
  37. (RWS), Rijkswaterstaat. The Storm Surge Barrier in the Eastern Scheldt. 2015. Available online: https://open.rijkswaterstaat.nl/publish/pages/100035/brochure_eastern_scheldt_storm_surge_barrier.pdf (accessed on 12 June 2023).
  38. (ENW), Water Safety Expertise Network. High Water 2021 Facts and Interpretation. 2021. Available online: https://www.enwinfo.nl/publicaties/ (accessed on 12 June 2023).
  39. Jonkman, S.; de Moel, H.; Moll, R.; Slager, K. Editorial for the Special issue on “2021 Summer Floods in Europe”. J. Coast. Riverine Flood Risk 2023, 2, 11. [Google Scholar] [CrossRef]
  40. Kok, M.; Slager, K.; de Moel, H.; Botzen, W.; de Bruijn, K.; Wagenaar, D.; Rikkert, S.; Koks, E.; van Ginkel, K. Rapid damage assessment caused by the flooding event 2021 in Limburg, Netherlands. J. Coast. Riverine Flood Risk 2023, 2. [Google Scholar] [CrossRef]
  41. Bessette-Kirton, E.K.; Cerovski-Darriau, C.; Schulz, W.H.; Coe, J.A.; Kean, J.W.; Godt, J.W.; Thomas, M.A.; Hughes, K.S. Landslides triggered by Hurricane Maria: Assessment of an extreme event in Puerto Rico. GSA Today 2019, 29, 4–10. [Google Scholar]
  42. Reis-Silvia, A.; Vecchiarelli, C.E.; Taylor, H.J.; Mues, L.M. Estimating Floodplain Populations and Assessing Flood Risk and Flood Mitigation in Puerto Rico; Worcester Polytechnic Institute: Worcester, MA, USA, 2011. [Google Scholar]
  43. Rodriguez, H. A socioeconomic analysis of hurricanes in puerto rico: An overview of disaster mitigation and preparedness. In Hurricanes: Climate and Socioeconomic Impacts; Springer: Berlin/Heidelberg, Germany, 1997; pp. 121–143. [Google Scholar]
  44. Ramsey, M.M.; Muñoz-Erickson, T.A.; Mélendez-Ackerman, E.; Nytch, C.J.; Branoff, B.L.; Carrasquillo-Medrano, D. Overcoming barriers to knowledge integration for urban resilience: A knowledge systems analysis of two-flood prone communities in San Juan, Puerto Rico. Environ. Sci. Policy 2019, 99, 48–57. [Google Scholar] [CrossRef]
  45. Ma, C.; Baker, A.C.; Smith, T.E. How income inequality influenced personal decisions on disaster preparedness: A multilevel analysis of homeowners insurance among Hurricane Maria victims in Puerto Rico. Int. J. Disaster Risk Reduct. 2021, 53, 101953. [Google Scholar] [CrossRef]
  46. López-Marrero, T. An integrative approach to study and promote natural hazards adaptive capacity: A case study of two flood-prone communities in puerto rico. Geogr. J. 2010, 176, 150–163. [Google Scholar] [CrossRef]
  47. Kunreuther, H. Improving the national flood insurance program. Behav. Public Policy 2021, 5, 318–332. [Google Scholar] [CrossRef]
  48. FEMA. 2023 Hurricane Fiona Recovery Overview. Available online: https://www.fema.gov/press-release/20231220/2023-hurricane-fiona-recovery-overview (accessed on 20 February 2024).
  49. Gall, M.; Borden, K.A.; Emrich, C.T.; Cutter, S.L. The unsustainable trend of natural hazard losses in the United States. Sustainability 2011, 3, 2157–2181. [Google Scholar] [CrossRef]
  50. Brody, S.D.; Highfield, W.E.; Kang, J.E. Rising Waters: The Causes and Consequences of Flooding in the United States; Cambridge University Press: Cambridge, UK, 2011. [Google Scholar]
  51. White, G.F. Human Adjustment to Floods: A Geographical Approach to the Flood Problem in the United States. Ph.D. Thesis, The University of Chicago, Chicago, IL, USA, 1942. [Google Scholar]
  52. Kienholz, C.; Pierce, J.; Hood, E.; Amundson, J.M.; Wolken, G.J.; Jacobs, A.; Hart, S.; Wikstrom Jones, K.; Abdel-Fattah, D.; Johnson, C. Deglacierization of a marginal basin and implications for outburst floods, Mendenhall Glacier, Alaska. Front. Earth Sci. 2020, 8, 137. [Google Scholar] [CrossRef]
  53. Thompson, P.R.; Widlansky, M.J.; Merrifield, M.A.; Becker, J.M.; Marra, J.J. A statistical model for frequency of coastal flooding in Honolulu, Hawaii, during the 21st century. J. Geophys. Res. Ocean. 2019, 124, 2787–2802. [Google Scholar] [CrossRef]
  54. Knowles, S.G.; Kunreuther, H.C. Troubled waters: The national flood insurance program in historical perspective. J. Policy Hist. 2014, 26, 327–353. [Google Scholar] [CrossRef]
  55. Michel-Kerjan, E.; Lemoyne de Forges, S.; Kunreuther, H. Policy tenure under the US national flood insurance program (NFIP). Risk Anal. Int. J. 2012, 32, 644–658. [Google Scholar] [CrossRef] [PubMed]
  56. Burby, R.J. Flood insurance and floodplain management: The US experience. Glob. Environ. Chang. Part B Environ. Hazards 2001, 3, 111–122. [Google Scholar] [CrossRef]
  57. FEMA. OpenFEMA. Available online: https://www.fema.gov/about/reports-and-data/openfema (accessed on 22 July 2023).
  58. Merrell, W. Mixing tulips with tacos: Flood prevention practices and policies—A comparison of north Texas coastal communities and the Netherlands. In Coastal Flood Risk Reduction; Elsevier: Amsterdam, The Netherlands, 2022; pp. 5–16. [Google Scholar]
  59. Brody, S.D.; Highfield, W.E.; Merrell, W.; Lee, Y. Recovery versus protection-based approaches to flood risk reduction. In The Routledge Handbook of Urban Disaster Resilience: Integrating Mitigation, Preparedness, and Recovery Planning; Routledge: London, UK, 2019. [Google Scholar]
  60. (RWS), Rijkswaterstaat. The National Water and Flood Information System (LIWO). Available online: https://basisinformatie-overstromingen.nl/#/maps (accessed on 14 June 2023).
  61. (RWS), Rijkswaterstaat. Flooding Standards. Available online: https://www.infomil.nl/onderwerpen/lucht-water/handboek-water/thema-s/wateroverlast/normen-wateroverlast/ (accessed on 19 February 2024).
  62. Vader, H.; Bakker, A.M.; Jonkman, S.N.; van den Boomen, M.; van Baaren, E.; Diermanse, F.L. A framework for assessing the remaining life of storm surge barriers. Struct. Infrastruct. Eng. 2023, 1–13. [Google Scholar] [CrossRef]
  63. Eilander, D.; Boisgontier, H.; Buitink, J.; Couasnon, A.; Dalmijn, B.; Hegnauer, M.; de Jong, T.; Loos, S.; Marth, I.; van Verseveld, W. HydroMT: Automated and reproducible model building and analysis. J. Open Source Softw. 2023, 8, 4897. [Google Scholar] [CrossRef]
  64. Slomp, R.; Diemanse, F.; de Waal, H.; Stijnen, J.; Noort, J.; Wentholt, L. A consistent suite of models for flood risk management. In Proceedings of the 36th IAHR World Congress, The Hague, The Netherlands, 28 June–3 July 2015; pp. 1–5. [Google Scholar]
  65. Jafarzadegan, K.; Moradkhani, H.; Pappenberger, F.; Moftakhari, H.; Bates, P.; Abbaszadeh, P.; Marsooli, R.; Ferreira, C.; Cloke, H.L.; Ogden, F. Recent advances and new frontiers in riverine and coastal flood modeling. Rev. Geophys. 2023, 61, e2022RG000788. [Google Scholar] [CrossRef]
  66. Teng, J.; Jakeman, A.J.; Vaze, J.; Croke, B.F.; Dutta, D.; Kim, S. Flood inundation modelling: A review of methods, recent advances and uncertainty analysis. Environ. Model. Softw. 2017, 90, 201–216. [Google Scholar] [CrossRef]
  67. Trinh, M.X.; Molkenthin, F. Flood hazard mapping for data-scarce and ungauged coastal river basins using advanced hydrodynamic models, high temporal-spatial resolution remote sensing precipitation data, and satellite imageries. Nat. Hazards 2021, 109, 441–469. [Google Scholar] [CrossRef]
  68. De Moel, H.; Jongman, B.; Kreibich, H.; Merz, B.; Penning-Rowsell, E.; Ward, P.J. Flood risk assessments at different spatial scales. Mitig. Adapt. Strateg. Glob. Chang. 2015, 20, 865–890. [Google Scholar] [CrossRef]
  69. Iqbal, A.; Mondal, M.S.; Veerbeek, W.; Khan, M.S.A.; Hakvoort, H. Effectiveness of UAV-based DTM and satellite-based DEMs for local-level flood modeling in Jamuna floodplain. J. Flood Risk Manag. 2023, 16, e12937. [Google Scholar] [CrossRef]
  70. Munawar, H.S.; Hammad, A.W.; Waller, S.T. Remote sensing methods for flood prediction: A review. Sensors 2022, 22, 960. [Google Scholar] [CrossRef] [PubMed]
  71. Muhadi, N.A.; Abdullah, A.F.; Bejo, S.K.; Mahadi, M.R.; Mijic, A. The use of LiDAR-derived DEM in flood applications: A review. Remote Sens. 2020, 12, 2308. [Google Scholar] [CrossRef]
  72. Annis, A.; Nardi, F.; Petroselli, A.; Apollonio, C.; Arcangeletti, E.; Tauro, F.; Belli, C.; Bianconi, R.; Grimaldi, S. UAV-DEMs for small-scale flood hazard mapping. Water 2020, 12, 1717. [Google Scholar] [CrossRef]
  73. Backes, D.; Schumann, G.; Teferle, F.N.; Boehm, J. Towards a high-resolution drone-based 3D mapping dataset to optimise flood hazard modelling. Int. Arch. Photogramm. Remote Sens. Spat. Inf. Sci. 2019, 42, 181–187. [Google Scholar] [CrossRef]
  74. Bodoque, J.M.; Guardiola-Albert, C.; Aroca-Jiménez, E.; Eguibar, M.Á.; Martínez-Chenoll, M.L. Flood damage analysis: First floor elevation uncertainty resulting from LiDAR-derived digital surface models. Remote Sens. 2016, 8, 604. [Google Scholar] [CrossRef]
  75. Diaz, N.D.; Highfield, W.E.; Brody, S.D.; Fortenberry, B.R. Deriving First Floor Elevations within Residential Communities Located in Galveston Using UAS Based Data. Drones 2022, 6, 81. [Google Scholar] [CrossRef]
  76. de Moel, H.; van Vliet, M.; Aerts, J.C. Evaluating the effect of flood damage-reducing measures: A case study of the unembanked area of Rotterdam, the Netherlands. Reg. Environ. Chang. 2014, 14, 895–908. [Google Scholar] [CrossRef]
  77. Koivumäki, L.; Alho, P.; Lotsari, E.; Käyhkö, J.; Saari, A.; Hyyppä, H. Uncertainties in flood risk mapping: A case study on estimating building damages for a river flood in Finland. J. Flood Risk Manag. 2010, 3, 166–183. [Google Scholar] [CrossRef]
  78. van Herk, S.; Zevenbergen, C.; Gersonius, B.; Waals, H.; Kelder, E. Process design and management for integrated flood risk management: Exploring the multi-layer safety approach for Dordrecht, The Netherlands. J. Water Clim. Chang. 2014, 5, 100–115. [Google Scholar] [CrossRef]
  79. FEMA. Flood Zones. Available online: https://www.fema.gov/flood-zones (accessed on 15 January 2024).
  80. FEMA. Base Flood Elevation (BFE). Available online: https://www.fema.gov/node/404233 (accessed on 15 January 2024).
  81. FEMA. Base Level Engineering (BLE) Tools and Resources. Available online: https://www.fema.gov/about/organization/region-6/base-level-engineering-ble-tools-and-resources (accessed on 8 November 2023).
  82. Tate, E.; Munoz, C.; Suchan, J. Uncertainty and sensitivity analysis of the HAZUS-MH flood model. Nat. Hazards Rev. 2015, 16, 04014030. [Google Scholar] [CrossRef]
  83. de MOEL, H.; Aerts, J. Effect of uncertainty in land use, damage models and inundation depth on flood damage estimates. Nat. Hazards 2011, 58, 407–425. [Google Scholar] [CrossRef]
  84. Atoba, K.; Newman, G.; Brody, S.; Highfield, W.; Kim, Y.; Juan, A. Buy them out before they are built: Evaluating the proactive acquisition of vacant land in flood-prone areas. Environ. Conserv. 2021, 48, 118–126. [Google Scholar] [CrossRef] [PubMed]
  85. Gori, A.; Blessing, R.; Juan, A.; Brody, S.; Bedient, P. Characterizing urbanization impacts on floodplain through integrated land use, hydrologic, and hydraulic modeling. J. Hydrol. 2019, 568, 82–95. [Google Scholar] [CrossRef]
  86. Juan, A.; Gori, A.; Sebastian, A. Comparing floodplain evolution in channelized and unchannelized urban watersheds in Houston, Texas. J. Flood Risk Manag. 2020, 13, e12604. [Google Scholar] [CrossRef]
  87. FEMA. Lowest Floor Guide, April 2021 NFIP Flood Insurance Manual. Available online: https://www.fema.gov/sites/default/files/documents/fema_fim-appendix-c-lowest-floor-guide_apr2020.pdf (accessed on 22 March 2022).
  88. FEMA. Elevation Certificate and Instructions. 2019. Available online: https://www.fema.gov/sites/default/files/2020-07/fema_nfip_elevation-certificate-form-instructions_feb-2020.pdf?id=1383 (accessed on 17 February 2022).
  89. de Ruig, L.T.; Haer, T.; de Moel, H.; Brody, S.D.; Botzen, W.W.; Czajkowski, J.; Aerts, J.C. How the USA can benefit from risk-based premiums combined with flood protection. Nat. Clim. Chang. 2022, 12, 995–998. [Google Scholar] [CrossRef]
  90. Horn, D.P. National Flood Insurance Program: The Current Rating Structure and Risk Rating 2.0; Congressional Research Service: Washington, DC, USA, 2021; Volume 45999.
  91. DJI. Phantom 4 RTK. Available online: https://enterprise.dji.com/phantom-4-rtk (accessed on 22 June 2023).
  92. Chow, T.E.; Chien, J.; Meitzen, K. Validating the quality of volunteered geographic information (VGI) for flood modeling of Hurricane Harvey in Houston, Texas. Hydrology 2023, 10, 113. [Google Scholar] [CrossRef]
  93. Gori, A.; Gidaris, I.; Elliott, J.R.; Padgett, J.; Loughran, K.; Bedient, P.; Panakkal, P.; Juan, A. Accessibility and recovery assessment of Houston’s roadway network due to fluvial flooding during Hurricane Harvey. Nat. Hazards Rev. 2020, 21, 04020005. [Google Scholar] [CrossRef]
  94. Garcia, M.; Juan, A.; Bedient, P. Integrating reservoir operations and flood modeling with HEC-RAS 2D. Water 2020, 12, 2259. [Google Scholar] [CrossRef]
  95. FEMA. Freeboard. Available online: https://www.fema.gov/glossary/freeboard (accessed on 17 July 2023).
  96. Baker, F. Risk communication about environmental hazards. J. Public Health Policy 1990, 11, 341–359. [Google Scholar] [CrossRef]
  97. Dransch, D.; Rotzoll, H.; Poser, K. The contribution of maps to the challenges of risk communication to the public. Int. J. Digit. Earth 2010, 3, 292–311. [Google Scholar] [CrossRef]
  98. Kellens, W.; Vanneuville, W.; Ooms, K.; De Maeyer, P. Communicating flood risk to the public by cartography. In Proceedings of the 24th International Cartographic Conference, Santiago, Chili, 15–21 November 2009. [Google Scholar]
  99. Leonard, S.D. Does color of warnings affect risk perception? Int. J. Ind. Ergon. 1999, 23, 499–504. [Google Scholar] [CrossRef]
  100. Stephens, K.K.; Blessing, R.; Tasuji, T.; McGlone, M.S.; Stearns, L.N.; Lee, Y.; Brody, S.D. Investigating ways to better communicate flood risk: The tight coupling of perceived flood map usability and accuracy. Environ. Hazards 2024, 23, 92–111. [Google Scholar] [CrossRef]
  101. Wong, B. Color blindness. Nat. Methods 2011, 8, 441. [Google Scholar] [CrossRef] [PubMed]
  102. USACE. Economic Guidance Memorandum (EGM) 01-03, Generic Depth-Damage Relationships. 2000. Available online: https://planning.erdc.dren.mil/toolbox/library/EGMs/egm01-03.pdf (accessed on 21 February 2024).
  103. USACE. Depth-Damage Relationships for Structures, Contents, and Vehicles and Content-to-Structure Value Ratios (CSVR) in Support of the Donaldsonville to the Gulf, Louisiana, Feasibility Study 2006. Available online: https://www.mvn.usace.army.mil/Portals/56/docs/PD/Donaldsv-Gulf.pdf (accessed on 21 February 2024).
  104. USACE. North Atlantic Coast Comprehensive Study: Resilient Adaptation to Increasing Risk Physical Depth Damage Function Summary Report. 2015. Available online: https://www.nad.usace.army.mil/Portals/40/docs/NACCS/10A_PhysicalDepthDmgFxSummary_26Jan2015.pdf (accessed on 21 February 2024).
  105. State of New South Wales. Flood Risk Management Guideline FB03. 2023. Available online: https://www.environment.nsw.gov.au/-/media/OEH/Corporate-Site/Documents/Water/Floodplains/flood-risk-management-flood-hazard-230231.pdf (accessed on 21 February 2024).
  106. NOAA. Global and Regional Sea Level Rise Scenarios for the United States; NOAA: Washington, DC, USA, 2022.
  107. Fortenberry, B.R. Heritage justice, conservation, and tourism in the greater Caribbean. J. Sustain. Tour. 2021, 29, 253–276. [Google Scholar] [CrossRef]
  108. Carballo, D.M.; Fortenberry, B. Bridging prehistory and history in the archaeology of cities. J. Field Archaeol. 2015, 40, 542–559. [Google Scholar] [CrossRef]
  109. Nadal, N.C.; Zapata, R.E.; Pagán, I.; López, R.; Agudelo, J. Building damage due to riverine and coastal floods. J. Water Resour. Plan. Manag. 2010, 136, 327–336. [Google Scholar] [CrossRef]
  110. Al Assi, A.; Mostafiz, R.B.; Friedland, C.J.; Rahim, M.A.; Rohli, R.V. Flood risk assessment for residences at the neighborhood scale by owner/occupant type and first-floor height. Front. Big Data 2023, 5, 997447. [Google Scholar] [CrossRef]
  111. Pricope, N.G.; Halls, J.N.; Rosul, L.M. Modeling residential coastal flood vulnerability using finished-floor elevations and socio-economic characteristics. J. Environ. Manag. 2019, 237, 387–398. [Google Scholar] [CrossRef]
Figure 1. Top-five most flood-damaged states (bold) within the US (a); most recent NL flooding events occurring in the Province of Limburg (bold) despite higher elevational topography (b); the greater San Juan area (bold) exhibiting the highest flood risks and damage within PR (c).
Geosciences 14 00109 g001
Figure 2. Determining flood inundation using first-floor elevations (FFEs) and water surface elevation (WSE) (left). Elevation certificate (EC) section C—building elevation information (right) required for NFIP policy holders within SFHAs.
Geosciences 14 00109 g002
Figure 3. Sites selected for flood vulnerability analysis: Meyerland (a), Old Empel (b), and Cataño Pueblo (c). These sites (red boundary, bold buildings) represent where drone deployments occurred to collect aerial imagery to derive building elevations.
Geosciences 14 00109 g003
Figure 4. DJI Phantom 4 RTK: drone and remote controller (left); DJI RTK base-station (right) [91].
Geosciences 14 00109 g004
Figure 5. Example of vulnerability classifications on two buildings located in Meyerland. Image obtained through Google Street view. Schematic is for visual purposes only, is not to scale, and is not for regulatory purposes.
Geosciences 14 00109 g005
Figure 6. Data acquisition and modeling workflow.
Geosciences 14 00109 g006
Figure 7. Flood vulnerability profiles showing percent of buildings by flood vulnerability class and inundation elevation means (IEMs) for Meyerland (US), Old Empel (NL), and Cataño Pueblo (PR). Note for visual purposes, figure percentage values are approximate and may contain rounding errors.
Geosciences 14 00109 g007
Figure 8. Flood vulnerability mapping for Meyerland, US (a), Old Empel, NL (b), and Cataño Pueblo, PR (c) using drone FFE data. Maps are intended for flood inundation visualization and risk awareness only and are not to be used for regulatory purposes.
Geosciences 14 00109 g008
Figure 9. Inclusion and exclusion of building elevation information in assessing flood vulnerabilities in NL. Note for visual purposes, figure percentage values are approximate and may contain rounding errors.
Geosciences 14 00109 g009
Figure 10. Inundation vulnerability for Cataño Pueblo buildings under 2050 SLR conditions (a), inundation vulnerabilities for the next highest floor elevations (NHFEs) for applicable buildings within Cataño Pueblo (b), buildings in Cataño Pueblo with inundated or absent NHFE (c).
Geosciences 14 00109 g010
Figure 11. Percent of buildings with NHFE present and absent by vulnerability class for Cataño Pueblo under 2050 SLR conditions. Note for visual purposes, figure percentage values are approximate and may contain rounding errors.
Geosciences 14 00109 g011
Table 1. Flood risk standards for the Netherlands, Puerto Rico, and the US.
CountryManaging AgencyFlood Risk StandardFlood Standard Probability30-Year Mortgage % Probability of Flooding
(Impact)(Designation)(per Year)
The NetherlandsRijkswaterstaat (RWS)Dutch national flood policyLowestDike rings 54–951/250–1/10012–30%
HighestDike rings 13 and 141/10,0000.3%
Puerto Rico and the United StatesFederal Emergency Management Agency (FEMA)Special flood hazard areas (SFHAs)Lowest100-year floodplain1/10030%
Highest500-year floodplain1/5006%
Table 2. Water surface elevations (WSEs) for the selected sites.
Data SourceFlood ProbabilityWSE (m)Flood Source
MeyerlandHEC-RAS 2D1/100 per year7.56–33.2Pluvial
Old EmpelLIWO1/100 per year5.54–8.88Fluvial
Cataño PuebloFEMA1/100 per year2.7–4.0Coastal
Table 3. Flood vulnerability classifications and mapping rubric.
Flood Vulnerability ClassificationMajor InundationModerate InundationMinor InundationAt RiskSafeVery Safe
Flood inundation>0.61 m0.3–0.61 m0–0.29 m
Building freeboard −0.01–−0.29 m−0.3–−0.61 m<−0.61 m
Mapping symbology
Flood inundation: WSE is above FFE (positive (+) case for inundation using Equation (1)). Building freeboard: FFE is above WSE (negative (−) case for inundation using Equation (1)).
Disclaimer/Publisher’s Note: The statements, opinions and data contained in all publications are solely those of the individual author(s) and contributor(s) and not of MDPI and/or the editor(s). MDPI and/or the editor(s) disclaim responsibility for any injury to people or property resulting from any ideas, methods, instructions or products referred to in the content.

