Article

New Tsunami Evacuation Training Methods: A Tsunami Evacuation Training Application

1
Department of Data Science, Nippon Institute of Technology, Miyashiro-machi, Saitama 345-8501, Japan
2
Next Generation Vehicle System Research Center, Aichi University of Technology, Gamagori-shi 443-0047, Japan
3
Department of Information and Media, Aichi University of Technology, Gamagori-shi 443-0047, Japan
4
School of Dentistry, Kanagawa Dental University, Yokosuka-shi 238-8580, Japan
5
Aichi System Corp., Toyota-shi 470-0431, Japan
6
Faculty of Software and Information Science, Iwate Prefectural University, Takizawa-shi 020-0693, Japan
7
Department of Engineering, Faculty of Engineering, Reitaku University, Kashiwa-shi 277-8686, Japan
*
Author to whom correspondence should be addressed.
Geosciences 2024, 14(4), 110; https://doi.org/10.3390/geosciences14040110
Submission received: 10 March 2024 / Revised: 15 April 2024 / Accepted: 19 April 2024 / Published: 20 April 2024

Abstract

:
Despite evacuation on foot being recommended by authorities, evacuation in practice is assumed to include evacuation on foot and evacuation by car, as a certain amount of evacuation by car is to be expected. We developed a tsunami evacuation training application operating on smartphones and tablets, and a tsunami evacuation training simulator to evaluate the effect of this application. We then conducted an experiment in Nishio City to evaluate the application. We found that the subjects were able to quickly grasp the attention targets that were present near them but had difficulty grasping attention targets that were far away. This suggests that participants need to be trained repeatedly on distant objects of attention to be able to locate them instantaneously.

1. Introduction

On 11 March 2011, a gigantic earthquake (M9.0), the Great East Japan Earthquake, occurred in the Pacific close to the Tohoku region, followed by a large tsunami, both striking the Tohoku region of Japan [1]. More than 22,000 people died or went missing, and 37,855 people were displaced to other prefectures [2]. Evacuation plays an important role in saving lives during tsunamis [3]. After the Great East Japan Earthquake, more than 60% of the evacuees used automobiles, as they perceived they would reach a place of safety faster than on foot [4]. According to a survey of the reasons that evacuees of the Great East Japan earthquake used cars, 34% of respondents answered, “[I] thought I would not make it in time out of the reach of the tsunami unless I use my car”, and 20% responded, “safe places were too far away and I could not get there without using the car” [5]. Hara and Kuwahara found using individual probe vehicles and smartphone GPS data that there was serious gridlock in the central area of Ishinomaki, Miyagi Prefecture, in the Tohoku region [6]. Therefore, evacuation by car causes secondary disasters such as the serious gridlock mentioned above, and evacuation by vehicle is generally not recommended [3]. However, approximately 50% of the respondents still said that they would evacuate by car in the event of an earthquake in the Nankai Trough, which is expected to occur in the near future [7]. Even if evacuation on foot is recommended by experts, the actual evacuation situation can be expected to include a mixture of evacuation on foot and evacuation by car since a certain amount of evacuation by car can be expected. Therefore, accidents involving people evacuating by foot and evacuating vehicles should also be considered [8], and it is necessary to understand the risks involved in an evacuation from the perspective of both evacuees on foot and by car. For example, it has been shown that evacuees evacuating by car can experience confusion with pedestrians, creating a risk of traffic accidents [8]. In order to enhance the comprehensibility of such situations, it is necessary to help individuals visualize tsunami evacuation situations that are realistic and understand the obvious risks.
Here, we propose a framework for the use of Information and Communication Technology (ICT) in tsunami evacuation drills, with a particular focus on the use of simulator technology and digital training methods. Tsunami evacuation drills conducted by municipalities and other organizations cannot fully reproduce the situation of automobiles and pedestrian. In contrast, a digital or virtual simulation can reproduce these situations as if they were natural and real, which is beneficial for the experience of evacuations by car and on foot. For tsunami evacuation drills, a training system that can simulate virtual circumstance and operate on smartphones and tablet terminals would be an easy way to improve evacuation knowledge anywhere and at any time. Early tsunami warnings enable the timely evacuation of near-shore residents, and accurate and prompt tsunami warnings are essential for reducing damage to lives and properties [9]. Therefore, a training system using ICT technology will lead to more accurate and prompt tsunami warnings and will contribute to the mitigation of damage to human lives and property more than ever before. Accordingly, our study focuses on the following:
  • The development of an application for tsunami evacuation drills for smartphones and tablets that reflects the knowledge of people who have experienced an evacuation.
  • A verification of the effectiveness of the developed application for tsunami evacuation drills under the situation reproducing a tsunami evacuation.
This paper presents a case study of a newly developed tsunami evacuation training application that runs on smartphones and tablets, into which a tsunami evacuation training simulator, which can reproduce evacuations by vehicle and on foot, was also introduced to verify its effectiveness. Based on these developments, an experiment to evaluate the effectiveness of the tsunami evacuation training application using the tsunami evacuation training simulator and its results are also described.
The remainder of this paper is organized as follows. Section 2 explains the related works and describe the characteristics of our research. Section 3 describes the development of the tsunami evacuation training application, a tool to raise awareness about tsunami evacuation, as well as the development of a tsunami evacuation training simulator. Section 4 describes the experiment conducted to evaluate the tsunami evacuation training application. Section 5 presents the results of the experiment, especially the questionnaire responses and logging data of the application. Section 6 shows the considerations about the result of the experiment. Section 7 describes the limitations of this work. Finally, Section 8 concludes the study.

2. Related Works and Relation to Our Work

In this section, we describe related research on applications and simulators for tsunami evacuation drills, which are the main points of our study, and outline possible solutions to the problems presented in the previous section.

2.1. About Applications for Tsunami Evacuation Drills

Yamori and Sugiyama developed a smartphone application named “Nige-Tore”, which provided tsunami hazard maps and tsunami arrival times and used GPS to record the current location, route, and speed of the moving trainees to determine the results of the training [10]. Han et al. developed an application that supported swift tsunami evacuations, which can be especially helpful for those who do not have sufficient knowledge of evacuation routes and refuge places [11]. There have been many studies developing applications and verifying their effects on improving people’s tsunami evacuation awareness. As described above, it can be concluded that application-based evacuation drills have been used in practice, and their effectiveness has been ensured to some extent. However, to the best of our knowledge, these previous studies focused only on evacuation on foot, even though actual disasters involve a mixture of evacuations on foot and by car. Therefore, in order to effectively improve evacuation awareness through the use of the application, it is necessary to make the content aware of evacuations both on foot and by car, and our developed application also considers evacuations both on foot and by car.
In addition, traditional tsunami evacuation drills are monotonous [12], and participants are not always interested in or committed to such drills, even if evacuation drills are commonly conducted as traditional disaster education to reduce damages from natural disasters [13]. There have been some serious games for tsunami evacuation drills, such as “Disaster Master”, “Stop Disasters”, “Earth Girl” and “Tanah—The Tsunami and Earthquake Fighter” [14]. However, if the emphasis is on game elements to raise awareness of tsunami evacuation, adults in particular may think that the content is not serious enough, despite the fact that it is a teaching tool. As far as we were able to ascertain from interviews and other research, older adults in particular tend to be less comfortable with training tools that have an entirely game-like element. Considering this, for the application we developed, we only incorporated game elements in some of the content. This is explained in detail in Section 3.2.

2.2. About Simulator for Tsunami Evacuation Drills

Simulators are tools that mimic the basic behavior of real machines but do not necessarily follow all the rules of the real environment. Therefore, situations that do not (or cannot) occur in the real world can occur in the simulator world. Driving simulators are perhaps the best-known example of such tools. Needless to say, tsunami disasters and similar imminent situations cannot be replicated in the real world. Only large-scale evacuation drills conducted by local governments can reproduce the imminent situation, but they are costly and require large numbers of personnel.
Therefore, we developed a simulator that can simulate the tsunami evacuation situation. There was a previous study on the development of driving simulators for tsunami evacuation [15]. However, that simulator was focused on evacuation by vehicle only. In addition, the evacuation situation of a mixture of evacuees on foot and by car was not reproduced. Therefore, from the viewpoint of a realistic tsunami evacuation experience, it was necessary to develop a simulator that can simulate evacuations on foot, and we developed a simulator that can simulate both evacuations on foot and by car.

3. Materials and Methods

3.1. About the “Tsunami Evacuation Training Application”
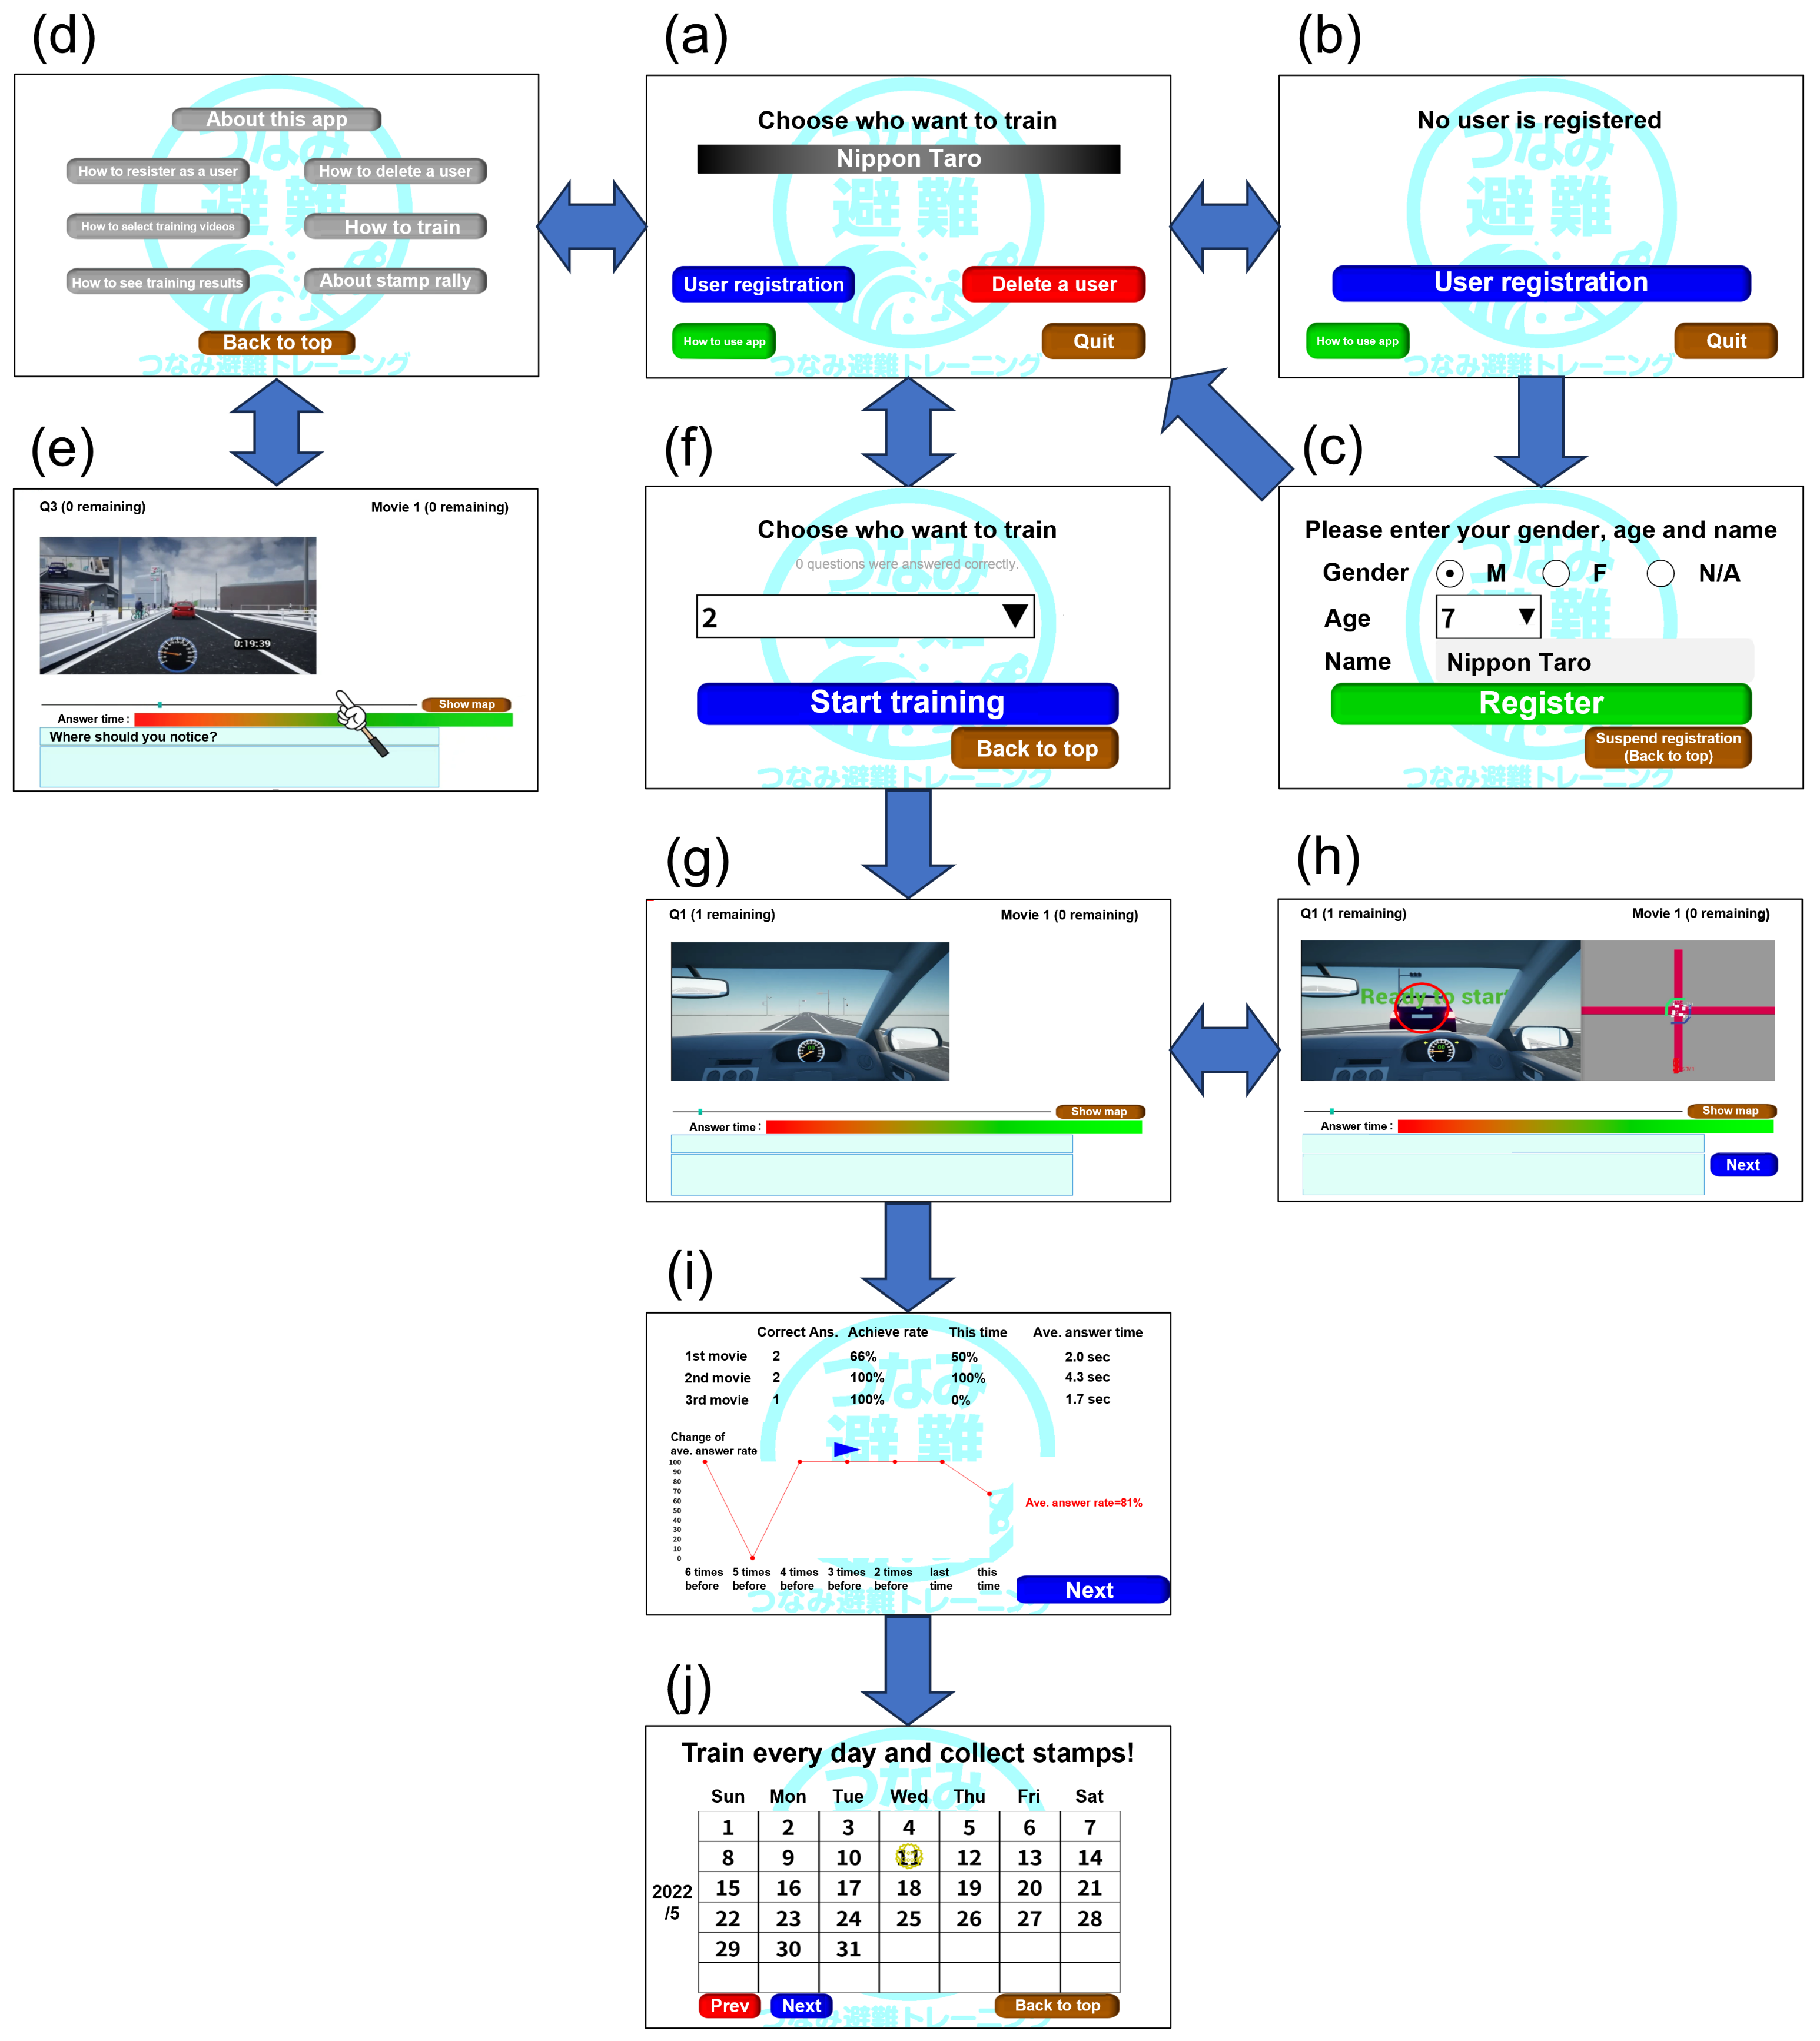
We developed an application for tsunami evacuation instruction based on the results of a preliminary study. In Japan, many companies and schools conduct Kiken Yochi Training (KYT), that is, risk-anticipating training, which originated in Japan [16] and was first practiced in 1976 [17]. This training was conducted with several participants. For example, a picture was shown, and the participants were asked to imagine or visualize potential dangers using the picture as a clue with the purpose of increasing the participants’ awareness and ability to perceive danger by sharing and understanding each other’s ideas. In other words, KYT involves brainstorming about hazardous events. KYT increases workers’ awareness of danger and motivation to practice in teams, pools hazard information, and improves their problem-solving capabilities [18]. KYT can reduce human errors and improve safety performance [19]. Traditionally, questions in KYT have been limited mainly to work-related casualties [20,21,22] and natural disasters such as fires [23], earthquakes [24], and water hazards [24]. However, as mentioned above, tsunamis are infrequent disasters, and there is less knowledge than for other hazards and disasters on how to protect against them using questions conducive to use in KYT. Traditionally, KYT has been paper-based, but we decided to develop a KYT application for smartphones and tablet devices, so that it could be easily used by citizens of all ages. Here, we named this developed KYT application the “Tsunami Evacuation Training Application”.
The “Tsunami Evacuation Training Application” is an application for the Android OS to create awareness of evacuations from tsunamis. Users watch simulated tsunami evacuation videos made by Unreal Engine 4 (Epic games) on their smartphones or tablets. The video pauses at a location that the user is expected to notice; therefore, the user is aware of the location on the video that requires attention during an evacuation and taps on that location. Regardless of whether the point the user taps on is correct, a jingle will sound when the tap is made, and the correct point to note and the reason the user should notice it is indicated. The correct note point is indicated by a red circle on the screen. In other words, this application is a kind of quiz game.
Figure 1 shows the operation flow of the “Tsunami Evacuation Training Application”. The meaning of each picture and abbreviation in Figure 1 is as follows. In Figure 1, the direction of the arrow indicates the transition direction.
(a)
Menu screen, where the user selects his/her name. If the user taps the brown button, the app will shut down.
(b)
User registration screen. If not registered, the user needs to push the “User registration button”, the blue button in (a), and register his/her status.
(c)
User attribute input scene. After the user taps the blue button in (b), he/she can input his/her attributes: gender, age, name. These data are only used for data analysis.
(d)
Tutorial image selection screen. If users cannot understand how to use the application, they need to tap the green button in (a), then transit the tutorial mode to learn how to use the application through images. In (d), they can choose the number of images that they want to watch.
(e)
Tutorial image screen. The images that the user chooses in (d) are shown.
(f)
Training image selection screen. After the user’s name is chosen in (a), the user also needs to choose how many images he/she will watch for training.
(g)
Training screen. An image is displayed, and the image represents some point of hazard. The user taps on the location of the perceived hazard.
(h)
Training screen with an overhead view. In (g), an overhead view allowing users to determine their location is shown when they tap the brown button.
(i)
Result screen. After the user has watched all images and finished all the training, the number of correct answers, the percentage of correct answers, the average percentage of correct answers so far, and the average time to answer are displayed, and the daily, weekly, and monthly changes in the percentage of correct answers are shown graphically.
(j)
Stamp screen. After the user taps the blue button in (i), a calendar is displayed where a stamp is placed on every day the user watched a video and trained. If the user taps the brown button, the screen transits to (a).
For aid in developing the “Tsunami Evacuation Training Application”, we previously conducted an experiment in Ishonomaki City, which had been damaged by the Great East Japan Earthquake, using the tsunami evacuation training simulator (explained in Section 3.3) [25]. This experiment found the following tendencies in tsunami evacuation behavior:
  • Participants who had experienced an actual tsunami evacuation often looked at traffic signals during evacuation to assess the situation and determine whether the traffic flow was normal.
  • Experienced participants often looked at tall or large buildings for aid in navigating to their destinations and to find alternative safe places to quickly evacuate to.
  • During an evacuation by car, experienced participants were often unaware of pedestrians attempting to cross at the crosswalks, as their attention was more focused on traffic signals, other vehicles, and tall buildings than on pedestrians.
Considering these findings, the “Tsunami Evacuation Training Application” was designed to mainly include questions that direct attention to “traffic signals”, “tall or large buildings”, “pedestrians attempting to cross the crosswalk”, and “vehicles not noticing pedestrians attempting to cross the crosswalk”.
Let us consider an example. Figure 2a illustrates one of the training situations, a view of evacuating from a tsunami by vehicle. In the figure, users are to consider a situation in which they are evacuating from a tsunami and can see a hospital, which is designated as an emergency evacuation building in Nishio city, which was the target city in this study’s experiment as discussed later. In the situation shown in the figure, the question is, “What should you notice (in this situation)?” The correct answer is shown in Figure 2b: “Be aware of the presence of high-rise buildings that could serve as evacuation sites”.
Each training video contained from three to ten questions, and eight videos were prepared for the training. Thus, users who did not have much time could easily train by watching one video and answering questions, while users who had more time could watch all eight videos and train more carefully. After the user watched all the initially selected videos and answered all the questions, the average percentage of correct answers was displayed on a line graph. The results of the training so far were visualized after finishing the training. The correct number, achievement rate of the questionnaire, overall correct rate, and average correct rate of each video were shown as text, as well as a time-series graph of the average answering rate.

3.2. Gamification Content for “Tsunami Evacuation Training Application”

The “Tsunami Evacuation Training Application” has gamification features. According to Kapp, gamification is defined as “using game-based mechanics, aesthetics and game thinking to engage people, motivate action, promote learning, and solve problems” [26], and the point of gamification is to integrate game elements and game thinking into activities that are not games [27]. In our “Tsunami Evacuation Training Application”, we introduced a stamp-rally function. A stamp rally is a game-like event in which participants aim to collect stamps by going to different locations on a card, where prizes can be won according to the number of stamps collected [28]; these are often held in Japan. We thought that this would add a competitive element and be enjoyable in a game-like sense. Thus, in the “Tsunami Evacuation Training Application”, a stamp-rally function was implemented, where a participant who completed all the training in one video would receive a red cherry blossom stamp; on completing all the training in all eight videos, he/she would receive a gold cherry blossom stamp. The stamp-rally feature was implemented to motivate users to train daily. The results of the training and stamp-rally features of the “Tsunami Evacuation Training Application” are shown in Figure 3a and Figure 3b, respectively.
If someone was not familiar with the operation of the application, they might not be able to use it well, even if paper operation manuals were provided. Therefore, we prepared an audio operation instruction movie to help users smoothly operate the “Tsunami Evacuation Training Application”, thereby enhancing its usability.

3.3. Tsunami Evacuation Training Simulator

The tsunami evacuation training simulator consisted of a desktop PC, steering controller, and head-mounted display (HMD). The tsunami evacuation training simulator software was installed on a desktop PC, the specifications of which are listed in Table 1.
The simulator was based on the driving simulator software Sirius, developed by Misaki Design LLC [29] using the Unreal Engine 4. The traffic environment was reproduced using the open-source multi-agent traffic flow simulation program Re:sim, developed by Misaki Design LLC, which controlled traffic and human flow in the simulator [29]. Therefore, the tsunami evacuation training simulator simulated a mixture of evacuees on foot and by car. Note that this simulator could not simulate an evacuation on foot or by car simultaneously. In other words, the simulator could simulate either an evacuation on foot or an evacuation by car in a situation in which the two types of evacuees were mixed. In the case of an automobile evacuation, a steering controller connected to a PC was operated. In this case, the driver operated the steering controller connected to the PC and watched the screen on the display connected to the PC. However, in the case of an evacuation on foot, an HMD (Vive Pro Eye, HTC Corporation) was used, and the button on the attached controller was pressed to make the user walk in the direction in which their head was facing at that time. In addition, a sub-display was set to the left side of the user to show the map while evacuating by car. The operating scene of the simulator is shown in Figure 4. Figure 4a shows the tsunami evacuation training simulator assuming an evacuation by car, and Figure 4b shows that assuming an evacuation on foot. The simulation screens for the actual evacuations by car and foot are shown in Figure 5a and Figure 5b, respectively.

3.4. Maps Implemented in the Simulator

A map of Nishio City, Aichi Prefecture, Japan, was used for the simulator because it was assumed that the evaluation experiment of the tsunami evacuation training application described in this paper would be conducted with Nishio’s citizens. Nishio City is one city of Aichi Prefecture, Japan, and is located in the center of Japan. Nishio City has suffered from tremendous tsunamis [30], for example, the 1707 Hōei Earthquake caused flooding damage in reclaimed land, the Ansei Tokai Earthquake of 1854 caused levee failures and flooding. Since then, Nishio City has suffered several disasters, and the most recent major disaster, the Isewan Typhoon in 1959, killed 35 people and damaged about 21,000 buildings. Nishio City is furthermore expected to suffer severe damage from a future Nankai Trough earthquake, and the damage is expected to experience an estimated seismic intensity of 7, a maximum tsunami height of 4.6 m, a tsunami arrival time of 53 min, and an inundation area of 5172 ha (about one-third of the city area) [31]. Based on the above, Nishio City was judged to be an appropriate experimental environment.
In particular, a 3 km × 3 km area centered on the Aichi Prefectural Isshiki High School was implemented. Considering the processing speed and load on the computer, not all roads and buildings could be reproduced in the tsunami evacuation training simulator. Therefore, only the red roads and buildings or houses along these roads were reproduced (Figure 6). This area is where national and city roads intersect and was deemed appropriate for reproducing a situation in which pedestrians and automobiles intersect. Several types of evacuees on foot (children, elderly, wheelchair evacuees, etc.) were evacuated at speeds based on the results of the Aichi Prefecture tsunami evacuation simulation [32]; thus, the simulation reproduced the actual tsunami evacuation almost exactly.
In order to create a sense of realism in the simulator, a countdown was displayed in the lower right corner of the screen indicating that the tsunami would arrive in 20 min, and the audio of the tsunami warning from Nishio City was also presented to the experiment participants during the evacuation using the simulator. In the Ishinomaki City experiment, the participants in Ishinomaki City commented that both the countdown and the audio provided a sense of urgency. Therefore, we judged that this was appropriate for improving the sense of urgency in the simulator.

4. Experiment

The experiment was conducted with 25 people living in Nishio City, Aichi, Japan. Of the 25 participants, 17 were male and 8 were female. The means and standard deviations of all participants’ ages were 47.88 ± 16.38 years old; those of male participants, 48.88 ± 16.56 years old; and those of females, 45.75 ± 16.91 years old. None of the participants had ever experienced a tsunami or tsunami evacuation.

4.1. Evacuation Route

Each participant’s evacuation route was assigned based on their neighborhood, as shown in Figure 7. Participants were recruited with the cooperation of the Nishio City Crisis Management Division. Residents of neighborhood associations along Evacuation Routes 1 and 2 in Figure 7 were recruited while ensuring that the number, age, and gender ratio were as equal as possible. In Figure 7, Ⓢ signifies the starting point and Ⓖ the destination. The age and evacuation routes of each participant are listed in Table 2. Those living in the Route 1 neighborhood evacuated via Route 1, while those living in the Route 2 neighborhood evacuated via Route 2. Participants living in other neighborhoods were distributed so that overall, Route 1 and Route 2 evacuees were approximately equally distributed.

4.2. Experimental Flow

The experimental setup is shown in Figure 8. Figure 8a shows the setting of the tsunami evacuation training simulator, Figure 8b the experiment of an evacuation by vehicle, and Figure 8c the experiment of an evacuation on foot. In Figure 8c, elderly participants performed the VR experiment while seated in a chair for fear they might lose their balance and fall during the VR experiment. The experimental flow was as follows:
1
After explaining the experiment and providing informed consent, the participants completed an experimental consent form. All participants were also informed that they could decline to participate in the experiment, even while the experiment was in progress.
2
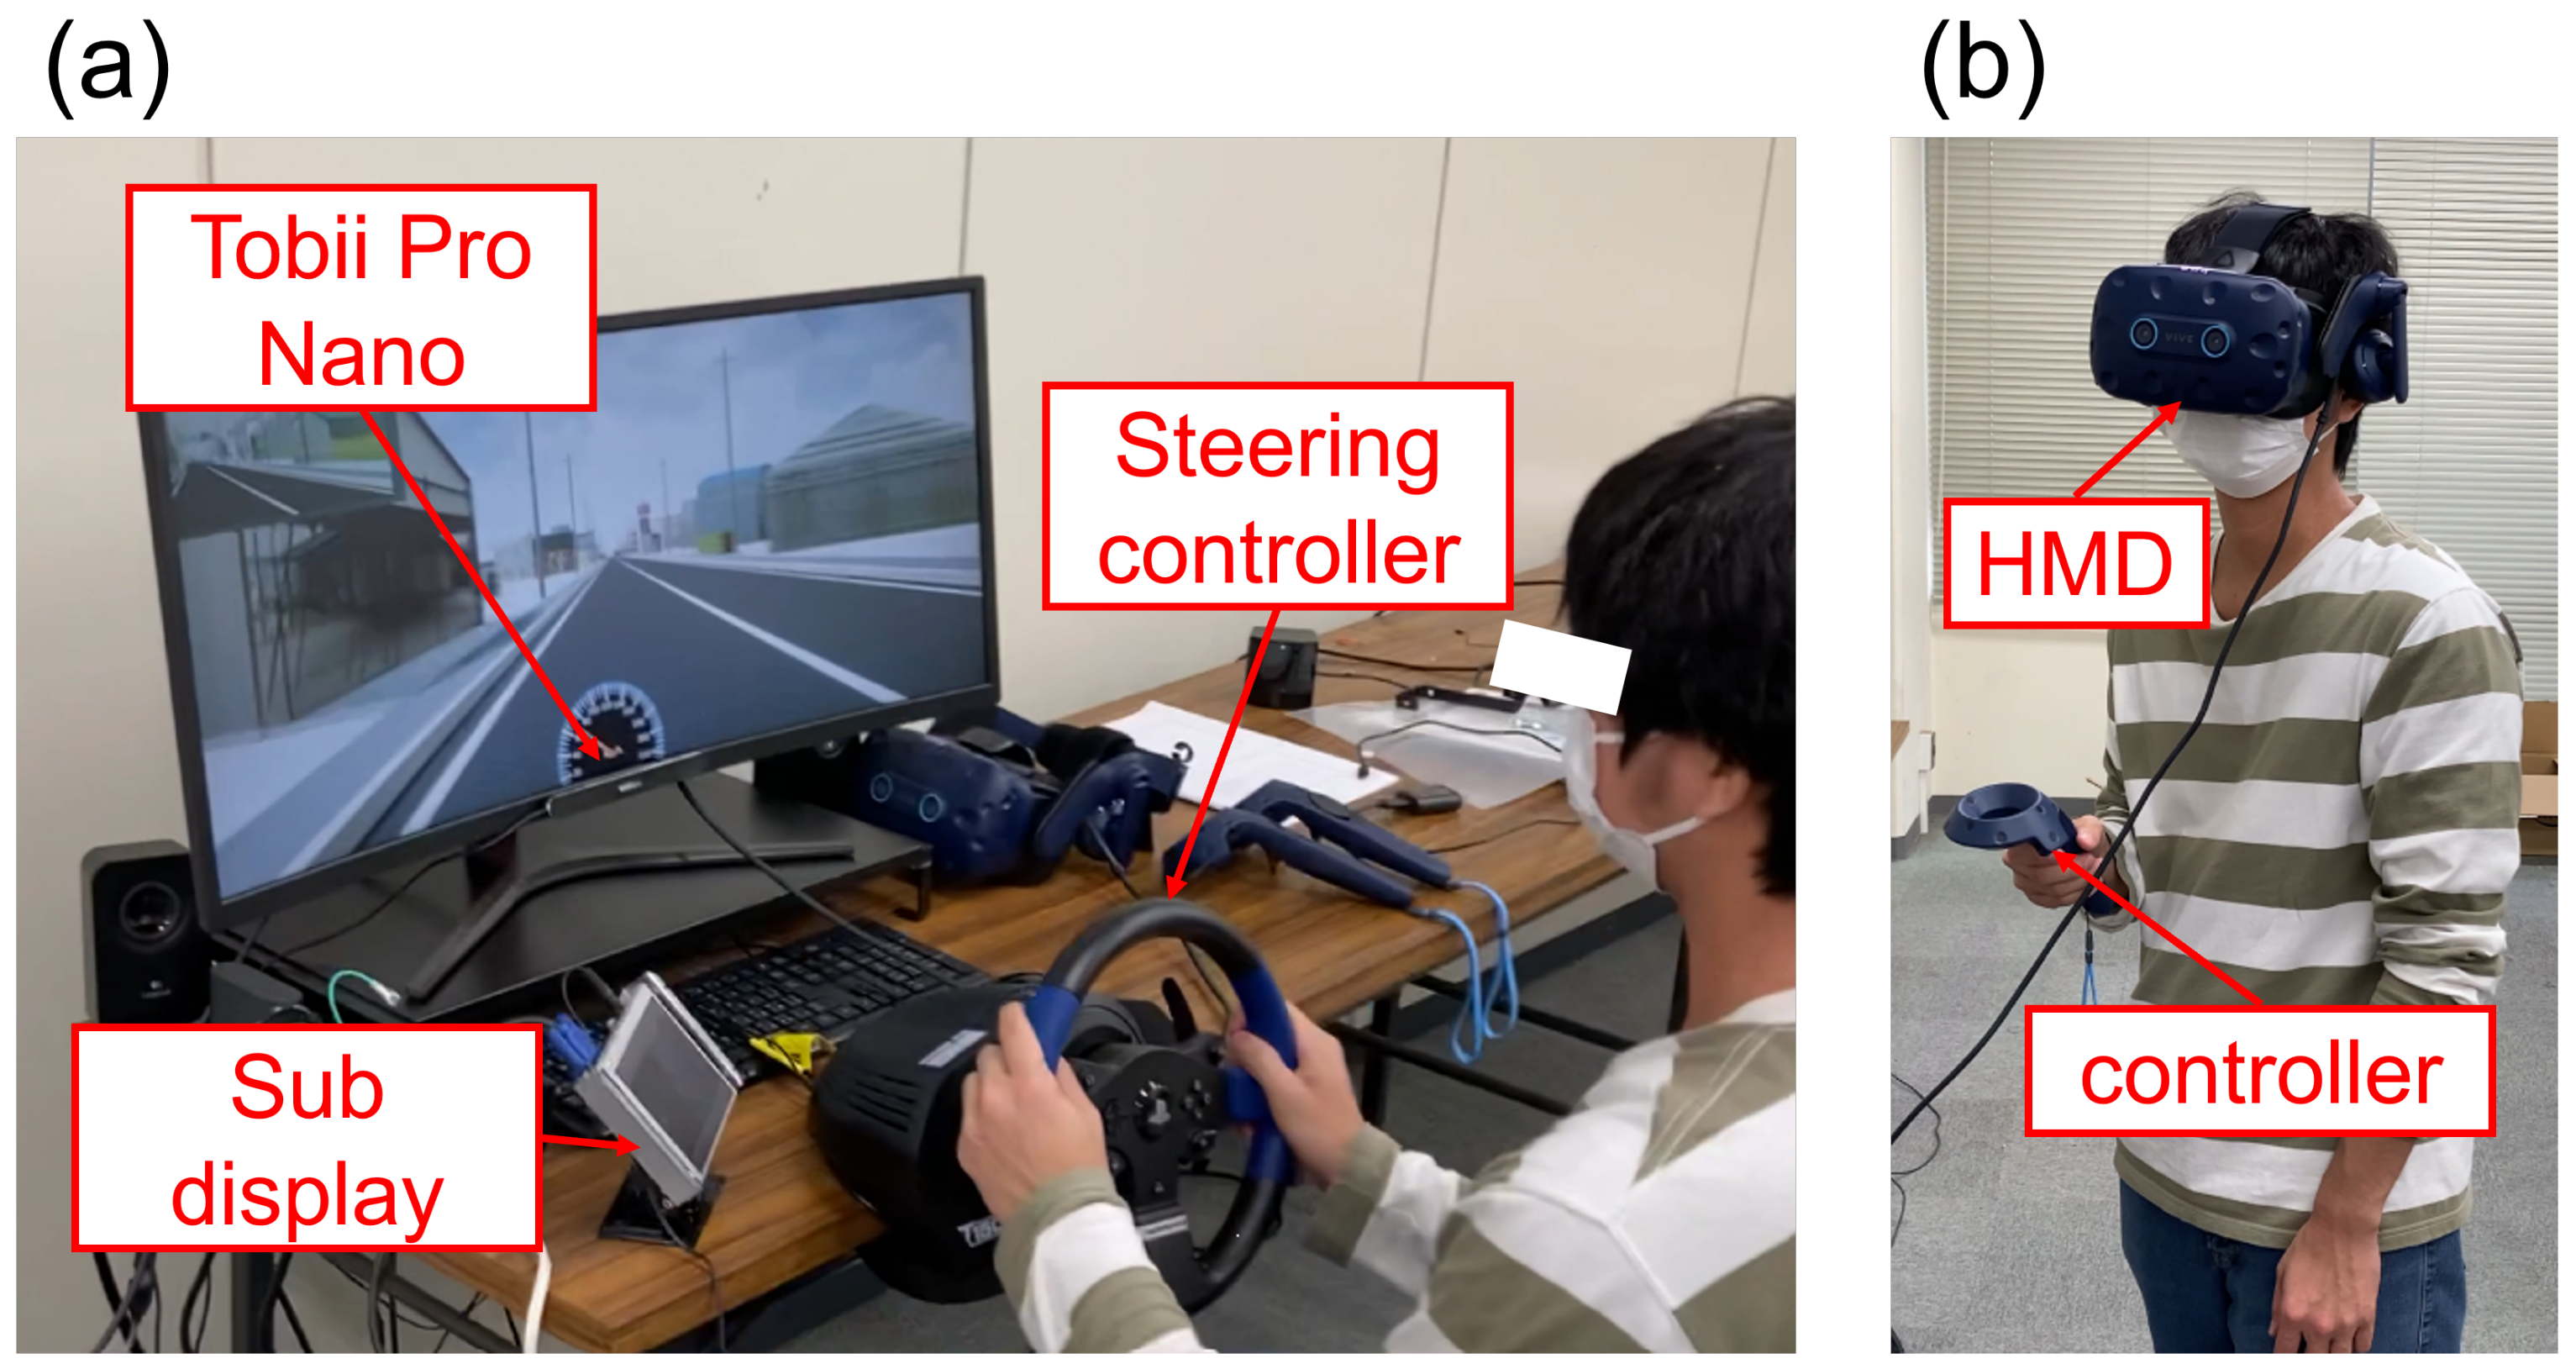
The participants sat in chairs and adjusted their seating positions because they were first tested on evacuating by car.
3
Participants were instructed about the route along which they would evacuate.
4
The participants ran freely along the indicated route as a trial evacuation to familiarize themselves with the operation of the tsunami evacuation training simulator and evacuation by car (twice). We called this stage the “trial car-evacuation experiment”.
5
The participants evacuated along the indicated route by car. We called this stage the “car-evacuation experiment”.
6
Participants had a five-minute break.
7
After the break, each participant was attached to an HMD.
8
Participants walked freely along the indicated route as a trial evacuation to familiarize themselves with the operation of the tsunami evacuation training simulator and evacuation on foot (1 time). We called this stage the “trial foot-evacuation experiment”.
9
The participants evacuated along the indicated route on foot. We called this stage the “foot-evacuation experiment”.
10
All participants completed a questionnaire about their awareness of a tsunami evacuation.
11
All participants were instructed on how to use the “Tsunami Evacuation Training Application”, chose the device they wished to use (smartphones, or tablets), and took the smartphone or tablet home.
12
For six days from the day after the above experiments, participants used the “Tsunami Evacuation Training Application” on the smartphone or tablet that they chose. The participants were also asked to note what they noticed when operating the “Tsunami Evacuation Training Application”.
13
The week following the experiment with the tsunami evacuation training simulator, participants again performed the experiment with the tsunami evacuation training simulator. Steps 2–9 of the experimental procedure were repeated. However, in Step 4, the trial car-evacuation experiment was conducted only once because the participants were accustomed to driving and operating the simulator.
14
All the participants completed a questionnaire on tsunami evacuation awareness. This questionnaire was compared to the questionnaire in Step 10 to determine the effectiveness of the “Tsunami Evacuation Training Application”.
As explained above, each participant was asked to complete the questionnaire three times: after the first experiment on the tsunami evacuation training simulator, while using the “Tsunami Evacuation Training Application” on a smartphone or tablet, and after the second experiment on the tsunami evacuation training simulator, that is, one week after the first experiment on the simulator. The questions were as follows:
(1)
After the first experiment on the tsunami evacuation training simulator
“What do you think you need to notice during evacuation from a tsunami?”.
(2)
When using the “Tsunami Evacuation Training Application” on a smartphone or tablet:
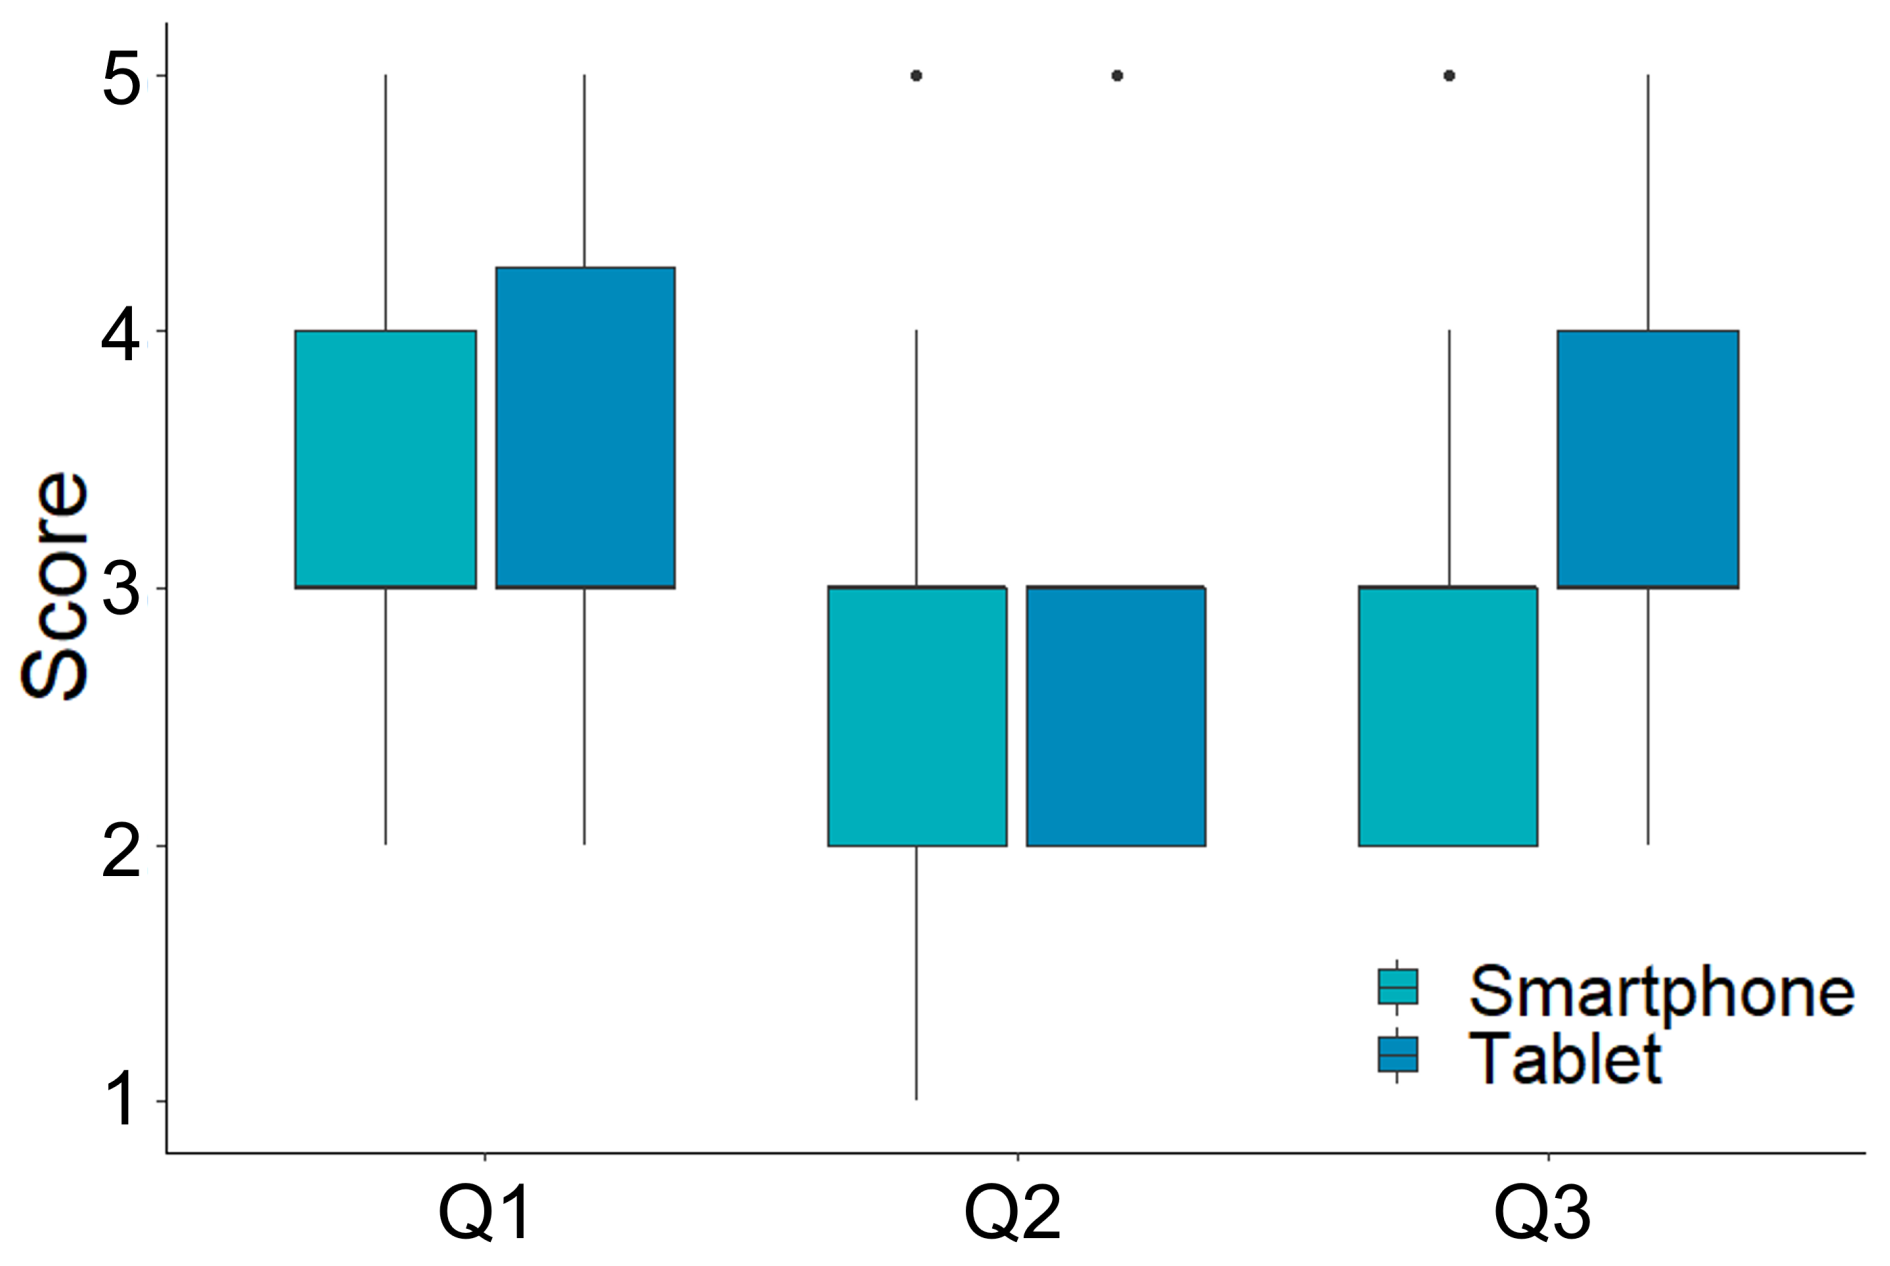
Q1
How do you rate the operability of the “Tsunami Evacuation Training Application”? (5-point scale: 1—bad, 5—good).
Q2
How do you rate the visibility of the “Tsunami Evacuation Training Application”? (5-point scale: 1—bad, 5—good).
Q3
How do you rate the font size of the “Tsunami Evacuation Training Application”? (5-point scale: 1—bad, 5—good).
Q4
Are the numbers of questions adequate? (5-point scale: 1—inadequate, 5—adequate).
Q5
How was the number of training videos? (5-point scale: 1—less, 5—more).
Q6
Write down whatever you noticed while using the “Tsunami Evacuation Training Application”.
(3)
After the second experiment on the tsunami evacuation training simulator
“What do you think you should notice during an evacuation from a tsunami?”.
In this experiment, two types of devices were prepared for the “Tsunami Evacuation Training Application” operation: a smartphone (moto e6S, Motorola) and a tablet (TAB M10, Lenovo). As explained above, all participants chose the device they preferred to use (smartphone or tablet) and took the device home. Eight smartphones and five tablets were prepared; however, because each device was selected on a first-come, first-served basis, it was not always possible for participants to use the device of their choice.
All experimental procedures were approved by the Ethics Review Board for Research Involving Human Subjects of the Nippon Institute of Technology (No. 2022-002).

5. Results

We introduce the results of the experiment under the following three points:
(1)
Usability of the “Tsunami Evacuation Training Application”.
(2)
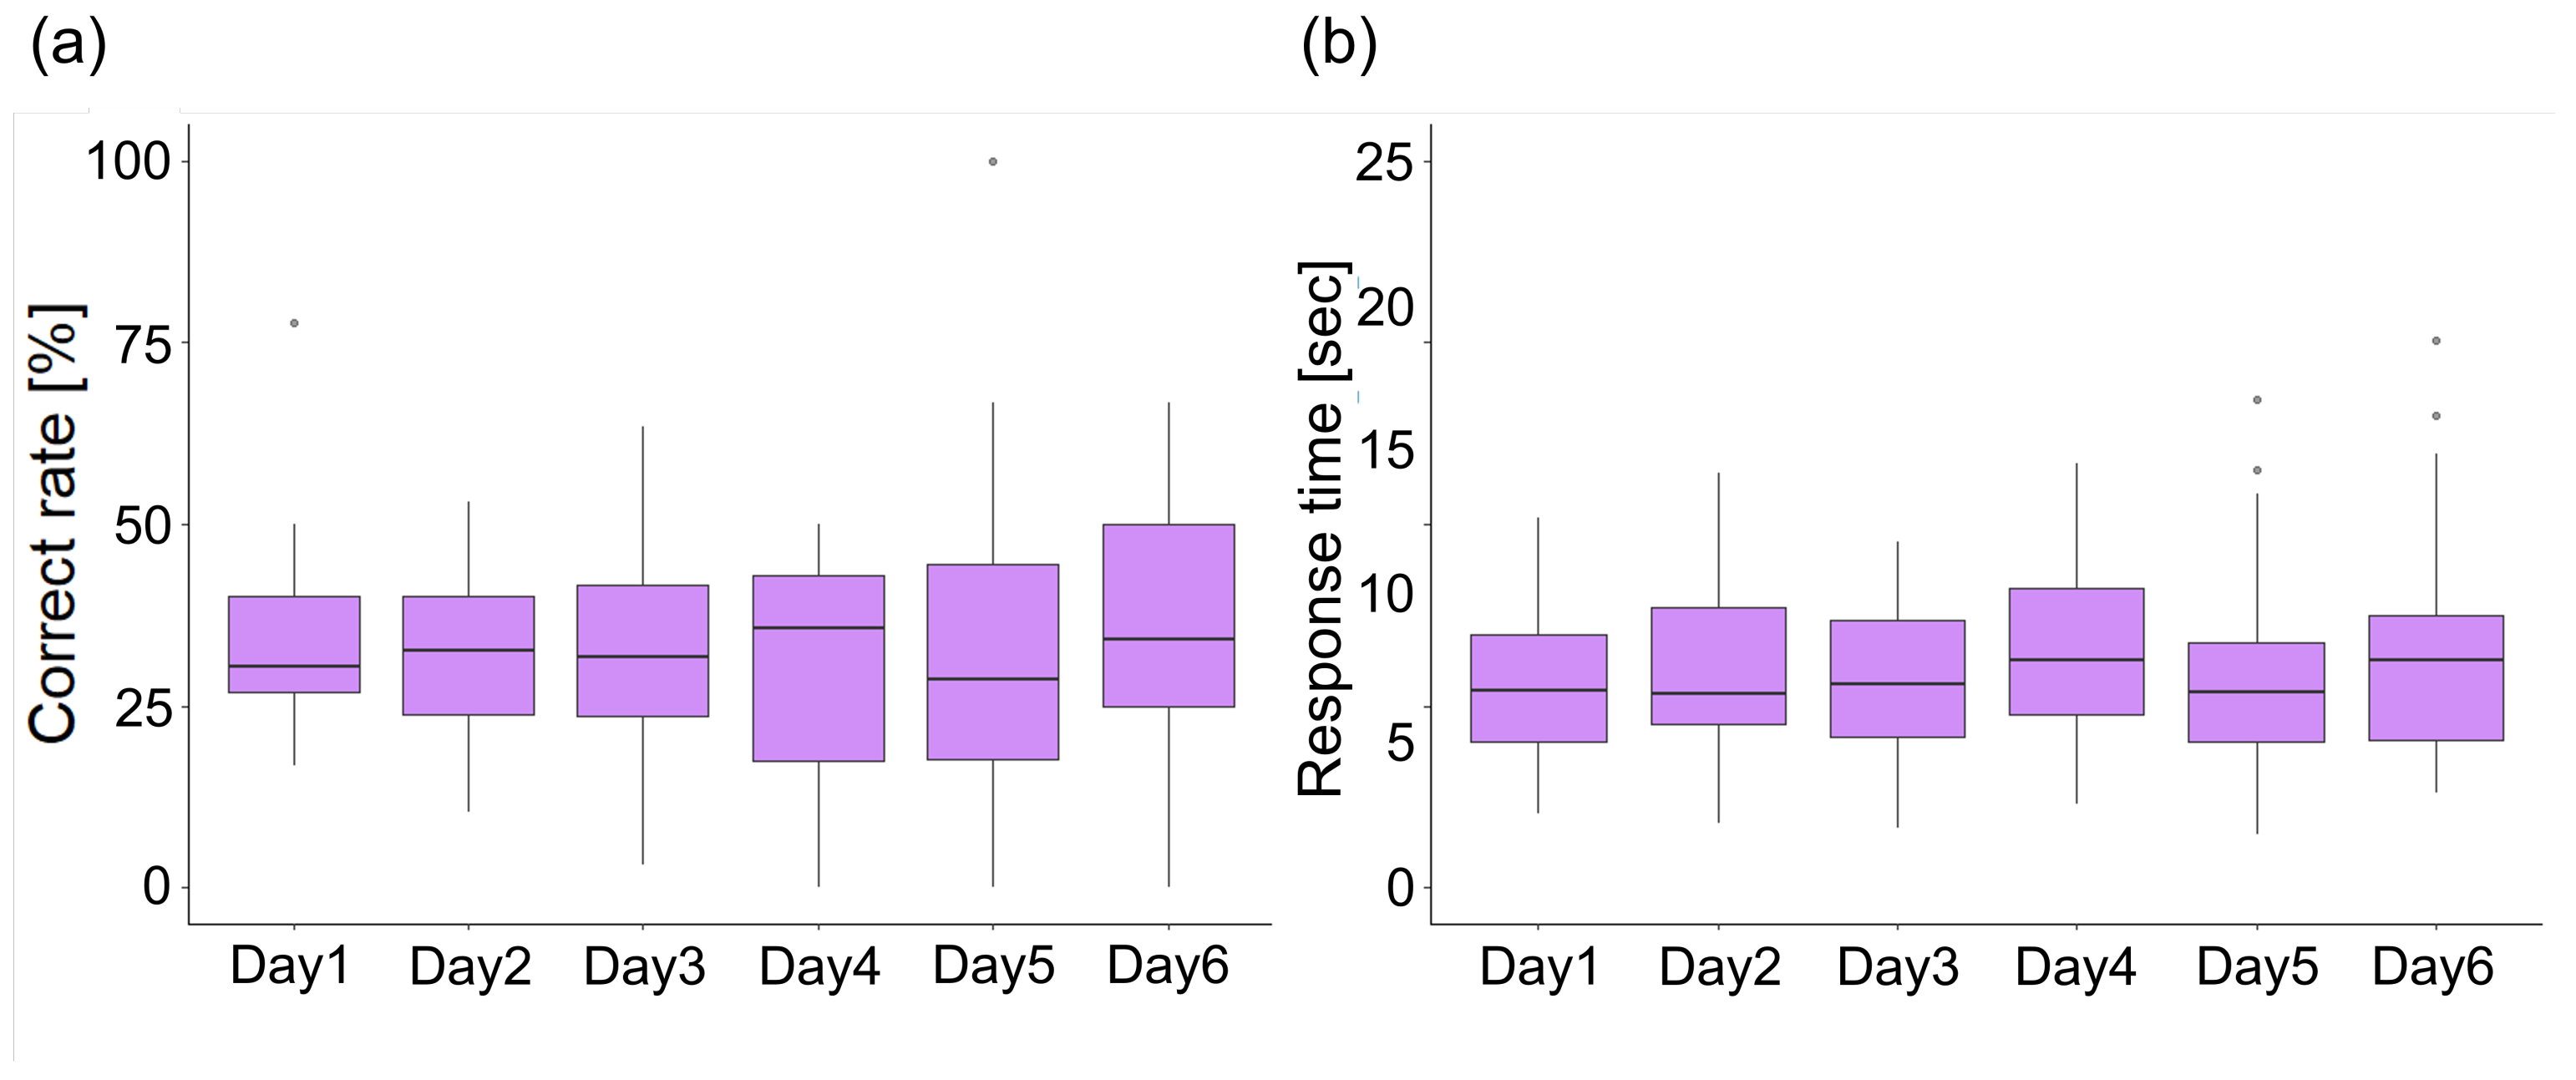
Personal characteristics and question-answering tendencies in the “Tsunami Evacuation Training Application”.
(3)
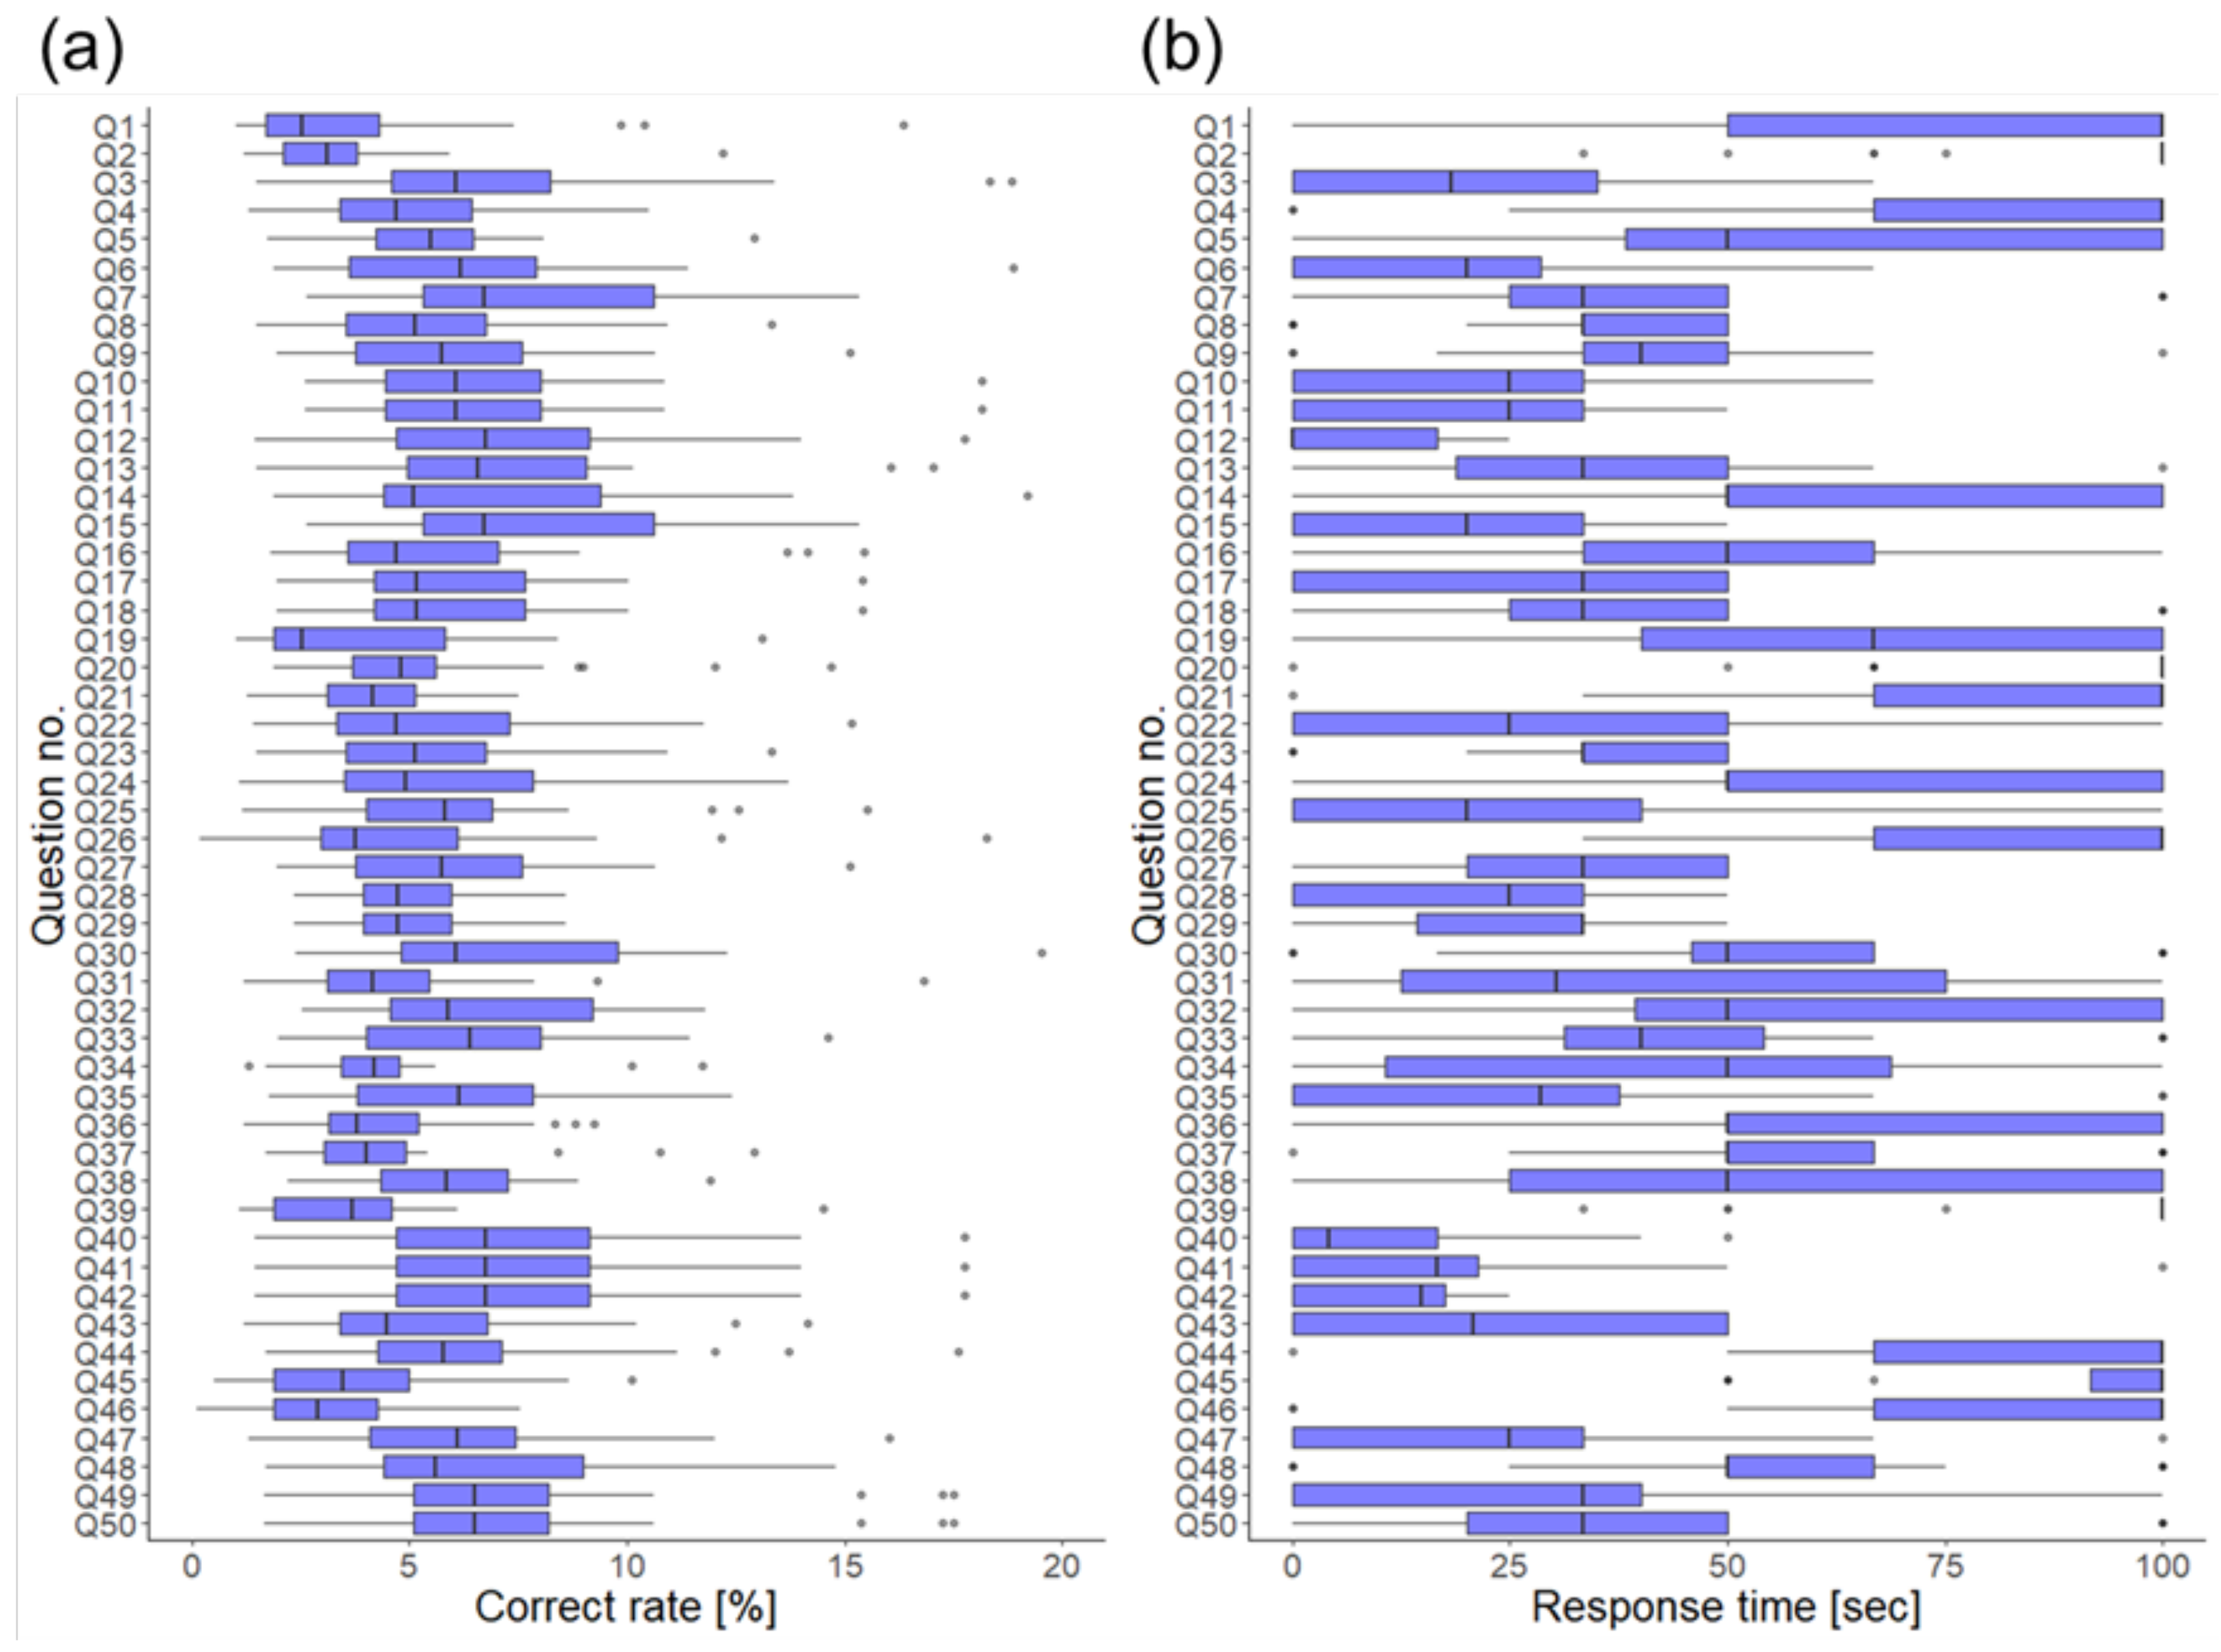
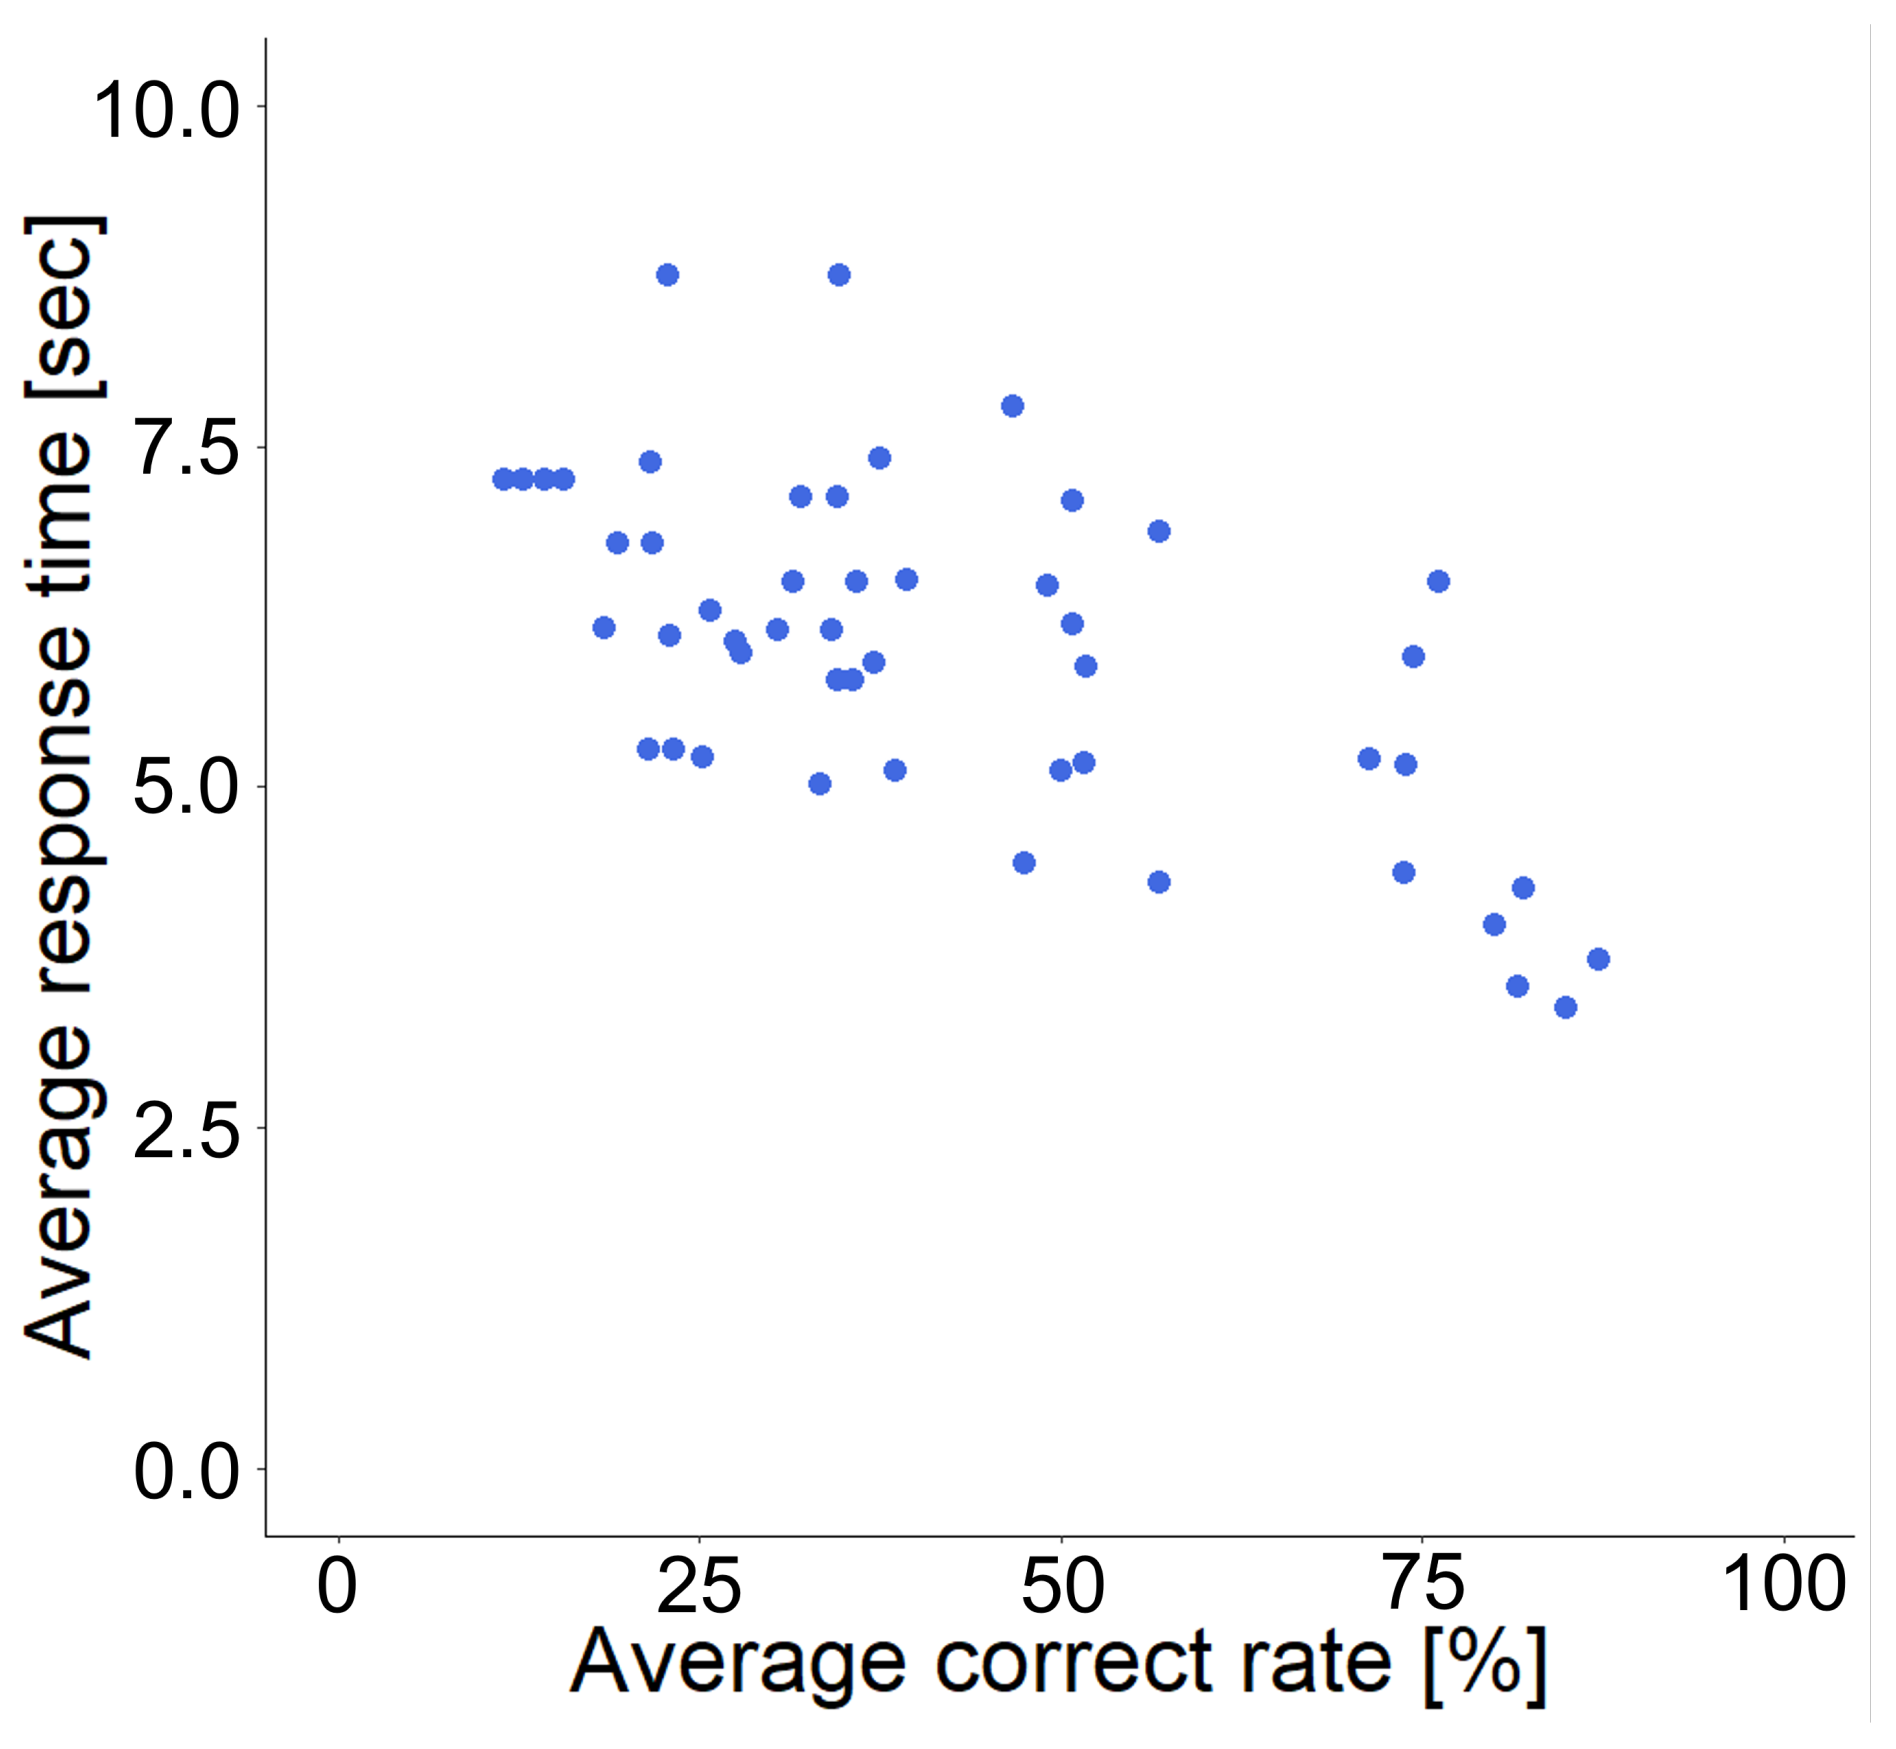
Validation of question characteristics based on answer trends when using the “Tsunami Evacuation Training Application”.
In the above, (1) and (2) were analyzed based on the questionnaire after the first tsunami evacuation training simulator experiment, while using the “Tsunami Evacuation Training Application”, and after the second tsunami evacuation training simulator experiment. (3) was analyzed based on logging data from “Tsunami Evacuation Training Applications” on smartphones and tablets. R version 4.2.1 and RStudio 2022.07.02 Build 576 were used for statistical analysis in this study.

5.1. Usability of the “Tsunami Evacuation Training Application”

Participants were able to use the “Tsunami Evacuation Training Application” on their preferred device, a smartphone or tablet device. However, since the screen sizes of smartphones and tablets were different, 6.1 inches for the former and 10.1 inches for the latter, the application’s operability could differ, which could affect the correct response rate and time required. Therefore, we checked whether these differences affected the correct rate and response time.
First, the usability of the “Tsunami Evacuation Training Application” was verified. The results for questions Q1 to Q5 are shown as a box–whisker plot in Figure 9. From Figure 9, for Q1 to Q5, the operability, visibility, font size, quantity of questions, and training video were considered approximately normal considering that the median was neither good nor bad; however, the ratings for visibility of the “Tsunami Evacuation Training Application” were slightly poorer than those of the other questions, judging from the overall distribution of the box–whisker plot.
To examine the effects of the different devices used, we compared the scores for each device used for each question. A box–whisker plot showing the difference in scores between smartphones and tablets for each question is shown in Figure 10. The effect of using the device for each question was verified by the Wilcoxon rank-sum test, and for each question relating to usability and visibility, that is, Q1, Q2, and Q3, the result of the Wilcoxon rank-sum test showed no significant difference (Q1: p = 0.9528 , Q2: p = 0.9767 , Q3: p = 0.2563 ).
First, we verified the correct rate and response time based on the usability of the “Tsunami Evacuation Training Application”. The box–whisker plot showing the relationship between the type of device (smartphone vs. tablet) and the correct rate is shown in Figure 11a, and the relationship between the type of device (smartphone vs. tablet) and the response time is shown in Figure 11b.
The difference in correct rate for the smartphone and tablet was verified by the Wilcoxon rank-sum test, which found no significant difference ( p = 0.949 ). Next, the difference in the response time for smartphones and tablets was verified by the Wilcoxon rank-sum test, which found no significant difference between the response times of the two devices ( p = 0.9094 ). Based on these considerations and the participants’ comments, it can be concluded that there was no difference between smartphones and tablets in terms of the essential use of the “Tsunami Evacuation Training Application”, although participants were certainly dissatisfied with its usability and visibility on the smartphone.
The results of what the participants noticed when using the “Tsunami Evacuation Training Application” (Q6) are also shown in Figure 12. It should be added that all the participants wrote down suggested points of improvement or dissatisfaction, not their points of concern. Thus, note that the labels in Figure 12 are the items of dissatisfaction and improvement, and the numbers in Figure 12 are the number of stated responses to each item.

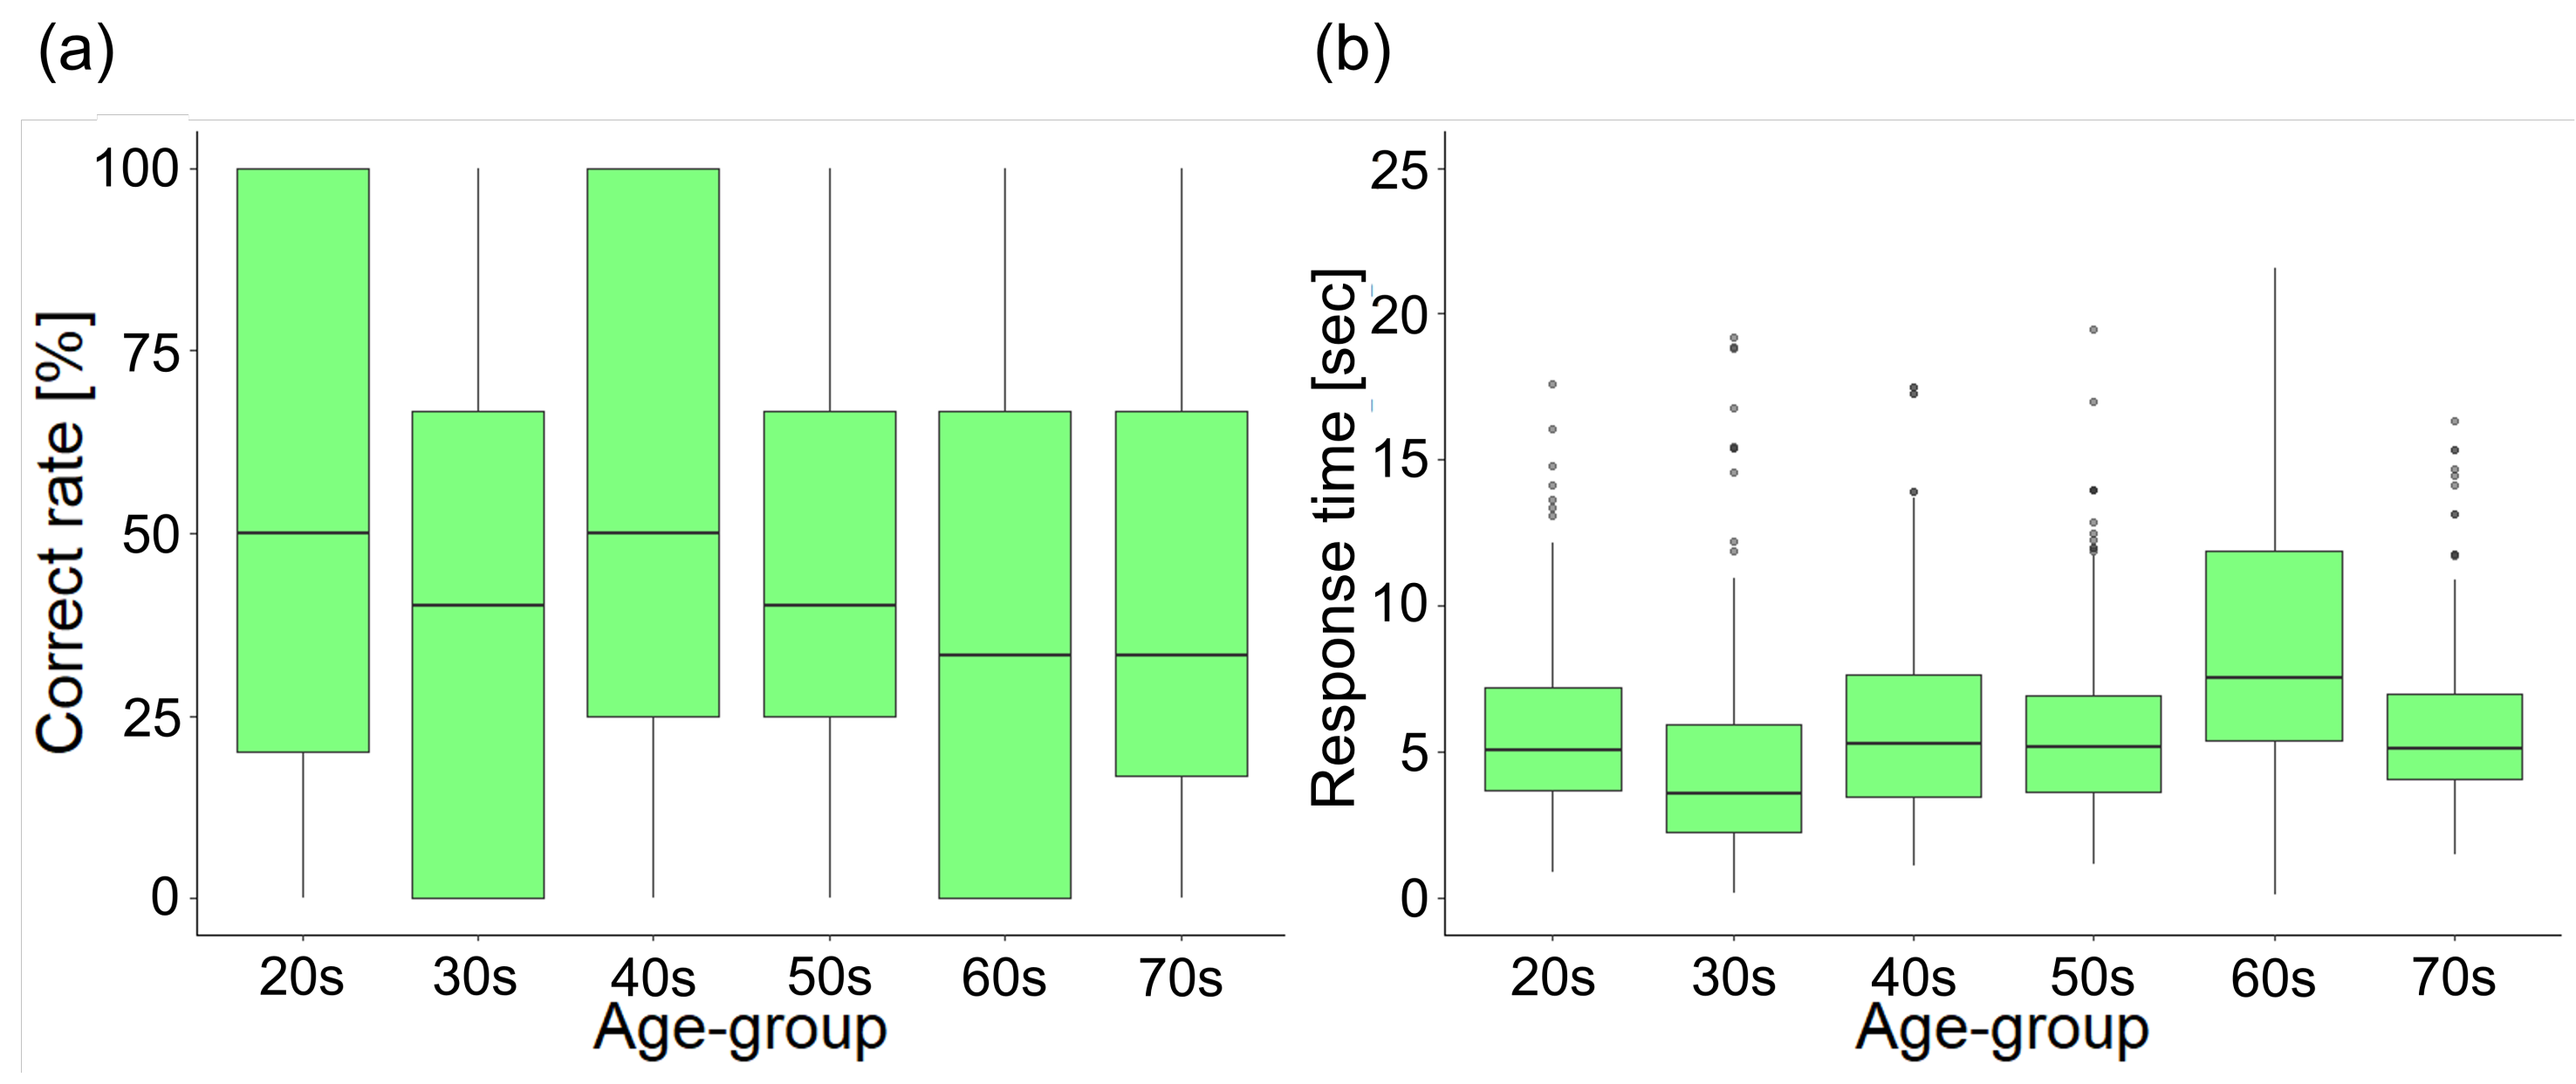
5.2. Personal Characteristics Regarding Question-Answering Tendencies in the “Tsunami Evacuation Training Application”

The ages of participants in this experiment varied, and there might have been some differences in the responses by gender. Therefore, we checked whether there were differences by the characteristics of participants, such as age group and gender, in the correct rate and response time. The box–whisker plot showing the relationship between age group and correct rate is presented in Figure 13a, and that between age group and response time in Figure 13b. In addition, the box–whisker plot showing the relationship between gender and correct rate is shown in Figure 14a, and that between gender and response time in Figure 14b.
For the correct rate, we conducted a three-factor repeated-measures ANOVA, which indicated significant effects of age ( F ( 5 , 1217 ) = 4.337 , p = 0.00046 ), device ( F ( 1 , 1217 ) = 0.181 , p = 0.670346 ), and the two-way interaction between age and device ( F ( 5 , 1217 ) = 2.969 , p = 0.11366 ), and between age and gender ( F ( 5 , 1217 ) = 6.648 , p = 0.272 × 10 4 ). No significant main effect was found for device (F(1,1217) = 0.181, p = 0.670346) or gender ( F ( 1 , 1217 ) = 1.351 , p = 0.245373 ). Next, for the response time, we conducted a three-factor repeated-measures ANOVA, and identified significant effects of age ( F ( 5 , 1217 ) = 30.911 , p < 2.0 × 10 16 ), gender ( F ( 1 , 1217 ) = 5.172 , p = 0.02313 ), and the two-way interactions between age and device ( F ( 5 , 1217 ) = 3.401 , p = 0.00468 ) and between age and gender ( F ( 5 , 1217 ) = 20.721 , p < 2.0 × 10 16 ). No significant effect was found for device ( F ( 1 , 1217 ) = 0.060 , p = 0.80686 ). According to the above results, there were significant differences by age; therefore, Tukey’s range method was used to verify that there was a difference between the participants on the basis of correct rate and response time. The results for correct rate and response time are shown in Table 3 and Table 4, respectively.

5.3. Validation of Question Characteristics by Answer Trends

The difficulty level of the questions in the tsunami evacuation training needed to be examined. First, the relationship between questions in the “Tsunami Evacuation Training Application” and the response time for each question was verified. A box-and-whisker diagram showing the relationship between the correct rate for each question and the question number is shown in Figure 15a, and a box-and-whisker diagram showing the relationship between the response time for each question and the question number is shown in Figure 15b. Here, “question number” refers to the ID of the problem in the “Tsunami Evacuation Training Application”. This ID is automatically assigned by the designer of the “Tsunami Evacuation Training Application” when creating the problem, and the “question number” is unrelated to the quality or difficulty of the problem. It is difficult to present all the “question numbers” and questions in this paper, so only the extremely important questions and question numbers are presented.
Figure 15a,b suggest that the shorter the response time, the higher the percentage of correct responses. The relationship between the average time to respond to each question and the average percentage of correct answers for each question is shown in Figure 16. The correlation coefficient between the two was 0.632 ; thus, the two were inversely related. Therefore, considering the variation in the difficulty level of the questions created by the application described in this paper, it can be concluded that difficult questions with a low percentage of correct answers tend to require a longer time for response, while easy questions with a high percentage of correct answers tend to be answered quickly and intuitively.
Next, as stated earlier, each participant was instructed to complete six days of training using the “Tsunami Evacuation Training Application” to improve their awareness of the tsunami evacuation. Familiarity with the “Tsunami Evacuation Training Application” and its questions might have improved response rates and response times. If so, this would suggest an educational effect due to familiarity. Therefore, we examined changes in the number of days the “Tsunami Evacuation Training Application” was used and in the correct rate and average response time required to answer the questions.
The relationship between the number of training days and correct rate for each question was verified. This relationship is illustrated in Figure 17a. Here, all the participants were instructed to train using the “Tsunami Evacuation Training Application” for six days starting from the day after the first simulator experiment to the day before the second simulator experiment; however, some participants might have misunderstood and trained for more than six days, that is, they could have trained with the “Tsunami Evacuation Training Application” for seven days from the day of the first simulator experiment to the day before the second simulator experiment. Therefore, the day when the application was first used, whether on the day of the simulator experiment or the next day, was considered the first day, and the analysis was conducted from that day to the sixth day. An ANOVA was performed on the number of days since the start of training and the correct rate, and no significant difference was found between the number of days and the correct rate ( F ( 5 , 141 ) = 0.271 , p = 0.357 ); therefore, we can conclude that there was no relationship between the number of training days and the correct rate.
Similarly, a box-and-whisker diagram showing the relationship between the training day and response time for each question is shown in Figure 17b. An ANOVA was performed on the number of days since the start of training and response time, and it was found that there was no significant difference between the number of days and response time ( F ( 5 , 141 ) = 1.112 , p = 0.928 ), indicating that there was no relationship between the number of training days and response time.
Next, a cluster analysis was conducted to extract the characteristics of the questions. First, the average answer rate and average response time for each question were analyzed. The NbClust function in the NbClust package was used for the cluster analysis. The NbClust package is an R package, and the NbClust function determines the number of clusters by majority vote after calculations using multiple selection methods, such as the gap statistic and the elbow method. The adequate category number for the question was determined to be three based on the result of NbClust, and the categorized data are shown in Figure 18. Here, the component 1 axis represents the answer rate and the component 2 axis the response time. Thus, the lower right region indicates questions that were easy to answer, whereas the upper left region indicates those difficult to answer.

6. Considerations

6.1. About Contents of “Tsunami Evacuation Training Application” and Its Usability

First, we discuss the usability of the “Tsunami Evacuation Training Application”. As shown in Figure 9, the operability and visibility were approximately average, and neither good nor bad. However, considering the range of the box–whisker plot, there was room for improvement of its visibility. To confirm whether the slightly lower ratings for visibility were due to the devices used by the participants, that is, the difference between a smartphone with a smaller screen size and a tablet with a larger screen size, we discuss Figure 10, which showed no significant difference between smartphones and tablets for all questions, suggesting that the low visibility may be due to the design of the “Tsunami Evacuation Training Application” rather than the differences in the devices. In contrast, for Q3, while there was no significant difference between smartphones and tablets, tablets tended to be scored higher than smartphones, suggesting that many participants found tablets easier to read than smartphones in terms of font size. As for Q1, the operability of the “Tsunami Evacuation Training Application” was the same. All participants tapped on what they thought was the correct answer, and the smaller the screen size, the harder it was to tap correctly. Therefore, tablets tended to be more operable than smartphones. This is supported by the results shown in Figure 12. Indeed, many participants commented that the screen was too small to tap correctly or find objects and/or buildings. This trend was more pronounced for smartphones than tablets. Besides the device issue, Figure 12 showed that the “Tsunami Evacuation Training Application” design was also problematic. For example, we received many comments that the diameter of the circle that determined the correct answer was small, which made it difficult to tap. This indicates that improvements must be made to the design of the interface.
Next, we considered whether the correct rate and response time were due to the device. Figure 11a indicated that the third quartile of correct rate on smartphones was larger than that on tablets, and Figure 11b for the response time showed that the tendency on smartphones was the same as that on tablets. Considering these, the quickness and accuracy of answering was not different when using a smartphone or a tablet, but the third quartile of the correct rate on smartphones suggested that smartphone users may have been influenced by familiarity or unfamiliarity with the small screen size.

6.2. Personal Characteristics in Question-Answering Tendencies in the “Tsunami Evacuation Training Application”

In this section, we discuss the usability of the “Tsunami Evacuation Training Application” in terms of individual characteristics and question-answering tendencies. First, we examined the relationship between participant age, percentage of correct responses, and response time. Figure 13 showed that participants in their 60s and 70s had lower percentages of correct responses than other age groups, especially in their 20s and 40s, and Table 3 statistically confirmed the tendency. As for the response time, those in their 60s spent more time responding than the other age groups. Considering the differences among the younger, middle-aged, and older age groups and the trends in the percentage of correct responses, it was expected that participants in their 70s would show the same trend as those in their 60s. However, in fact, the trends differed because there were fewer respondents in these age groups. As for significant differences, Table 4 showed that the response times of those in their 30s were statistically faster than other age groups, and those in their 60s were statistically longer. These considerations suggest that the “Tsunami Evacuation Training Application” is somewhat difficult to handle for older age groups, and in light of the analysis in Section 6.1, the content and interface need to be improved to accommodate older age groups, especially those in their 60s and 70s.

6.3. Question Characteristics Based on Answer Trends

Question characteristics were verified based on the answer trends, correct rates, and response times. Figure 15 shows that both the correct rate and time to answer varied widely from question to question. Figure 15a,b suggested that for questions with a high percentage of correct answers, the response time tended to be low. This trend was shown in Figure 16. Figure 16 showed that the higher the percentage of correct answers, the shorter the response time; in other words, participants spent more time answering difficult questions, and vice versa. In Figure 16, there was a correlation between the correct rate and response time, and the correlation coefficient was r = −0.632; therefore, a negative correlation was observed. The percentage of correct answers was high for intuitive questions that could be answered relatively quickly, while the percentage of correct answers was low for questions that required more time to answer. Therefore, a possible guideline for training using the “Tsunami Evacuation Training Application” is to have trainees repeatedly practice problems that require a long time to solve so that they become accustomed to solving them in a short period of time. On the other hand, this negative correlation between correct response rate and response time may be due to the extremely different difficulty levels of the application questions, ranging from very easy to very difficult. Very difficult questions took longer to answer and had lower percentages of correct responses, while very easy questions took less time to answer and had higher percentages of correct responses. Therefore, we believe that adjusting the difficulty level of the questions is an issue for the future.
Second, we considered the relationship between the number of training days, correct rate, and response time, based on Figure 17. As explained earlier, there was no significant difference between the number of training days and percentage of correct responses or solution times. It was suggested that the percentage of correct answers tended to increase with the number of training days. However, it was also suggested that variability in the percentage of correct answers also seemed to increase. Overall, the “Tsunami Evacuation Training Application” questions created in this study showed that some people showed positive effects when trained, while others did not show any effect. This finding suggests that individual differences may be significant.
Finally, the diversity of questions in the “Tsunami Evacuation Training Application” is discussed. The results of the cluster analysis in Figure 18 suggested differences in difficulty among the questions and indicated which of the questions should be used for intensive training to improve participants’ awareness of tsunami evacuation. In Figure 18, the blue, pink, and orange hatched oval regions represent easy, difficult, and intermediate difficulty questions, respectively. The typical questions included in each area of Figure 18 were overlaid on the clusters in Figure 18, and this is shown in Figure 19, which suggests that participants could easily answer questions about dangers that were lurking right in front of them; however, they could not answer questions about dangers further away from them. In addition, when there were multiple things to pay attention to in the same situation, the percentage of correct answers was lower, probably because the participants were at a loss to make a decision. These results suggest that training to pay attention to distant events and to improve the ability to grasp multiple events is important to enhance tsunami evacuation awareness.

7. Limitations of This Work

We developed the “Tsunami Evacuation Training Application” for continuous tsunami evacuation training. In this study, the training period using the “Tsunami Evacuation Training Application” was set to 6 days, but the validity of this period was not verified. The purpose of the “Tsunami Evacuation Training Application” is to help people become more attentive during evacuations by using the knowledge of actual tsunami evacuees. The results for the question “What do you think you should notice considering an evacuation from a tsunami?”, before and after training with the “Tsunami Evacuation Training Application” are shown in Figure 20. Note that the numbers in Figure 20 are those of stated responses to each item. From Figure 20, there is a tendency for participants to notice persons, vehicles, and buildings during an evacuation like actual tsunami evacuees. However, given that there were 25 people who participated in the experiment, less than half of the respondents indicated that this was the case. This may be attributed in part to an inadequate problem setup. In fact, Figure 12 shows that many people commented that the question was not fully understandable. Therefore, it is necessary to devise a more understandable and effective way of setting up questions for instruction.
The experimental situation is another limitation of this study. As you know, tsunami disasters cannot be replicated in the real world, therefore we used the tsunami evacuation training simulator. However, the simulator is only a virtual experience, and there is a discrepancy with the real situation. Therefore, it is necessary to improve the simulator and devise how to reproduce realistic crisis situations.

8. Conclusions

This paper introduced a new framework of tsunami evacuation training embodied in the development of a “Tsunami Evacuation Training Application” to raise awareness about tsunami evacuation. In an experiment using a tsunami evacuation training simulator, we evaluated the training effects of the “Tsunami Evacuation Training Application” through a questionnaire survey. The results suggested that six days of training using the “Tsunami Evacuation Training Application” enabled the subjects to quickly grasp the attention targets that were present near them; however, they had difficulty grasping attention targets that were further away. This suggests that participants need to be trained repeatedly on distant objects of attention to be able to locate them instantaneously. The “Tsunami Evacuation Training Application” was designed to work on smartphones and tablets; however, the results suggest that there were problems with the visibility and interface. However, the results also suggest that the application is almost in line with our expectation of changing the visual behavior of people who have not experienced tsunami evacuation.
The “Tsunami Evacuation Training Application” will be improved based on the issues discussed in this paper. We will also verify whether the application, when used continuously, improves knowledge about tsunami disasters and establishes crisis awareness, thereby proving the validity of our tsunami evacuation training framework.

Author Contributions

T.A. conceived and designed the experiments; T.A., T.I., S.U., S.Y. and T.S. investigated relevant studies and methodologies related to this study; T.A., F.O., K.K., S.Y. and T.S. performed the experiments; T.A. analyzed the data; T.A., S.Y. and T.S. designed the “Tsunami Evacuation Training Application”; and T.A. wrote the paper. All authors have read and agreed to the published version of the manuscript.

Funding

This work was supported by JSPS KAKENHI (grant number 19H01723).

Data Availability Statement

The dataset generated during the current study is not publicly available but is available from the corresponding author upon reasonable request.

Acknowledgments

The authors would like to thank Jun Tajima and Keita Oda of Misaki Design LLC for developing the tsunami evacuation training simulator and the base of the “Tsunami Evacuation Training Application”, and Kazumi Sugiura for designing the logo for the “Tsunami Evacuation Training Application” and for her assistance with the experiments in this paper. The authors would like to thank Yuko Kawai of the Nishio City Crisis Management Division and the Japan Car Sharing Association for their great help in recruiting participants for this experiment; the citizens of Ishinomaki, Miyagi Prefecture, and Nishio, Aichi Prefecture, for their cooperation in the experiment; and the Japan Car Sharing Association, the Nishio City Crisis Management Division, the Nishio Police Station, and Ishinomaki City Office for their cooperation during the interviews.

Conflicts of Interest

The authors declare no conflicts of interest.

References

  1. Miura, N.; Yasuhara, K.; Kawagoe, S.; Yokoi, H.; Kazama, S. Damage from the Great East Japan Earthquake and Tsunami—A quick report. Mitig. Adapt. Strateg. Glob Chang. 2011, 16, 803–818. [Google Scholar] [CrossRef]
  2. Fujita, M.; Hamaguchi, N.; Kameyama, Y. Process of Recovery from the Great East Japan Earthquake which Pictures and Data. In Spatial Economics for Building Back Better; Springer: Singapore, 2021; pp. 75–98. [Google Scholar]
  3. Takabatake, T.; Fujisawa, K.; Esteban, M.; Shibayama, T. Simulated effectiveness of a car evacuation from a tsunami. Int. J. Disaster Risk Reduct. 2020, 47, 101532. [Google Scholar] [CrossRef]
  4. Murakami, H.; Takimoto, K.; Pomonis, A. Tsunami evacuation process and human loss distribution in the 2011 Great East Japan earthquake—A case study of Natori city, Miyagi prefecture. In Proceedings of the 15th World Conference on Earthquake Engineering, Lisbon, Portugal, 24–28 September 2012. [Google Scholar]
  5. Cabinet Office, Government of Japan. Measures to Ensure Safe and Secure Evacuation by Car. Available online: https://www.bousai.go.jp/jishin/tsunami/hinan/5/pdf/3.pdf (accessed on 14 December 2023). (In Japanese)
  6. Hara, Y.; Kuwahara, M. Traffic Monitoring immediately after a major natural disaster revealed by probe data—A case in Ishinomaki after the Great East Japan earthquake. Transp. Res. Part A Policy Pract. 2015, 75, 1–15. [Google Scholar] [CrossRef]
  7. Sasaki, M.; Ujihara, T.; Abe, H.; Suzuki, R. Intention of car use, its motive and reduction potential by various policies based on the assumption of evacuation from tsunami disaster generated by Nankai Trough earthquake. J. City Plan Inst. Jpn. 2014, 49, 861–866. (In Japanese) [Google Scholar] [CrossRef]
  8. Takei, H.; Okumura, M. Risk of being caught by tsunami and traffic accident risk in vehicle-pedestrian mixed evacuation. Jste J. Traffic Eng. 2018, 4, A129–A137. (In Japanese) [Google Scholar] [CrossRef]
  9. Wang, Y.; Tsushima, H.; Satake, J.; Navarrete, P. Review on Recent Progress in Near-Field Tsunami Forecasting Using Offshore Tsunami Measurements: Source Inversion and Data Assimilation. Pure. Appl. Geophys. 2021, 178, 5109–5128. [Google Scholar] [CrossRef]
  10. Yamori, K.; Sugiyama, T. Development and social implementation of smartphone app Nige-Tore for improving tsunami evacuation drills: Synergistic effects between commitment and contingency. Int. J. Dis. Risk Sci. 2020, 11, 751–761. [Google Scholar] [CrossRef]
  11. Han, D.C.; Takabatake, T.; Esteban, M.; Shibayama, T. Development of smartphone application to support tsunami evacuation. Coast Eng. Proc. 2020, 37, 38. [Google Scholar] [CrossRef]
  12. Mitsuhara, H.; Sumikawa, T.; Miyashita, J.; Iwaka, K.; Kozuki, Y. Game-based evacuation drill using real world edutainment. Interact. Technol. Smart Educ. 2013, 10, 194–210. [Google Scholar] [CrossRef]
  13. Kawai, J.; Mitsuhara, H.; Shishibori, M. Tsunami evacuation drill system using smart glasses. Procedia Comput. 2015, 72, 329–336. [Google Scholar] [CrossRef]
  14. Hawthorn, S.; Jesus, R.; Baptista, M.A. A review of digital serious games for tsunami risk communication. Int. J. Serious Games 2021, 8, 21–47. [Google Scholar] [CrossRef]
  15. Maruyama, Y.; Sakaki, S. Development of driving simulator for the experiment of tsunami evacuation using automobile. In Proceedings of the 7th International Conference on Asian and Pacific Coasts 2013, Bali, Indonesia, 24–26 September 2013; pp. 454–459. [Google Scholar]
  16. Ito, K.; Taguchi, H.; Fujinami, K. Posing questions during experimental operations for safety training in university chemistry experiments. Int. J. Multimed. Ubiquitous Eng. 2014, 9, 51–62. [Google Scholar] [CrossRef]
  17. Na, C.; Yi, M. Specific statistics and control method study on unsafe behavior in Chinese coal mines. Procedia Eng. 2011, 26, 2222–2229. [Google Scholar] [CrossRef]
  18. Chen, Q.; Jin, R. Safety4Site commitment to enhance jobsite safety management and performance. J. Constr. Eng. Manag. 2012, 138, 509–519. [Google Scholar] [CrossRef]
  19. JICOSH. Concept of Zero-Accident Total Participation Campaign. Available online: https://www.jisha.or.jp/international/jicosh/english/zero-sai/eng/index.html (accessed on 4 December 2023).
  20. Noor, A.Y.; Irniza, R.; Emilia, Z.A.; Anita, A.R.; Suriani, I. Kiken Yochi Training (KYT) in reducing accidents at workplaces: A systematic review. Int. J. Public Health 2016, 3, 123–132. [Google Scholar]
  21. Hashida, M.; Kamezaki, R.; Goto, M.; Shirahashi, J. Quantification of hazard prediction ability at hazard prediction training (Kiken-Yochi Training: KYT) by free-response receiver-operating characteristic (FROC) analysis. Radiol. Phys. Technol. 2017, 10, 106–112. [Google Scholar] [CrossRef] [PubMed]
  22. Ikeda, N.; Kagechika, K.; Maeno, T. The effect of nurses’ training on sensitivity of fall risk prediction (KYT: Kiken Yochi Training). Ann. Physic. Rehabil. Med. 2018, 61, e530. [Google Scholar] [CrossRef]
  23. Hidaka, A.; Miyake, A. Selection of suitable safety activities and experience of safety condition establishment. Open J. Saf. Sci. Technol. 2015, 5, 1. [Google Scholar] [CrossRef]
  24. Ministry of Education, Culture, Sports, Science and Technology Homepage. Available online: https://anzenkyouiku.mext.go.jp/todoufuken/data/35yamaguchi/35-03/35-03-1.pdf (accessed on 4 December 2023).
  25. Arakawa, T.; Yamabe, S.; Obayashi, F.; Suzuki, T.; Kobayashi, K.; Itamiya, T.; Uno, S.; Tajima, J. Simulation-based tsunami evacuation drill method: development and validation of tsunami evacuation simulator system. J. Disaster Inf. Stud. 2022, 20, 251–262. [Google Scholar] [CrossRef]
  26. Kapp, K.M. The Gamification of Learning and Instruction: Game-Based Methods and Strategies for Training and Education; John Wiley & Sons: Hoboken, NY, USA, 2012. [Google Scholar]
  27. Kiryakova, G.; Angelova, N.; Yordanova, L. Gamification in education. In Proceedings of the 9th International Balkan Education and Science Conference, Edim, Turkey, 16–18 October 2014. [Google Scholar]
  28. Meiji, A.; Suganuma, A. Estimation of hand posture with straight line detection for a hand pose rally system. In Proceedings of the 8th IIAE International Conference on Intelligent Systems and Image Processing 2021, Kobe, Japan, 6–10 September 2021; pp. 194–200. [Google Scholar]
  29. Misaki Design LLC Homepage. Available online: http://misaki-design.co.jp/ (accessed on 4 December 2023).
  30. Nishio City. Earthquake and Tsunami Countermeasures Initiatives. Available online: https://www.cbr.mlit.go.jp/kensei/machi_seibika/pdf/20130816_shizuoka04_nishio.pdf (accessed on 9 April 2024). (In Japanese)
  31. Nishio City. Let’s Protect and Support our Beloved Hometown. Available online: https://www.pref.aichi.jp/uploaded/attachment/405255.pdf (accessed on 9 April 2024). (In Japanese)
  32. Aichi Prefecture. Aichi Prefecture Municipal Tsunami Evacuation Planning Guidelines. Available online: https://www.pref.aichi.jp/bousai/thunamihinankeikakusakuteisishin.pdf (accessed on 4 December 2023). (In Japanese).
  33. Google. Google Map. Available online: http://google.com/maps (accessed on 4 December 2023).
Figure 1. Operation flow of the “Tsunami Evacuation Training Application”: (a) menu screen, (b) user registration screen, (c) user attribute screen, (d) tutorial image selection screen, (e) tutorial image screen, (f) training image selection screen, (g) training screen, (h) training screen with an overhead view, (i) result screen, (j) stamp screen.
Geosciences 14 00110 g001
Figure 2. An example evacuation situation where the evacuation is by car and a hospital is visible, which is designated as an emergency evacuation building in Nishio City.
Geosciences 14 00110 g002
Figure 3. The result and stamp-rally screen. (a) The result screen. The upper area shows the correct number, achievement rate of the questionnaire, overall correct rate, and average correct rate of each movie. The lower area shows the time-series graph of the average correct rate. (b) The stamp rally screen. The red cherry blossom stamp marks the completion of all the training in one video, and the gold cherry blossom stamp marks the completion of all the training in the eight videos.
Geosciences 14 00110 g003
Figure 4. Operating scene of tsunami evacuation training simulator for (a) an evacuation by car, (b) an evacuation on foot.
Geosciences 14 00110 g004
Figure 5. Screen of the tsunami evacuation training simulator for (a) an evacuation by car and (b) an evacuation on foot.
Geosciences 14 00110 g005
Figure 6. The reproduced roads of Nishio City in the tsunami training simulator. (Map data ®2023 Google) [33].
Geosciences 14 00110 g006
Figure 7. The routes used for the experiment in Nishio City. The map is centered on Aichi Prefectural Issiki High School. In each route, Ⓢ indicates the starting point and Ⓖ the destination. (a) Route 1, (b) Route 2. (Google Map data ®2023 ) [33].
Geosciences 14 00110 g007
Figure 8. Experimental scene in Nishio city. (a) Setting of the tsunami evacuation training simulator, (b) experimental scene of an evacuation by vehicle, (c) experimental scene of an evacuation on foot.
Geosciences 14 00110 g008
Figure 9. The box–whisker plot for the results of Q1 to Q5.
Geosciences 14 00110 g009
Figure 10. The box–whisker plot comparing the differences in the devices (smartphone and tablet) for Q1, Q2, and Q3.
Geosciences 14 00110 g010
Figure 11. Differences between smartphone and tablet. (a) Relation between type of device and correct rate, (b) relation between type of device and response time.
Geosciences 14 00110 g011
Figure 12. The results of what the participants noticed when using the “Tsunami Evacuation Training Application”.
Geosciences 14 00110 g012
Figure 13. Difference between age groups: (a) the relation between age group and correct rate, (b) the relation between age group and response time.
Geosciences 14 00110 g013
Figure 14. Difference between genders: (a) the relation between gender and correct rate, (b) the relation between gender and response time.
Geosciences 14 00110 g014
Figure 15. Relationship between response time, correct rate, and question number (explained later): (a) relation between correct rate and question number, (b) relation between response time and question number.
Geosciences 14 00110 g015
Figure 16. Correlation between average correct rate and average response time. There is a weak negative correlation ( r = 0.632 ).
Geosciences 14 00110 g016
Figure 17. Box-and-whisker diagram of the relationship between training dates and correct rate and response time: (a) relation between training dates and correct rate, (b) relation between training dates and response time.
Geosciences 14 00110 g017
Figure 18. The result of the cluster analysis for average answer rate and average response time of all participants. Component 1 is the answer rate and component 2 is the response time.
Geosciences 14 00110 g018
Figure 19. The characteristic questions were overlaid on the clusters obtained in Figure 18: (a) questions to make him/her aware of evacuated bicycles coming from behind him/her, (b) questions to notice pedestrians ahead crossing between cars, (c) questions to remind about distant hospitals, (d) questions to pay attention to a vehicle ignoring a stop sign and entering the area, (e) questions to note the flow of people in the distance and toward the evacuation route, and (f) questions to enhance awareness of landmark signs and traffic signals ahead.
Geosciences 14 00110 g019
Figure 20. The results of the question “What do you think you should notice considering an evacuation from a tsunami?” before and after using the KYT application.
Geosciences 14 00110 g020
Table 1. PC specifications of the tsunami evacuation training simulator.
CPUIntel CoreTM i9-9900K
GPUNVIDIA®GeForce RTXTM 2080 SUPER
Memory16 GB DDR4 SDRAM (PC4-21300, 8 GB × 2)
Table 2. Age, gender, and evacuation route of each participant. M = male, F = female.
ParticipantsAgeGenderRouteParticipantsAgeGenderRoute
A53F1N34M2
B54M1O30M2
C53F1P45M2
D64F2Q55M2
E23M2R35M1
F30M1S30M1
G66M2T29F2
H42F2U72M2
I71M1V69F2
J21F1W46M1
K67M2X50M1
L52M1Y35F1
M71M2
Table 3. The result of Tukey’s range method for the correct rate by age of the participants. The numbers in the cells indicate the p-values obtained by the Tukey’s range method for the ages in the rows and columns of the table. Cells that are significant at the 5% level are shown in bold.
 20s30s40s50s60s70s
20s1.69 × 10−11.008.30 × 10−19.48 × 10−36.35 × 10−2
30s1.69 × 10−11.20 × 10−17.64 × 10−17.54 × 10−19.95 × 10−1
40s1.001.20 × 10−16.89 × 10−17.00 × 10−34.54 × 10⁻²
50s8.30 × 10−17.64 × 10−16.89 × 10−11.09 × 10−14.55 × 10−1
60s9.48 × 10−37.54 × 10−17.00 × 10−31.09 × 10−19.58 × 10−1
70s6.35 × 10−29.95 × 10−14.54 × 10−24.55 × 10−19.58 × 10−1
Table 4. The result of Tukey’s range method for average response time by participant age. The numbers in the cells indicate the p-values obtained by the Tukey’s range method for the ages in the rows and columns of the table. Cells that are significant at the 5% level are shown in bold.
 20s30s40s50s60s70s
20s2.22 × 10−39.64 × 10−11.000.009.82 × 10−1
30s2.22 × 10−32.34 × 10−44.21 × 10−40.001.05 × 10−4
40s9.64 × 10−12.34 × 10−49.53 × 10−10.001.00
50s1.004.21 × 10−49.53 × 10−10.009.76 × 10−1
60s0.000.000.000.000.00
70s9.82 × 10−11.05 × 10−41.009.76 × 10−10.00
Disclaimer/Publisher’s Note: The statements, opinions and data contained in all publications are solely those of the individual author(s) and contributor(s) and not of MDPI and/or the editor(s). MDPI and/or the editor(s) disclaim responsibility for any injury to people or property resulting from any ideas, methods, instructions or products referred to in the content.

