

Geotechnical Characterisation of Flysch-Derived Colluvial Soils from a Pre-Alpine Slope Affected by Recurrent Landslides

Polytechnic Department of Engineering and Architecture, University of Udine, 33100 Udine, Italy
*
Author to whom correspondence should be addressed.
Geosciences 2024, 14(5), 115; https://doi.org/10.3390/geosciences14050115
Submission received: 21 March 2024
/
Revised: 10 April 2024
/
Accepted: 19 April 2024
/
Published: 24 April 2024
Abstract
:Heterogeneous rock masses that include rhythmic alternations of marl, shale, marly limestone, sandstone, siltstone, and argillite, such as Flysch, are particularly prone to generating colluvial deposits on gentle slopes, which are often subject to failures triggered by heavy rainfall. Flysch-derived colluvial soils are made up of highly heterogeneous sediments ranging from clayey loam to rock fragments, and they have been studied more rarely than homogeneous soils. In this work, we present a geotechnical and hydraulic characterisation performed both in situ and in the laboratory on flysch-derived colluvial soils that were involved in a channelised landslide in the pre-alpine area of the Friuli Venezia Giulia region (NE Italy). The investigated soils were characterised by the average values of the grain size composition of about 25% gravel, 20% sand, 30% silt, and 25% clay. The loamy matrix presented low-to-medium values of the liquid and plastic limits, as well as of the plasticity index (LL = 40%, PL = 23%, and PI = 17%, respectively). The values of the peak friction angle for natural intact samples were 33° < ϕ’p < 38°, whereas the residual friction angle fell to 23–24° at great depths and high vertical stresses, for a prevailing silty–clayey matrix. Variable head permeability tests were performed both in situ and in the laboratory, showing that the values of the vertical and horizontal permeability were very close and in the range 1 × 10⁻⁴–1 × 10⁻⁶ m/s. The soil permeability measured in the field was generally higher than the hydraulic conductivity calculated on laboratory samples. The proposed geotechnical and hydrological characterisation of flysch-derived colluvial soils can be of fundamental importance before the use of more thorough analyses/models aimed at forecasting the possible occurrence of slope failures and evaluating the related landslide hazard. The reported geotechnical and hydraulic parameters of flysch-derived colluvial materials can represent a useful reference for rainfall infiltration modelling and slope stability analyses of colluvial covers that are subject to intense and/or prolonged precipitation. However, when facing engineering problems involving colluvial soils, particularly those coming from flysch rock masses, the intrinsic variability in their grain size composition, consistency, and plasticity characteristics is a key feature and attention should be paid to the proper assumption of the corresponding geotechnical and hydraulic parameters.
1. Introduction
Several slopes belonging to hilly and mountainous environments all over the world are characterised by the widespread occurrence of flysch-like rock masses and related flysch-derived soils [1,2,3,4,5,6,7,8,9]. Heterogeneous rock masses that include rhythmic alternations of marl, shale, marly limestone, sandstone, siltstone, and argillite, such as Flysch, are particularly prone to generating loose soil deposits due to weathering processes [10,11]. In fact, the physical and chemical weathering of terrigenous rocks results in structural and mineralogical changes, particularly due to the large presence of clayey minerals within the rock matrix, causing the progressive disintegration and comminution of the rock and the consequent generation of residual and/or colluvial soils [12,13,14,15,16]. Consequently, flysch-derived colluvial deposits are commonly thicker than the covers of colluvial materials deriving from other parent rock masses of various origins, such as igneous and metamorphic rocks, as well as carbonate sedimentary rocks.
Colluvial soils are typically related to the limited transport of material and have been deposited along hillslopes by rainwash, sheet erosion, fluvio-glacial sedimentation, shallow landslides, slow continuous creep, or a variable combination of these processes [17,18,19,20,21,22]. Colluvial deposits have different structures (in particular, the number of layers and interstratifications), thicknesses, and lithostratigraphic complexity, depending on the specific geomorphological process that formed them [19,23,24,25]. When closely related to the weathering and disruption of the underlying bedrock, colluvial covers are characterised by a single layer of up to 1 m thick made up of a rather homogeneous soil, sometimes overlaid by a 10–20 cm thick organic topsoil [25]. Differently, the fluvial fill-and-cut sedimentary processes that occurred after the deglaciation of alpine valleys created extensive and superimposed orders of terraced belts that are characterised by a 1–3 m thick layered cover with a typical three-layer stratigraphy [26]. In the mountain environment, active slopes subject to recurrent shallow instability processes can form channelised deposits where distinct landslide masses accumulate within pre-existing creeks or gullies. These channelised landslide deposits of colluvial materials can have a limited lateral extension, but their thickness can increase considerably depending on the number and volume of landslide events, even reaching 5–10 m [25]. Channelised colluvial deposits are irregularly stratified and include a number of layers that are associated with the distinct and superimposed landslide masses that filled buried creeks or landslide gullies.
Notably, complex sedimentary processes and stratigraphical features, which are strictly related to the geomorphological evolution of the slope, always determine changes, even abrupt, in the geotechnical and hydrological properties of the different soil layers forming the colluvial deposit. As a result, local variations in the grain size, permeability, and moisture conditions of the soil strongly affect the strength properties of the layered cover and, in turn, the stability of the slope [26]. This means that knowledge of the geomorphological processes that formed the specific colluvial deposit is mandatory to plan any geotechnical investigation on the materials that form the deposit effectively [27].
Colluvial soils coming from flysch-like rock masses are commonly made up of highly heterogeneous unconsolidated sediments ranging from clayey loam to rock fragments [28,29]. In fact, the combined processes of chemical alteration and physical disruption of the parent bedrock generally lead to the production of a loamy matrix with a widespread presence of lapideous fragments of variable size [30]. Commonly, the coarser fraction (gravel and sand) is quite close to the finer fraction (silt and clay), and a reference particle size composition may be as follows: 25–30% gravel, 20–25% sand, 25–35% silt, and 20–25% clay [25] and this study. However, these proportions can vary to a degree depending on certain factors, including the lithology of the parent material and the specific geomorphological context. A higher clay content in the colluvium mixture can be related to either the occurrence of shales and marly interbeds in the parent bedrock or pedogenetic processes of the upper layers (illuvial clay). Conversely, a larger amount of the coarse fraction may be the result of the fragmentation and shearing processes of the rock mass during previous landslide events. It must also be noted that heterogeneous soils with a relevant coarse fraction, such as colluvial materials, objectively make it difficult to obtain undisturbed samples and set both field and laboratory testing.
Flysch-derived colluvial slopes are often involved in shallow landslides, even multiple ones, when they are hit by very intense rainfall, possibly resulting in damage to infrastructures and properties, environmental and economic losses, and, in some devastating cases, in the loss of human lives [26]. These rainfall-induced slope failures are commonly referred to as soil slips [31,32,33] and/or slide-debris (earth) flows [34,35,36], and are driven by the infiltration process through the unsaturated–saturated colluvial soil [37,38]. In particular, the failure mechanism is related to either: (i) a decrease in soil suction in the unsaturated zone due to the progressive saturation of the soil; or (ii) an increase in pore-water pressure in the saturated zone accompanied by the formation of a perched water table. Both mechanisms cause a reduction in the effective stresses and, in turn, in the shear strength of the soil, possibly leading to slope failure. In the literature, it has been largely demonstrated that the infiltration process through the soil and the related slope stability are strongly influenced by the rainfall characteristics (in particular, the duration and intensity), as well as by the geotechnical and hydrogeological properties of the soil [39,40,41]. Nevertheless, it is widely acknowledged that the values of the geotechnical and hydrological parameters of soils have a marked spatial variability, and appropriate tests for the determination of these parameters are fundamental to correctly assess the landslide hazard [42].
Owing to the widespread occurrence of shallow landslides involving flysch slopes in mountainous regions, especially due to the changing climate characterised by an intensification of extreme hydrological events [43], the geotechnical and hydrological characterisation of flysch-derived colluvial soils is essential to properly understand the underlying mechanisms driving slope instability. Indeed, a proper rainfall infiltration analysis requires knowledge of the saturated and unsaturated soil properties of all the materials involved in the seepage process [44]. In addition, the geotechnical characteristics of the soil are of paramount importance for any kind of slope stability analysis, landslide susceptibility mapping, and/or the establishment of rainfall intensity–duration thresholds [5,45,46,47,48]. In the literature, a great deal of effort has been devoted to the investigation of the geotechnical and hydrological properties of rather homogeneous soils, both for fine-grained soils [49] and coarse-grained soils [50,51,52,53]. Conversely, flysch-derived soils have been more rarely studied, possibly because of the difficulties in their sampling procedures and laboratory testing due to the presence of a relevant coarse fraction [4,6,30,54,55,56]. However, the particular lithological and structural heterogeneity of flysch-derived colluvial materials deserves an in-depth investigation to comprehensively understand the related slope stability problems, especially in wet conditions.
To achieve this aim, this paper presents the results of a geotechnical investigation, which was performed both in the field and on laboratory samples, on flysch-derived colluvial soils that were involved in a channelised landslide in the pre-alpine area of the Friuli Venezia Giulia region (NE Italy, Figure 1).
2. Geology and Geomorphological Processes of the Study Area
The study area is in northeast Italy, in the village of Sedilis (municipality of Tarcento) (Figure 1). Sedilis is located in the pre-alpine area of the Friuli Venezia Giulia (FVG) region, which is in the southeastern Alps. In the pre-alpine area of FVG, surface deposits made up of colluvial soils are widespread due to the occurrence of rock masses formed by alternating arenaceous–pelitic sequences belonging to the Flysch of Friuli Formation, which is upper Campanian–Lutetian in age and includes a number of geological units with facies of flysch [57,58]. Flysch-formed reliefs tend to form complex geomorphological systems that are characterised by numerous creeks and deep gullies where landslide deposits accumulate due to the repeated instability of the upper slopes. In some cases, the slope instability processes are favoured by abrupt tectonic contacts with overlying limestone formations related to the presence of typical overthrust structures. This particular geological setting has caused significant damage to the limestone rock masses, which are often affected by intense karstic phenomena including an underground deep-water karstic circulation. Colluvial deposits accumulate within the gullies as a consequence of previous landslide processes and lead to typical channelised landslide deposits that can reach a considerable thickness (5–10 m). Repeated shallow slope failures, also including slide-debris flows, can lead to the superimposition of a debris cover on top of an underlying colluvial deposit caused by an older landslide event. However, the overall thickness of the colluvial deposit is highly variable, depending on the magnitude of the various slope failure processes and the irregular morphology of the gully incised in the bedrock. Another important factor controlling the instability processes of these flysch slopes covered by thick colluvium is hydrogeology. In fact, deep-water circulation occurs within buried gullies and is strongly conditioned by the marked permeability threshold between the colluvial cover and the sandstone–marl sequences forming the bedrock.
In the study area, the outcropping geological formations are, from the youngest to the oldest [59] (Figure 2a):
- “Marne e arenarie di Savorgnano (SVO)” Formation: alternations of graded, fine-to-medium-grained marls and carbonate–siliciclastic sandstones, greyish–blueish marls and clayey marls;
- “Flysch del Grivò (GRIa)” Formation: interbedded shales and sandstones with calcirudites and calcarenites, sometimes in thick carbonate beds;
- “Calcari del Monte Cavallo (CMC)” Formation: whitish bioclastic limestones, massive, with abundant rudists, sometimes with interbedded micritic limestone;
- “Calcari del Cellina (CEL)” Formation: stratified whitish, greyish, and brownish limestones, with karst features, sometimes with the presence of breccias, residual clays, and stromatolites.
The most relevant geological discontinuity affecting the study area is a south-vergent overthrust that caused the overall thrusting of the older and more rigid sequences formed by CMC and CEL over the more ductile sequence formed by the flysch units of GRIa and SVO [60] (Figure 2b). This thrust is accompanied by an overall anticline fold with a low-angle axial plane and by some subsidiary structures within the more ductile thrusted-and-folded sequences, which also caused the overturning of the bedding planes belonging to GRIa and SVO. Flysch-formed reliefs in the surroundings of Sedilis, which pertain to SVO and GRIa formations, are characterised by a complex geomorphological system related to a closely spaced alternation of ridges and incised gullies, which results in the occurrence of multifaceted slopes. Soil slopes made up of colluvial materials have variable inclinations, ranging between sub-horizontal terraces and 35–40°-tilted slopes.
In addition, several slopes in the Sedilis area were involved in extensive reprofiling for vineyard cultivation related to wine production. These earthwork operations have modified the geometry and soil structure of the colluvial slopes and have been responsible for both the phenomena of degradation and chemical–physical alterations in the colluvial deposits, which were involved in shallow instability processes.
Figure 2.
Geological map (a) and section (b) of the study area showing the location of the channelised landslide of Sedilis (modified from [61]).
Figure 2.
Geological map (a) and section (b) of the study area showing the location of the channelised landslide of Sedilis (modified from [61]).

When considering the climate of the study area, the pre-alpine sector of FVG is subject to the influx of winds that are rich in humidity due to the proximity of the Adriatic Sea and is consequently characterised by a wet and rainy climate. The average yearly rainfall for the pre-alpine areas of FVG, calculated in the period 1991–2020, ranges from about 1800 mm to more than 3000 mm (Figure 1). These areas are frequently hit by rainstorms characterised by a high intensity (40 ≤ I ≤ 100 mm/h) and limited duration (D = 1–6 h at most), which mainly occur during the wet season (September–November) or during the spring (May–June). In the Sedilis area, some extreme hydrological events have been responsible for the activation of dozens of shallow slope failures over time. In many cases, these shallow landslides were characterised by an initial sliding of a colluvium mass and a subsequent fluidisation of the material, and, owing to this mechanism, they can be classified as slide-earth flows. Repeated shallow landslides of colluvial material have progressively buried several gullies throughout this flysch range. The flysch-derived colluvial soils that will be investigated in the present study are related to a thick channelised landslide deposit that is the result of multiple slide-earth flows, the most important of which occurred in 1998, with a partial reactivation in 2014 (Figure 3a).
3. Methodology
In order to achieve a more profound knowledge of the geotechnical and hydraulic characteristics of flysch-derived colluvial soils (grain size distribution, and plasticity, activity, index and shear strength properties, as well as moisture condition, matric suction, Soil–Water Characteristic Curve (SWCC), and hydraulic conductivity), an engineering–geological survey was carried out on the Sedilis channelised landslide area and several tests were performed both in the field and in the laboratory.
3.1. Fieldwork and Sample Collection
Fieldwork aimed to: (i) define a detailed stratigraphic section of the colluvial deposit; (ii) arrange field tests to evaluate the in situ hydraulic conductivity of colluvial soils; and (iii) collect a number of soil samples to determine their geotechnical and hydraulic properties in the laboratory.
During the field survey, some key outcrops were cleaned using trowels and brushes to remove debris cover. In some cases, shallow trenches were excavated using a pick and shovel to highlight the stratigraphic contacts within the colluvial deposit and the underlying bedrock (Figure 3b–d), as well as to arrange field tests and minimise disturbance during the sampling procedure (Figure 4a). For each investigated outcrop, a stratigraphic analysis was performed, with identification, codification, and thickness measurements of the different soil layers. The colluvial soil samples were collected from a borehole (S7) that was drilled close to the crown area of the unstable slope and some outcrops on the lateral scarps of the 1998 slide event and the 2014 reactivation (Figure 3).
Soil samples were taken in both undisturbed and disturbed conditions using steel cylindrical or rectangular samplers with a cutting edge from 22 different sampling points throughout the landslide area. The soil sampling that was aimed at the assessment of the moisture condition of colluvial materials was performed at 40–60 cm depth intervals on the lateral scarps of the 1998 Sedilis slide in order to reconstruct moisture profiles within the colluvial deposit. This procedure was repeated in different periods of the year to appreciate possible seasonal changes. In these tests, the undisturbed soil samples were sealed and rapidly brought to the geotechnical laboratory (within 3–6 h) for the determination of the weight, natural water content, and degree of saturation.
3.2. Field Tests
A number of variable head permeability tests were carried out in situ to estimate the vertical saturated hydraulic conductivity of flysch-derived colluvial soils (Figure 3 and Figure 4). The measurement method that was adopted considered some critical aspects, including the soil response times, the type and functionality of the equipment used, and the need to perform measurements in an adequate time (ranging from a few hours to one day). To overcome the operative difficulties related to accessing the measuring points on the field with heavy equipment and limited working times, variable head permeability tests were carried out using instruments and a quantity of water (a few dozen litres) that could be transported manually by the operators. When considering the demanding fieldwork needed to prepare the measuring points, the use of typical single- or double-ring infiltrometers would not have been possible due to the limited operative spaces in the excavated trenches along the investigated scarps. Therefore, a smaller Shelby sampler with the same flotation system was used, even though the water volumes and flow rates involved were lower compared with the single- or double-ring infiltrometers. In particular, preliminary tests were performed using half of a steel Shelby cylinder (diameter D = 9.8 cm; length L = 30 cm; thickness s = 0.2 cm), which was manually inserted into the ground at a depth of 10 cm. The variations in the hydraulic head over time were measured using a floating graduated rod.
During the test execution, as the soil was in a partially saturated condition, the test was initially performed to saturate the soil volume below and around the test cylinder. After this preliminary stage, a known amount of water was poured into the test cylinder using a graduated container, thus generating an initial specific hydraulic head. Subsequently, the decrease in the hydraulic head over time was recorded using the floating graduated rod and a timer. The decrease rate of the hydraulic head depends on the permeability of the soil contained in the test cylinder, the volume or thickness of the soil, and the shape coefficient related to the cylindrical test size. The values of the in situ vertical permeability of the various identified colluvial soils were calculated according to the well-known relationships of the variable head permeability calculation [62,63].
3.3. Laboratory Investigations
Laboratory investigations on flysch-derived colluvial soils were devoted to the following: (i) assessing the values of grain size composition, unit weight, porosity, bulk density, natural water content, Atterberg limits; (ii) identifying the materials with the lowest shear strength properties; (iii) evaluating the saturated hydraulic conductivity; and (iv) determining the values of the suction, volumetric water content, and degree of saturation. The tests were performed at the Geotechnical and Engineering Geological Laboratory of the Polytechnic Department of Engineering and Architecture at the University of Udine (Udine, Italy).
The grain size analyses were carried out through wet sieving and using a hydrometer during the decantation process of the fine fraction. The liquid limit of the soil samples was determined with the Casagrande spoon test, whereas the plastic limit was determined with the hand rolling method. The shear strength properties of the colluvial materials were estimated by performing shear tests on both undisturbed and remoulded samples. In particular, peak and residual strength parameters were determined using the following:
- (i)
- The Casagrande direct shear box, for natural soil samples;
- (ii)
- The Bromhead ring shear machine, for reconstituted samples that only included the fine fraction (ASTM#40 sieve-passing material).
When considering the moisture condition of natural soil samples subjected to direct shear tests, the latter were tested in completely saturated conditions through water immersion in the metal box supporting the shear machine. For the reconstituted samples subjected to residual shear tests, complete saturation was ensured during the initial sample preparation, in which the water content was set to be equal to the corresponding liquid limit. The values of the normal consolidation stress (σv), which were maintained over the shear stage, were chosen on the basis of the lithostatic stresses actually occurring in situ for the different sampling locations. For the tested samples, the values of σv varied, at 50 < σv < 150 kPa, with these values being representative of a colluvial cover up to 8 m thick. The displacement rates that were used in the direct and residual shear resistance tests were VP = 0.02 mm/min and VR = 0.032°/min, respectively.
Some variable head permeability tests were performed on colluvial samples to compare the values of the saturated hydraulic conductivity calculated in the laboratory with measurements obtained from field tests. Laboratory tests were carried out adopting a standard oedometer ring (diameter D = 7.14 cm, height H = 2.00 cm, area A = 40 cm2), which was previously used in situ as a sampler to collect undisturbed samples. The samples were initially saturated in the oedometer cell by immersion for at least 24 h. Subsequently, the flow circulation phase was developed by imposing a minimal entry of water flow from the lower porous base of the cell through the appropriate channel, which was also used to eliminate air bubbles and to saturate the sample. The samples were then consolidated at different vertical pressures, ranging between 2 and 100 kPa, thus exploring the different hydraulic responses of the soil. After the end of the consolidation phase, the variable head permeability test was carried out in the oedometer cell by imposing an initial hydraulic head and following its decrease over time. For each vertical consolidation pressure, the permeability flow phases were repeated three times to obtain a proper average value of the vertical permeability, evaluated with the same test conditions and gradients.
Finally, some laboratory tests on selected soil samples were carried out to obtain the suction measurements that were necessary to reconstruct the SWCC of flysch-derived colluvial soils. A specific laboratory procedure was performed, and this was repeated for the undisturbed soil samples taken from the Sedilis landslide area. Owing to the high content of rock fragments and pebbles included in the colluvial mixture, the finer fraction (diameter < 2 mm) was separated and then the soil samples were reconstituted into a state similar to that of the field conditions (water content and saturation degree; bulk density). The remoulded samples were obtained using a finer soil matrix, i.e., only ASTM#40 sieve-passing material. They were prepared in a cylindrical steel mould with a total volume of 851 cm3 (diameter of 8.5 cm and height of 15 cm), with different controlled moisture and saturation degrees. After the initial phase of sample preparation and moisture adsorption, a jet-fill tensiometer was inserted into a hole created within the soil sample for the suction measurement during the desorption stage. Suction measurements on this type of silty loam reconstituted sample were performed after a stabilising period of 24 h, which was required to achieve a good equilibrium condition. The measured values of suction were subsequently corrected to take the height of the water in the tensiometer tube into account. Immediately afterwards, the values of θw and Sr were determined on the tested soil samples. Based on these data, the SWCC was reconstructed considering the low suction values, which correspond with the most frequent slope conditions.
4. Stratigraphy of the Colluvial Deposit
Owing to the characteristic three-dimensional geometry of the buried gully, the investigated colluvial deposit has a very variable thickness, ranging from 2 m to 17 m, with an average value of 7–8 m. The maximum thickness is reached in the upper zone of the landslide deposit, as ascertained from the borehole data (Figure 3e). The 1998 Sedilis landslide involved a colluvial cover that was characterised by a thickness varying between 2–3 m and 8 m.
The typical texture of flysch-derived colluvial soils is characterised by an abundant fine matrix mixed with a skeleton made up of marl and sandstone fragments from the parent rock mass (Figure 5a). The colluvial deposit overlies the Eocene flysch bedrock belonging to the SVO Formation (Figure 5b). According to evidence obtained from field surveys and borehole data (Figure 3 and Figure 4), three distinct soil layers with different characteristics were identified (Figure 5c):
- A 30–50 cm thick organic topsoil, with abundant roots and macro-voids, in some cases reworked for vineyard cultivation purposes;
- An upper colluvial soil of highly variable thickness with a prevailing loamy matrix (Colluvial soil 1 in Figure 5c);
- An underlying colluvial soil made up of abundant angular fragments of marl and sandstone with a scant amount of loamy matrix (Colluvial soil 2 in Figure 5c).
It must be noted that Colluvial soil 2 is, in several cases, lacking, and Colluvial soil 1 directly overlies the flysch bedrock. As a result, the thickness of Colluvial soil 2 is highly variable, even reaching 7–8 m (Figure 3e). However, only the geotechnical and hydraulic properties of the topsoil and the upper flysch-derived colluvial soil were investigated in the present study.
5. Geotechnical Characterisation of Flysch-Derived Colluvial Soils
5.1. Grain Size Distribution
According to the grain size investigations (Figure 6 and Table 1), the natural samples collected from the eastern scarp of the 1998 slide included a larger amount of clay fraction, even if they were not the most plastic or active ones (Figure 7). In addition, the most homogeneous samples were those collected from the western scarp, whereas the most heterogeneous ones were those related to borehole S7, which were most likely affected by drilling operations.
When considering their grain size composition (Table 1), the analysed colluvial soils can be classified as clayey sandy silts. According to the calculated values of the average percentage and standard deviation of each soil class, the content of sand generally ranged from 12% to 41%, with a mean value of 21%, whereas the amount of clay varied between 6% and 38%, with a mean value of 25% (Table 1). However, the content of silt was prevalent, ranging from 19% to 43%, with a mean value of more than 28%. Based on these sedimentological data, the colluvial soils can be referred to as a poorly sorted silty loam, with 48–62% of fine matrix (FF), on average, even reaching, in some cases, a higher content of 78%. The silt/clay ratio is generally in the range 0.9–1.3, except for two samples taken from borehole S7 at lower depths (Table 1), which were characterised as having a higher silt/clay ratio (2.3–3.1). The loamy matrix (Sand + Silt + Clay) was always prevalent (51–96%) on the coarse fraction made up of gravel and rock pieces (4–49%). In particular, the skeleton was characterised by an average amount of gravel equal to 25%, which was mainly made up of fragments of marl and sandstone deriving from the parent flysch material.
When merging data of the grain size composition for all the collected samples, the content of gravel was highly variable, with a variation coefficient equal to 57%, which was somewhat higher than those related to sand (33%), silt (21%), and clay (31%). Conversely, the lower value of the variation coefficient of the silt fraction (21%) reflected its constantly higher content within the loamy matrix of the colluvial soil samples.
5.2. Index Properties
The liquid limit (LL) of the silty loam samples was included in the range 30% < LL < 50%, whereas the plasticity index (PI) was 14% < PI < 22% (Figure 7a). According to the Unified Soil Classification System (USCS), these clayey–sandy silts can be classified in the plasticity chart as inorganic clays of low-to-medium plasticity (CL). When considering the activity chart (Figure 7b), the investigated samples generally showed a low or medium activity, with a corresponding swelling–shrinkage potential.
Table 2 summarises the values of the index properties of the investigated colluvial soils, including the average values, standard deviation, and variation coefficient for each sampling location. The colluvial soils were characterised by a natural water content (wn) in the range 19% < wn < 28% (Table 2), with these values being similar to or slightly higher (maximum difference of 7%) than their plastic limit. The samples generally showed a natural wet bulk density (γn) in the range 18.4 < γn < 21.1 kN/m3, whereas the dry ones had values of 14.6 < γd < 17.3 kN/m3 (Table 2). The values of the void index (e) and porosity (n) were included, at 0.59 < e < 0.92 and 0.38 < n < 0.52, respectively. The specific gravity (Gs) was in the range 2.62 < Gs < 2.75. On average, the obtained assessments are consistent with typical values of sandy clayey silts.
5.3. Shear Strength
The results of the shear strength tests performed in both residual and peak conditions are summarised in Table 3 and Table 4, along with the values of the plasticity index and clay fraction for each sample. Shear strength determinations under saturated conditions showed the following:
- (i)
- The values of the residual friction angle for reconstituted samples, which were evaluated in the torsional shear test, were 16° < ϕ’r < 29°, with a mean value of 23° (Table 3). In residual conditions, the soil cohesion was null;
- (ii)
- The peak shear strength properties of the undisturbed natural samples C0 and C1, which were collected at the base of the western and eastern scarps, respectively, were evaluated with the direct shear test. The values of the peak friction angle were 33° < ϕ’p < 38°, whereas the values of cohesion were 6 kPa < c’p < 11 kPa (Table 4 and Figure 8a,b). The peak conditions were reached for horizontal displacements (SH) of about 8–10 mm (Figure 8c,d), highlighting the plastic behaviour of the hardening type;
- (iii)
- When considering residual conditions on undisturbed natural samples, the residual friction angle of the two tested samples decreased by up to 31–33°, respectively (Table 4 and Figure 8a,b). The lower friction angle value related to sample C0 is possibly explained by the higher content of clay that characterised that sample (Table 1).
When analysing results of the ring shear tests, a general decrease in the values of the residual friction angle as the depth increased was observed for almost all the samples collected from the scarps and borehole S7. Indeed, the residual friction angle varied from ϕ’r = 26–29° for the shallowest samples to ϕ’r = 16–17° for the deepest ones (Table 3). Sample C5 from borehole S7, which was collected at a depth greater than 8 m and was not involved in the landslide, was characterised by a higher value of ϕ’r = 30°. This can be justified by the fact that sample C5 was characterised by a higher content of coarse fraction with a corresponding lower CF (Table 1) and a lower plasticity compared with all the other analysed samples (Table 3).
Finally, a direct shear test was also performed on an undisturbed sample under partially saturated conditions (Sr = 93%), which was collected at a depth of about 2 m from the scarp formed as a result of the 2014 slide reactivation. An increase in the peak shear strength was observed, which was related to the additional cohesive strength contribution provided by an apparent cohesion of 19 kPa caused by the matric suction. Conversely, the value of the peak friction angle remained close to that obtained for the sample under complete saturation conditions (Table 4).
6. Hydraulic Properties of Flysch-Derived Colluvial Soils
6.1. Saturated Permeability
The variable head permeability tests that were performed both in situ and in the laboratory allowed for the assessment of the saturated permeability values of the soil layers forming the channelised landslide deposit (Figure 5). The results of the oedometer permeability test that was carried out in the laboratory on samples from the scarp formed by the 2014 reactivation are shown in Table 5. Permeability determinations were obtained in both horizontal and vertical directions for samples collected at different depths. Different vertical consolidation pressures were applied to evaluate their influence on the soil’s hydraulic conductivity. The results of the analysis demonstrated that the increase in the vertical stress (2 kPa < σv < 100 kPa) caused a slight decrease in the soil permeability (Figure 9). Furthermore, when the same vertical stress was applied, the values of the vertical and horizontal permeability were quite similar, even if the vertical hydraulic conductivity was, in most cases, slightly higher than the horizontal one (Table 5). In addition, the calculated values of the vertical and horizontal hydraulic conductivities were found to be very close for samples that were collected at both shallower and greater depths (Figure 9).
The in situ permeability tests were carried out on the top organic soil and the upper colluvial layer (Colluvial soil 1). Field measurements pointed out that the top organic soil is characterised by a vertical hydraulic conductivity of 1.2 × 10⁻⁴ m/s, whereas the upper colluvial soil had a vertical permeability of 7.8 × 10⁻⁵ m/s (Table 6). When comparing the values of the soil vertical permeability obtained from the two different types of tests (in situ vs. laboratory), the field measurements were always higher than oedometric test determinations (Table 6). For Colluvial soil 1, the difference was of about one order of magnitude, whereas for the topsoil, the two values differed by about a half of an order of magnitude. This lower discrepancy could be caused by the different application method of the hydraulic head (variable vs. constant head) and by the different volumes of soil that were involved in the tests between the steel Shelby cylinder and the oedometer ring.
6.2. Moisture Condition
Laboratory tests allowed for the determination of the degree of saturation (Sr) and volumetric water content (θw) of some soil samples, also considering variations according to depth within the colluvial deposit and possible seasonal changes. On the whole, the colluvial deposit was in partially saturated conditions (70% < Sr < 90%) for a depth of about 3 m from the ground surface, whereas the degree of saturation increased at greater depths (90–100%) (Figure 10).
The saturation profile highlighted a general curvilinear trend, with an exponential-shaped curve, showing an increase in the saturation degree as the depth increases. However, the saturation curves were irregular, showing the occurrence, at depth, of several moisture peaks (Sr = 100%) separated by markedly lower values of Sr (Figure 10), as also ascertained for other colluvial deposits in NE Italy [26]. This was consistent for measurements that were acquired on both the 1998 slide scarps (Figure 10a) and the 2014 reactivation scarp (Figure 10b). Measurements of Sr performed at different times on the same outcrop showed a quite constant trend over time, confirming that colluvial deposits in NE Italy are in near-saturated conditions for most of the year [27]. An evaluation of the saturation degree and volumetric water content, along with determinations of the void index, porosity, and natural water content (Table 2), provided key data on the mean and maximum values of the volumetric water content of colluvial soils under both saturated and unsaturated conditions. In particular, for flysch-derived colluvial soils, the natural volumetric water content was in the range 21% < θn < 44%, whereas the saturated volumetric water content varied: 42% < θsat < 50%. Notably, the values of the saturated volumetric water content are key to assess the initial values of the SWCC.
6.3. Soil–Water Characteristic Curve
Following the specific laboratory procedure that was described in Section 3.3, the reconstruction of the SWCC for flysch-derived colluvial soils was possible. The average values of saturation degree, volumetric water content, and soil density, measured for the colluvial samples collected from the slide scarps, were used to reconstitute the laboratory soil samples on which suction measurements were carried out using the jet-fill tensiometer. Immediately afterwards, θw and Sr were re-measured on the remoulded soil samples. The experimental points were interpolated to obtain the SWCC, according to the Fredlund and Xing equation [64] and using the values of parameters a, n, and m, which are reported in Figure 11.
7. Discussion
In this section, a comparison between the findings of the geotechnical and hydraulic characterisation of the colluvial materials investigated in this study and those proposed by other authors is presented, particularly for grain size composition, consistency, and plasticity, as well as for residual shear strength, permeability, and SWCC.
7.1. Grain Size Composition, Consistency and Plasticity
The grain size analyses of the colluvial soils collected from the channelised landslide deposit (Figure 6 and Table 1) obtained the following average composition: 25% gravel, 20% sand, 30% silt, and 25% clay. These values related to clayey–sandy silts (i.e., loam) are consistent with previous determinations proposed by other authors for flysch-derived colluvial soils (Table 7), for example, the loamy materials involved in the Slano Blato landslide [65,66,67]. However, it must be noted that colluvial soils are characterised by a notable variability in their grain size composition. This grain size heterogeneity is strictly associated with various factors, including (i) the lithology of the parent bedrock, (ii) the geomorphological process of the formation of the colluvial cover, and (iii) the pedogenetic processes that could have been involved in the soil deposit. As a result, in some cases, the grain size composition of these loamy materials can be characterised by lower or null percentages of gravel and a higher clay fraction (CF > 30–40%), as documented by various authors [30,56,68,69] (Table 7). Actually, when the parent rock mass is made up of lithological units that are rich in clay minerals (in particular, marls interbeds of the Flysch formations), the clay fraction within the colluvial cover can increase.
Based on the field investigations performed by the authors, soil samples collected from the channelised colluvial deposit at Sedilis showed a greater grain size variability compared with soils sampled from alpine colluvial terraces, which are mostly silty in nature [26]. The significant grain size variability of the colluvial materials of channelised slopes is due to the specific geomorphological context and sedimentary process, which is related to the occurrence of repeated landslide events that create a very complex stratigraphy and chaotic assemblage of soils that experience multiple mobilisations. The notable content in the coarser fraction is related to the occurrence of rock fragments and small blocks that were formed by rock mass crushing during the shearing process of the bedrock at the base of the slide. The colluvial samples analysed within this study also showed that the content of gravel was highly variable depending on both the sampling location (see the eastern and western scarps in Table 1) and the depth of sampling (see the eastern scarp and borehole S7 in Table 1). These data highlight the marked spatial variability in the grain size composition of colluvial materials, which, in turn, strongly affects the other geotechnical and hydrological properties.
Flysch-derived colluvial soils are characterised, on average, by medium-to-low consistency and plasticity properties. For the analysed samples, values of LL = 40%, PL = 23%, and PI = 17% were found. By comparing the values of the natural water content with those of the consistency limits (liquid and plastic), it was found that the samples in their natural state were characterised by water contents close to or higher than the plastic limit, thus highlighting the consistency and deformability that are characteristic of a plastic behaviour. The propensity of the colluvial soils to fluidise can be evaluated by considering the Approximate Mobility Index (AMI), which is defined by the ratio between the water content at saturation (Wsat) and its liquid limit (LL), that is, AMI = Wsat/LL [31]. LL represents the water content necessary to fluidise the material. The values of AMI calculated for the studied soils were in the range 0.45 < AMI < 1, indicating that the materials need to absorb additional water to fluidise (Case B according to [31]), but they are still predisposed to trigger slope failures such as soil slips or debris flows. Generally, fluidisation more likely develops in soil layers at a greater depth, since these are generally characterised by a greater water content and degree of saturation. Even though there are no clear correlations, the values of LL decrease at depth, on average, whereas the water content increases; therefore, their difference can fall below 15%. However, the natural conditions of water content and saturation degree can significantly alter due to heavy rainfall events, which can lead to the complete saturation of the whole colluvial cover, thus incorporating the additional water necessary for fluidisation.
7.2. Residual Strength
The values of the residual friction angle of the colluvial samples that were involved in the Sedilis landslide are shown in Figure 12, together with some reference limit intervals available in the literature:
- (i)
- (ii)
- (iii)
Given the composition and nature of the tested colluvial materials (CF* < 45%, PI < 25%, LL < 50%), the samples appear in the parts of the diagrams where the dispersion is higher and the differences more marked. Overall, most of the measured values fall within the range limits proposed by widely adopted research works [70,71]. Based on the results obtained, an average residual value of the friction angle that can be assumed as a reference for flysch-derived colluvial soils is ϕr = 23°, which is associated with average values of CF* = 37% and PI = 17%.
7.3. Permeability
Hydraulic conductivity determinations for flysch-derived soils are rare. Ref. [30] performed field tests (variable load well test) on a colluvial soil mainly made up of clayey silts that was involved in a shallow landslide, and ascertained values of the saturated permeability within the range 2.3–2.7 × 10⁻³ m/s. Ref. [65] obtained values of permeability in the range 1 × 10⁻³–1 × 10⁻⁴ m/s from in situ tests (slug tests and pump test) on clayey gravels with pieces of limestone and siltstone that were involved in a 3–11 m thick active landslide. Lower permeability values were found by [4], in the order of 1 × 10⁻⁶ m/s, for a landslide colluvial material formed by poorly graded gravelly clays and clayey gravels with a stiff matrix. Ref. [55] performed field measurements of the hydraulic conductivity (constant head permeameter test) of colluvial soils forming flysch hillslope deposits in Tuscany (Italy), which were mainly composed of well-sorted sand and silt with extremely variable gravel and clay contents. The values of the saturated permeability fell in a wide range, between 4 × 10⁻⁸ m/s and 8 × 10⁻⁵ m/s, with most values included in the range 1 × 10⁻⁷–3 × 10⁻⁶ m/s. Ref. [56] determined the saturated hydraulic conductivity of a residual soil from a flysch rock mass through laboratory tests on intact and remoulded soil samples (falling and constant head methods in oedometer and triaxial tests, respectively). The value of the saturated permeability was found to be 4.6 × 10⁻⁸–2.79 × 10⁻⁸ m/s for a medium–low effective stress (25–50 kPa), which corresponds well with the values of vertical stress that were employed in the present study. The authors also obtained significantly lower values of the hydraulic conductivity of reconstituted soil samples (3.5 × 10⁻¹⁰–1.64 × 10⁻¹⁰ m/s) compared with intact samples and suggested that laboratory measurements of hydraulic properties should only be performed using intact samples [56]. The previously reported values of the saturated permeability of flysch-derived soils fall within a very wide interval, and this remarkable variability is closely related to the typically high heterogeneity in the grain size composition of colluvial soils, particularly in the amount of gravel and clay.
The results of the permeability tests performed within this study on flysch-derived colluvial soils, both in the laboratory and in situ, indicated the following (Table 6):
- -
- For the top organic soil, the permeability varies in the range 7.0 × 10⁻⁵–1.2 × 10⁻⁴ m/s;
- -
- For the underlying colluvial layer, the permeability is in the range 7.7 × 10⁻⁶–7.8 × 10⁻⁵ m/s.
Overall, the values of the saturated permeability that were determined in this study from both in situ and laboratory tests fall within the range defined in previous research on flysch-derived soils. In addition, the permeability values of these matrix-supported loamy materials are in line with the values of the hydraulic conductivity of colluvial and/or residual soils coming from other bedrock lithologies, which are included in the range 1 × 10⁻⁴–1 × 10⁻⁶ m/s [73,74,75,76,77,78]. The outcomes of the soil permeability investigations also demonstrate that the values of the hydraulic conductivity obtained from in situ tests are higher than the values from laboratory determinations, as was previously found by other authors [79,80,81,82,83,84,85]. In this study, differences ranging from about half an order of magnitude to one order of magnitude were found (Table 6). Overall, reference values of the soil permeability equal to 1 × 10⁻⁴ m/s for the top organic soil and 1 × 10⁻⁵ m/s for the flysch-derived colluvial soil can be assumed.
The methods employed in this study to determine the saturated permeability of the investigated colluvial soils have both advantages and drawbacks. In particular, the use of a smaller Shelby steel sampler is not conventional compared to classical ring infiltrometers, but it allowed for the measurement of the in situ permeability in a shorter timeframe, considering the difficult operative field conditions. This procedure was also key to preliminarily assessing the values of the hydraulic conductivity in situ, since the latter are more representative of the actual soil permeability at the field scale compared with laboratory determinations, particularly for highly heterogeneous materials such as colluvial soils. Indeed, laboratory tests in oedometric rings were carried out on soil specimens whose size was small in order to minimise the sampling disturbances in the field. However, smaller soil samples reduced the probability of incorporating clasts and coarser fragments, thus possibly reducing, to some extent, the values of the permeability determinations. This means that laboratory tests on smaller soil samples were mainly related to the hydraulic properties of the loamy matrix, whereas field tests, as they were performed on larger volumes of soil, were better able to consider the actual heterogeneity in the structure and grain size composition of the colluvial soils. This could also explain the fact that the values of saturated permeability obtained from field tests are commonly higher than the values determined in the laboratory.
7.4. SWCC
Very few authors have proposed an SWCC for flysch-derived colluvial soils reconstructed from experimental measurements. Thus, the SWCC that was reconstructed within this study can be of key reference for loamy materials, and the comparison of suction measurements with other colluvial soils available in the literature is possible. The values of the matric suction obtained with the tensiometer method for the Sedilis colluvial soils are consistent with other determinations that were obtained using the pressure plate method on colluvial soils of different origins from the FVG region [86] (Figure 13). Similar suction values were also obtained for residual soils deriving from a flysch rock mass in Croatia [87].
When considering the SWCC for silty soils by [64] as a reference, the experimental suction measurements from the Sedilis colluvial soils are higher, and this is due to the increase in the clay fraction (about 25%) that is included in the heterogeneous mixture of materials deriving from flysch rock masses. Indeed, for colluvial soils with a heterogeneous grain size composition that includes a low percentage of gravel and a high clay fraction (>30–40%, or more), the hydraulic properties of conductivity and retention move close to those of pure clayey soils, as demonstrated by the upper bounding drying curve related to flysch-derived soils described by [87].
8. Conclusions
A major aim of this paper is to provide a reliable set of data concerning the geotechnical and hydraulic properties of flysch-derived colluvial soils. A proper characterisation of these soils is of fundamental importance before starting more thorough analyses/models aimed at forecasting the possible occurrence of slope failures and evaluating the related landslide hazard. Overall, colluvial soils are very heterogeneous in their grain size composition. The investigated flysch-derived soils, which were involved in landslide processes, are characterised by the following average values: 25% gravel, 20% sand, 30% silt, and 25% clay. The loamy matrix is characterised by the following consistency limits and plasticity index: LL = 40%, PL = 23%, and PI = 17%. In addition, the main geotechnical index properties of the natural intact soils are, on average: void index e = 0.7, specific gravity Gs = 2.7, and natural unit weight γn = 19.8 kN/m3. The water content and the saturation degree are not constant but change according to depth within the ranges 19% < wn < 28% and 70% < Sr < 100%, respectively. Within the first 4 m of the investigated landslide deposit, the degree of saturation is equal to Sr = 85%, on average, whereas it reaches complete saturation at greater depths.
When considering the shear strength properties of flysch-derived colluvial soils, the peak resistance conditions of the natural intact samples are associated with mean reference values of ϕ’p = 35° for the friction angle and c’p = 8 kPa for the cohesion. For the residual conditions of shear strength, the friction angle decreases up to 31°, with null cohesion values. In frequent cases, when the fine matrix prevails in the soil grain size composition and the clay fraction is equal or even higher than the silty fraction, the residual shear strength can drop well below 30°, especially for soils at greater depths and with vertical stresses. In the examined cases, the residual values of the friction angle were in the range ϕ’r = 23–29° at shallower depths of the colluvial cover (<4 m) and ϕ’r = 16–17° at greater depths, with the latter being related to soils in correspondence with the basal contact with the underlying bedrock. On the whole, the average residual values of the friction angle, which were the most frequently measured values in the analysed samples, fall within the range ϕ’r = 23–24°.
When considering the hydraulic properties of the investigated soils, the reference value of the hydraulic conductivity for the topsoil is 1 × 10⁻⁴ m/s, whereas for the flysch-derived colluvial soil, a reference permeability value of 1 × 10⁻⁵ m/s can be adopted. The permeability tests also demonstrated that the vertical and horizontal hydraulic conductivities were very close, whereas the field soil permeability was generally higher than the permeability measured for laboratory samples.
The reported parameters obtained from the geotechnical and hydraulic characterisation of flysch-derived colluvial materials represent a useful reference for rainfall infiltration modelling and slope stability analyses of colluvial covers that are subject to intense and/or prolonged precipitation, as typically occurs in pre-Alpine and Alpine areas all over the world. In addition, these parameters can also be used in physically based shallow landslide prediction models at the basin scale for landslide susceptibility analyses. Knowledge of the geotechnical and hydrological parameters of the soils forming a given terrain is the basis for the proper assessment of the landslide hazard and/or the effective stabilisation of active landslides. Nonetheless, this study confirms that the marked grain size heterogeneity that typically characterises colluvial materials has consequences for the soil shear strength, as well as the moisture conditions, saturation degree, and SWCC of the soils, leading to wide ranges in their values. This grain size heterogeneity is strictly related to the specific formation process of the soil deposit, the type and nature of the parent bedrock, and the specific climate condition of the area.
As demonstrated by data within this study, the values of the geotechnical and hydrological parameters of colluvial soils have a marked spatial variability, even in the same soils from identical parent material. This means that, in order to appreciate this spatial variability, appropriate and extensive investigations and analyses (focusing on grain size distribution, plasticity, shear strength properties, moisture condition, matric suction, hydraulic conductivity, and SWCC curve) should be performed in parallel using various methods, both in the laboratory and in the field, as they play an important role in the reliable determination of these parameters. This also means that, when facing engineering problems involving colluvial soils, particularly those coming from flysch rock masses, the grain size composition, along with the consistency and plasticity of the fine fraction, is a key feature, and attention should be paid to the proper assumption of the corresponding geotechnical and hydraulic properties.
Author Contributions
Conceptualization, M.D.F., P.P. and A.B.; methodology, M.D.F., P.P. and A.B.; validation, M.D.F., P.P. and A.B.; investigation, M.D.F., P.P. and A.B.; resources, P.P.; data curation, M.D.F. and A.B.; writing—original draft preparation, M.D.F. and A.B.; writing—review and editing, P.P. and A.B.; supervision, P.P. and A.B. All authors have read and agreed to the published version of the manuscript.
Funding
This research received no external funding.
Data Availability Statement
The data presented in this study are available upon request from the corresponding author.
Conflicts of Interest
The authors declare no conflicts of interest.
References
- Poole, F.G. Flysch deposits of Antler Foreland Basin, Western United States. AAPG Bull. 1973, 57, 800–801. [Google Scholar]
- Caron, C.; Homewood, P.; Wildi, W. The original Swiss flysch: A reappraisal of the type deposits in the Swiss prealps. Earth-Sci. Rev. 1989, 26, 1–45. [Google Scholar] [CrossRef]
- Benac, Č.; Arbanas, Ž.; Jurak, V.; Oštrić, M.; Ožanić, N. Complex landslide in the Rječina valley (Croatia): Origin and sliding mechanism. Bull. Eng. Geol. Environ. 2005, 64, 361–371. [Google Scholar] [CrossRef]
- Klimeš, J.; Baroň, I.; Pánek, T.; Kosačík, T.; Burda, J.; Kresta, F.; Hradecký, J. Investigation of recent catastrophic landslides in the flysch belt of outer Western Carpathians (Czech Republic): Progress towards better hazard assessment. Nat. Hazards Earth Syst. Sci. 2009, 9, 119–128. [Google Scholar] [CrossRef]
- Skrzypczak, I.; Kokoszka, W.; Zientek, D.; Tang, Y.; Kogut, J. Landslide Hazard assessment map as a n element supporting spatial planning: The Flysch Carpathians region study. Remote Sens. 2021, 13, 317. [Google Scholar] [CrossRef]
- García-Ruiz, J.M.; Beguería, S.; Alatorre, L.C.; Puigdefábregas, J. Land cover changes and shallow landsliding in the flysch sector of the Spanish Pyrenees. Geomorphology 2010, 124, 250–259. [Google Scholar] [CrossRef]
- Gong, D.-X.; Wu, C.-H.; Zou, H.; Zhou, X.; Zhou, Y.; Tan, H.-Q.; Yue, X.-Y. Provenance analysis of Late Triassic turbidites in the eastern Songpan–Ganzi Flysch Complex: Sedimentary record of tectonic evolution of the eastern Paleo-Tethys Ocean. Mar. Pet. Geol. 2021, 126, 104927. [Google Scholar] [CrossRef]
- Stumvoll, M.J.; Schmalz, E.M.; Kanta, R.; Roth, H.; Grall, B.; Luhn, J.; Flores-Orozco, A.; Glade, T. Exploring the dynamics of a complex, slow-moving landslide in the Austrian Flysch Zone with 4D surface and subsurface information. Catena 2022, 214, 106203. [Google Scholar] [CrossRef]
- d’Onofrio, A.; Picarelli, L.; Santo, A.; Urcioli, G. The Red Flysch Formation in Southern Apennines: Lithological and structural features and challenges in geotechnical characterization and modelling. Rock Mech. Rock Eng. 2023, 56, 8375–8393. [Google Scholar] [CrossRef]
- Reiβmüller, M. Geotechnische Eigenschaften verwitterter Kfssener Mergel. Diploma Thesis, Technical University of Munich, Munich, Germany, 1997. (In German). [Google Scholar]
- Cardoso, R.; Alonso, E.E. Degradation of compacted marls: A microstructural investigation. Soils Found. 2009, 49, 315–327. [Google Scholar] [CrossRef]
- Chandler, R.J. The effect of weathering on the shear strength properties of Keuper marl. Géotechnique 1969, 19, 321–334. [Google Scholar] [CrossRef]
- Brown, E.T. Rock Characterization, Testing and Monitoring ISRM Suggested Methods; Pergamon Press: Oxford, UK, 1981; 211p. [Google Scholar]
- Selby, M.J. Hillslope Materials and Processes, 2nd ed.; Oxford University Press: Oxford, UK, 1993; 451p. [Google Scholar]
- Chigira, M.; Oyama, T. Mechanism and effect of chemical weathering of sedimentary rocks. Dev. Geotech. Eng. 2000, 84, 267–278. [Google Scholar]
- Bhattarai, P.; Marui, H.; Tiwari, B.; Watanabe, N.; Tuladhar, G.; Aoyama, K. Influence of weathering on physical and mechanical properties of mudstone. In Disaster Mitigation of Debris Flows, Slope Failures and Landslides; Universal Academy Press, Inc.: Tokyo, Japan, 2006; Volume 2, pp. 467–479. [Google Scholar]
- Surian, N.; Pellegrini, G.B. Paraglacial sedimentation in the Piave Valley (Eastern Alps, Italy): An example of fluvial processes conditioned by glaciation. Geogr. Fis. Dinam. Quat. 2000, 23, 87–92. [Google Scholar]
- Colucci, R.R.; Monegato, G.; Žebre, M. Glacial and proglacial deposits of the Resia Valley (NE Italy): New insights on the onset and decay of the Last Alpine Glacial Maximum in the Julian Alps. Alp. Mediterr. Quat. 2014, 27, 85–104. [Google Scholar]
- Millar, S.W.S. Colluvial deposits. In Encyclopedia of Planetary Landforms; Hargitai, H., Kereszturi, Á., Eds.; Springer: New York, NY, USA, 2014; pp. 321–328. [Google Scholar]
- Cremaschi, M.; Trombino, L.; Zerboni, A. Palaeosoils and relict soils: A systematic review. In Interpretation of Micromorphological Features of Soils and Regoliths, 2nd ed.; Stoops, G., Marcelino, V., Mees, F., Eds.; Elsevier: Amsterdam, The Netherlands, 2018; pp. 863–894. [Google Scholar]
- Mücher, H.; van Steijn, H.; Kwaad, F. Colluvial and mass wasting deposits. In Interpretation of Micromorphological Features of Soils and Regoliths, 2nd ed.; Stoops, G., Marcelino, V., Mees, F., Eds.; Elsevier: Amsterdam, The Netherlands, 2018; pp. 21–36. [Google Scholar]
- Zádarová, T.; Penížek, V. Formation, morphology and classification of colluvial soils: A review. Eur. J. Soil Sci. 2018, 69, 577–591. [Google Scholar] [CrossRef]
- Fleming, R.W.; Johnson, A.M. Landslides in Colluvium; US Geological Survey Bulletin 2059-B; US Government Printing Office: Washington, UT, USA, 1994; 28p.
- Zádarová, T.; Penížek, V.; Koubová, M.; Lisá, L.; Pavlů, L.; Tejnecký, V.; Žižala, D.; Drábek, O.; Němeček, K.; Vaněk, A.; et al. Formation of Colluvisols in different soil regions and slope positions (Czechia): Post-sedimentary pedogenesis in colluvial material. Catena 2023, 229, 107233. [Google Scholar] [CrossRef]
- Paronuzzi, P.; Fedrigo, D.; Bolla, A. Rainfall infiltration through stratified colluvial deposits: Analytical approach vs. numerical modelling. Geosciences 2024, 14, 53. [Google Scholar] [CrossRef]
- Paronuzzi, P.; Bolla, A. Rainfall infiltration and slope stability of alpine colluvial terraces subject to storms (NE Italy). Eng. Geol. 2023, 323, 107199. [Google Scholar] [CrossRef]
- Paronuzzi, P.; Del Fabbro, M.; Bolla, A. Soil moisture profiles of unsaturated colluvial slopes susceptible to rainfall-induced landslides. Geosciences 2022, 12, 12010006. [Google Scholar] [CrossRef]
- Turner, A.K. Colluvium and talus. In Landslides: Investigation and Mitigation; Turner, A.K., Schuster, R.L., Eds.; Transportation Research Board Special Report 247; National Research Council: Washington, UT, USA, 1996; pp. 525–554. [Google Scholar]
- Borradaile, G. Geological maps and some basic terminology. In Understanding Geology Through Maps; Borradaile, G., Ed.; Elsevier: Amsterdam, The Netherlands, 2014; pp. 1–14. [Google Scholar]
- Meisina, C.; Scarabelli, S. A comparative analysis of terrain stability models for predicting shallow landslides in colluvial soils. Geomorphology 2007, 87, 207–223. [Google Scholar] [CrossRef]
- Ellen, S.D.; Fleming, R.W. Mobilization of debris flows from soil slips, San Francisco Bayregion, California. In Debris Flows/Avalanches: Process, Recognition, and Mitigation; Costa, J.E., Wieczorek, G.F., Eds.; Geological Society of America: Boulder, CO, USA, 1987; pp. 31–40. [Google Scholar]
- Montrasio, L. Stability analysis of soil-slip. In Risk Analysis II; Brebbia, C.A., Ed.; Wit Press: Southampton, UK, 2000; pp. 357–366. [Google Scholar]
- D’Amato Avanzi, G.; Falaschi, F.; Giannecchini, R.; Puccinelli, A. Soil slip susceptibility assessment using mechanical-hydrological approach and GIS techniques: An application in the Apuan Alps (Italy). Nat. Hazards 2009, 50, 591–603. [Google Scholar] [CrossRef]
- Varnes, D.J. Slope Movement Types and Processes. In Landslides: Analysis and Control; Schuster, R.L., Krizek, R.J., Eds.; TRB, National Research Council: Washington, UT, USA, 1978; pp. 11–33. [Google Scholar]
- Hungr, O.; Leroueil, S.; Picarelli, L. The Varnes classification of landslide types, an update. Landslides 2014, 11, 167–194. [Google Scholar] [CrossRef]
- Zhang, M.; Yin, Y.; Hu, R.; Wu, S.; Zhang, Y. Ring shear test for transform mechanism of slide–debris flow. Eng. Geol. 2011, 118, 55–62. [Google Scholar] [CrossRef]
- Rahardjo, H.; Ong, T.H.; Rezaur, R.B.; Leong, E.C.; Fredlund, D.G. Response parameters for characterization of infiltration. Environ. Earth Sci. 2010, 60, 1369–1380. [Google Scholar] [CrossRef]
- Sun, P.; Wang, H.; Wang, G.; Li, R.; Zhang, Z.; Huo, X. Field model experiments and numerical analysis of rainfall-induced shallow loess landslides. Eng. Geol. 2021, 295, 106411. [Google Scholar] [CrossRef]
- Rahardjo, H.; Krisdani, H.; Leong, E.C.; Ng, Y.S.; Foo, M.D.; Wang, C.L. Capillary barrier as slope cover. In Common Ground Proceedings of 10th Australia New Zealand Conference on Geomechanics; Hilton Hotel: Brisbane, Australia, 2007; pp. 698–703. [Google Scholar]
- Cho, S.E. Prediction of shallow landslide by surficial stability analysis considering rainfall infiltration. Eng. Geol. 2017, 231, 126–138. [Google Scholar] [CrossRef]
- Segoni, S.; Piciullo, L.; Gariano, S.R. A review of the recent literature on rainfall thresholds for landslide occurrence. Landslides 2018, 15, 1483–1501. [Google Scholar] [CrossRef]
- Vannocci, P.; Segoni, S.; Masi, E.B.; Cardi, F.; Nocentini, N.; Rosi, A.; Bicocchi, G.; D’Ambrosio, M.; Nocentini, M.; Lombardi, L.; et al. Towards a national-scale dataset of geotechnical and hydrological soil parameters for shallow landslide modelling. Data 2022, 7, 37. [Google Scholar] [CrossRef]
- Haque, U.; da Silva, P.F.; Devoli, G.; Pilz, G.; Zhao, B.; Khaloua, A.; Wilipo, W.; Andersen, P.; Lu, P.; Lee, J.; et al. The human cost of global warming: Deadly landslides and their triggers (1995–2014). Sci. Total Environ. 2019, 682, 673–684. [Google Scholar] [CrossRef]
- Peranić, J.; Mihalić Arbanas, S.; Arbanas, Ž. Importance of the unsaturated zone in landslide reactivation on flysch slopes: Observations from Valići Landslide, Croatia. Landslides 2021, 18, 3737–3751. [Google Scholar] [CrossRef]
- Ma, T.; Li, C.; Lu, Z.; Bao, Q. Rainfall intensity–duration thresholds for the initiation of landslides in Zhejiang Province, China. Geomorphology 2015, 245, 193–206. [Google Scholar] [CrossRef]
- Marin, R.J.; Velásquez, M.F.; García, E.F.; Alvioli, M.; Aristizábal, E. Assessing two methods of defining rainfall intensity and duration thresholds for shallow landslides in data-scarce catchments of the Colombian Andean Mountains. Catena 2021, 206, 105563. [Google Scholar] [CrossRef]
- Min, D.-H.; Kim, Y.S.; Kim, S.; Yoon, H.-K. Strategy of oversampling geotechnical parameters through geostatistical, SMOTE, and CTGAN methods for assessing susceptibility of landslide. Landlisdes 2023, 21, 291–307. [Google Scholar] [CrossRef]
- Wei, X.; Gardoni, P.; Zhang, L.; Tan, L.; Liu, D.; Du, C.; Li, H. Improving pixel-based regional landslide susceptibility mapping. Geosci. Front. 2024, 15, 101782. [Google Scholar] [CrossRef]
- Uyeturk, C.E.; Huvaj, N.; Bayraktaroglu, H.; Huseyinpasaoglu, M. Geotechnical characteristics of residual soils in rainfall-triggered landslides in Rize, Turkey. Eng. Geol. 2020, 264, 105318. [Google Scholar] [CrossRef]
- Cerato, A.B.; Lutenegger, A.J. Specimen size and scale effects of direct shear box tests of sands. Geotech. Test. J. 2006, 29, 507–516. [Google Scholar] [CrossRef]
- Cho, G.-C.; Dodds, J.; Santamarina, J.C. Particole shape effects on packing density, stiffness, and strength: Natural and crushed sands. J. Geotech. Geoenviron. Eng. 2006, 132, 591. [Google Scholar] [CrossRef]
- Iverson, N.R.; Mann, J.E.; Iverson, R.M. Effects of soil aggregates on debris-flow mobilization: Results from ring-shear experiments. Eng. Geol. 2010, 114, 84–92. [Google Scholar] [CrossRef]
- Li, S.; Wang, T.; Wang, H.; Jiang, M.; Zhu, J. Experimental studies of scale effect on the shear strength of coarse-grained soil. Appl. Sci. 2022, 12, 447. [Google Scholar] [CrossRef]
- Anis, Z.; Wissem, G.; Riheb, H.; Biswajeet, P.; Essghaier, G.M. Effects of clay properties in the landslides genesis in flysch massif: Case study of Aïn Draham, North Western Tunisia. J. Afr. Earth Sci. 2019, 151, 146–152. [Google Scholar] [CrossRef]
- Bicocchi, G.; Tofani, V.; D’Ambrosio, M.; Tacconi-Stefanelli, C.; Vannocci, P.; Casagli, N.; Lavorini, G.; Trevisani, M.; Catani, F. Geotechnical and hydrological characterization of hillslope deposits for regional landslide prediction modeling. Bull. Eng. Geol. Environ. 2019, 78, 4875–4891. [Google Scholar] [CrossRef]
- Peranić, J.; Moscariello, M.; Cuomo, S.; Arbanas, Ž. Hydro-mechanical properties of unsaturated residual soil from a flysch rock mass. Eng. Geol. 2020, 269, 105546. [Google Scholar] [CrossRef]
- Bosellini, A.; Sarti, M. Geologia del Gruppo M. Cuar-M. Covria (Alpi Carniche). Giorn. Geol. 1978, 43, 47–88. [Google Scholar]
- Carulli, G.B. Carta Geologica del Friuli Venezia Giulia–Scale 1:150,000 with Illustrative Notes; Tabacco: Tavagnacco, Italy, 2006; 44p. [Google Scholar]
- Zanferrari, A.; Avigliano, R.; Monegato, G.; Paiero, G.; Poli, M.E. Note Illustrative della Carta Geologica d’Italia alla Scala 1:50,000; Foglio 066 Udine; Graphic Linea: Tavagnacco, Italy, 2008; 176p. [Google Scholar]
- Poli, M.E. La carta geologica del massiccio della Bernadia (Prealpi Giulie meridionali, Friuli, Italia NE). Rend. Online Soc. Geol. It 2009, 5, 168–171. [Google Scholar]
- Servizio Geologico d’Italia. Carta Geologica d’Italia alla Scala 1:50,000; Foglio 049 Gemona (Progetto CARG); ISPRA: Rome, Italy, 2013. [Google Scholar]
- Associazione Geotecnica Italiana. Raccomandazioni Sulla Programmazione ed Esecuzione delle Indagini Geotecniche; AGI: Rome, Italy, 1977; pp. 51–63. [Google Scholar]
- UNI EN ISO 22282-2; Geotechnical Investigation and Testing–Geohydraulic Testing–Part 2: Water Permeability Tests in a Borehole Using Open Systems. ISO: Geneva, Switzerland, 2012; 12p.
- Fredlund, D.G.; Xing, A. Equations for the soil-water characteristic curve. Can. Geotech. J. 1994, 31, 521–532. [Google Scholar] [CrossRef]
- Logar, J.; Fifer Bizjak, K.; Kŏcevar, M.; Mikŏs, M.; Ribĭcĭc, M.; Majes, B. History and present state of the Slano Blato landslide. Nat. Hazards Earth Syst. Sci. 2005, 5, 447–457. [Google Scholar] [CrossRef]
- Fifer Bizjak, K.; Zupančič, A. Site and laboratory investigation of the Slano blato landslide. Eng. Geol. 2009, 105, 171–185. [Google Scholar] [CrossRef]
- Petkovšek, A.; Maček, M.; Mikoš, M.; Majes, B. Mechanisms of Active Landslides in Flysch. In Landslides: Global Risk Preparedness; Sassa, K., Rouhban, B., Briceño, S., McSaveney, M., He, B., Eds.; Springer: Berlin/Heidelberg, Germany, 2013; pp. 149–165. [Google Scholar]
- Carrubba, P.; Del Fabbro, M. Resistenza residua alla riattivazione del Flysch di Cormons. Riv. Ital. Geotec. 2006, 1, 28–52. [Google Scholar]
- Carrubba, P.; Del Fabbro, M. Laboratory Investigation on Reactivated Residual Strength. J. Geotech. Geoenvironmental Eng. 2008, 134, 302–315. [Google Scholar] [CrossRef]
- Skempton, A.W. Long-term stability of clay slopes. Géotechnique 1964, 14, 77–102. [Google Scholar] [CrossRef]
- Lupini, J.F.; Skinner, A.E.; Vaughan, P.R. The drained residual strength of cohesive soils. Géotechnique 1981, 31, 181–213. [Google Scholar] [CrossRef]
- Marchetti, S.; Totani, G. Parametri geotecnici ed indagini geognostiche. In Atti 1° Seminario Problemi Geotecnici Nella Edificazione su Pendio; CNR-GNDCI: Montesilvano, Italy, 1992; 41p. [Google Scholar]
- Ng, C.W.W.; Shi, Q. A numerical investigation of the stability of unsaturated soil slopes subjected to transient seepage. Comput. Geotech. 1998, 22, 1–28. [Google Scholar] [CrossRef]
- Dai, F.C.; Lee, C.F.; Wang, S. Analysis of rainstorm-induced slide-debris flows on natural terrain of Lantau Island, Hong Kong. Eng. Geol. 1999, 51, 279–290. [Google Scholar]
- Gasmo, J.M.; Rahardjo, H.; Leong, E.C. Infiltration effects on stability of a residual soil slope. Comput. Geotech. 2000, 26, 145–165. [Google Scholar] [CrossRef]
- Rahimi, A.; Rahardjo, H.; Leong, E.-C. Effect of antecedent rainfall patterns on rainfall-induced slope failure. J. Geotech. Geoenviron. Eng. 2011, 137, 483–491. [Google Scholar] [CrossRef]
- Cuomo, S.; Della Sala, M. Rainfall-induced infiltration, runoff and failure in steep unsaturated shallow soil deposits. Eng. Geol. 2013, 162, 118–127. [Google Scholar] [CrossRef]
- Balzano, B.; Tarantino, A.; Ridley, A. Preliminary analysis on the impacts of the rhizosphere on occurrence of rainfall-induced shallow landslides. Landslides 2019, 16, 1885–1901. [Google Scholar] [CrossRef]
- Amorosi, D.; Sollazzo, R. Misure di permeabilità in sito ed in laboratorio su terreni sabbiosi. Riv. Ital. Geotec. 1966, 3, 58–65. [Google Scholar]
- Olson, R.E.; Daniel, D.E. Measurement of the hydraulic conductivity of fine-grained soils. In Permeability and Groundwater Contaminant Transport; Zimmie, T.F., Riggs, C.O., Eds.; ASTM International: West Conshohocken, PA, USA, 1981; pp. 18–64. [Google Scholar]
- Daniel, D.E. In situ hydraulic conductivity tests for compacted clay. J. Geotech. Eng. 1989, 115, 1205–1226. [Google Scholar] [CrossRef]
- Lim, T.T.; Rahardjo, H.; Chang, M.F.; Fredlund, D.G. Effects of rainfall on matric suctions in a residual soil slope. Can. Geotech. J. 1996, 33, 618–628. [Google Scholar] [CrossRef]
- Faybishenko, B. Comparison of laboratory and field methods for determining the quasi-saturated hydraulic conductivity of soils. In Riverside International Workshop on Soil Hydraulic Properties; Lawrence Berkeley National Laboratory: Berkeley, CA, USA, 1997; pp. 279–292. [Google Scholar]
- Damiano, E.; Greco, R.; Guida, A.; Olivares, L.; Picarelli, L. Investigation on rainwater infiltration into layered shallow covers in pyroclastic soils and its effect on slope stability. Eng. Geol. 2017, 220, 208–218. [Google Scholar] [CrossRef]
- Nam, S.; Gutierrez, M.; Diplas, P.; Petrie, J. Laboratory and in situ determination of hydraulic conductivity and their validity in transient seepage analysis. Water 2021, 13, 1131. [Google Scholar] [CrossRef]
- Meriggi, R. Misura delle proprietà idrauliche e meccaniche dei terreni colluviali in condizione di parziale saturazione. In Sviluppi Nell’esecuzione e Nell’impiego delle Indagini Geotecniche; XX Convegno Nazionale di Geotecnica; AGI: Parma, Italy; Pàtron Editore: Bologna, Italy, 1999; pp. 177–184. [Google Scholar]
- Peranić, J.; Arbanas, Ž.; Cuomo, S.; Maček, M. Soil-water characteristic curve of residual soil from a flysch rock mass. Geofluids 2018, 2018, 6297819. [Google Scholar] [CrossRef]
Figure 1.
Topographic map of the Friuli Venezia Giulia region (NE Italy) showing the various morphological areas, the yearly rainfall contour lines (isohyets, in yellow), and the location of the study area of Sedilis.
Figure 1.
Topographic map of the Friuli Venezia Giulia region (NE Italy) showing the various morphological areas, the yearly rainfall contour lines (isohyets, in yellow), and the location of the study area of Sedilis.

Figure 3.
(a) Planimetric sketch of the Sedilis unstable area highlighting the 1998 channelised slide-earth flow and 2014 partial reactivation. (b,c) Eastern and western lateral scarps of the 1998 slide, showing the sampling points (small white labels). (d) A 5 m high scarp that was formed as a result of the 2014 reactivation occurring in the western part of the unstable slope, with an indication of the sampling location. (e) Stratigraphic reconstruction of borehole S7 with sampling position (red squares).

Figure 4.
(a) Trench excavated to prepare the in situ permeability test, also showing the occurrence of two distinct soil layers. (b,c) Equipment used for the variable head permeability tests.
Figure 4.
(a) Trench excavated to prepare the in situ permeability test, also showing the occurrence of two distinct soil layers. (b,c) Equipment used for the variable head permeability tests.

Figure 5.
(a) Typical texture of the colluvial soil that was involved in the Sedilis channelised landslide; (b) outcrop of the underlying Eocene flysch bedrock (SVO Formation); (c) general stratigraphic sketch of the colluvial deposit in the unstable slope area.
Figure 5.
(a) Typical texture of the colluvial soil that was involved in the Sedilis channelised landslide; (b) outcrop of the underlying Eocene flysch bedrock (SVO Formation); (c) general stratigraphic sketch of the colluvial deposit in the unstable slope area.

Figure 6.
Grain size distribution curves of the colluvial materials sampled from borehole S7 and the eastern and western scarps of the 1998 slide.
Figure 6.
Grain size distribution curves of the colluvial materials sampled from borehole S7 and the eastern and western scarps of the 1998 slide.

Figure 7.
(a) Plasticity and (b) activity charts of the colluvial samples collected from the Sedilis landslide area.
Figure 7.
(a) Plasticity and (b) activity charts of the colluvial samples collected from the Sedilis landslide area.

Figure 8.
(a,b) Peak and residual strength envelopes for the samples coming from the western and eastern scarp, respectively, of the Sedilis slide. (c,d) Shear force–horizontal displacement trends recorded in the peak direct shear tests of two selected samples from the western and eastern scarps, respectively.

Figure 9.
Values of the horizontal and vertical permeability of Colluvial soil 1 (a) and Colluvial soil 2 (b), determined in the oedometer cell for different consolidation pressures.
Figure 9.
Values of the horizontal and vertical permeability of Colluvial soil 1 (a) and Colluvial soil 2 (b), determined in the oedometer cell for different consolidation pressures.

Figure 10.
Variations in the degree of saturation at different depths (moisture profiles) of the unstable colluvial deposit that were measured at various periods of time on the scarps of the (a) 1998 slide and (b) 2014 reactivation.
Figure 10.
Variations in the degree of saturation at different depths (moisture profiles) of the unstable colluvial deposit that were measured at various periods of time on the scarps of the (a) 1998 slide and (b) 2014 reactivation.

Figure 11.
Soil–water characteristic curve for flysch-derived colluvial soils, which was reconstructed using the tensiometer measurements and equation parameters (a, n, m) suggested by [64].
Figure 11.
Soil–water characteristic curve for flysch-derived colluvial soils, which was reconstructed using the tensiometer measurements and equation parameters (a, n, m) suggested by [64].

Figure 12.
Values of the residual friction angle vs. (a) the clay fraction, (b) the plasticity index, (c) and the liquid limit of the colluvial samples from the Sedilis landslide. The results of this study are compared with other authors [70,71,72].

Figure 13.
Experimental suction data ascertained from colluvial samples of the FVG region using both tensiometer and pressure plate measurement methods. For comparison purposes, wetting and drying SWCCs for silty soils [64] and residual soils from a flysch rock mass [87] are also shown.


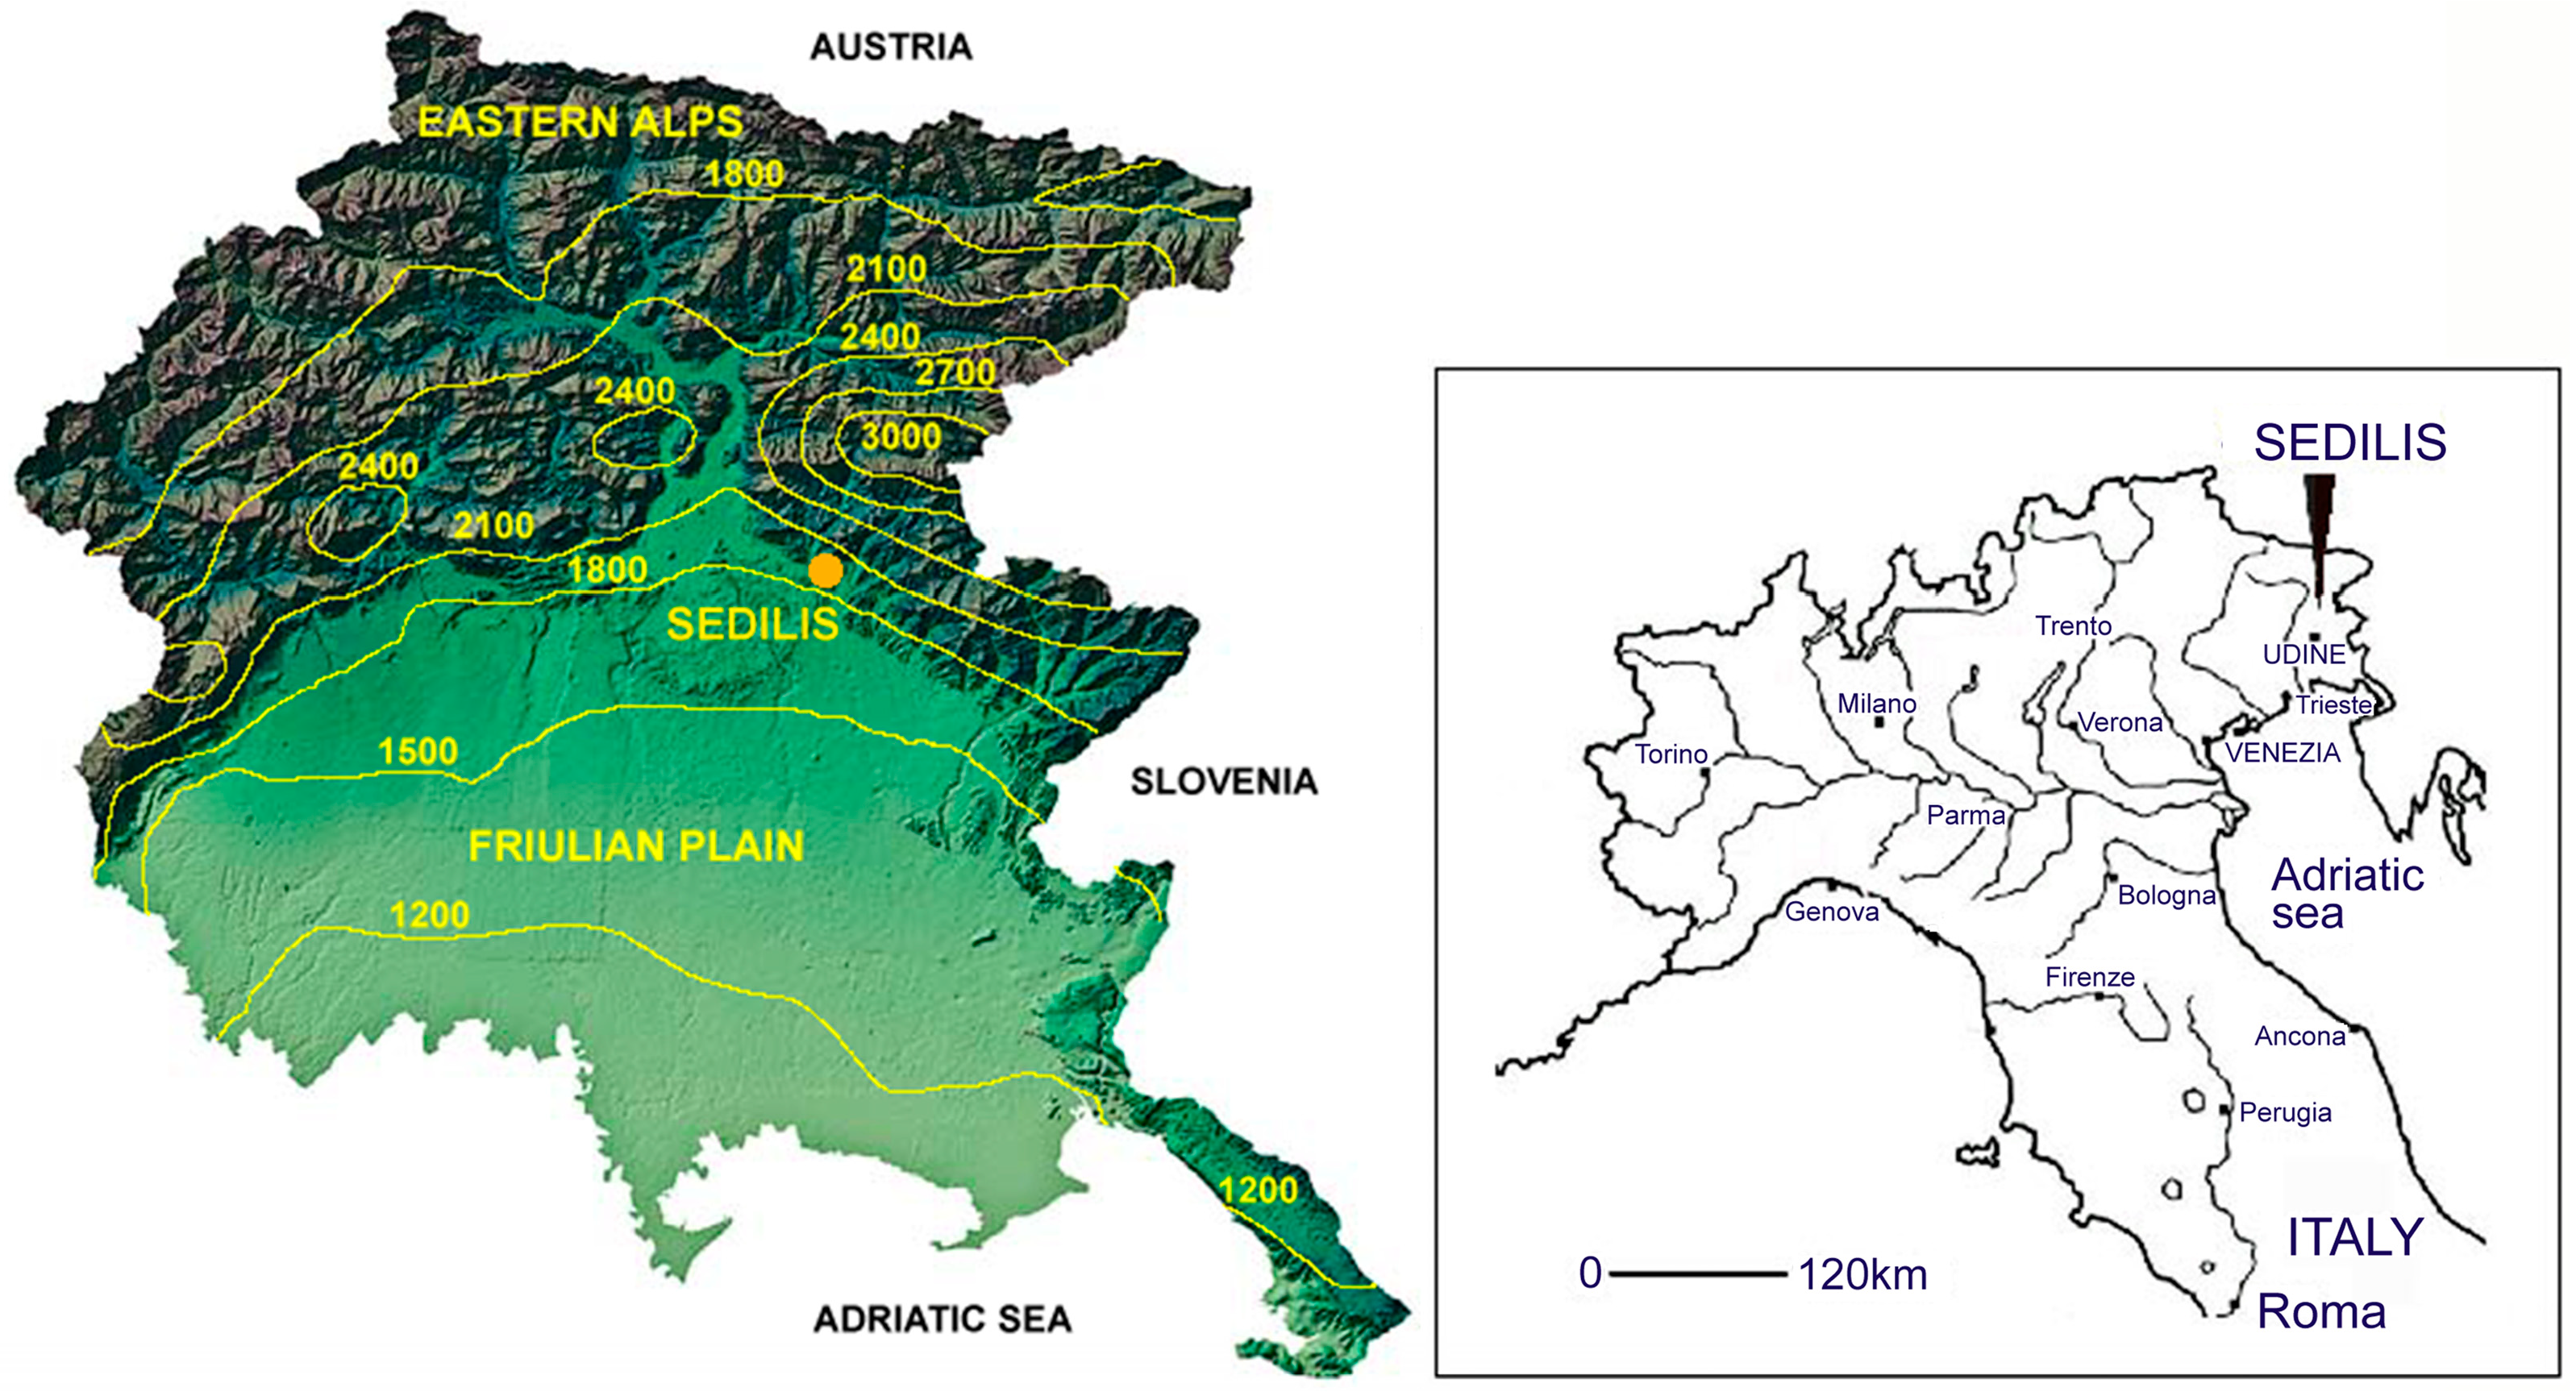
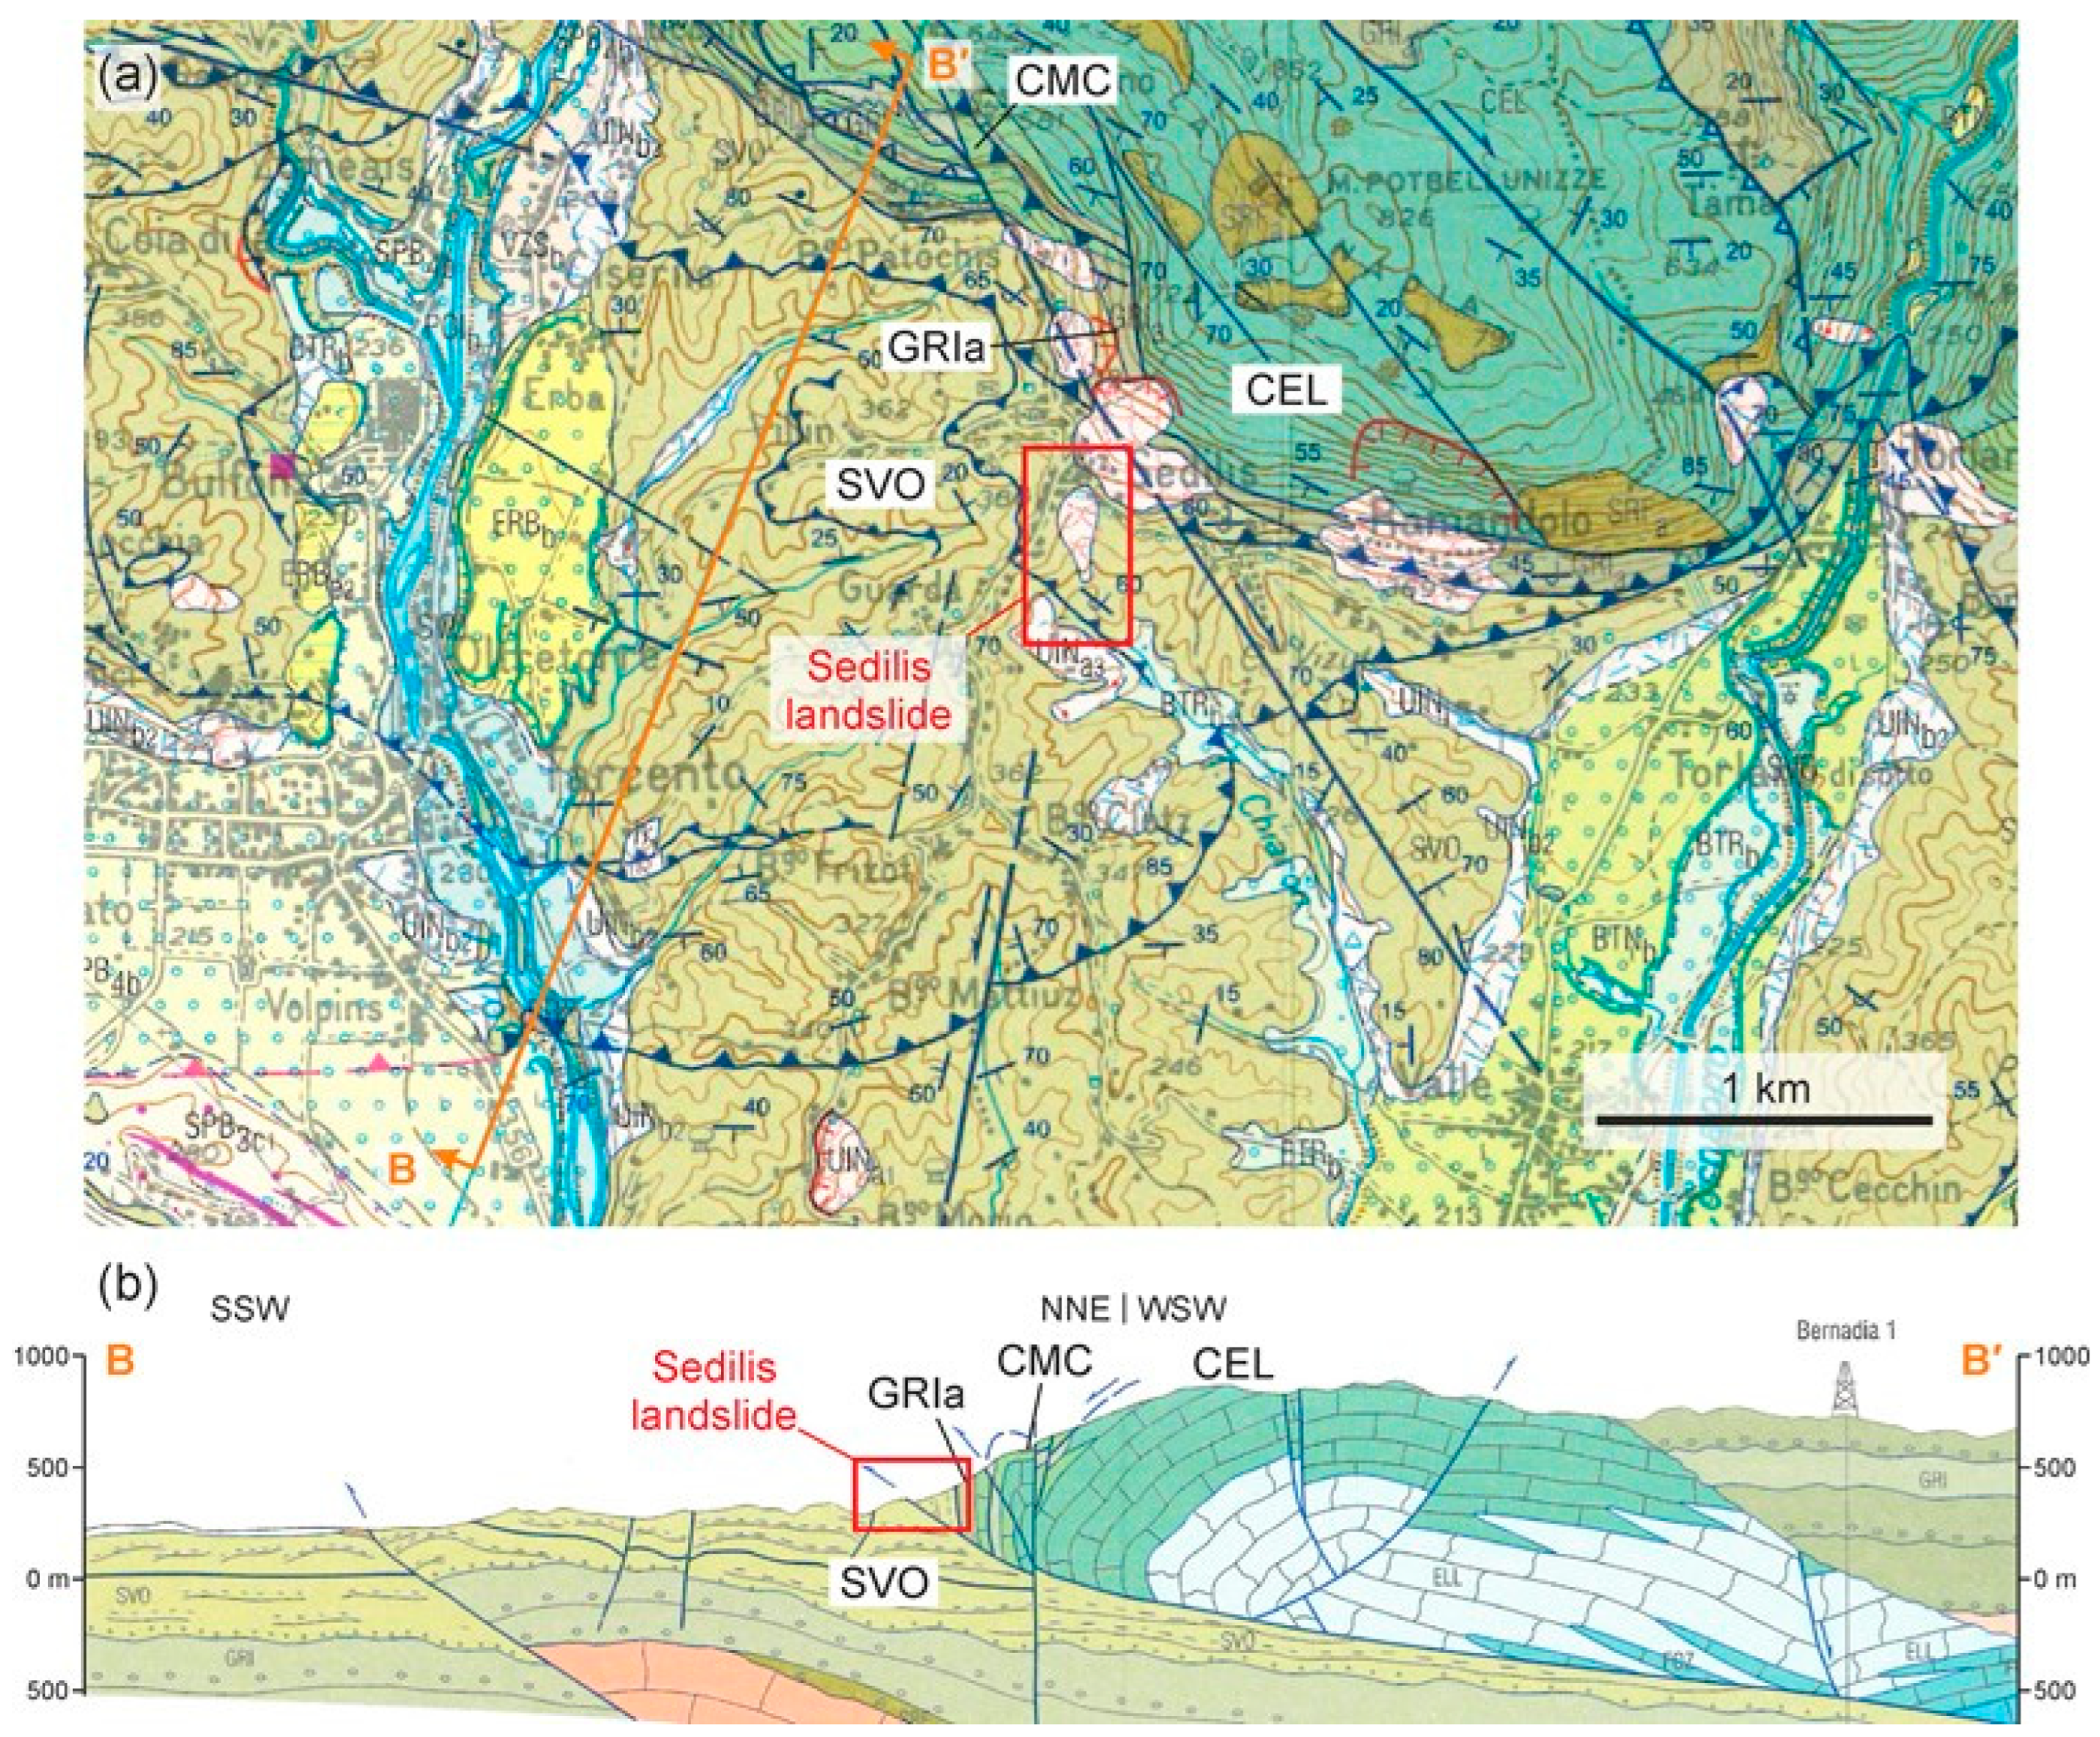
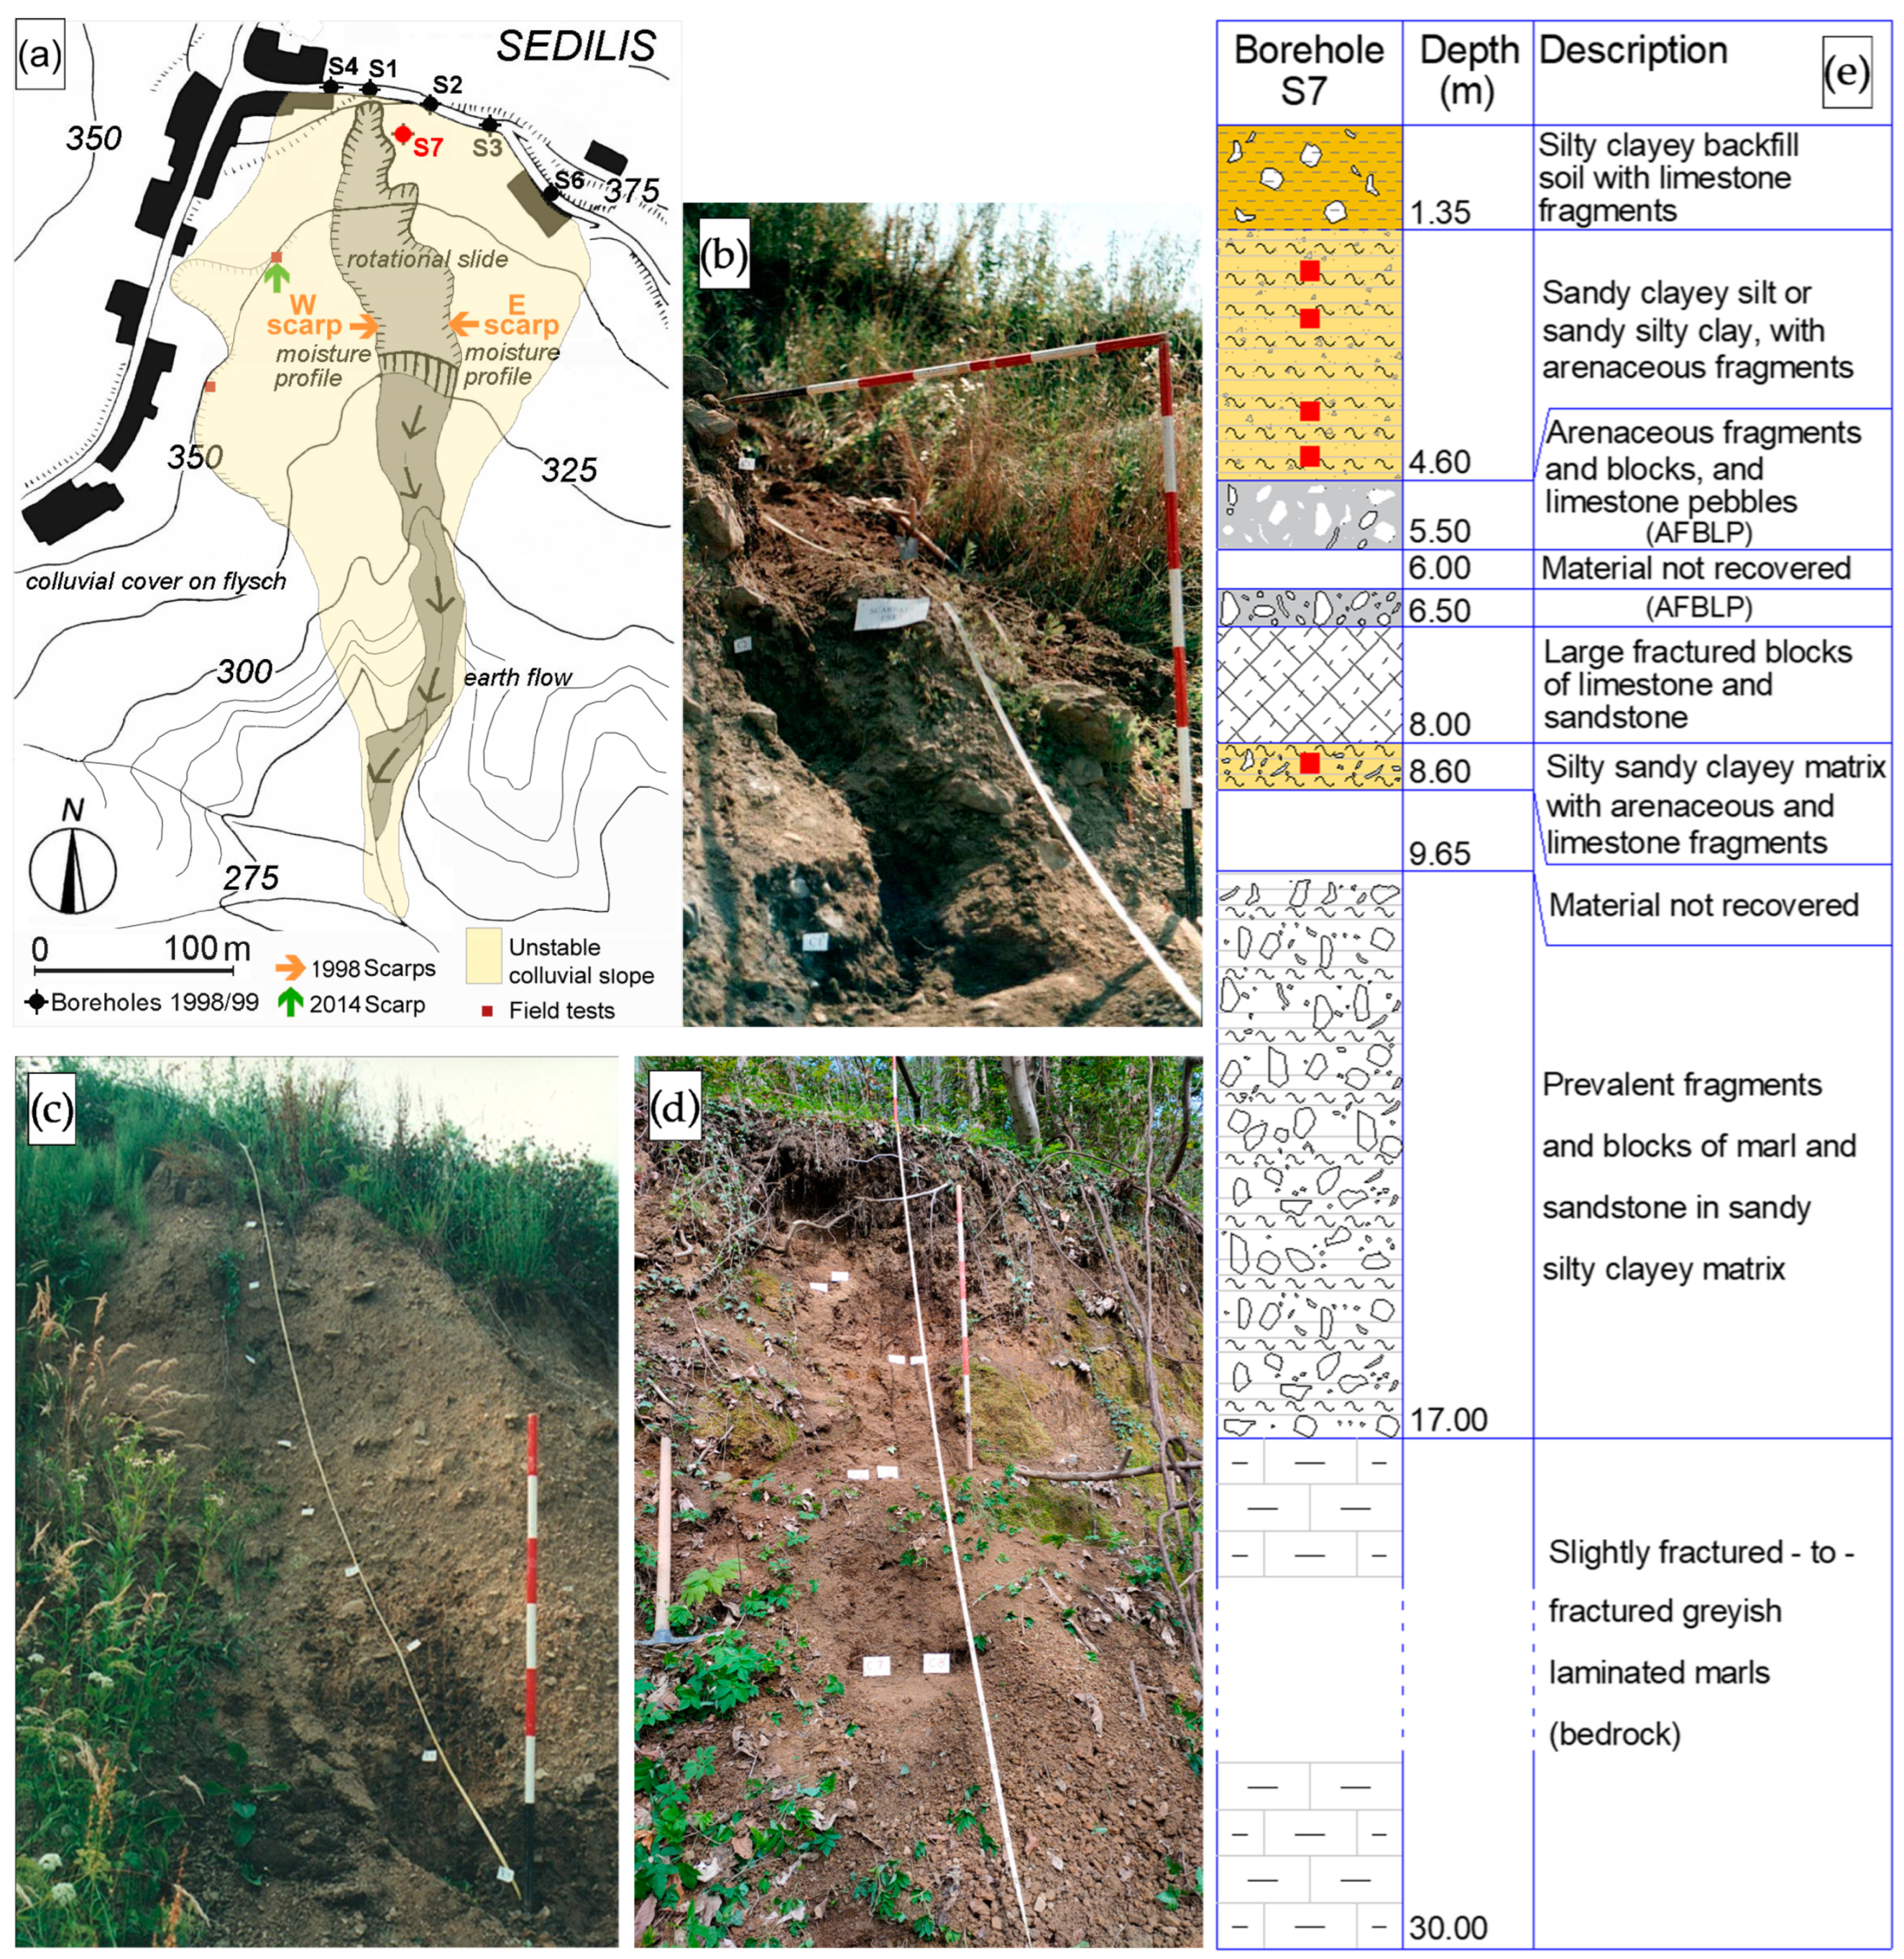
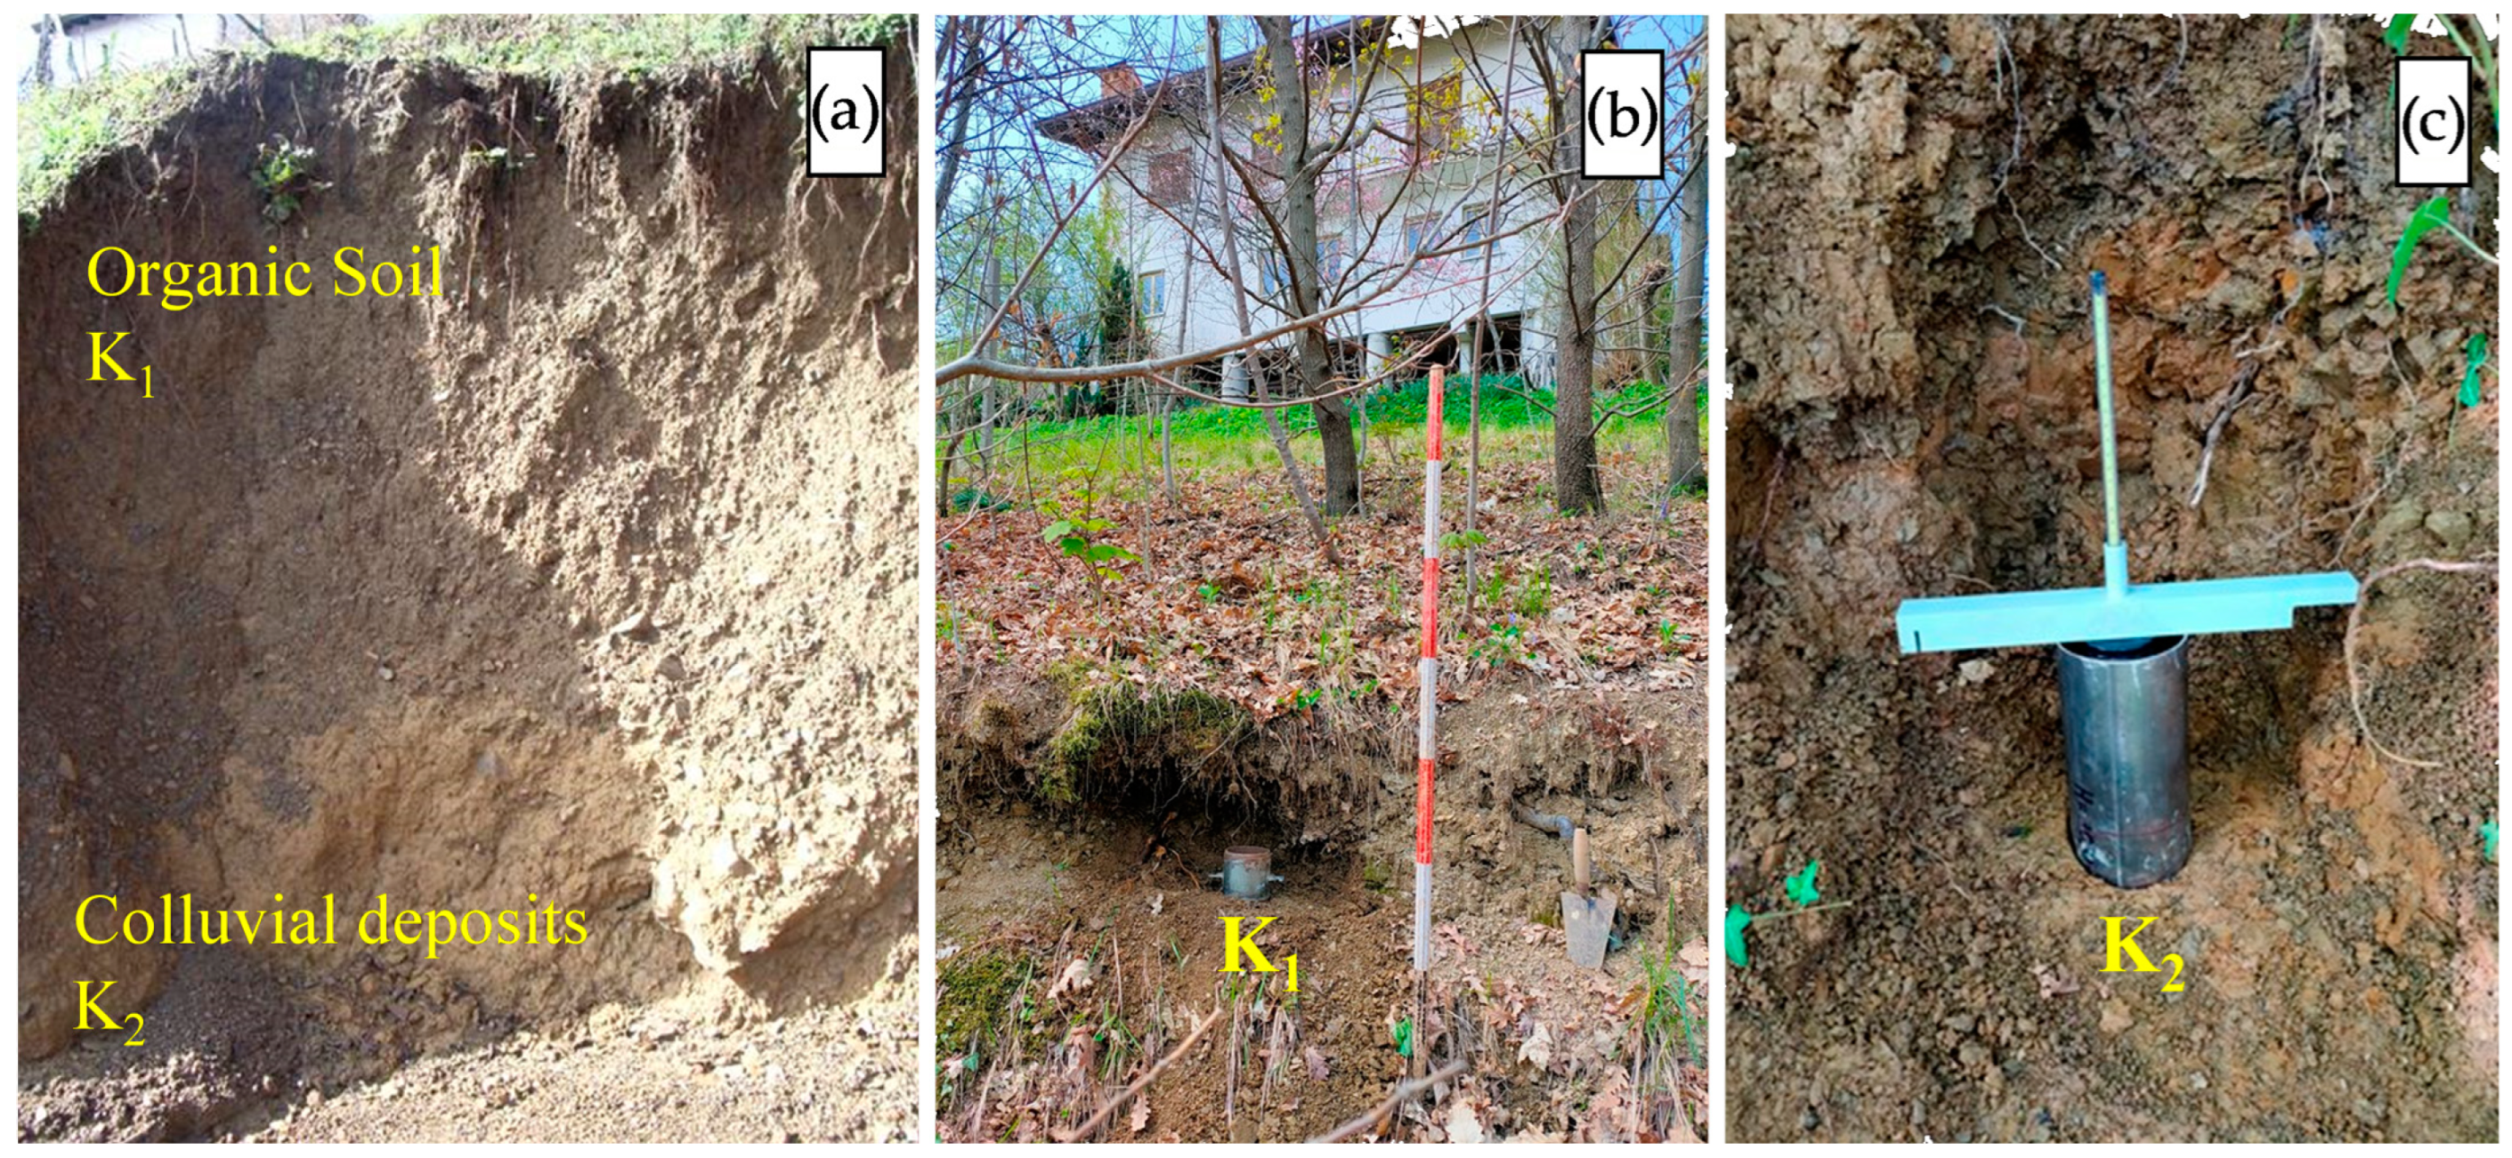
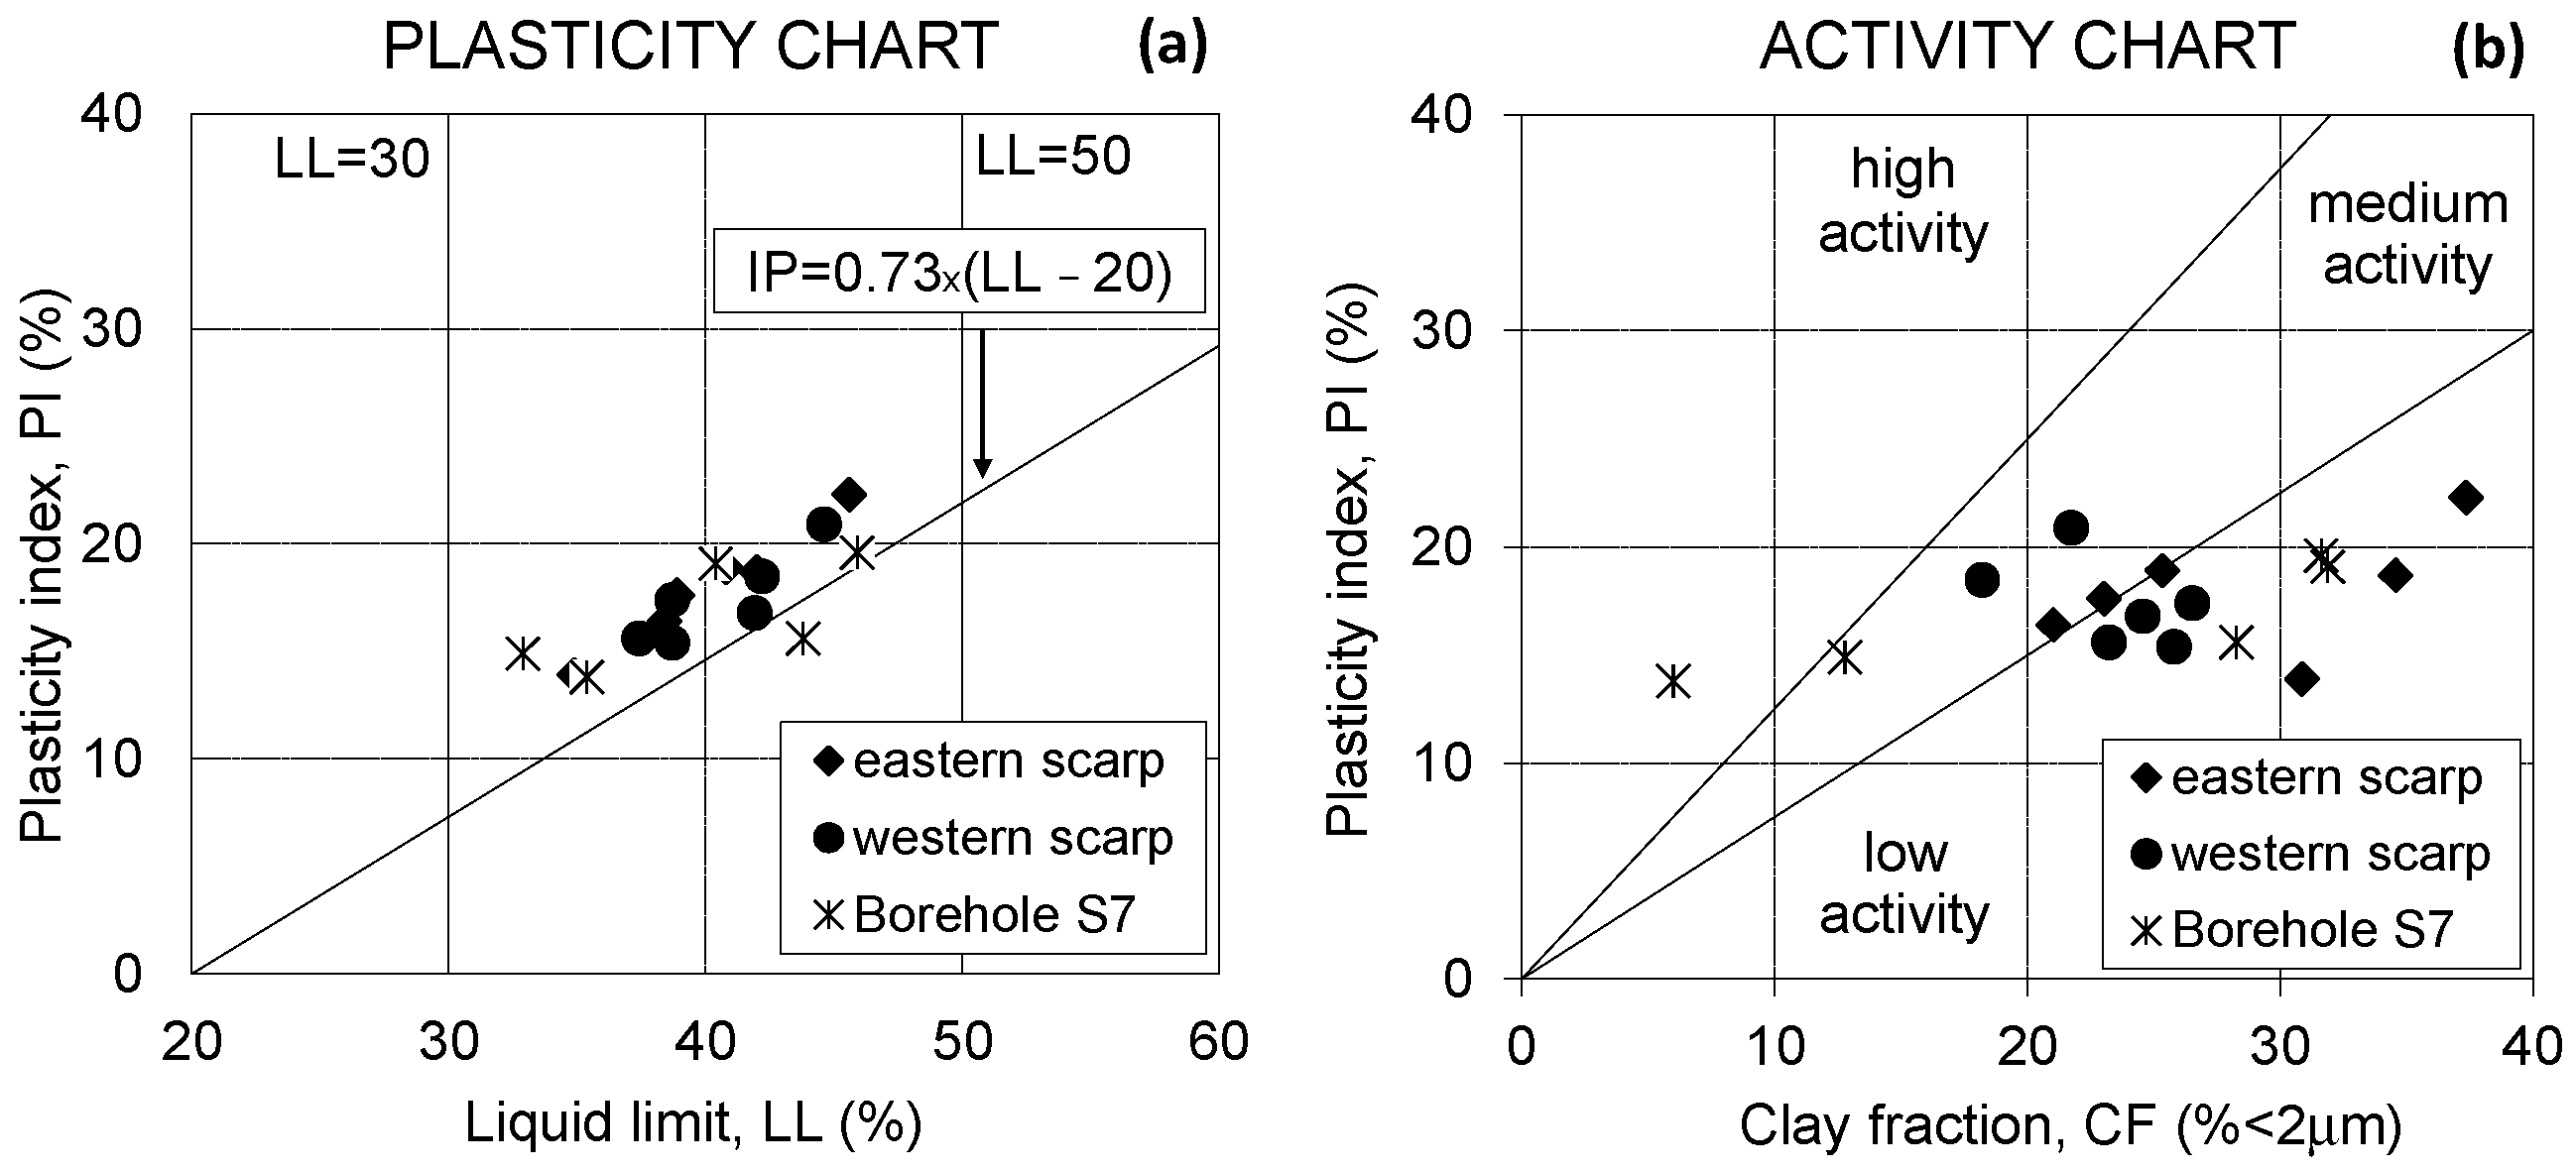
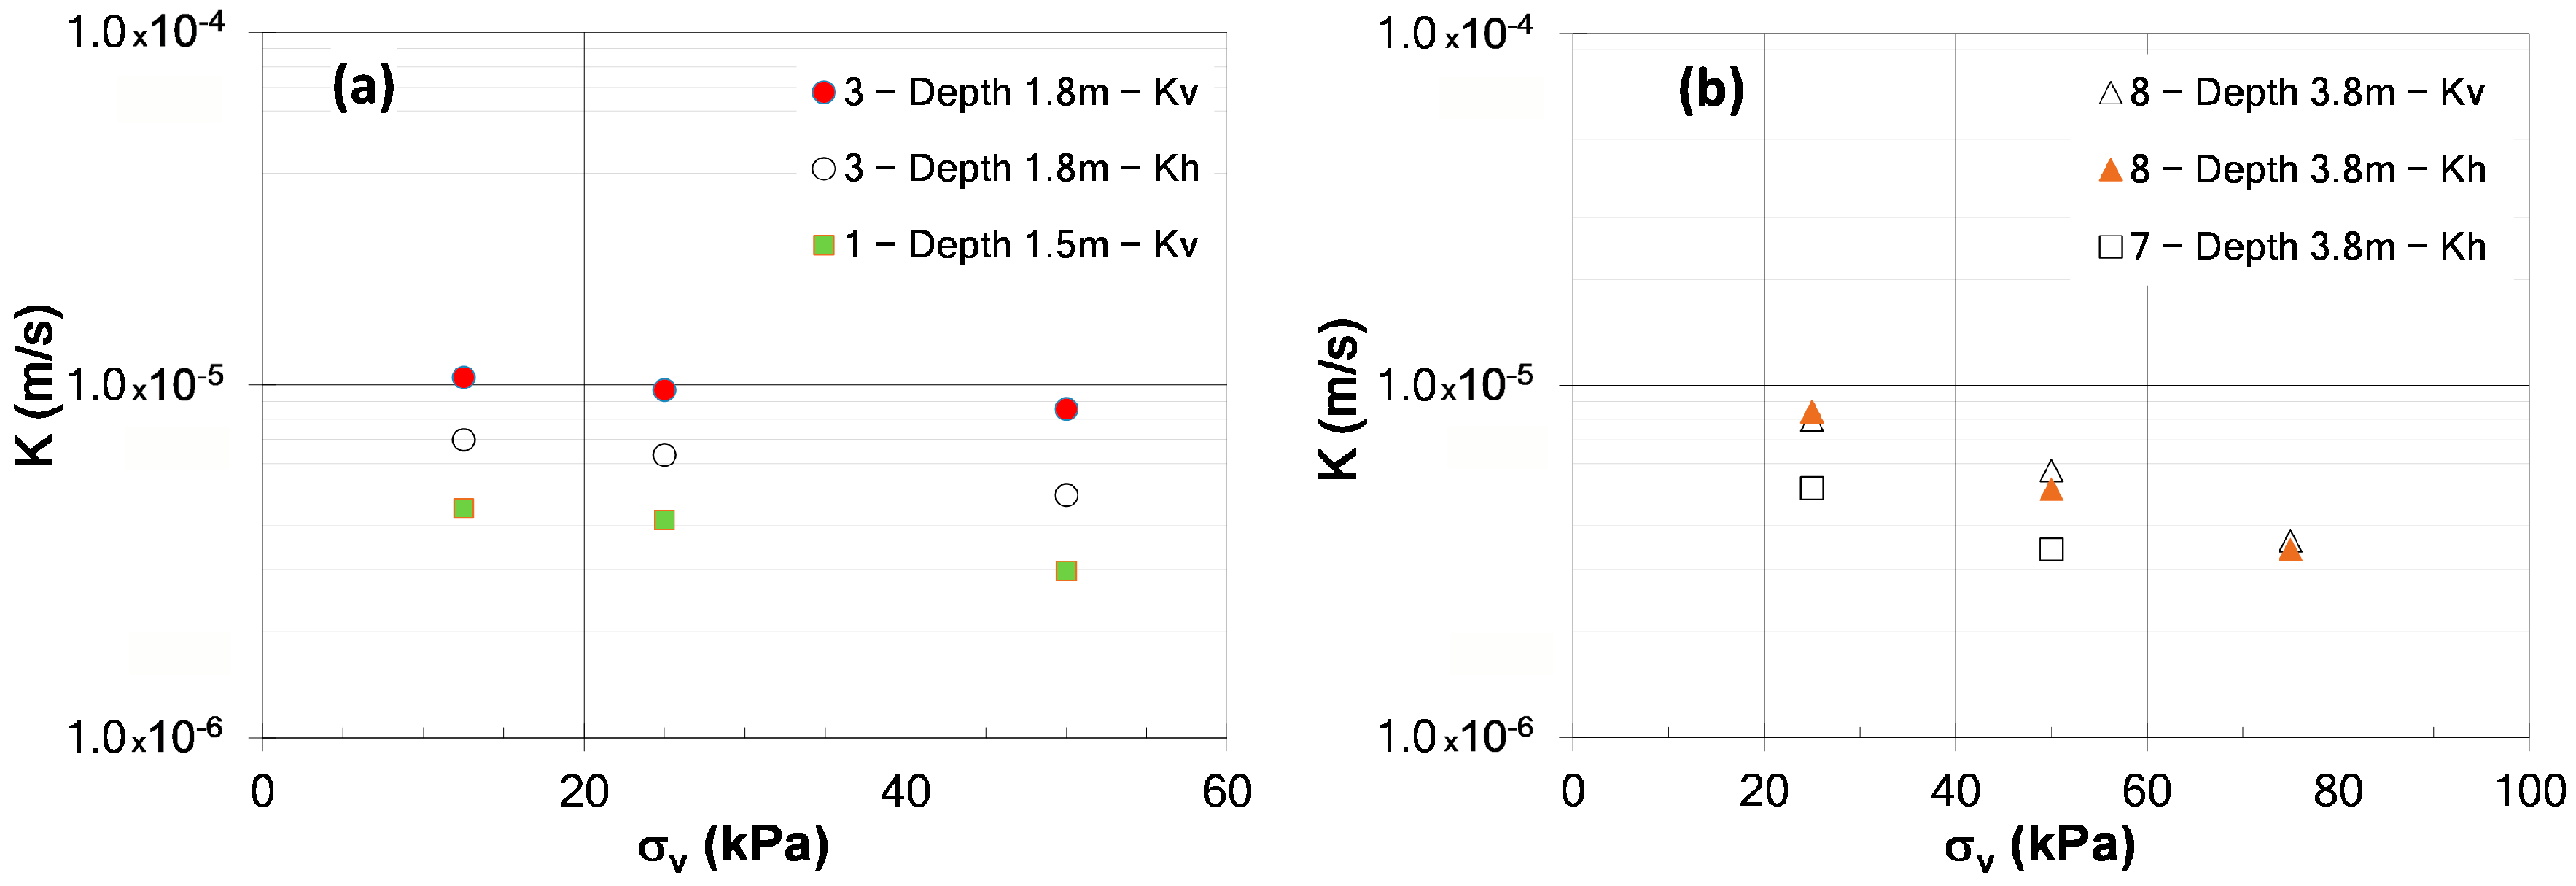
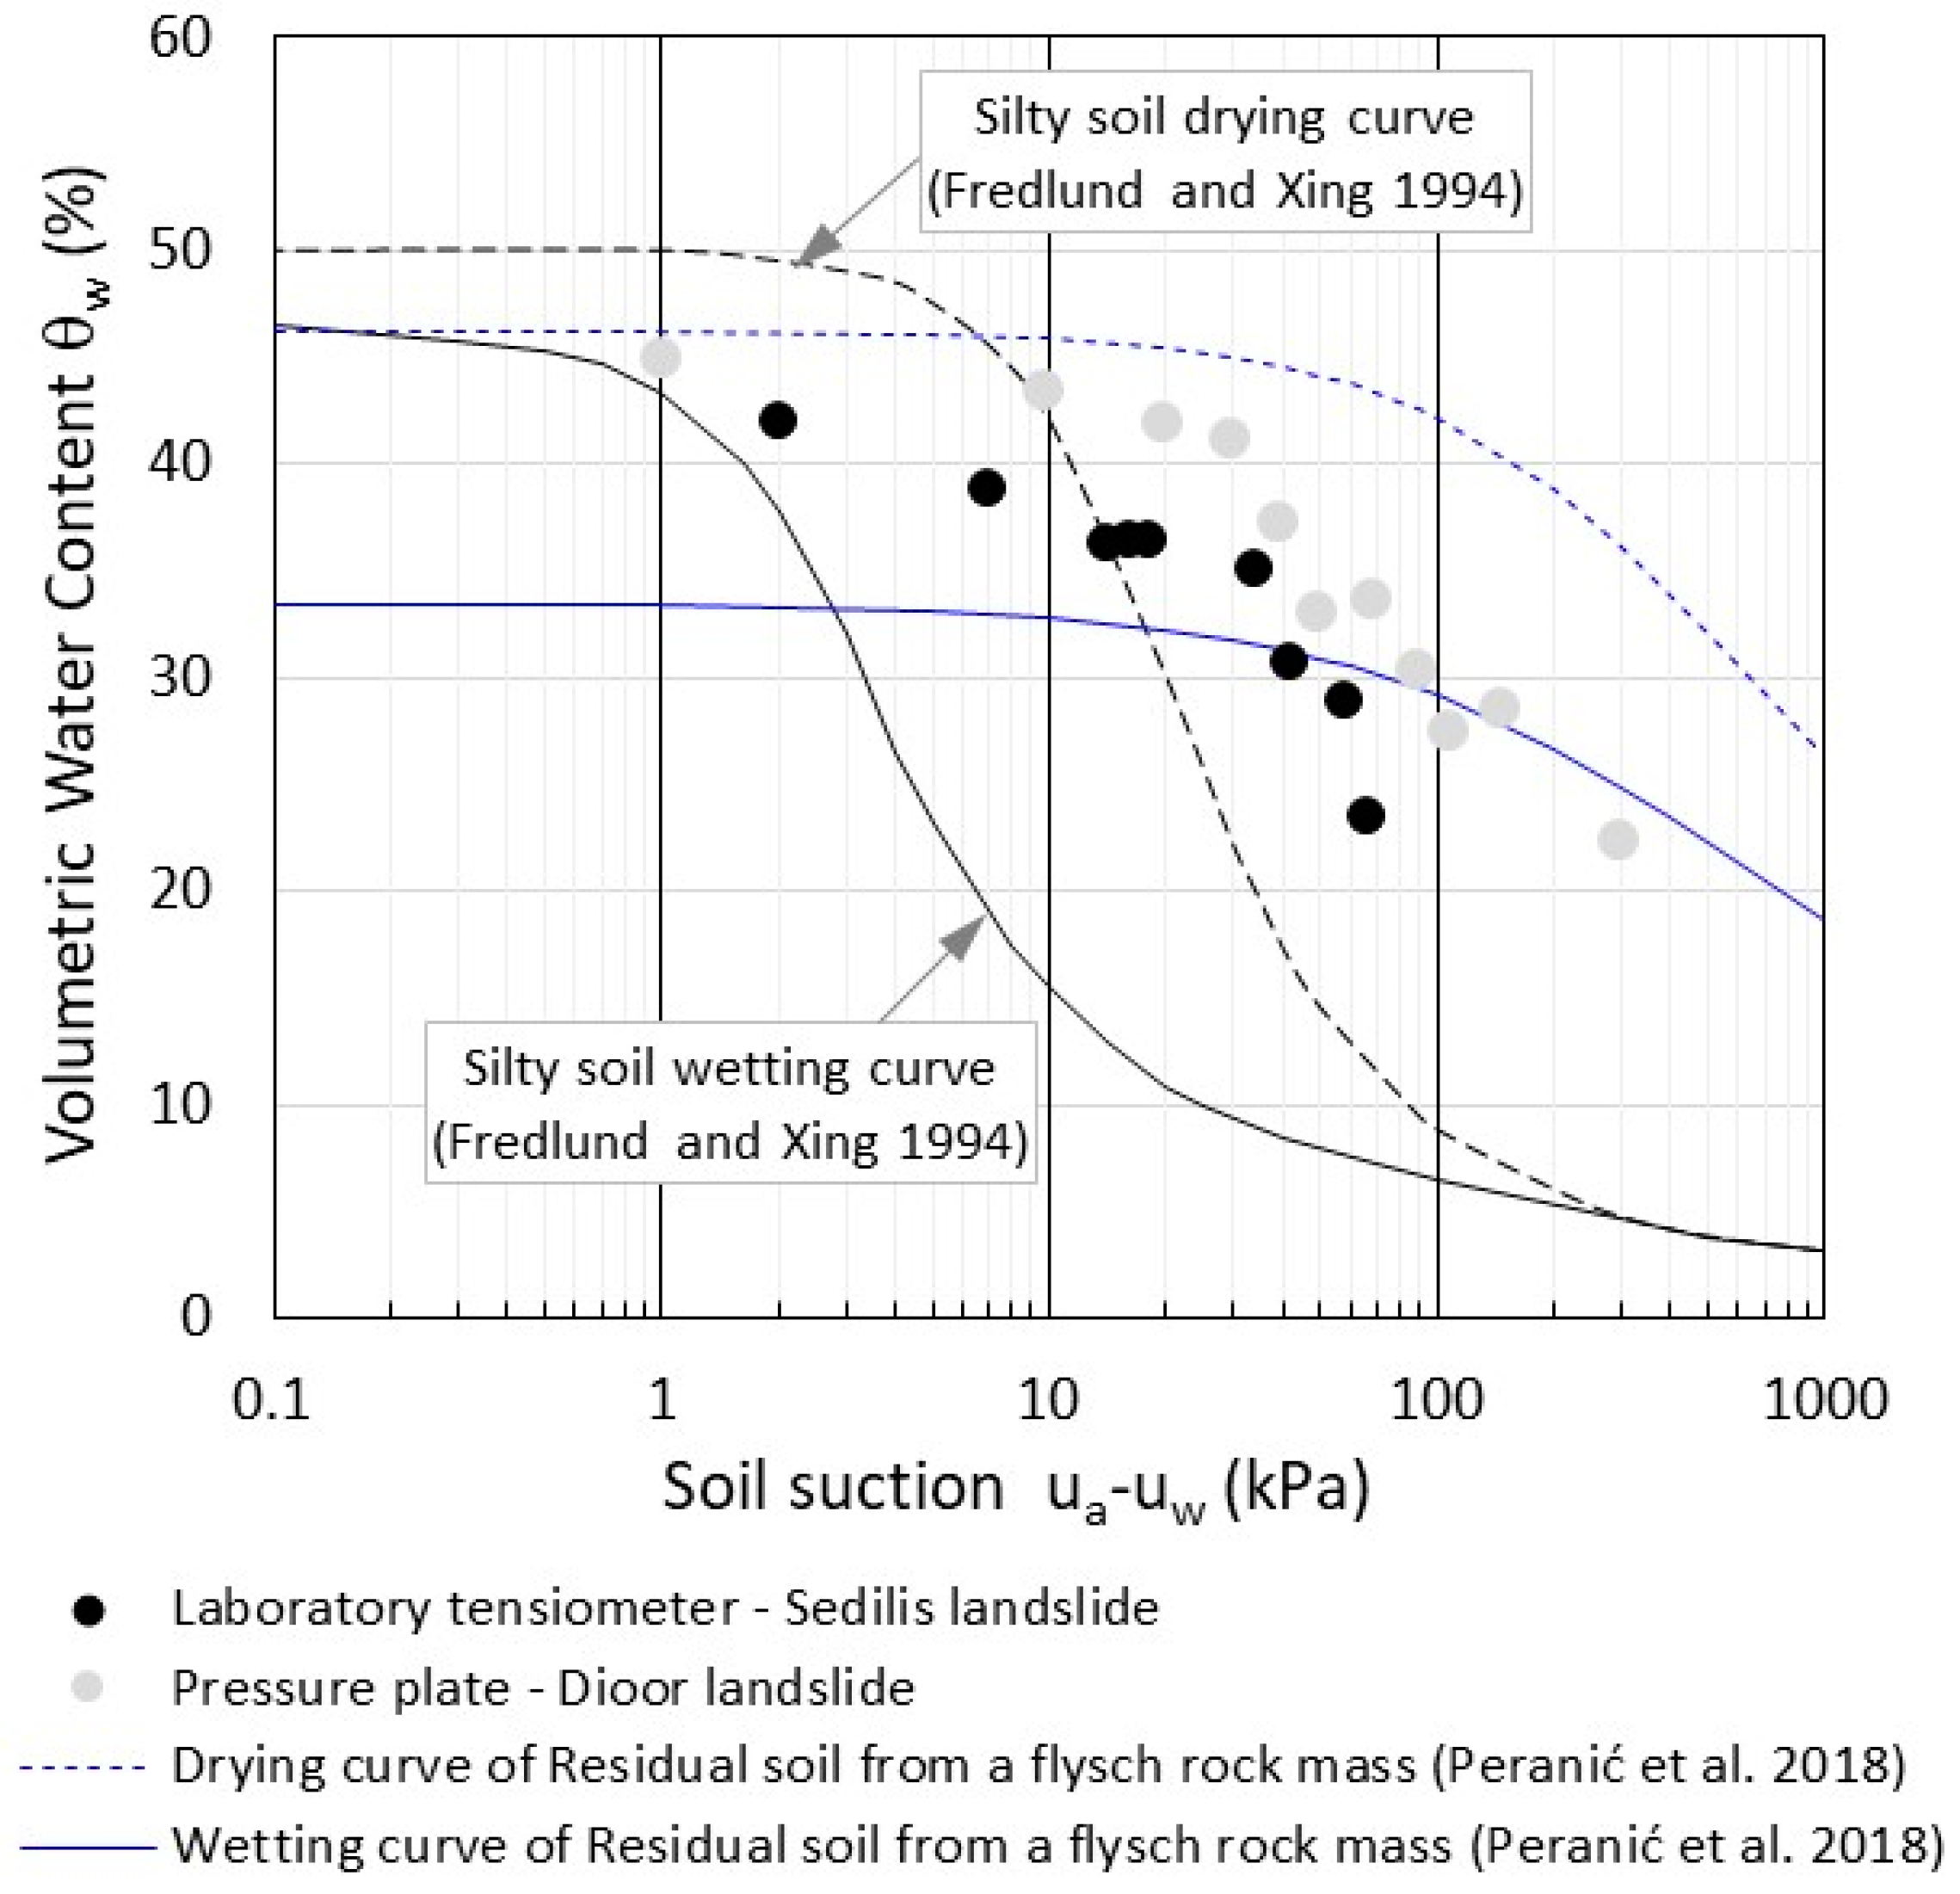
Table 1.
Grain size composition of the flysch-derived colluvial soils that were sampled at variable depths from the Sedilis landslide.
Table 1.
Grain size composition of the flysch-derived colluvial soils that were sampled at variable depths from the Sedilis landslide.
| Eastern Scarp Sample | Depth (m) | Gravel (%) | Sand (%) | Silt (%) | Clay (%) | Silt/Clay |
| C6 | 0.50 | 4.2 | 17.5 | 43.2 | 35.1 | 1.2 |
| C5 | 1.70 | 3.8 | 18.8 | 39.6 | 37.8 | 1.0 |
| C4 | 1.88 | 21.1 | 26.5 | 26.3 | 26.1 | 1.0 |
| C3 | 2.16 | 16.9 | 19.7 | 32.2 | 31.2 | 1.0 |
| C2 | 2.76 | 34.9 | 12.3 | 26.5 | 26.3 | 1.0 |
| C1 | 3.72 | 30.8 | 19.0 | 28.1 | 22.0 | 1.3 |
| Average | 18.6 | 19.0 | 32.7 | 29.8 | 1.1 | |
| St. Dev. | 13.0 | 4.6 | 7.2 | 6.0 | ||
| Var. coeff. | 70.0 | 24.0 | 22.0 | 20.2 | ||
| Western Scarp Sample | Depth (m) | Gravel (%) | Sand (%) | Silt (%) | Clay (%) | Silt/Clay |
| C10 | 2.65 | 32.5 | 21.7 | 24.1 | 21.7 | 1.1 |
| C8 | 3.65 | 30.6 | 16.4 | 28.5 | 24.6 | 1.2 |
| C6 | 4.65 | 43.0 | 16.7 | 22.1 | 18.2 | 1.2 |
| C4 | 5.55 | 27.1 | 19.1 | 28.0 | 25.8 | 1.1 |
| C2 | 6.30 | 38.3 | 15.7 | 22.8 | 23.2 | 1.0 |
| C0 | 7.10 | 32.3 | 16.2 | 25.0 | 26.5 | 0.9 |
| Average | 34.0 | 17.6 | 25.1 | 23.3 | 1.1 | |
| St. Dev. | 5.7 | 2.3 | 2.7 | 3.1 | ||
| Var. coeff. | 16.9 | 13.1 | 10.6 | 13.1 | ||
| Borehole S7 Sample | Depth (m) | Gravel (%) | Sand (%) | Silt (%) | Clay (%) | Silt/Clay |
| C1 | 1.88 | 4.9 | 40.9 | 25.9 | 28.3 | 0.9 |
| C2 | 2.53 | 6.4 | 31.0 | 31.0 | 31.6 | 1.0 |
| C3 | 3.70 | 17.6 | 18.0 | 32.5 | 31.9 | 1.0 |
| C4 | 4.28 | 39.1 | 18.1 | 30.0 | 12.8 | 2.3 |
| C5 | 8.10 | 49.5 | 25.8 | 18.7 | 6.0 | 3.1 |
| Average | 23.5 | 26.8 | 27.6 | 22.1 | 1.7 | |
| St. Dev. | 20.0 | 9.6 | 5.6 | 11.9 | ||
| Var. coeff. | 84.9 | 36.0 | 20.1 | 54.0 |
Table 2.
Index properties of the colluvial soils sampled from the scarps of the 1998 Sedilis slide.
| Eastern Scarp Sample | Depth (m) | Void Index (–) | Porosity (–) | Water Content (%) | Specific Gravity (–) | Bulk Density (nat.) (kN/m3) | Bulk Density (dry) (kN/m3) |
| C6 | 0.50 | 0.75 | 0.43 | 19 | 2.65 | 18.40 | 15.41 |
| C5 | 1.70 | 0.74 | 0.44 | 28 | 2.74 | 19.36 | 15.15 |
| C4 | 1.88 | 0.77 | 0.47 | 27 | 2.69 | 19.62 | 15.46 |
| C3 | 2.16 | 0.92 | 0.52 | 28 | 2.71 | 18.65 | 14.61 |
| C2 | 2.76 | 0.89 | 0.51 | 26 | 2.70 | 18.95 | 14.98 |
| C1 | 3.72 | 0.66 | 0.41 | 22 | 2.69 | 20.40 | 16.75 |
| Average | 0.79 | 0.46 | 25 | 2.70 | 19.23 | 15.39 | |
| St. Dev. | 0.10 | 0.04 | 3.5 | 0.03 | 0.73 | 0.73 | |
| Var. coeff. | 12.2 | 9.4 | 14.0 | 1.2 | 3.8 | 4.8 | |
| Western scarp Sample | Depth (m) | Void index (–) | Porosity (–) | Water content (%) | Specific Gravity (–) | Bulk density (nat.) (kN/m3) | Bulk density (dry) (kN/m3) |
| C10 | 2.65 | 0.71 | 0.43 | 24 | 2.62 | 20.21 | 16.33 |
| C8 | 3.65 | 0.78 | 0.45 | 26 | 2.74 | 19.61 | 15.61 |
| C6 | 4.65 | 0.59 | 0.38 | 22 | 2.69 | 21.17 | 17.37 |
| C4 | 5.55 | 0.70 | 0.43 | 23 | 2.70 | 20.76 | 16.47 |
| C2 | 6.30 | 0.75 | 0.43 | 28 | 2.73 | 19.78 | 15.50 |
| C0 | 7.10 | 0.69 | 0.42 | 26 | 2.75 | 20.37 | 16.21 |
| Average | 0.70 | 0.42 | 25 | 2.70 | 20.32 | 16.25 | |
| St. Dev. | 0.07 | 0.02 | 2.1 | 0.05 | 0.59 | 0.68 | |
| Var. coeff. | 9.2 | 5.7 | 8.4 | 1.9 | 2.9 | 4.2 |
Table 3.
Values of the residual friction angle of the colluvial soils sampled from the eastern and western lateral scarps and borehole S7.
Table 3.
Values of the residual friction angle of the colluvial soils sampled from the eastern and western lateral scarps and borehole S7.
| E Scarp Sample | Depth (m) | Distance from Bedrock (m) | Clay Fraction CF * (%) | Plasticity Index PI (%) | Residual Friction Angle ϕ’r (°) |
|---|---|---|---|---|---|
| C6 | 0.50 | 3.22 | 37.8 | 18.7 | 29 |
| C5 | 1.70 | 2.02 | 40.1 | 22.3 | 25 |
| C4 | 1.88 | 1.84 | 34.0 | 17.6 | 29 |
| C3 | 2.16 | 1.56 | 41.0 | 13.9 | 23 |
| C2 | 2.76 | 0.96 | 43.4 | 18.9 | 19 |
| C1 | 3.72 | 0.00 | 36.1 | 16.4 | 17 |
| Average | 38.7 | 18.0 | 24 | ||
| St. Dev. | 3.4 | 2.8 | 5 | ||
| Var. coeff. | 8.9 | 15.6 | 21 | ||
| Western Scarp Sample | |||||
| C10 | 2.65 | 4.45 | 38.0 | 20.9 | 26 |
| C8 | 3.65 | 3.45 | 40.4 | 16.8 | 23 |
| C6 | 4.65 | 2.45 | 38.2 | 18.5 | 19 |
| C4 | 5.55 | 1.55 | 41.3 | 15.4 | 16 |
| C2 | 6.30 | 0.80 | 44.9 | 15.6 | 16 |
| C0 | 7.10 | 0.00 | 47.0 | 17.4 | 17 |
| Average | 41.6 | 17.4 | 20 | ||
| St. Dev. | 3.6 | 2.1 | 4 | ||
| Var. coeff. | 8.7 | 11.8 | 21 | ||
| Borehole S7 Sample | |||||
| C1 | 1.88 | 14.10 | 32.4 | 15.6 | 28 |
| C2 | 2.53 | 13.50 | 36.2 | 19.6 | 24 |
| C3 | 3.70 | 12.30 | 41.5 | 19.1 | 24 |
| C4 | 4.28 | 11.70 | 24.8 | 14.9 | 23 |
| C5 | 8.10 | 7.90 | 14.2 | 13.8 | 30 |
| Average | 29.8 | 16.6 | 26 | ||
| St. Dev. | 10.6 | 2.6 | 3 | ||
| Var. coeff. | 35.7 | 15.6 | 12 |
* Clay Fraction of the reconstituted samples subjected to torsional residual shear tests.
Table 4.
Values of the peak and residual friction angle of the colluvial samples, measured with the Casagrande direct shear box.
Table 4.
Values of the peak and residual friction angle of the colluvial samples, measured with the Casagrande direct shear box.
| Sample | Depth (m) | Peak Friction Angle ϕ’P (°) | Peak Cohesion c’P (kPa) | Residual Friction Angle ϕ’r (°) | Residual Cohesion c’r (kPa) |
|---|---|---|---|---|---|
| Eastern scarp—C1 | 3.72 | 38 | 6 | 33 | 0 |
| Western scarp—C0 | 7.10 | 33 | 11 | 31 | 0 |
Table 5.
Results of the variable head permeability test (oedometer) performed at different consolidation pressures on colluvial samples collected from the 2014 scarp.
Table 5.
Results of the variable head permeability test (oedometer) performed at different consolidation pressures on colluvial samples collected from the 2014 scarp.
| 2014 Scarp Sample | Depth (m) | Vertical Pressure σV (kPa) | Vertical Permeability KV (m/s) | Horizontal Permeability KH (m/s) |
|---|---|---|---|---|
| 0 | 0.5 | 13 | - | 2.7 × 10⁻⁶ |
| 0 | 0.5 | 25 | - | 1.9 × 10⁻⁶ |
| 0 | 0.5 | 50 | - | 1.1 × 10⁻⁶ |
| 1 | 1.5 | 13 | 4.5 × 10⁻⁶ | - |
| 1 | 1.5 | 25 | 4.1 × 10⁻⁶ | - |
| 1 | 1.5 | 50 | 3.0 × 10⁻⁶ | - |
| 3 | 1.8 | 13 | 1.1 × 10⁻⁵ | 7.0 × 10⁻⁶ |
| 3 | 1.8 | 25 | 9.7 × 10⁻⁶ | 6.3 × 10⁻⁶ |
| 3 | 1.8 | 50 | 8.5 × 10⁻⁶ | 4.9 × 10⁻⁶ |
| 7 | 3.8 | 25 | - | 5.1 × 10⁻⁶ |
| 7 | 3.8 | 50 | - | 3.4 × 10⁻⁶ |
| 7 | 3.8 | 100 | - | 9.6 × 10⁻⁷ |
| 8 | 3.8 | 25 | 8.0 × 10⁻⁶ | 8.5 × 10⁻⁶ |
| 8 | 3.8 | 50 | 5.7 × 10⁻⁶ | 5.1 × 10⁻⁶ |
| 8 | 3.8 | 75 | 3.6 × 10⁻⁶ | 3.4 × 10⁻⁶ |
Table 6.
Values of the vertical permeability of colluvial soils determined with Shelby (field) and oedometer (laboratory) steel cylinders at low lithostatic vertical pressures.
Table 6.
Values of the vertical permeability of colluvial soils determined with Shelby (field) and oedometer (laboratory) steel cylinders at low lithostatic vertical pressures.
| 2014 Scarp Sample | Depth (m) | Vertical Pressure σV (kPa) | Vertical Permeability KV (m/s) | Type of Test | Method |
|---|---|---|---|---|---|
| 9 | 0.5 | 2 | 1.2 × 10⁻⁴ | In situ | variable head |
| 9 | 0.5 | 2 | 7.0 × 10⁻⁵ | Laboratory | constant head |
| 8 | 3.8 | 2 | 7.8 × 10⁻⁵ | In situ | variable head |
| 8 | 3.8 | 2 | 7.7 × 10⁻⁶ | Laboratory | variable head |
Table 7.
Average grain size composition of flysch-derived colluvial soils from the literature.
| Reference | Gravel (%) | Sand (%) | Silt (%) | Clay (%) |
|---|---|---|---|---|
| Logar et al. 2005 [65] | 27 | 25 | 40 | 8 |
| Fifer Biziac and Zupančič 2009 [66] | 28 | 12 | 44 | 16 |
| Petkovšek et al. 2013 [67] | 38 | 17 | 30 | 15 |
| Meisina and Scarabelli 2007 [30] | 0 | 14 | 49 | 37 |
| Carrubba and Del Fabbro 2006, 2008 [68,69] | 5 | 20 | 35 | 40 |
| Peranić et al. 2020 [56] | 6.3 | 10.4 | 53 | 30.3 |
Disclaimer/Publisher’s Note: The statements, opinions and data contained in all publications are solely those of the individual author(s) and contributor(s) and not of MDPI and/or the editor(s). MDPI and/or the editor(s) disclaim responsibility for any injury to people or property resulting from any ideas, methods, instructions or products referred to in the content. |
© 2024 by the authors. Licensee MDPI, Basel, Switzerland. This article is an open access article distributed under the terms and conditions of the Creative Commons Attribution (CC BY) license (https://creativecommons.org/licenses/by/4.0/).
Share and Cite
MDPI and ACS Style
Del Fabbro, M.; Paronuzzi, P.; Bolla, A. Geotechnical Characterisation of Flysch-Derived Colluvial Soils from a Pre-Alpine Slope Affected by Recurrent Landslides. Geosciences 2024, 14, 115. https://doi.org/10.3390/geosciences14050115
AMA Style
Del Fabbro M, Paronuzzi P, Bolla A. Geotechnical Characterisation of Flysch-Derived Colluvial Soils from a Pre-Alpine Slope Affected by Recurrent Landslides. Geosciences. 2024; 14(5):115. https://doi.org/10.3390/geosciences14050115
Chicago/Turabian StyleDel Fabbro, Marco, Paolo Paronuzzi, and Alberto Bolla. 2024. "Geotechnical Characterisation of Flysch-Derived Colluvial Soils from a Pre-Alpine Slope Affected by Recurrent Landslides" Geosciences 14, no. 5: 115. https://doi.org/10.3390/geosciences14050115
Note that from the first issue of 2016, this journal uses article numbers instead of page numbers. See further details here.