1. Introduction
Landslide hazard zonation is fundamental to manage urban expansion in mountain areas [
1,
2]. However, especially for slow and very slow movements [
3], the procedure to follow is not defined a priori and has to be based on the integration of different techniques specifically chosen for the area under examination [
4,
5]. Nevertheless, slow and very slow moving landslides can still continue to damage buildings and infrastructures [
6] and local authorities must be provided with sound landslide hazard maps to guarantee an appropriate degree of safety to properties and people [
7]. When anthropic pressure is elevated, inaccuracy in the definition of landslide boundaries can also lead to a significant economic loss. This is particularly important in the prestigious location of the Cortina valley (eastern Italian Alps), in the heart of the Dolomites, a United Nations Educational, Scientific and Cultural Organization (UNESCO) world heritage site, where the prices of the apartment are about 10.000 €/m
2 [
8].
The Cortina municipality is subject to numerous landslide phenomena that intersect and influence the city margins [
9,
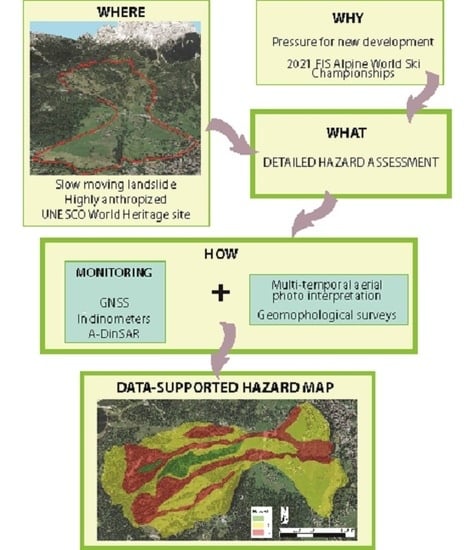
10]. In this framework a compromise between the aspiration of the owners of potential development areas and the necessity of guaranteeing safety to people has to be found. Recently, the pressure to build has increased a lot as the city has been chosen to host the 2021 FIS Alpine World Ski Championships. In this context, the construction of new buildings, infrastructures, and event facilities is expected. Mapping and assessing the activity of the Mortisa landslide is a compulsory requirement to reduce the risk since it is the site of the ski slopes selected for the races. To achieve this task, multitemporal aerial photo interpretation, Global Navigation Satellite System (GNSS) surveys, inclinometric measurements, and A-DInSAR analysis were carried out.
The integration of different techniques is effective as each method has its advantages and disadvantages. Photointerpretation and geomorphological survey allow comprehension of the distributed dynamic of the phenomenon, but do not quantify velocities, and sometimes areas with low activity may be undetected. GNSS surveys provide precise information on the displacement, but each survey is quite time-consuming and their results punctual. A-DInSAR too provides very detailed data on displacements, but the density of persistent scatterer interferometry (PSI) could vary greatly within different areas. Inclinometers are fundamental to the detection of the depth of the slip surface of a landslide, but they are expensive and difficult to install. The possibility to apply multitechnological techniques permits balancing each element’s limitations, and it also provides redundancy of data that could be extremely useful in complex environments.
Through the integration of monitoring data and geomorphological interpretation, a very detailed hazard map of the Mortisa area was produced, with the intent to assist the local authorities in the update of the urban development plan. Similar approaches have been used to map the state of activity or hazard of a specific landslide [
5,
11,
12,
13]; the novelty of this study resides in the long-term multitechnological monitoring of the landslide and on the particular location of the phenomenon that affects the expansion of a major touristic area listed in the UNESCO world heritage sites. Most of the time, literature focuses on the problems carried by anthropic pressure in developing countries, however, even in parts of Europe there is pressure to construct on landslides.
2. Study Area
The Mortisa landslide unit [
14] is located on the western flank of the Cortina valley. In this area of the Dolomites, the morphogenetic action of the Würm glaciers was very intense, and in the Late Glacial and Holocene, great landslides have profoundly changed the morphology of the slopes. The geological setting and past climatic conditions are the main predisposing factors for slope instability. A plastic substratum of marls (S. Cassiano Formation) was heavily weathered in glacial and postglacial times [
15,
16] and became a compact silty clay; its presence allows the development of low gradient slopes typically prone to landsliding [
17].
The mass movement extends for an approximate length of 3.5 km, from the crown located at 1750 m a.s.l. to the foot, in correspondence to the Boite stream bed at 1150 m a.s.l., and causes sags and cracks that damage houses, roads, retaining walls, and check dams. The landslide is composed of two different slides that converge and then separate again, crossing ski slopes and lifts; an important national road; and the settlements of Mortisa, Lacedel, and Grignes (
Figure 1). Silty clays originating from the weathering of the San Cassiano formation marls form most of the landslide body; data on the geological and geomorphological evolution of the slope can be found in [
9,
16].
In the late 1980s, urban development on the eastern side of the Cortina valley reached a plateau: in order to preserve the landscape, municipal administrators were not willing to undergo construction of tall buildings and several well-known landslides on the right flank of the Boite river were of impediment for further expansion. Therefore, greater interest focused on the possible development of the western slope, where the Mortisa landslide unit is located. Measurement campaigns with inclinometers and piezometers, performed in 1989, were focusing on the investigation of the most active part of the landslide, which is in the lowest third of the slope. The main aim was to evaluate mitigation strategies to reduce the displacements of the whole slope and to prevent road ruptures. To that extent, a series of canalizations and drainage trenches were placed along the slope to moderate the movements but were rapidly disrupted by the deformations. They are now lying within the landslide body, with the side effect that infiltration is locally further facilitated. An additional measurement campaign with new inclinometers was performed in 1991 to evaluate the effectiveness of the mitigation measures: the movements of the landslide broke the tube in only 15 days, signaling that the interventions had been ineffective. The possibility of building new housing developments within the slope was therefore discarded and the new urban development plan stated that only old buildings, likely placed in more stable areas, could be renovated and expanded.
Twenty years later, the municipality of Cortina enquired CNR-IRPI (National Research Council, Institute for Geo-Hydrological Protection) to provide a new reliable map to update the urban development plan in order to evaluate where to place new buildings and infrastructures, also in anticipation of the Alpine World Ski Championships event.
3. Methods
Multidisciplinary and multitechnological approaches are nowadays a mandatory requirement to investigate complex phenomena such as large mass movements. Qualitative and quantitative analysis provide fundamental information about the triggering mechanisms, the evolution of the landslides, and their interactions with the exposed elements. The geomorphological analysis was carried out through multitemporal aerial photo interpretation and field surveys to map the landslide, determine its extent, and define the causes of the instability processes. Through the topographic campaigns, it was possible to assess the state and style of landslide activity in terms of superficial displacement, while the depth of the failure surface and the magnitude of the displacements below the ground level were assessed by the inclinometric surveys. Finally, A-DInSAR analysis highlighted the displacements induced by the landslide to man-made structures and their evolution in time.
3.1. Geomorphological Analysis
The Mortisa landslide is characterized by the hourglass morphology of slow flowlike processes [
18,
19]. The average slope is approximately 14°, which is in line with similar phenomena [
17].
Several aerial photos dating from 1954 to 1999 for a total of 9 flights were available for photointerpretation; these images allow evaluation of the state of activity of the landslide unit in the previous decades [
20]. By means of geomorphological surveys and through the analysis of the multitemporal ortophotos, clear evidence of pronounced lateral ridges located especially in the central part and compression ridges at the toe was found. This is further proof of the presence of unremitting slow movements. Two large basal fans in the lower part of the landslide unit are present: the first is located where the settlement of Mortisa lies, the second is where the village of Grignes is located (
Figure 2). At the toe, the fans are eroded by the Boite stream which induces small local instabilities. The small quantities of sediment accumulated in the riverbed are rapidly carried away by the stream, without causing any river dam.
In the scarp area, characterized by steeper slopes, the retrogressive slide rotates partially and provides energy and sediment to the movement. These small instabilities, in relation to the size of the phenomenon as a whole, contribute to the rearrangement of the material resulting from the weathering and failure of the plastic S. Cassiano formation. In this area, back-tilted trees and counterslopes that host marshy areas can be observed. Furthermore, numerous natural springs are present but the superficial drainage network is chaotic and unable to collect all the water due to the progressive disarticulation of the slope that continuously changes the local morphology. This contributes to the instabilities since the impounding in the upper part of the slope modifies the hydrological balance of the catchment and the pore water pressure regime. Moreover, the maintenance work of the ski slope aggravates this issue: funnels and improvised channelizations are built every year to avoid the formation of small streams along the ski slopes, and broken pipes of previous interventions are left in the soil. Finally, deformations also cause deep lacerations in the sward and the complete destruction of the forest cover becomes a destabilizing factor as it further facilitates water infiltration.
In the track zone, several small trenches usually open during snowmelt, and damage on the road network, like cracks and bumps, are pieces of evidence of ongoing deformations. In this area the most rapidly evolving tongues are clearly identifiable by the surface roughness characterized by more humps than the surrounding pastures. Below, in correspondence of the two fans of Mortisa and Grignes, the slope decreases significantly and the two landforms are well developed, the latter showing the most obvious signs of activity with the presence of transversal trenches and fractures. Three tongues that show signs of greater activity are present even in the lowest part of the landslide unit: one is directed towards the village of Grignes, the other flows where the countermeasure work was placed in 1989, and the last one follows the central stream.
3.2. Inclinometric Measurements
Part of the activity of CNR-IRPI was the installation of three inclinometers, placed near the already present settlements in areas with lower activity, so as to likely follow the displacement for longer periods and to determine the depth of the slip surface. The inclinometers of the 1989 and 1991 campaigns, in fact, broke within some weeks because they were placed along the most active slide (
Figure 3). They intersected the slip surface at a depth that encompassed between 7.5 and 10.5 m below the ground surface, even though there were signs of the presence of a deeper slip surface.
Due to the scarcity of economic resources and to the focus of the study to possible urbanization, the new inclinometers were placed in the lowest part of the landslide.
Inclinometer S1, which is located in the village of Mortisa, showed the presence of a distinct slip surface at 40–42 m below ground surface; the displacements follow a linear trend with a velocity of approximately 1.5 cm/year. Borehole S2 was placed near the settlement of Lacedel in an area which was previously supposed to be stable. However, the instrument measured a small displacement of nearly constant velocity (5 mm/year) localized at 21 m below ground surface. In inclinometer S3 the slip surface is at 34 m below ground surface at the contact between a thick layer of silty clay and an underlying gravel layer. The displacements follow a linear trend of 7.5 mm/year.
In
Figure 4 the trends of the displacements along the slip surface for each of the three boreholes are presented. The first measures were discarded from the linear interpolations to avoid possible errors due to the consolidation of the soil after the installation. It is possible to appreciate that the trend of displacement is almost linear, i.e., velocity is constant, a typical behavior for the accumulation area of these types of landslides [
21].
3.3. Topographic Campaigns
The Global Navigation Satellite System (GNSS) monitoring network was installed in July 2008 and it originally consisted of one control point, located in a stable area at the margins of the landslide unit, and of 30 benchmarks distributed over the unstable slope. During the time of the measurement campaigns some benchmarks were lost and others were newly installed; in fact, most of the benchmarks that were placed on the road pavements were lost due to maintenance works carried out to repair the damages induced by the movements of the landslide. The benefit that may come from the integration of A-DInSAR analysis with GNSS data is extremely valuable. In fact, GNSS measurements provided relevant information in areas where interferometry was not suitable as a consequence of rates of displacement too high to be detected or of the absence of natural radar reflectors (i.e., buildings, exposed rocks, etc.). Between July 2008 and April 2012, eight relative fast-static positioning surveys [
22] were carried out. The position of each benchmark was determined with respect to a single known point which is located in a stable area (MASTER benchmark in
Figure 5). Data were post-processed using precise ephemeris with the commercial software LEICA Geo-Office. Specifications on the instrumentation and on survey strategies are shown in
Table 1. The accuracy achieved with the GNSS measurements expressed in terms of standard deviation is reported in
Table 2.
Data clearly show the presence of areas of larger activity, with velocities in the order of m/year, and others where the displacement rates are much lower, around cm/year. The southern landslide, where the village of Mortisa lies, shows lower displacement rates than the northern one. These results are coherent with the geomorphological evidence (
Figure 5).
The most significant displacements correspond to the central tongue, a matter of investigation of the 1989–1991 campaign. However, also a check dam, monitored by benchmark 7, is moving more than 80 cm/year. The fact that this structure does not show any signs of damage is a consequence of the large lateral extension and depth of the landslide sliding surface.
Further, benchmarks 10 and 11 show subsidence: this may increase the risk of flooding for the inhabitants of the houses located downslope. Moreover, the drainage pattern of the slope may be diverted if the elevation of that area continues to decrease (
Figure 6).
3.4. A-DInSAR Analysis
The interferometric analysis was carried out from a set of 35 ENVISAT ASAR images acquired from April 2004 until October 2010. The PS (Persistent Scatterers) analysis was performed using the IPTA (interferometric point target analysis) technique [
23] that is part of the broad family of the PSI (Persistent Scatterer Interferometry) approaches [
24]. Using a single master image, 34 interferograms were generated. The SRTM (Shuttle Radar Topography Mission) digital elevation model [
25] was used to generate the synthetic phase image that was subtracted to the interferograms in order to reduce the topographic phase related term. The PSCs (persistent scatterers candidates) list was identified with the use of two algorithms: one inspecting the spectral characteristics and the dominating backscattering of the pixels in individual full-resolution images, the other examining their intensity variability through the entire data stack. IPTA algorithm performs a bidimensional regression in time and space of the differential interferometric phase. The calculation is performed several times and at the end of each iteration the model parameters are updated. The residuals between measurement and model data at each target position are related to the uncertainty of the measurement due to uncompensated topography, orbital errors, thermal noise, and atmospheric heterogeneity. At the end of the calculation the residuals are filtered with the aim of isolating the phase term related to the displacement.
The IPTA analysis allowed the displacements of 1048 PS in the Cortina area to be measured. The phase variations were converted in linear velocities along the line of sight of the radar (23° in respect to the vertical) and are represented as a color map, in
Figure 7.
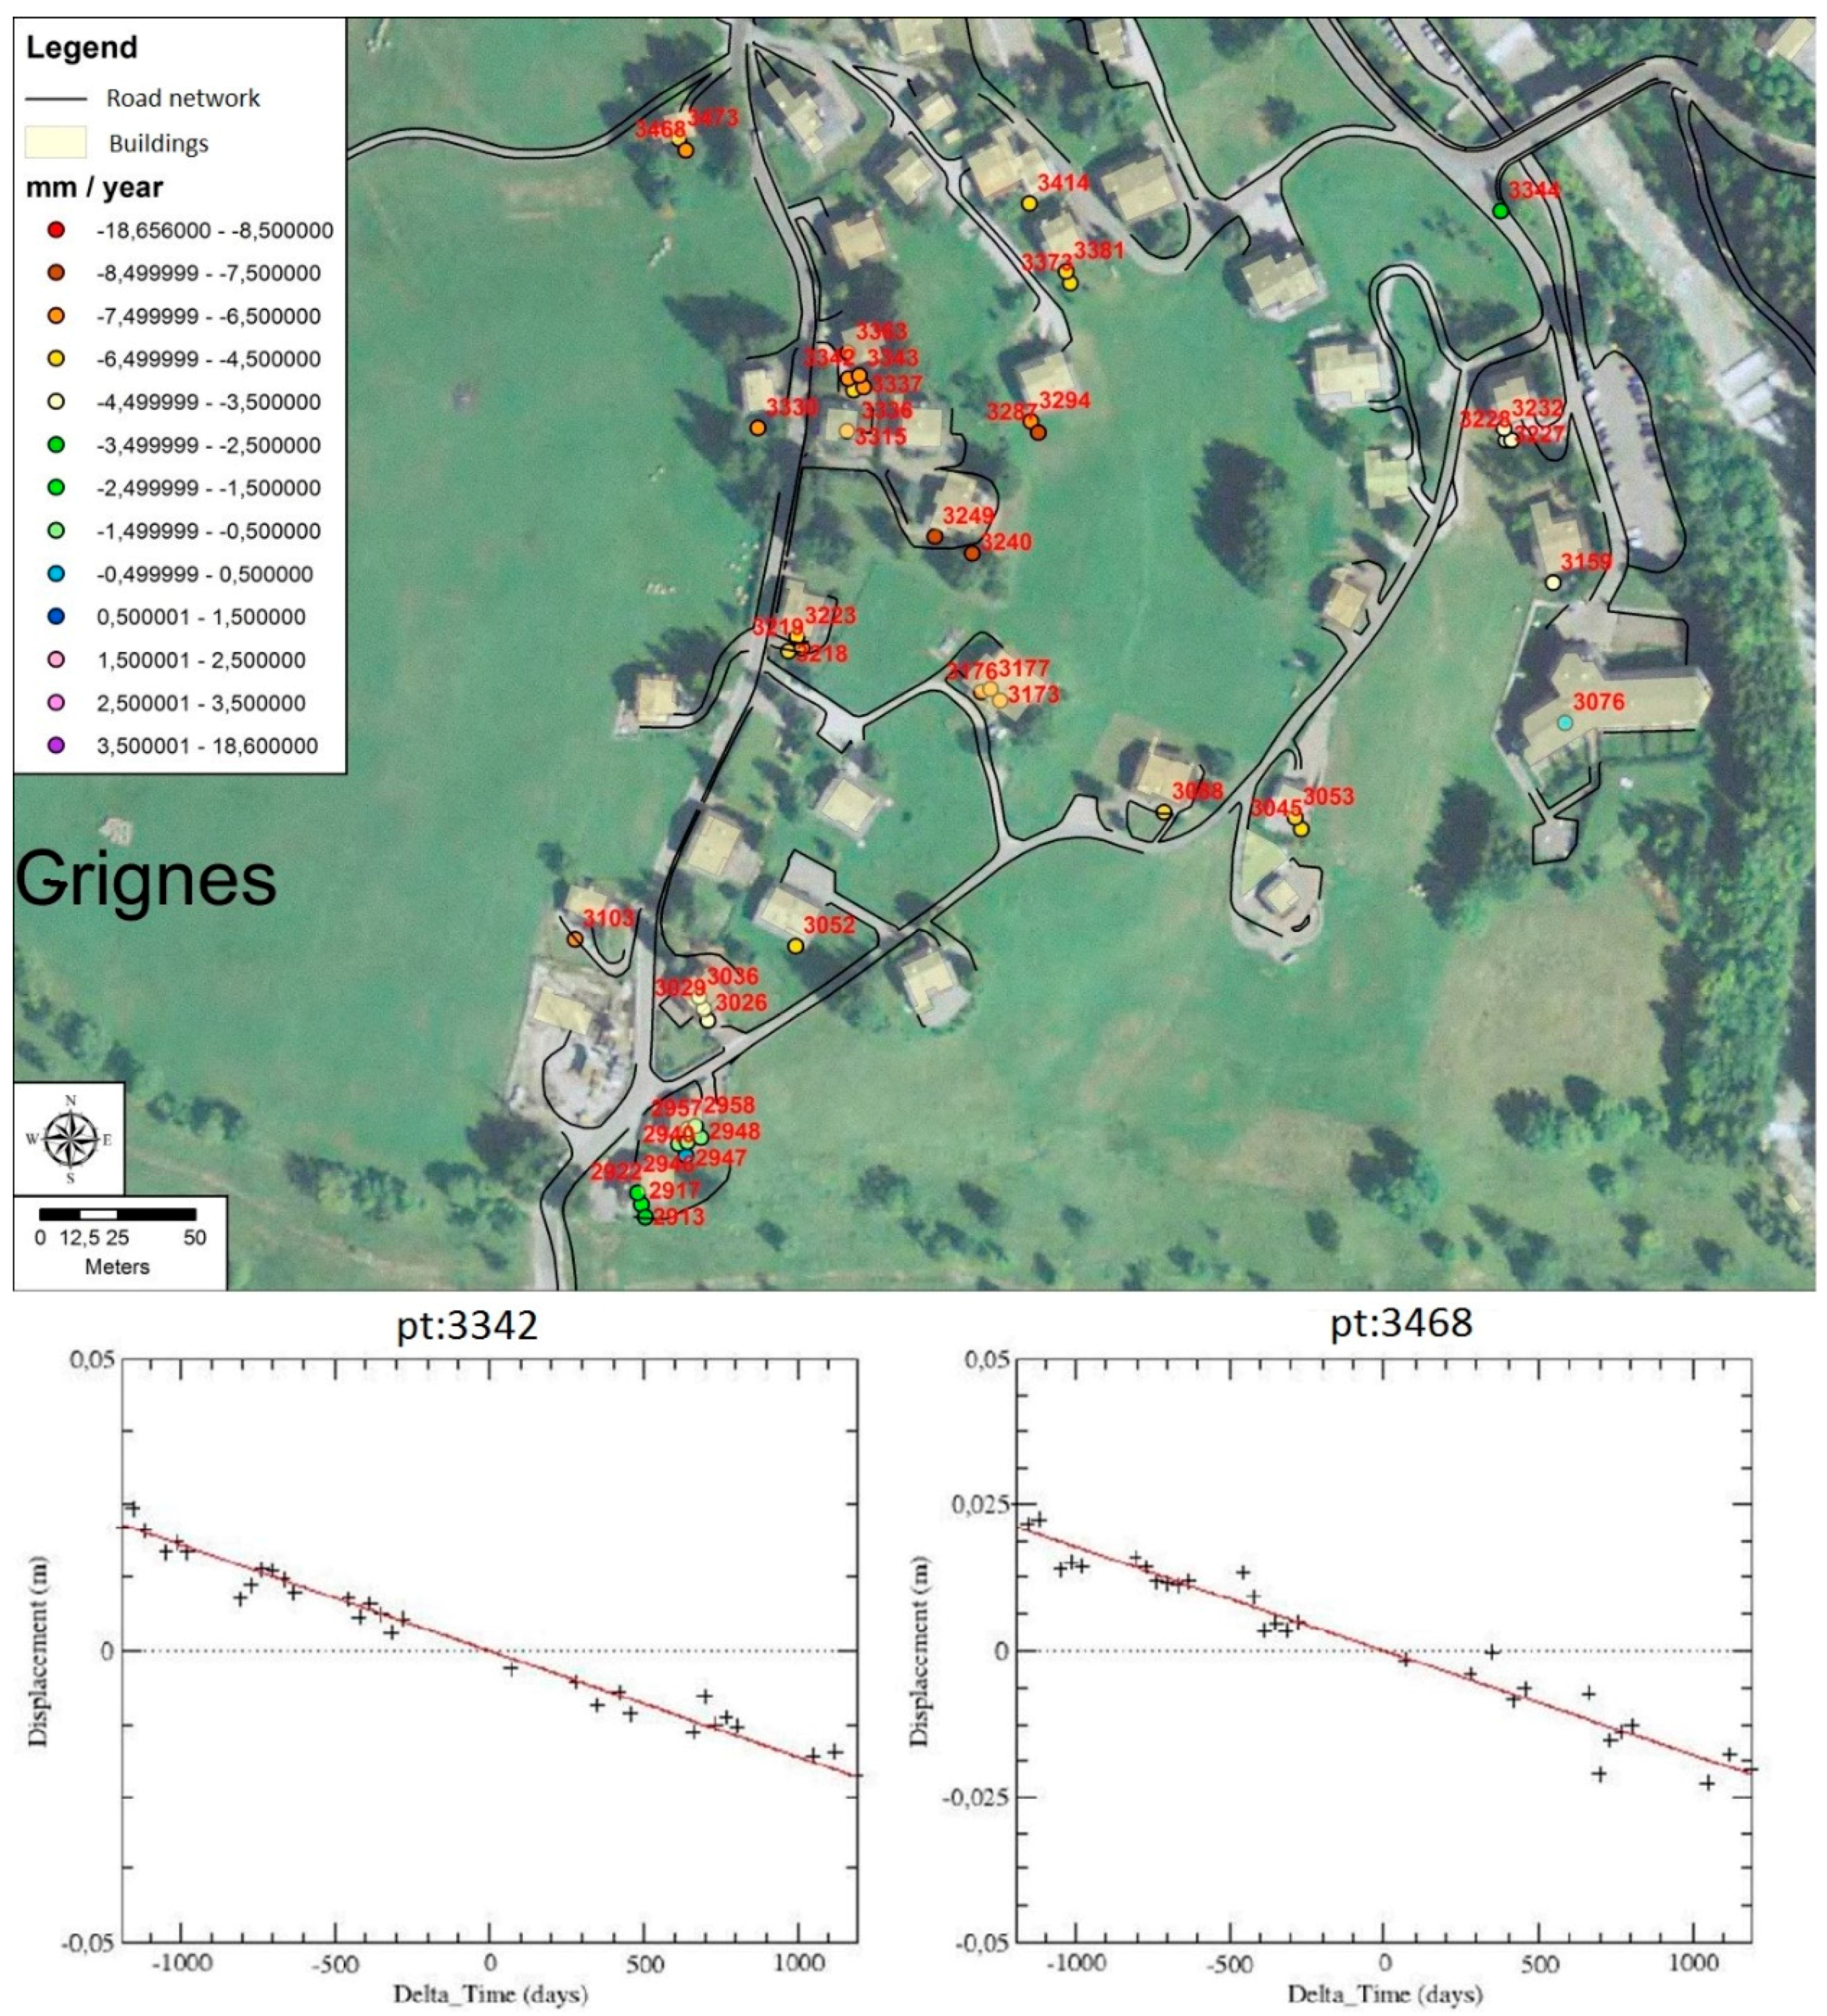
The displacements were also analyzed at a smaller scale to estimate the movements of the settlements. In
Figure 8 an example for the village of Grignes is illustrated, where most of the buildings are moving. In this area, no geomorphological evidence was suggesting the presence of displacement, and GPS measurements—due to accuracy issues and to the loss of most benchmarks—were not detecting movements. However, the landslide is also active here, as A-DInSAR data clearly show; the displacements are mostly lower than a cm/year, which is still enough to damage poorly designed and maintained infrastructures on the long run. This is especially true for linear facilities like drainage systems and waterworks; therefore, the information on the presence of displacements is valuable for the local authorities.
4. Discussion
An integrated approach comprising geomorphological analysis, inclinometric measurements, topographic campaigns, and A-DINSAR was applied to study a highly anthropized area. The use of multiple tools leads to a clear picture of the phenomenon that could be used for a new urban development plan.
A first assessment and mapping of the Mortisa landslide was made by visual multitemporal aerial photo interpretation. The geomorphological survey served also as a baseline for the definition and the project of the integrated monitoring network.
The GNNS displacements analysis isolated two stable benchmarks (i.e., points 6 and 23) that did not record any significant planar and vertical displacement. On the other hand, the benchmarks 9, 10, 11, 20, 21, and 22 (located at the downslope with the respect of the national road) have recorded major shifts, reaching a maximum horizontal displacement of 2.60 m and a lowering of about 60 cm in height.
The A-DInSAR analysis allowed the detection of smaller movements in areas where no other evidence of displacement was available. The campaign effectively revealed a state of activity for areas that were previously considered stable.
Inclinometers, which were placed in less active parts of the landslide, show a linear trend of displacements and revealed well-developed deep slip surfaces. These two elements support the evidence of little or no damage to buildings on the slower moving parts of the landslide unit. Therefore, it is possible to hypothesize that in the lesser active areas the sliding mass moves as a rigid body over the slip surface and the shear zone does not intercept the foundations of the buildings, which are substantially unaffected.
To further confirm these findings and to assess the potential risk for all the preexisting buildings in the study area, a survey on the cracks on the structures’ walls was performed. Few damages were found, and a correlation analysis with GNSS data and A-DInSAR data was carried out to check if they could be related to the recorded displacements.
In
Figure 9 an example of the data provided to the municipality is shown. The different degrees of displacements in the slope can be appreciated in great detail: this is an indication of the conditions and the risk to which every single structure is subjected. The map shows that buildings 1–5 are placed in relatively safe areas. Correspondingly, they present only small cracks that do not affect the overall safety of the structure. Moreover, the cracks of houses 2 and 3 are probably due to the age of the building rather than by the small and uniform displacements recorded. Building 4 is close to the border of a highly active area along the stream but the margins of the slide seems well defined and not endangering the structure.
On the other hand, building 6, a former restaurant, is completely shattered; this corresponds to the high activity of the landslide tongue over which it is built. The building was built just after the maintenance works of 1989, as it was supposed that the intervention would have stopped or mitigated the displacements. However, progressive damage ensued and legal disputes on the responsibilities between owners, municipality, and countermeasure work designers are ongoing ever since. Twenty years later the area is still quite active and construction on this site is still to be avoided.
Through the integration of all the data collected it was possible to produce the hazard map at a 1:5000 scale, the typical value for detailed hazard maps [
26]. The hazard map was produced following the Tagliavini (2007) [
27] approach that is based on the Swiss Confederation semi-deterministic method BUWAL [
28]. Where monitoring data were available, that is for the lowest part of the slope, the threshold of displacement of Tagliavini (2007), which defines three classes of velocity to evaluate possible structural damages (above 3 m per year, below 10 cm per year, and the intermediate class), was used. When direct measurements were not available, the rate of displacement was inferred by photointerpretation and other geomorphological evidences. All the inclinometers show thickness above 15 m so the highest level of magnitude was assigned. For the probability of occurrence, a geotechnical evaluation was carried out: following the work of Picarelli (2000) [
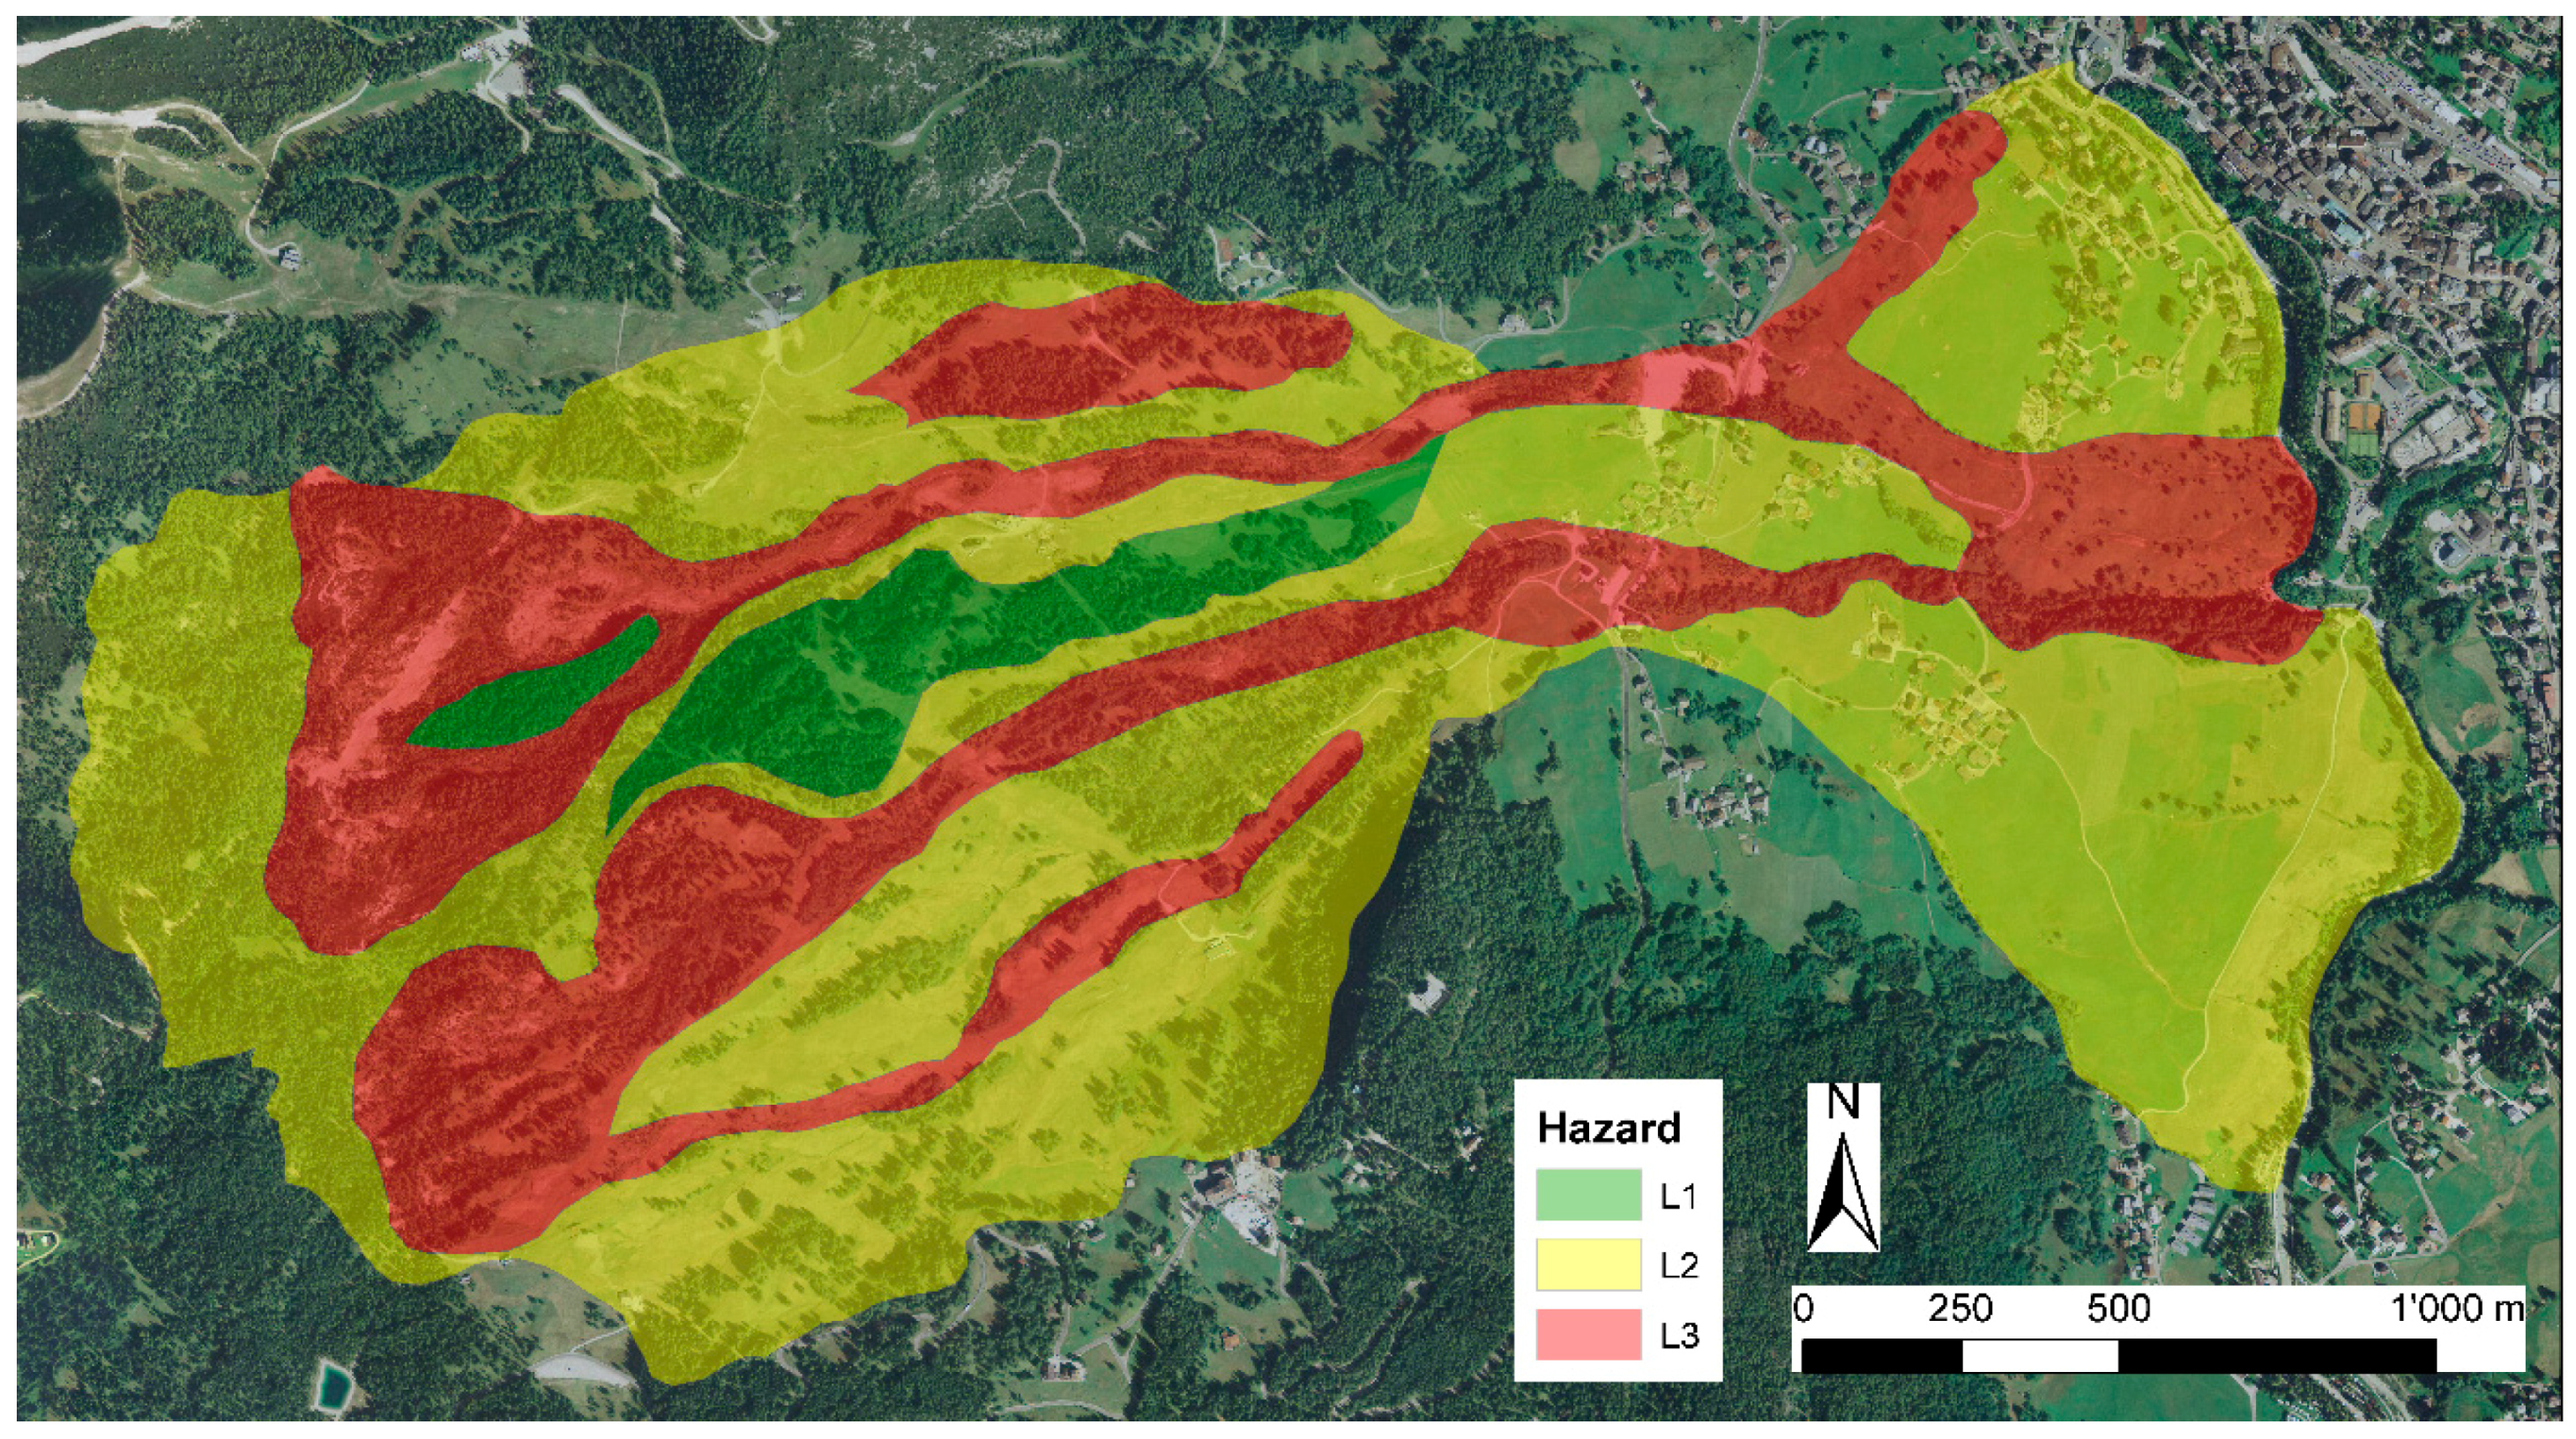
29] the landslide seems, in the lesser active zones, in the final evolutionary stage. The fact that inclinometers show a distinct and well-developed localized slip surface supports this hypothesis. For these zones of the landslide unit, owing also to the fact that the steepness of the slope is almost constant as the small rate of displacement, it is possible to consider a very low probability of a major catastrophic failure. In this case the hazard level assigned in the hazard map was L2. The other class of hazards are L3, where measured velocity exceeds 10 cm per year and where geomorphological evidence of large displacements are present, and L1, areas that do not show geomorphological evidences and do not have measured displacements so far. It has to be pointed out that all the measurement GNSS benchmarks that fall within the L2 zones show minor displacement of 3 cm per year, way less than the 10 cm per year threshold.
Most of the Mortisa slope is in class L3 or L2 (
Figure 10); however, a large number of buildings undergoing movement with no evidence of damage due to the displacement are located in L2. As mentioned above, this is due to the small magnitude of the deformations localized along a deep and well-defined slip surface. Nonetheless, this fact has to be considered for the risk assessment by local authorities.
5. Conclusions
Through the integration of different investigation techniques, the state of activity of different zones of the Mortisa landslide unit was classified. The map serves as a base for the Cortina municipality to design the upcoming urban development plan and to determine the areas where the expansions of existing buildings or underground structures may be risky.
This study shows that in order to be able to design a sound local-scale hazard map, numerous measures which are to be carried out in a long time span and with different instruments are absolutely mandatory. This is particularly true for urban areas where the absence of damage on buildings could lead to overestimation of the stability of the zone and where human activities in the surrounding fields (mechanical cutting of grass, ski slopes maintenance work) easily obliterate some geomorphological features, especially for slower phenomena. The fact that the map is rigorously data-supported limits controversy between land owners and local authorities.


 ,
, 


