
Mineralogy of Paleocene Petrified Wood from Cherokee Ranch Fossil Forest, Central Colorado, USA


Abstract
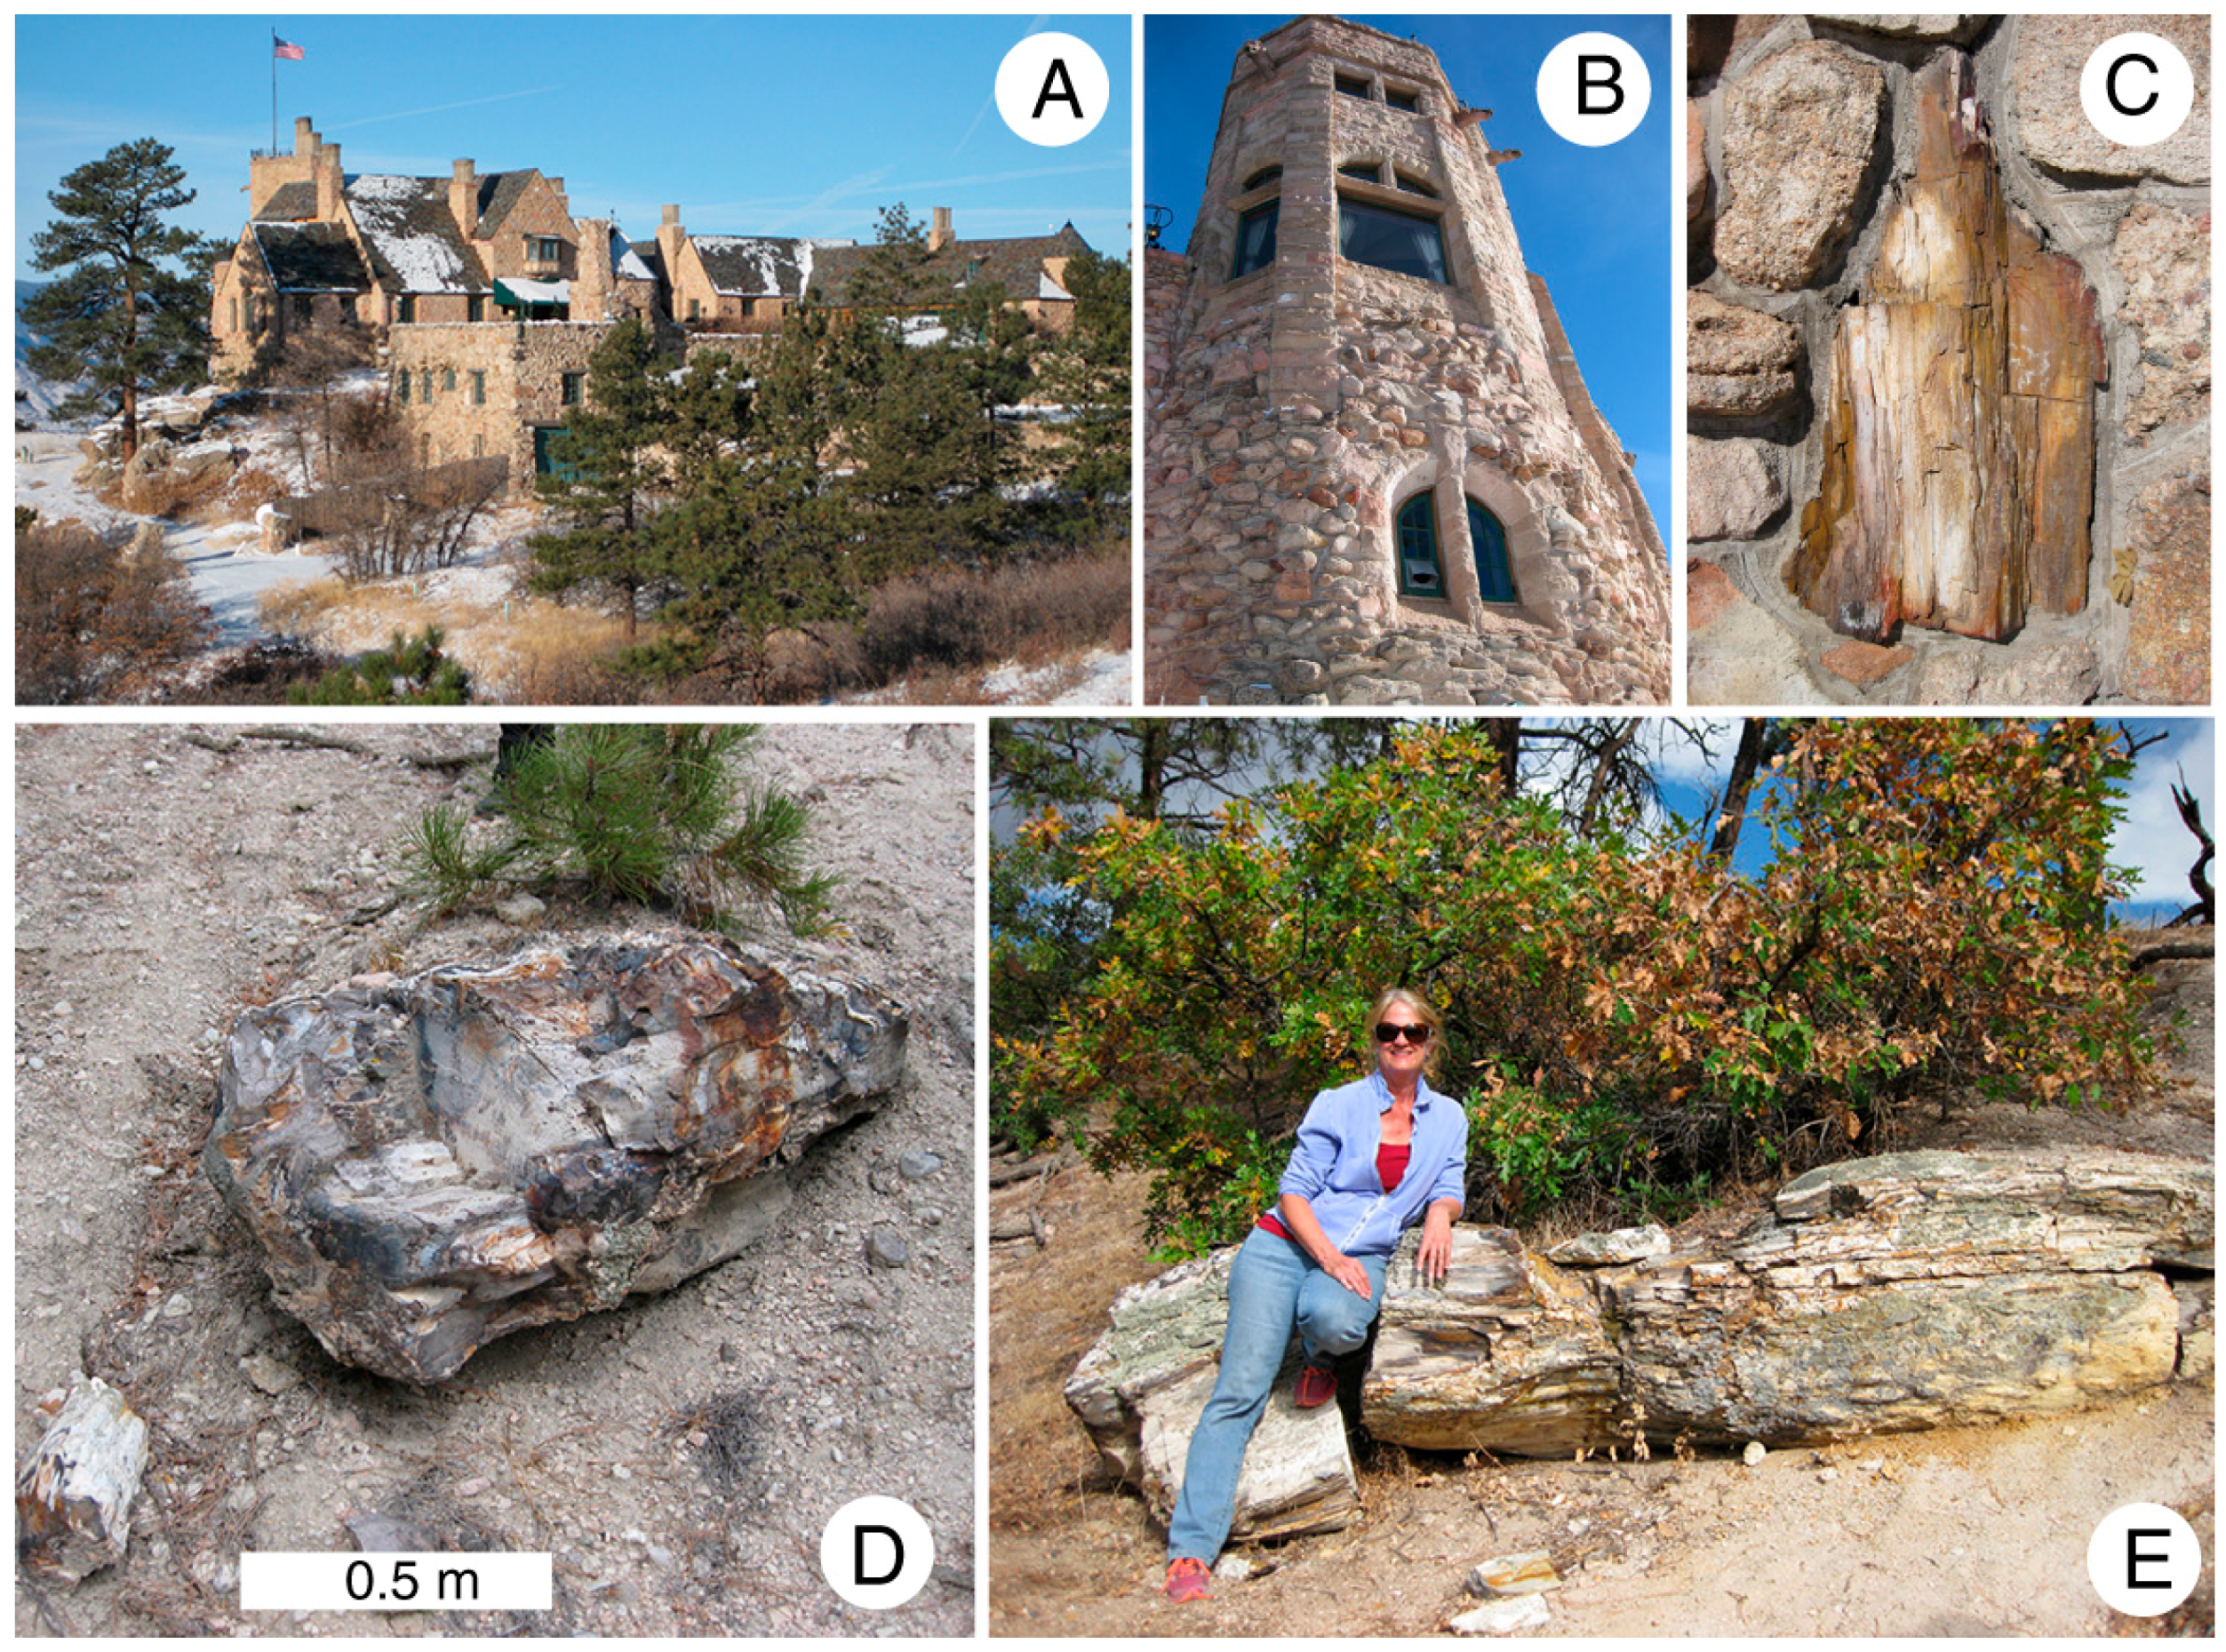
:1. Introduction
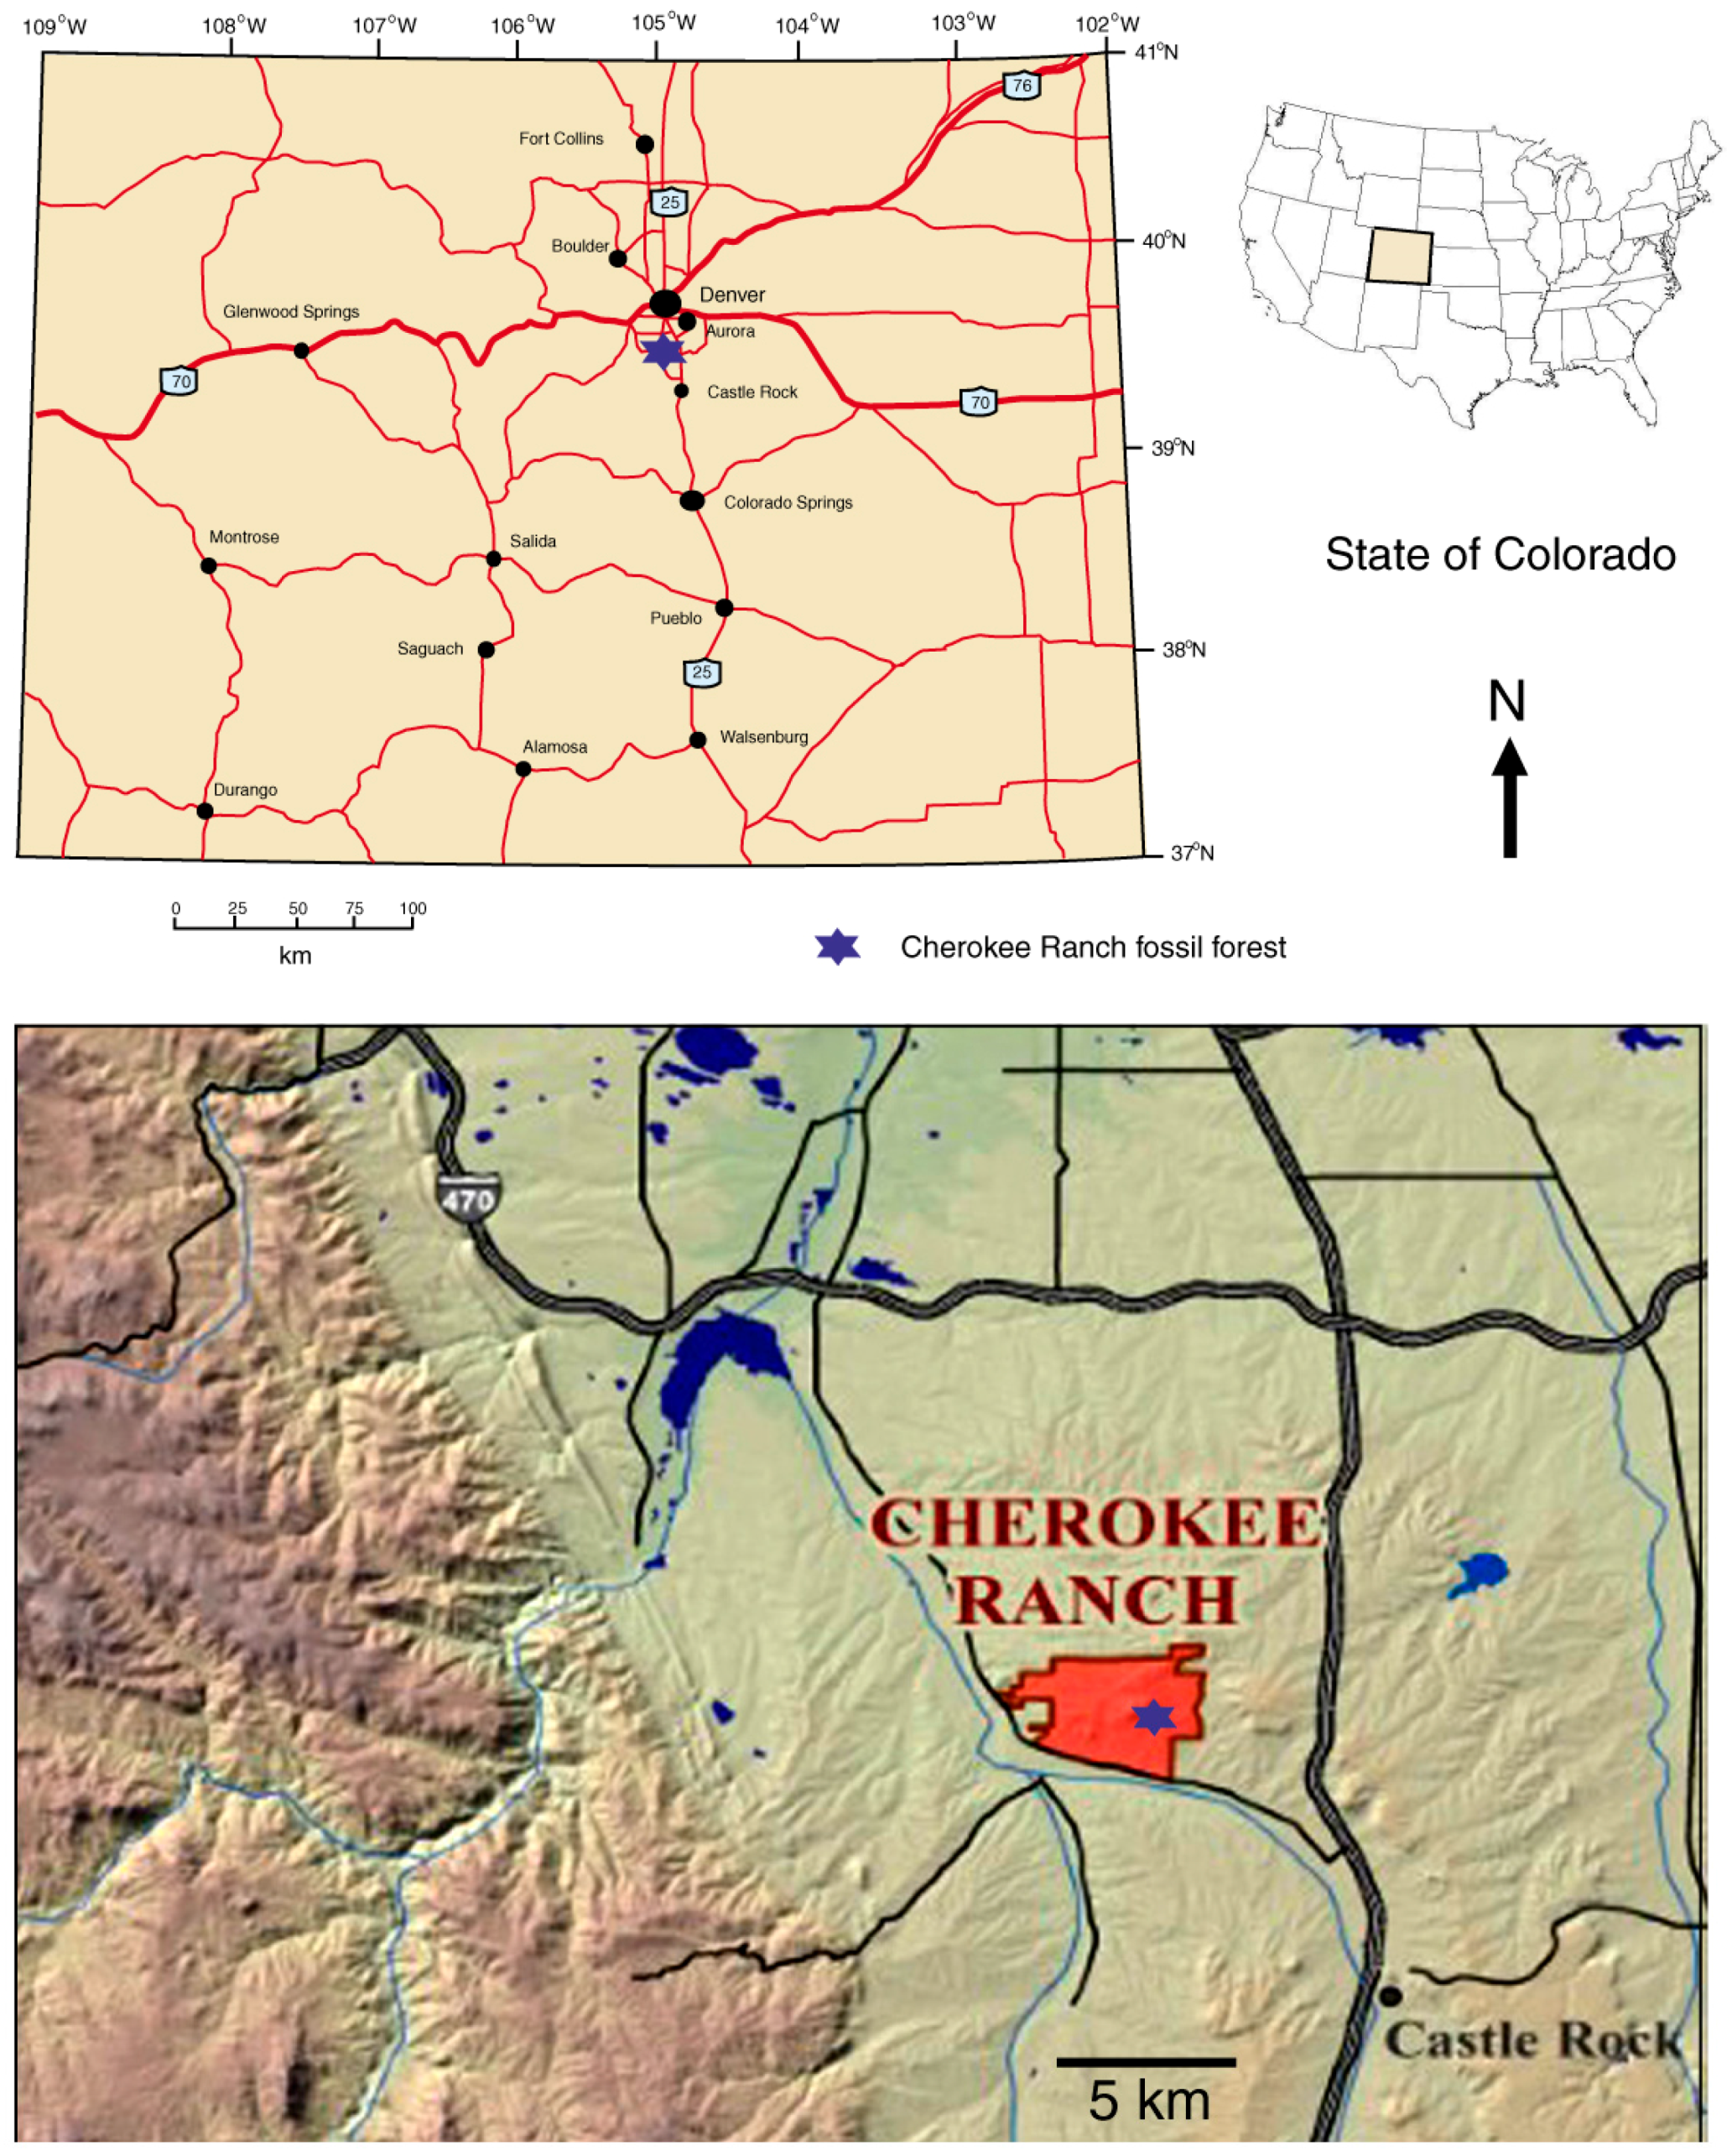
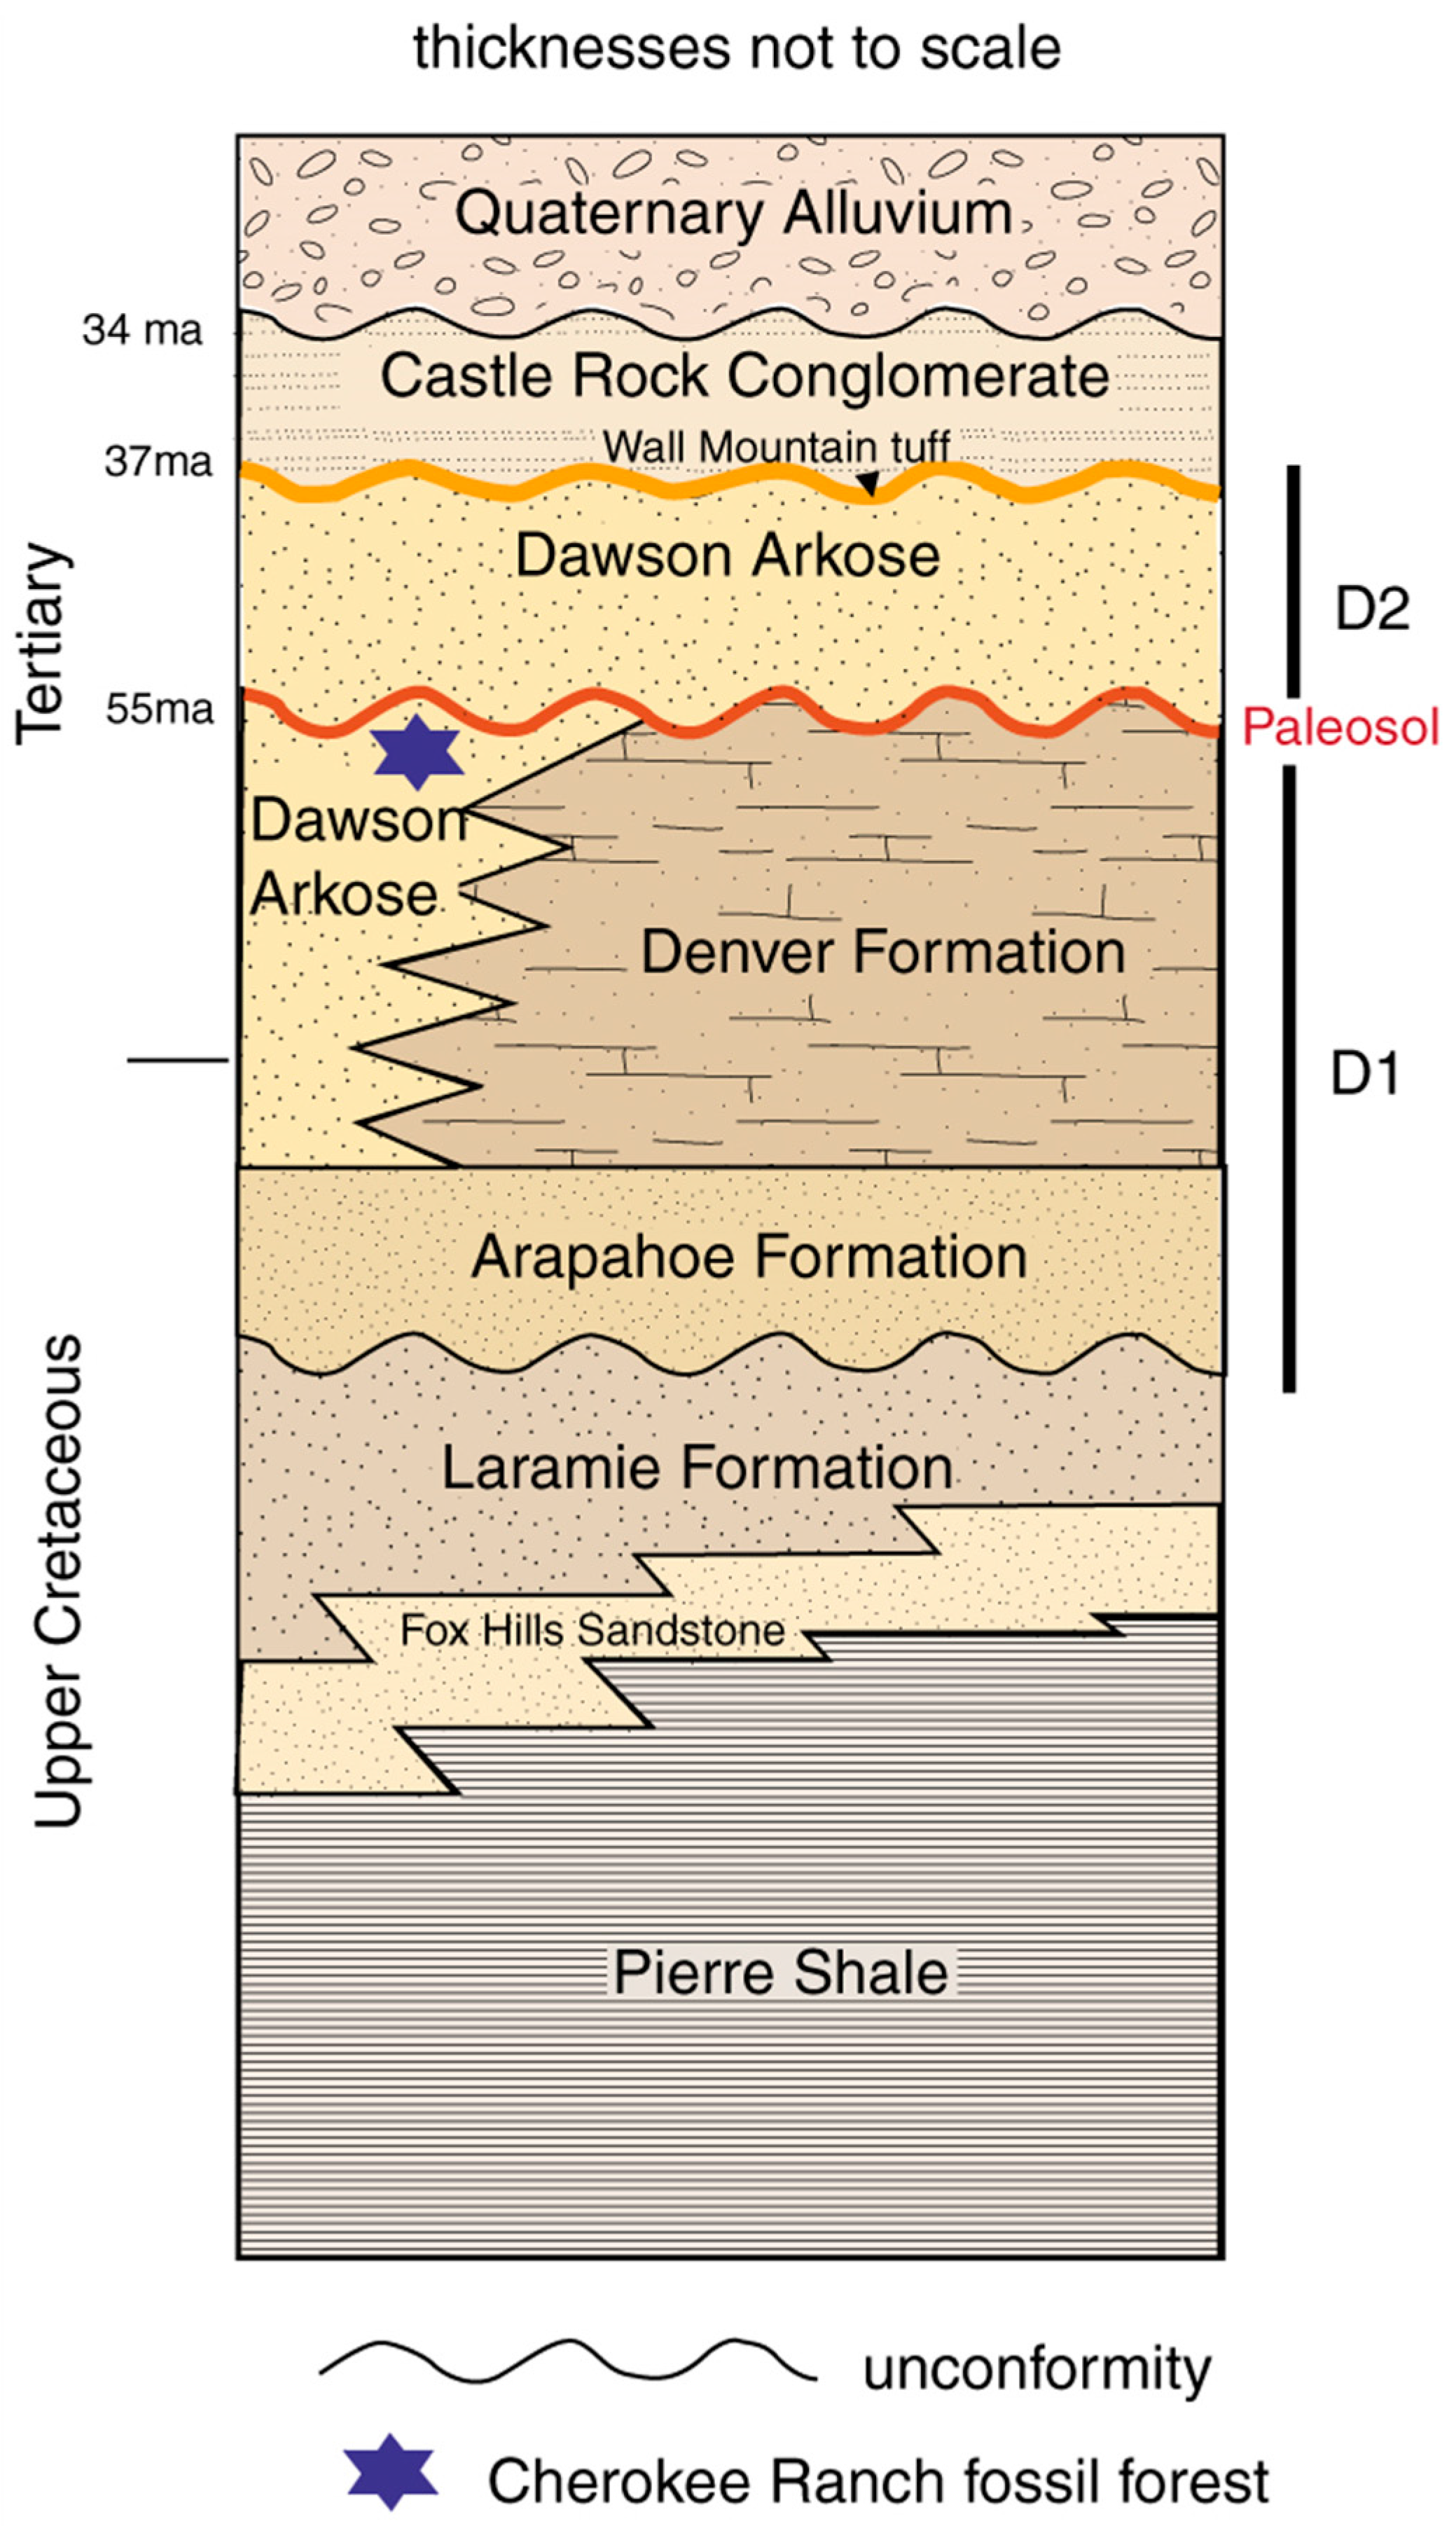
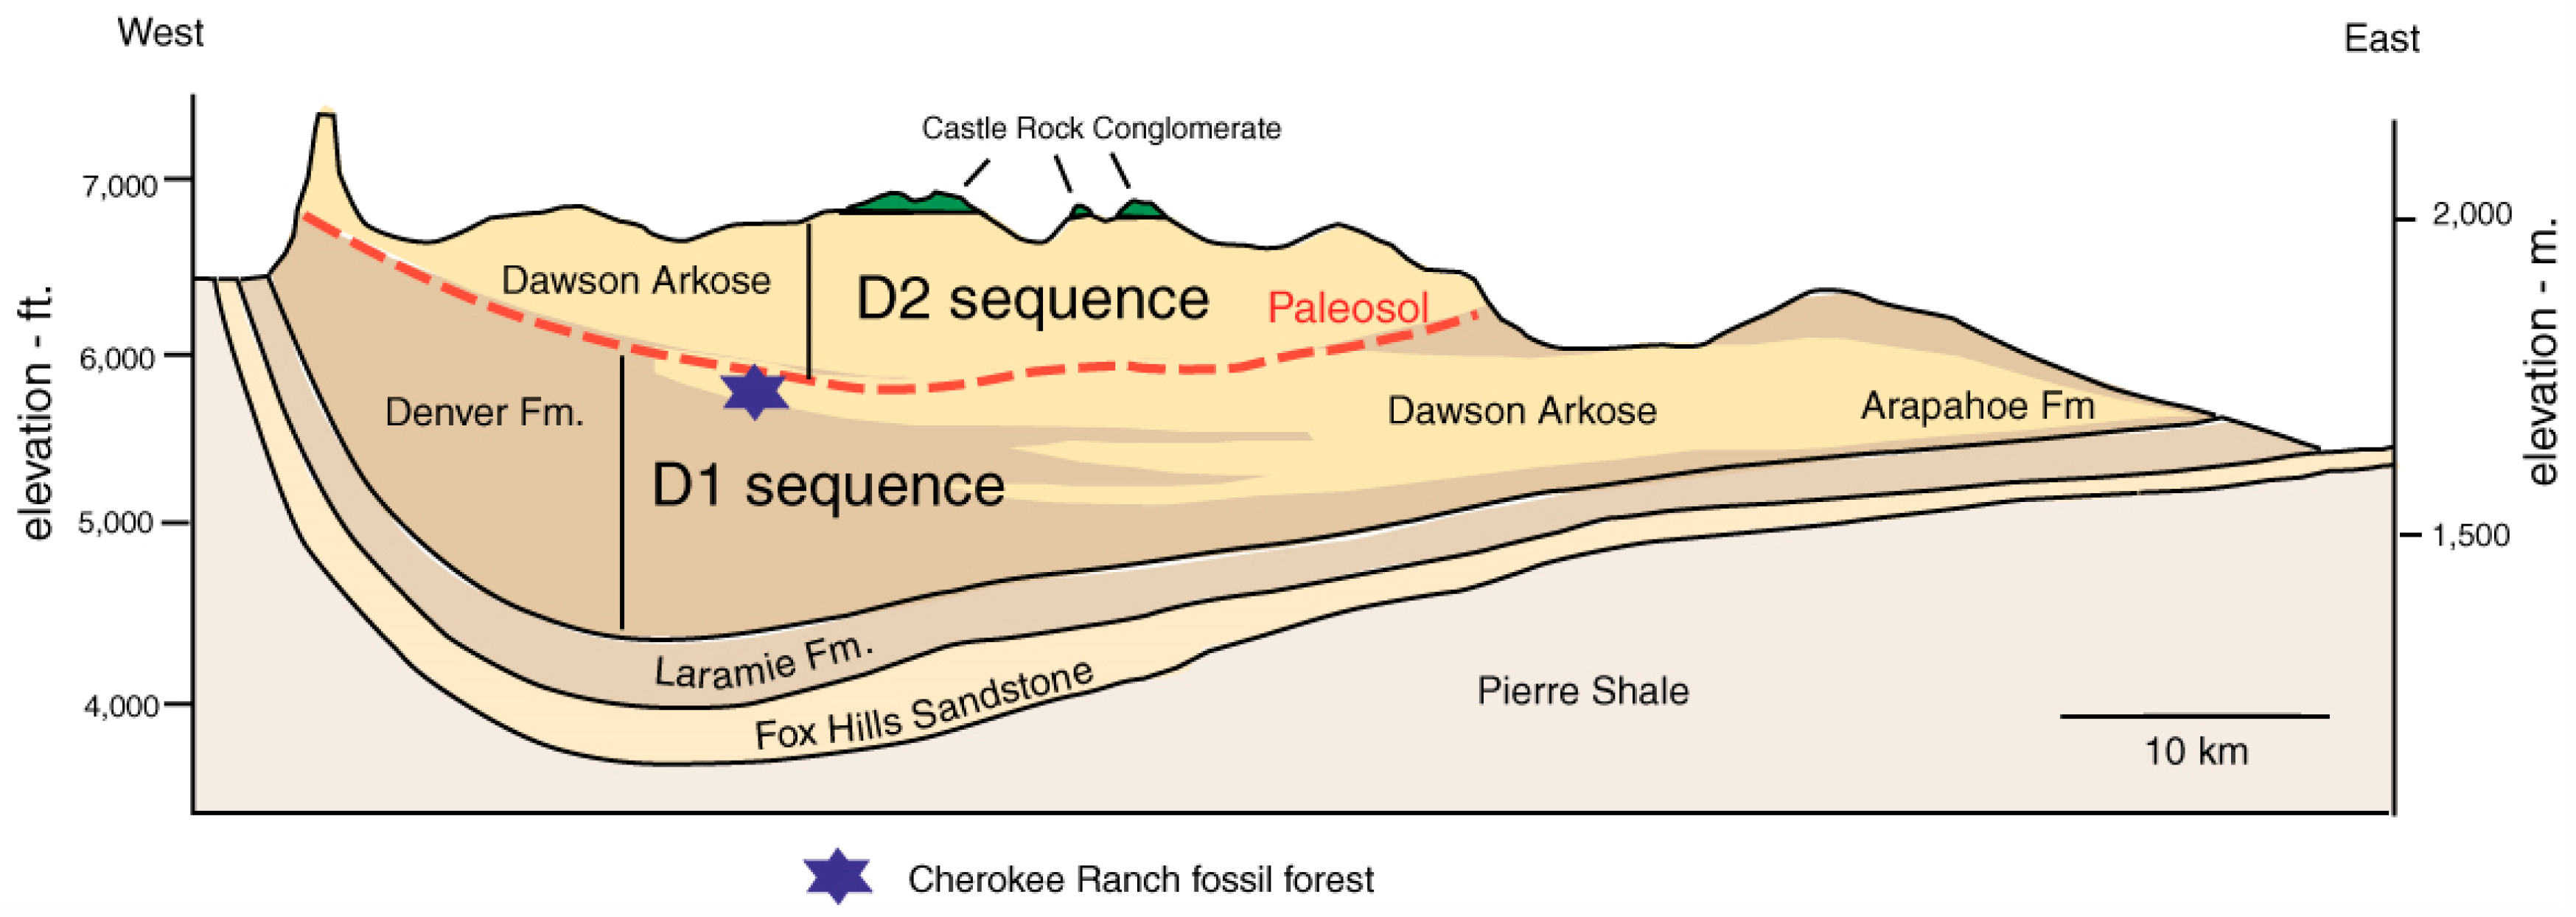
Geologic Setting
2. Methods
3. Results
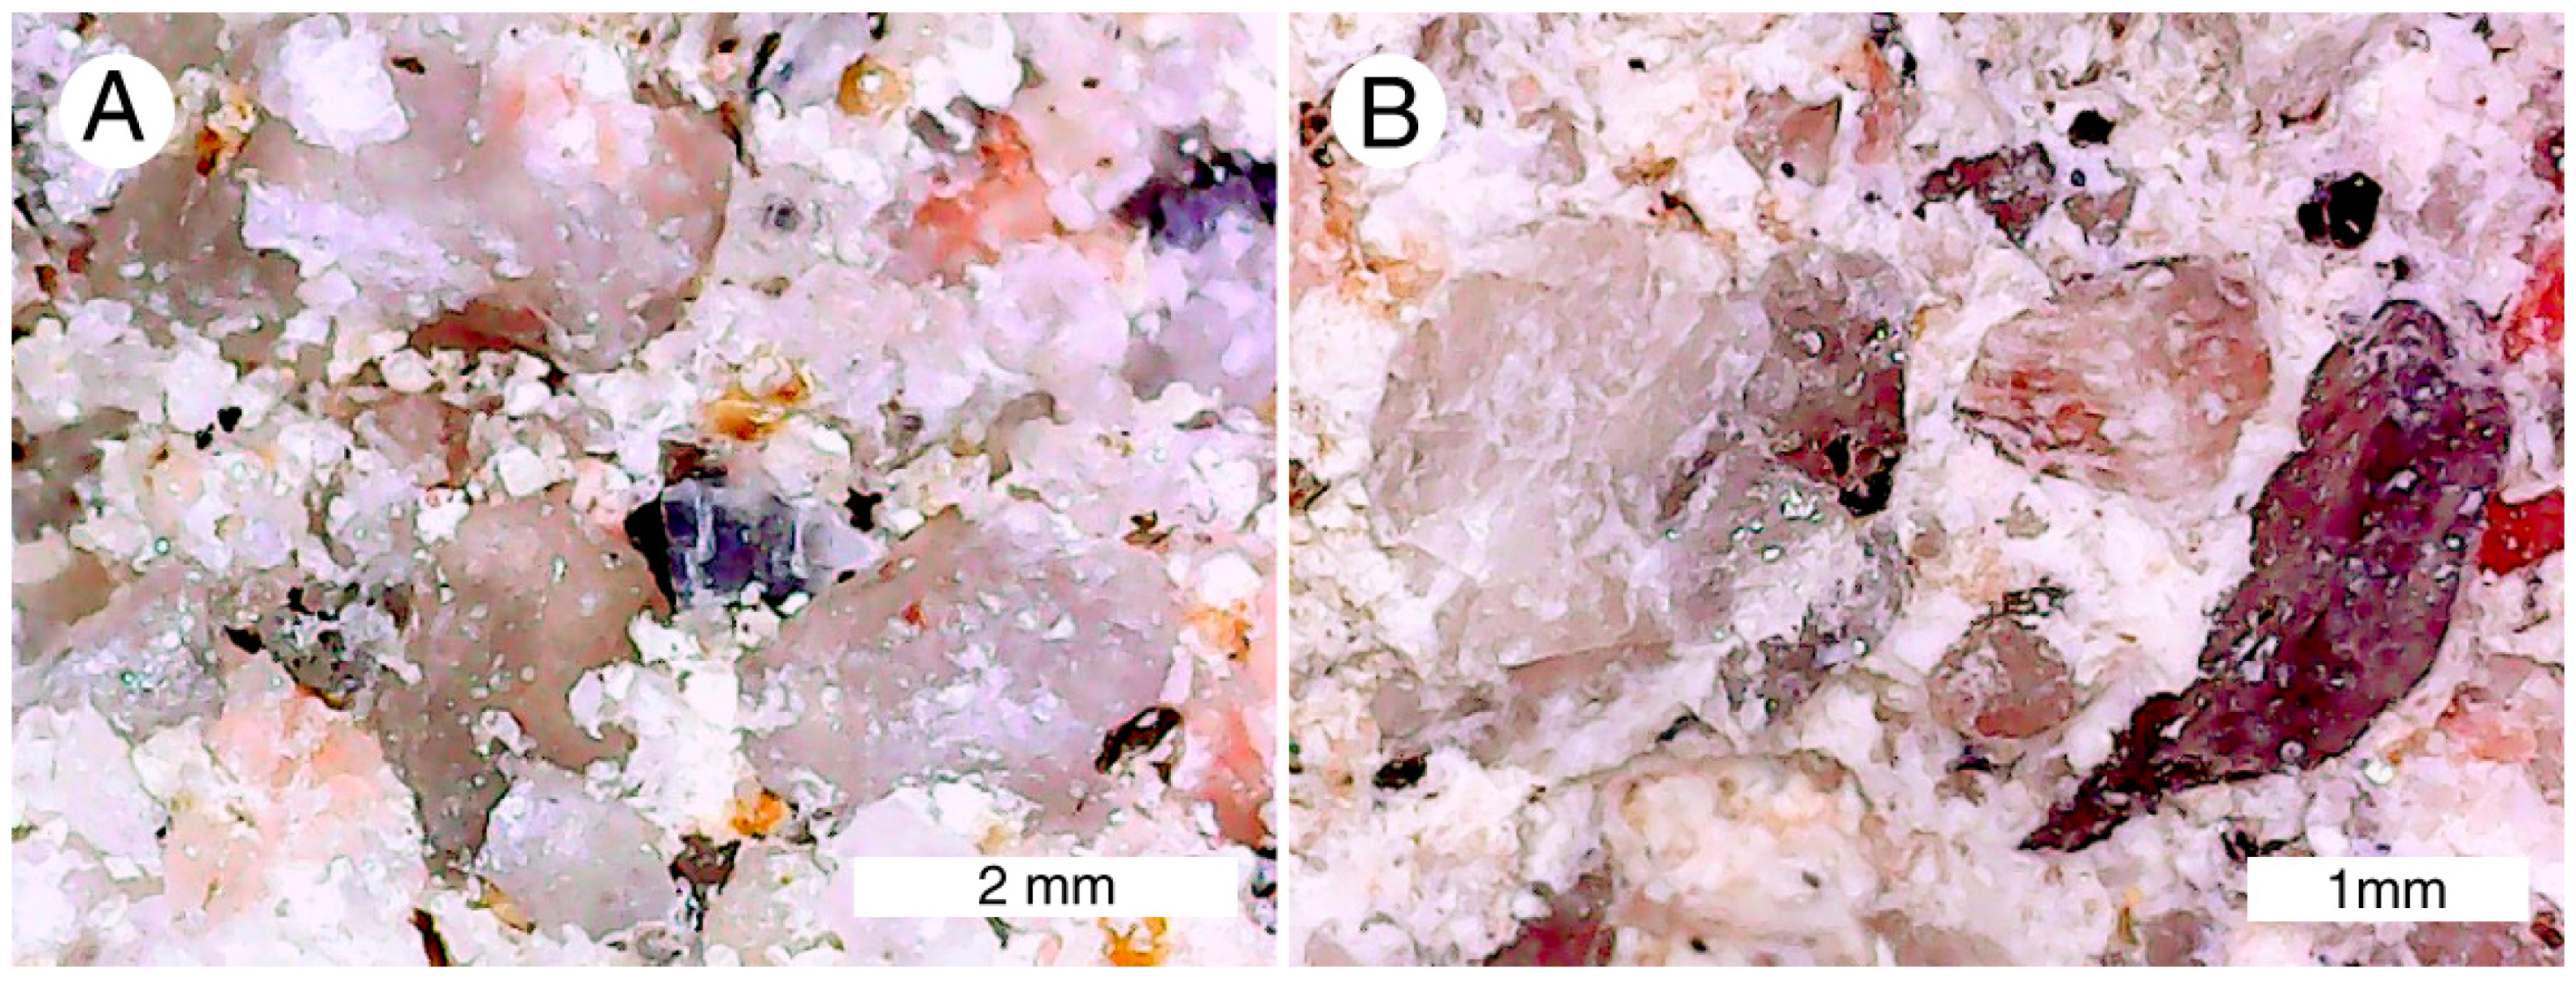
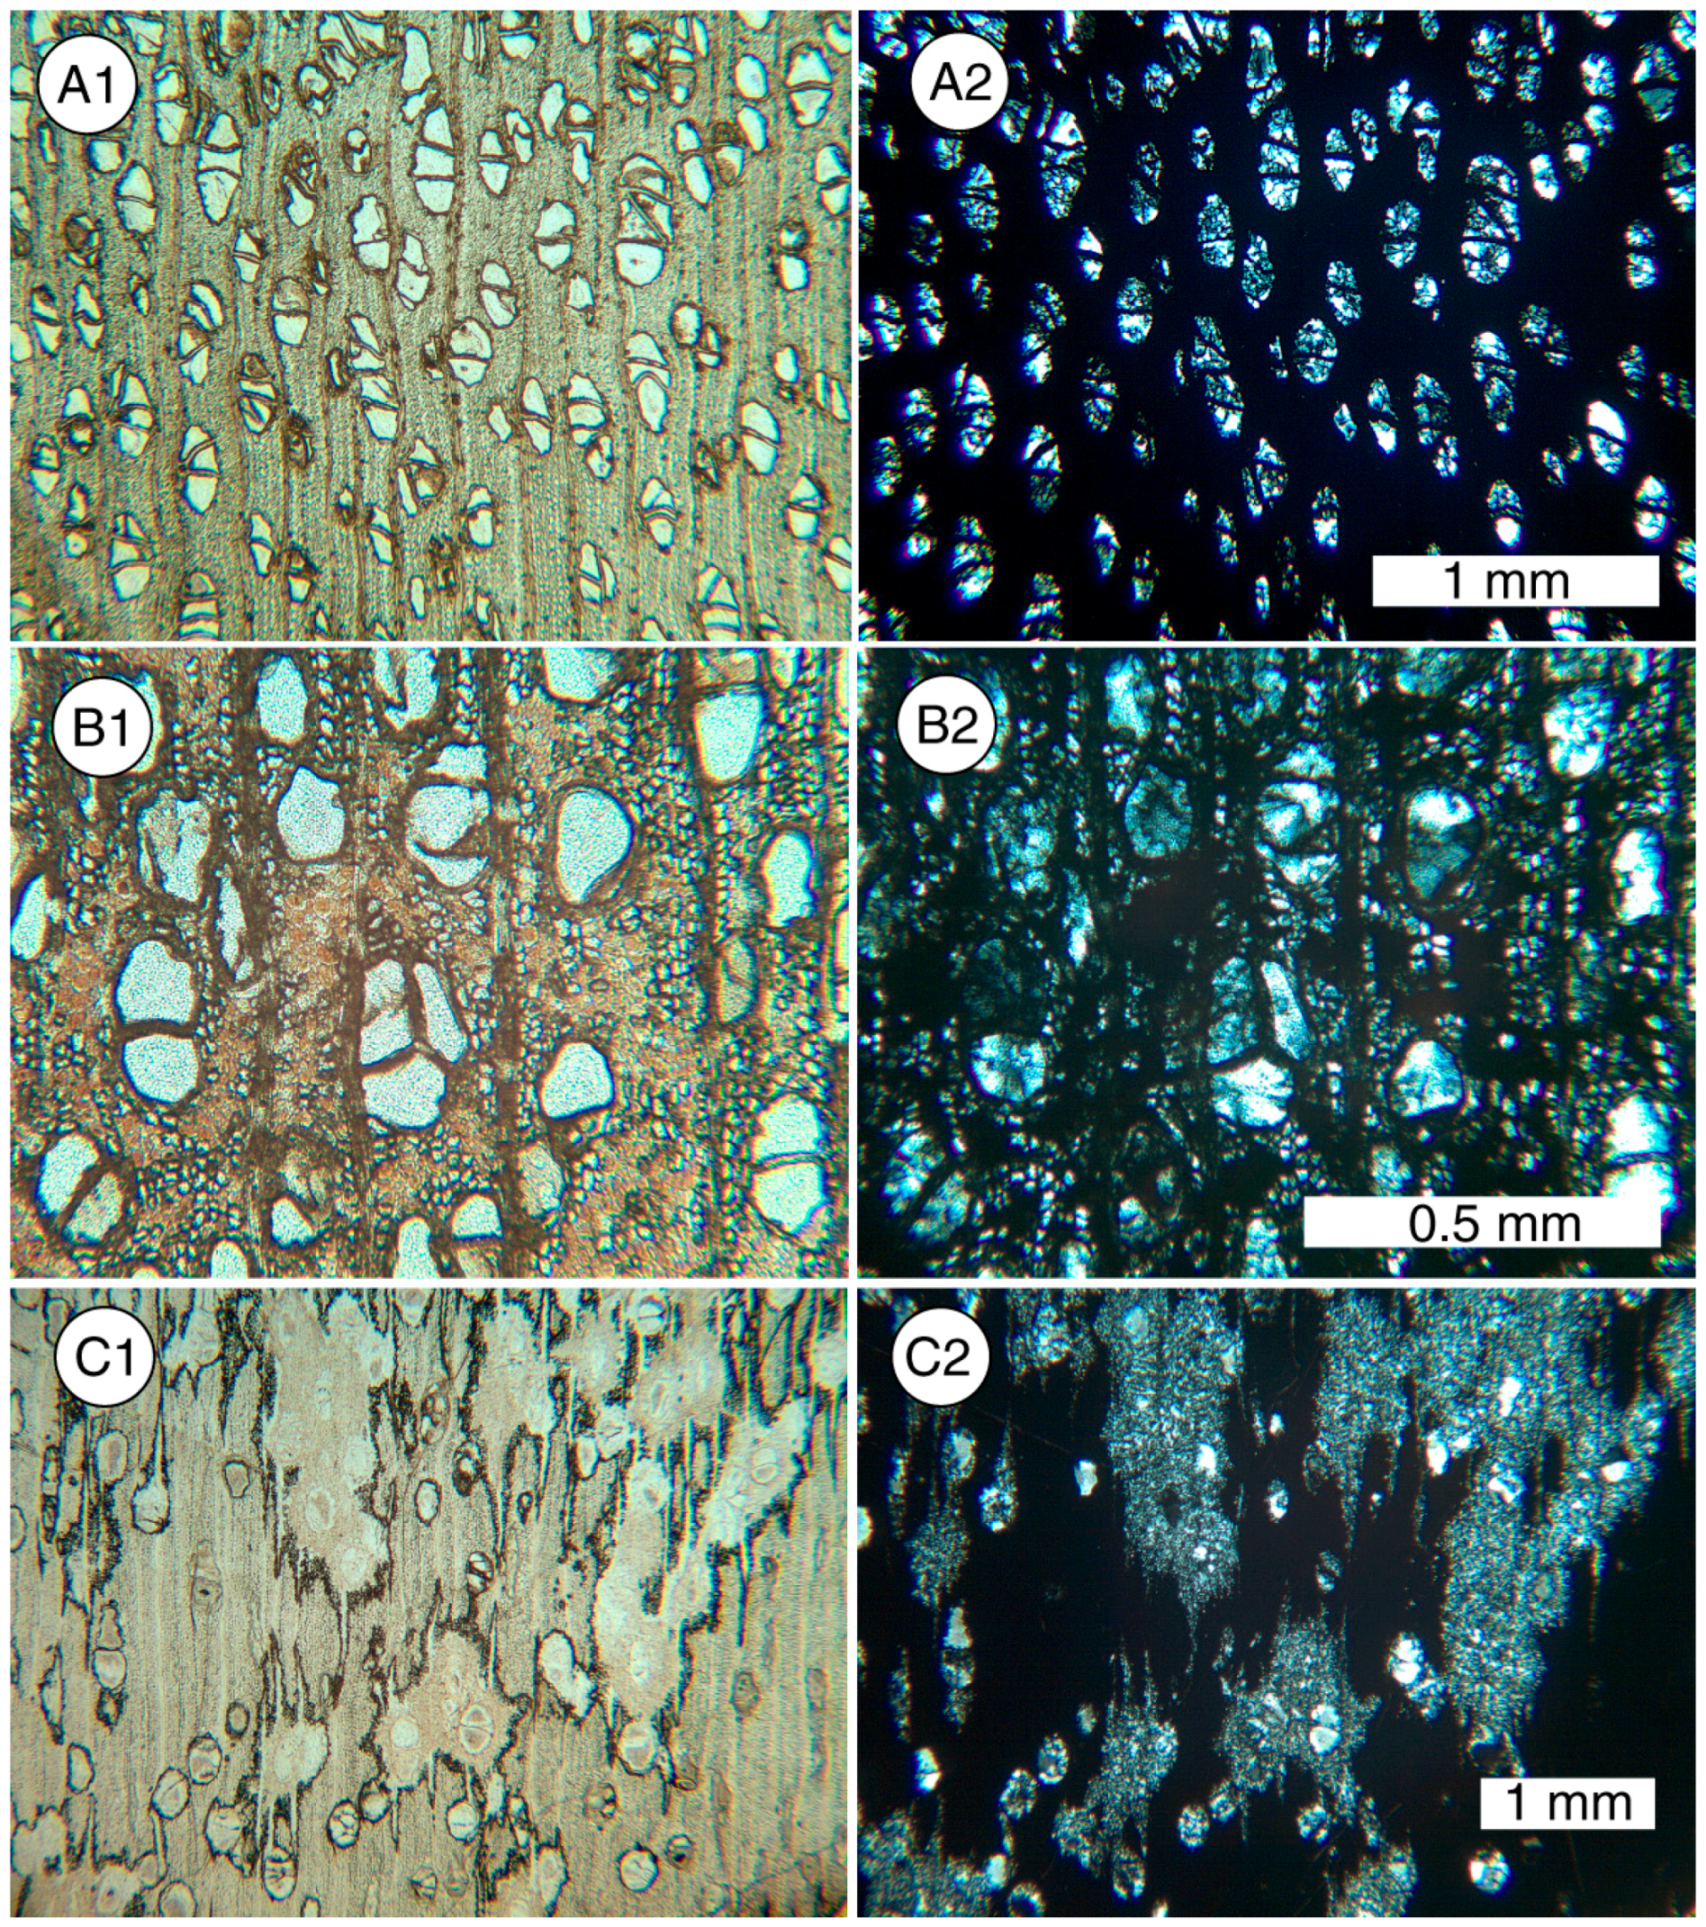
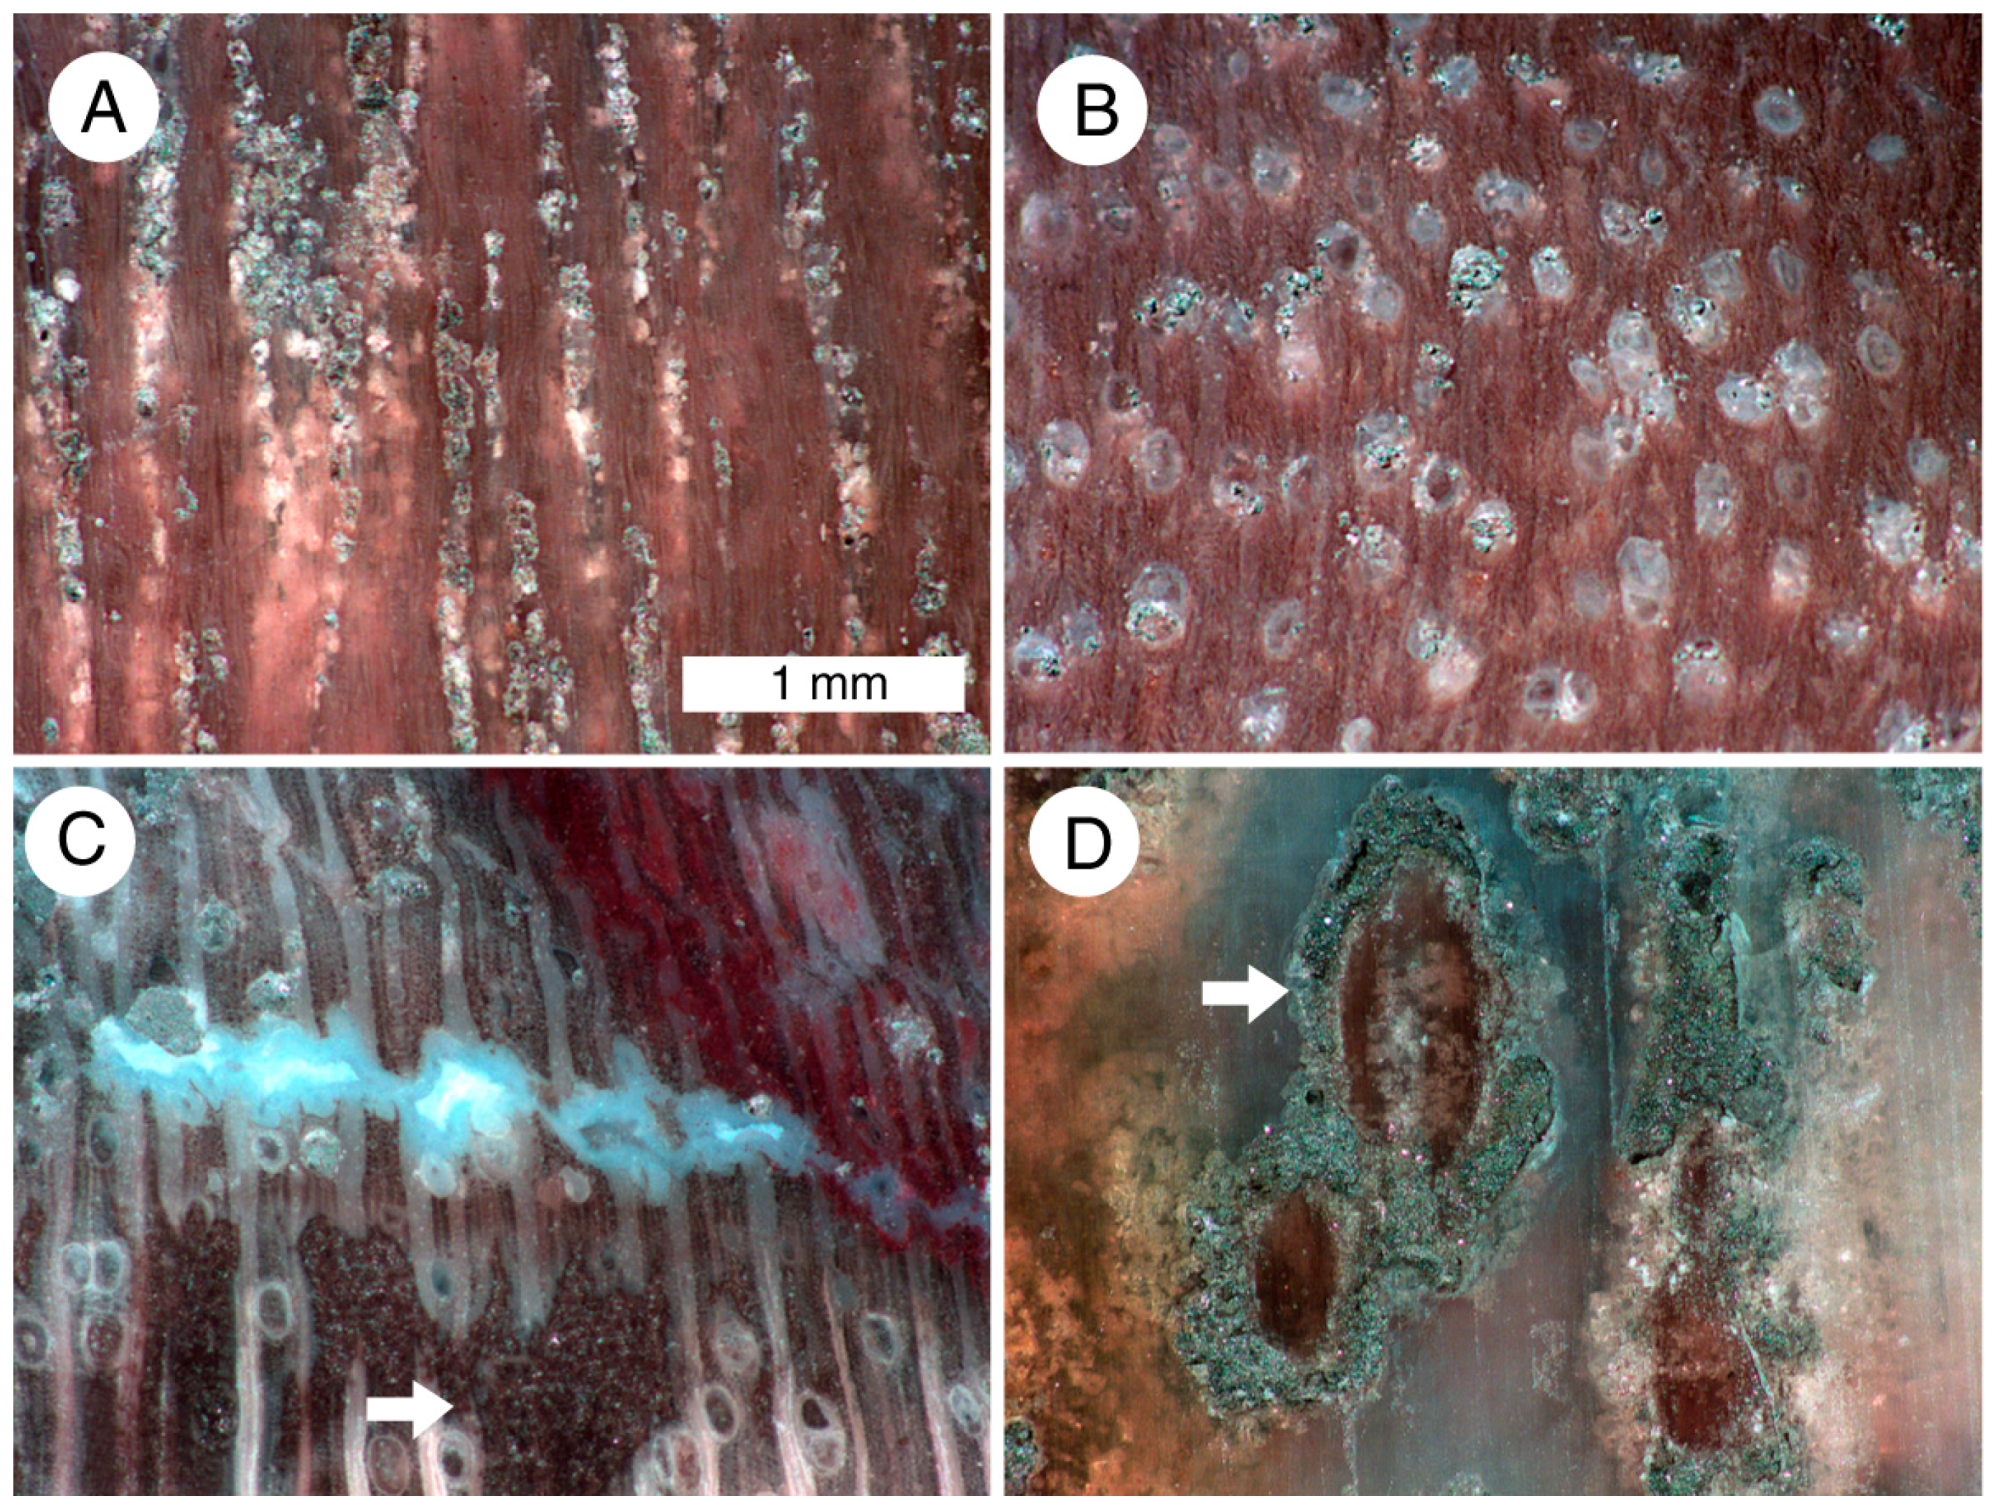
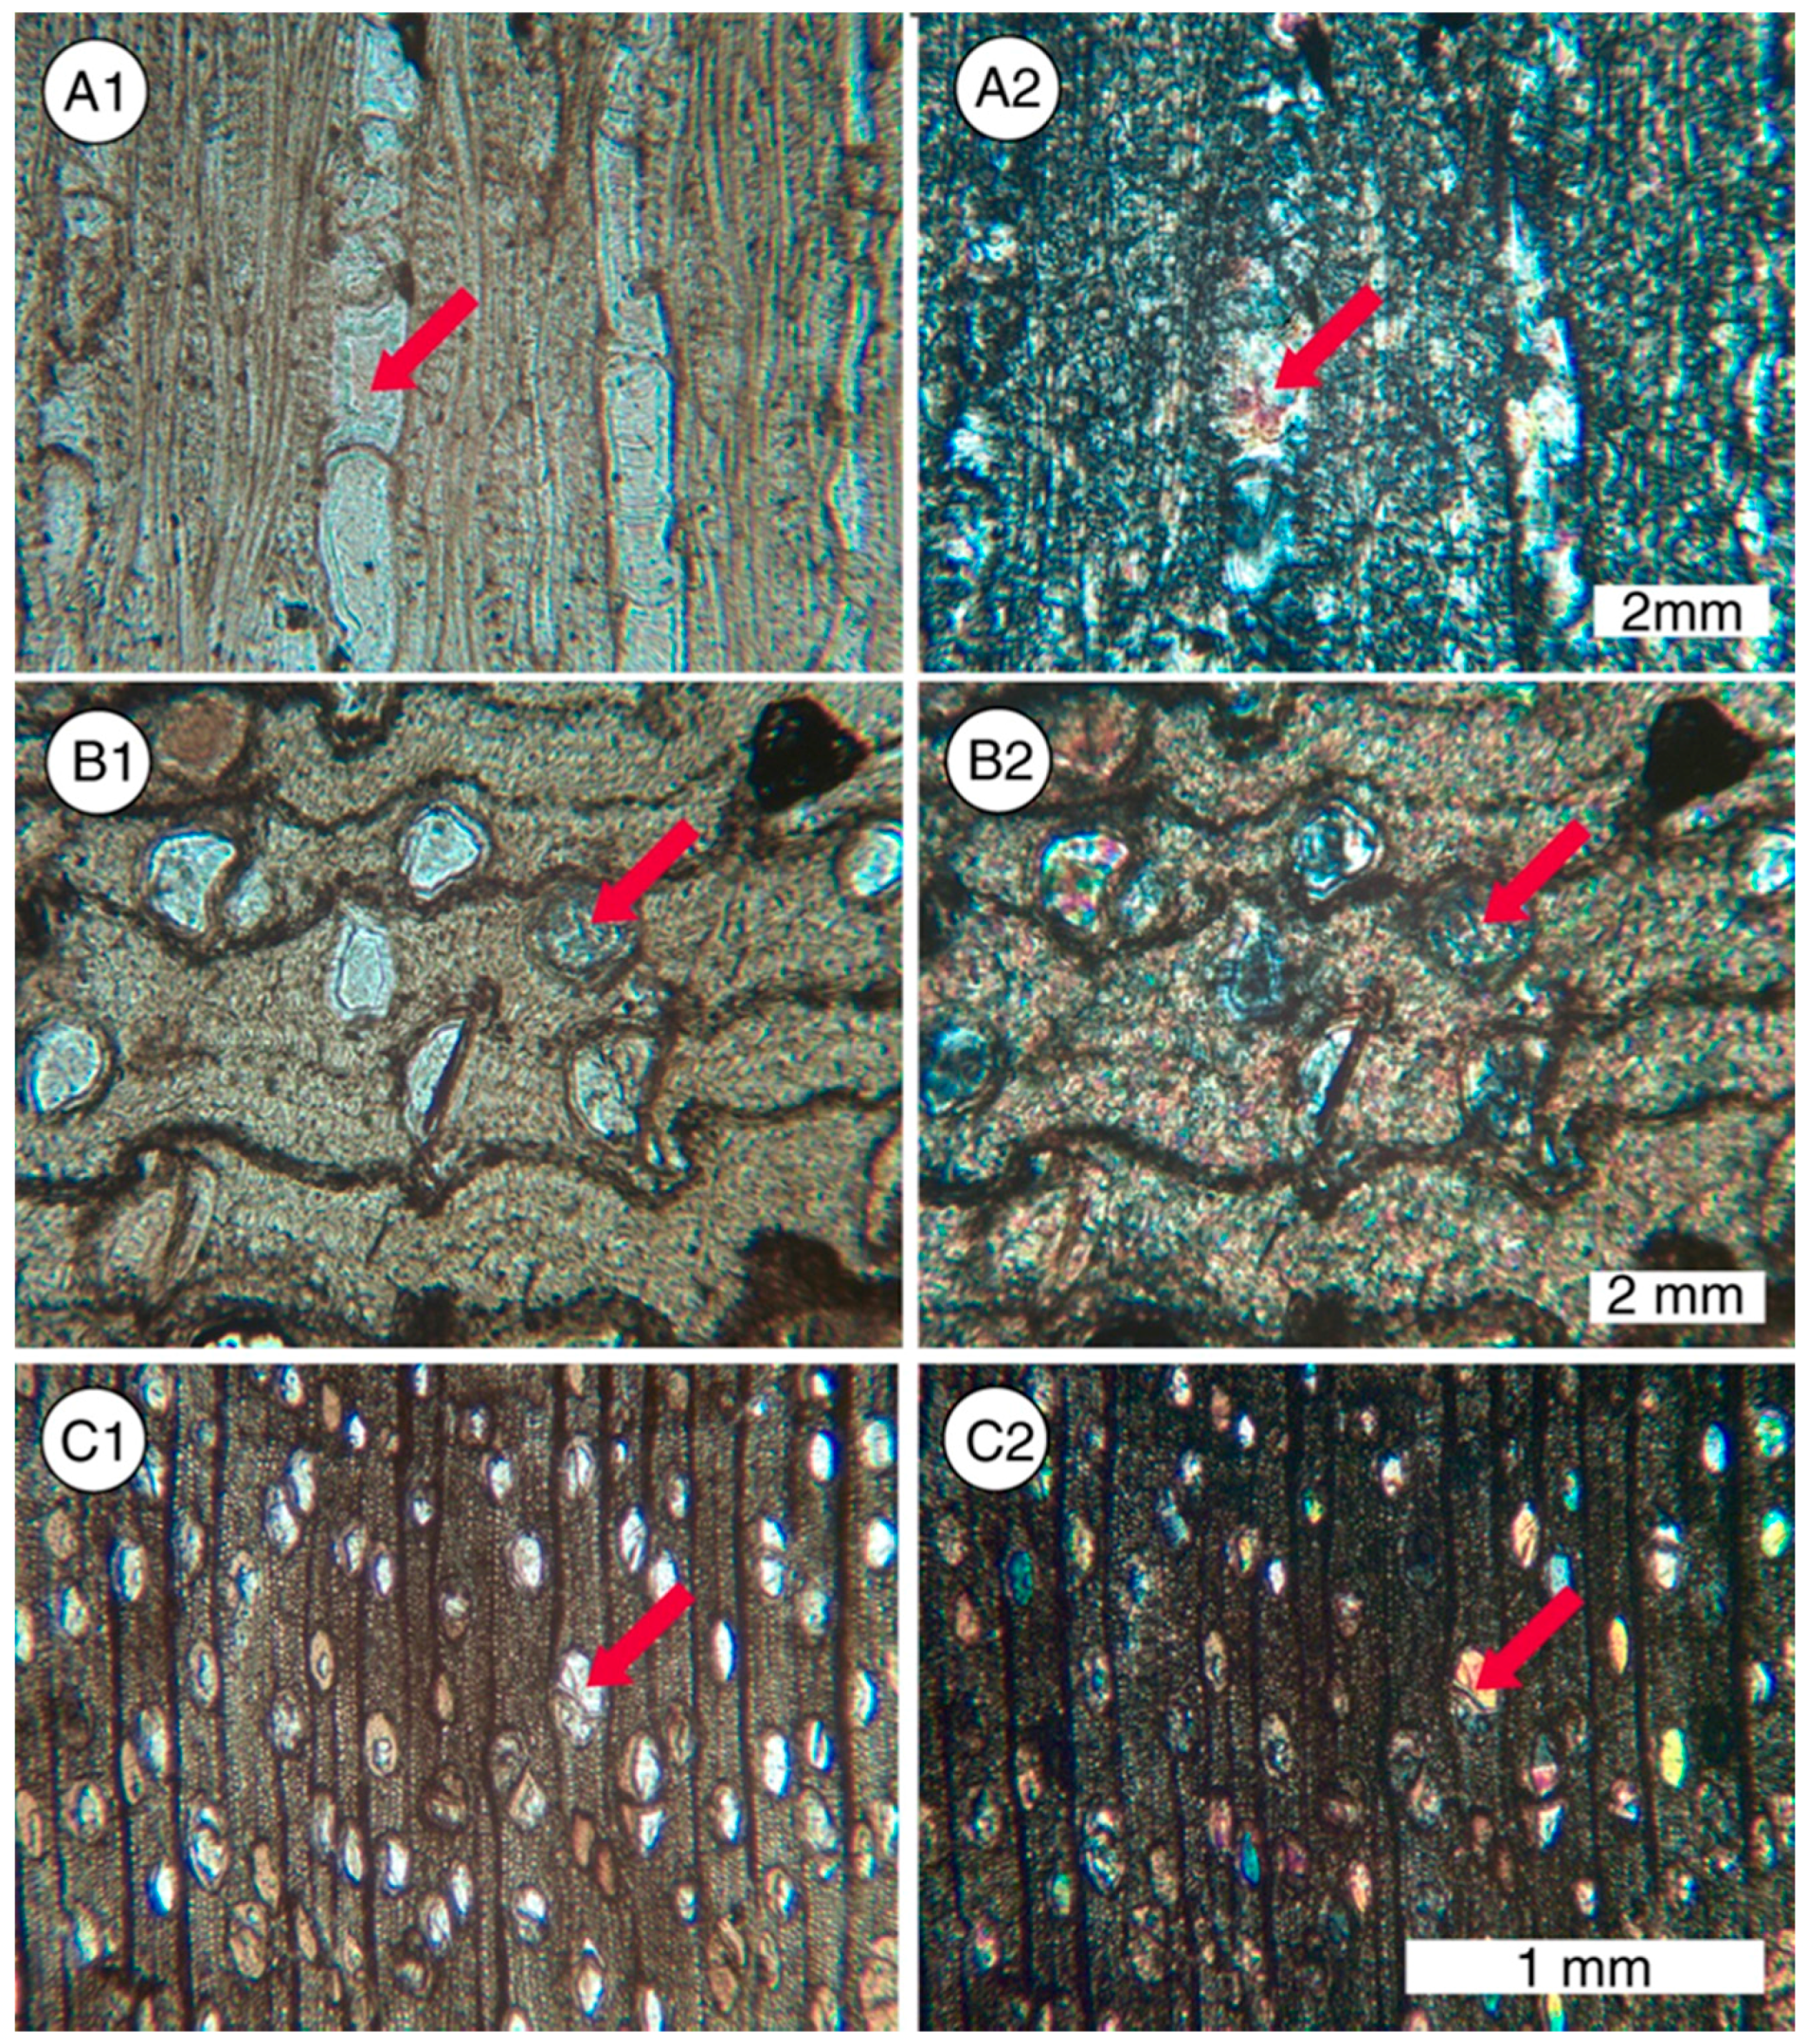
3.1. Petrography: Transmitted Light Microscopy
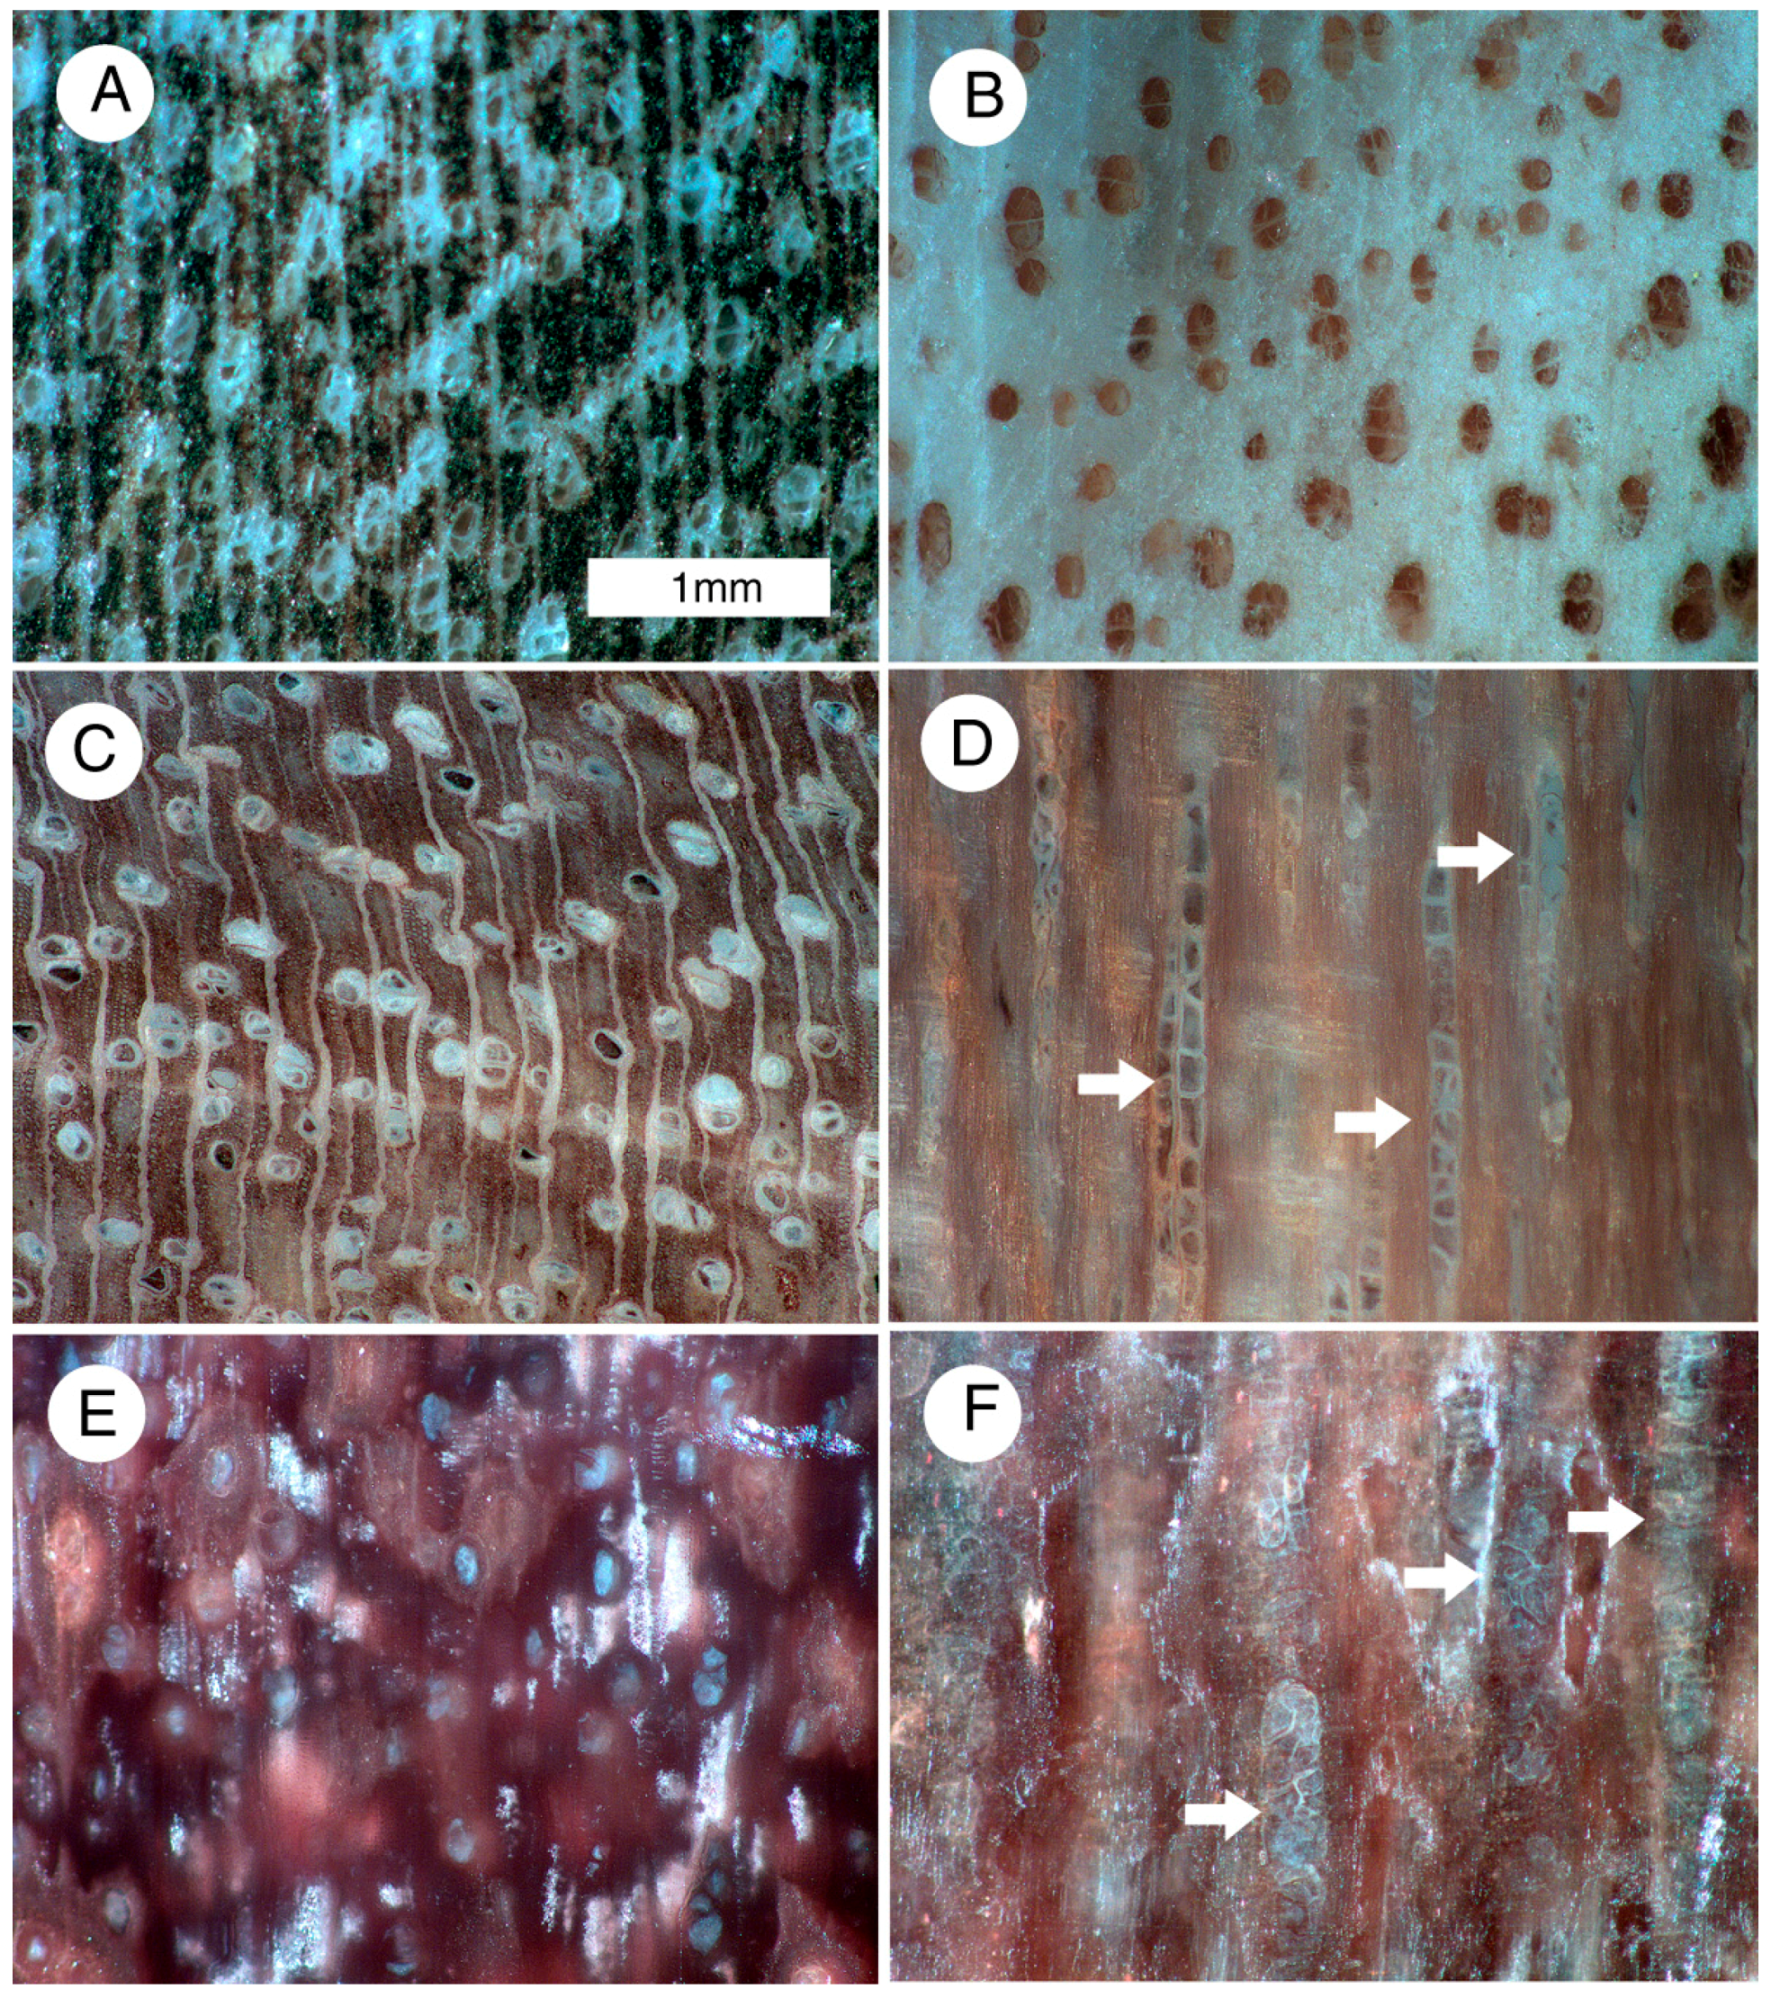
3.2. Petrography: Reflected Light Microscopy
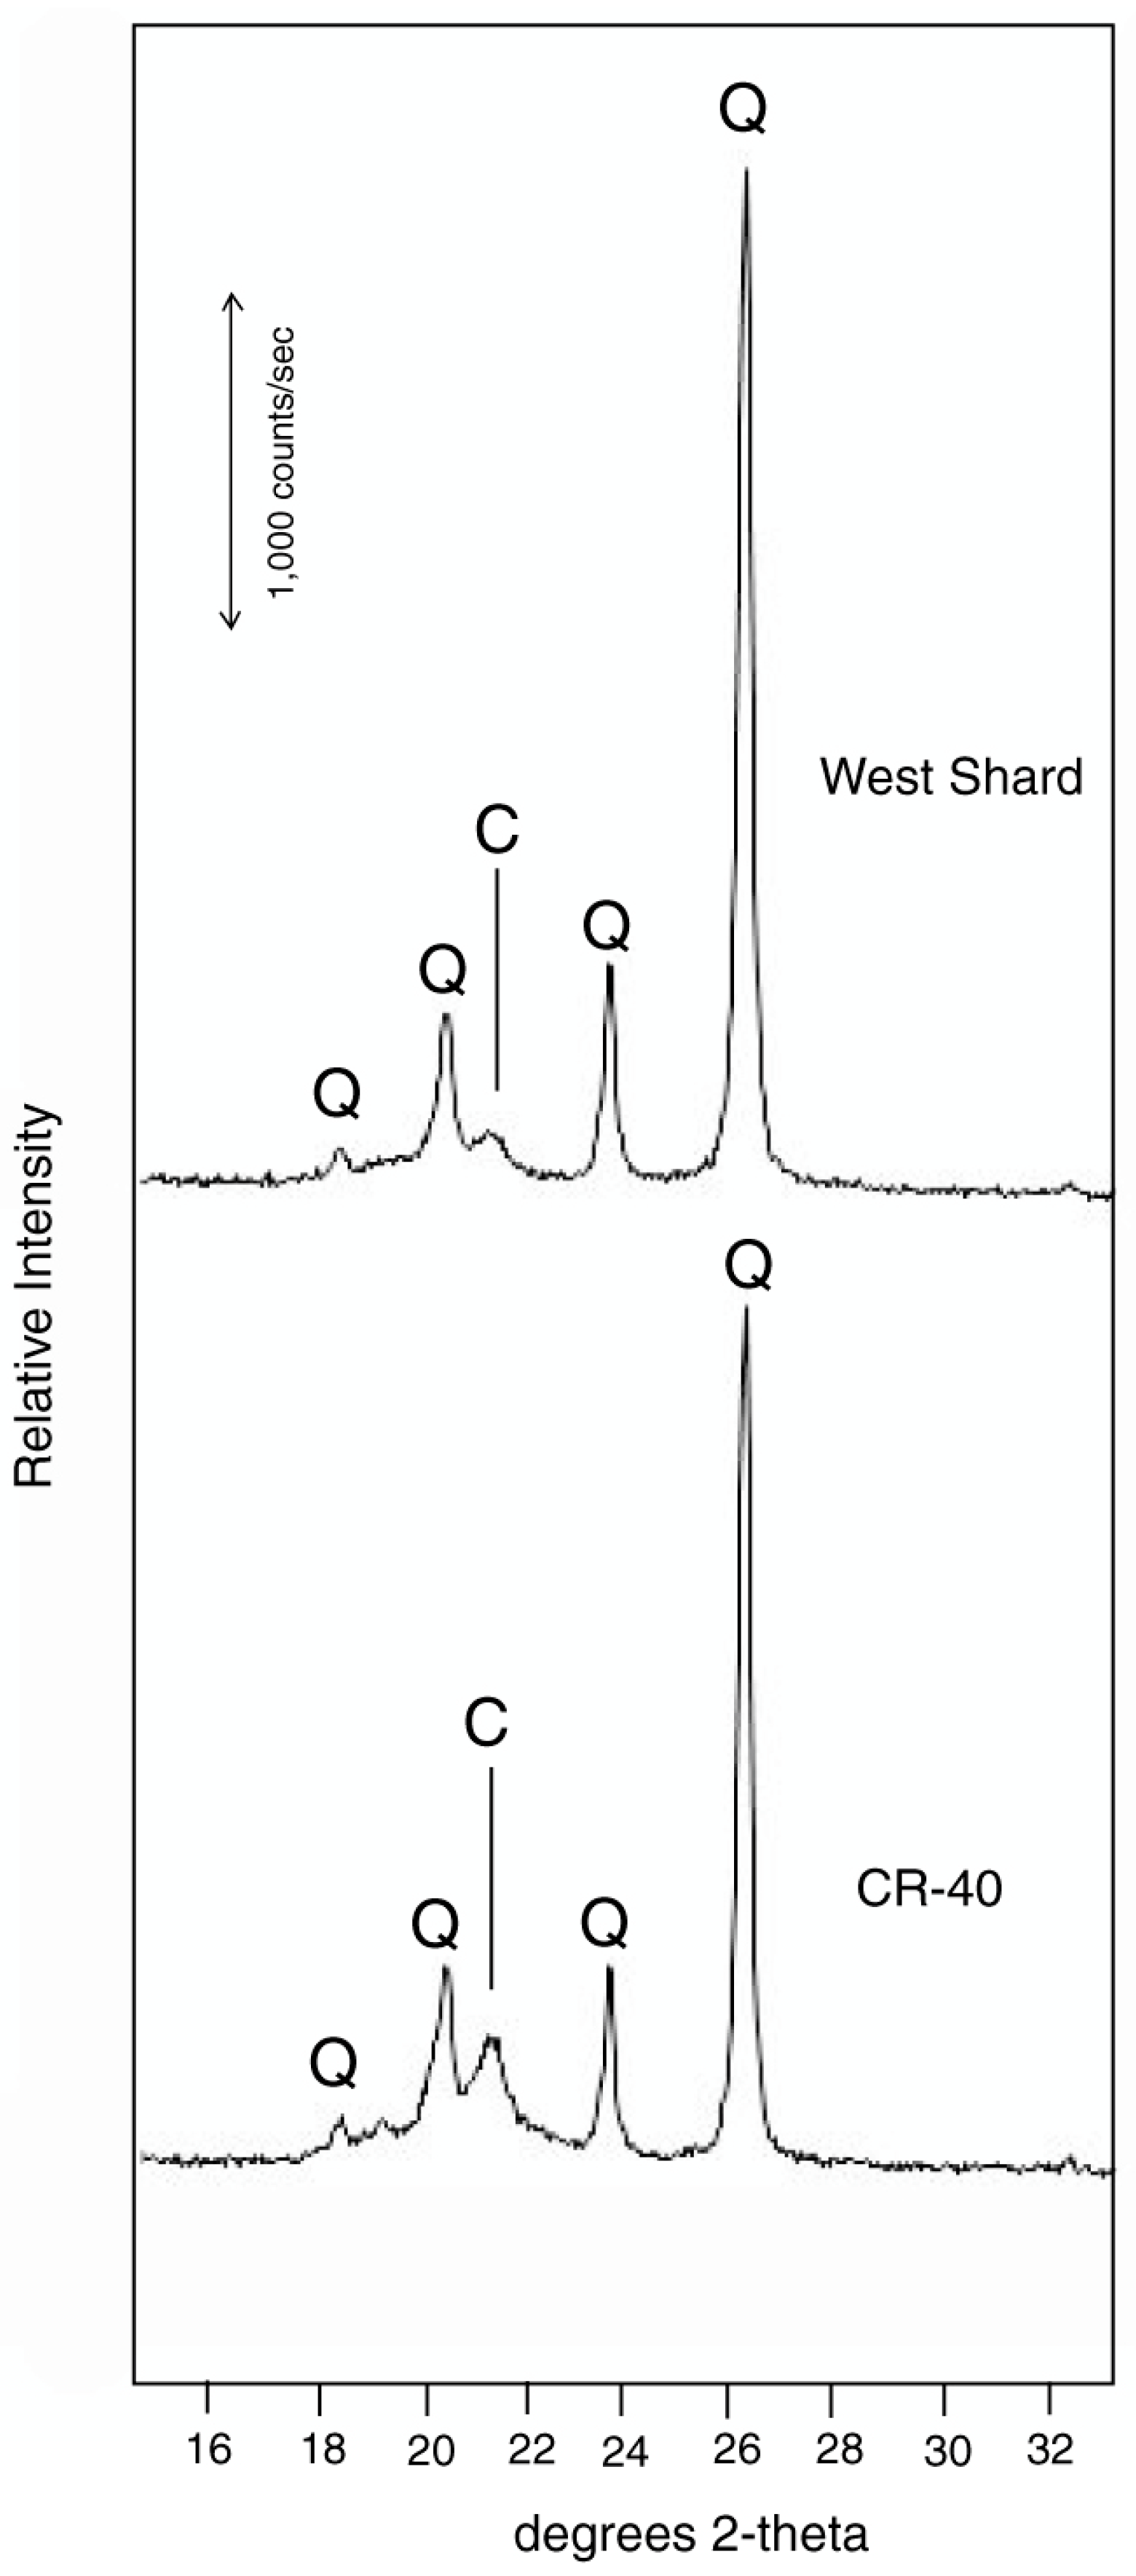
3.3. X-ray Diffraction
3.4. Density
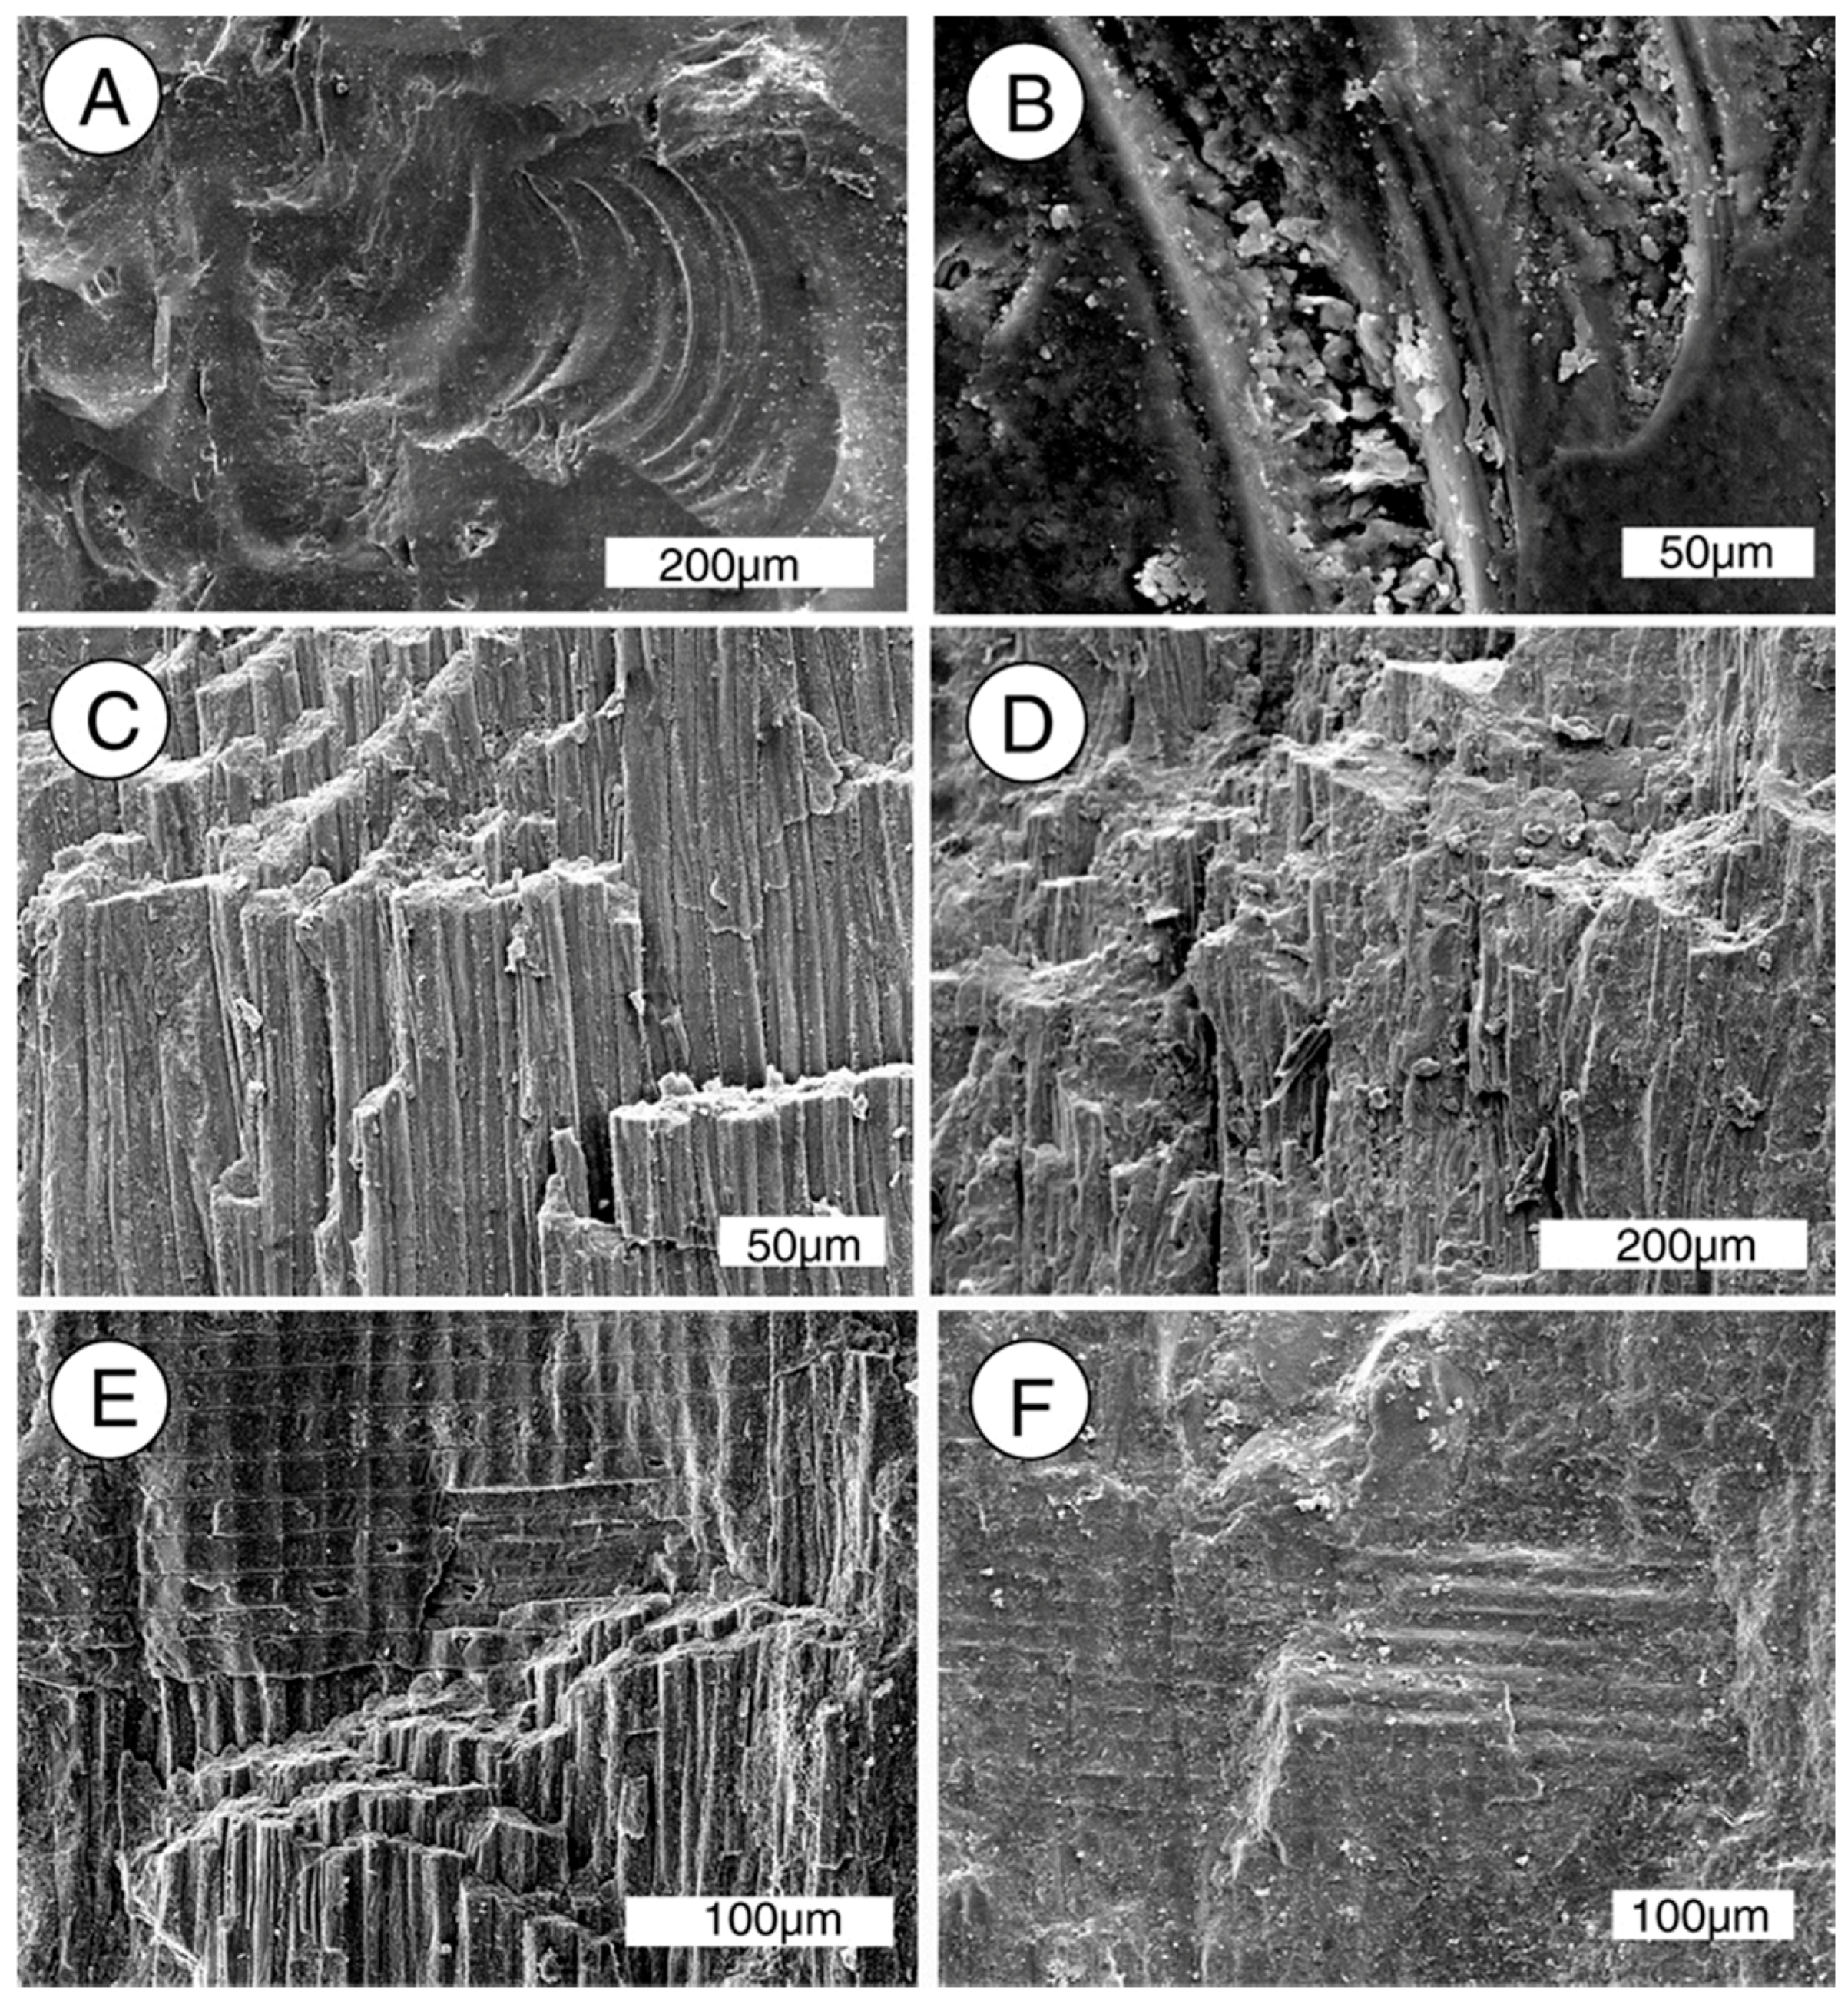
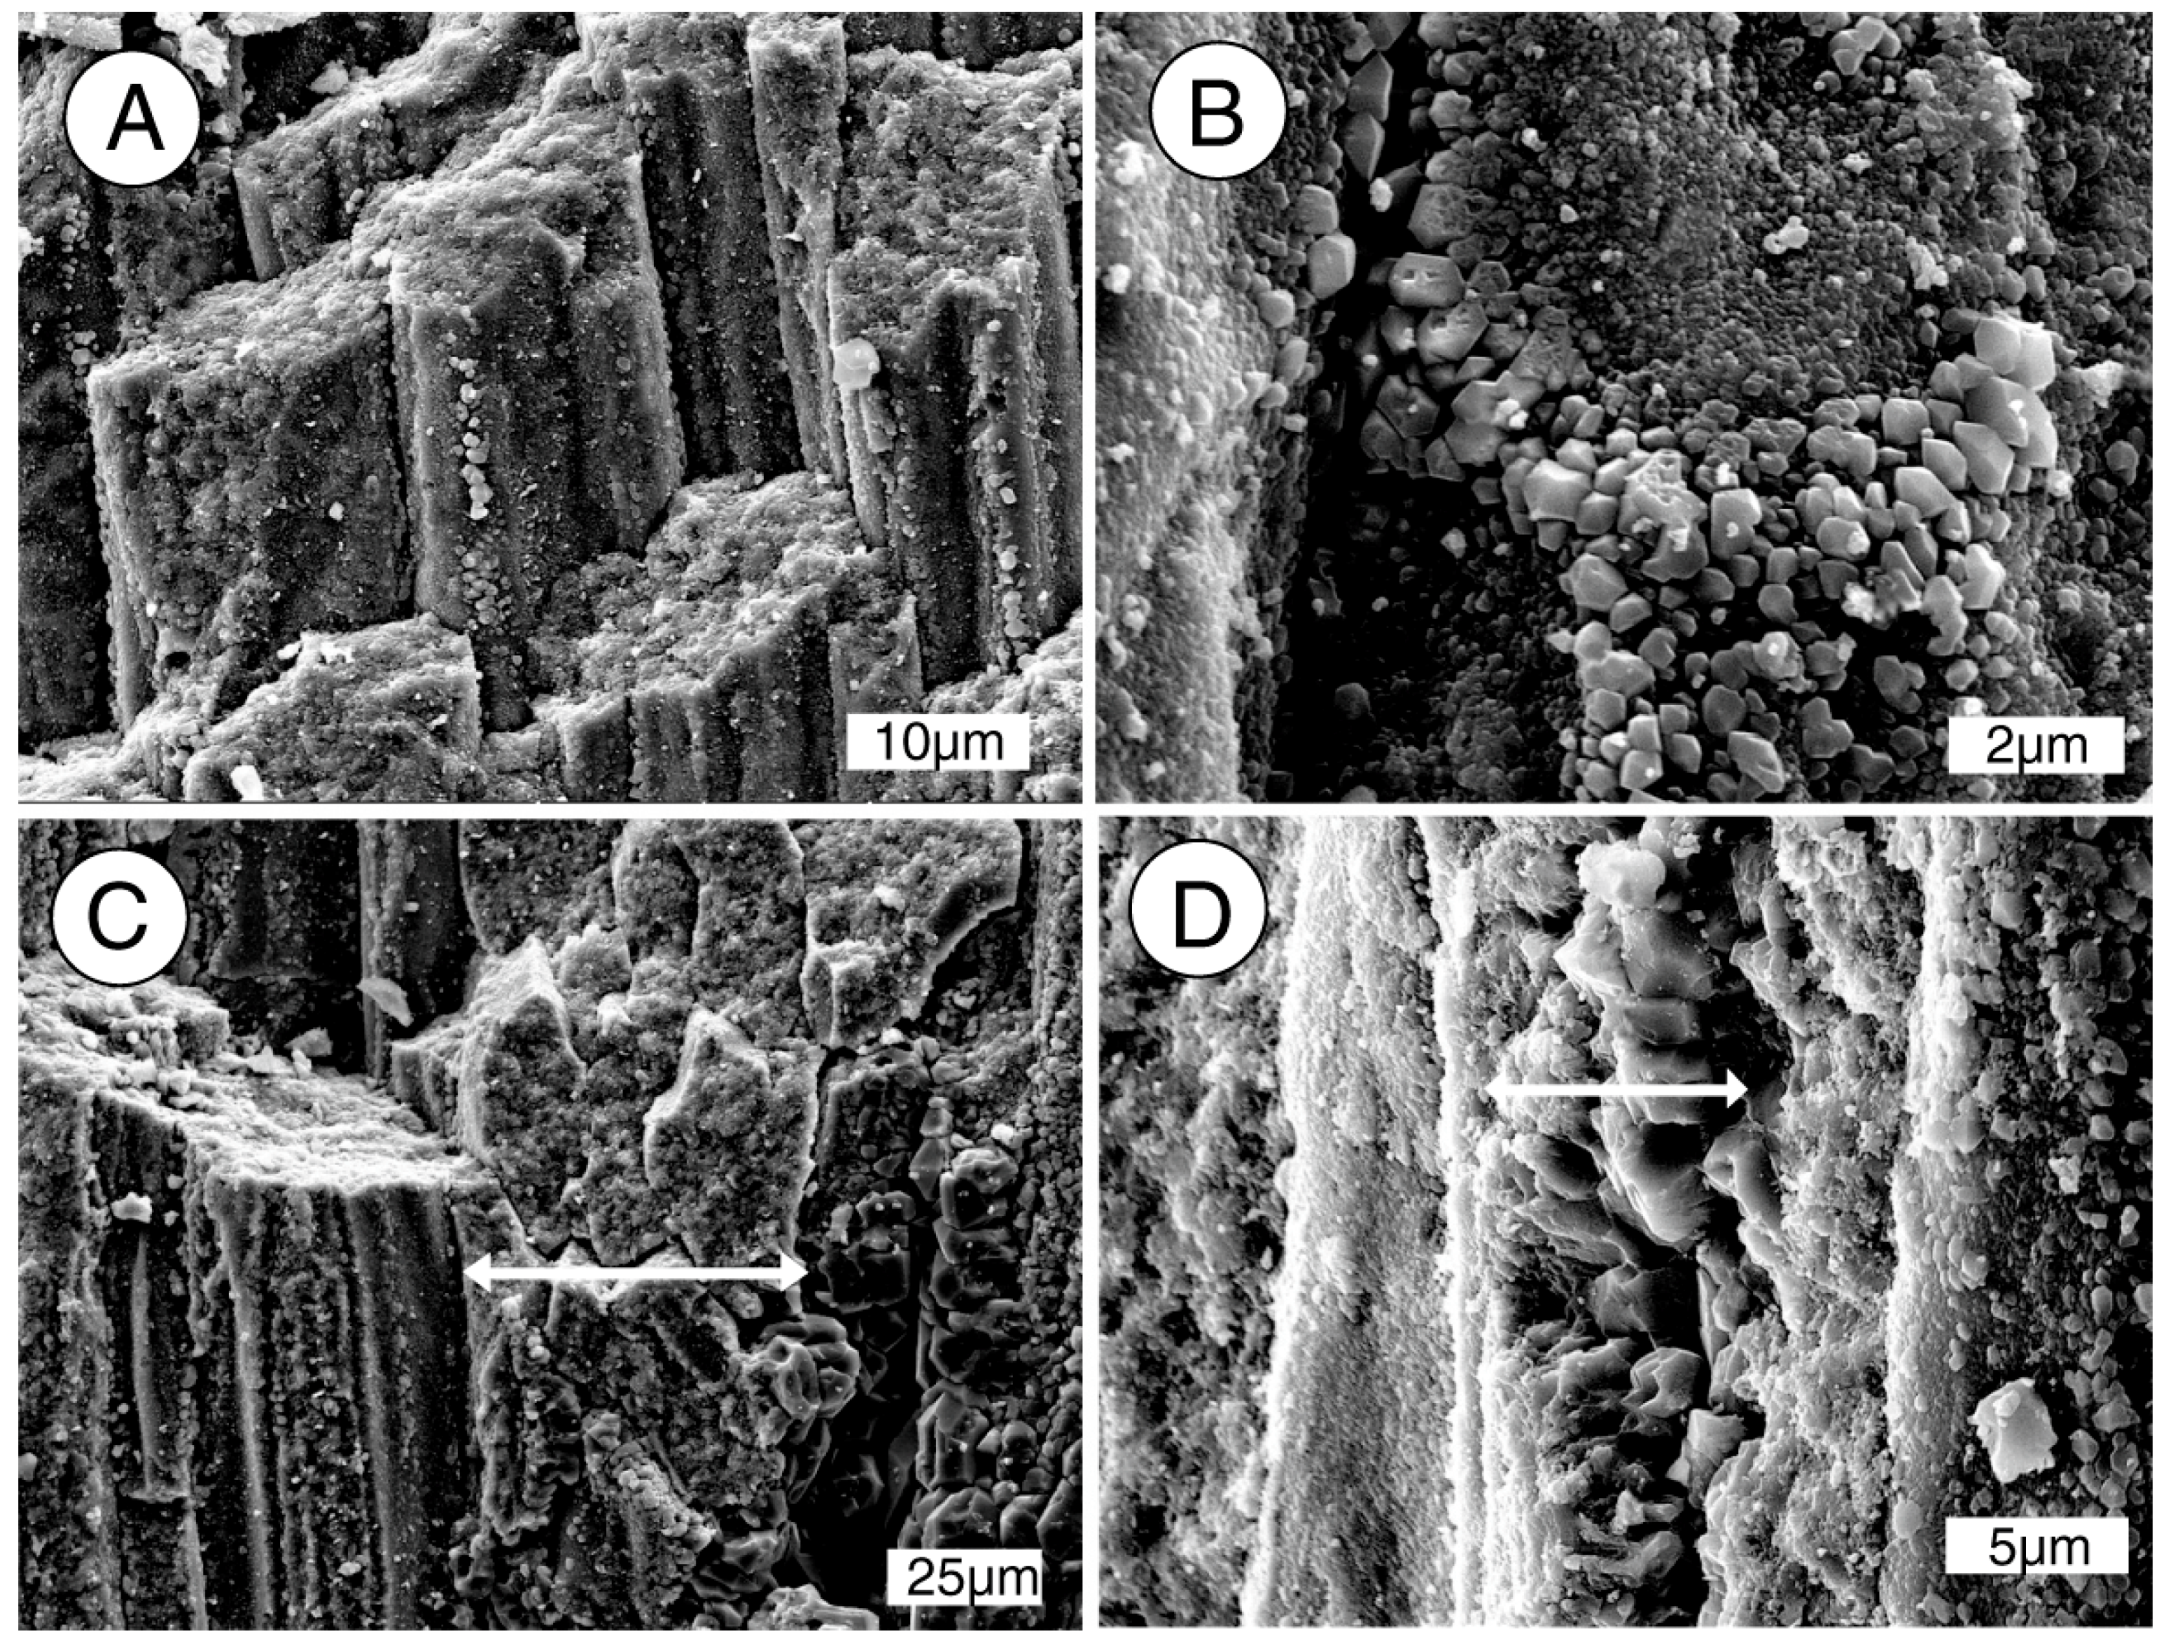
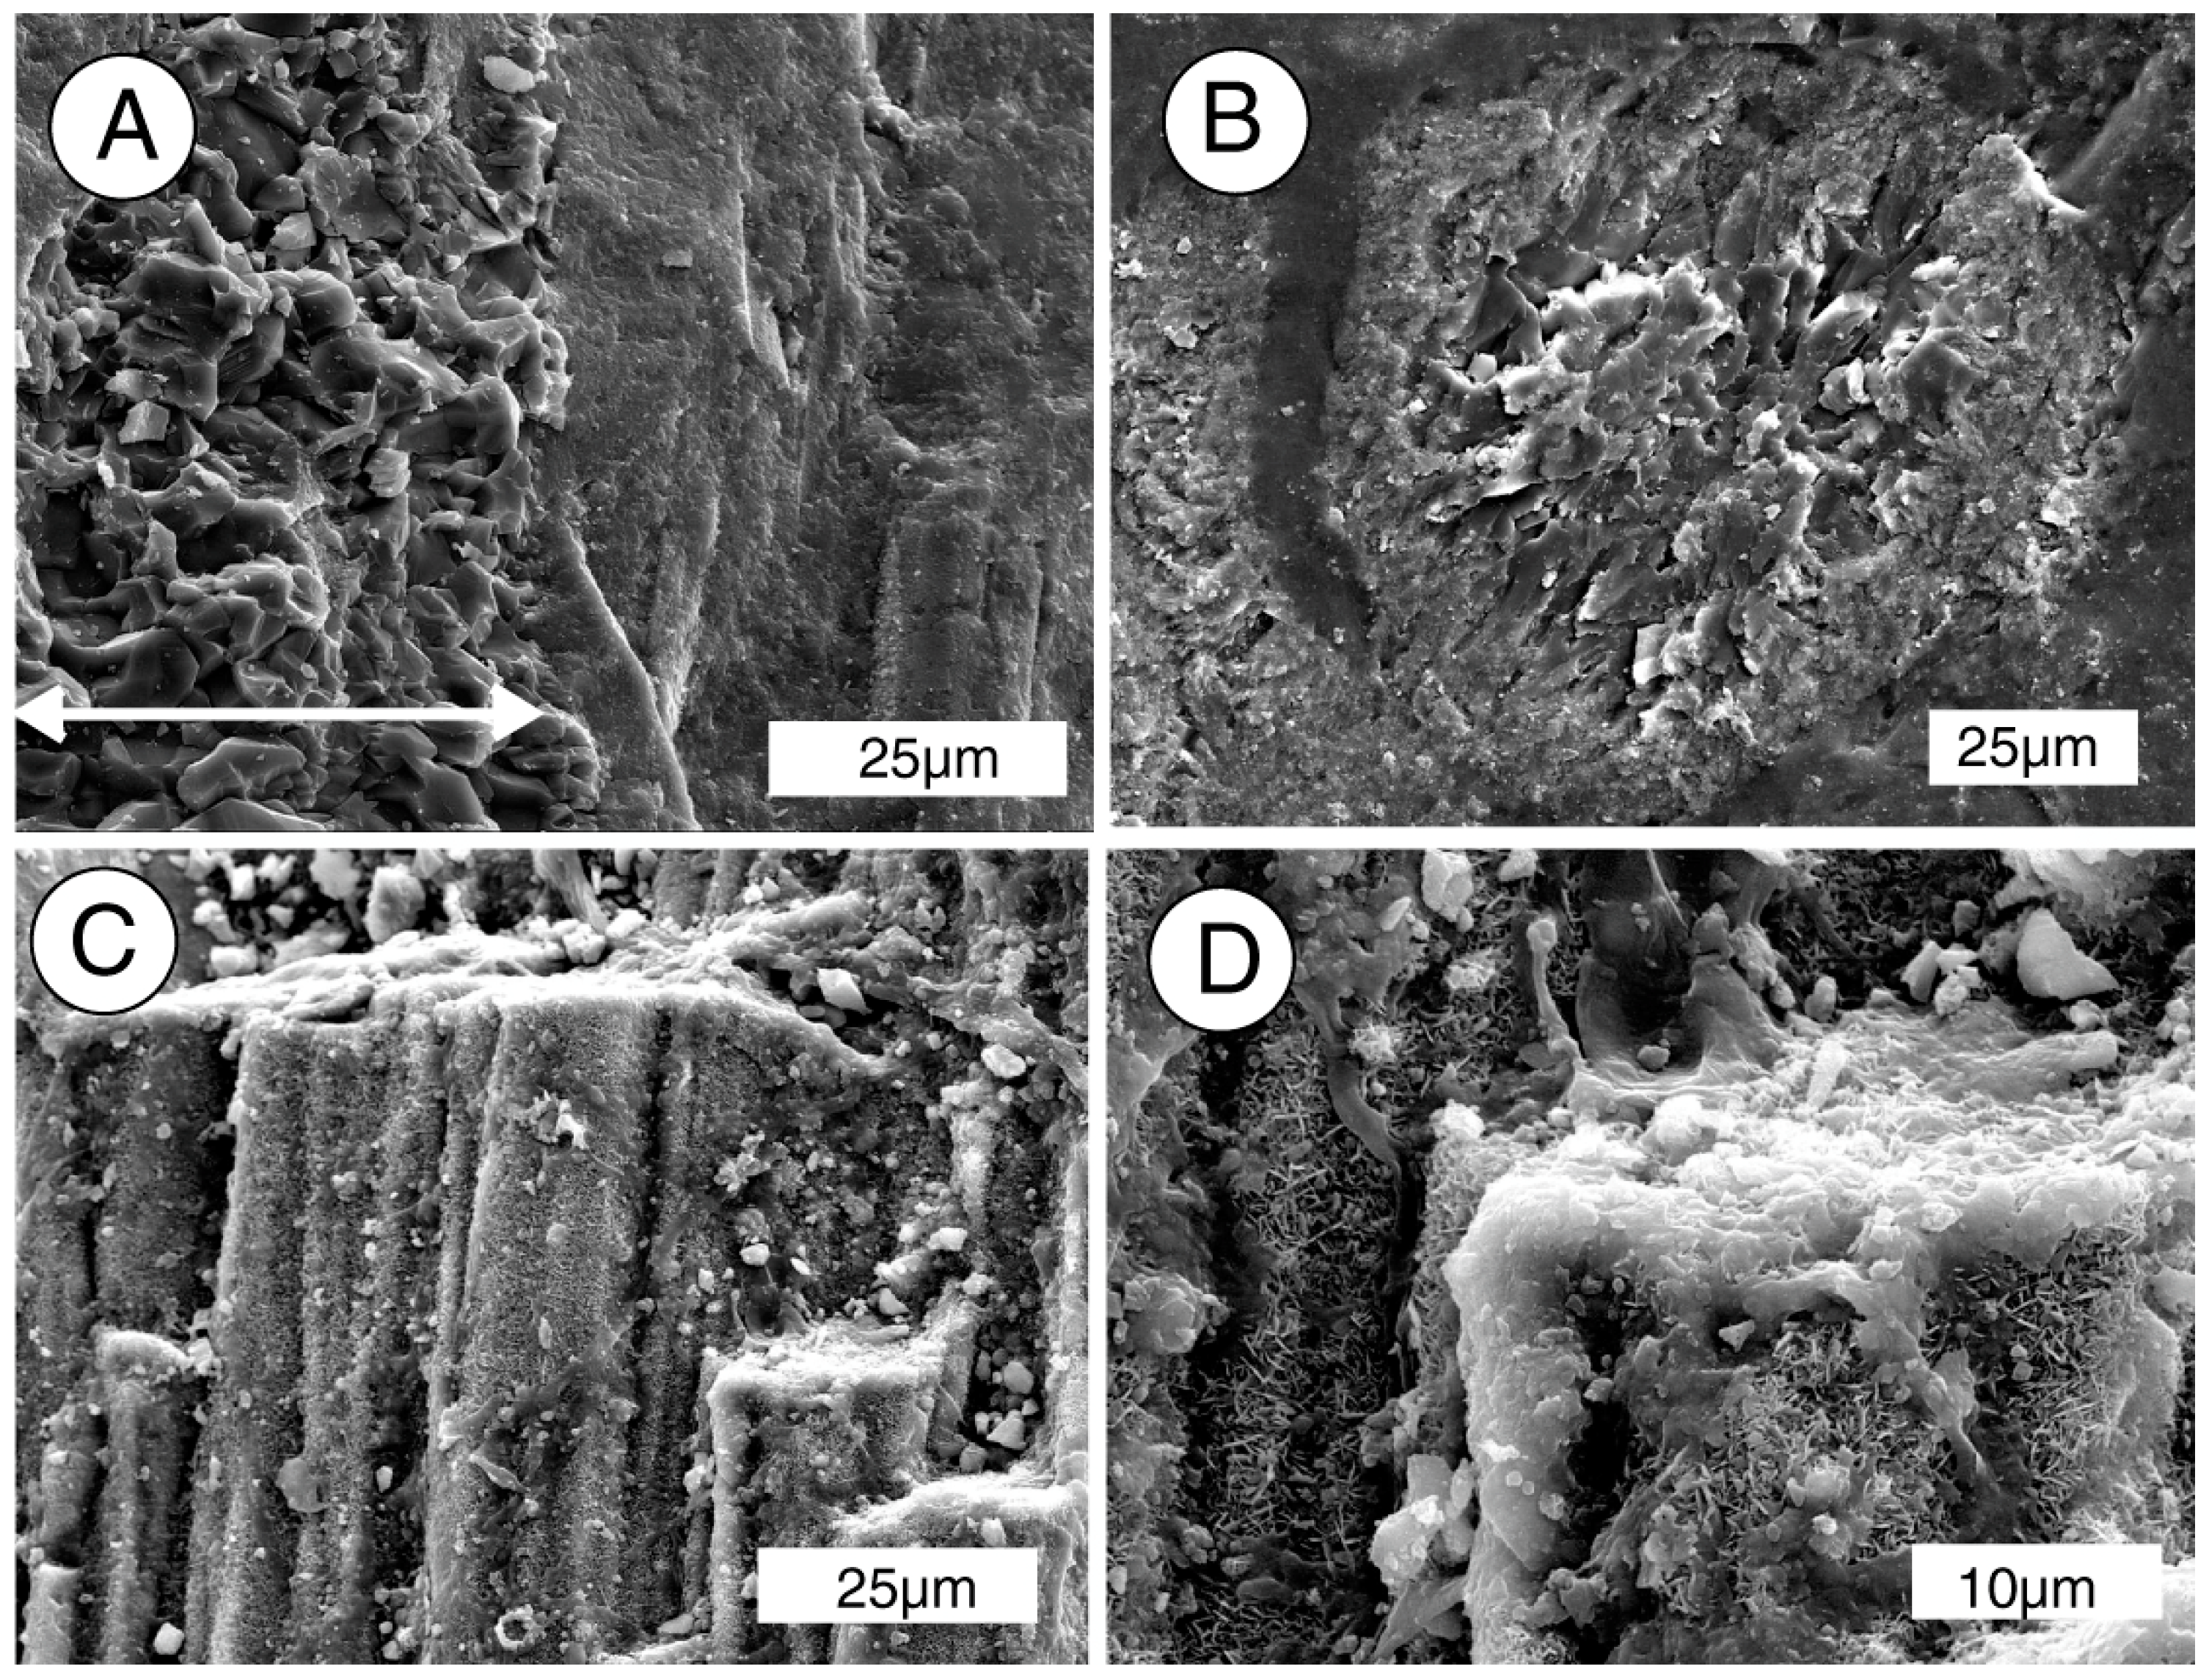
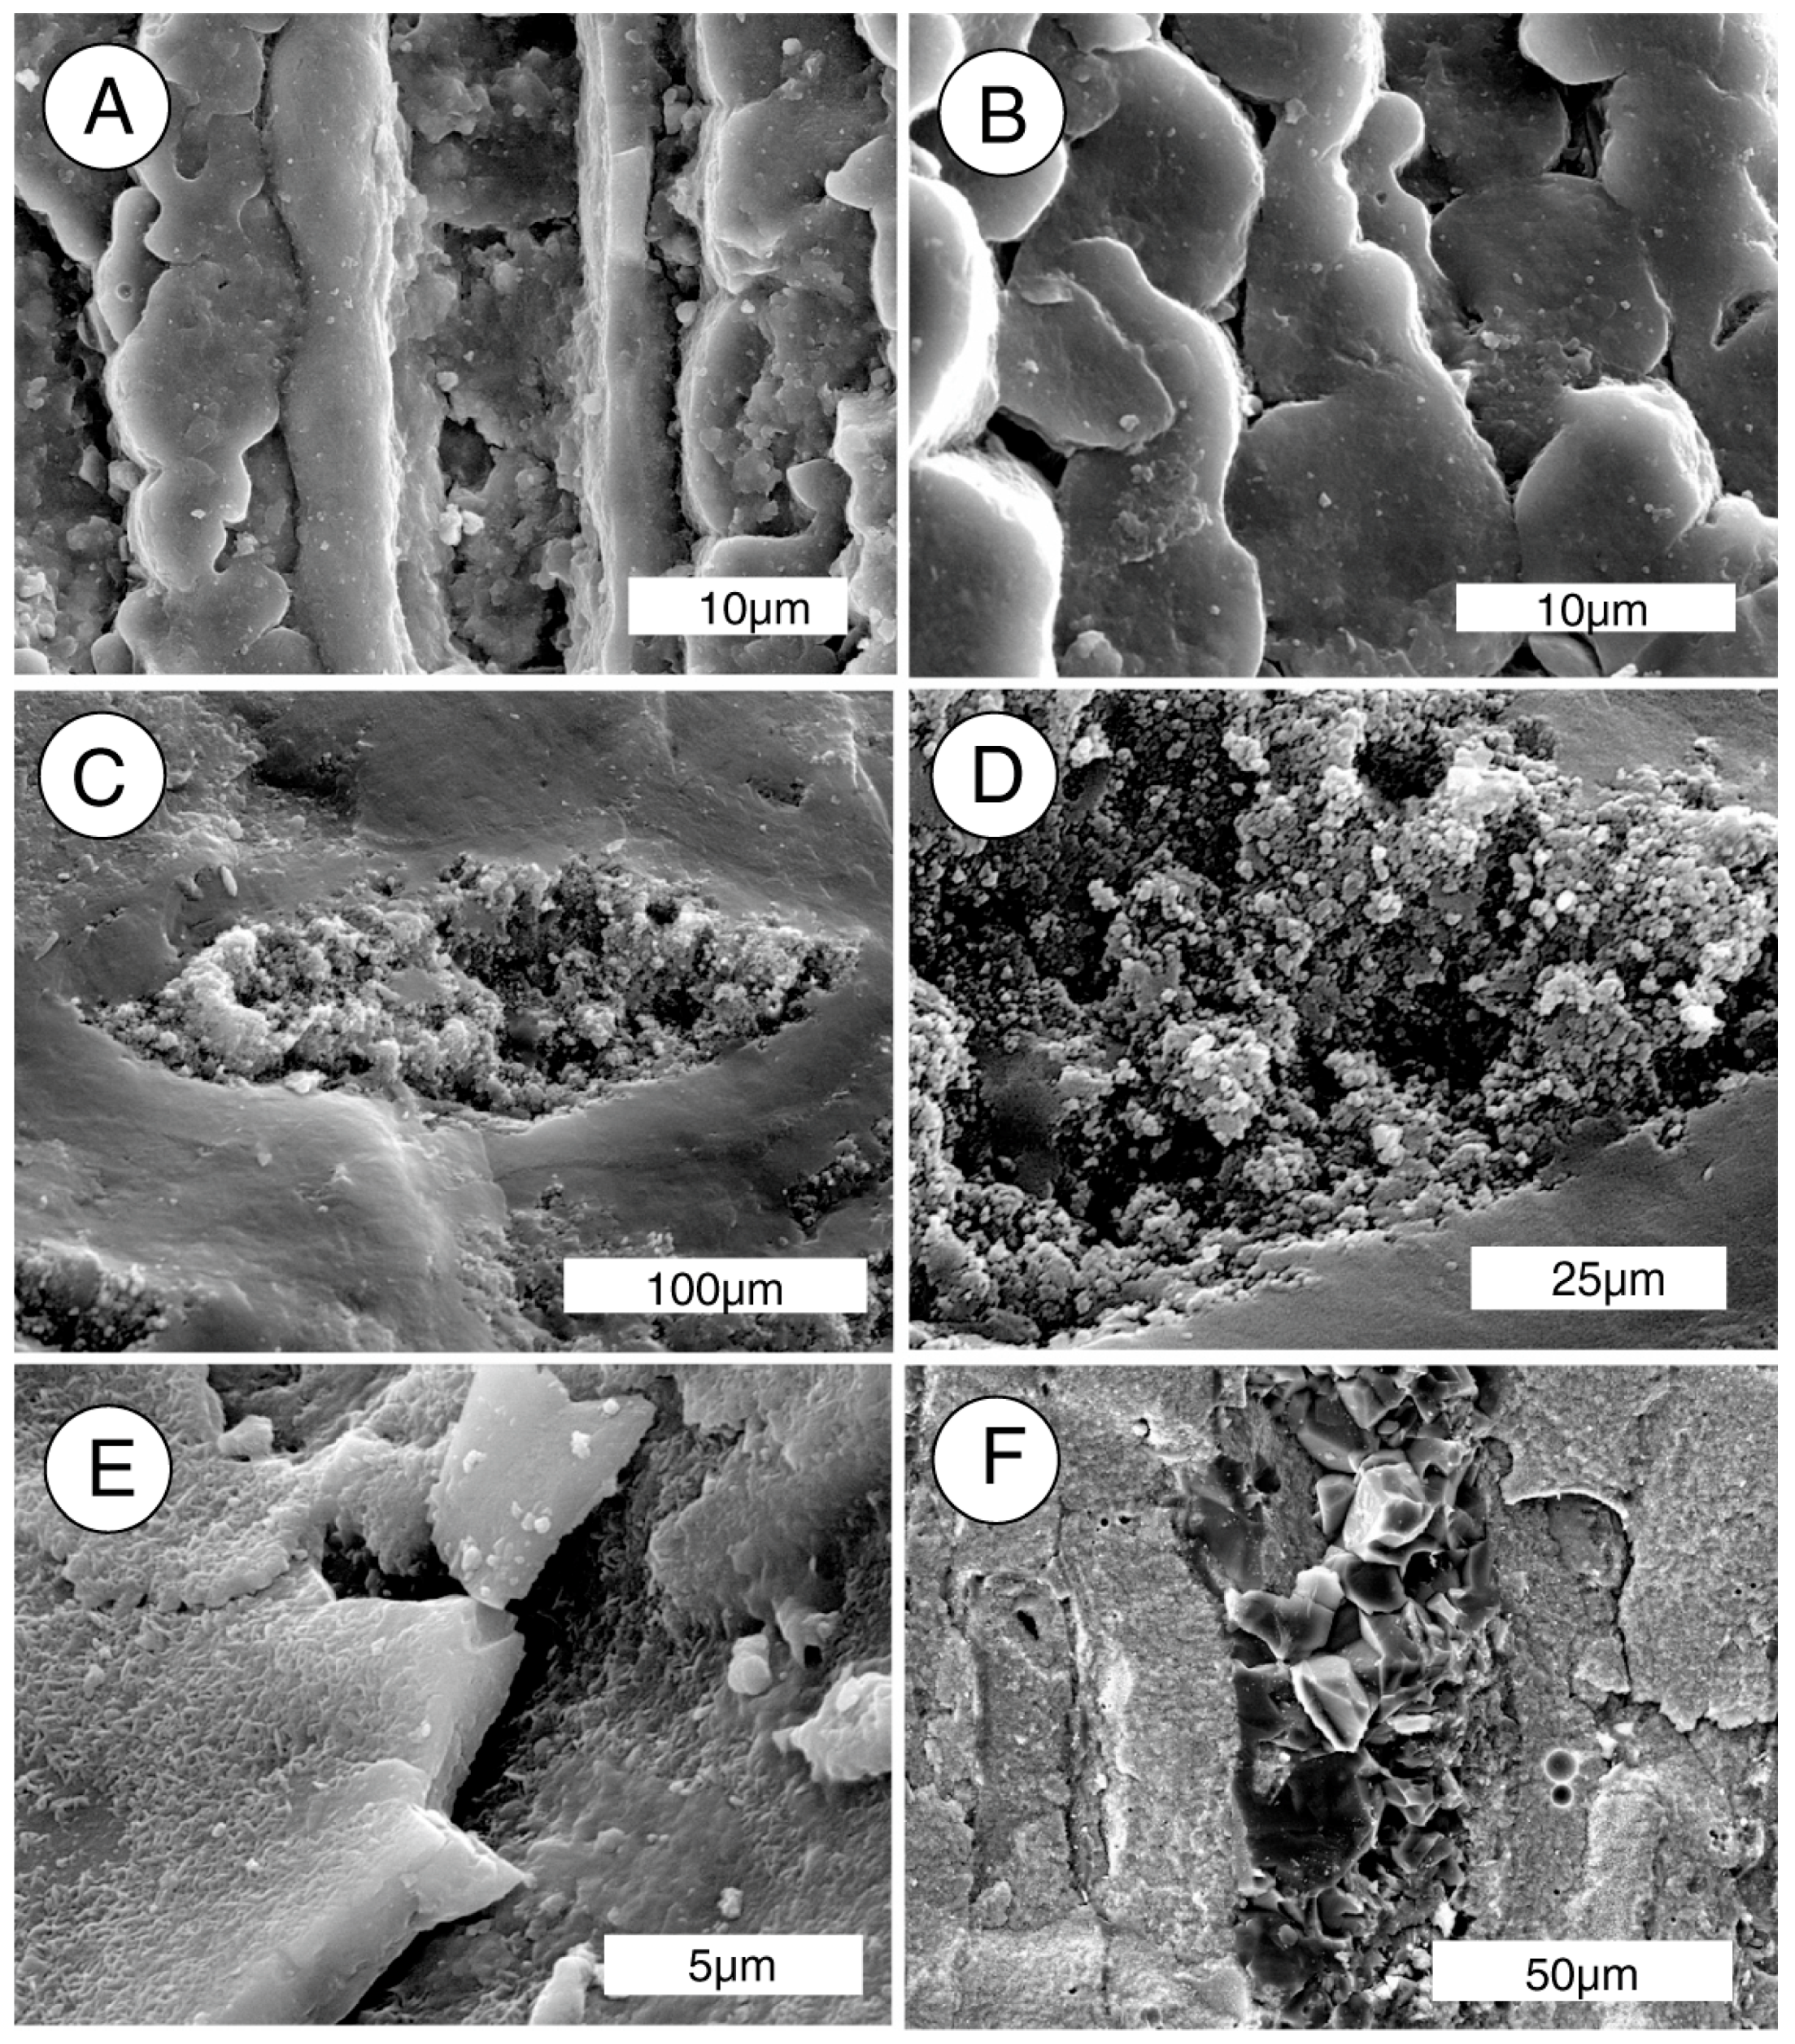
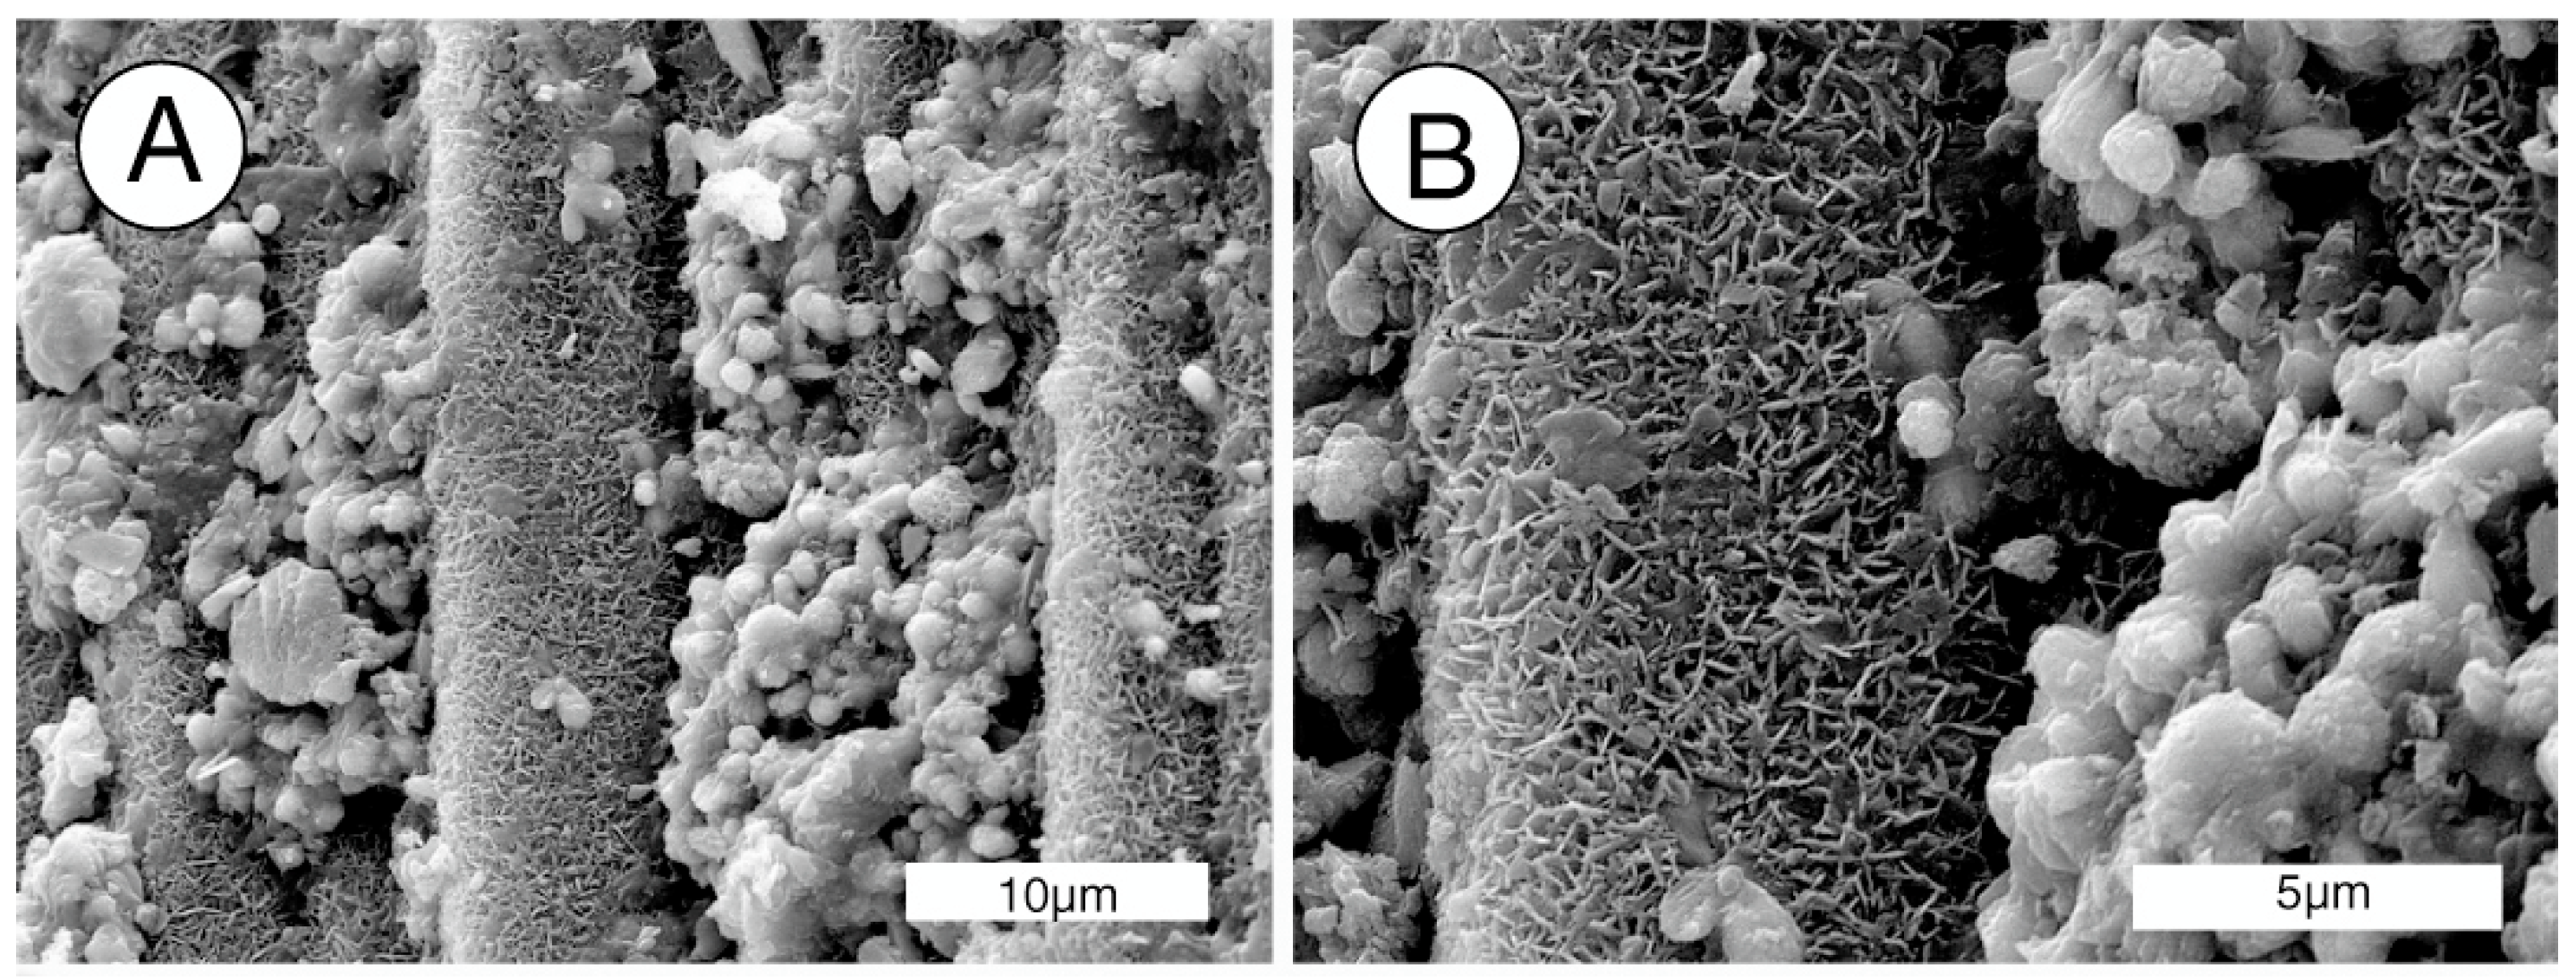
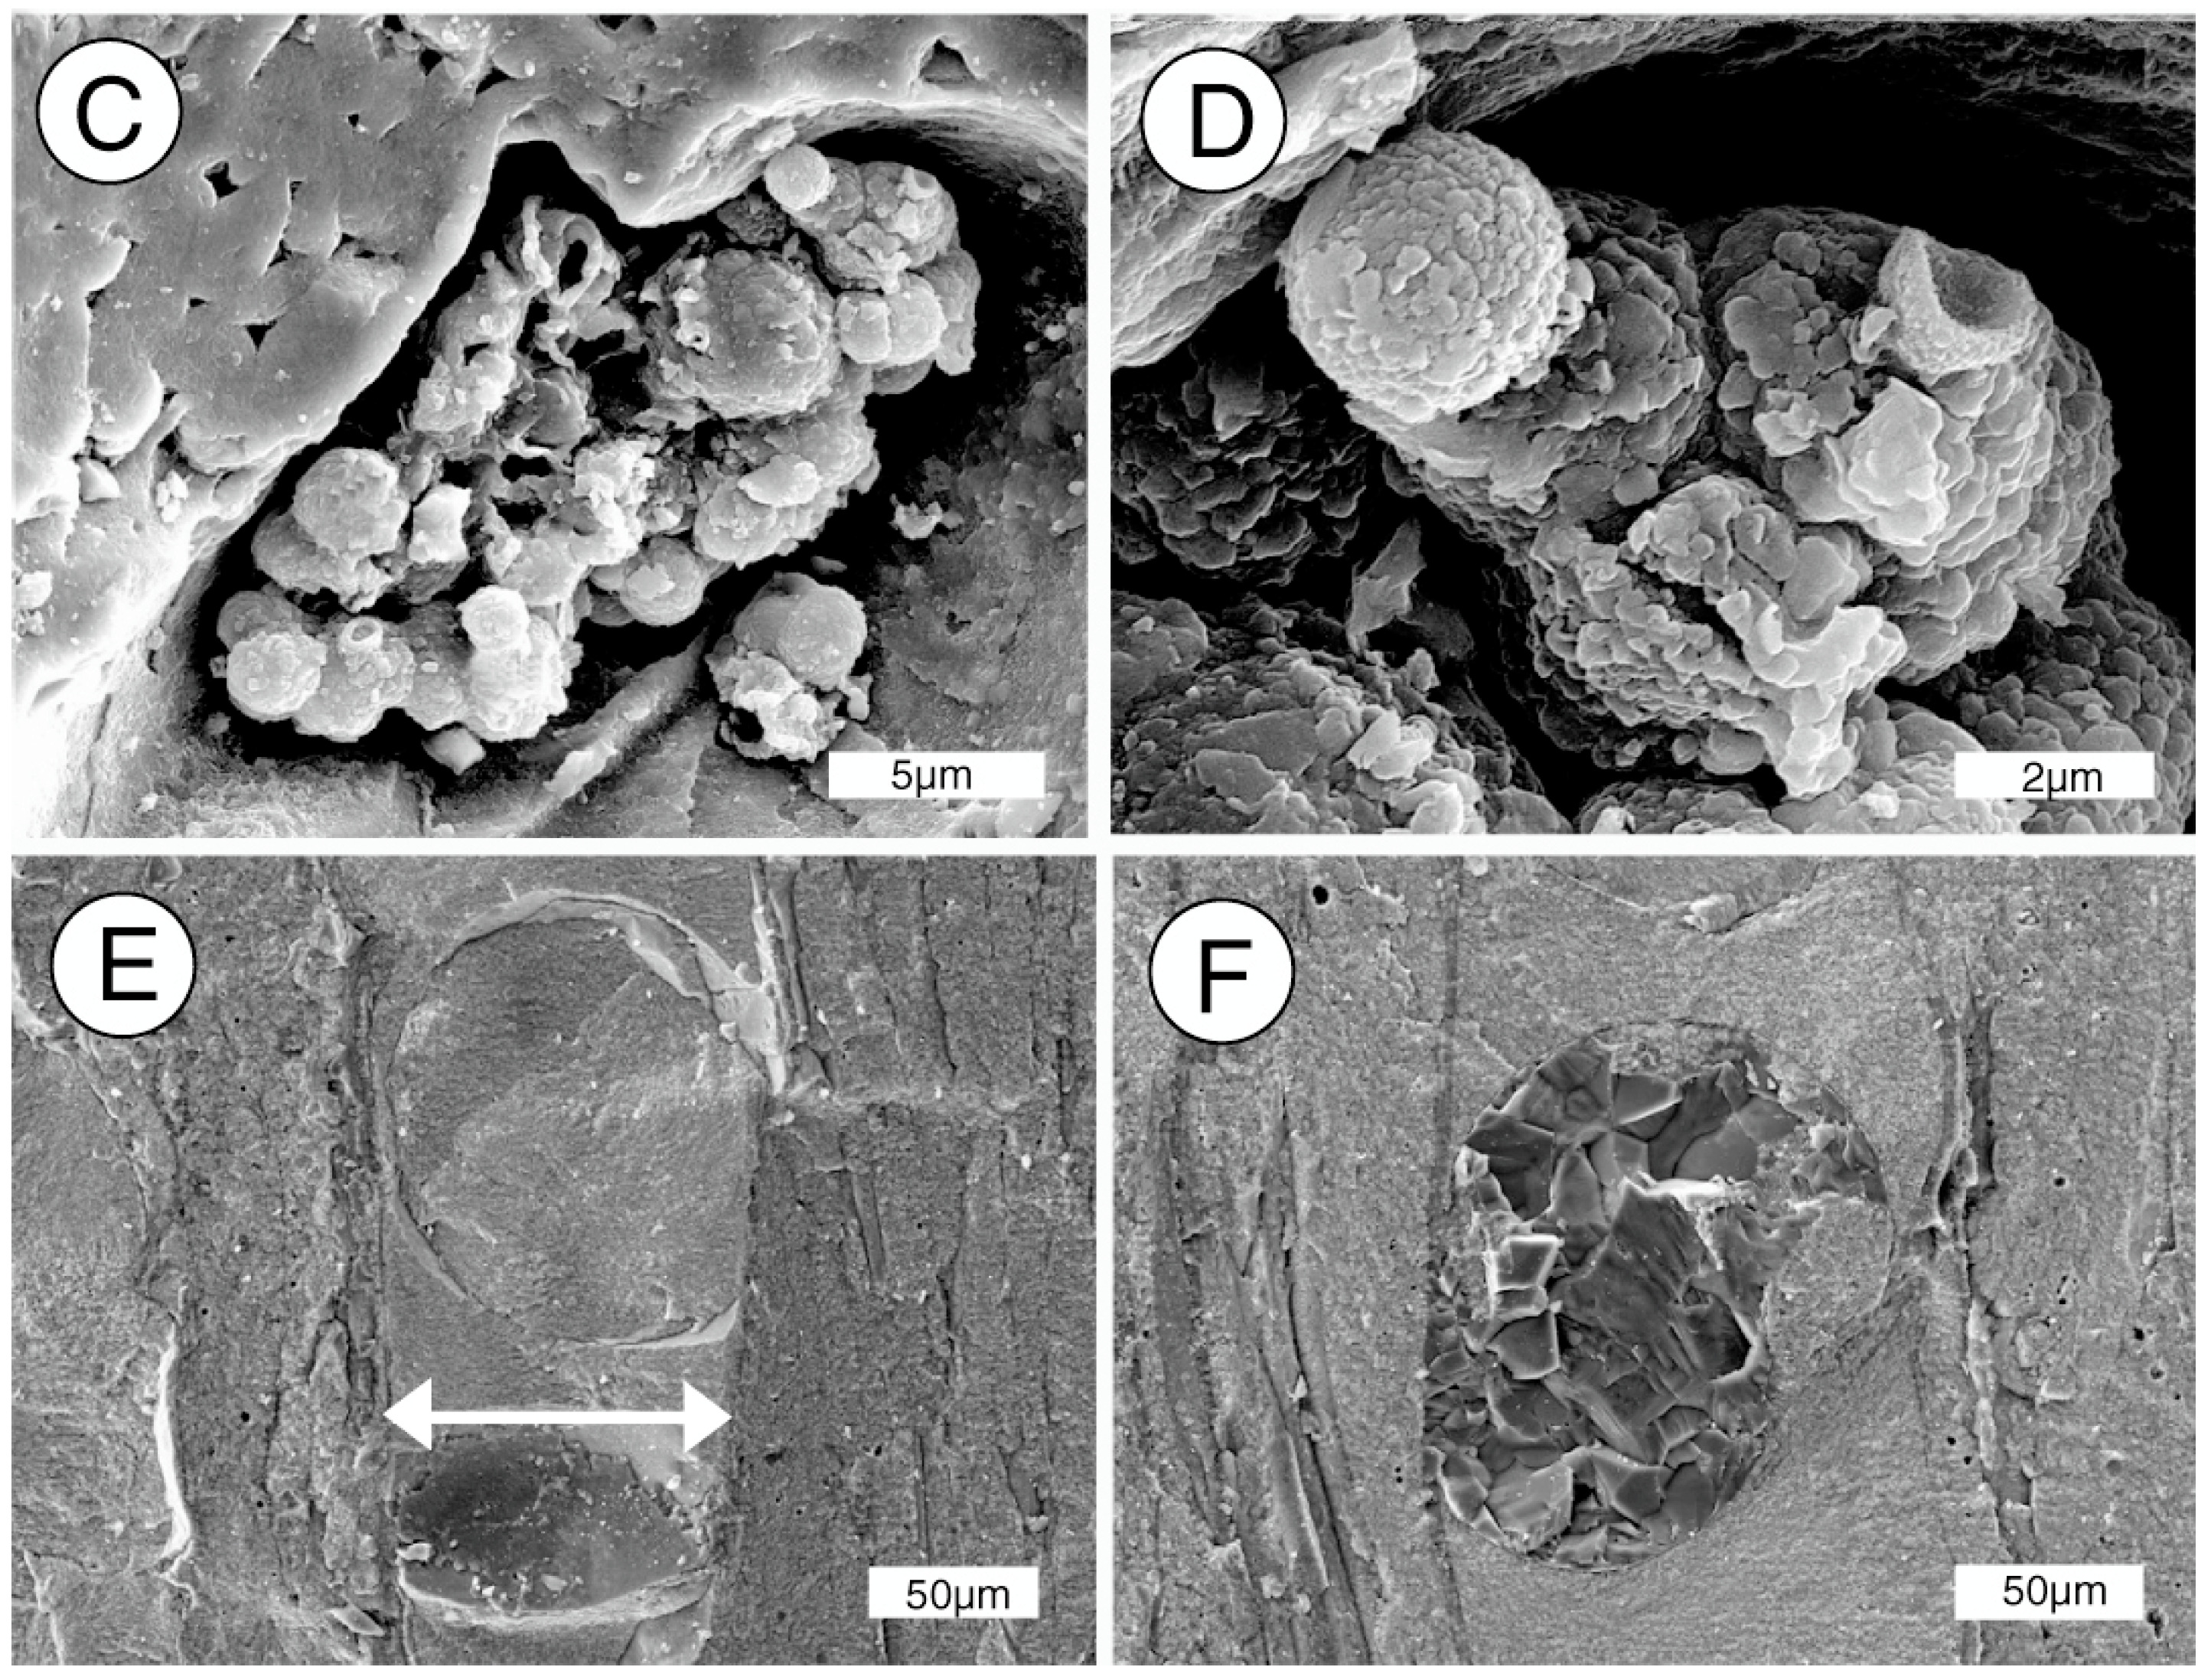
3.5. Scanning Electron Microscopy
3.6. Trace Elements
4. Results & Discussion
4.1. Mineralogy
4.2. Evidence for Multiple Phases of Mineralization
4.3. Significance of Non-Silica Minerals
4.4. Summary
4.5. Future Research
Acknowledgments
Author Contributions
Conflicts of interest
References
- Rubino, J. Cherokee Ranch Logs Offer Peak into 55 Million Year of History. The Denver Post: Denver, Colorado, USA, 2015. Available online: http://www.denverpost.com/2015/10/21/cherokee-ranch-logs-offer-peek-into-55-million-years-of-history/ (accessed on 12 December 2016).
- Raynolds, R.G. Synorogenic and post-orogenic strata in the central Front Range, Colorado. In Geologic History of the Colorado Front Range; Bolyard, D.W., Sonnenberg, S.A., Eds.; American Association of Petroleum Geologists—Rocky Mountain Section Field Trip No. 1997; Rocky Mountain Association of Geologists: Denver, CO, USA, 1997; pp. 43–47. [Google Scholar]
- Raynolds, R.G. Upper Cretaceous and Tertiary stratigraphy of the Denver Basin, Colorado. Rocky Mt. Geol. 2002, 37, 111–134. [Google Scholar] [CrossRef]
- Raynolds, R.G.; Johnson, K.R. Synopsis of the stratigraphy and paleontology of the uppermost Cretaceous and lower Tertiary strata in the Denver Basin, Colorado. Rocky Mt. Geol. 2003, 38, 171–181. [Google Scholar] [CrossRef]
- Tweto, O. Geologic Map of Colorado. In US Geological Survey Special Geologic Map; Scale 1:500,000; USGS: Reston, VA, USA, 1979. [Google Scholar]
- Kirkham, R.M.; Ludwig, L.R. Coal Resources of the Denver and Cheyenne Basins, Colorado; Colorado Geological Survey Resources Series 5; Colorado Geological Survey: Golden, CO, USA, 1979; p. 70. [Google Scholar]
- Johnson, K.R.; Reynolds, M.L.; Werth, K.W.; Thomasson, J.R. Overview of the Late Cretaceous, early Paleocene, and early Eocene megafloras of the Denver Basin, Colorado. Rocky Mt. Geol. 2003, 38, 101–120. [Google Scholar] [CrossRef]
- Barclay, R.S.; Johnson, K.R.; Betterton, W.J.; Dilcher, D.L. Stratigraphy and megaflora of a K-T boundary section in the eastern Denver Basin, Colorado. Rocky Mt. Geol. 2003, 38, 45–71. [Google Scholar] [CrossRef]
- Wheeler, E.A.; Michalski, T.C. Paleocene and early Eocene woods of the Denver Basin, Colorado. Rocky Mt. Geol. 2003, 38, 29–43. [Google Scholar] [CrossRef]
- Roberts, S.B. Coal in the Front Range Urban Corridor—An Overview of Coal Geology, Coal Production, and Coal-bed Methane Potential in Selected Areas of the Denver Basin, Colorado, and the Potential Effects of Historical Coal Mining on Development and Land-use Planning, Chapter F. In Energy Resource Studies, Northern Front Range, Colorado; Fishman, N.S., Ed.; U.S. Geological Survey Professional Paper 1698; USGS: Reston ,VA USA; pp. 117–162.
- Mustoe, G.E.; Acosta, M. Origin of petrified wood color. Geosciences 2016, 6, 25. [Google Scholar] [CrossRef]
- Mustoe, G.E. Density and loss on ignition as indicators of the fossilization of silicified wood. IAWA J. 2016, 37, 98–111. [Google Scholar] [CrossRef]
- Rossman, G.R. The colored varieties of the silica minerals. In Reviews in Mineralogy; Haney, P.J., Ed.; Mineralogical Society of America: Washington, DC, USA, 1994; pp. 433–468. [Google Scholar]
- Fritsch, E.; Rossman, G.R. An update on color in gems, part 1: Introduction and colors caused by dispersed metal ions. Gems Gemol. 1987, 23, 126–139. [Google Scholar] [CrossRef]
- Dietrich, D.; Viney, M.; Lampke, T. Petrifactions and wood-templated ceramics: Comparisons between natural and artificial silicification. IAWA J. 2015, 36, 167–185. [Google Scholar] [CrossRef]
- Leo, R.F.; Barghoorn, E.S. Silicification of Wood. Harv. Univ. Mus. Leafl. 1976, 25, 1–47. [Google Scholar]
- Stein, C.L. Silica recrystallization of petrified wood. J. Sediment. Petrol. 1982, 52, 1277–1282. [Google Scholar]
- Scurfield, G.; Segnit, E.R. Petrifaction of wood by silica minerals. Sediment. Geol. 1984, 39, 149–167. [Google Scholar] [CrossRef]
- Mizutani, S. Silica minerals in early stages of diagenesis. Sedimentology 1970, 15, 19–36. [Google Scholar] [CrossRef]
- Mitzutani, S. Progressive ordering of cristobalitic silica in the early stages of diagenesis. Contrib. Mineral. Petrol. 1977, 61, 419–436. [Google Scholar]
- Davis, E.F. The radiolarian cherts of the Franciscan Group. Univ. Calif. Dep. Geol. Bull. 1918, 11, 2235–2432. [Google Scholar]
- Murata, K.J.; Nakata, J.K. Cristobalitic stage in the diagenesis of diatomaceous shale. Science 1974, 184, 567–568. [Google Scholar] [CrossRef] [PubMed]
- Ernst, W.G.; Calvert, S.E. An experimental study of the recrystallization of porcellanite and its bearing on the origin of some bedded cherts. Am. J. Sci. 1969, 267A, 114–133. [Google Scholar]
- Mustoe, G.E. Diatomaceous origin of siliceous shale in Eocene lake beds of central British Columbia. Can. J. Earth Sci. 2005, 42, 231–241. [Google Scholar] [CrossRef]
- Mustoe, G.E. Late Tertiary petrified wood from Nevada, USA: Evidence of multiple silicification pathways. Geosciences 2015, 5, 286–309. [Google Scholar] [CrossRef]
- Akahane, H.; Furuno, T.; Miyajima, H.; Yoshikawa, T.; Shiguru, Y. Rapid wood silicification in hot spring water: An explanation of silicification of wood during the Earth’s history. Sediment. Geol. 2004, 169, 219–228. [Google Scholar] [CrossRef]
- Channing, A.; Edwards, D. Experimental taphonomy: Silicification of plants in Yellowstone hot-spring environments. Trans. R. Soc. Edinb. Earth Sci. 2004, 94, 503–521. [Google Scholar] [CrossRef]
- Hellawel, J.; Ballhaus, C.; Gee, C.Y.; Mustoe, G.E.; Nagel, T.; Wirth, R.; Rethemeyer, J.; Tomaschek, F.; Geisler, T.; Greef, K.; et al. Incipient mineralization of recent conifer wood at a Yellowstone hot spring. Geochim. Cosmochim. Acta 2015, 149, 79–87. [Google Scholar] [CrossRef]
- Kastner, M.; Keene, J.B.; Gieskes, J.M. Diagenesis of siliceous oozes—1. Chemical controls on the rate of opal-A to opal-CT transformation—An experimental study. Geochim. Cosmochim. Acta 1977, 41, 1041–1059. [Google Scholar] [CrossRef]
- Herdianita, N.R.; Browne, P.R.L.; Rodgers, K.A. Mineral and textural changes accompanying aging of silica sinter. Miner. Depos. 2000, 5, 48–62. [Google Scholar] [CrossRef]
- Campbell, K.A.; Sannazaro, K.; Rodgers, K.A.; Herdianite, N.; Brown, P.R. Sedimentary facies and mineralogy of late Pleistocene Umukiri sinter, Taupo volcanic zone, New Zealand. J. Sediment. Res. 2001, 71, 727–746. [Google Scholar] [CrossRef]
- Bostick, N.H. Microscopic measurement of the level of catagenesis in solid organic matter in sedimentary rocks to aid exploration for petroleum and to estimate burial temperature—A review. In Aspects of Diagenesis; Scolle, P.A., Schluger, P.R., Eds.; Society of Economic Paleontologists and Mineralogists Special Publication: Tulsa, OK, USA, 1979; Volume 26, pp. 17–43. [Google Scholar]
- Castaño, J.R.; Sparks, D.M. Interpretation of vitrinite reflectance measurements in sedimentary rocks and determination of burial history using reflectance and authigenic minerals. In Carbonaceous Materials as Indicators of Metamorphism; Dutcher, R.R., Ed.; Geological Society of America Special Paper 153; Geological Society of America: Boulder, CO, USA, 1974; pp. 31–52. [Google Scholar]
- Buurman, P. Mineralization of fossil wood. Scr. Geol. 1972, 12, 1–43. [Google Scholar]
- Viney, M.; Deitrich, D.; Mustoe, G.; Link, P.; Lampke, T.; Gotze, J.; Rossler, R. Multui-stage silicification of Pliocene wood: Re-examination of an 1985 discovery from Idaho, USA. Geosciences 2016, 6, 21. [Google Scholar] [CrossRef]
- Mustoe, G.E. Mineralogy and geochemistry of late Eocene silicified wood from Florissant Fossil Beds National Monument, Colorado. In Paleontology of the Upper Eocene Florissant Formation, Colorado; Meyer, H.W., Smith, D.M., Eds.; Geological Society of America Special Paper 435; Geological Society of America: Boulder, CO, USA, 2008; pp. 127–140. [Google Scholar]
- Murata, K.J. Volcanic ash as a source of silica for silicified wood. Am. J. Sci. 1940, 238, 586–596. [Google Scholar] [CrossRef]
- Ballhaus, C.; Gee, C.T.; Bockrath, C.; Greef, K.; Mansfeldt, T.; Rhede, D. Thesilicification of trees in volcanic ash—An experimental study. Geochim. Cosmochim. Acta 2012, 84, 62–74. [Google Scholar] [CrossRef]
- Strullu-Dwrriwnm, C.; Kenrick, P.; Tafforeau, P.; Cochard, H.; Bonnemain, J.; Le Hérissé, A.; Lardeux, H.; Badel, E. The earlierst wood and its hydraulic properties documented in c. 407-million-ear-old fossils using synchtroton microtomography. Bot. Soc. Linn. Soc. 2014, 175, 423–437. [Google Scholar] [CrossRef]
- Rust, G.W. Colloidal primary copper ores of Cornwall Mines, southwest Missouri. J. Geol. 1935, 43, 398–426. [Google Scholar] [CrossRef]
- Sawlowicz, Z. Framboids: From their origin and application. Prace Mineral. (Mineral. Trans.) 2000, 88, 1–58. [Google Scholar]
- Sawlowicz, Z. Pyrite framboids and their development: a new conception. Geol. Rundsch. 2000, 82, 148–156. [Google Scholar] [CrossRef]
- Garrels, R.M.; Christ, C.L. Solutions, Minerals and Equilibria; Harper and Row, New York and John Weatherhill, Inc.: Tokyo, Japan, 1965. [Google Scholar]
- Cherokee Ranch and Castle. Available online: https://cherokeeranch.org/ (accessed on 8 April 2017).


| % Quartz | % Opal | Calculated Density (g/cm3) | |
|---|---|---|---|
| d = 2.50 g/cm2 | d = 2.0 g/cm2 | ||
| 0 | 100 | 2.00 | |
| 10 | 90 | 2.05 | |
| 20 | 80 | 2.10 | |
| 30 | 70 | 2.15 | |
| 40 | 60 | 2.20 | |
| 50 | 50 | 2.25 | |
| 60 | 40 | 2.30 | |
| 70 | 30 | 2.35 | |
| 80 | 20 | 2.40 | |
| 90 | 10 | 2.45 | |
| 100 | 0 | 2.50 | |
| Results for Cherokee Ranch samples | |||
| % quartz | % opal | Density | Sample |
| 75 | 25 | 2.37 | CR-40 |
| 100 | 0 | 2.49 | W. Shard |
| 100 | 0 | 2.50 | CR-1 |
| 100 | 0 | 2.48 | CR-5 |
| 100 | 0 | 2.54 | CR-12 |
| 100 | 0 | 2.53 | CR-14 |
| 100 | 0 | 2.51 | CR-16 |
| Sample | Ti | V | Cr | Mn | Fe | Co | Ni | Cu | U |
|---|---|---|---|---|---|---|---|---|---|
| CR-1 | 12 | 0 | 0 | 7 | 118 | 0 | 2 | 14 | 4 |
| CR-5 | 10 | 9 | 0 | 7 | 124 | 0 | 3 | 19 | 14 |
| CR-12 | 6 | 0.2 | 4 | 4 | 286 | 0.1 | 3 | 16 | 3 |
| CR-14 | 6 | 1 | 14 | 5 | 582 | 0.2 | 3 | 10 | 10 |
| CR-16 | 16 | 1 | 22 | 16 | 336 | 0.3 | 2 | 19 | 37 |
| CR-40 | 5 | 1 | 59 | 4 | 701 | 0.1 | 2 | 32 | 21 |
| W. Shard | 11 | 1 | 33 | 17 | 305 | 0.3 | 2 | 19 | 37 |
© 2017 by the authors. Licensee MDPI, Basel, Switzerland. This article is an open access article distributed under the terms and conditions of the Creative Commons Attribution (CC BY) license (http://creativecommons.org/licenses/by/4.0/).
Share and Cite
Mustoe, G.E.; Viney, M. Mineralogy of Paleocene Petrified Wood from Cherokee Ranch Fossil Forest, Central Colorado, USA. Geosciences 2017, 7, 23. https://doi.org/10.3390/geosciences7020023
Mustoe GE, Viney M. Mineralogy of Paleocene Petrified Wood from Cherokee Ranch Fossil Forest, Central Colorado, USA. Geosciences. 2017; 7(2):23. https://doi.org/10.3390/geosciences7020023
Chicago/Turabian StyleMustoe, George E., and Mike Viney. 2017. "Mineralogy of Paleocene Petrified Wood from Cherokee Ranch Fossil Forest, Central Colorado, USA" Geosciences 7, no. 2: 23. https://doi.org/10.3390/geosciences7020023