Article

Evaluating the Scale and Potential of GLOF in the Bhutan Himalayas Using a Satellite-Based Integral Glacier–Glacial Lake Inventory

1
Japan Aerospace Exploration Agency, Tsukuba 350-8505, Japan
2
Niigata University, Niigata 950-2181, Japan
3
Nagoya University, Nagoya 464-8601, Japan
4
Remote Sensing Technology Center of Japan, Tsukuba 305-8505, Japan
*
Author to whom correspondence should be addressed.
Geosciences 2017, 7(3), 77; https://doi.org/10.3390/geosciences7030077
Submission received: 26 May 2017 / Revised: 28 August 2017 / Accepted: 29 August 2017 / Published: 1 September 2017
(This article belongs to the Special Issue Cryosphere)

Abstract

:
A comprehensive glacier–glacial lake inventory was developed for the Bhutan Himalayas based on satellite observations between 1987–1990 and 2006–2011. In total, 733 lakes (covering 82.6 km2) were delineated between 4000 and 6000 m a.s.l. and their relationships to associated glaciers were documented. Using this new inventory, the scale and potential for glacial lake outburst flooding (GLOF) based on multiple criteria was examined. This included a history of connectivity characteristics of glacial lakes to mother glaciers, potential flood volumes, and debris-cover of mother glaciers in addition to the conventional criteria of expansion rate and lake size. The majority of the lakes with high expansion rates (more than double in size) and large areas (>0.1 km2) met the conditions of being continuously in contact with a mother debris-covered glacier for nearly 20 years. Based on these multiple criteria, two lakes were identified as having potential for large-scale GLOF. Potentially dangerous glacial lakes listed in the International Centre for Integrated Mountain Development (ICIMOD) study were re-visited, and some overlaps with the glacier–glacial lake inventory were found.

1. Introduction

Nearly 10,000 glacial lakes are located in the Hindu Kush Himalayan (HKH) region and on the Tibetan Plateau [1,2]. Previous studies have reported changes in the surface areas of these lakes in recent decades. Compared to lakes in the western HKH region, glacial lakes in the eastern HKH region have exhibited larger increases in total and individual areas; notably, rapidly expanding supra- and pro-glacial lakes in contact with glaciers [3]. A previous study compiled a glacial lake inventory containing 30 lakes in the Bhutan Himalayas in the easternmost HKH region, and recorded a history of growth and integration of small lakes into fewer but larger lakes since the 1950s [4]. Lakes on the northern side of the Himalayan Range have shown slow expansion since the 1950s. In contrast, those on the southern side formed after the 1950s have rapidly expanded [5].
Glacial lake outburst flooding (GLOF) occurs when glacial lakes collapse, drain large volumes of water, and cause severe downstream damage (e.g., [6,7,8,9]). To understand the recent status of glacial lakes and their GLOF potential in the Bhutan Himalayas, the International Centre for Integrated Mountain Development (ICIMOD) compiled a glacial lake inventory by means of topographic maps and satellite images. They identified 24 potentially dangerous glacial lakes (PDGLs) in the Bhutan Himalayas [10], which were selected using the criteria of: (1) expansion since 1968; (2) threshold lake area (>0.1 km2) and distance to glacier (<0.5 km); (3) water depth from in situ survey; and (4) various moraine-dam conditions and characteristics, such as materials, shapes, drainage, topography, presence/absence of internal ice, slope stability, signs of past breaching and GLOF, and seepage flow.
Since the ICIMOD study, there have been rapid improvements in observations and continuous progress in the understanding of GLOF processes [11]. For example, potential GLOF was assessed in the Cordillera Blanca, Peru, and some lakes were identified as having higher GLOF potential [12]. In general, there are both external/short-term and internal/long-term factors responsible for the collapse of moraine-dammed lakes. Short-term factors can be the presence/absence of slope movements into lakes, earthquakes, high-waves associated with flooding in upstream lakes, blocking of underground outflow channels, and intensive rainfall and/or snowmelt. Long-term factors can be the destruction of a dam by melting of buried ice, hydrostatic pressure effects, and gradual degradation of dams [13]. Nonetheless, it is extremely difficult to collect accurate information about many of these factors because of a region’s remoteness. Therefore, prior to any assessment of GLOF, it is necessary to build a geospatial database to gather basic statistical information and to evaluate possible GLOF scales and potential by means of satellite remote-sensing techniques. Following this strategy, an up-to-date comprehensive glacial lake inventory of the Bhutan Himalayas was generated from high-resolution satellite images acquired by the Advanced Land Observing Satellite (ALOS) operated by the Japan Aerospace Exploration Agency (JAXA). Another glacier data set was generated to describe the connectivity of the glacial lakes identified in the glacial lake inventory with respect to their associated glaciers, and the concept of potential flood volume (PFV) was introduced, which enabled the estimation of drainable water volumes from damming topography [14]. The current study re-assesses GLOF scale and potential in the Bhutan Himalayas using multiple criteria, including connectedness of glacial lakes to associated glaciers and PFVs.

2. Study Site

The current study focused on glacial lakes in the Bhutan Himalayas (27.496°–28.166° N; 88.791°–92.161° E) mostly located in the Kingdom of Bhutan (Druk Yul is the local name) (Figure 1). Bhutan is a landlocked country in southern Asia surrounded by India and China with a land area of approximately 40,000 km2 and a population of approximately 700,000. Glaciers and glacial lakes exist along the highly glacierised area of the main Himalayan Range and its branching ridges (within 4000 to 7500 m a.s.l.). This west-to-east high mountain range separates climatic conditions from north to south. The northern side has an arid climate with an annual precipitation of 500 to 1000 mm, while the southern side is influenced by the Indian Monsoon, especially in its high season between June and September, with a high level of precipitation (1000 to 2500 mm) [10]. On the southern side, a river system, typically divided into several sub-basins, flows north to south. Tectonically formed gentle hillslopes are dominant on the northern side (i.e., a southern rim of the Tibetan Plateau) (e.g., [15,16]). All of the river basins eventually connect to the Brahmaputra River system.
Glacier surface areas compose approximately 642 km2 of the Bhutanese domain, and have exhibited rapid shrinkage (>20%) between 1990 and 2010 [18]. The glaciers in this region are summer-accumulation-type, whereby accumulation and ablation occur simultaneously during the monsoon season [19], and thus are highly sensitive to changing climate. In situ measurements by [20] revealed that glacier mass loss in the Bhutan Himalayas (−1.12 to −2.04 m w.e. a−1) is greater than in neighboring regions (−0.22 to −0.51 m w.e. a−1 in Khumbu, Nepal, for example).

3. Data and Methods

3.1. Subsection Completion of Glacier and Glacial Lake Inventory

A former glacial lake inventory was generated by the ICIMOD covering 2674 lakes in the Bhutan Himalayas [10] based on topographic maps published in the 1950s–1970s by the Survey of India [21]. However, this inventory had a problem of significant horizontal offset [21]. The non-systematic horizontal shift and the 20-year temporal range were not ideal for recording areal evolution, present location, and other geographic parameters. One of the main outcomes from the Bhutan/Japan joint research project carried out between 2009 and 2012 was the production of an up-to-date glacial lake inventory generated from high-resolution satellite images acquired by ALOS as operated by JAXA [22].
The definition of a glacial lake and the delineation method for this study are explained in detail in Ukita et al. [21], which compiled the lakes in four basins in our study site. The visual identification and manual delineation of lake outlines were performed on ortho-rectified satellite images that had been pan-sharpened from ALOS PRISM and AVNIR–2 images acquired between 2006 and 2011 (Figure 2a,b). A PRISM-derived digital surface model (DSM) was used to distinguish flat lake surfaces from the surrounding topography. The specific dates of the ALOS images used are listed in the attached attribute table. Because our previous study was strongly motivated by the disaster management of GLOF, small lakes of <0.01 km2 were excluded from the analysis [21]. Moraine-dammed and bedrock dammed lakes are included, whereas those situated farther downstream from the Little Ice Age moraines (>2 km) were also excluded as they are less related to glaciation. On the other hand, lakes both in contact with glaciers and not in contact were included.
The details of ALOS-derived image processing, DSMs, and in situ validation of delineated lake outlines are described in [21,23]. They reported that the PRISM DSM used for the ALOS image ortho-rectification had a vertical accuracy of 2.3 ± 7.8 m against ground control points (N = 3268) and a delineated lake outline had a mean distance of 9.5 m (11.7 m in root mean square) from a global positioning system (GPS)-measured outline. It was noted, for the purposes of the current study, that these error values were sufficiently small for delineating lakes >0.01 km2.
The glacier inventory, used in the current study, was also developed from the same ALOS images from the period of 2006 to 2011 [16] (Figure 2a,b). The outlines of the glaciers and debris-covered areas were manually delineated. In total, 1364 debris-free glaciers and 219 debris-covered glaciers were identified. There were some difficulties in delineation associated with steep adjacent slopes. However, judging from a comparison and validation with other glacier inventories, these difficulties were not considered to pose serious problems for the current study.

3.2. Multiple Criteria for Scale and Potential

In the Bhutan Himalayas, pro-glacial lakes in contact with glaciers are expanding at faster rates than supra-glacial lakes and those without contact are expanding more slowly [4]. Many of the new lakes, formed after 1990, are supra-glacial and located on debris-covered glaciers [24]. This implies that the connection type and the presence of supra-glacial debris are strongly related to continuous lake expansion. In previous studies [2,3,4,25], lakes still in contact with associated glaciers were classified as supra-glacial (Cs) and pro-glacial (Cp) lakes. In the current study, four categories were used, including the Cs and Cp types. Because no satellite remote-sensing technique currently provides information on sub-lake ice bodies, lakes surrounded by a glacier surface were categorized as Cs types and those with a boundary to non-glaciated terrain as Cp types. Lakes with distant glaciers were classified as glacier-fed (Df) type and those without upstream glaciers as non-glacier-fed (Dn) type. Glacier outlines and information were obtained from the ALOS-derived glacier inventory described above (see [16]). For example, Figure 2a,b presents spatial distributions of glaciers and associated debris-covered areas. In addition, moraine-damming or bedrock-damming are distinguished by geomorphological visual interpretation in Google Earth (Google, Menlo Park, CA, USA).
A history of lake expansion is essential for GLOF assessment. To obtain past lake outlines, the ALOS-derived lake outlines were back-traced to ortho-rectified panchromatic (10-m spatial resolution) images acquired between 1987 and 1990 by Satellite Pour l’Observation de la Terre-1 (SPOT-1) (Table 1, Figure 2c,d). To describe the expansion history over an interval of around 20 years, an expansion factor was calculated as a ratio of the ALOS-derived lake area (2006–2010) to the SPOT-1-derived lake area (1987–1990), if a lake had been formed in the SPOT-1 image. The connection types during the early period were also identified in reference to the SPOT-1 imagery (without glacier outline delineation) using the same definition as the later ALOS period.
PFVs were also calculated according to the definition given in [14]. It was assumed that lake water would be discharged until the lake surface dropped to a critical level. This critical level was linked to an elevation gradient defined with respect to the angle from downstream of the moraine (or the damming bedrock) to the shoreline of the lake after hypothetical drainage. Note that this is not the same as the slope gradient of the front side of the moraine (or the damming bedrock), which is significantly steeper. This method was validated from GLOF of four lakes in the Himalayas. Based on these observations, 10° was adopted as the critical value of the elevation gradient for outburst termination [14].

4. Results

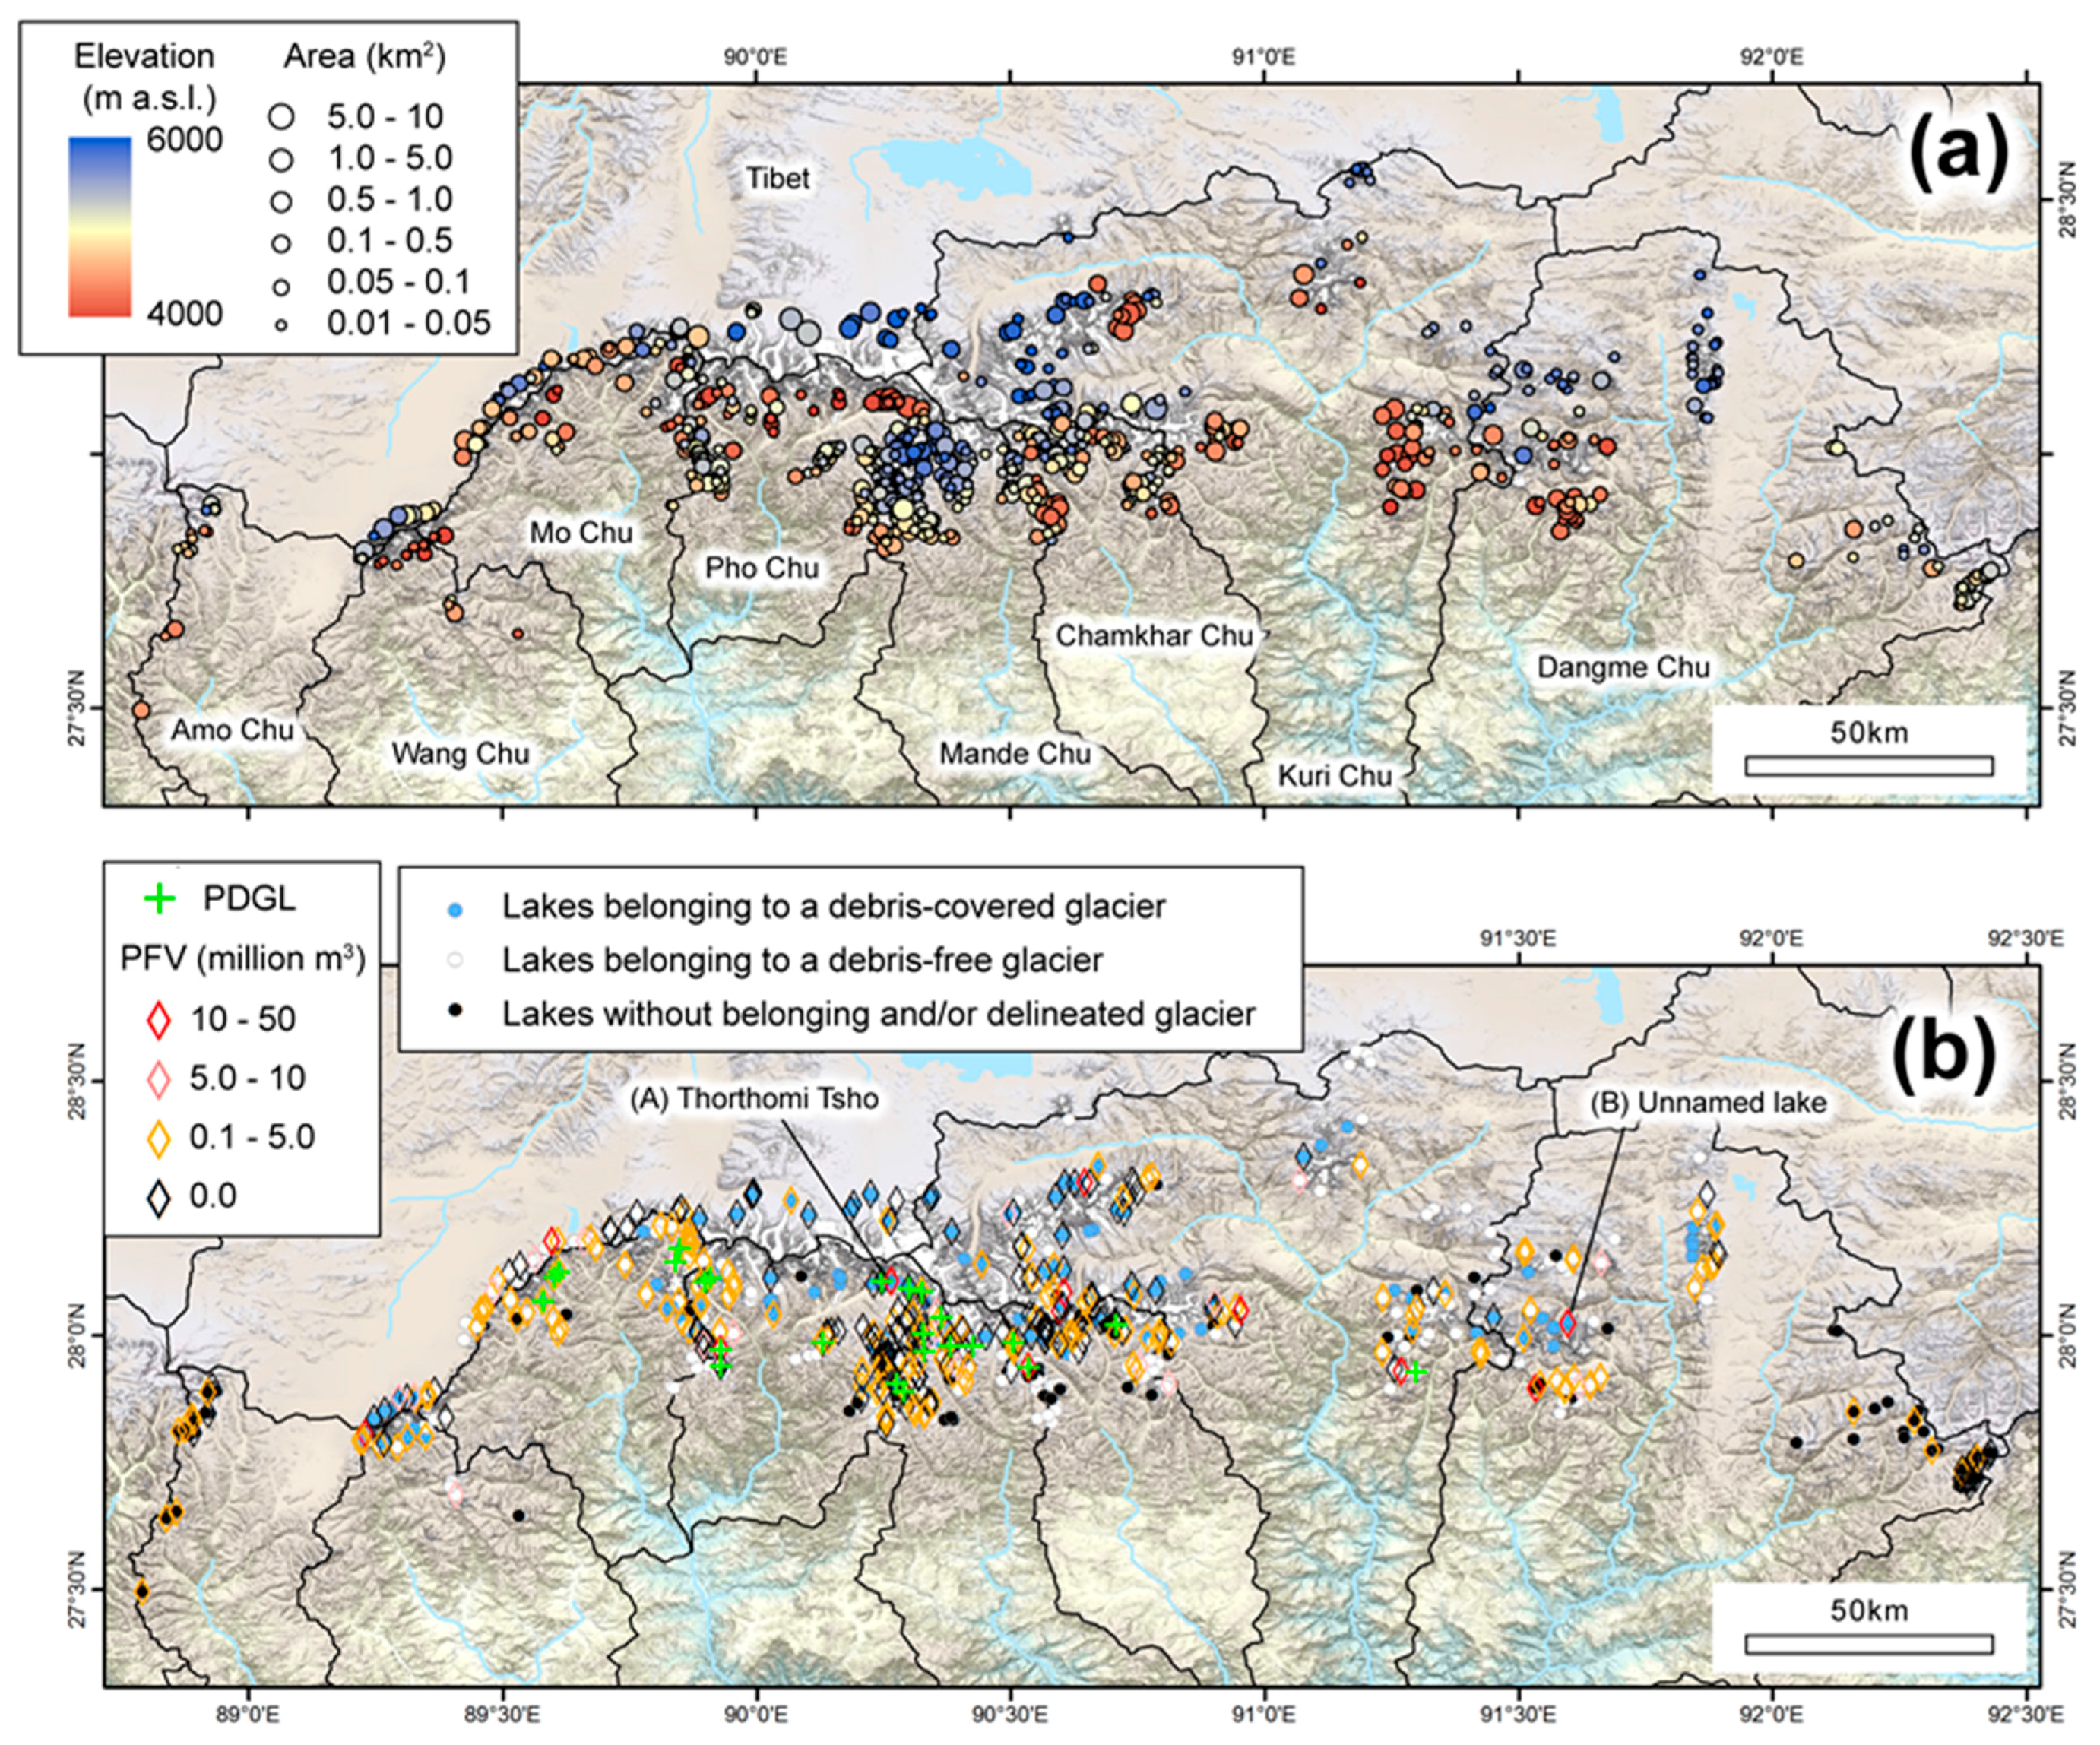
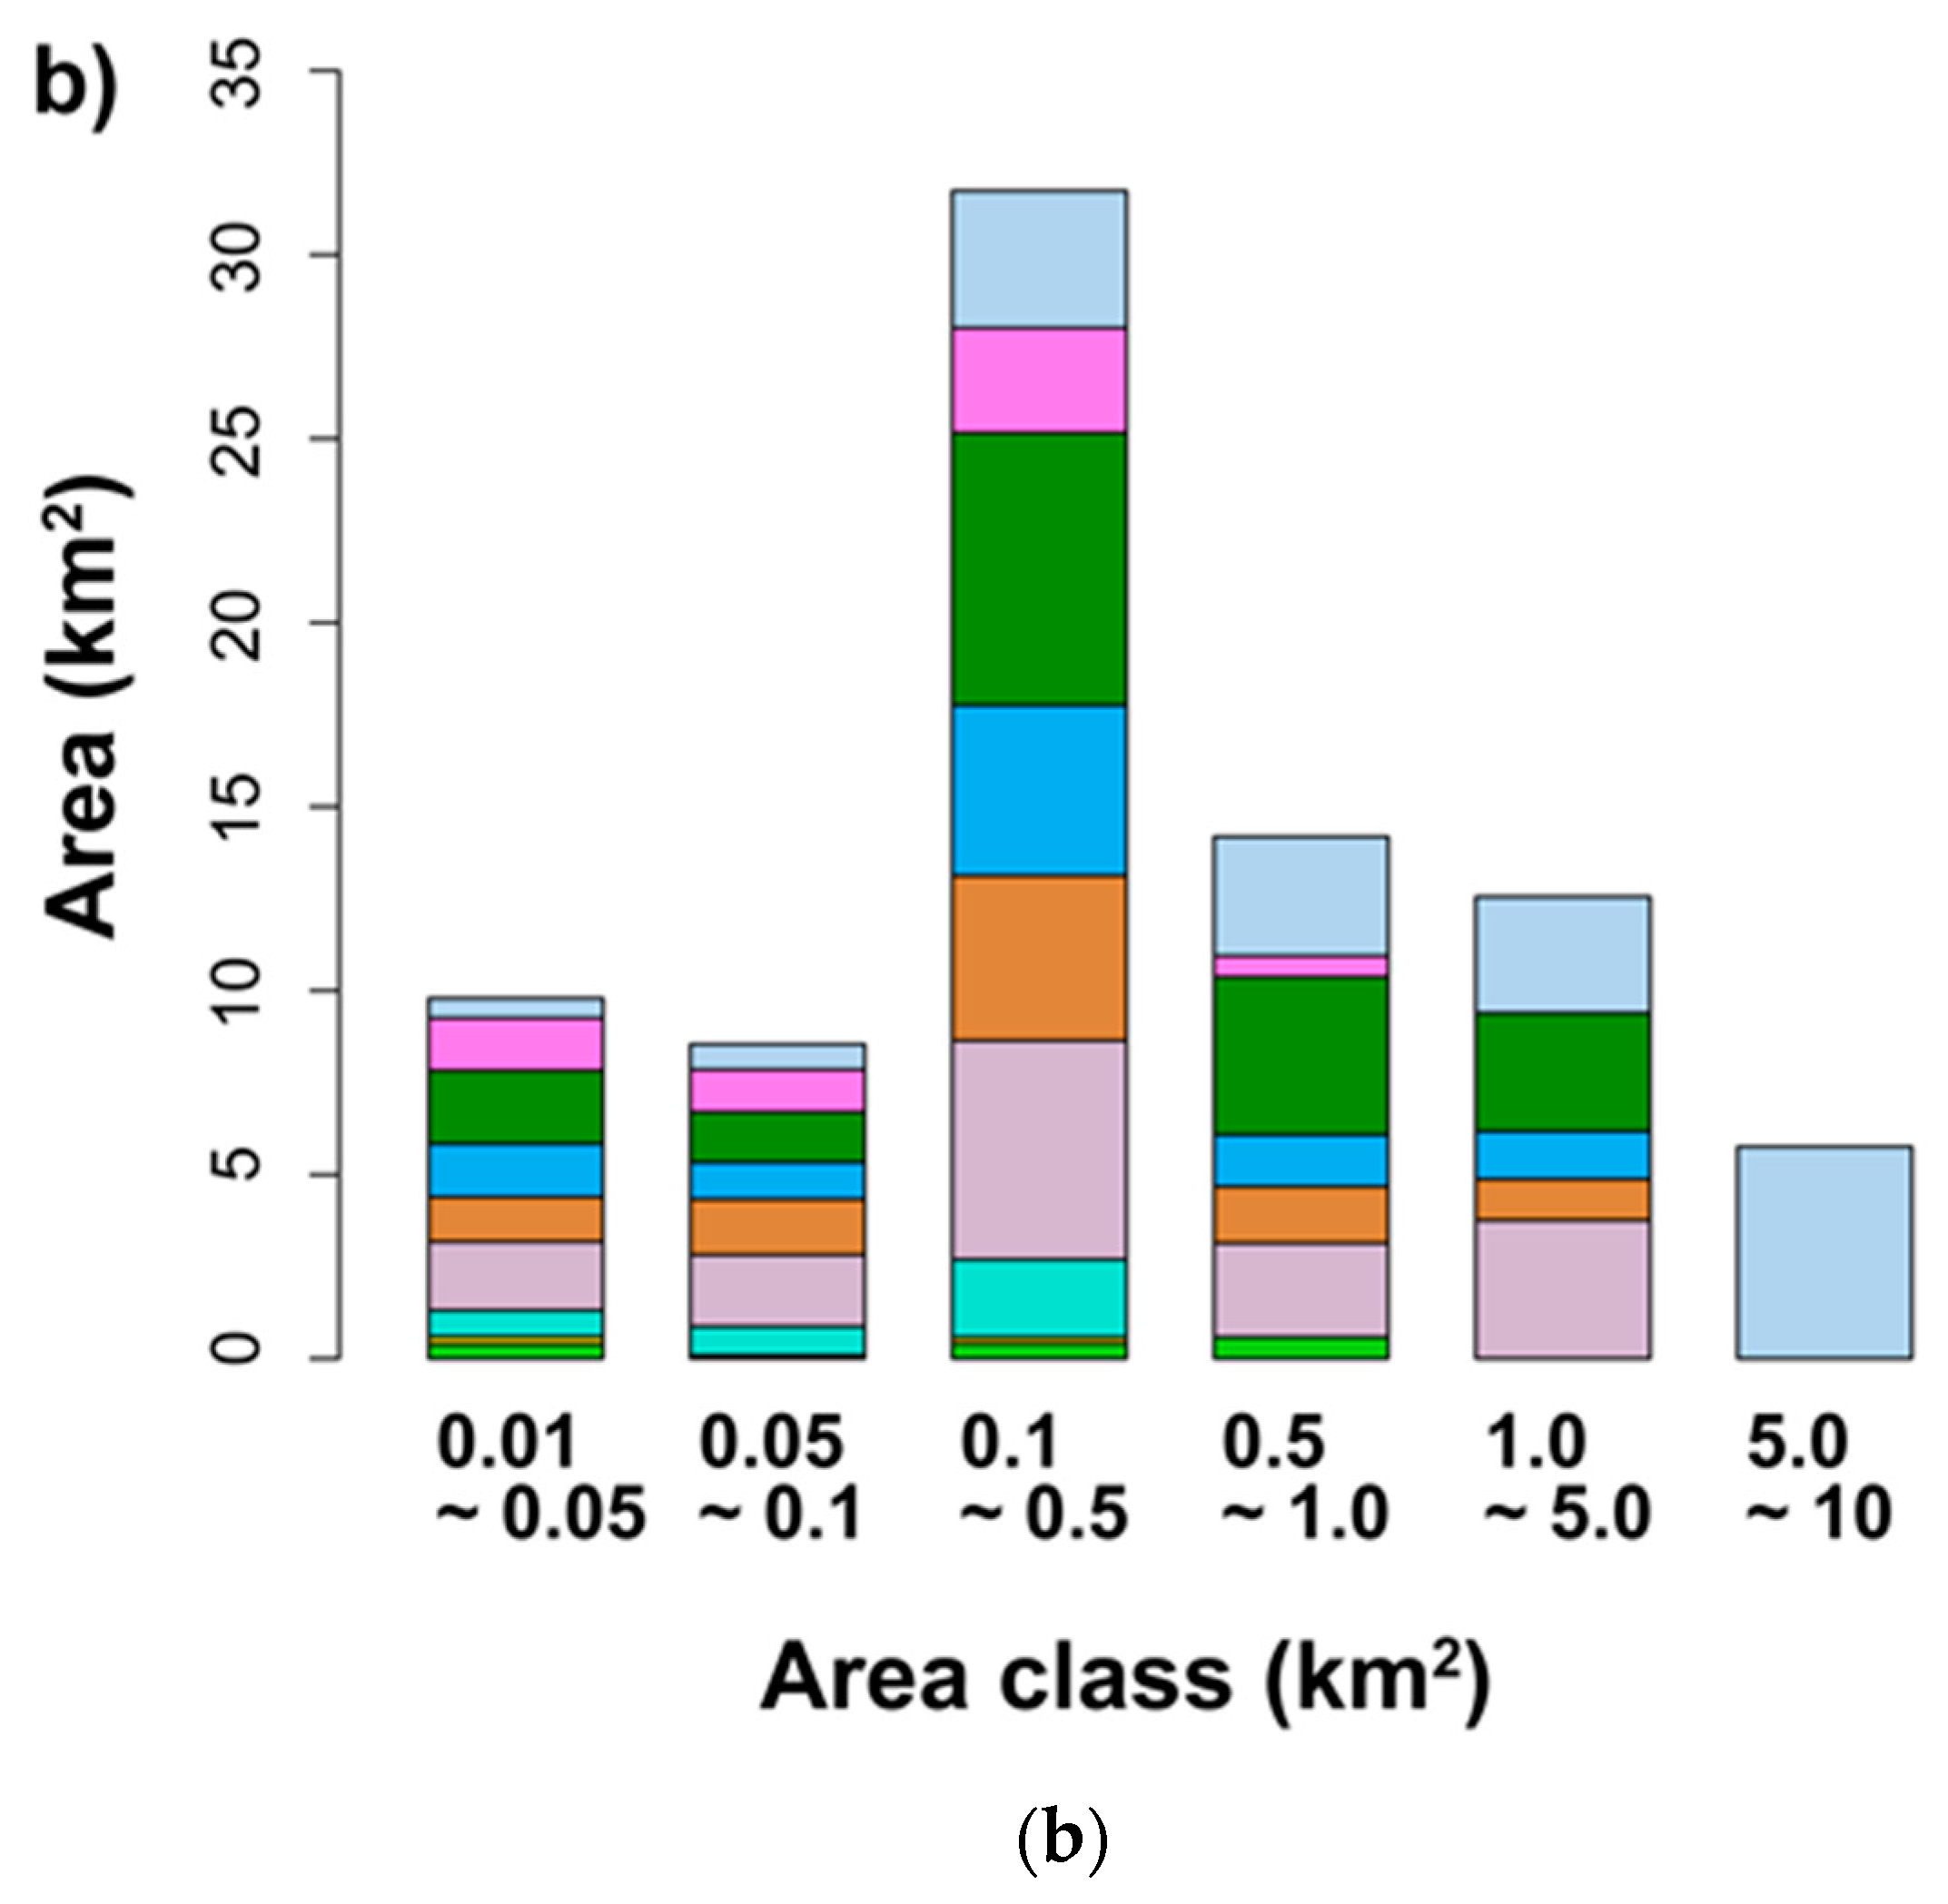
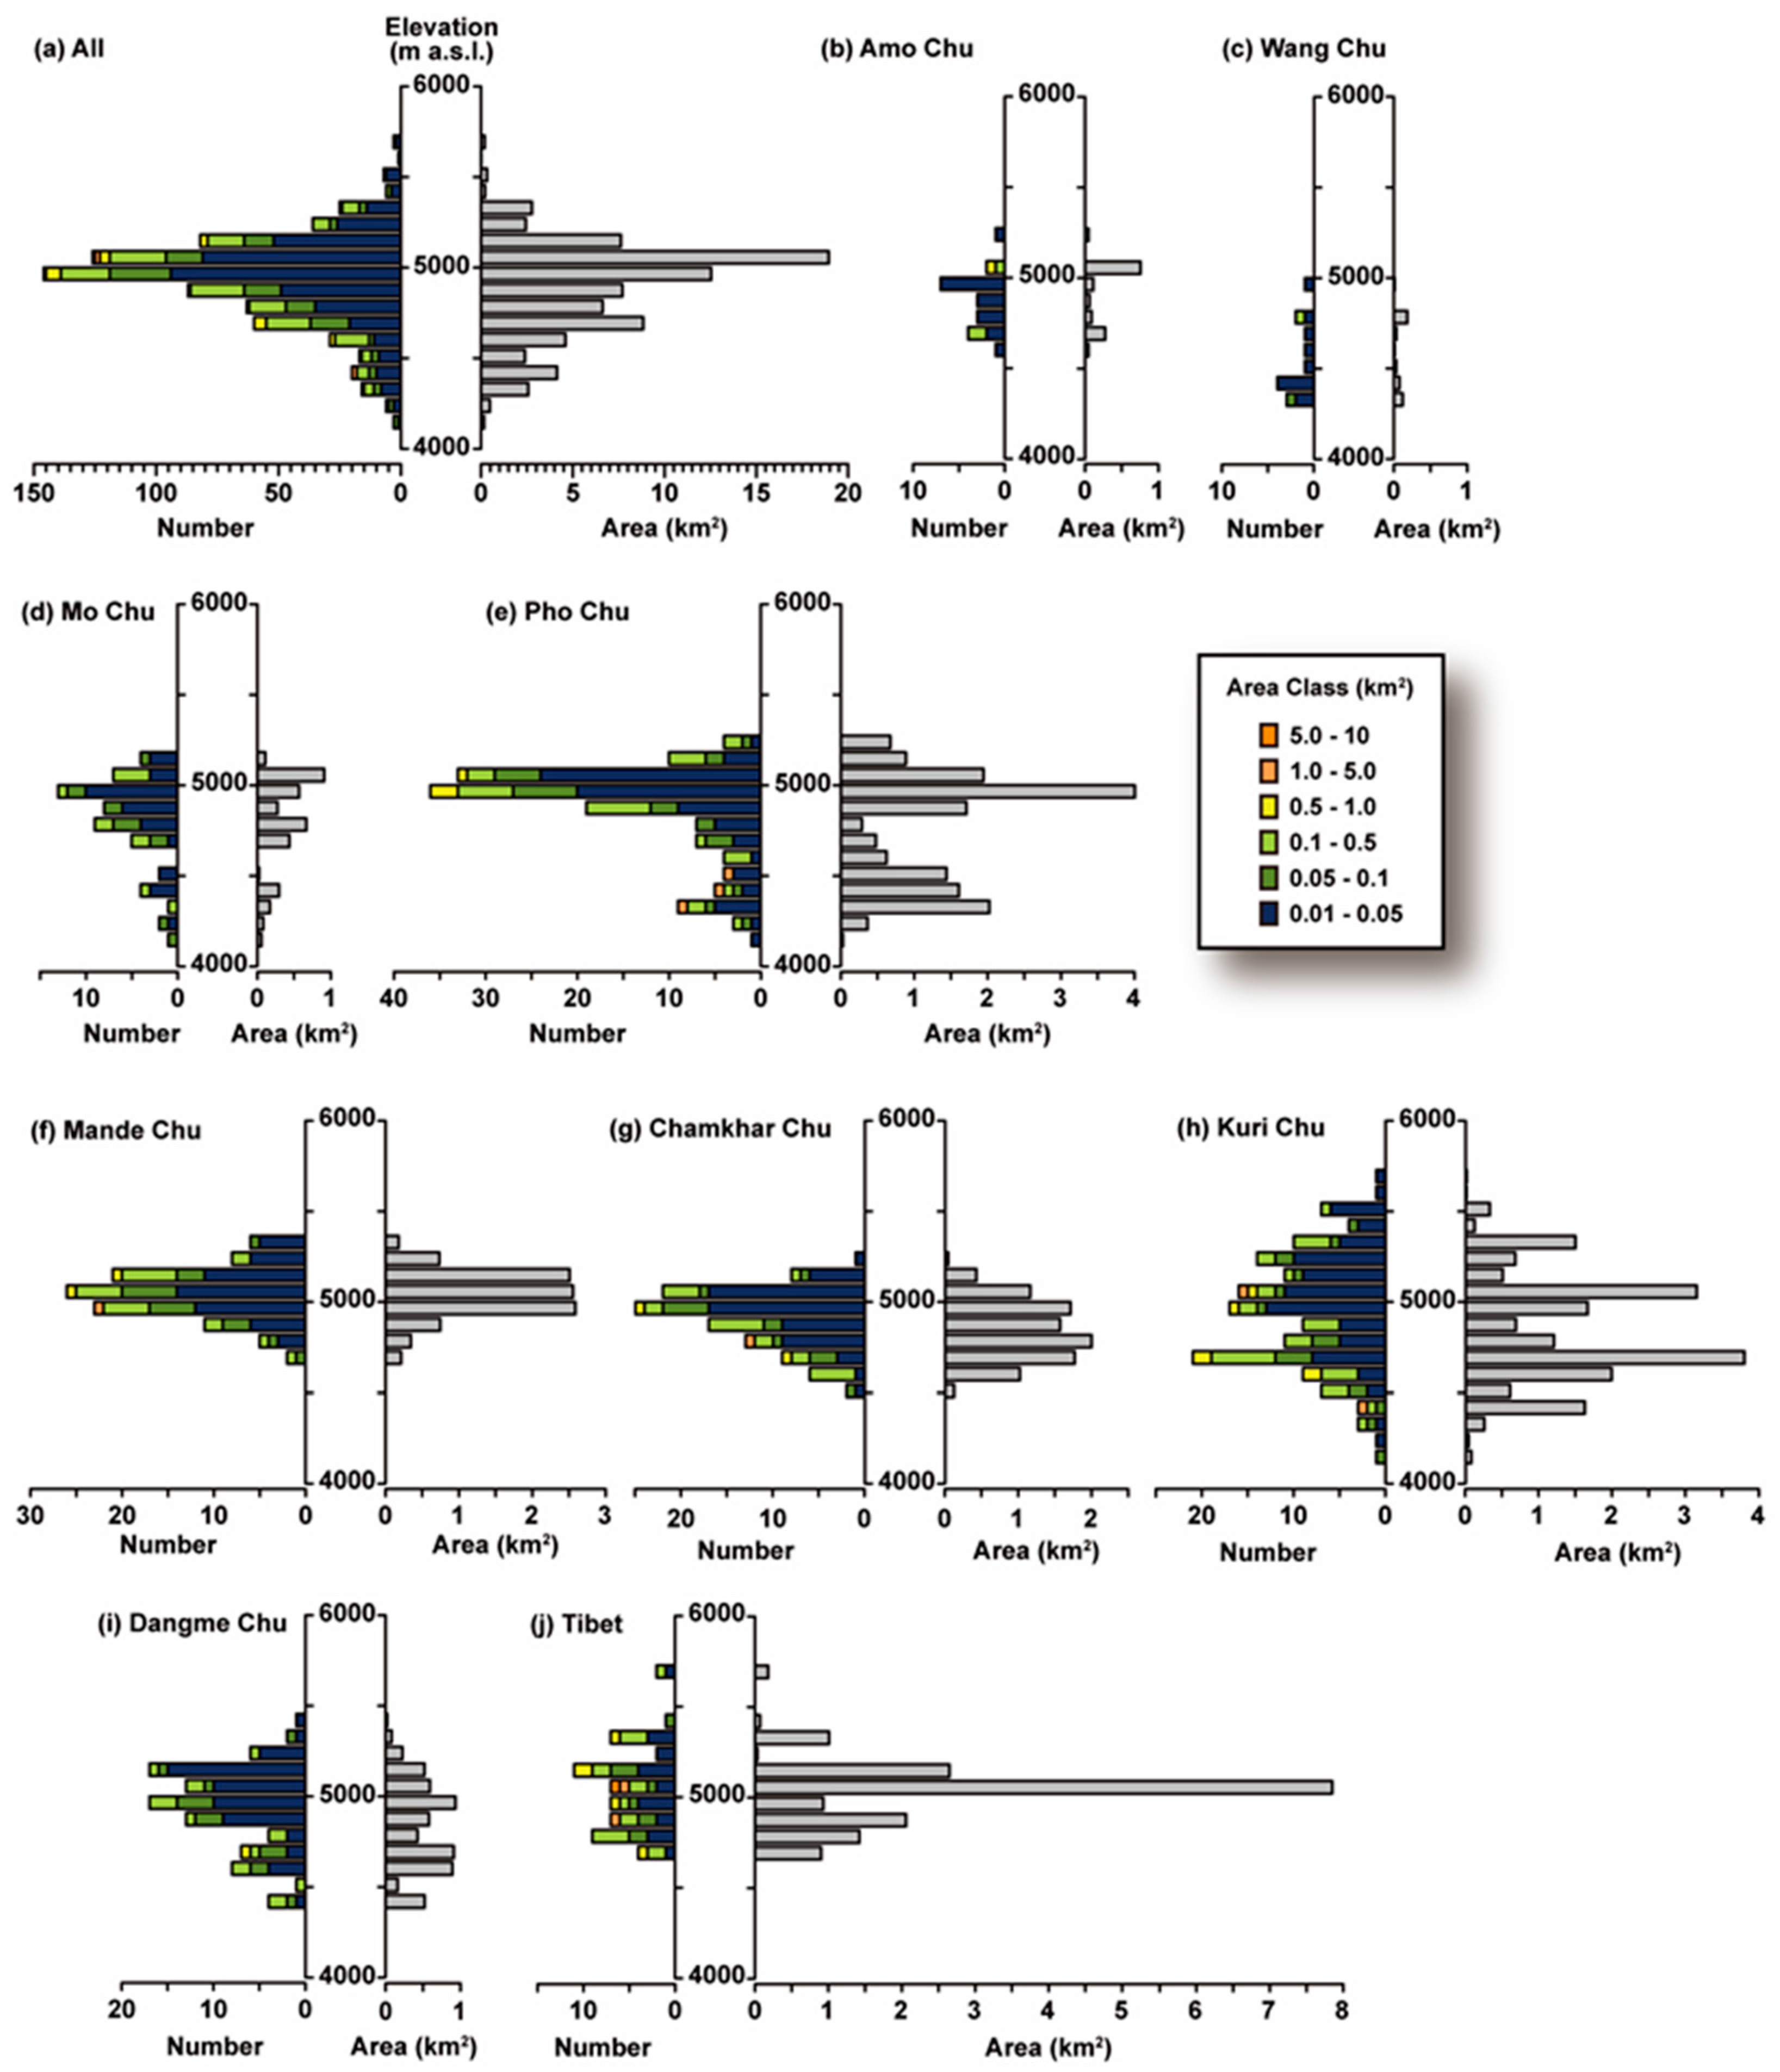
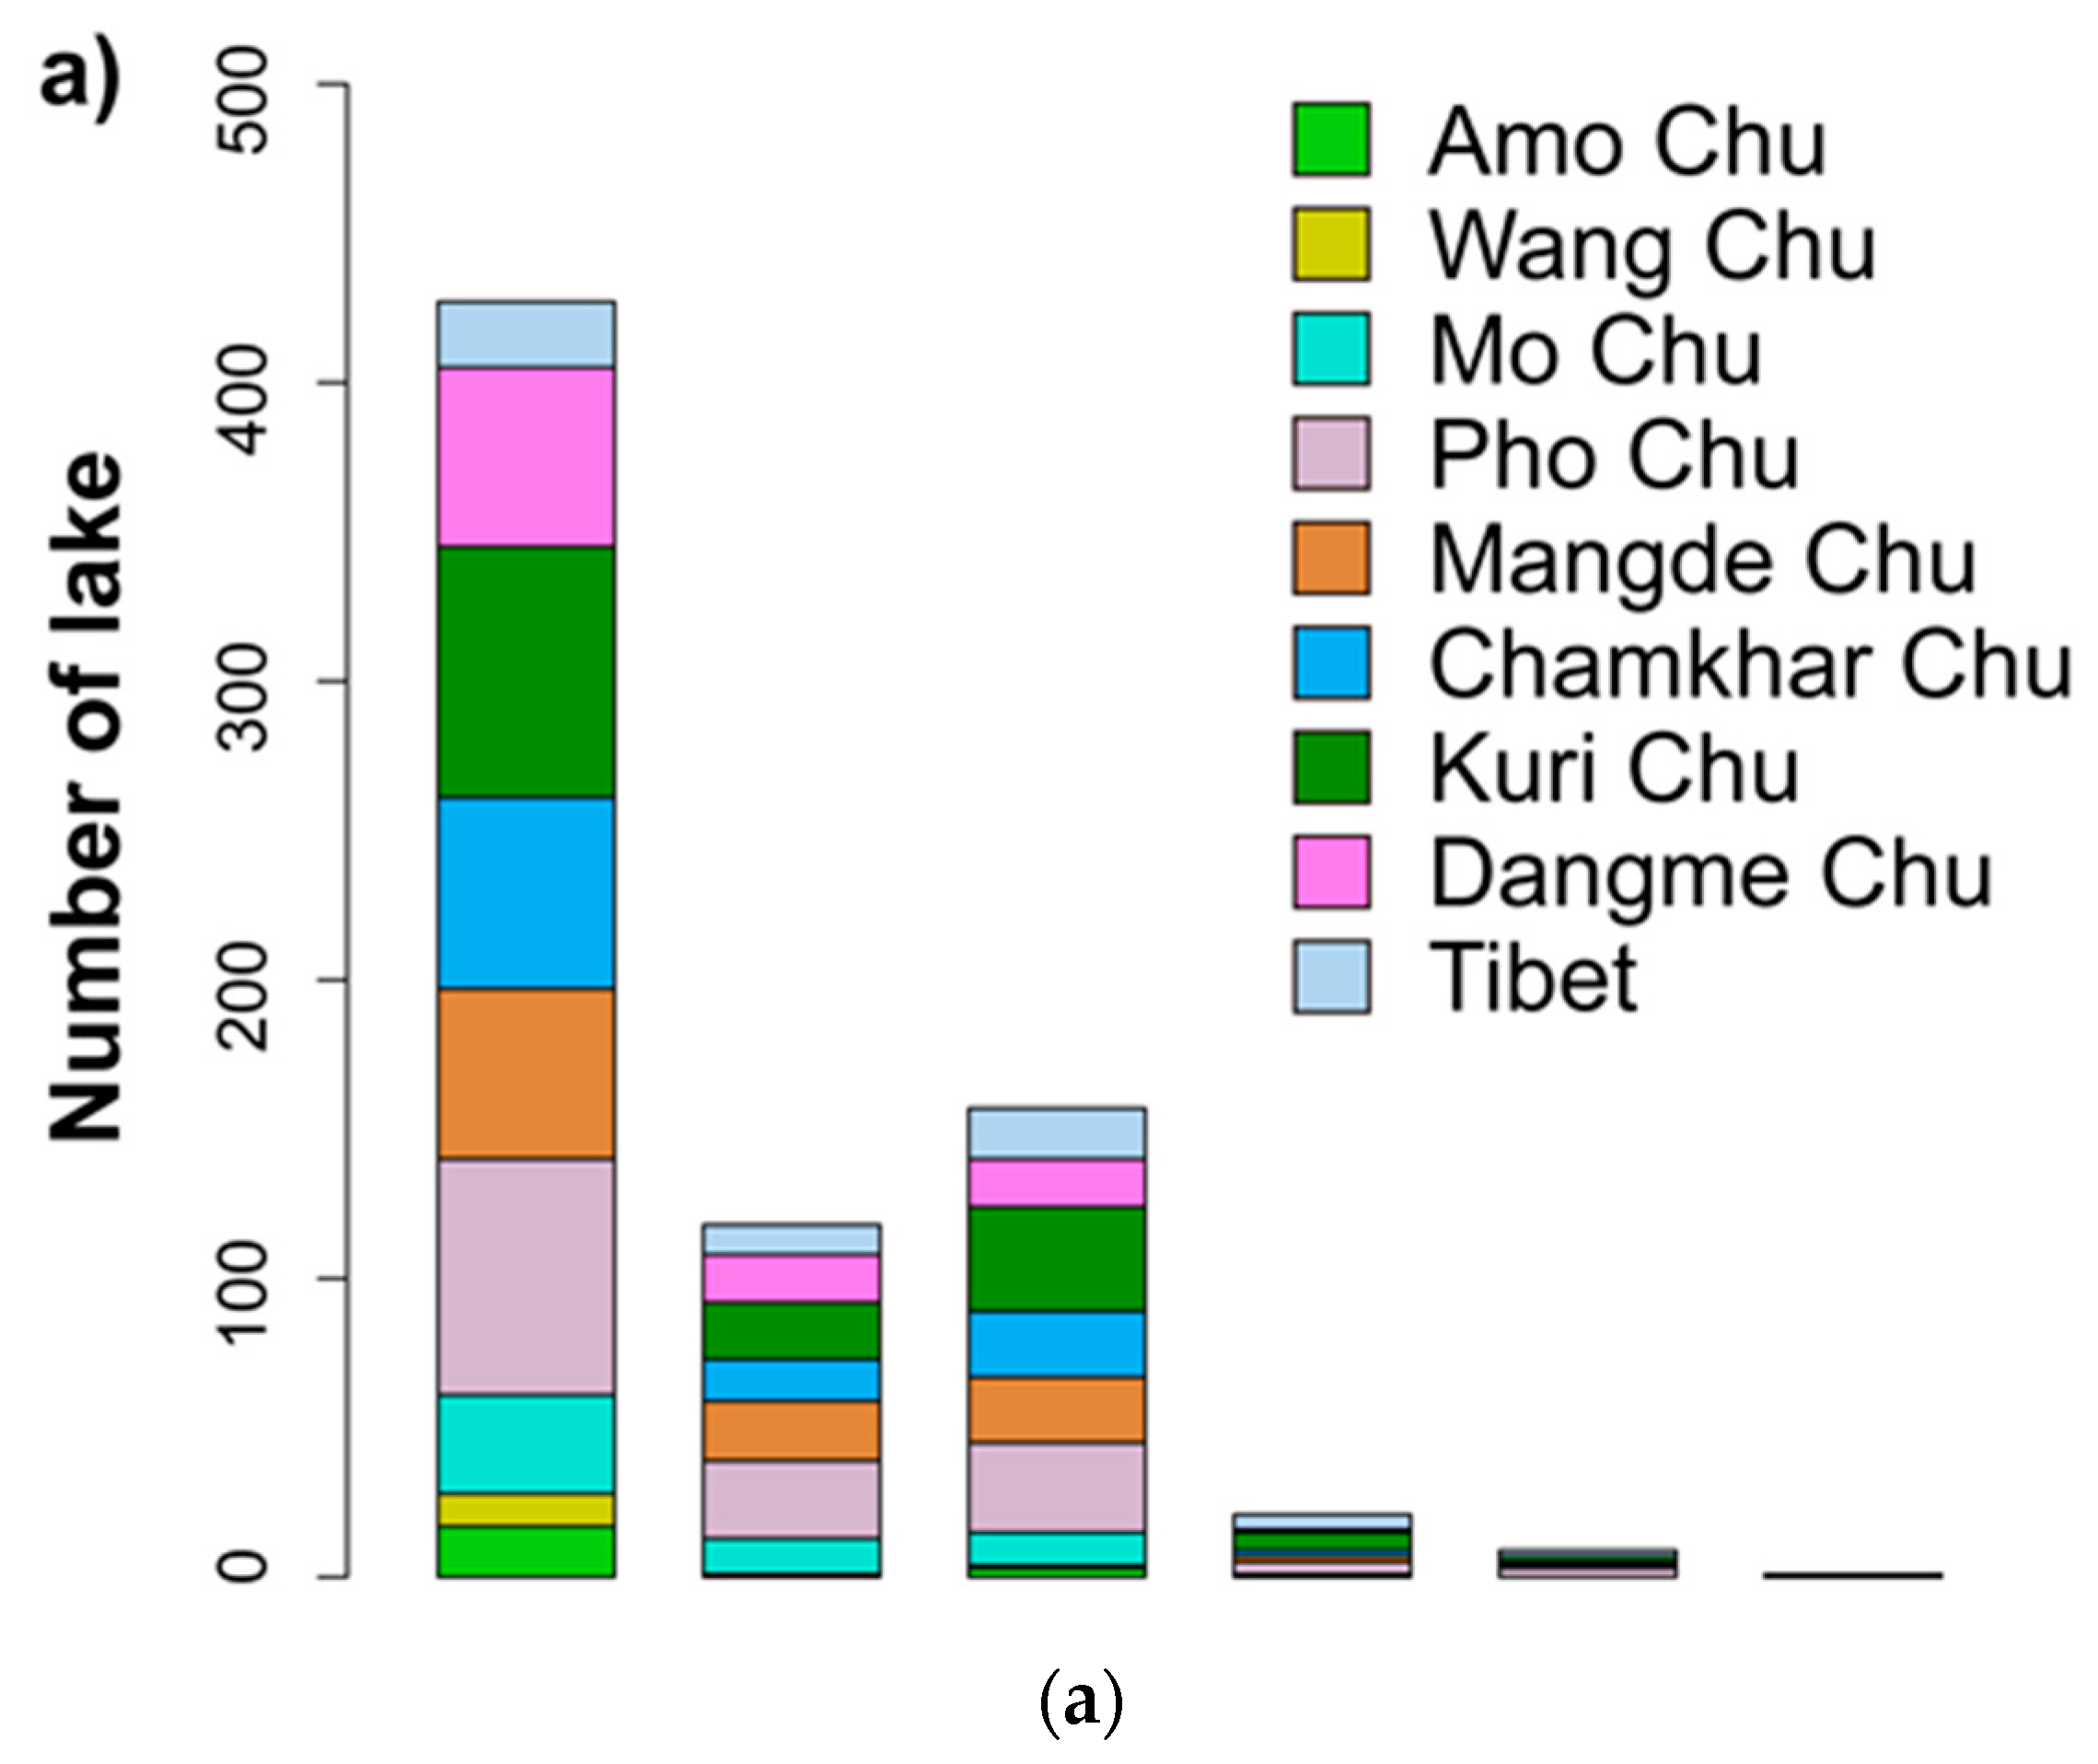
4.1. Current Area and Other Basic Statistics

The current study’s new Bhutan Himalayas glacial lake inventory contains 733 lakes with a total lake area of 82.6 km2 within the range of 4000 to 6000 m a.s.l. (Figure 1a). Individual lake areas range from 0.01 to 5.8 km2 with a mean of 0.1 km2 (Figure 3). The smallest lake-size category (0.01 to 0.05 km2) accounted for 58% (n = 427) of the total lakes; smaller lakes are more abundant than larger lakes. The mode was found in the size range of 0.1 to 0.5 km2, which occupied 31.7 km2 or 38% of the total lake area (Figure 3b). Hydrological boundaries were defined by nine river basins as was done by [21] (Figure 1a). The Kuri Chu Basin had the highest number of lakes (n = 146), followed by the Pho Chu Basin (n = 142), which has the highest density of lake number divided by basin area (6.1 × 10⁻² lakes per km2) (Table 2). Fewer lakes were distributed in the Amo Chu (n = 21) and Wang Chu Basins (n = 13). In terms of lake area, the Kuri Chu Basin contained the greatest total lake area (18.3 km2, 22.1%) followed by the Tibetan Basin (17.1 km2). The Wang Chu and Amo Chu Basins had smaller lake-to-basin densities of 2.6 × 10⁻³ and 3.4 × 10⁻³ lakes per km2 as well as smaller lake-coverages of 0.5 km2 and 1.4 km2, respectively.
The vertical distribution of the lakes ranged between 4134 and 5885 m a.s.l. with a mean elevation of 5008 m a.s.l. (Table 2, Figure 4). The elevation category between 5000 and 5100 m a.s.l. had the largest number of lakes (n = 146, 20%). The elevation distribution of glacial lakes for each river basin showed that the largest lake was in the Tibetan Basin at 5129 m a.s.l. The mean elevation was highest in the Tibetan Basin (5137 m a.s.l.) and lowest in the Wang Chu Basin (4571 m a.s.l.) (Figure 4j). Glacial lakes in the Kuri Chu Basin had the largest vertical range of 1700 m followed by those in the Pho Chu Basin of 1233 m. Lakes in the Mangde Chu Basin had the smallest range of 708 m.

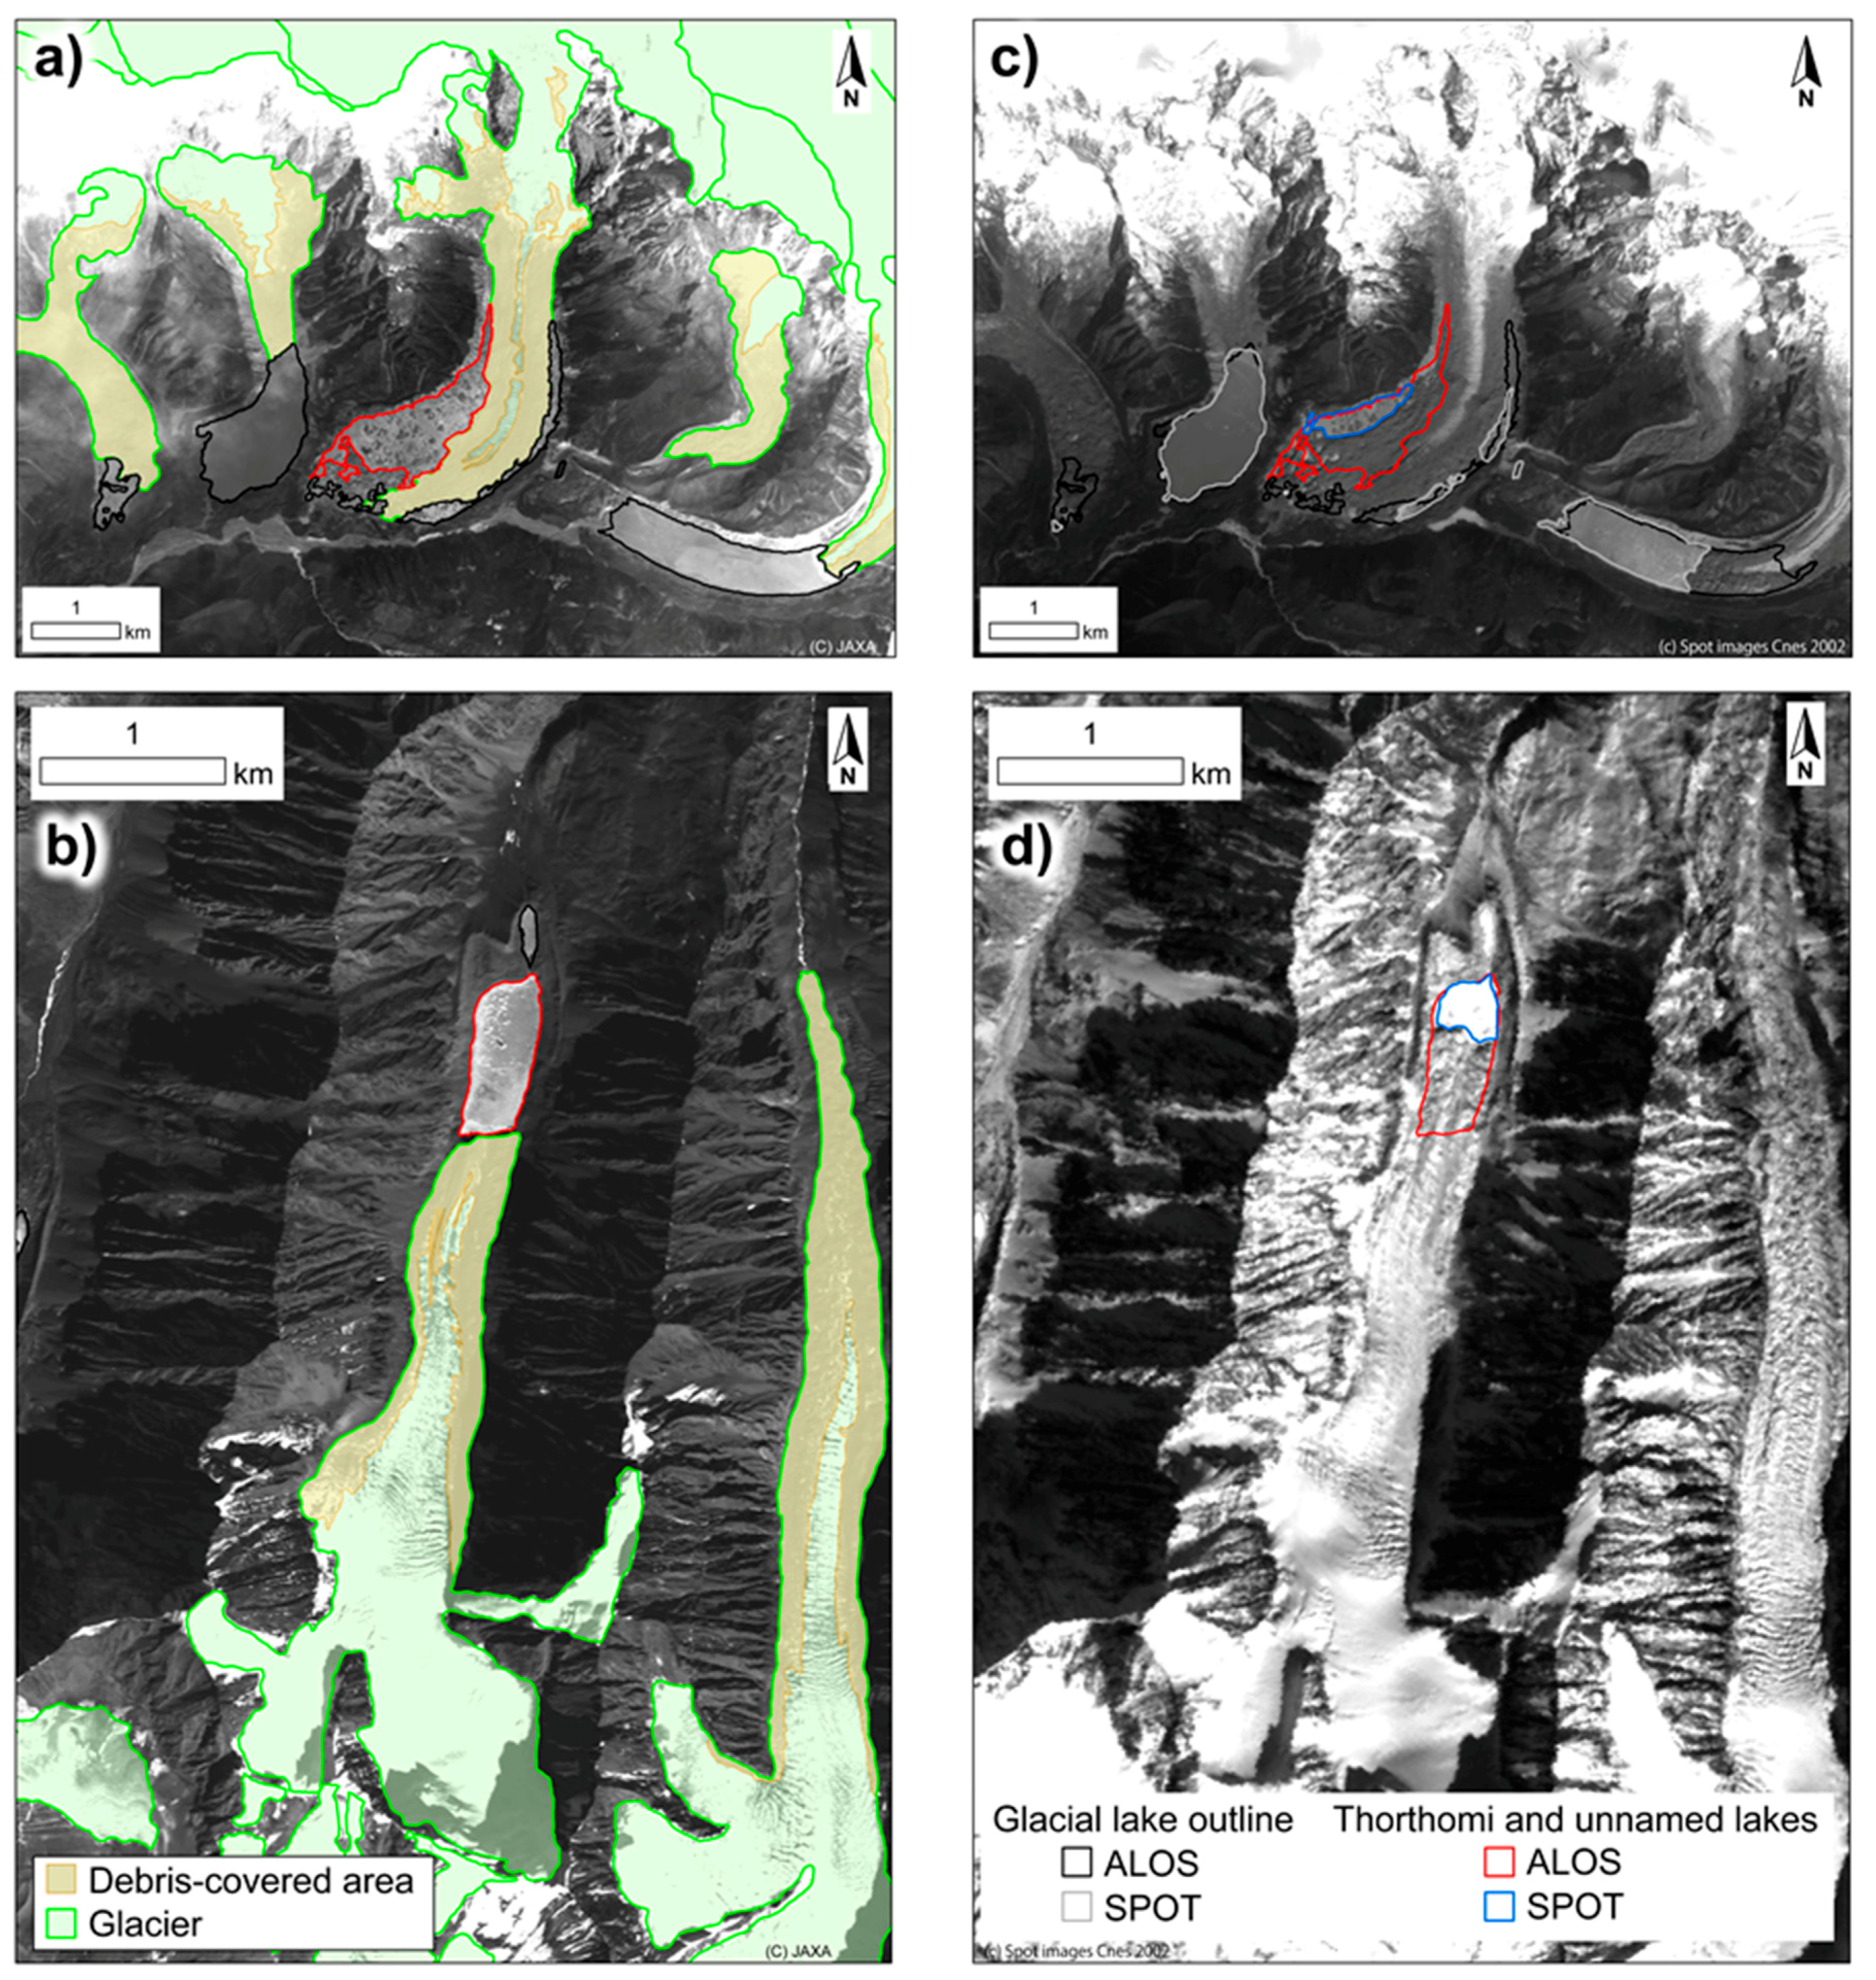
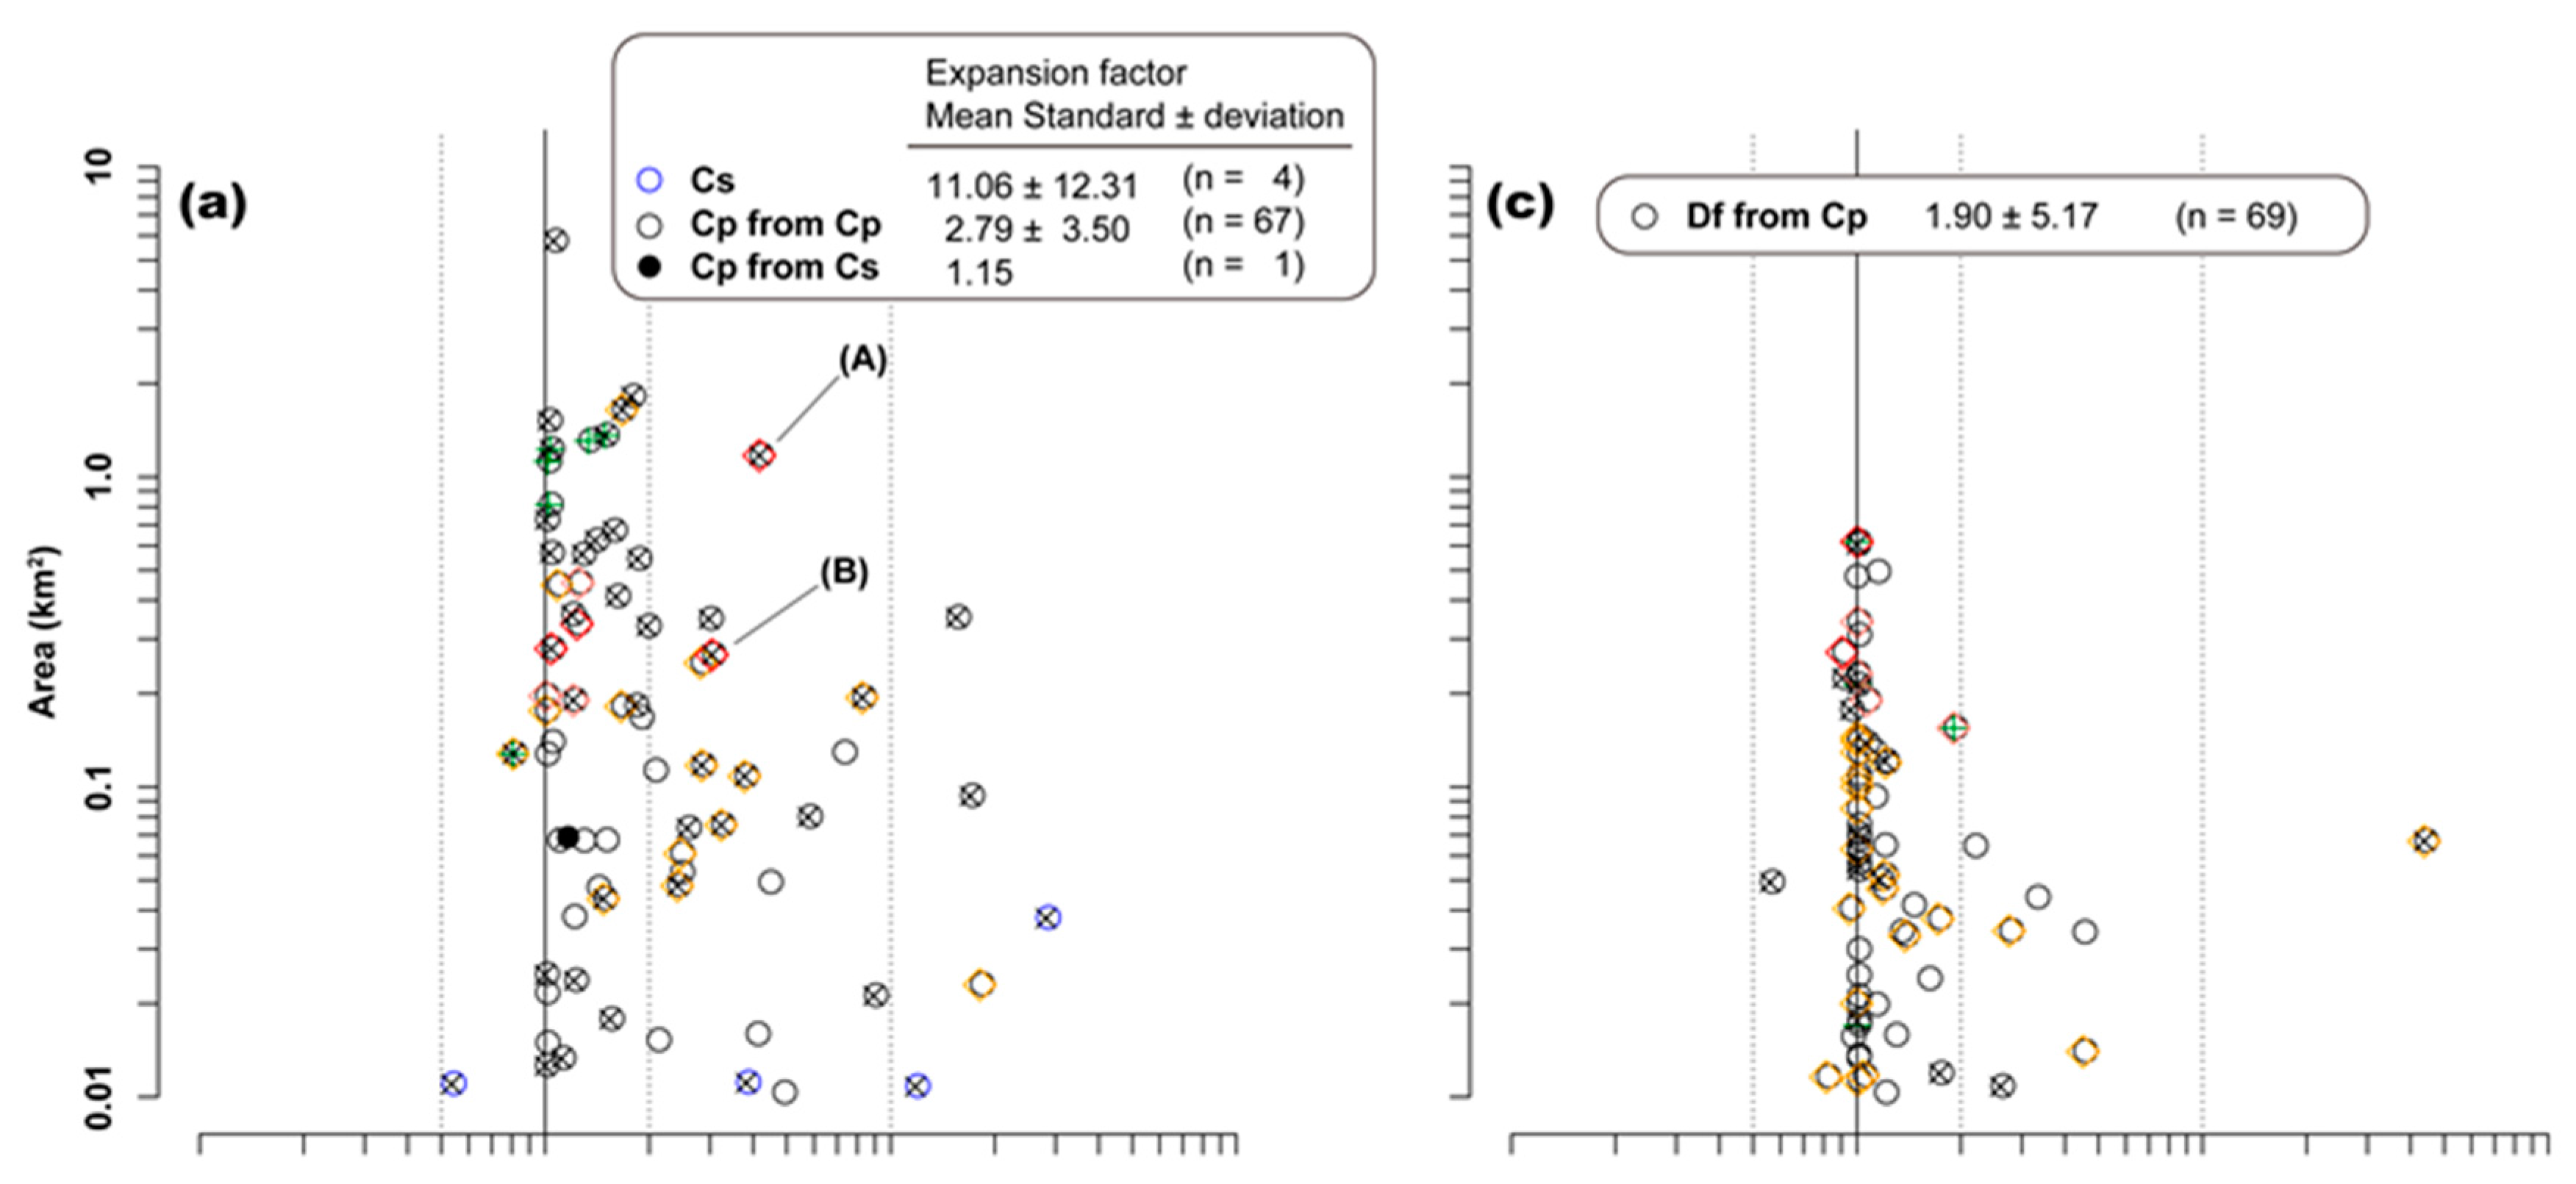
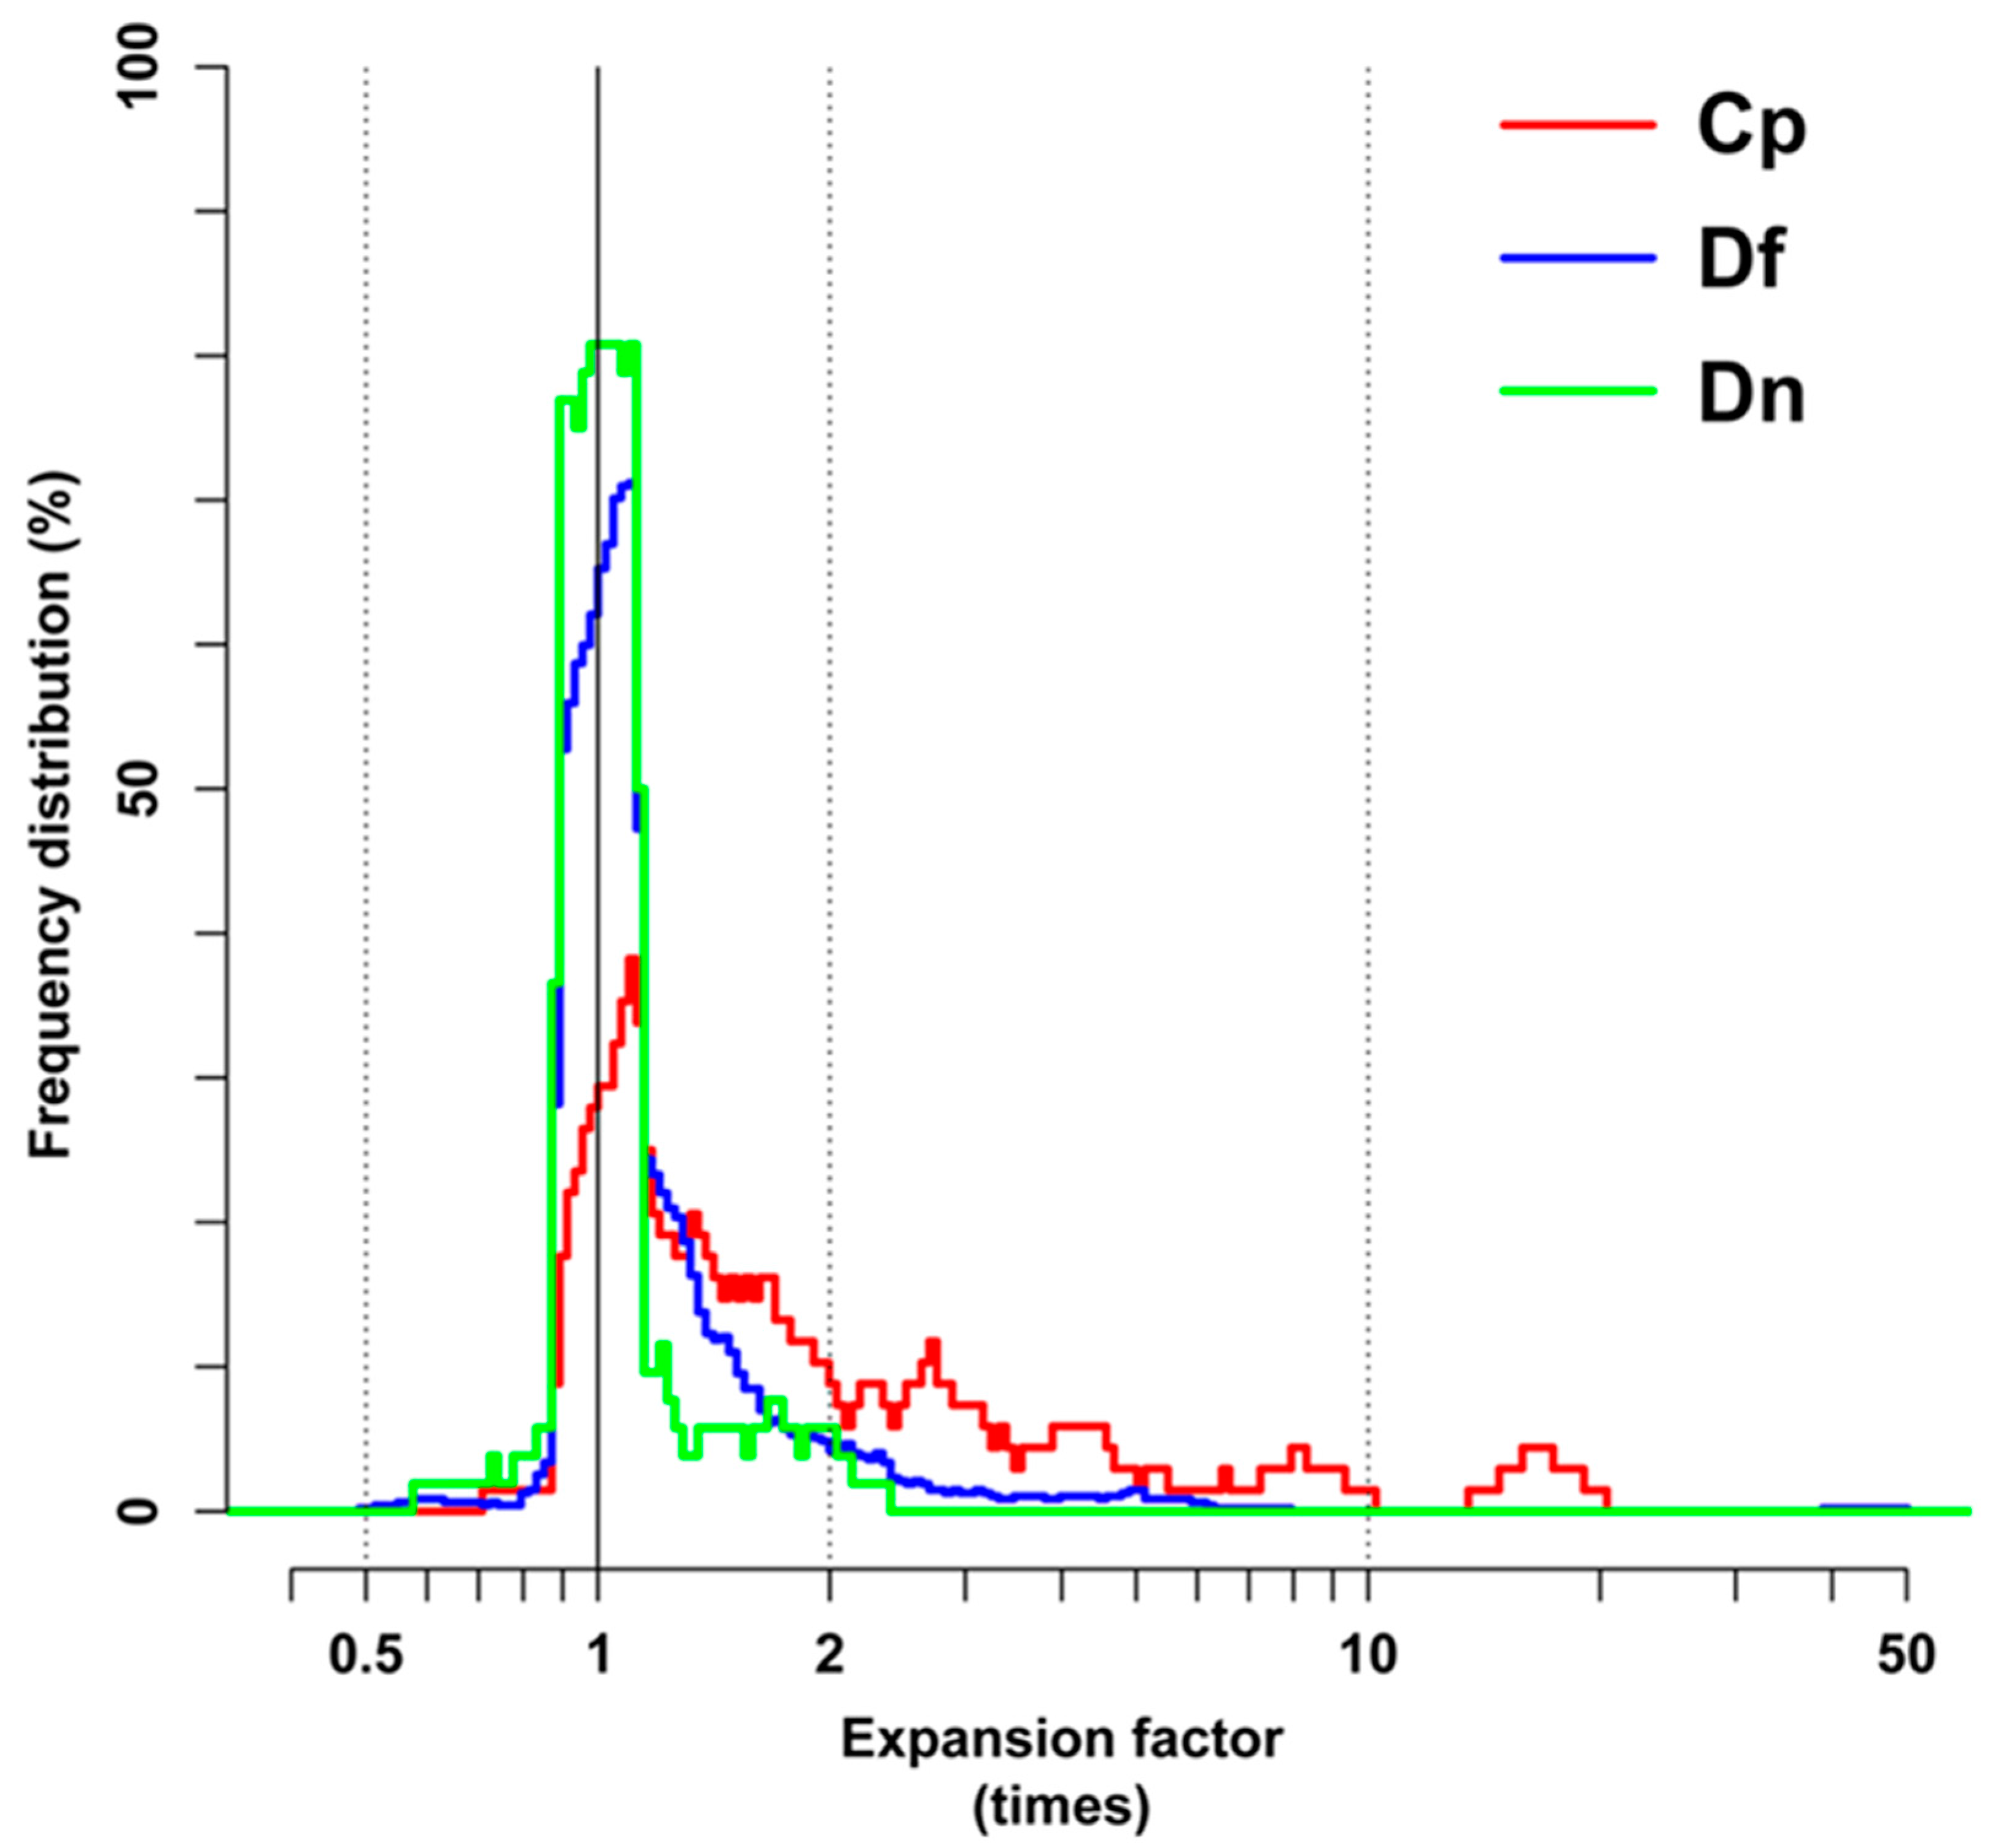
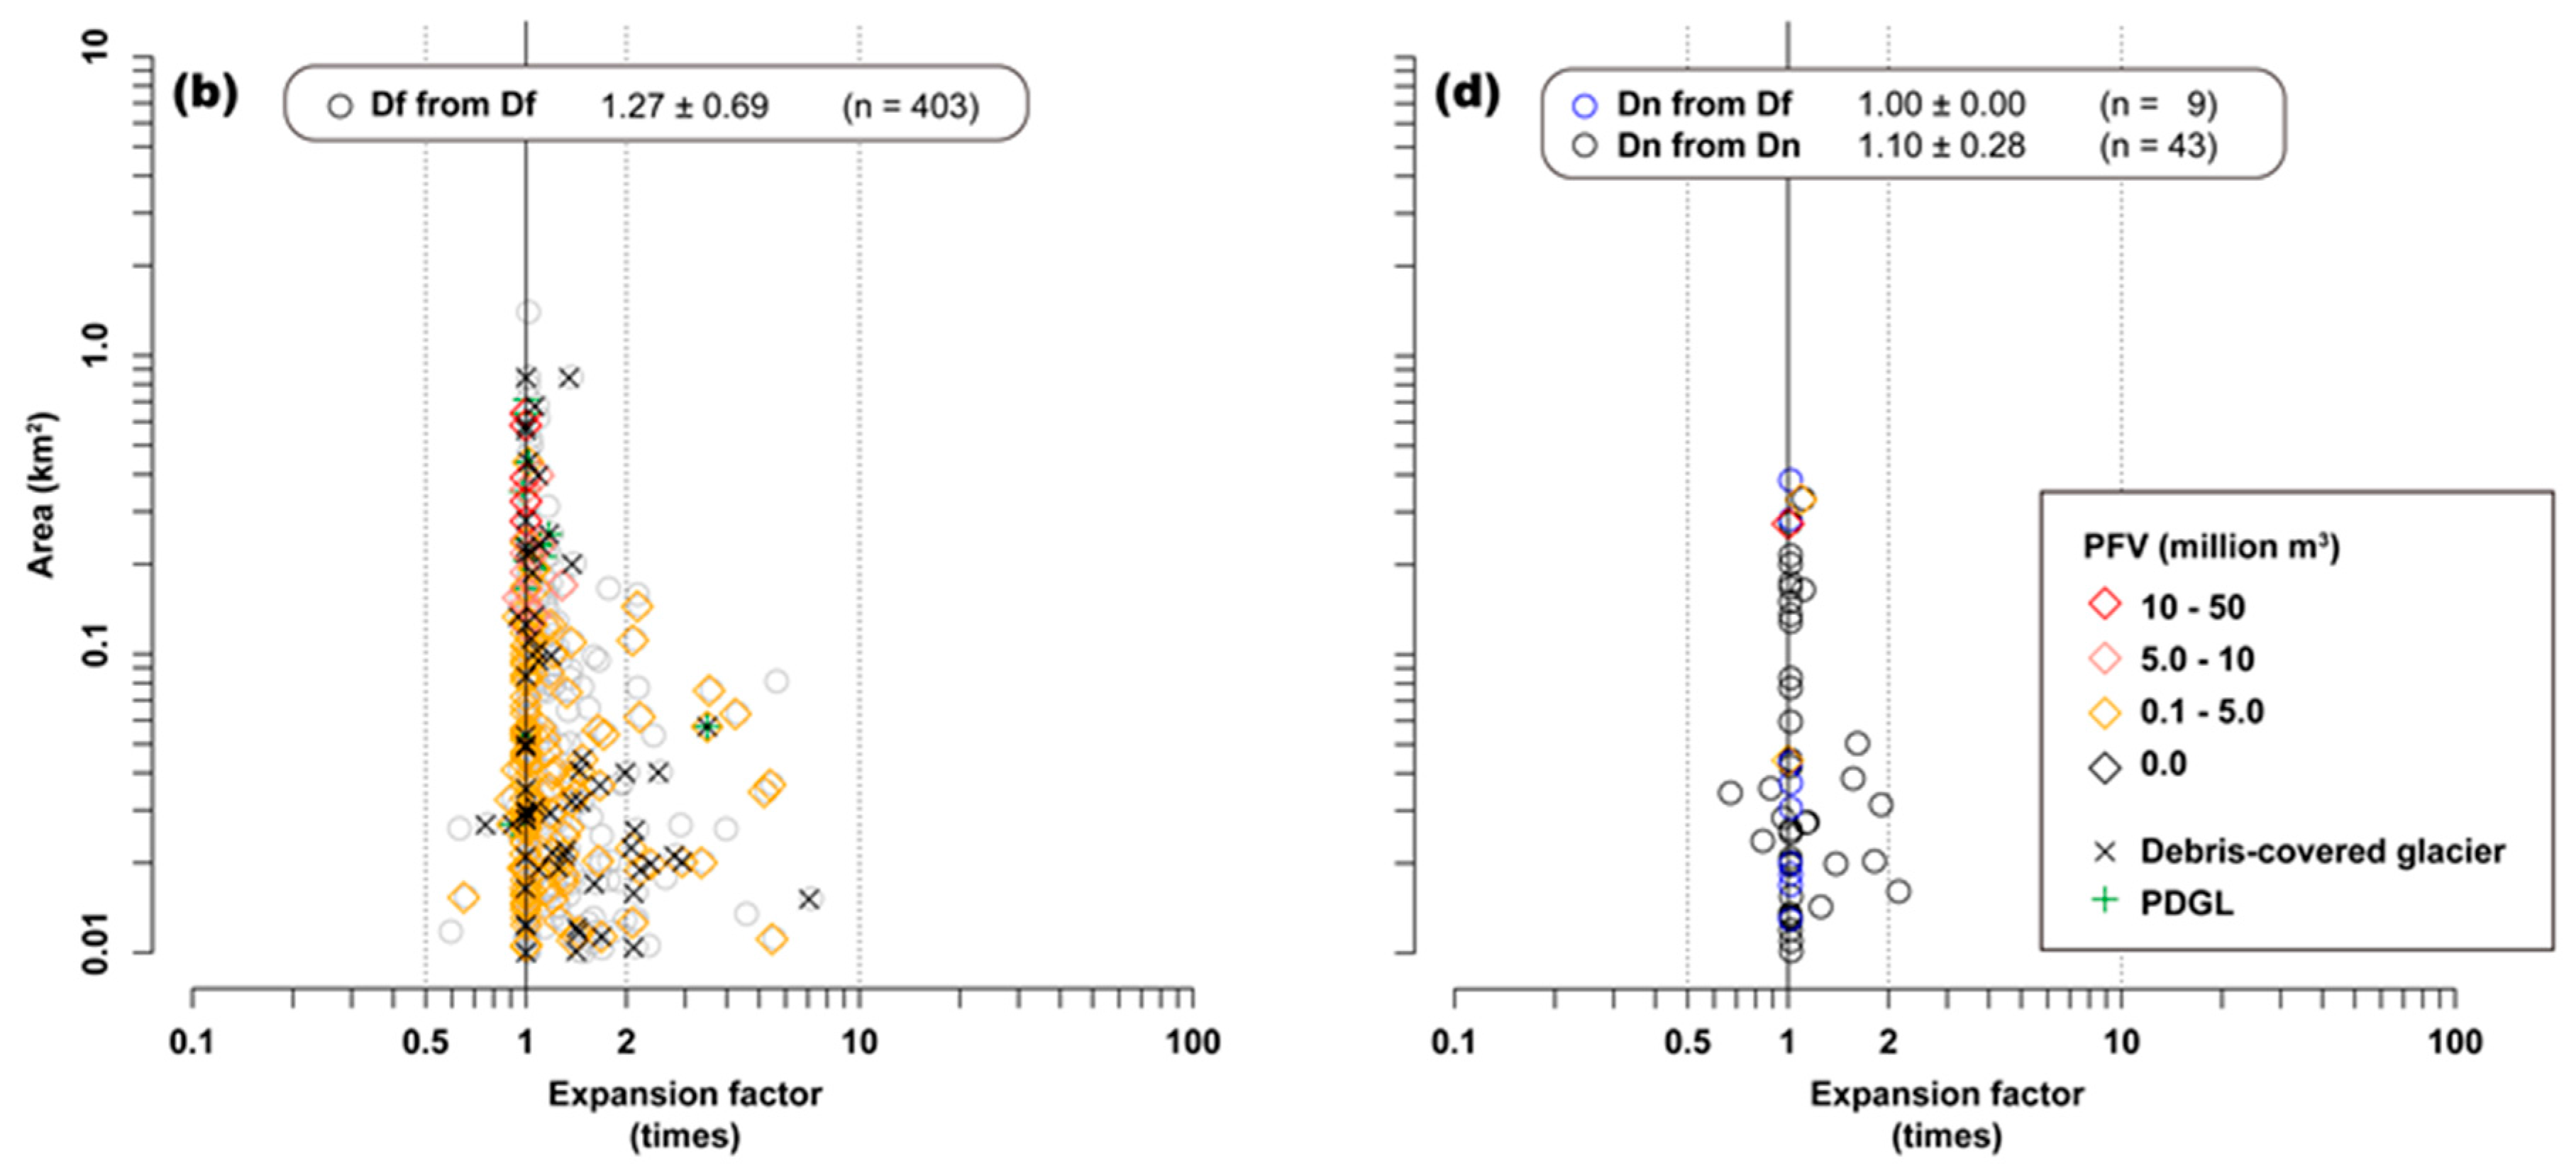
4.2. Glacier–Glacial Lake Connections and Recent Expansion

As described above, the integrated glacier–glacial lake inventory provided information on the connectivity of lakes and glaciers into four types (Cs, Cp, Df, and Dn). By comparing the images from the early SPOT-1 period and the later ALOS period, there were 16 different combinations (i.e., 4 × 4 from the set of Cs, Cp, Df, and Dn) to describe changes in the lake–glacier relationship. Table 3 summarizes these combinations, where 662 lake–glacier relationships were identified. The others were difficult to confirm due to exclusion from SPOT-1 coverage or cloud cover, or were thought to be formed prior to the lake formation stage. The lake relationships comprise: 516 Df lakes, of which 403 lakes were already in the Df type before the 1990s; 100 Cp lakes, of which 67 lakes were in the Cp type before the 1990s; 58 Dn lakes, of which 43 lakes were in the Dn type; and 14 Cs lakes, of which 10 lakes were not yet formed by the 1990s. One lake was changed from Cs to Cp, 69 lakes showed a history of changing from Cp to Df, and nine lakes changed from Df to Dn. There were no lakes showing a history of moving from Dn to Df or Dn, to Df, to Cp, or to Cs.
Figure 5 plots the relationship between lake area ~1990 and expansion factors over the last 20 years with colors indicating changes in glacier–glacial lake connectivity. The expansion factors for the Cs lakes were the highest at 11.1 ± 12.3 times (n = 4) followed by those of the Cp-from-Cp lakes at 2.8 ± 3.5 times (n = 67) (Figure 5a). The Df-from-Df lakes had smaller mean expansion factors and a smaller standard deviation of 1.3 ± 0.7 times compared to those of the Df-from-Cp lakes (1.9 ± 5.2 times) (Figure 5b,c). The Dn-from-Df lakes and the Dn lakes showed only minor variation in their expansion factors concentrated around 1.0 (Figure 5d).

4.3. Potential Flood Volumes

The analysis revealed that 169 lakes have zero PFV and 226 lakes have positive PFV ranging from 0.04 to 33.7 million m3 (Figure 1b). Other lakes were not analyzed by [14]. Lakes with larger PFVs (>5 million m3) were found in all nine basins: one in Amo Chu; three in Chamkhar Chu; three in Dangme Chu; eight in Kuri Chu; five in Mangde Chu; three in Mo Chu; three in Pho Chu; six in Tibet; and one in Wang Chu. They were sorted from the largest to the smallest PFVs (Table 4). Expansion rates, lake areas, ID, PDGL (or not), connectivity, moraine-damming or bedrock-damming, presence or absence of debris-cover, and glacial features are also shown. Table 4 also shows the rest of the ICIMOD-suggested PDGLs in a descending order of PFVs. These PDGL comprise 11 lakes with positive PFVs and 11 lakes with zero PFV.

5. Discussion

5.1. Current Status of Glacial Lakes

The current study analyzed 733 lakes in the Bhutan Himalayas, which included 278 lakes already delineated by [21]. The largest number of glacial lakes (58%) were in the size class of 0.01–0.05 km2 (Figure 3a). Nie et al. [2] also showed that the highest number of lakes were in the size category of 0.01–0.05 km2. This size category had the greatest total area of glacial lakes in the Bhutan Himalayas and the Himalayan Range. This indicates that glacial lakes in the Bhutan Himalayas are not different from the rest of the Himalayas in terms of size distribution. Veettil et al. [24] delineated 1065 glacial lakes from a much smaller domain than the current study’s domain. This was a larger number than the current study because smaller lakes (<0.01 km2) and lakes >2 km away from the Little Ice Age (LIA) moraine were included.
The vertical distribution of the glacial lakes varies between the nine basins (Table 2, Figure 4). The southern basins have lower lake elevations (i.e., the lowest mean elevation of 4571 m a.s.l. was found for the Wang Chu Basin followed by the Mo Chu and Pho Chu Basins with mean elevations between 4100 and 4200 m a.s.l.). In contrast, the Tibetan Basin had the highest mean elevation of 5137 m a.s.l. with individual lakes above 5800 m a.s.l. This south-to-north gradient reflects elevation differences in the glacier termini, as shown by [16]. The elevation of the glacier terminus in the Bhutan Himalayas is higher than in the Tibetan Basin to the north and lower in the six southern basins, with the transverse basins (Kuri Chu and Dangme Chu) in between (Figure 10c in [16]). The Kuri Chu Basin had the largest standard deviation of the elevations (348 m), possibly because of a mixture of contrasting cold and arid climates in the north and warm and humid conditions in the south. The Pho Chu Basin had the second largest standard deviation of 279 m. There were two major elevation distribution groups, one around 5000–5100 m a.s.l., and the other around 4300–4400 m a.s.l. (Figure 4e). The higher group consisted of lakes from geographically neighboring basins. The lakes in the lower group were located in the Lunana region (Figure 2a; around (A) in Figure 1b), which includes the rapidly expanding Thorthomi and Lugge Lakes that caused GLOF in 1994. Relatively large glacial lakes connected to debris-covered glaciers are located in this region. The thermal insulation effect of debris mantles contributes to the debris-covered termini being located at a lower elevation than the debris-free termini [16,26,27].

5.2. Interaction and Integration of GLOF Scale Multiple Indices

Figure 6 shows the normalized frequency distributions for the expansion factors of the Cp, Df, and Dn classes, where an expansion factor of unity indicates no change over the course of approximately 20 years. Cp (in red) has a long tail toward large expansion factors followed by Df (in blue). In contrast, Dn is highly concentrated around 1. These findings strongly suggest that lake expansion is related to the retreat of associated glaciers. Thus, the connectivity between glaciers and glacial lakes, whose change is a proxy for glacial retreat, is critical for the expansion of glacial lakes.
As discussed in Section 5.1, debris-cover is another critical factor in lake expansion. Figure 5 illustrates the distributions of debris-covered glaciers for different connectivity groups. Most of the lakes which have expansion factors exceeding two (more than double in size) and lake sizes exceeding 0.1 km2 belong to the group of Cp-from-Cp (Figure 5a). Furthermore, many of these lakes are associated with or connected to debris-covered glaciers. The lakes currently classified as Df, which comprise a large percentage of all the lakes (473 out of 733), showed large expansion, up to a 10-fold. However, these lakes are not larger than 0.1 km2 nor debris-covered. This is strong evidence for the importance of debris-covered mother glaciers for rapid expansion of large glacial lakes, which is consistent with previous studies [1,2,3,28].
Finally, PFVs in terms of the four volumetric classes were added to Figure 5. The lakes in the largest PFV class with volumes exceeding 10 × 106 m3 are also large lakes (>0.1 m2). However, many of these lakes are not rapidly expanding and only two of them have expansion factors exceeding 2.

5.3. Synthesis of Multiple Criteria

Previous studies have assessed the amount of water released by Sabai Tsho in Nepal in September 1998, as 17.7 × 10⁶ m3 [29]; 17.2 × 10⁶ m3 by Luggye Tsho in Bhutan in November, 1994 [30], and 5.0 × 10⁶ m3 by Dig Tsho in Nepal in August, 1985 [7]. Based on these observations, Table 4a shows integrated information of the GLOF-related factors discussed so far in a descending order of PFV, with a minimum value of 5.0 × 10⁶ m3. In total, there were 33 lakes, with a maximum PFV of 33.7 × 10⁶ m3 by Lake Ph-016. Twelve lakes had PFVs exceeding 1.0 × 10⁷ m3. The expansion factors ranged from 0.9 to 4.2, with only two lakes greater than 1.5. In terms of connectivity: 17 lakes were in the Df-from-Df group; seven in Cp-from-Cp; six in Df-from-Cp; one for Dn-from-Dn; and two were unidentified. Of these 33 lakes, nine were associated with glaciers with debris-cover. In fact, some of them had a large debris-cover ratio, up to 24% of the glacier surface. Visual geomorphological interpretation with Google Earth identifies eight lakes dammed by bedrock and the others dammed by moraines. No remarkable relationship is found between this categorization and other indices (Table 4).
Having complied this information, it was tempting to extract lakes with high GLOF scales and potential. Using the four criteria: large PFV, high rate of expansion factor, currently either Cp or Cf and thus hydrologically feasible for expansion, and connected with a debris-covered glacier, two lakes emerged; Ph-051 and Da-021 had large PFVs (>15 million m3), large expansion factors (>3 times), and had been in contact with debris-covered glaciers (Cp-from-Cp).
The former (Ph-051) is Thorthomi Lake located in the Lunana region in the Pho Chu Basin (Figure 1a,c and Figure 2b). Numerous small supra-glacial ponds on the debris-covered terminus were integrated into several large lakes during the second half of the 20th century [5,6]. Because the area is accessible and there is concern over such large supra-glacial lakes, the United Nations Development Programme supported the Government of Bhutan to install a water drainage outlet for this lake [31,32,33]. Since 2009, about 350 local workers, every summer, have attempted to control the water level. Thorthomi Lake had higher multiple criteria related to a large-scale GLOF compared to other lakes in the Bhutan Himalayas. Attempting to control water levels is a reasonable step toward the prevention of GLOF hazards.
The latter (Da-021) is an unnamed lake connected to a north-facing debris-covered glacier in the Dangme Chu Basin, China (Figure 1b,d and Figure 3b). Further remote sensing and if necessary in situ observations are needed to assess the possibility of a large-scale GLOF event at this location. Flood simulation using numerical models with accurate downstream topographic data would be ideal to quantify possible damage as demonstrated in [34,35,36].
These two lakes were selected in the current study based on four criteria. However, other glacier-related factors are important for lake expansion. For example, calving of a glacial terminus, wind effects, englacial conduits, and glacial flow velocities could affect lake expansion [37]. Further in situ and remote-sensing studies focused on these factors would help the understanding of why these two lakes have been rapidly expanding compared to other lakes. When the study region is extended from the Bhutan Himalaya to others, a variety of local topography should be considered in terms of topographic influence on lake expansion, because the north-to-south asymmetric feature in the Bhutan Himalayas illustrated in [38,39] has an influence on glacier advance/retreat.
Finally, it was noted that five of the 33 lakes in Table 4a were identified as PDGLs by the ICIMOD study [10]. Table 4b lists another 19 ICIMOD PDGLs, of which six lakes have positive PFVs with a maximum of 2.7 × 10⁶ m3 (Ph-027). Of these lakes, Mo-015 has a relatively large expansion factor (3.5-fold) but the present lake area is small (0.06 km2) and has been separated from the mother glacier (Df-from-Df). The other 11 PDGLs have zero PFVs, which means adequately low water levels relative to the foot of the moraine and/or gentle hillslope.

6. Conclusions

The current study developed a comprehensive glacier–glacial lake inventory for the Bhutan Himalayas based on satellite observations between 1987 and 1990 by SPOT-1 and ~2006–2011 by ALOS. This new integrated inventory provides much-needed information for a better understanding of glacier-related processes located in the eastern part of the Hindu Kush Himalayas. As a highly sought application of the inventory, GLOF scale and potential was analyzed using multiple criteria. In addition to the conventional criteria of expansion rate and lake size, the connectivity characteristic of the glacial lake to a mother glacier, potential flood volume, and debris-cover of the mother glacier, if any, for each of the glacial lakes in the inventory were examined.
With the availability of the two observational windows, not only the current connectivity condition but also its evolution was evaluated. The details of connectivity history using four different states: supra-glacial (Cs), pro-glacial (Cp), glacier-fed (Df), and no-glacier-fed (Dn) conditions were evaluated. The analysis of the connectivity evolution revealed that the evolution of the types Cp-from-Cs and Cf-from-Cp were more common, indicative of hydrological changes associated with the retreat of glaciers.
It was found that the majority of the lakes with high expansion rates (>2) and large size (>0.1 km2) satisfied the following two conditions: (i) Cp-from-Cp, thus continuously in contact with mother glaciers; and (ii) being associated with debris-covered glaciers. A close examination based on multiple criteria including connectivity and debris-cover revealed that there were two lakes with high GLOF scale and potential. One of them was the much-publicized Thorthomi Lake, which justifies ongoing drainage efforts. The other is an unnamed lake in China, which may require further investigation.
This study is a step toward a better understanding of glacial processes, especially those related to GLOF scale and potential. The current study demonstrated the usefulness of the new integrated glacier–glacial lake inventory as a valuable tool for objective GLOF scale comparison. A potential for further studies is that possible trigger mechanisms for GLOF events, such as moraine-dam failure, mass movement entering a lake, and the wave-erosion or self-destruction of a terminal moraine, were not explicitly discussed [29,30]. Future work needs to establish links between GLOF scale and GLOF potential and trigger mechanisms using observations and well-designed simulations. A comparison of local topography among different regions might explain regional difference of lake expansion trends.

Acknowledgments

This work was in part conducted for the ‘Study on Glacial Lake Outburst Floods in the Bhutan Himalayas’ project under the Science and Technology Research Partnership for Sustainable Development (SATREPS) supported by the Japan Science and Technology Agency and the Japan International Cooperation Agency. Many thanks to the two anonymous reviewers for their suggestions and the editor.

Author Contributions

H.N. designed this study and wrote the manuscript with J.U.; C.N. improved the outline of the study, followed by K.F. and A.S.; and T.T., T.Y. and N.T. prepared and processed the satellite data.

Conflicts of Interest

The authors declare no conflicts of interest.

References

  1. Zhang, G.; Yao, T.; Xie, H.; Wang, W.; Yang, W. An inventory of glacial lakes in the Third Pole region and their changes in response to global warming. Glob. Planet. Chang. 2015, 131, 148–157. [Google Scholar] [CrossRef]
  2. Nie, Y.; Sheng, Y.; Liu, Q.; Liu, L.; Liu, S.; Zhang, Y.; Song, C. A regional-scale assessment of Himalayan glacial lake changes using satellite observations from 1990 to 2015. Remote Sens. Environ. 2017, 189, 1–13. [Google Scholar] [CrossRef]
  3. Gardelle, J.; Arnaud, Y.; Berthier, E. Contrasted evolution of glacial lakes along the Hindu Kush Himalaya mountain range between 1990 and 2009. Glob. Planet. Chang. 2011, 75, 47–55. [Google Scholar] [CrossRef] [Green Version]
  4. Ageta, Y.; Iwata, S.; Yabuki, H.; Naito, N.; Sakai, A.; Narama, C. KARMA Expansion of glacier lakes in recent decades in the Bhutan Himalayas. In Debris-Covered Glaciers; Fountain, A., Nakao, M., Raymond, C.F., Eds.; IAHS Publication: Seattle, Washington, DC, USA, 2000; pp. 165–175. [Google Scholar]
  5. Komori, J. Recent expansions of glacial lakes in the Bhutan Himalayas. Quat. Int. 2008, 184, 177–186. [Google Scholar] [CrossRef]
  6. Yamada, T. Glacier Lake and Its Outburst Flood in the Nepal Himalaya; Japanese Society of Snow and Ice: Tokyo, Japan, 1998. [Google Scholar]
  7. Vuichard, D.; Zimmermann, M. The 1985 Catastrophic Drainage of a Moraine-Dammed Lake, Khumbu Himal, Nepal: Cause and Consequences. Mt. Res. Dev. 1987, 7, 91–110. [Google Scholar] [CrossRef]
  8. Richardson, S.D.; Reynolds, J.M. An overview of glacial hazards in the Himalayas. Quat. Int. 2000, 65–66, 31–47. [Google Scholar] [CrossRef]
  9. Buchroithner, M.F. Jökulhlaup mapping in the Himalaya by means of remote sensing. Kartogr. Bausteine 1996, 12, 75–86. [Google Scholar]
  10. Mool, P.K.; Wangda, D.; Bajracharya, S.R.; Kunzang, K.; Grung, D.R.; Joshi, S.P. Inventory of Glaciers, Glacial Lakes and Glacial Lake Outburst Floods. Monitoring and Early Warning Systems in the Hindu Kush-Himalayan Region: Bhutan; ICIMOD: Kathmandu, Nepal, 2001. [Google Scholar]
  11. Buchroithner, M.F.; Bolch, T. Glacier Lake Outburst Floods (GLOFs)—Mapping the Hazard of a Threat to High Asia and Beyond; Grover, V.I., Borsdorf, A., Breuste, J., Tiwari, P.C., Frangetto, F.W., Eds.; CRC Press: Boca Raton, FL, USA, 2014; ISBN 978-1-4822-0890-0. [Google Scholar]
  12. Emmer, A.; Vilímek, V. Review Article: Lake and breach hazard moraine-dammed lakes: An example from the Cordillera Blanca (Peru). Nat. Hazards Earth Syst. Sci. 2013, 13, 1551–1565. [Google Scholar] [CrossRef]
  13. Emmer, A.; Cochachin, A. The causes and mechanisms of moraine-dammed lake failures in the Cordillera Blanca, North American Cordillera, and Himalayas. AUC Geogr. 2013, 48, 5–15. [Google Scholar] [CrossRef]
  14. Fujita, K.; Sakai, A.; Takenaka, S.; Nuimura, T.; Surazakov, A.B.; Sawagaki, T.; Yamanokuchi, T. Potential flood volume of Himalayan glacial lakes. Nat. Hazards Earth Syst. Sci. 2013, 13, 1827–1839. [Google Scholar] [CrossRef]
  15. Nagai, H.; Fujita, K.; Nuimura, T.; Sakai, A. Southwest-facing slopes control the formation of debris-covered glaciers in the Bhutan Himalaya. Cryosphere 2013, 7, 1303–1314. [Google Scholar] [CrossRef]
  16. Nagai, H.; Fujita, K.; Sakai, A.; Nuimura, T.; Tadono, T. Comparison of multiple glacier inventories with a new inventory derived from high-resolution ALOS imagery in the Bhutan Himalaya. Cryosphere 2016, 10, 65–85. [Google Scholar] [CrossRef]
  17. Tadono, T.; Nagai, H.; Ishida, H.; Oda, F.; Naito, S.; Minakawa, K.; Iwamoto, H. Generation of the 30 m-mesh global digital surface model by ALOS PRISM. Int. Arch. Photogramm. Remote Sens. Spat. Inf. Sci. XXIII ISPRS Congr. 2016, XLI-B4, 157–162. [Google Scholar] [CrossRef]
  18. Bajracharya, S.R.; Maharjan, S.B.; Shrestha, F. The status and decadal change of glaciers in Bhutan from the 1980s to 2010 based on satellite data. Ann. Glaciol. 2014, 55, 159–166. [Google Scholar] [CrossRef]
  19. Ageta, Y.; Higuchi, K. Estimation of mass balance components of a summer-accumulation type glacier in the Nepal Himalaya. Geogr. Ann. Ser. A Phys. Geogr. 1984, 66, 249–255. [Google Scholar] [CrossRef]
  20. Tshering, P.; Fujita, K. First in situ record of decadal glacier mass balance (2003–2014) from the Bhutan Himalaya. Ann. Glaciol. 2016, 57, 289–294. [Google Scholar] [CrossRef]
  21. Ukita, J.; Narama, C.; Tadono, T.; Yamanokuchi, T.; Tomiyama, N.; Kawamoto, S.; Abe, C.; Uda, T.; Yabuki, H.; Fujita, K.; et al. Glacial lake inventory of Bhutan using ALOS data: Part I. Methods and preliminary results. Ann. Glaciol. 2011, 52, 65–71. [Google Scholar] [CrossRef]
  22. Fujita, K.; Nishimura, K.; Komori, J.; Iwata, S.; Ukita, J.; Tadono, T.; Koike, T. Outline of Research Project on Glacial Lake Outburst Floods in the Bhutan Himalayas. Glob. Environ. Res. 2012, 16, 3–12. [Google Scholar]
  23. Tadono, T.; Kawamoto, S.; Narama, C.; Yamanokuchi, T.; Ukita, J.; Tomiyama, N.; Tabuki, H. Development and Validation of New Glacial Lake Inventory in the Bhutan Himalayas Using ALOS “DAICHI”. Glob. Environ. Res. 2012, 16, 31–40. [Google Scholar]
  24. Veettil, B.K.; Bianchini, N.; de Andrade, A.M.; Bremer, U.F.; Simões, J.C.; de Souza Junior, E. Glacier changes and related glacial lake expansion in the Bhutan Himalaya, 1990–2010. Reg. Environ. Chang. 2015, 16, 1267–1278. [Google Scholar] [CrossRef]
  25. Salerno, F.; Thakuri, S.; D’Agata, C.; Smiraglia, C.; Manfredi, E.C.; Viviano, G.; Tartari, G. Glacial lake distribution in the Mount Everest region: Uncertainty of measurement and conditions of formation. Glob. Planet. Chang. 2012, 92–93, 30–39. [Google Scholar] [CrossRef]
  26. Nakao, M.; Young, G.J. Field experiments to determine the effect of a debris layer on ablation of glacier ice. Ann. Glaciol. 1981, 2, 85–91. [Google Scholar] [CrossRef]
  27. Östrem, G. Ice Melting under a Thin Layer of Moraine, and the Existence of Ice Cores in Moraine Ridges. Geogr. Ann. 1959, 41, 228–230. [Google Scholar]
  28. Nuimura, T.; Fujita, K.; Yamaguchi, S.; Sharma, R.R. Elevation changes of glaciers revealed by multitemporal digital elevation models calibrated by GPS survey in the Khumbu region, Nepal Himalaya, 1992–2008. J. Glaciol. 2012, 58, 648–656. [Google Scholar] [CrossRef]
  29. Dwivedi, S.S.K.; Acharya, M.D.M.; Simard, R. The Tam Pokhari glacier lake outburst flood of 3 September 1998. J. Nepal Geol. Soc. 2000, 22, 539–546. [Google Scholar]
  30. Fujita, K.; Suzuki, R.; Nuimura, T.; Sakai, A. Performance of ASTER and SRTM DEMs, and their potential for assessing glacial lakes in the Lunana region, Bhutan Himalaya. J. Glaciol. 2008, 54, 220–228. [Google Scholar] [CrossRef]
  31. Meenawat, H.; Sovacool, B.K. Improving adaptive capacity and resilience in Bhutan. Mitig. Adapt. Strateg. Glob. Chang. 2011, 16, 515–533. [Google Scholar] [CrossRef]
  32. UNDP. Reducing Climate Change-induced Risks and Vulnerabilities from Glacial Lake Outburst Floods in the Punakha-Wangdi and Chamkhar Valleys. In UNDP Project Document Government Bhutan; United Nations Development Program: New York, NY, USA, 2012. [Google Scholar]
  33. Brauner, M.; Leber, D.; Hausler, H. Glacier Lake Outburst Flood (GLOF) Mitigation Project, Lunana, Bhutan: Technical Mitigation Measures Thorthomi Outlet; Department of Geological Sciences, University of Vienna: Vienna, Austria, 2003; p. 27. [Google Scholar]
  34. Wang, X.; Liu, S.; Ding, Y.; Guo, W.; Jiang, Z.; Lin, J.; Han, Y. An approach for estimating the breach probabilities of moraine-dammed lakes in the Chinese Himalayas using remote-sensing data. Nat. Hazards Earth Syst. Sci. 2012, 12, 3109–3122. [Google Scholar] [CrossRef] [Green Version]
  35. Worni, R.; Huggel, C.; Stoffel, M. Science of the Total Environment Glacial lakes in the Indian Himalayas—From an area-wide glacial lake inventory to on-site and modeling based risk assessment of critical glacial lakes. Sci. Total Environ. 2013, 468, S71–S84. [Google Scholar] [CrossRef] [PubMed]
  36. Rounce, D.R.; McKinney, D.C.; Lala, J.M.; Byers, A.C.; Watson, C.S. A new remote hazard and risk assessment framework for glacial lakes in the Nepal Himalaya. Hydrol. Earth Syst. Sci. 2016, 20, 3455–3475. [Google Scholar] [CrossRef]
  37. Baťka, J. Factors of formation and development of supraglacial lakes and their quantification: A review. AUC Geogr. 2016, 51, 205–216. [Google Scholar] [CrossRef]
  38. Kääb, A. Combination of SRTM3 and repeat ASTER data for deriving alpine glacier flow velocities in the Bhutan Himalaya. Remote Sens. Environ. 2005, 94, 463–474. [Google Scholar] [CrossRef]
  39. Scherler, D.; Bookhagen, B.; Strecker, M.R. Hillslope-glacier coupling: The interplay of topography and glacial dynamics in High Asia. J. Geophys. Res. 2011, 116, F02019. [Google Scholar] [CrossRef]
Figure 1. Spatial distribution of glacial lakes in the Bhutan Himalayas. (a) Lake areas and elevations. (b) Multiple indices of debris-covered glaciers, potential flood volumes (PFVs), and potentially dangerous glacial lakes (PDGLs). The background topographic map is generated from ALOS World 3D-30m [17].
Geosciences 07 00077 g001
Figure 2. Examples of glacial lake outlines with glacier and debris-covered areas. (a) Thorthomi Lake and (b) unnamed lake. (c,d) Back-traced lake outlines from ALOS images (2006–2010) and Satellite Pour l’Observation de la Terre-1 (SPOT-1) images (1987–1990).
Geosciences 07 00077 g002
Figure 3. Histograms of inventoried glacial lakes in the Bhutan Himalayas. (a) Number of lakes per basin. (b) Total area for each area class.
Geosciences 07 00077 g003aGeosciences 07 00077 g003b
Figure 4. Vertical distribution of glacial lakes. (a) Total, and (bj) the nine river basins.
Geosciences 07 00077 g004
Figure 5. Area of glacial lakes ~2010 versus expansion factors from ~1990 to ~2010. Dot colors correspond to connectivity changes initially separated in (a) present Cs and Cp, (b) Df from Df, (c) Df from Cp, and (d) present Dn. PFV, connection to debris-covered glacier, and PDGLs are noted by symbols. Two lakes with proposed multiple high criteria for large-scale glacial lake outburst flood (GLOF) annotated as (A) and (B) in (a) correspond to those in Figure 1.
Geosciences 07 00077 g005aGeosciences 07 00077 g005b
Figure 6. Normalized frequency distribution of expansion factors between 2006 and 2010 and ~1990 smoothed using a moving window ( w = 10 n 10 ) where n is an integer.
Geosciences 07 00077 g006
Table 1. Satellite Pour l’Observation de la Terre-1 (SPOT-1) imagery specifications for back-tracing glacial lake outlines.
SatelliteSensorDateSpatial Resolution (m)Imagery TypeScene ID
SPOT-1HRV01-15-199010Panchromatic1 232-294 90-01-15 04:52:22 2 P
01-15-19901 232-295 90-01-15 04:52:30 2 P
20-12-19891 233-293 89-12-20 04:52:16 1 P
20-12-19891 233-294 89-12-20 04:52:25 1 P
20-12-19891 234-293 89-12-20 04:52:14 2 P
20-12-19891 234-294 89-12-20 04:52:23 2 P
10-12-19891 235-294 89-12-10 04:44:35 1 P
10-12-19891 235-295 89-12-10 04:44:44 1 P
10-12-19891 236-294 89-12-10 04:44:34 2 P
10-12-19891 236-295 89-12-10 04:44:42 2 P
04-01-19871 237-294 87-01-04 04:40:23 1 P
04-01-19871 237-295 87-01-04 04:40:31 1 P
22-01-19891 238-295 89-01-22 04:36:28 2 P
Table 2. Statistical and vertical distribution of glacial lakes.
AllAmo ChuWang ChuMo ChuPho ChuMande ChuChamkhar ChuKuri ChuDangme ChuTibet
Number7332113561421021031469357
Basin area (km2) 615649542372233338203168966910,478>90,000
Areal Density (lakes per km2) 3.4 × 10−32.6 × 10−32.4 × 10−26.1 × 10−22.7 × 10−23.3 × 10−21.5 × 10−28.9 × 10−3<6.3 × 10⁻⁴
Elevation (m)Mean 5008495345714878494151354989503350255137
Standard deviation275.5166.1211.7269.3279.5157.9177.1347.8251.8250.4
Range175171068411311233708806170011261158
Maximum5885532050165292536754985374586755485885
3rd quartile5173506447205040513152465120530152065278
Median5037495444934940503451405014503650785124
1st quartile4853487144064787482850314859476448604916
Minimum4134461043324161413447904568416744224727
Skewness−0.43−0.050.73−1.02−1.10−0.03−0.420.00−0.530.74
Kurtosis3.642.572.103.233.242.602.532.422.583.45
Table 3. Summary of glacier–glacial lake connectivity.
ALOS (2006–2011)Total
CsCpDfDnNo LakeN/A
SPOT-1 (1987–1990)Cs4100005
Cp06769000136
Df00403900412
Dn000430043
No lake10292700066
N/A0317604571
Total1410051658045733
Cs: supra-glacial; Cp: pro-glacial; Df: glacier-fed; Dn: no-glacier-fed; N/A: connection unidentified because of poor satellite imagery.
Table 4. Multiple glacial lake outburst flooding (GLOF) scale indices for (a) highest potential flood volume (PFV) and (b) potentially dangerous glacial lakes (PDGLs).
PFVExpansion FactorLake Area (km2)IDICIMODConnectivityMoraine-/Bedrock-DammedDebris-CoverGlacierDebris-CoveredLocation in Figure 2b
(Million m3)(1990–2010)ALOSSPOT-1PDGLALOSSPOT-1IDArea (km2)Area (km2)Ratio (%)
(a) PFV >5 m3133.71.00.640.64Ph-016DfDfM 903122.20.00
230.54.21.170.28Ph-051 CpCpM9054713.13.124(A)
327.71.00.620.62Ch-019DfCpM 908050.50.00
418.61.00.580.59Am-018 DfDfM900182.30.312
517.61.00.390.39Ku-133 DfDfM 912440.10.00
616.13.00.270.09Da-021 CpCpM914593.20.620(B)
715.71.00.320.32Ku-019 DfDfM 911150.10.00
813.61.00.280.28Ku-047 DfDfM 909821.30.00
912.31.20.340.27Ti-029 CpCpM 901571.50.00
1012.11.00.280.27Ku-078 CpCpM909471.50.212
1110.70.90.270.30Ku-039 DfCpM 908792.90.00
1210.71.00.270.27Da-001 DnDnB N/A---
138.91.10.230.21Mo-030DfDfM902617.90.12
148.7-0.32Before formationMa-016 Cp-M 905882.10.00
158.31.00.240.24Ma-049DfDfM 906020.70.00
168.11.00.220.22Ku-024 DfDfB911022.30.15
177.81.00.210.20Ti-019 DfDfM 901031.80.00
187.61.00.230.23Ti-033 DfCpM 901730.40.00
197.51.10.400.36Ti-005 DfDfM900321.10.110
207.21.00.200.20Da-040 CpCpM 915211.10.00
216.9N/A0.19N/AKu-095 DfN/AM 911342.30.00
226.71.00.360.36Mo-048 DfDfB 903030.60.00
236.61.00.130.13Ph-017 DfDfB 903320.60.00
246.41.00.190.19Ma-081 DfDfM 906850.30.00
256.21.30.170.13Wa-012 DfDfB 900710.20.00
265.81.10.130.13Ti-009 DfDfM900400.80.05
275.81.20.190.16Ku-085 CpCpM907522.20.210
285.61.20.450.37Ma-061 CpCpM 906392.10.00
295.51.10.190.18Ti-027 DfCpM 901442.60.00
305.40.90.150.16Ma-059 DfDfM 906410.40.00
315.31.00.340.34Ch-101 DfCpB 910572.90.00
325.21.90.150.08Mo-031DfCpM 902430.40.00
335.11.00.160.16Ch-087 DfDfM 910241.00.00
(b) PDGL by ICIMOD342.71.00.440.43Ph-027DfDfM9031112.02.621
352.60.80.130.16Ph-058CpCpM906504.61.327
361.63.50.060.02Mo-015DfDfM901531.50.532
371.31.00.050.05Mo-014DfDfM901403.50.823
381.21.10.190.18Ch-027DfDfM 907730.90.00
390.80.90.030.03Mo-016DfDfM901642.91.140
400.01.51.360.92Ph-057CpCpM9060010.91.715
410.01.01.231.19Ph-050CpCpM905053.61.233
420.01.10.210.19Ph-081DfDfM 904401.20.00
430.01.20.250.21Ph-025DfDfM902713.00.415
440.01.00.710.71Ph-008DfDfB 903300.10.00
450.01.00.210.21Ma-008DfCpM905590.70.06
460.01.00.210.21Ma-069DfDfM 906881.10.00
470.01.01.121.11Ma-012CpCpM 905763.80.00
480.01.00.810.79Ma-062CpCpM 906613.50.00
490.01.00.350.36Ma-057DfDfM 906231.10.00
500.01.31.310.98Ch-074CpCpM 908100.30.00
51N/A1.00.170.17Ku-129DfDfB 912560.10.00
52N/A1.00.020.02Ma-086DfCpM 907050.50.00

