Article

Development of a Seamless, High-Resolution Bathymetric Model to Compare Reef Morphology around the Subtropical Island Shelves of Lord Howe Island and Balls Pyramid, Southwest Pacific Ocean

by
Michelle Linklater
1,*,†,
Sarah M. Hamylton
1,
Brendan P. Brooke
2,
Scott L. Nichol
2,
Alan R. Jordan
3 and
Colin D. Woodroffe
1
1
School of Earth and Environmental Sciences, University of Wollongong, Northfields Ave., Gwynneville 2522, Australia
2
Geoscience Australia, GPO Box 378, Canberra 2601, Australia
3
New South Wales Department of Primary Industries, Locked Bag 1, Nelson Bay 2315, Australia
*
Author to whom correspondence should be addressed.
Current address: Water, Wetlands and Coasts Science, New South Wales Office of Environment and Heritage, Locked Bag 1002, Dangar NSW 2309, Australia.
Geosciences 2018, 8(1), 11; https://doi.org/10.3390/geosciences8010011
Submission received: 3 November 2017 / Revised: 20 December 2017 / Accepted: 23 December 2017 / Published: 2 January 2018
(This article belongs to the Special Issue Marine Geomorphometry)

Abstract

:
Lord Howe Island and Balls Pyramid are located approximately 600 km offshore of the southeastern Australian mainland, in the subtropical waters of the northern Tasman Sea. Lord Howe Island hosts the most southern coral reef in the Pacific Ocean, and the shelves surrounding both islands feature fossil coral reefs. This study creates a seamless, high-resolution (5 m cell size) bathymetry model of the two shelves to compare and contrast the extent of reef development and shelf morphology. This was produced by integrating satellite-derived depth data (derived to 35 m depth) and multibeam echosounder (MBES) data. Image partitioning and filtering improved the accuracy of the bathymetry estimates and the suitability for integration with MBES data. Diverse accretionary and erosional geomorphic features were mapped on both shelves, with fossil reefs dominating the shelves in 25–50 m depth. Similar patterns of shelf morphology were observed for the middle and outer shelves, while the inner shelf regions were most dissimilar, with reef development greater around Lord Howe Island compared to the more restricted inner shelf reefs around Balls Pyramid. Understanding the relative extent and morphology of shelf features provides insights into the geological and ecological processes that have influenced the formation of the shelves.

1. Introduction

Geomorphic characterisations of the seabed provide fundamental information for management of benthic biodiversity [1]. Geomorphology can be used as a physical surrogate for biodiversity, help identify areas of likely high habitat diversity, as well as stratify subsequent biological sampling. Geomorphic interpretations are often utilised as cost-effective baseline surveys for marine spatial planning, with broadscale, provincial mapping informing international and national policy [2,3,4] and mesoscale, regional mapping useful for local management applications [5,6,7].
Digital elevation models (DEMs) are a core dataset for geomorphic feature interpretations [8]. In the marine environment, DEMs can be produced from data acquired from active (e.g., sonar) or passive (e.g., satellite) sensors. Multibeam echosounders (MBES) are a common platform used to map seabed bathymetry; however their efficiency typically decreases in shallower waters. Marine light detection and ranging (LiDAR) data and satellite-derived bathymetry can be utilised to fill the void in this coastal zone and create a seamless surface of the land and seafloor [9]. The acquisition of airborne LiDAR can often be prohibitively expensive, and the approach of extracting depth from satellite imagery offers an accessible and effective means to generate DEMs [10].
Depth can be derived from satellite imagery using physics-based or empirical methods. Employing physical methods [11,12] require the input of a range of parameters measured in the field and, while providing robust seabed data, are complex to implement. Empirical methods [13] are more simplistic, requiring fewer parameters, although ground validation depth data are needed. Due to the increased parameterisation of physical methods, the resultant surface can be more accurate than provided by empirical methods. However, in certain settings, empirical approaches can provide comparably accurate surfaces [10].
To effectively derive depth from satellite imagery, the images are typically pre-processed to reduce or remove the artefacts of atmosphere, cloud cover or surface disturbance, such as sun glint or wind waves [14,15]. Noise and pixelation are commonly smoothed by image filtering methods which remove outliers in the data. As terrain derivatives can be used to explore spatial patterns in relation to benthic and pelagic communities [1,16], it is important that terrain measures derived from the satellite image are reflecting surface variation rather than pixelation artefacts. For the creation of seamless DEMs, it is important that surface smoothing of input datasets are at comparable levels to ensure consistency for subsequent geomorphic analysis of the integrated DEM.
The creation of a seamless DEM of the coast and shelf enables an holistic approach to terrain analysis and geomorphic interpretation, enabling landform features to be defined and described at the same scale. The acquisition of marine LiDAR and satellite-derived bathymetry over expansive areas along the Australian coastline have led to the creation of seamless coastal DEMs which inform the understanding of coastal processes and evolution, and reveal distributions of potential submerged habitats [17,18,19]. For example, along the Great Barrier Reef in Australia, the creation of a seamless DEM through integrated bathymetric sources [20] has led to the identification of extensive areas of potential suitable habitat for corals and increased understanding of reef morphology over broad spatial scales [21,22].
In this study, we report the development of a seamless bathymetric DEM for the shelf areas surrounding the world-heritage-listed Lord Howe Island and Balls Pyramid, which occur in subtropical waters offshore of the New South Wales (NSW) mainland, Australia. The creation of a seamless shelf DEM of this region would enable characterisation of the marine geomorphology of the region, which allows an assessment of geodiversity and potential biodiversity.
Accurately delineating the extent of fossil reefs is important for understanding capacity for reef accretion in marginal, subtropical settings. In this study, we utilise satellite imagery to infill gaps in coverage and produce a new shelf DEM. We explore methods of enhancing the processing of satellite-derived bathymetry to suit the purposes of integration with MBES for DEM generation, including filtering and image partitioning. The aims of this study are to: (1) improve application of depth extraction for input into an integrated DEM; (2) create an updated DEM for the region; (3) define and map shelf geomorphic features to compare and contrast shelf morphology.

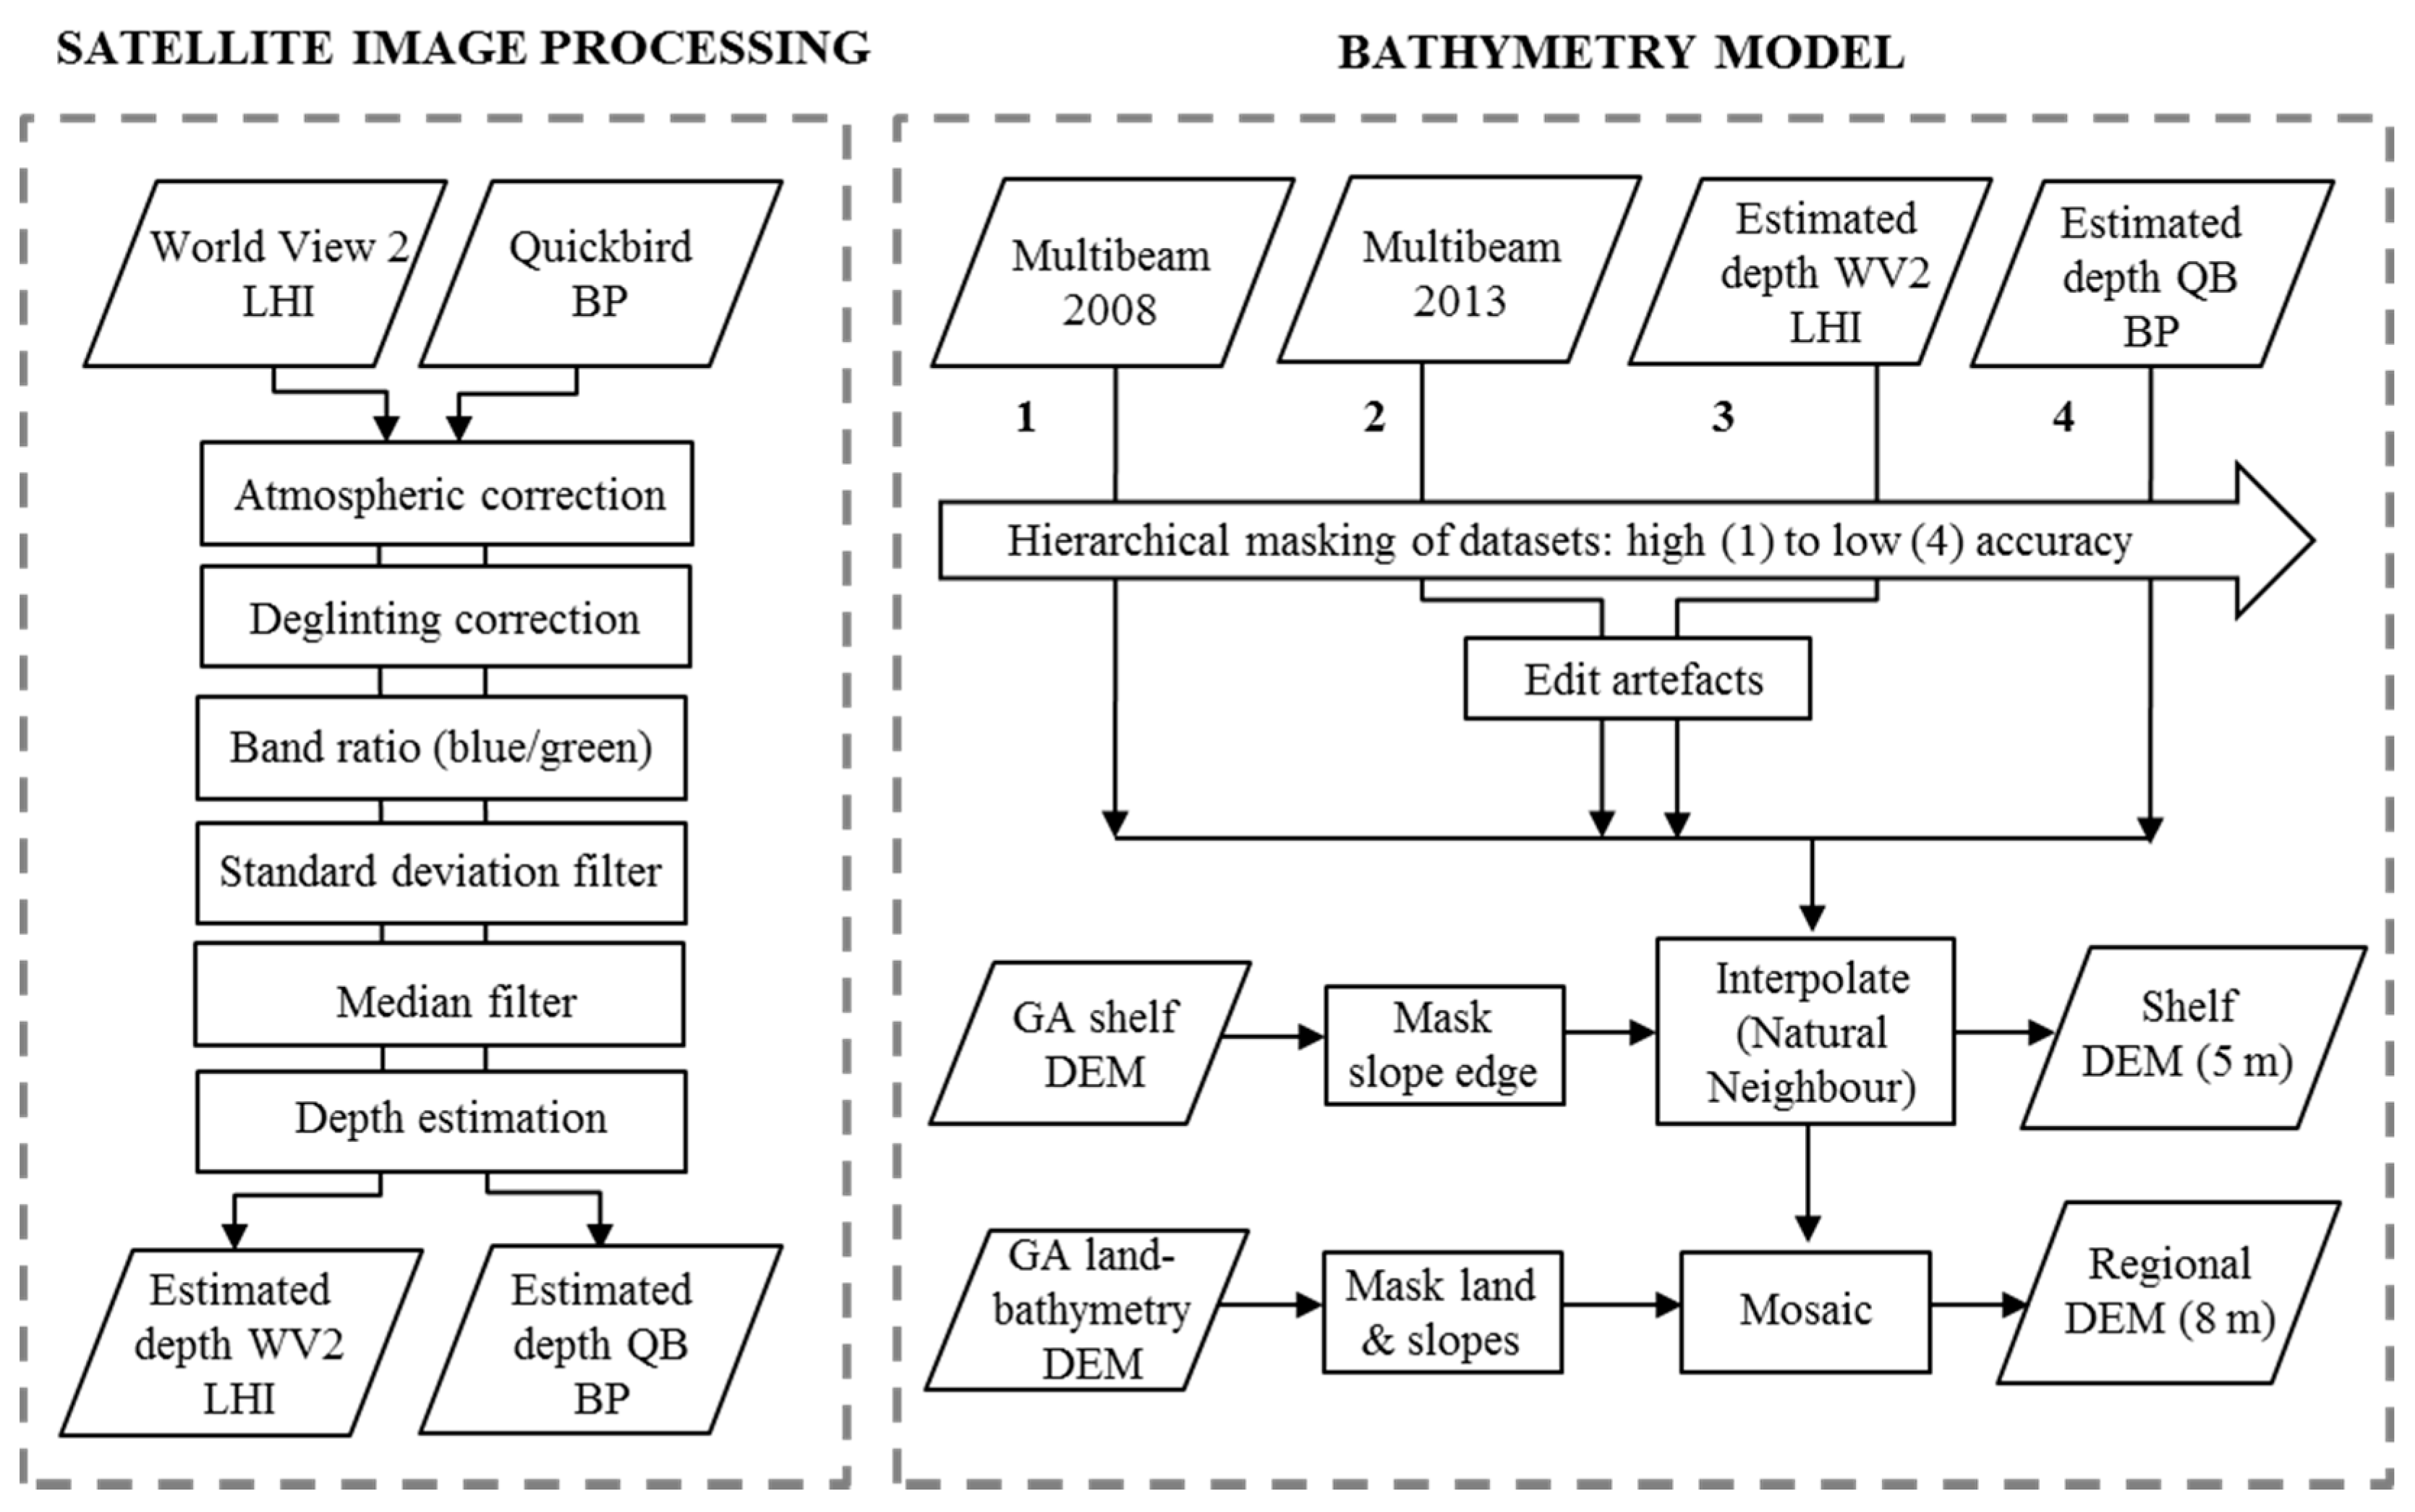
2. Materials and Methods
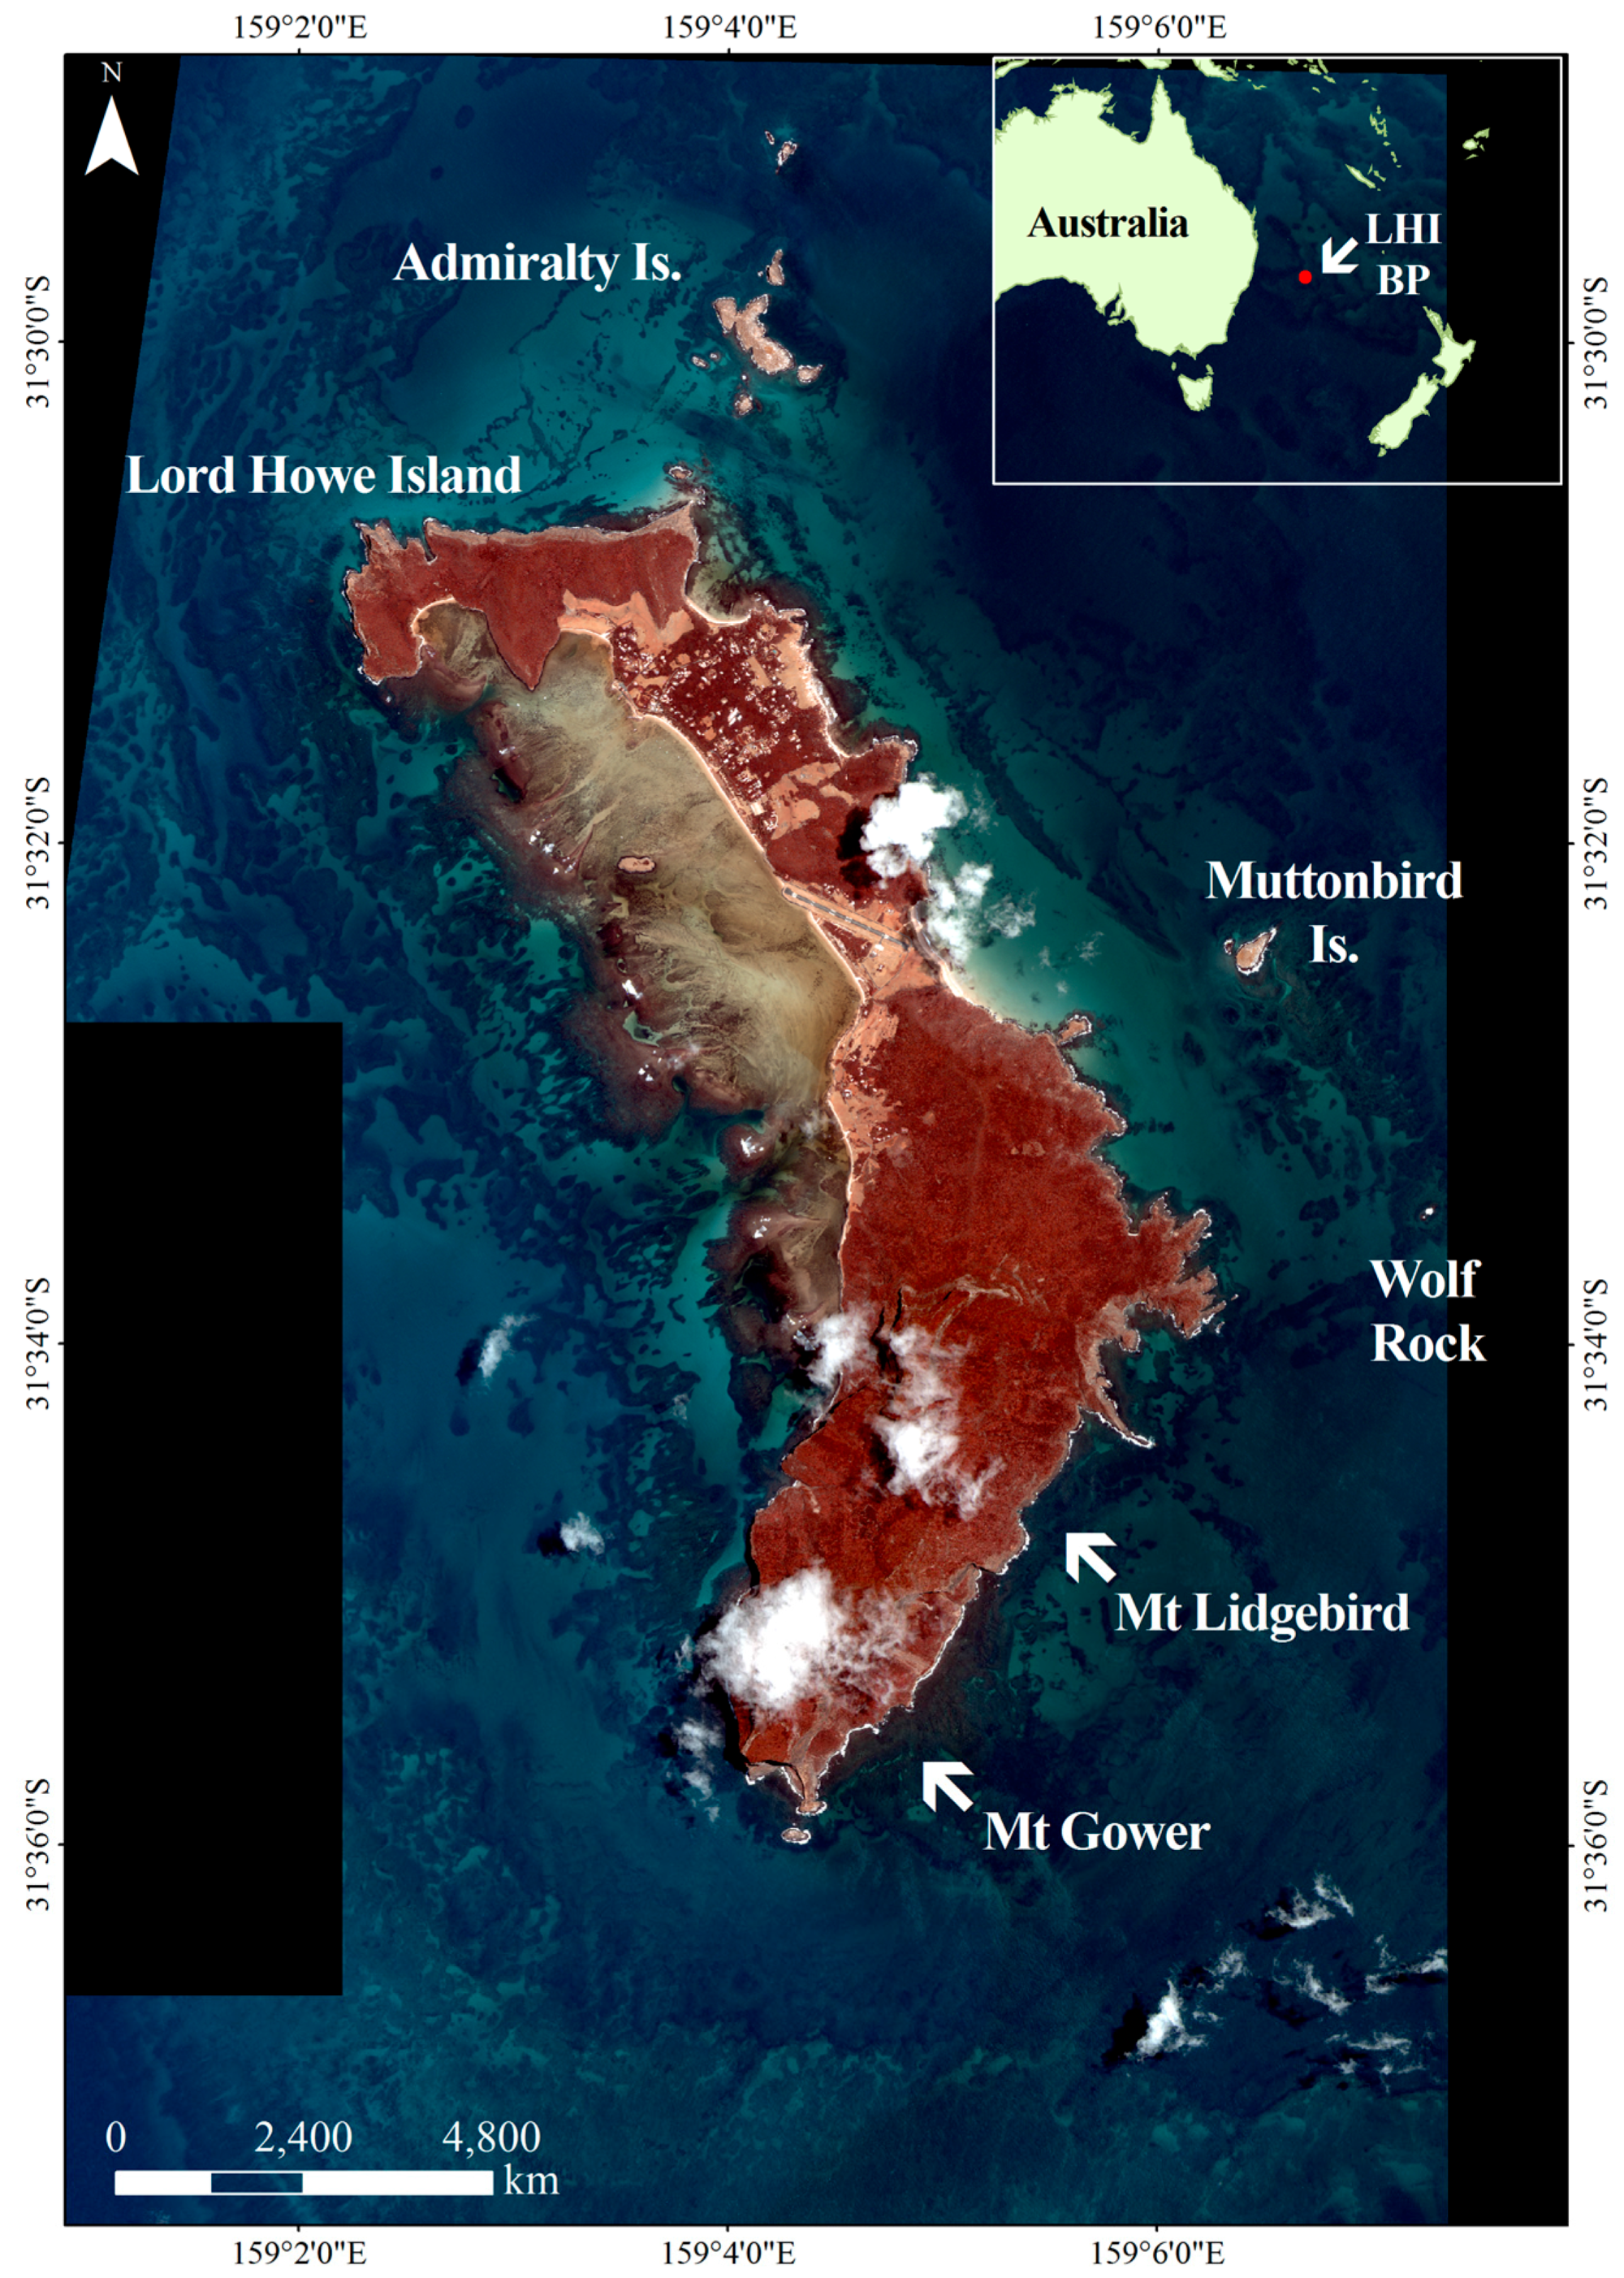
2.1. Study Area

Lord Howe Island and Ball Pyramid are remote, pristine islands which are located 600 km offshore of the east coast of the Australian mainland (Figure 1). These islands are internationally valued for their high biodiversity and endemism, and for possessing the southernmost coral reef in the Pacific Ocean, which fringes the west coast of Lord Howe Island [23,24]. The islands are protected by state and Commonwealth marine parks and reserves, and have been World Heritage listed since 1982.
The islands formed from hotspot volcanism 6–7 million years ago [25] and have eroded to a small fraction of their original size with broad shelf platforms submerged in 30–100 m water depth [26]. Eroded volcanic lavas and tuffs are overlain by Quaternary calcarenites [25,27]. A coral reef fringes the west coast of Lord Howe Island [23,28] and extensive fossil reefs have been mapped around the submerged shelves [29,30]. The fossil reef around Lord Howe Island developed during times of lower sea level and is more than 20 times larger in area than the modern fringing coral reef [29]. Material dated from the fossil reef revealed several metres of accretion from 9–2 ka [29]. A comparable submerged reef system is also present on the Balls Pyramid shelf, and inferred to similarly be a drowned fossil reef [30]. Coral reef growth is possible at this subtropical location due to the influx East Australian Current which flows east from the Australian mainland delivering warm waters to the region.
Broadscale characterisations at the provincial and biome levels have been previously undertaken for the Lord Howe region, generating datasets for international [4] and national [3,31] marine management. Meso-scale mapping at the geomorphic and primary biome classification levels have also been produced for the shelves [30,32,33,34,35] and habitat classifications have been performed for shallow and mesophotic assemblages [23,34,36,37]. Mapping of geomorphic features has been utilised in assessment reviews of the marine park zoning scheme and research planning [34,38].
High-resolution bathymetry grids were compiled for the Lord Howe region by Geoscience Australia [39], which included a land-bathymetry model with MBES data of the shelves and slopes together with depth extracted from a Quickbird image of Lord Howe Island. Since the creation of the bathymetry grids by Geoscience Australia [39], new MBES data was acquired around the shelves aboard the R.V. Southern Surveyor (Marine National Facility, Canberra, Australia) in 2013, presented in [30] and this study. The availability of detailed new MBES data and satellite imagery around the islands creates the opportunity to create a seamless DEM and geomorphic interpretation of the shelves from shoreline to shelf break.

2.2. Depth Estimation for the Lord Howe Island Shelf

Depth estimates were empirically derived from high-resolution World View 2 imagery 2010 (WV2, 8 spectral bands, 2 m cell size) to supplement the gaps in bathymetry data around the inner shelf of Lord Howe Island. MBES data were collected around the middle shelf in 2008 and 2013 aboard the R.V. Southern Surveyor using the onboard Kongsberg EM300 30 kHz system. Single beam data were collected in the lagoon in 2008 by New South Wales Roads and Maritime Services using an ODOM CVx3 echosounder. Marine LiDAR data was available around the north of the island, although the data was considered too coarse for this study (35 m cell size). Single beam and MBES data were utilised for bathymetry estimates due to their greater data density (4–5 m point spacing for multibeam; 10–15 m point spacing for single beam) which better matches the image resolution (2 m cell size).
Data were converted into the local Lord Howe Island hydro datum and tidal corrections were applied to all datasets (tide height 1.90 m above local datum at time of image acquisition). Single beam data were collected in the local datum. MBES data were collected in Australian height datum and were transformed to the local datum for analysis. A summarised workflow of satellite imagery processing is shown in Figure 2.

2.2.1. Correction for Atmospheric Interference and Sun Glint Effects

The Lord Howe Island WV2 image was calibrated to radiance units (μW·cm-2·nm-1·sr-1) using ENVI v4.8 (Harris Corporation, Colorado, USA). The Fast Line-of-sight Atmospheric Analysis of Spectral Hypercubes (FLAASH) algorithm was used to correct for atmospheric interference [40,41]. This algorithm adopts the MODTRAN4 (MODerate resolution atmospheric TRANsmission) radiation transfer model to remove the contributions of atmosphere from the spectral reflectance [40,41]. A mid-latitude model was used with initial visibility adjusted to 80 km.
Corrections for sun glint were undertaken on the atmospherically-corrected image using the methodology of [15]. This method achieved deglinting by using the near infra-red (NIR) band to approximate the contribution of specular reflection from the water surface, and subtracting this from the reflectance in each individual image band. To calculate the slope product and minimum NIR values required for deglinting, a subset was extracted from a region of interest (ROI) in each band (49,567 points per band). The ROI was defined from a representative area, which demonstrated a range of glint intensities over homogenous substrate. A single ROI area was extracted from the image as this was found to produce a stronger correlation. Extraction of data from multiple ROI’s produced data clusters that expressed similar slopes within the regression, though the spread of data reduced the overall fit of the linear regression. Land and cloud artefacts were masked from the image using a digitised land and cloud polygon.

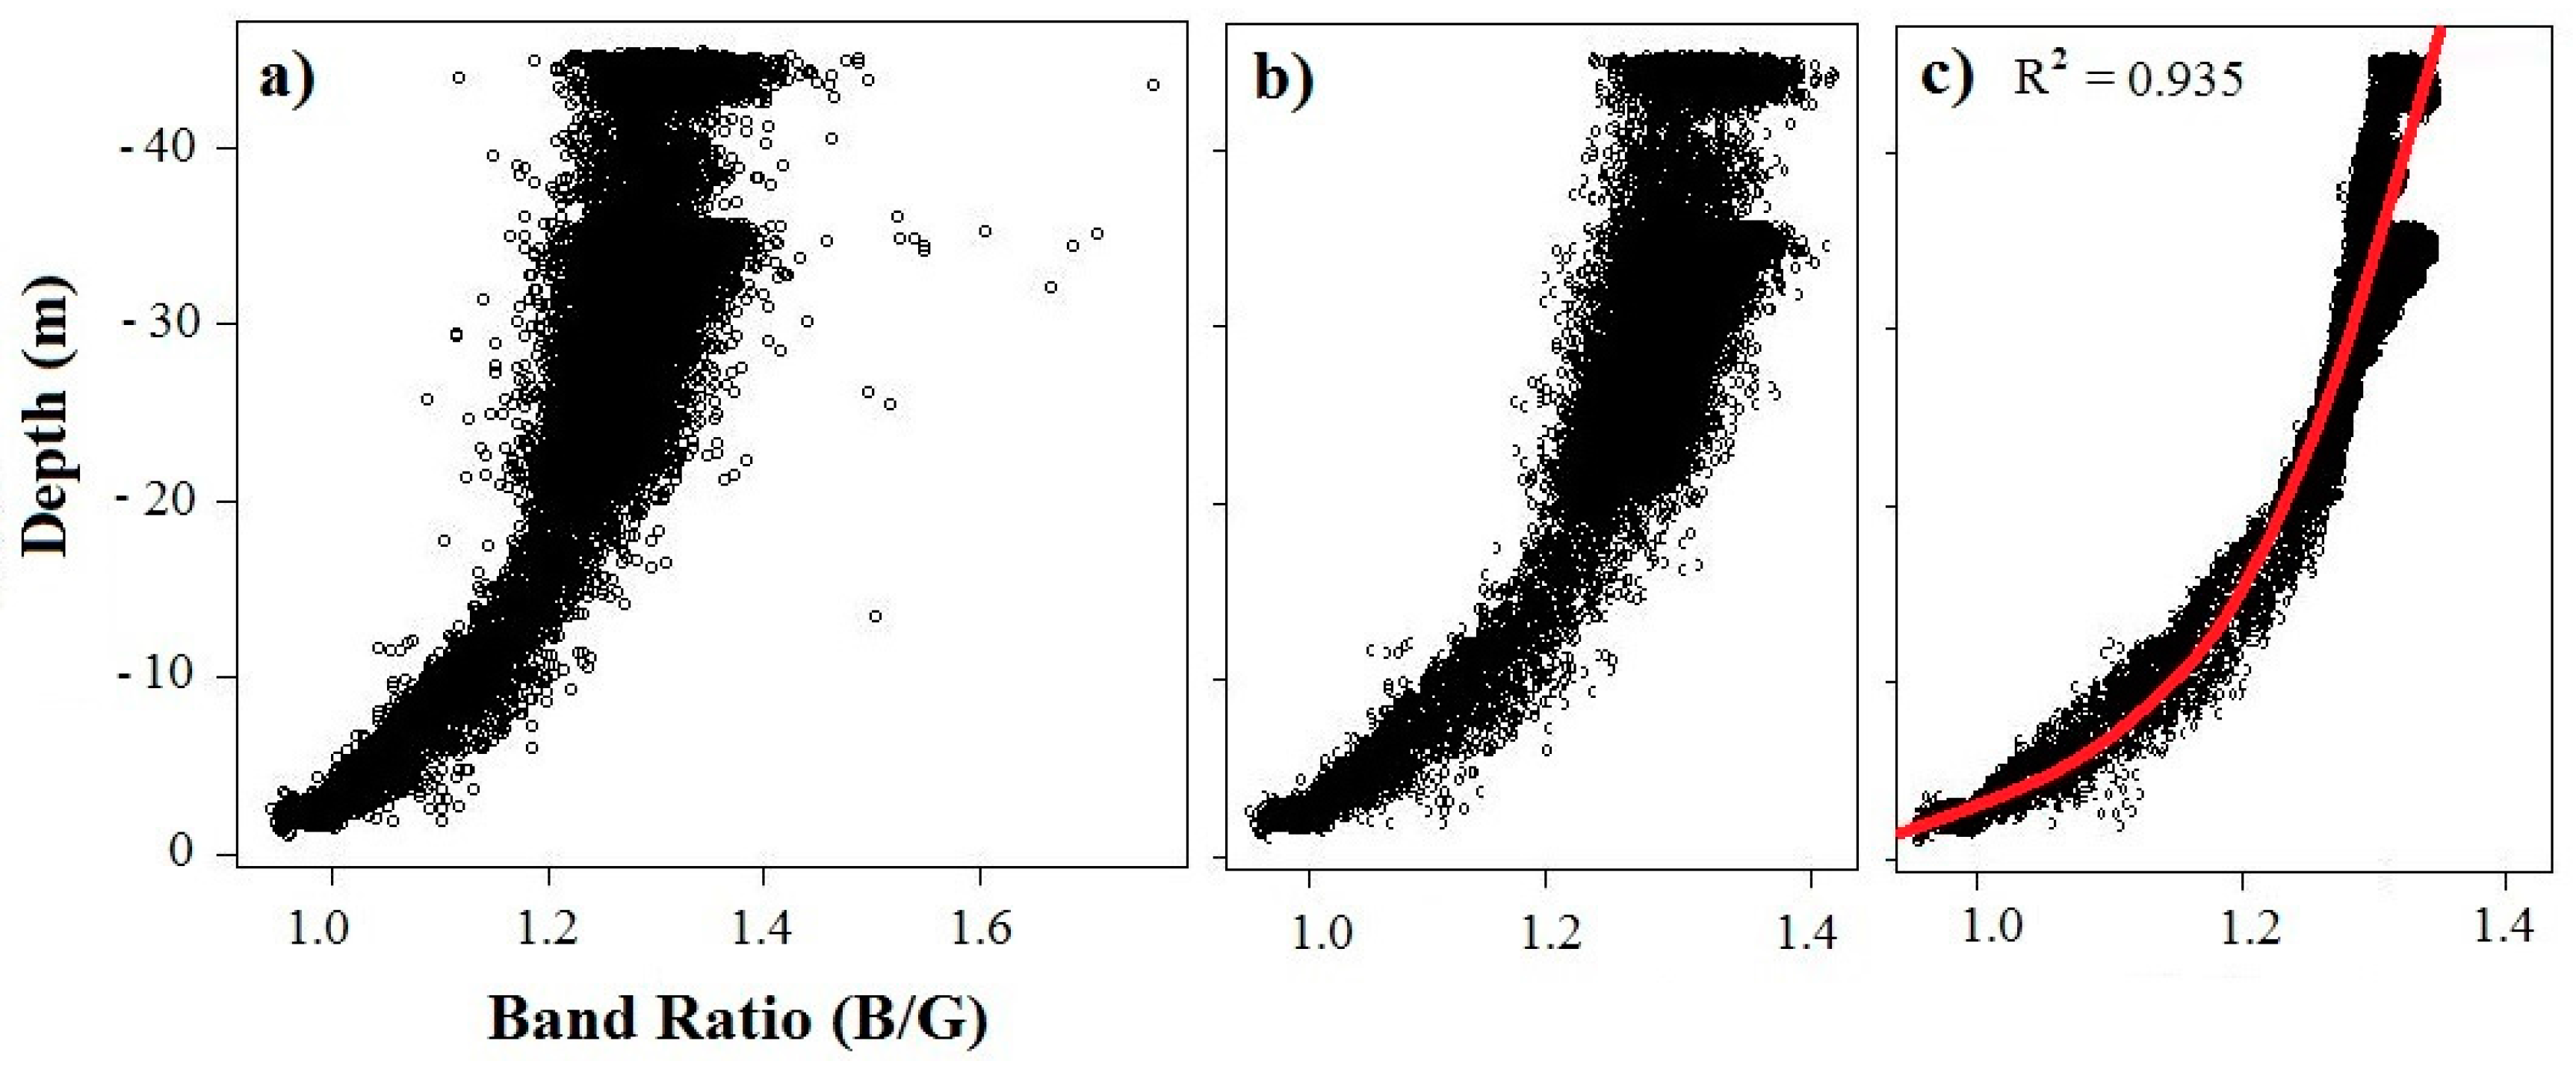
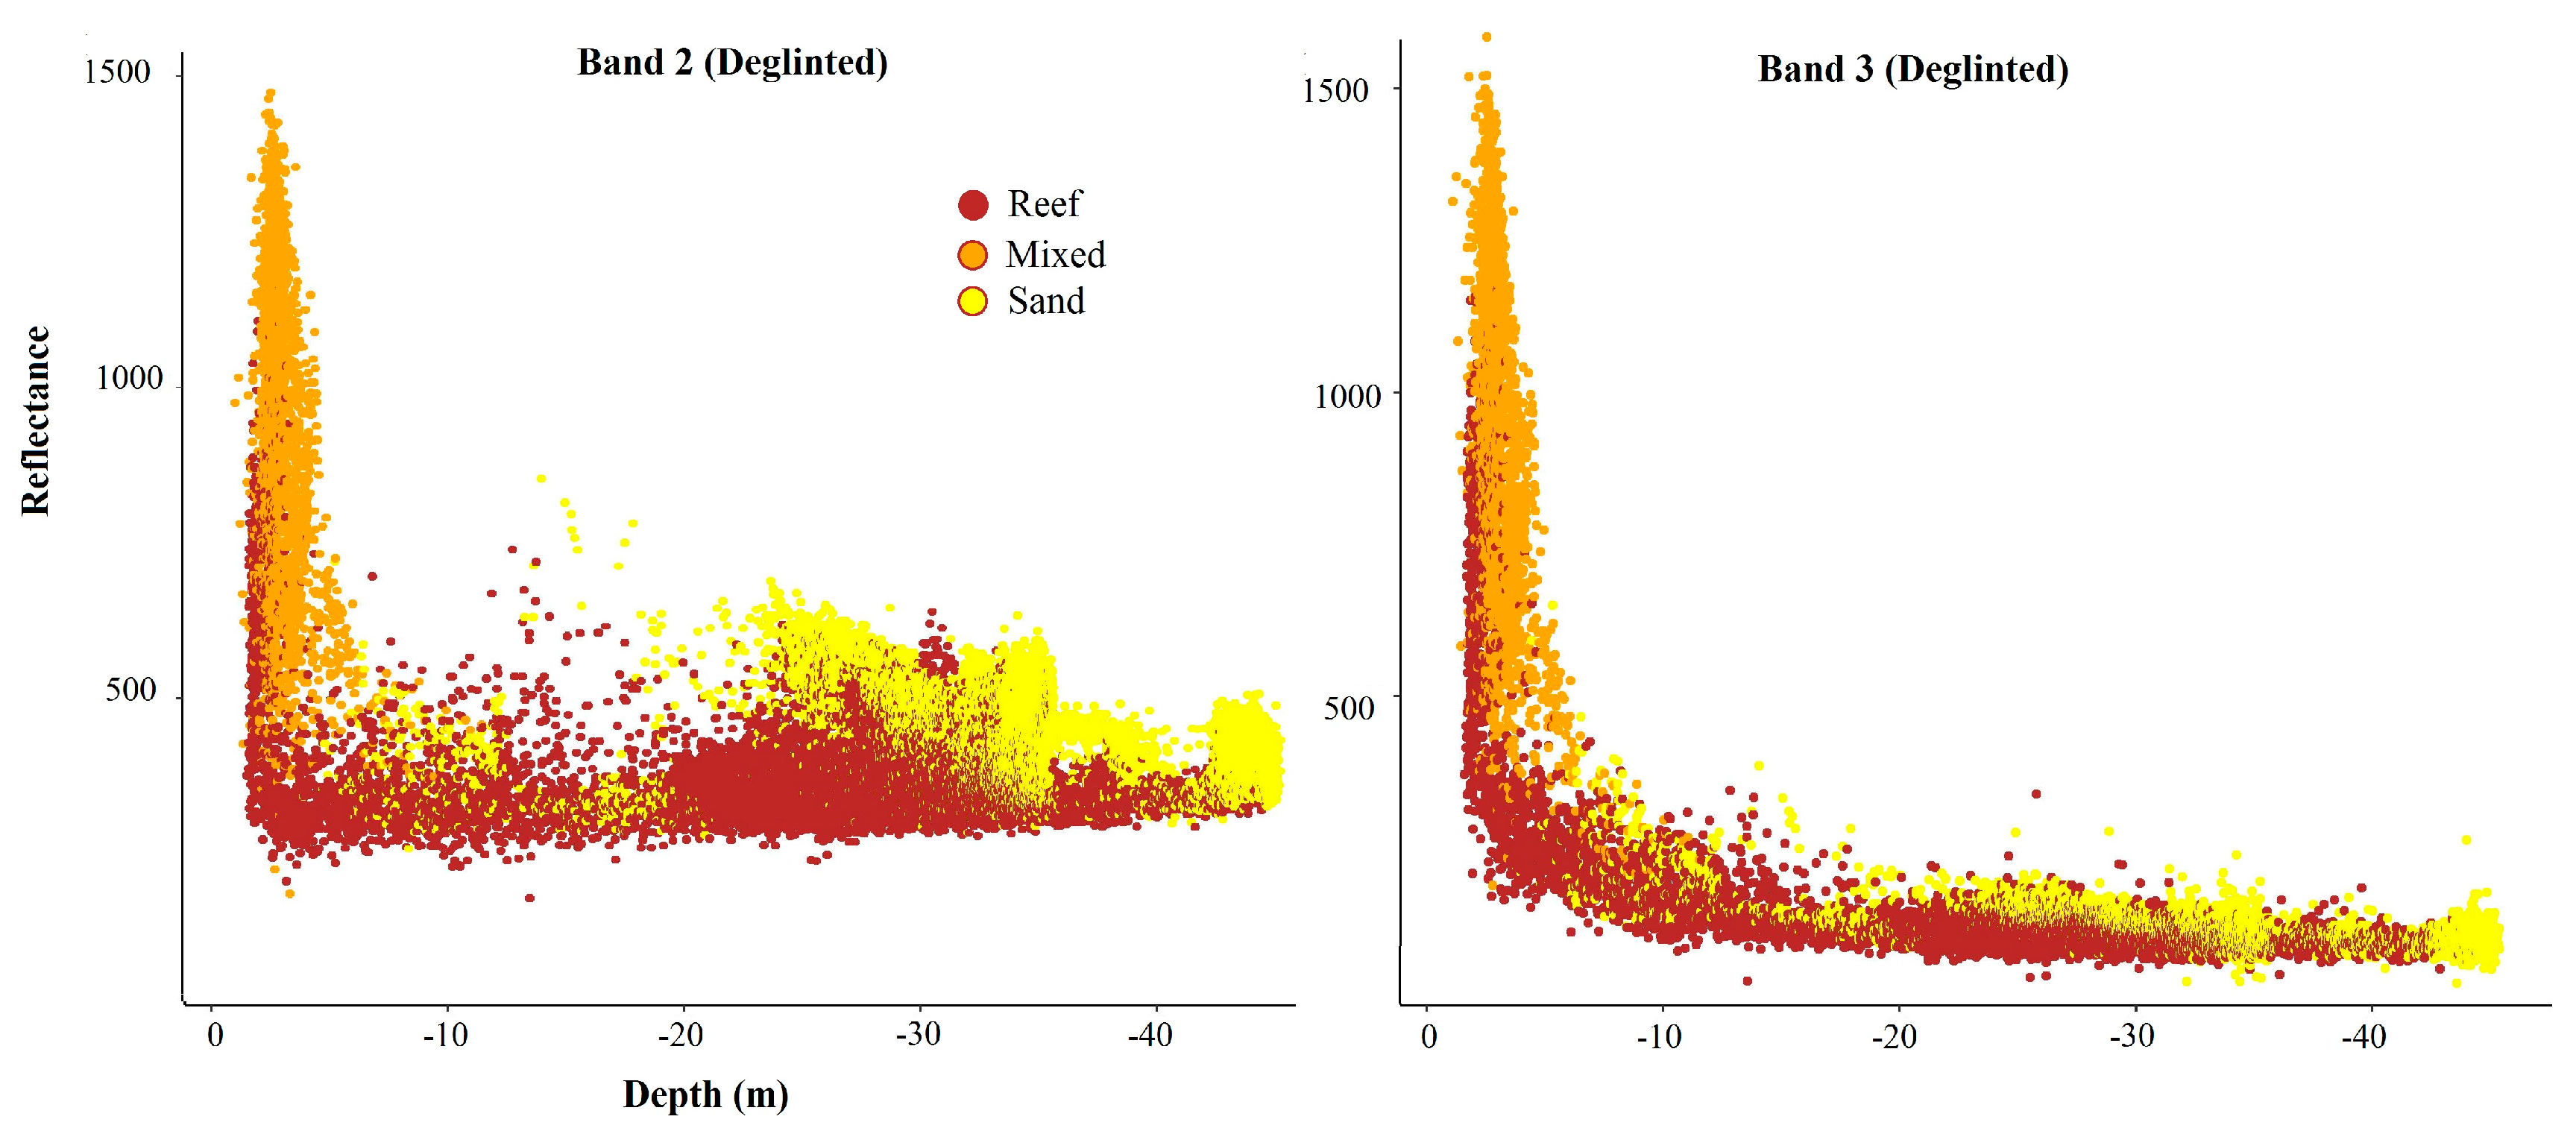
2.2.2. Estimating Bathymetry from Satellite Image Bands

Band ratio approaches are a type of empirical method which uses the relative attenuation of light between two bands to infer depth [13]. This approach has been shown to be effective in deriving depth using relatively few parameters. Known depth data is required for this approach (such as single beam data, MBES or marine LiDAR) to calibrate the ratio and validate the surface. This approach was selected due to the simplicity of the method and the availability of known depth data for the region (single beam and MBES).
Depth was estimated in the satellite image using the methodology described in [13] (Equation (9)). This approach functions independently of bottom type by using a ratio transform to measure the relative attenuation of light through the water column for individual bands. Ratios were calculated for different combinations of bands, and these ratios were plotted against known depth to assess the most suitable bands for depth estimation. The ratio of the blue (band 2) and green (band 3) bands were shown to have the best correlation and were used for subsequent analysis. Deglinted reflectance values for each substrate type for band 2 and 3 are provided in Appendix A, Figure A1.
Depth was estimated by correlating reference depth points against the ratio of reflectance for the blue and green bands. Reference depth points for the Lord Howe Island shelf were sourced from the 2013 multibeam (22,445 points) and 2008 single beam (6316 points). Coverage of calculation and validation points is shown in Appendix B, Figure A2. Band ratio values were plotted against known depths to generate a relationship function, which was then applied across the entire band ratio rasters using the raster calculator in ArcGIS to generate a continuous surface of estimated depth. Estimated surfaces were produced for the different filter types, and slope surfaces were generated for comparison.

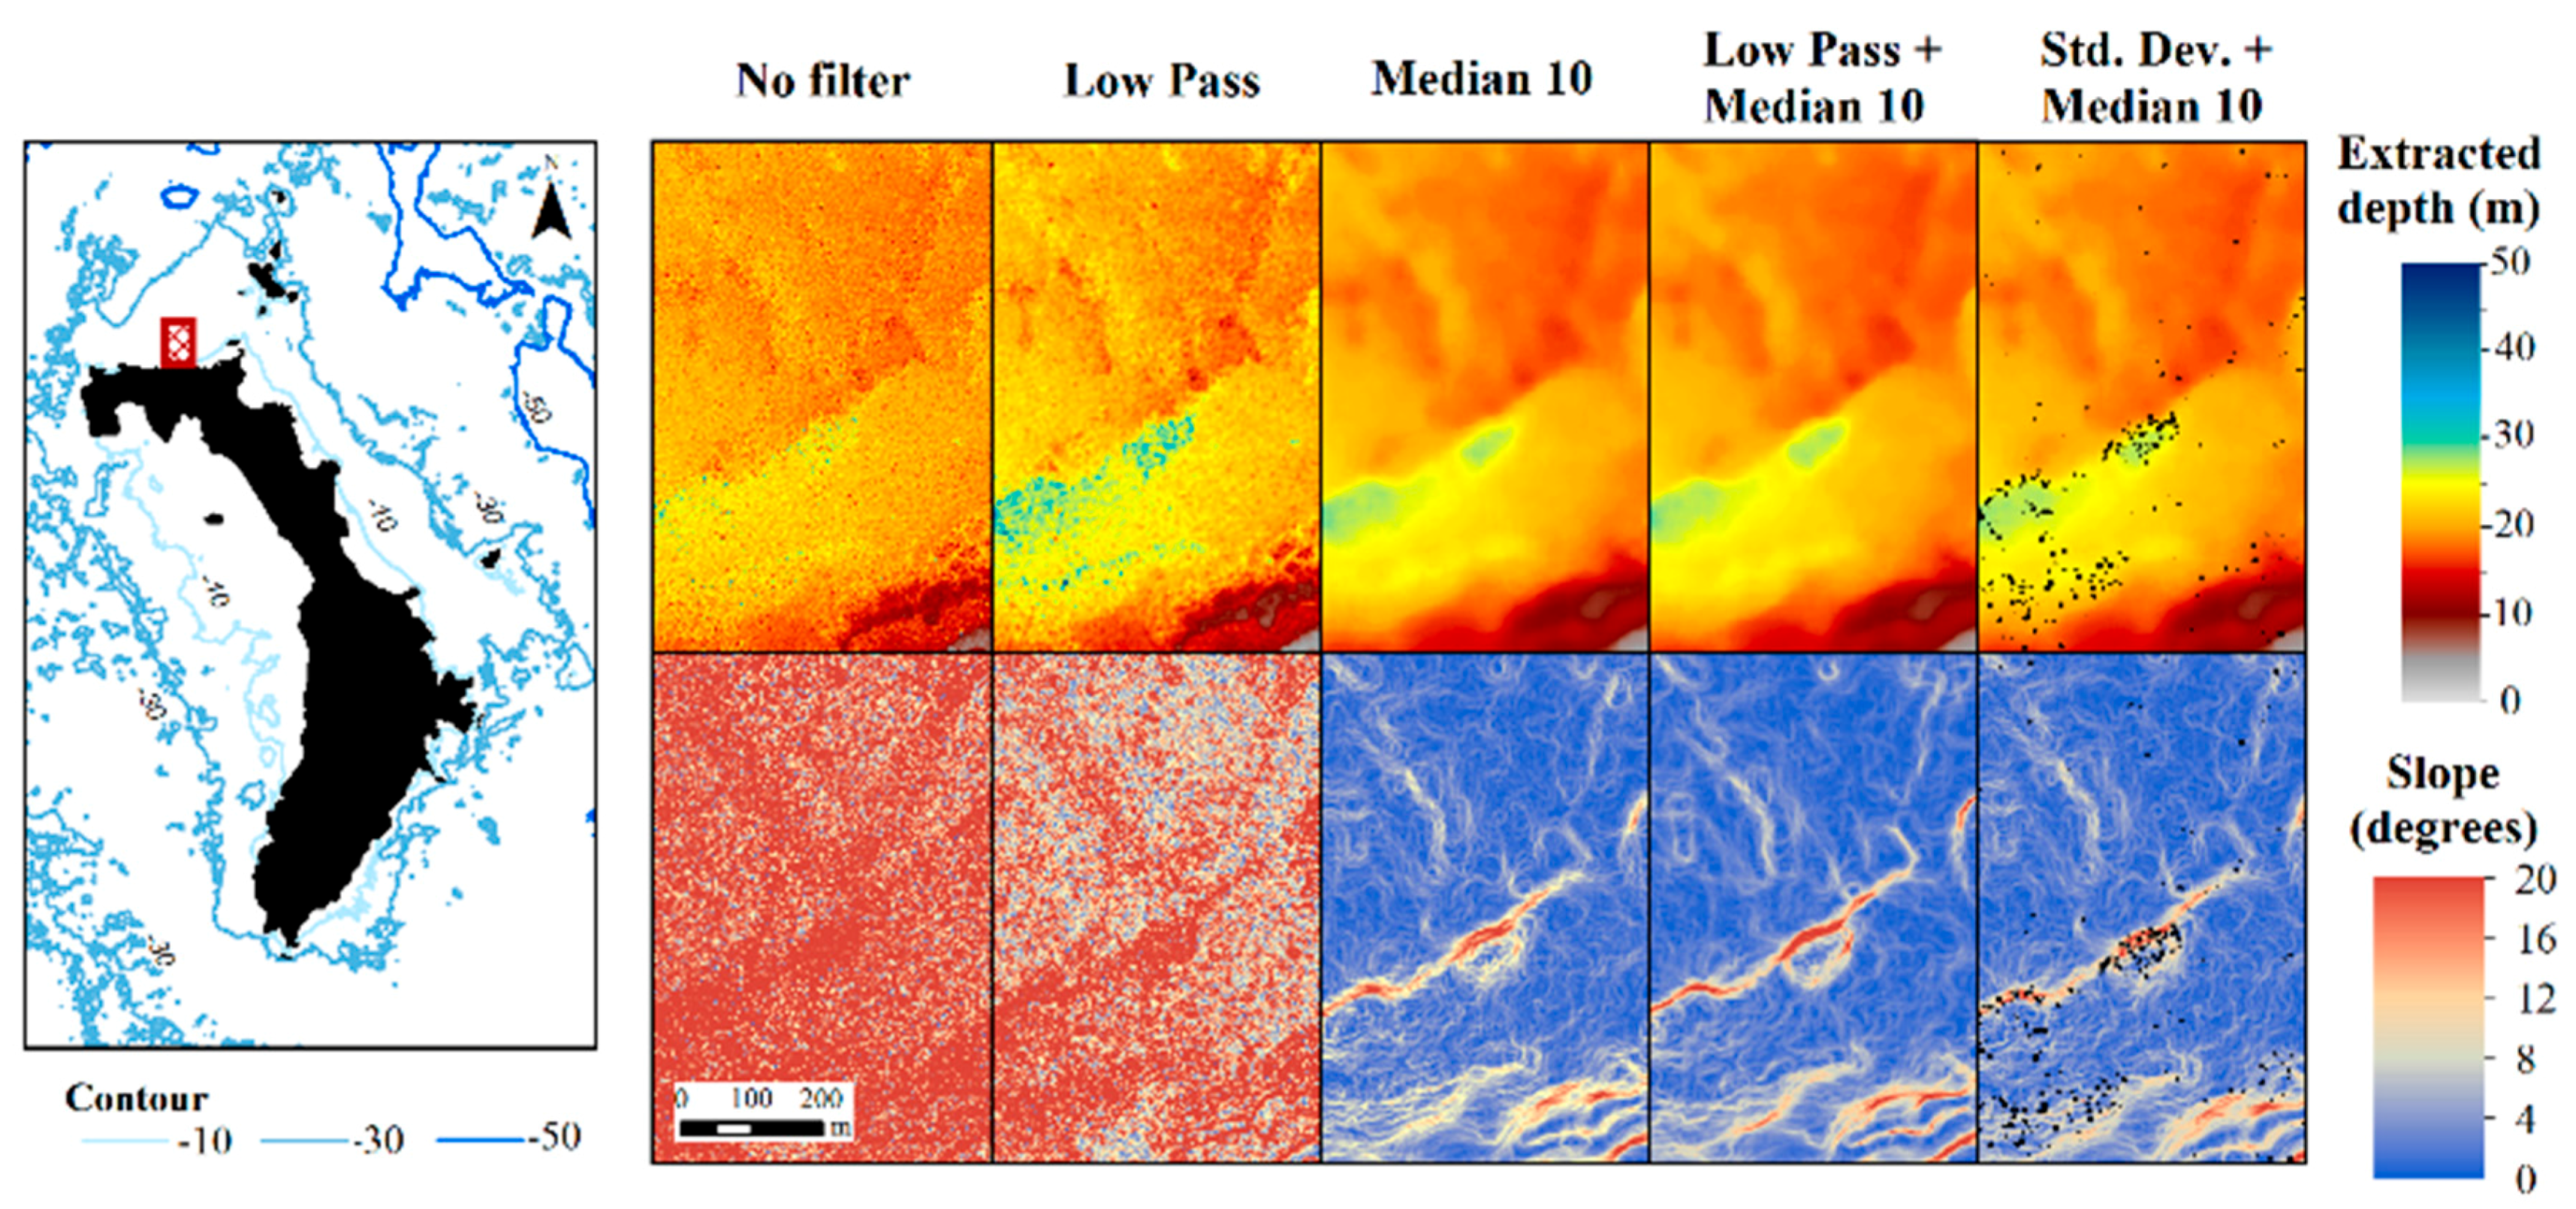
2.2.3. Filter Comparison

Filters were applied using two approaches: the first approach used a single filter; while the second approach used a combination of two or more filters. Filters were generated for the blue/green ratio grid using ArcGIS 10.5 Spatial Analyst Toolbox, and these were compared to the ratio grid with no filters applied.
For the first approach, single filters were applied to the ratio grid including: (1) low pass filter; (2) median filters, with circle radii of three, five and 10 cells; and (3) standard deviation filter, with a three cell circle radius filter. Values exceeding a standard deviation threshold of 0.035 were reclassified and used to create a mask which excluded these outlier values from the ratio grid. The second approach applied a series of filters to the band ratio grid. These filters included: (1) low pass filter followed by a median filter with a 10 cell circle radius; and (2) standard deviation filter followed by median filter with a 10 cell circle radius. The surface created with the combination of standard deviation and median 10 (10 cell radius) filters was determined to be the most suitable filter for the purposes of this study.

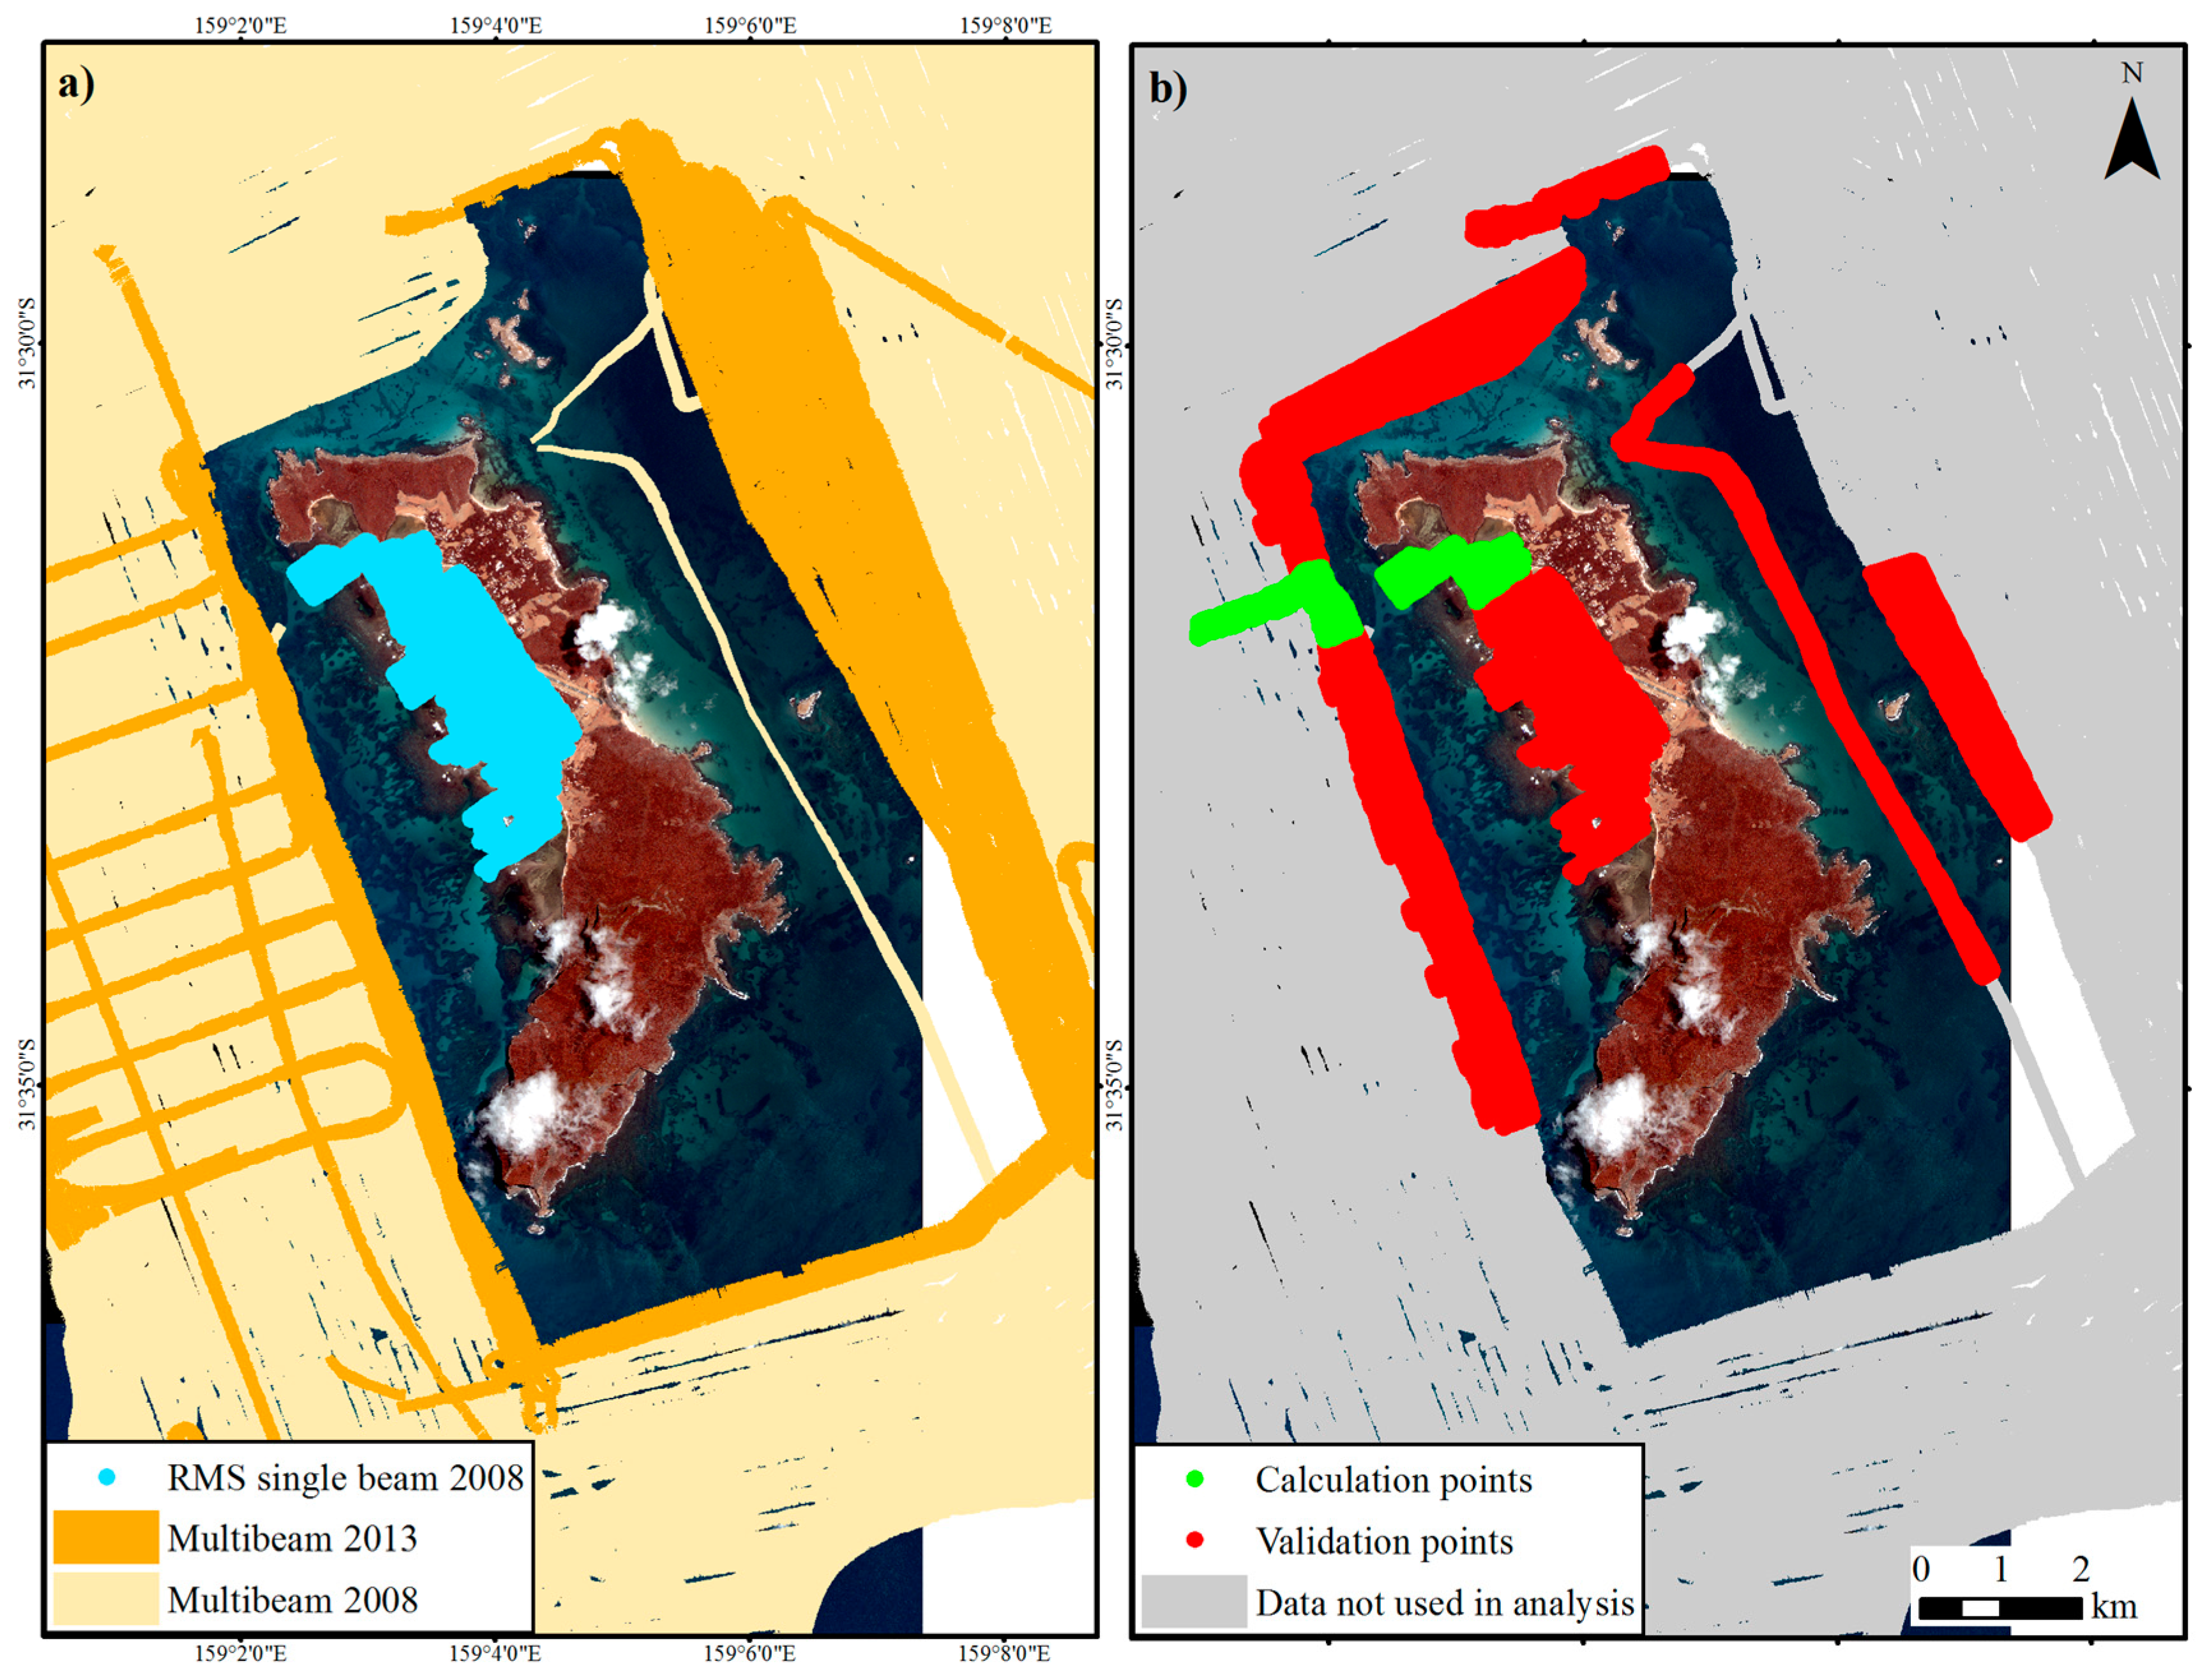
2.2.4. Image Partitioning and Error Assessment

Root mean square error (RMSE) was performed using all remaining data points in the inner shelf region, excluding the depth points used to derive depth, to avoid bias of error calculation (Appendix B, Figure A2). Depth points overlapping the calculated surface were extracted from the 2013 (249,988 points) and 2008 (234,627 points) multibeam data and single beam data (3666 points) to calculate error. RMSE were calculated for the different ratio filters and depth intervals.
Qualitative and quantitative evaluation of the derived depth surface revealed that the surface to the west of the island was more accurate than the eastern side in waters greater than 25 m depth. Water surface disturbance is apparent on the eastern side of the image, which may be due to its exposure to prevailing conditions. Variation between image tiles is also apparent, and these factors may account for the differences in regression fit.
It was therefore considered to partition the image into eastern and western segments and apply separate regressions to each side of the image. RMSE errors were calculated for the partitioned segments and the results were compared.

2.3. Depth Estimation for the Balls Pyramid Shelf

Bathymetry estimates for the Balls Pyramid shelf were previously conducted by [30]. These estimates were recalculated by this study using the optimal approach determined by the aforementioned process of depth estimation for the Lord Howe Island shelf. This included the application of standard deviation and median (10 circle radius) filters which were applied to a 2010 Quickbird (QB, four spectral bands, 2.4 m cell size) image for the Balls Pyramid shelf. Image partitioning was not required for the Balls Pyramid shelf as there were no distinct variations across the surface. Reference depth points (57,269 points) and validation points (220,629) were sourced from the 2013 multibeam dataset.

2.4. Integrated Bathymetry Model

Bathymetry estimates from the WV2 and QB satellite images were converted to Australian height datum (AHD) using an offset of 1.10 m [42] for integration with the 2008 and 2013 MBES data, which were gridded to AHD. Estimated depth surfaces for the WV2 and QB images were clipped at 35 m due to deviation in the spread of unfiltered data and ideal depth for seamless integration with MBES data. The application of image partitioning for the WV2 image improved surface accuracy in deeper waters, which improved the integration with the MBES data. Error assessments were additionally performed on the 2008 and 2013 MBES survey data, with RMSE values calculated on areas of overlap.
Bathymetry estimates were integrated with MBES data from R.V. Southern Surveyor voyages (Marine National Facility, Canberra, Australia) in 2008 (4 m cell size) and 2013 (5 m cell size), and supplemented with data around the shelf slopes from the Geoscience Australia (8 m cell size) shelf grid [39] for a seamless transition. A summarised workflow of processing for the integrated bathymetry model is shown in Figure 2. Coverages were hierarchically masked based on the relative accuracy of the input data, whereby MBES data was considered the highest ranking layer, followed by the satellite-derived depth. Data were converted to points and interpolated to a 5 m grid using natural neighbour (ArcGIS v10.1, Environmental Systems Research Institute (ESRI), Redlands, CA, USA), which was shown to generate the most appropriate surface from a range of interpolation approaches available [43,44]. A gap of 20 m was applied when combining bathymetry estimates with MBES data to create a smooth transition.
The new shelf model was clipped to 300 m, as this captured the full extent of the shelf area. The shelf model was then mosaicked with coverage for the land and shelf slopes from the Geoscience Australia land-bathymetry grid [39] to create an updated regional seamless DEM of the land, shelf and slopes (8 m cell size). An overlap distance of 10 m was applied when combing bathymetry estimates with MBES data. Slope and ruggedness terrain derivatives were calculated for the shelf and regional DEMs using ArcGIS Spatial Analyst toolbox and Benthic Terrain Modeler [45], respectively.

2.5. Geomorphomic Feature Interpretation

Broad seafloor features were visually interpreted through digitisation in ArcGIS v10.1 using terminology consistent with international nomenclature [46,47] and national standards [48]. Shelves were classified into shelf region (inner, mid, outer) and geomorphic features, with definitions primarily sourced from [48] with feature definitions and sources presented in Table 1. The classification of geomorphic features extends upon the interpretation of Balls Pyramid shelf undertaken by [31]. These interpretations were further informed by previous characterisations of the Lord Howe Island shelf produced by [29,35,36,37].
The inner shelf represents the zone within approximately 1 km of the shoreline to around 30–35 m depth. Inner shelf features around Lord Howe Island were defined at a 1:6000 map scale using WV2 imagery, supplemented with ADS40 (2012) (Land and Property Information, New South Wales, Australia) aerial imagery where cloud artefacts obscured the view. The spatial extent of the modern fringing reef was informed by the existing literature [23,28,36].
The middle and outer shelf zones have varying distances from the shoreline, and typically represent the seaward 50 and 130 m isobaths, respectively. For the remaining shelf, features were digitised at 1:10,000 using slope transparently (50%) displayed over the bathymetry model. The large, mid-shelf fossil reef features were sub-divided into the upper (below 35 m depth), lower (beyond 35 m depth), and intra-reef depression (localised lows within reef structure) features.
The zonal statistics tool in ArcGIS was used to extract summary statistics of depth and slope for each feature, and the zonal histogram tool was used to create hypsometric curves. These allowed for the spatial extent, depth and slope characteristics of specific shelf features to be compared and contrasted. Linear features are included into the zonal histogram analysis, with area representing the cumulative area of individual cells directly beneath the lines. This allows for depth distribution patterns to be described for linear features as well as polygon features.

3. Results

3.1. Depth Estimation for the Lord Howe Island Shelf

The estimated depth surface for the Lord Howe Island shelf was enhanced through the selection of suitable bands, the application of filters and image partitioning (Table 2, Figure 3 and Figure 4). Comparisons of input bands showed that the ratio of blue and green bands had the strongest relationship to known depth. The optimal correlation was achieved for the standard deviation and median 10 (10 cell radius) filter using a third order polynomial function (R2 = 0.935).
This was further improved with image partitioning, which reduced the overall error of the surface to RMSE 2.36 in 0–35 m water depth. Applying separate regressions to the east and west portions of the image reduced the error of the eastern surface in 25–40 m water depth, although it slightly increased the error in the 0–20 depth interval. Multibeam data points were not available in water depths less than 20 m for the western side, which may have affected the accuracy in this depth interval. The overall error of the surface in the 0–35 m depth interval was reduced from an RMSE error of 3.15 prior to partitioning, to an RMSE error of 2.39 with partitioning applied (Table 2). As with the ROI selection, the reference points for depth calculation were extracted from one continuous section of the image.
In addition to RMSE calculations, residual values for each point in the subsample dataset were plotted to visually assess the areas of greater error. Errors appeared to be greatest in bathymetric depressions, where the calculation appeared to overestimate the gradient of depth. An additional source of error arises from the time difference between the acquisition of imagery and reference depth data. Coordination of data acquisition is logistically difficult, and therefore some of the observed error may originate from sediment movement between the imagery and survey dates.
The application of filters improved the correlation through removing the outliers within the surface and reducing the data spread in deeper waters (Figure 3 and Figure 4). The singular application of a low pass filter appears to produce a strong correlation (R2 = 0.894), however the resultant surface is too variable for the derivation of terrain measures, as shown by high slope values across the surface in Figure 3. The application of a median filter with a sufficiently wide radius (10 cell) provided smoothing to a level most suitable for integration with MBES data. Smaller filter radii (three and five cell) showed higher surface variability, and greater filter windows showed data loss through over-smoothing the surface.
The standard deviation filter removes artefacts of image tiling and outlier values, which can be retained with the median or low pass filters alone. If the image is not affected by surface disturbance or tiling edge effects, the median filter on its own may be sufficient for surface smoothing. The addition of the low pass filter did not significantly improve the correlation or RMSE error of the surfaces.
The pristine water clarity of this study region enabled depth estimations down to 35 m, where typically depth is not derived from satellite imagery beyond 20 m water depth [10]. For the purposes of this study, 35 m was selected as the depth limit, as this was where the deviation in the unfiltered data increased and also provided a balance between coverage and accuracy for seamless integration with MBES data. RMSE error between the overlapping coverages of the 2008 and 2013 MBES surveys was calculated to be 1.15 (3,428,021 points).

3.2. Depth Estimation for the Balls Pyramid Shelf

The optimal correlation for the Balls Pyramid Quickbird image was achieved using a linear function (R2 = 0.47). The weaker correlation of the depth data for the Balls Pyramid shelf is attributable to the severe sun glint evident in the Quickbird image, which hindered the success of the correlation. Furthermore, reliable known depth points from MBES data around Balls Pyramid existed only for waters deeper than 18 m across the mapped area of the shelf. Within the area of interest around the inner shelf, the shallowest MBES data used for calculations and validations was 21 m depth.
The RMSE values for the Balls Pyramid shelf varied with depth. As no MBES data was available for the area of interest in waters shallower than 21 m, the estimated depth in this shallow-water range is considered the area of highest error. Estimated depths are presumed to be overestimated close to the island where the surface is deeper than would likely occur. RMSE values were lowest for 21–35 m, where RMSE = 1.55 (RMSE: 21–40 = 3.18; 21–35 = 1.55; 21–30 = 4.16; 21–25 = 7.76). These estimations are suitable for geomorphic interpretations although a high degree of caution is needed for other applications. This calculation could be improved with the addition of shallow water data, which would allow for the correlation to be fitted to a more representative spread of data. Data were clipped to 35 m depth for seamless integration with MBES data.

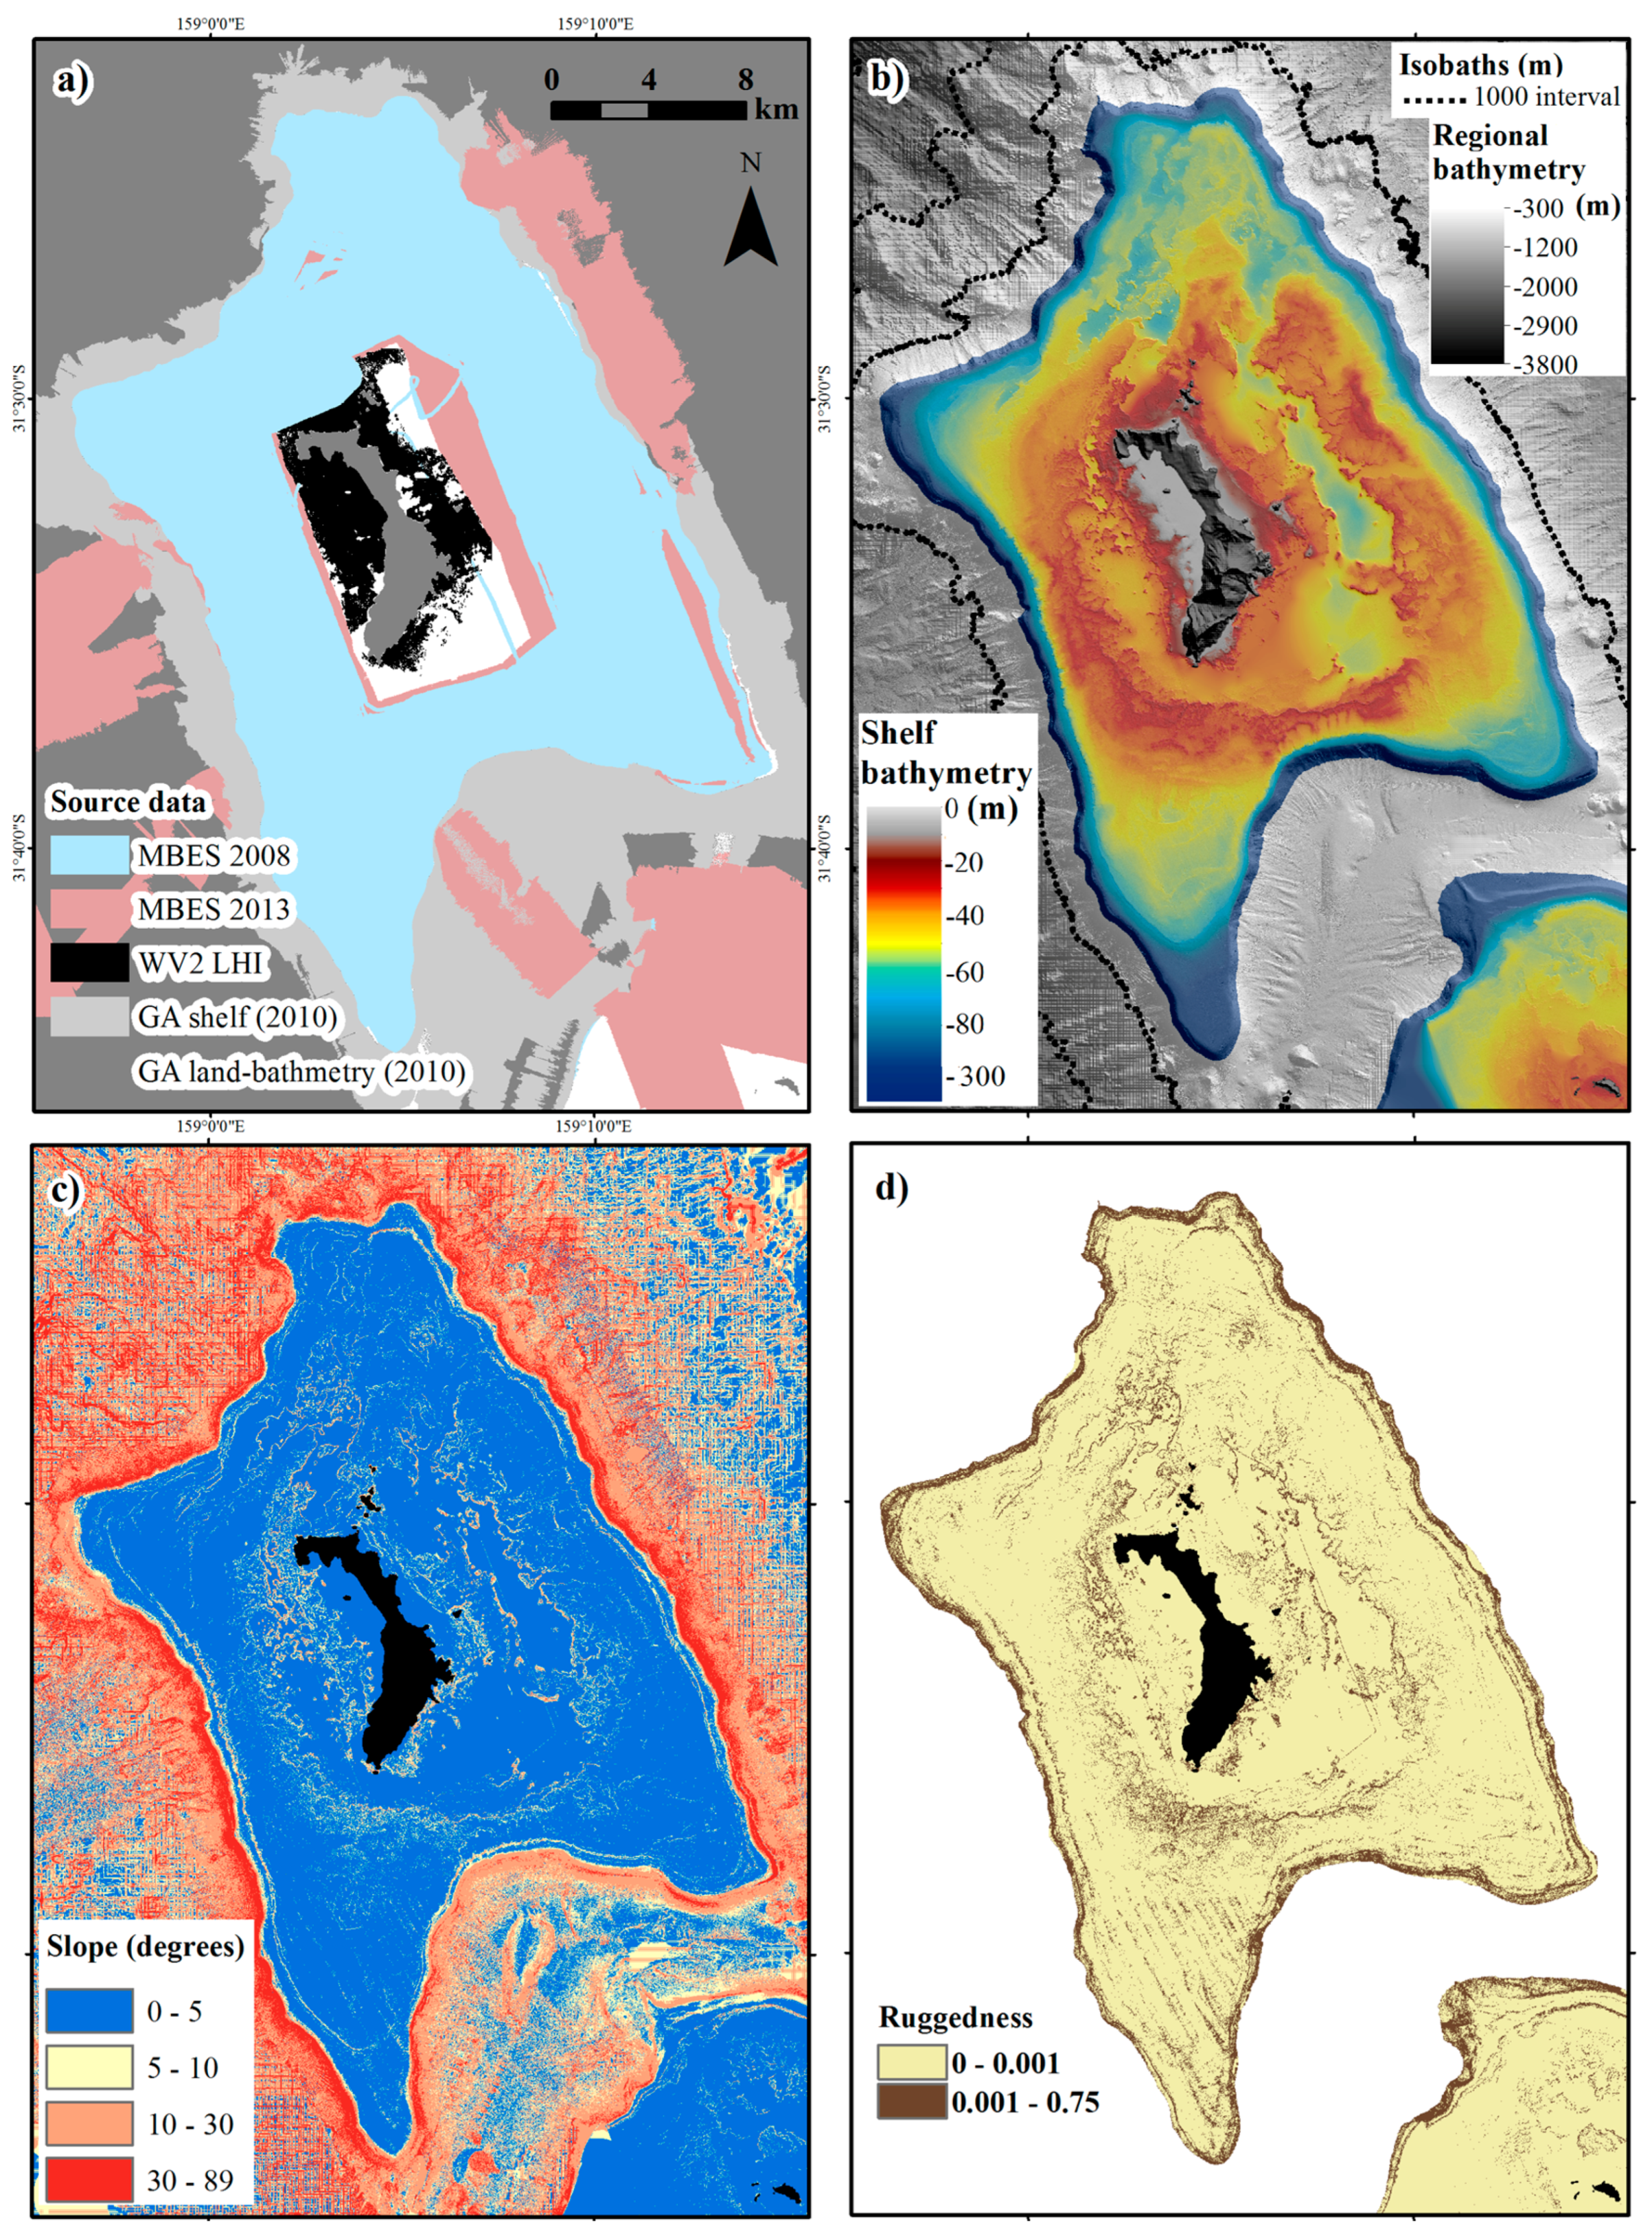
3.3. Integrated Bathymetry Model

A high-resolution bathymetry model was produced for the island shelves (5 m cell size). The new estimated depth surfaces from the satellite imagery contributed 34 km2 of data for the Lord Howe Island shelf and 7.2 km2 for the Balls Pyramid shelf (Figure 5a). The estimated depth from the WV2 satellite image greatly improved the bathymetric resolution of the southeast shelf of Lord Howe Island (Figure 5b). This region of the shelf is difficult to access due to high exposure to swell and winds, and the previous bathymetry data and subsequent geomorphic interpretations were heavily interpolated in this region. The satellite data were ideal for these applications, and the new bathymetry model has substantially enhanced the detail of the features inaccessible to vessel-based platforms.
The regional land and bathymetry model (8 m cell size) was also updated to include the new shelf model. The production of high-resolution bathymetry models enables the exploration of the terrain, including the calculation of metrics such as slope (Figure 5c), ruggedness (Figure 5d) and the identification of shelf features. Detailed descriptions and comparisons of geomorphic features across the seascape are presented below.

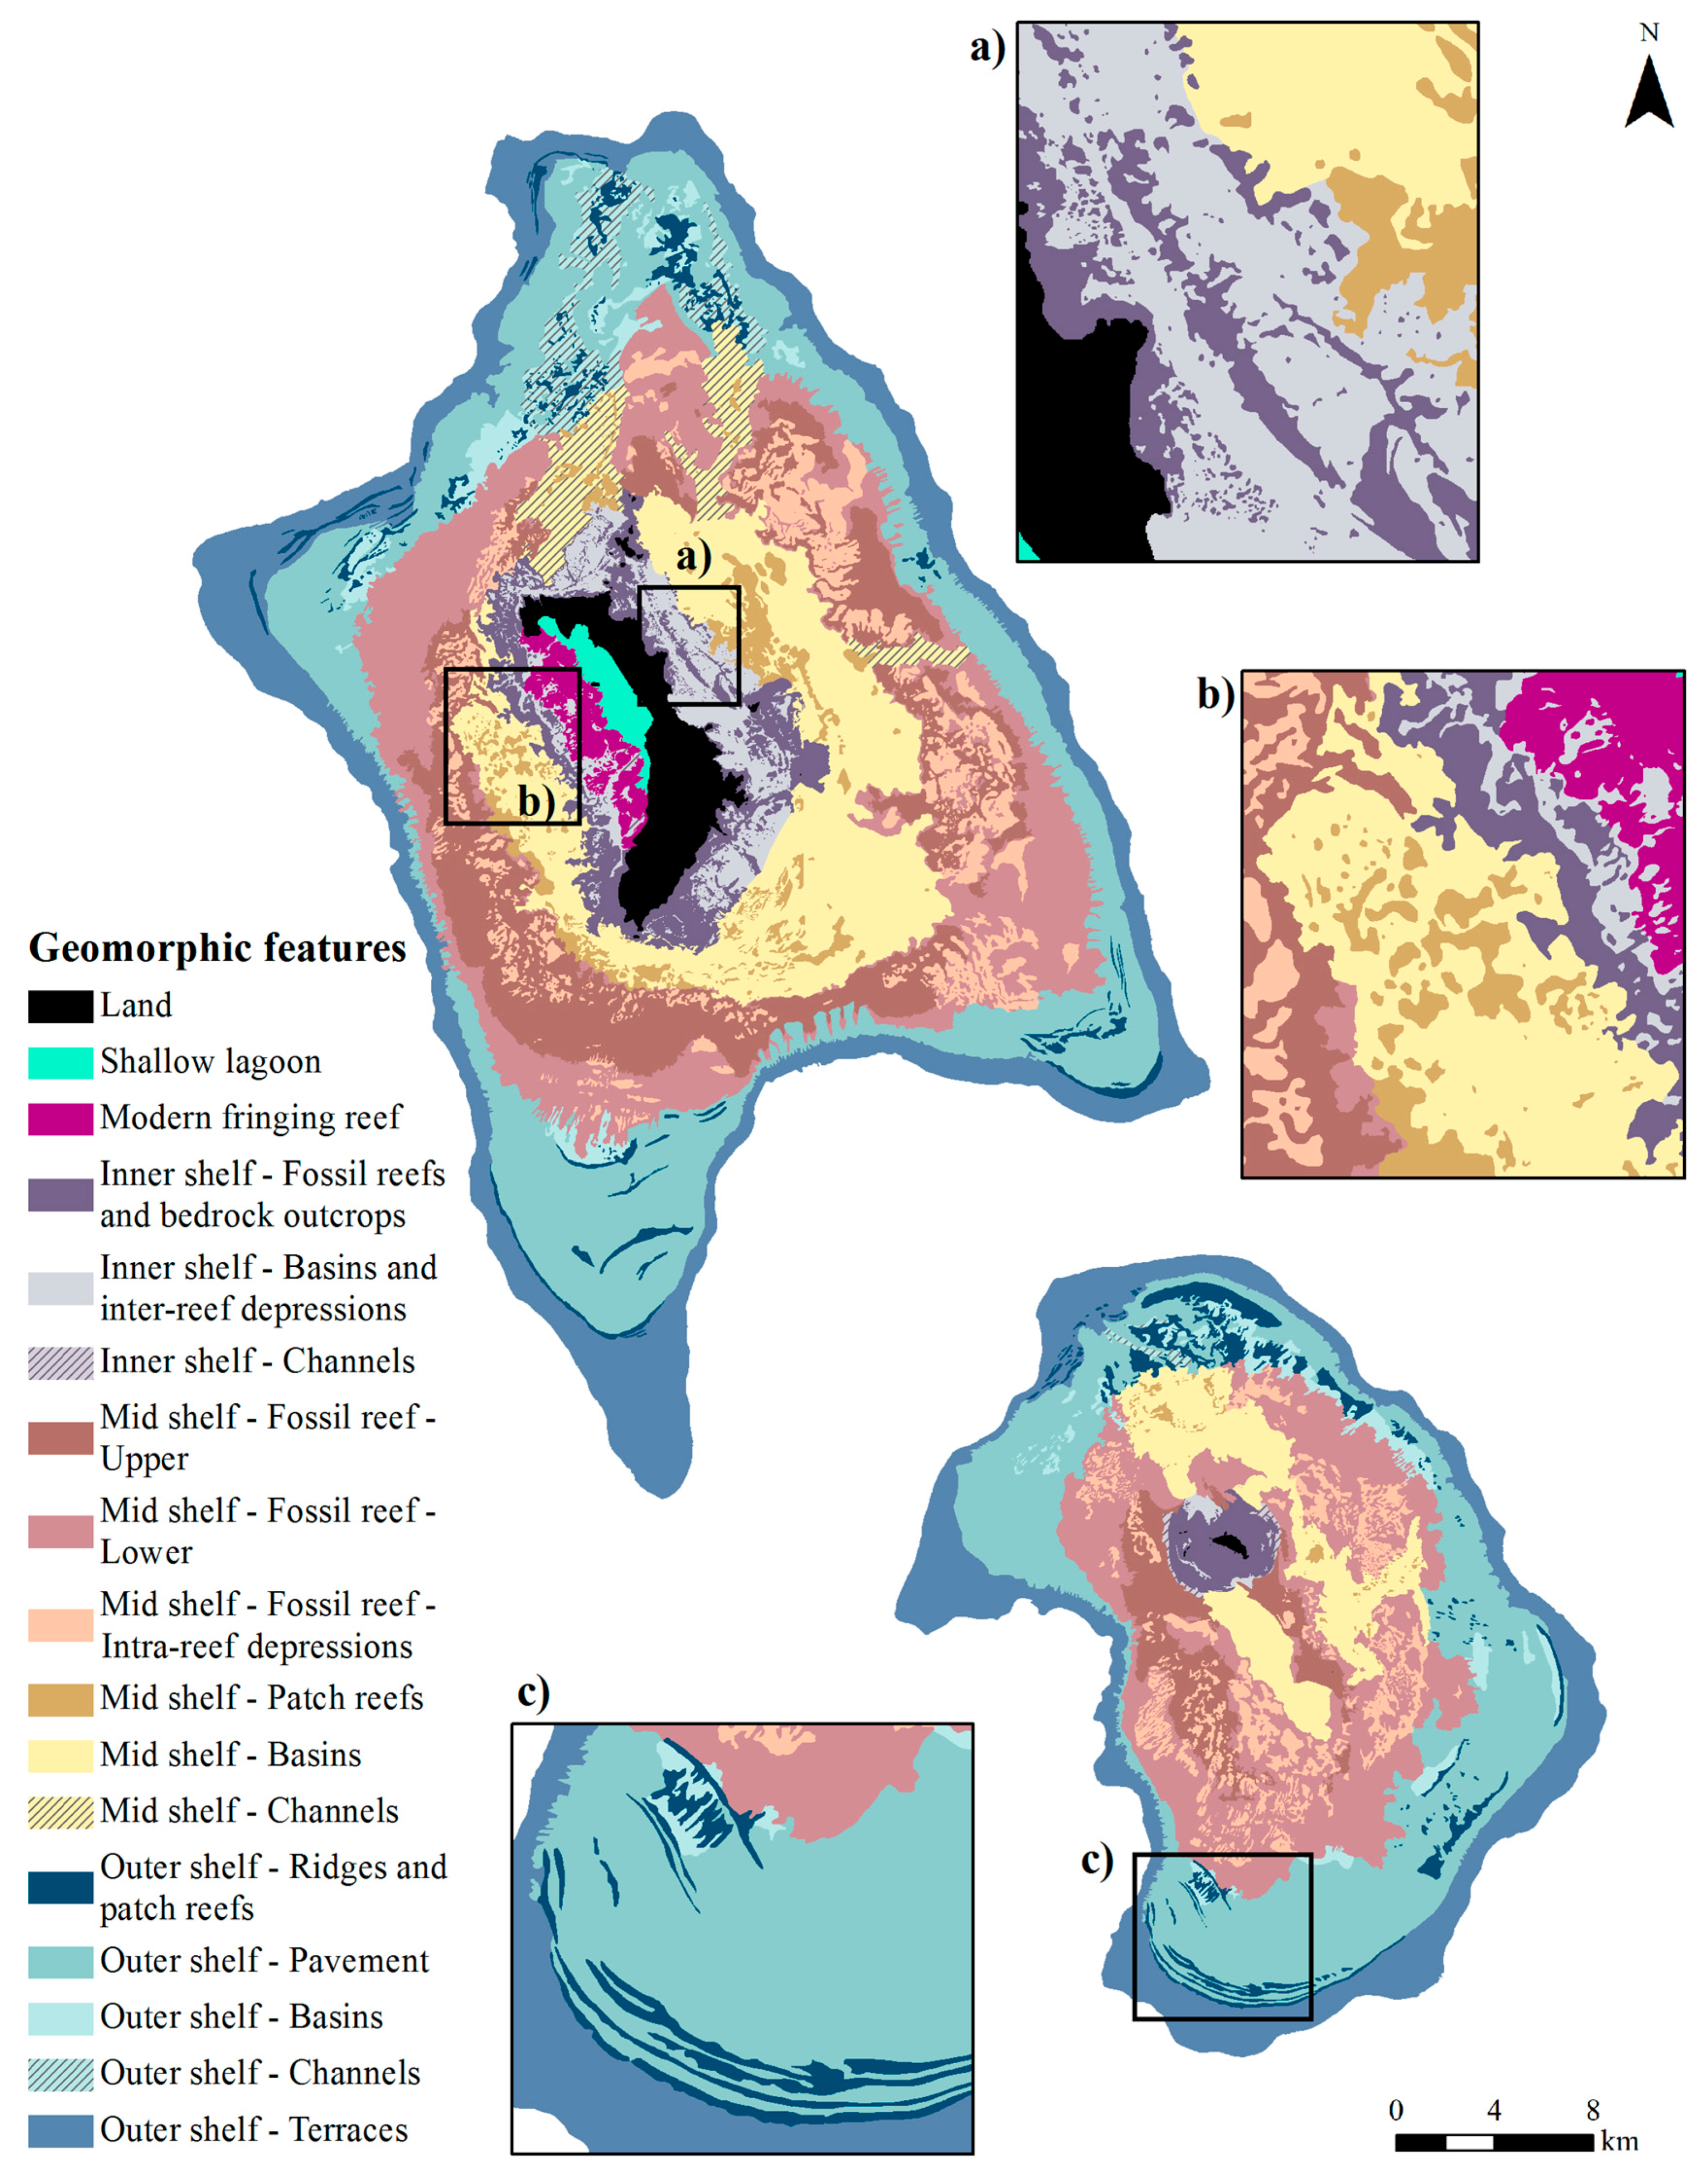
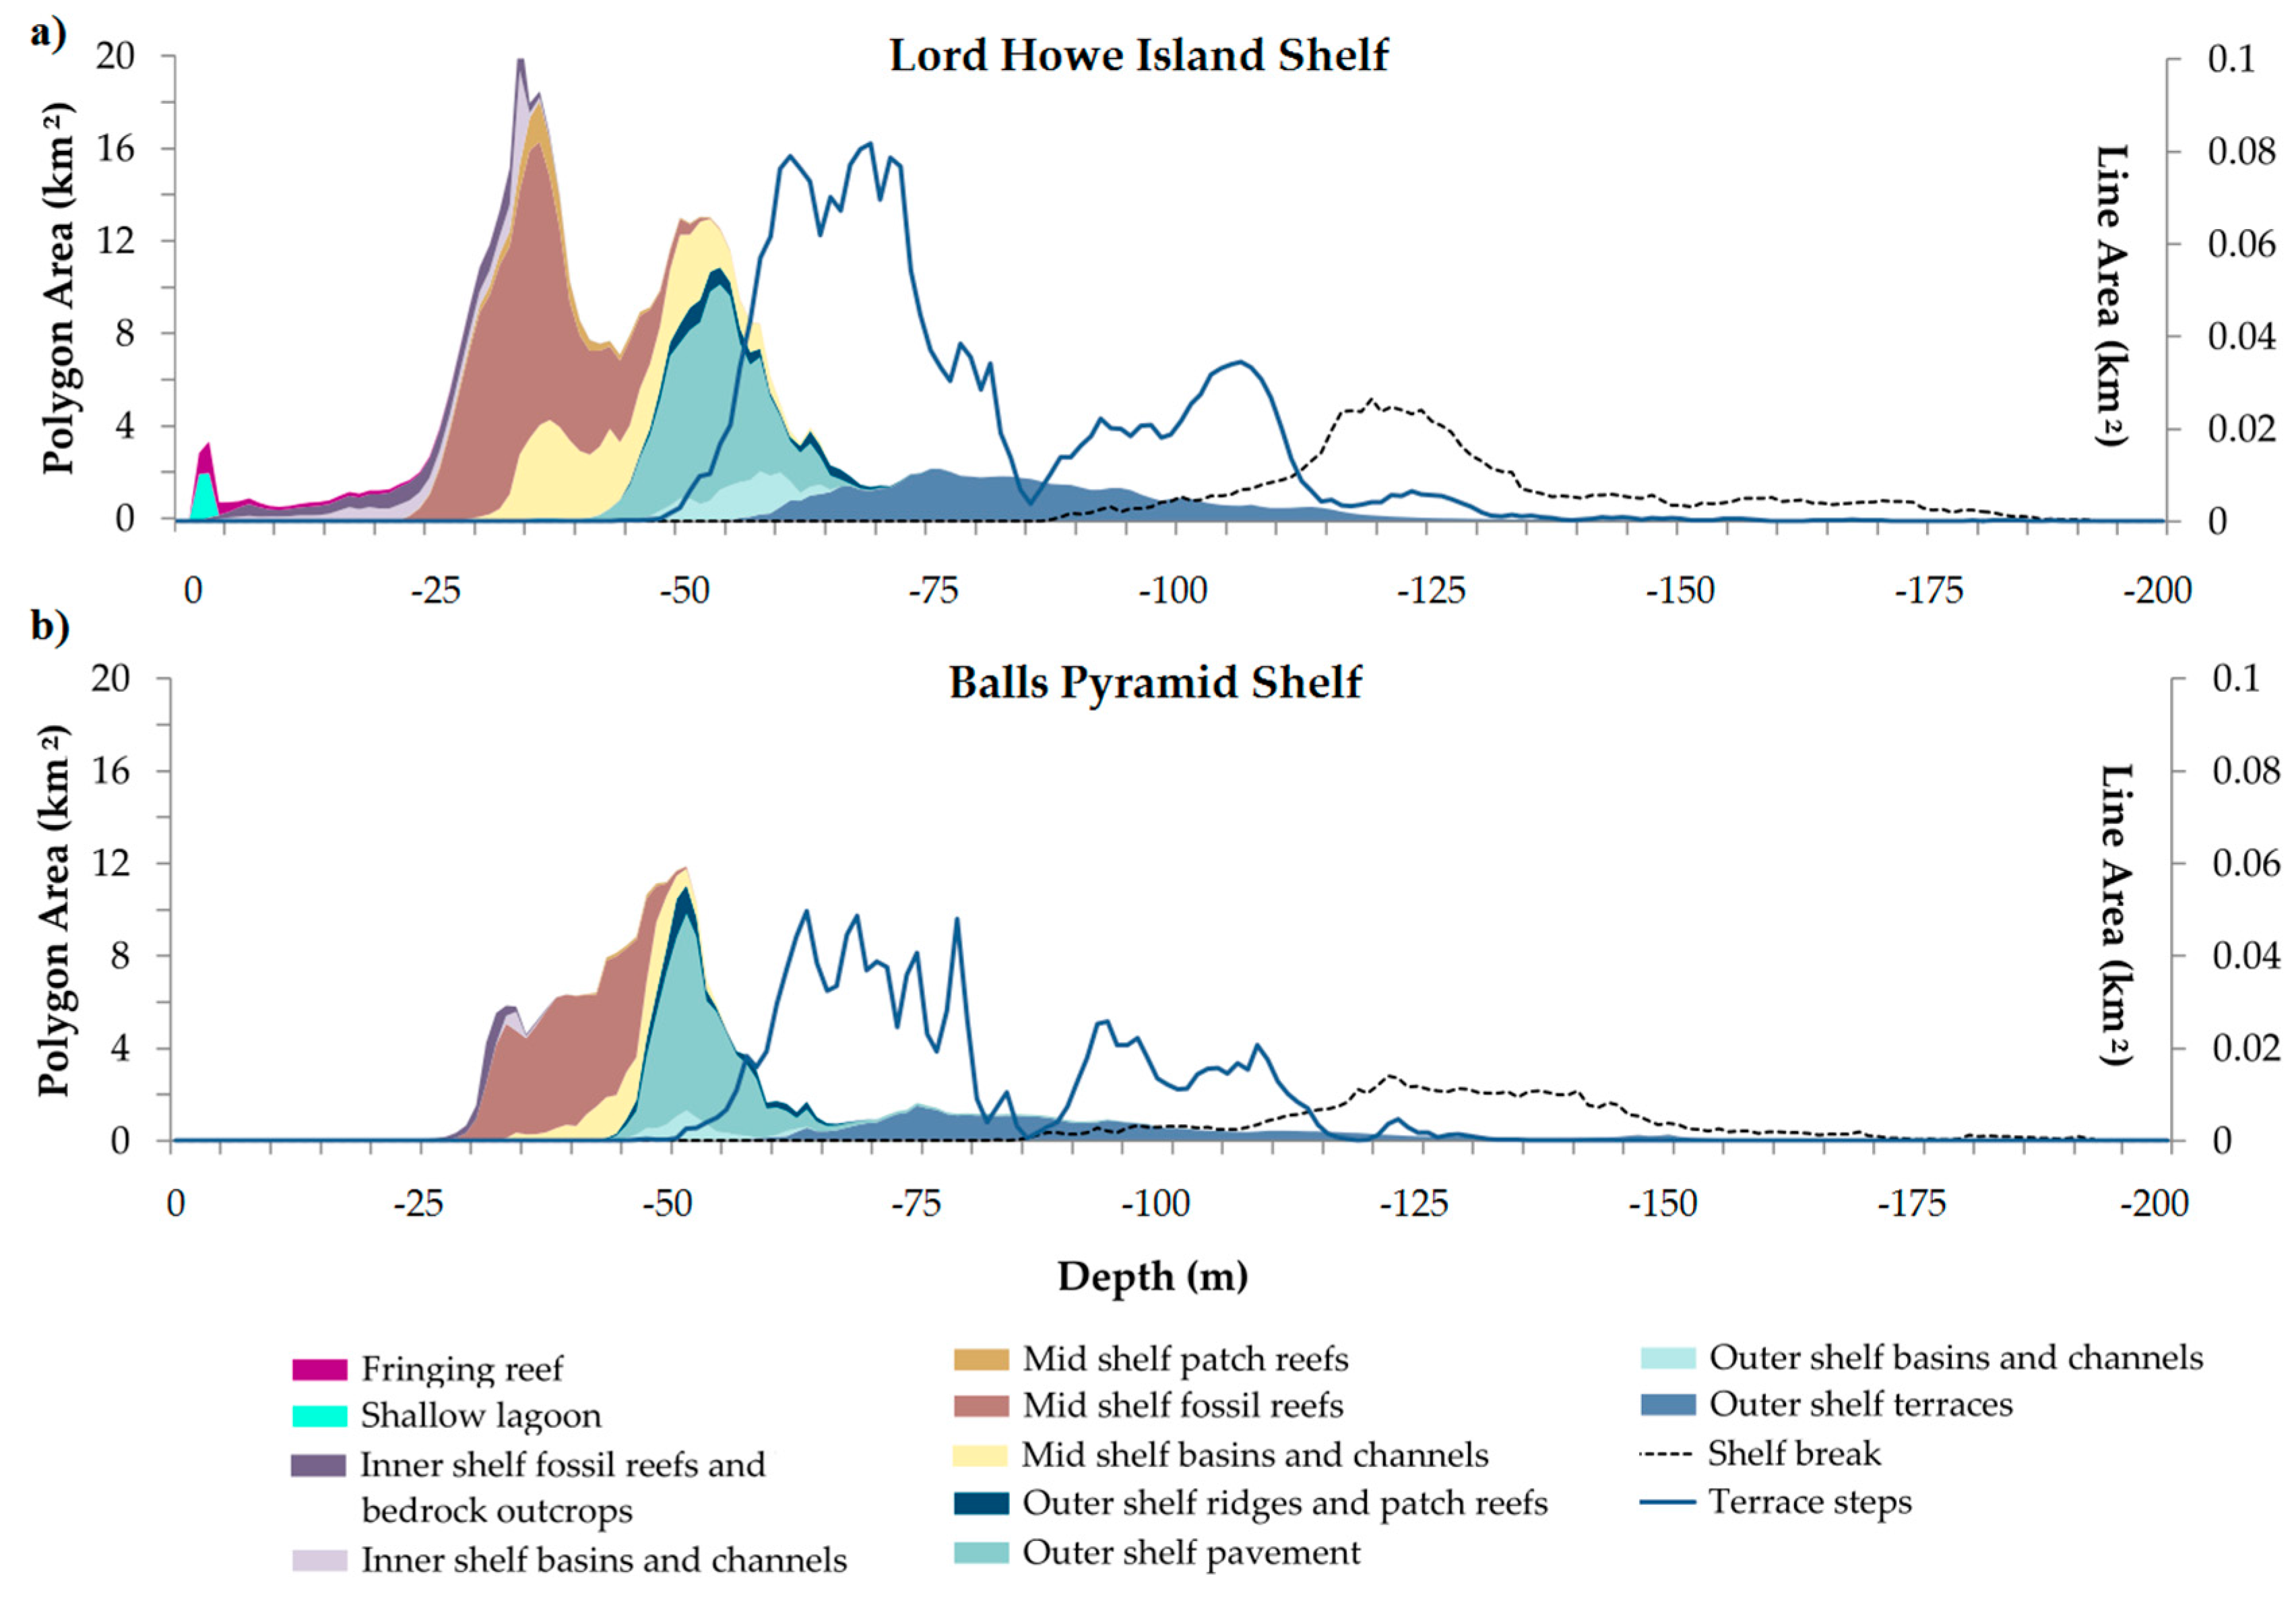
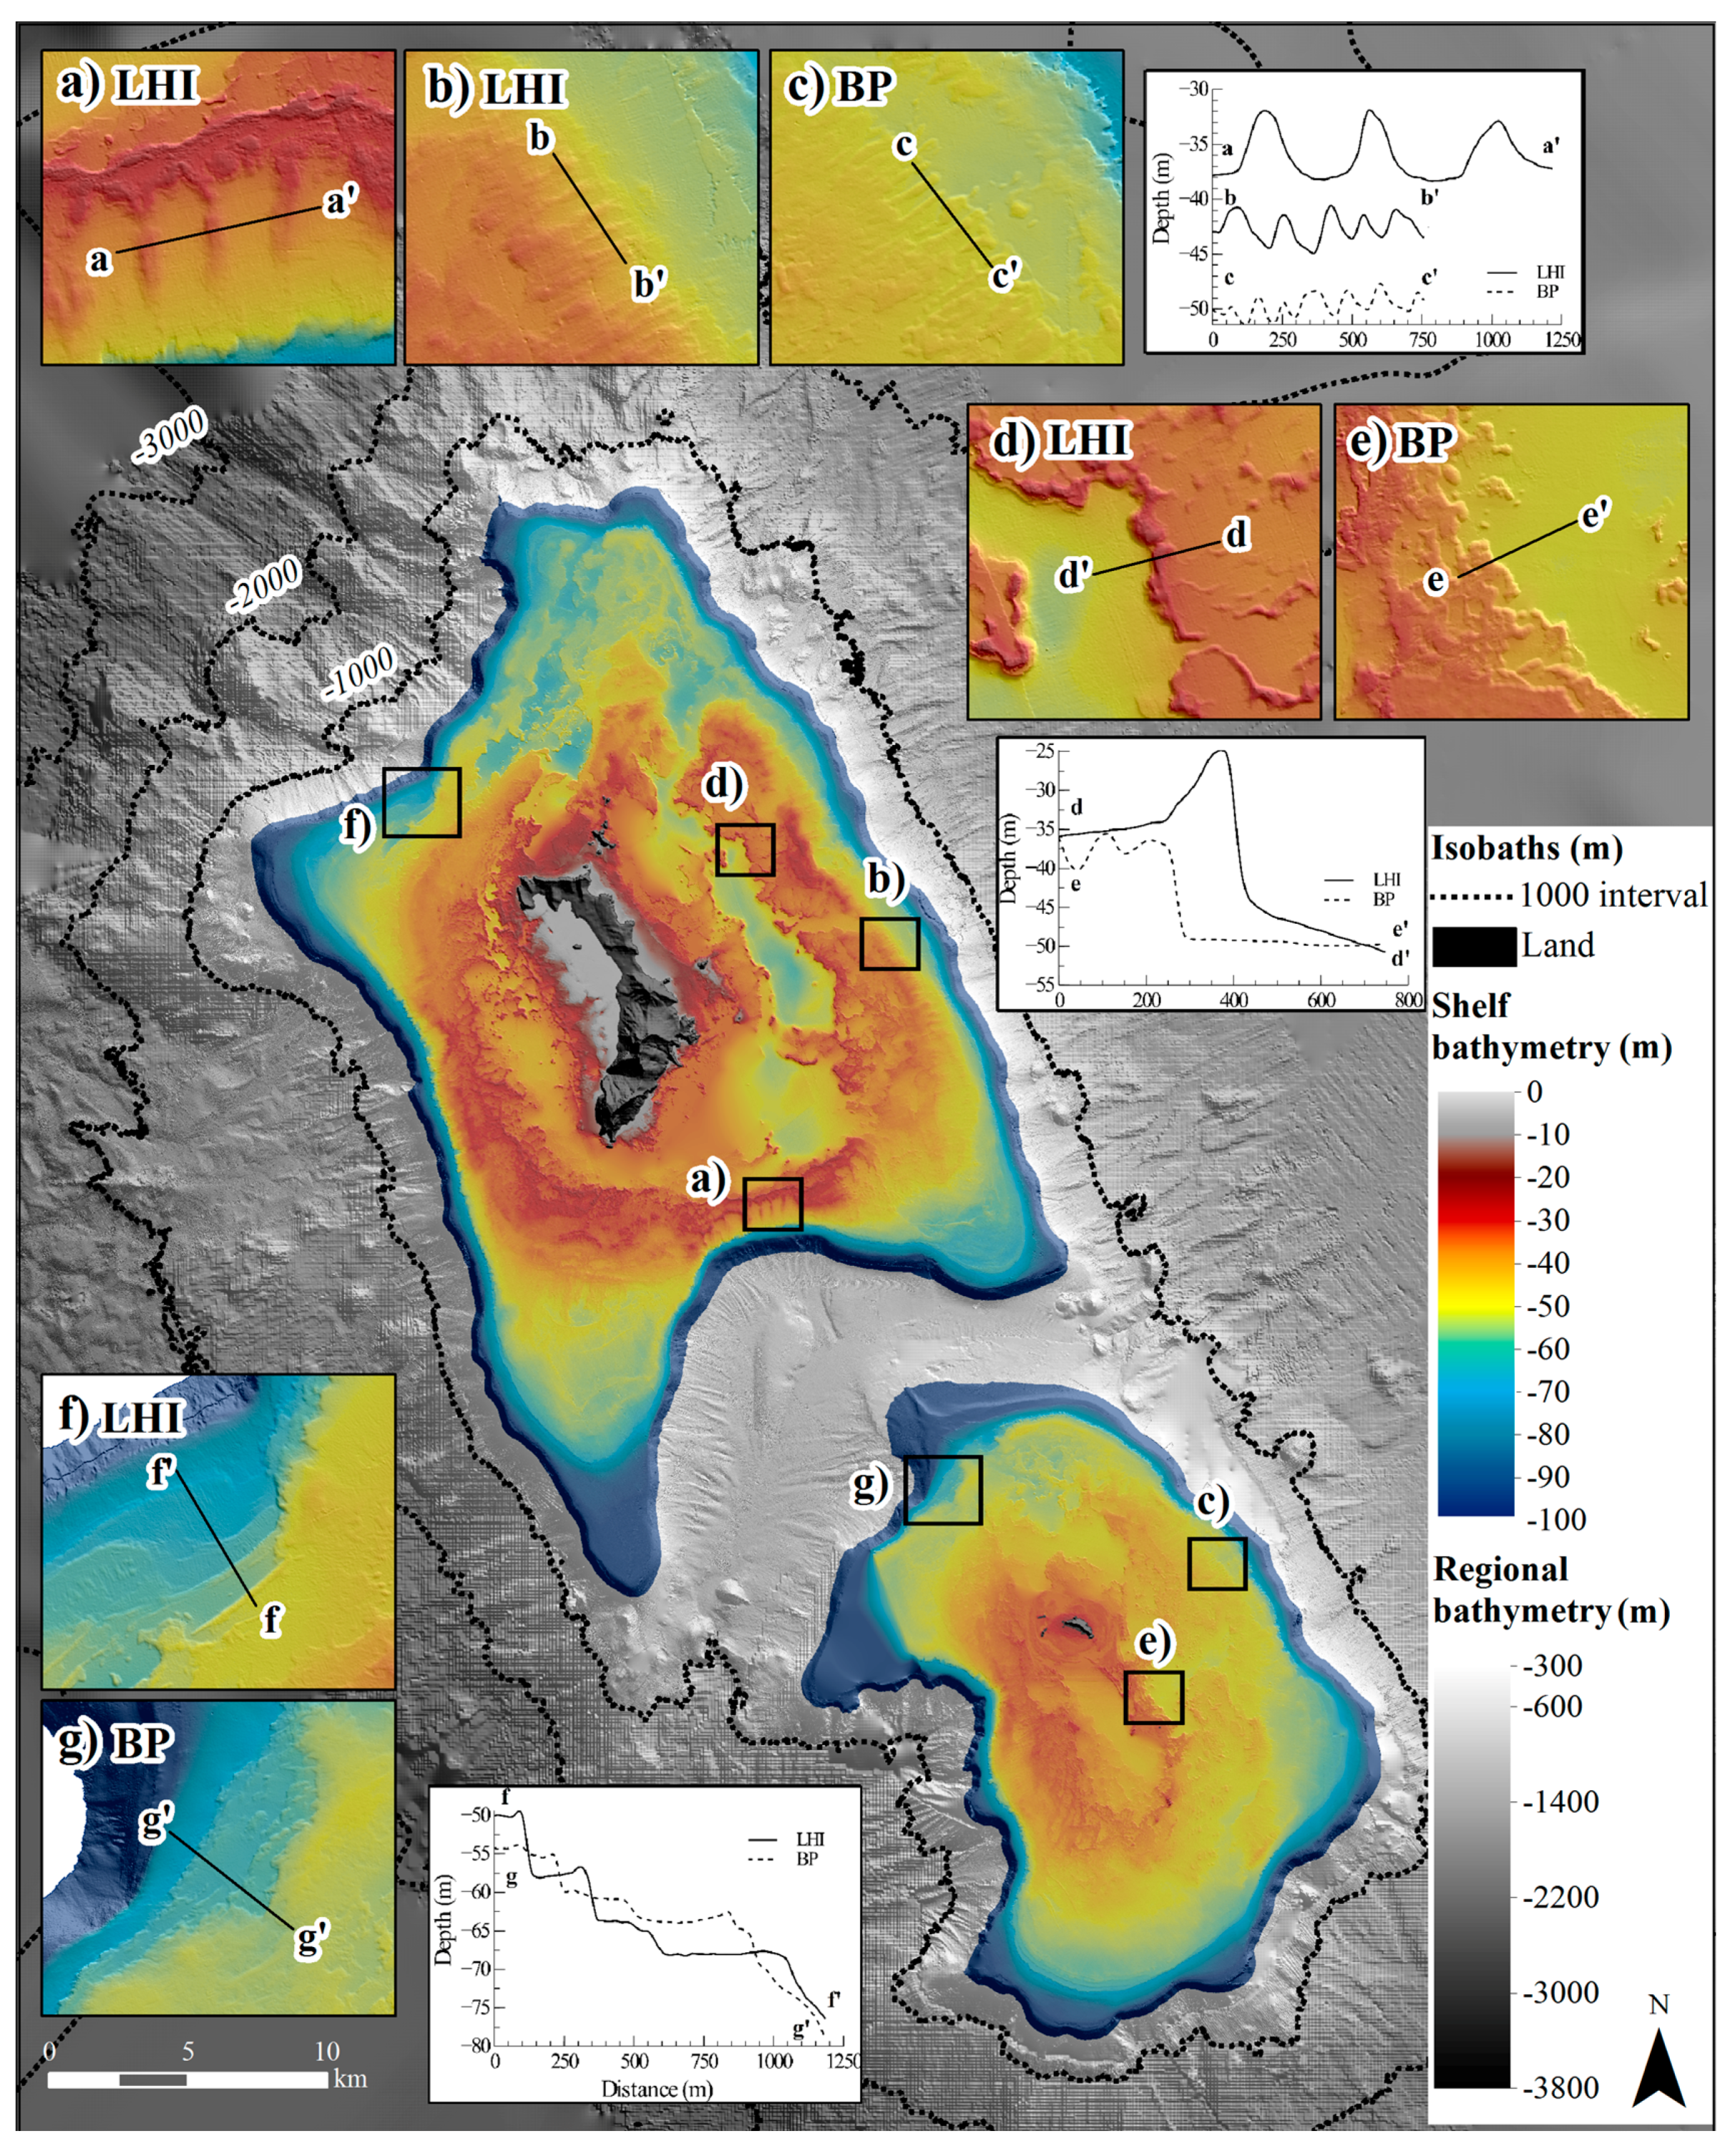
3.4. Geomorphic Interpretation and Shelf Comparison

Diverse accretionary and erosional geomorphic features were mapped on both shelves (Figure 6). The two island shelves possess broad platforms which predominantly occur in 30–60 m water depth (69% and 77% of the shelf area for the Lord Howe Island and Balls Pyramid shelves, respectively) and are dominated by extensive fossil reefs (Figure 7, Table 3). The 504 km2 area of the Lord Howe Island shelf is almost twice the size of the 261 km2 Balls Pyramid shelf. Similar proportions of the shelves occur in deeper waters, with 13–14% of shelf area in 60–90 m for both shelves, and 6–9% >90 m. The greatest difference occurs in the shallow waters, where <1% occurs in <30 m depth around Balls Pyramid, while 12% of the Lord Howe Island shelf comprises shallow reefs and depressions, including the modern fringing reef and shallow lagoon.
The hypsometric curve highlights the similarities in the depth distribution of features, as well as the differences in the cumulative area of the Lord Howe Island features (Table 3). A pronounced modal depth occurs on the Lord Howe Island shelf at 35–40 m from the collective contributions of the mid-shelf reefs and inner shelf features. At 30–35 m, a minor mode from the mid-shelf reefs is seen on the Balls Pyramid shelf, though the distribution spreads more broadly across 30–50 m and there is minimal contribution from inner shelf features. Both shelves exhibit a distinct mode at 50–55 m and reach a similar areal extent from the contributions of outer shelf features, although the additional contribution of the mid-shelf basins around Lord Howe Island exceed those of Balls Pyramid. Terrace-step patterns are similar, with multiple modes occurring from 65–80 m and 95–110 m. The shelf break is more distinct around Lord Howe Island at 125 m depth, whereas it is more variable around Balls Pyramid and occurs at 115–150 m.
The bathymetry estimates for the Balls Pyramid shelf generated deeper values around the inner shelf and therefore it is inferred that a greater proportion of shallower substrate <20 m depth likely occurs on the inner shelf. While the hypsometry of depth in shallow waters around Balls Pyramid must be interpreted with caution, area calculations provide for quantification and comparison of the size of the inner-shelf reefs (Table 3). The areal extent of inner-shelf reefs around Balls Pyramid was shown to be reduced by area in relation to the Lord Howe Island shelf; totalling 5.6 km2 for the Balls Pyramid shelf (2.2% of the shelf) and 22.8 km2 for the Lord Howe Island shelf (4.5% of the shelf).

3.4.1. Inner Shelf

The Lord Howe Island shelf possesses a more extensive inner-shelf reef system, which uniquely includes a modern fringing reef. The inner-shelf reefs around Lord Howe Island are substantially larger in area (22.8 km2) and occur across a wider distribution of depths (average 25 ± 8.9 m) compared to the Balls Pyramid inner-shelf reefs (5.6 km2 area, average depth 32 ± 2.3 m). Complex reef systems occur around the inner shelf of Lord Howe Island, in contrast to the less extensive inner-shelf reef features which encircle the Balls Pyramid sea stack. The previously unmapped inner-shelf around the east and south of Lord Howe Island reveal contiguous reefs extending from the island and patch reefs interspersed within the basin.
To the east of Lord Howe Island, a shore-parallel discontinuous linear reef ridge, 5 km in length, up to 420 m in width and 4 m in vertical relief, extends south from the Admiralty Islands to Muttonbird Island in 14–30 m depth (Figure 6a). Extensive patch reefs extend east of the shore-parallel fringing reef, surrounding Muttonbird Island and encroaching into the eastern mid-shelf basin. Southeast of Muttonbird Island, Wolf Rock rises to the surface at a slope of 10–15° (up to 26°) from a base around 35 m depth. On the northern shelf, smaller linear reef structures up to 2.4 km long, 140 m wide and up to 5 m in relief, occur in a sub-parallel formation in 18–25 m depth. Along the southern coast, a large, contiguous reef adjoins the coastline in 0–30 m depth beneath Mt Gower and Mt Lidgebird.

3.4.2. Middle Shelf

Mid-shelf fossil reef features, including the upper reef, lower reef and intra-reef depressions, dominate both shelves. The 155.4 km2 fossil reef around Lord Howe Island is almost twice the area (180% larger) of the 86.9 km2 Balls Pyramid fossil reef, although the reefs comprise a similar proportion of shelf area at 31% for Lord Howe Island and 33% for Balls Pyramid (Table 3). The Lord Howe Island reef forms a barrier-type reef morphology that encircles the island with pronounced, large basins distinctly separating the mid-shelf reefs from the inner-shelf reefs. The mid-shelf reef has a typical relief of 20 m. It is widest in the southeast (5.9 km) and southwest (4.8 km) and extends closest to the shelf break (<400 m) along the western rim. The mid-shelf reef around Balls Pyramid instead forms a platform-type morphology with basins that only partially intersect the reef structure. The reef has a typical relief of 15 m, and is similarly widest on the southwest shelf (5.2 km) where it extends to within 500 m of the shelf break.
Patch reef features are interspersed between the inner-shelf reefs and the fossil reef. On the western middle shelf, a dense network of patch reefs occur in 24–34 m, rising 10–20 m in relief from the basin floor at 42–47 m depth (Figure 6b). To the east, shore-parallel patch reefs form an 8 km chain which adjoins the margin of inner-shelf reefs on the east shelf. Along this chain, reefs rise to 20 m depth from the surrounding inner- and mid-shelf basin floor in 30–58 m depth. Around the southern inner rim of the fossil reef, low-lying reef patches appear to be inundated by sand, visible from satellite and aerial imagery.
Large forereef buttresses occur on the southern seaward rim of the Lord Howe Island shelf, reaching 5–6 m in height, 50–430 m in width and 470–800 m in length. The magnitude of these buttresses is substantially larger than the 1–4 m high forereef buttresses observed elsewhere along the rim of the Lord Howe Island and Balls Pyramid mid-shelf fossil reefs (Figure 8a–c).
Basins are prominent on the northern, eastern and southern mid shelves around both islands, with the western shelf basin reduced in size around Lord Howe Island and absent on the Balls Pyramid shelf. Basin and channel networks dissect the eastern and northern mid-shelf reefs around Lord Howe Island and Balls Pyramid, and the channels connect to outer-shelf channel systems. Steep margins are commonly observed on the inner-reef rim adjoining the basins on both shelves. The basin rims around Lord Howe Island have gradients up to 30° on the eastern basin and up to 22° observed on the eastern basin rim of Balls Pyramid (Figure 8d,e).

3.4.3. Outer Shelf

The outer-shelf pavement encompasses a large proportion of shelf area for both the Lord Howe Island (99.7 km2; 20%) and Balls Pyramid (72.7 km2; 28%) shelves. Underwater imagery of the outer shelf of Balls Pyramid reveals the pavement is commonly encrusted with coralline algae with a carbonate sand veneer [37]. It is widest on the southwestern (11.3 km) and northeastern (7.8 km) section of the Lord Howe Island shelf and the southern section of the Balls Pyramid shelf (3.6 km). It is narrowest (<50 m) on the western side of both shelves where the mid-shelf reefs extend close to the shelf break. The northeast shelves are characterised by basin and channel networks. Patch reefs are more prominent on the northeast shelves whereas sub-parallel, linear ridges are more typical of the southern outer-shelf platforms (Figure 6c).
Terraces are evident along the outer shelf rim of both shelves, predominantly occurring at 65–110 m depth, with a similar average depth (88 ± 18 m for Lord Howe Island; 94 ± 24 m for Balls Pyramid) and average terrace-step depth (79 ± 20 m for Lord Howe Island; 80 ± 18 m for Balls Pyramid). Terraces appear most separated on the gentler-gradient northern and southern shelves, and conjoin along the steeper-gradient eastern and western shelves. The most distinct terrace-step sequences are observed on the northwest shelf region (Figure 8f,g). These appear more clearly defined on the Lord Howe Island shelf, occurring at 50, 57, 63 and 69 m with a raised rim of 0.5–1 m. On Balls Pyramid, steps occur at 55, 60 and 63 m with a raised rim of <0.5 m. The shelf break occurs at the same average of 130 m around both shelves (± 21 m for Lord Howe Island and ± 20 m for Balls Pyramid).

4. Discussion

The estimated depth surfaces for the inner shelves around Lord Howe Island and Balls Pyramid have substantially enhanced the detail of the features that are very difficult to access using vessel-based platforms. The methods presented here provide a more accurate and detailed seabed model derived from satellite imagery and provide data that are more amenable for integration with multibeam echosounder (MBES) data. The application of multiple filters and the use of larger filter windows (10 cell size) provide a smoothing level similar to that produced with 4–5 m cell size MBES grids. Standard deviation filters were shown to remove outliers and artefacts which may occur from tiling edge effects or surface disturbance, and median 10 (10 cell size) filters were shown to produce a level of smoothing comparable with MBES data.
The selection of filters for individual studies depends on the level of pixel-to-pixel variation within the satellite image and the resolution of bathymetry datasets used for integration. The combination of the standard deviation and median 10 filters were selected for this study due to the surface disturbance observed on the eastern inner shelf and improved RMSE performance of the filtered surface. Image partitioning further improved surface accuracy through tailoring the regression to the east–west variation observed across the image. Quantitative (e.g., RMSE calculations) and qualitative (e.g., plotting residuals) error assessments indicate the reliability of the surface and its fitness for purpose.
The empirical, band ratio method for depth estimation from satellite imagery provides a relatively simple method of shallow depth estimation [10,13]. Importantly, in this study the WV2 image for Lord Howe Island reveals high water clarity (Figure 1), and this high clarity together with the high-resolution of the WV2 image enables a reasonably accurate product to be generated for the inner shelf. For the Balls Pyramid shelf, severe sun glint reduced the suitability of the method. Physics-based approaches may offer more accurate surfaces, however such approaches would also be compromised by sun glint and require increased model parameterisation and complex data processing [10]. Therefore, the empirical, ratio-based approach employed here provides an efficient and relatively accurate method suitable for seabed geomorphic analysis.

4.1. Comparison of Shelf Morphology

The creation of a seamless bathymetry model for the entire shelf region of the two island shelves enabled geomorphic features to be mapped from the shoreline to shelf break at the same resolution and scale. The high-resolution shelf (5 m cell size) and regional (land, and shelf and slope, 8 m cell size) DEMs provide detailed information on shelf morphology, which allow for comparisons of the extent and distribution of fossil reefs. This, in turn, informs interpretations on the formation and driving processes of shelf features. The two oceanic shelves possess a diverse range of accretionary and erosional geomorphic features which have been defined and described. Submerged fossil coral reefs, basins, channels, pavements and terraces are identified on both shelves, with the expression and extent of features typically more pronounced on the larger shelf surrounding Lord Howe Island.
Mid-shelf fossil reefs dominate both shelves in 25–50 m, comprising a similar proportion of shelf area (approximately one third). The reefs form concentric patterns encircling large basins, which are inferred to be paleolagoons. The morphological similarities and comparable depth distributions suggest the mid-shelf reefs developed concurrently, with the mid-shelf reef around Balls Pyramid appearing to have drowned with postglacial sea-level rise [30] while the Lord Howe Island shelf backstepped to form the modern reef [28,29]. The Lord Howe Island mid-shelf fossil reef accreted several metres during the Holocene (9–2 ka) [29], and it is presumed the Last Interglacial (125 ka, Marine Isotope Stage, MIS 5) reef material forms a significant component of the reef foundations, and possibly deposits from preceding interglacials (MIS 7, 9, 11).
The lateral and vertical extent of reef development is greatest on the southwestern shelves, interpreted as the more exposed, windward setting. Forereef buttresses border the eastern, western, and southern rims of the mid-shelf reefs and outer-shelf pavements, indicating variable exposure gradients which are typical of the mid-ocean setting [26]. The development of larger buttresses (5–6 m height) on the southern rim of the Lord Howe Island fossil reef suggest the southern reef was exposed to significantly higher prevailing energy conditions from due south than occurred around the surrounding shelf where buttresses were reduced in size (1–2 m height).
On the outer shelf, where there was ample substrate available for colonisation on the outer-shelf pavement, the reefs cover similar relative areas on both shelves. These reefs formed as ridges and patch reefs, with ridges most developed on the southern outer shelves. Similar paleoshoreline features have been described around the Australian continental shelf [51] and the linear, sub-parallel configuration of these features suggest beach barrier or coral reef origins. Occurring at 40–80 m depth, these features may have formed during postglacial sea-level rise of the Early Holocene or during earlier interstadials (e.g., MIS 3).
The dense network of patch reefs on the mid shelf and the linear reef systems on the eastern and northern inner shelves of Lord Howe Island are interpreted as transitional fossil patch and fringing reefs that developed as the reef retreated landward with postglacial sea-level rise. As the linear reefs have a maximum relief of 4 m, the associated lagoons are likely to be shallow and therefore more typical of fringing reef than barrier systems [52]. While the less-exposed west coast is dominated by reef accretion, the more exposed eastern, northern and southern coasts have limited coral accretion and the substratum comprises volcanic and calcarenite outcrops [23,36]. Along the southern coast, the nearshore waters adjoining the steep basalt cliffs are characterised by boulder stacks and plunging cliffs, which likely extend to form the contiguous reef mapped along the southern inner shelf.
Unlike the mosaic of different reef morphologies observed on the Lord Howe Island inner shelf, the Balls Pyramid inner shelf possesses a more limited inner shelf fossil reef. The Balls Pyramid pinnacle comprises steep cliffs which plunge into shallow waters, and the contiguous inner shelf reef surrounding the island is likely dominated by volcanic bedrock. The concentric formation of the outer edge of the inner shelf reefs, intersected with narrow channels, suggests constructional fossil reef origins which may have accreted, in part, during the postglacial rise in sea-level.
In addition to accretionary geomorphic features, the shelves exhibit diverse erosional features and morphologies. Complex networks of basins and channel systems characterise the northeast shelves, interpreted as the more sheltered, leeward setting. Basin features are interconnected to the channels, which are interpreted as inter-reef passages which would have functioned to transport water from the paleolagoons when the sea level was at or near the fossil reef surface. Three prominent channels dissect the Lord Howe Island mid-shelf reef, whereas distinct channels are not apparent on the mid shelf around Balls Pyramid. However, the leeward setting is apparent on the Balls Pyramid shelf through developed channels on the northeast outer shelf and the extension of a large northern mid-shelf basin.
During periods of lower sea level when the shelf was exposed, the mid- and outer-shelf channels appear to have fed sediment off the shelf edge, as suggested by the sub-bottom profiles presented for the Balls Pyramid northeast shelf by [30]. These processes are similarly inferred for the Lord Howe Island shelf, where distinct channels are evident on the northeast middle shelf of Lord Howe Island, with a complex network of channels extending across the northeast shelf. Sediment samples collected from the slope areas by [53] indicate the transport and deposition of sediments off the shelf into slope areas during periods of lower sea level.
The karstification of limestone shelf features likely occurred during times of lower sea level, as suggested by onshore deposits of calcarenites around Lord Howe Island [27]. Karst features including dolines, caves and subaerially exposed speleothems were documented within calcarenite sequences around the island, which experienced dissolution and weathering following deposition during the MIS 7 [27]. Morphological characteristics of the mid-shelf basins, including steep basin rims and a sand-inundated low-profile reef, suggest the basin morphology may reflect karstification processes (e.g., [54]). The steeper basin rims and greater extent of the mid-shelf basins around Lord Howe Island (60 km2 around Lord Howe Island; 24 km2 around Balls Pyramid) likely reflect the greater volume of water drainage from the larger shelf system during periods when the sea-level was at or near the fossil reef surface and during lowstands when the shelves were exposed.
Terrace and step features are associated with lowstand sea levels during the last glacial period (Last Glacial Maximum ~21 ka) and the preceding interstadial and glacial periods of lower sea level. The depth range of these features are distributed across a wide spread of depths (45–217 m), corresponding to a range of lower sea levels. Similar mean depths of step features occur on both shelves (79–80 m), which may be associated with MIS 3. Morphologically, terrace step feature patterns are remarkably similar for the two shelves, particularly in the northwest where several distinct terraces form with rimmed margins (Figure 8f,g). The shelf break similarly varies around the island shelves (83–217 m, mean depth 130 m). Shelf planation is proposed to have occurred rapidly after the formation of the shield volcanoes (6–7 million years ago), with marine abrasion accounting for the majority (90%) of erosion [26]. Following shelf planation, carbonate sequences were deposited over the basalt platform [29,30,32], and accretionary and erosional processes during sea level lowstands shaped the variable nature of the shelf break.
The availability of substrate for coral colonisation, leading to reef formation, is a key factor differentiating the morphology of the two shelves. The larger size of the shelf and thus the original formative volcano of Lord Howe Island, translates to larger island remnants that remained after shelf planation. The greater extent of reefs around the Lord Howe Island inner shelf was likely facilitated through the availability of shallow substrates and the larger island size which presumably provided greater shelter from exposure. Possibly, slightly warmer sea temperatures and/or more favourable currents (e.g., upwelling) or levels of exposure may have enabled coral to grow faster on the Lord Howe Shelf. In contrast to Lord Howe Island, the Balls Pyramid shelf possesses minimal shallow inner-shelf substrates and the steep pinnacle provides little shelter from high wind and wave energies. Although the areal extent of shelf features are reduced in comparison to Lord Howe Island, substantial past reef development is evident on the Balls Pyramid.

4.2. Applications for Management

Previous studies of the distribution of benthic assemblages around the island shelves and broader Lord Howe region have shown strong correlations to geomorphic features and shelf regions [31,32,37,55,56,57]. Abundant hard corals were recently discovered growing on the mid-shelf reef of Balls Pyramid, showing increased abundance associated with the mid- and outer-shelf reef features [37]. It is likely that similar distributions of hard corals occur around the Lord Howe Island mid-shelf reef, particularly given the development of a modern fringing reef and the more extensive fossil reef. The outer shelf pavement has been characterised as an area of sand veneers and rhodolith beds [32,37,55], with gorgonian whips and fans observed on the outer shelf and shelf break [37,55]. Investigations of benthic invertebrates around the Lord Howe Island shelf have shown that the infaunal benthic community structure was significantly different between geomorphic zones (fossil reef, basins and outer shelf, [56]).
While geomorphology appears to be a useful surrogate for benthic assemblages for the mid- to outer-shelf features, benthic communities around the inner shelf appear to be strongly structured by the hydrodynamic regime [23,58,59]. Geomorphology is considered to be less useful as a surrogate in this zone, however terrain variables derived from the DEM, such as seafloor ruggedness, may provide useful proxies for explaining distribution of benthic assemblages.
Seafloor habitat mapping is an important component for marine spatial planning and fisheries management [7,60]. The high-resolution bathymetry model and geomorphic characterisation produced in this study feed directly into the management needs identified by marine park managers [34]. These macro-scale classifications of geomorphic features fit within the hierarchical framework of biome and provincial characterisations of the seafloor and biogeography for the broader Lord Howe region [3,31]. The datasets produced by this study reveal detailed bathymetric information and characterise the geodiversity of the shelf landscape. The continuous depth information and stratification of the shelf into distinct features can be utilised in the ongoing planning and management of the shelf environment. An understanding of geodiversity around the shelf can assist in the experimental design of future data collection, and can identify areas of potential biodiversity, which can be targeted for further exploration.
Future research will focus on resolving the timing of reef accretion around the Balls Pyramid shelf and the evolution of the shelf features. The distribution of benthic assemblages around the Lord Howe Island shelf will also be explored to further examine relationships between biota to underlying geomorphology and terrain variables.

5. Conclusions

The principal conclusions that arise from the present study are:
  • Filtering of the band ratio grid with standard deviation and median filters improved the surface for integration with multibeam echosounder data.
  • Image partitioning further improved the surface, accounting for east-to-west variation across the image.
  • The integration of depth derived from satellite imagery together with multibeam echosounder data produced a seamless 5 m cell size bathymetry model of the shelf from the shoreline to shelf break.
  • Geomorphic interpretations of the shelves defined diverse accretionary and erosional features, with mid-shelf fossil reefs shown to dominate both shelves in 25–50 m.
  • The mid-shelf fossil reef around Balls Pyramid is approximately half the area of the Lord Howe Island mid-shelf reef, although it represents a similar proportion of shelf area (approximately one third).
  • The morphology, size, configuration and depth distribution of outer shelf features are most similar between the two shelves, and are most dissimilar for inner shelf features.

Acknowledgments

Thank you to the Marine National Facility for the use of the R.V. Southern Surveyor and to all the staff and crew aboard the voyages in 2008 (SS06-2008) and 2013 (SS2013_v02). Thank you to New South Wales (NSW) Roads and Maritime Services for provision of single beam data. We express our thanks to the Lord Howe Island Marine Park Authority (LHIMPA, Permit LHIMP/R/2012/013), NSW Department of Primary Industries (DPI, Permit P12/0030-1.0) and the Department of the Environment (Permit 003-RRR-120918-02). Funding for this research was received by the Australian Government’s National Environmental Research Program Marine Biodiversity Hub. Funding was also provided by NSW DPI, LHIMPA and University of Wollongong (UOW) Research Partnerships Grant. M.L. gratefully acknowledges support from the Australian Postgraduate Award. B.P.B. and S.L.N. publish with the permission of the Chief Executive Officer of Geoscience Australia.

Author Contributions

This work is based on the doctoral thesis of M.L., who conducted the data processing and analysis and wrote the paper. C.D.W., S.M.H., B.P.B., S.L.N., A.R.J. reviewed the analyses and revised the paper.

Conflicts of Interest

The authors declare no conflict of interest.

Appendix A

Figure A1. Deglinted band 2 and band 3 reflectance values plotted against depth and coloured by substrate type (sand, mixed sand and reef, and reef).
Geosciences 08 00011 g0a1

Appendix B

Figure A2. (a) Coverage of 2008 and 2013 multibeam data, and 2008 Roads and Maritime (RMS) single beam data; (b) Calculation points used to estimate bathymetry, which extend from the western lagoon, and validation points which include all remaining known depth points in shallower areas (approximately <40 m depth).
Geosciences 08 00011 g0a2

References

  1. Harris, P.T.; Baker, E.K. Seafloor Geomorphology as Benthic Habitat: Geohab Atlas of Seafloor Geomorphic Features and Benthic Habitats; Elsevier Science: Burlington, ON, Canada, 2012; p. 947. [Google Scholar]
  2. Directive 2008/56/EC of the European Parliament and of the Council of 17 June 2008: Establishing a Framework for Community Action in the Field of Marine Environmental Policy (Marine Strategy Framework Directive). Available online: http://eur-lex.europa.eu/eli/dir/2008/56/oj (accessed on 25 December 2017).
  3. Harris, P.T.; Heap, A.D.; Whiteway, T.; Post, A. Application of biophysical information to support Australia’s representative marine protected area program. Ocean Coast. Manag. 2008, 51, 701–711. [Google Scholar] [CrossRef]
  4. Harris, P.T.; Macmillan-Lawler, M.; Rupp, J.; Baker, E.K. Geomorphology of the oceans. Mar. Geol. 2014, 352, 4–24. [Google Scholar] [CrossRef]
  5. Stevens, T.; Connolly, R.M. Local-scale mapping of benthic habitats to assess representation in a marine protected area. Mar. Freshw. Res. 2005, 56, 111–123. [Google Scholar] [CrossRef]
  6. Last, P.R.; Lyne, V.D.; Williams, A.; Davies, C.R.; Butler, A.J.; Yearsley, G.K. A hierarchical framework for classifying seabed biodiversity with application to planning and managing Australia’s marine biological resources. Biol. Conserv. 2010, 143, 1675–1686. [Google Scholar] [CrossRef]
  7. Jordan, A.R.; Lawler, M.; Halley, V.; Barrett, N. Seabed habitat mapping in the Kent Group of islands and its role in marine protected area planning. Aquat. Conserv. Mar. Freshw. Ecosyst. 2005, 15, 51–70. [Google Scholar] [CrossRef]
  8. Evans, I.S. Geomorphometry and landform mapping: What is a landform? Geomorphology 2012, 137, 94–106. [Google Scholar] [CrossRef]
  9. Leon, J.X.; Phinn, S.R.; Hamylton, S.M.; Saunders, M.I. Filling the ‘white ribbon’—A multisource seamless digital elevation model for Lizard Island, Northern Great Barrier Reef. Int. J. Remote Sens. 2013, 34, 6337–6354. [Google Scholar] [CrossRef]
  10. Gao, J. Bathymetric mapping by means of remote sensing: Methods, accuracy and limitations. Prog. Phys. Geogr. 2009, 33, 103–116. [Google Scholar] [CrossRef]
  11. Brando, V.E.; Anstee, J.M.; Wettle, M.; Dekker, A.G.; Phinn, S.R.; Roelfsema, C. A physics based retrieval and quality assessment of bathymetry from suboptimal hyperspectral data. Remote Sens. Environ. 2009, 113, 755–770. [Google Scholar] [CrossRef]
  12. Botha, E.; Brando, V.; Dekker, A. Effects of per-pixel variability on uncertainties in bathymetric retrievals from high-resolution satellite images. Remote Sens. 2016, 8, 459. [Google Scholar] [CrossRef]
  13. Stumpf, R.P.; Holderied, K.; Sinclair, M. Determination of water depth with high-resolution satellite imagery over variable bottom types. Limnol. Oceanogr. 2003, 48, 547–556. [Google Scholar] [CrossRef]
  14. Hernandez, W.; Armstrong, R. Deriving bathymetry from multispectral remote sensing data. J. Mar. Sci. Eng. 2016, 4, 8. [Google Scholar] [CrossRef]
  15. Hedley, J.D.; Harborne, A.R.; Mumby, P.J. Technical note: Simple and robust removal of sun glint for mapping shallow-water benthos. Int. J. Remote Sens. 2005, 26, 2107–2112. [Google Scholar] [CrossRef]
  16. McArthur, M.A.; Brooke, B.P.; Przeslawski, R.; Ryan, D.A.; Lucieer, V.L.; Nichol, S.L.; McCallum, A.W.; Mellin, C.; Cresswell, I.D.; Radke, L.C. On the use of abiotic surrogates to describe marine benthic biodiversity. Estuar. Coast. Shelf Sci. 2010, 88, 21–32. [Google Scholar] [CrossRef]
  17. Sagar, S.; Roberts, D.; Bala, B.; Lymburner, L. Extracting the intertidal extent and topography of the Australian coastline from a 28 year time series of Landsat observations. Remote Sens. Environ. 2017, 195, 153–169. [Google Scholar] [CrossRef]
  18. Kennedy, D.M.; Ierodiaconou, D.; Schimel, A. Granitic coastal geomorphology: Applying integrated terrestrial and bathymetric LiDAR with multibeam sonar to examine coastal landscape evolution. Earth Surf. Process. Landf. 2014, 39, 1663–1674. [Google Scholar] [CrossRef]
  19. Quadros, N.; Rigby, J. Construction of a High Accuracy Seamless, State-Wide Coastal DEM; FIG Coastal Zone Special Publication: Sydney, Australia, 2010. [Google Scholar]
  20. Beaman, R. 3DGBR: A High-Resolution Depth Model for the Great Barrier Reef and Coral Sea; Marine and Tropical Sciences Research Facility (MTSRF) Project 2.5i.1a Final Report; Reef and Rainforest Research Centre: Cairns, Australia, 2010. [Google Scholar]
  21. Bridge, T.; Beaman, R.; Done, T.; Webster, J. Predicting the location and spatial extent of submerged coral reef habitat in the Great Barrier Reef World Heritage Area, Australia. PLoS ONE 2012, 7, e48203. [Google Scholar] [CrossRef] [PubMed]
  22. Harris, P.T.; Bridge, T.C.; Beaman, R.J.; Webster, J.M.; Nichol, S.L.; Brooke, B.P. Submerged banks in the Great Barrier Reef, Australia, greatly increase available coral reef habitat. ICES J. Mar. Sci. J. Cons. 2013, 70, 284–293. [Google Scholar] [CrossRef]
  23. Veron, J.; Done, T. Corals and coral communities of Lord Howe Island. Aust. J. Mar. Freshw. Res. 1979, 30, 203–236. [Google Scholar] [CrossRef]
  24. Roberts, C.M.; McClean, C.J.; Veron, J.E.; Hawkins, J.P.; Allen, G.R.; McAllister, D.E.; Mittermeier, C.G.; Schueler, F.W.; Spalding, M.; Wells, F.; et al. Marine biodiversity hotspots and conservation priorities for tropical reefs. Science 2002, 295, 1280–1284. [Google Scholar] [CrossRef] [PubMed]
  25. McDougall, I.; Embleton, B.J.J.; Stone, D.B. Origin and evolution of Lord Howe Island, southwest Pacific Ocean. J. Geol. Soc. Aust. 1981, 28, 155–176. [Google Scholar] [CrossRef]
  26. Dickson, M. The development of talus slopes around Lord Howe Island and implications for the history of island planation. Aust. Geogr. 2004, 35, 223–238. [Google Scholar] [CrossRef]
  27. Brooke, B.P.; Woodroffe, C.D.; Murray-Wallace, C.V.; Heijnis, H.; Jones, B.G. Quaternary calcarenite stratigraphy on Lord Howe Island, southwestern Pacific Ocean and the record of coastal carbonate deposition. Quat. Sci. Rev. 2003, 22, 859–880. [Google Scholar] [CrossRef]
  28. Kennedy, D.M.; Woodroffe, C.D. Holocene lagoonal sedimentation at the latitudinal limits of reef growth, Lord Howe Island, Tasman sea. Mar. Geol. 2000, 169, 287–304. [Google Scholar] [CrossRef]
  29. Woodroffe, C.D.; Brooke, B.P.; Linklater, M.; Kennedy, D.M.; Jones, B.G.; Buchanan, C.; Mleczko, R.; Hua, Q.; Zhao, J. Response of coral reefs to climate change: Expansion and demise of the southernmost pacific coral reef. Geophys. Res. Lett. 2010, 37, 15. [Google Scholar] [CrossRef]
  30. Linklater, M.; Brooke, B.P.; Hamylton, S.M.; Nichol, S.L.; Woodroffe, C.D. Submerged fossil reefs discovered beyond the limit of modern reef growth in the pacific ocean. Geomorphology 2015, 246, 579–588. [Google Scholar] [CrossRef]
  31. Przeslawski, R.; Williams, A.; Nichol, S.L.; Hughes, M.G.; Anderson, T.J.; Althaus, F. Biogeography of the Lord Howe Rise region, Tasman sea. Deep Sea Res. Part II Top. Stud. Oceanogr. 2011, 58, 959–969. [Google Scholar] [CrossRef]
  32. Kennedy, D.M.; Woodroffe, C.D.; Jones, B.G.; Dickson, M.E.; Phipps, C.V.G. Carbonate sedimentation on subtropical shelves around Lord Howe Island and Balls Pyramid, southwest Pacific. Mar. Geol. 2002, 188, 333–349. [Google Scholar] [CrossRef]
  33. Brooke, B.P.; Woodroffe, C.D.; Linklater, M.; McArthur, M.A.; Nichol, S.L.; Jones, B.G.; Kennedy, D.M.; Buchanan, C.; Spinoccia, M.; Mleczko, R.; et al. Geomorphology of the Lord Howe Island shelf and Submarine Volcano: SS06-2008 Post-Survey Report Record 2010/26; Geoscience Australia: Canberra, Australia, 2010; p. 125.
  34. Lord Howe Island Marine Park: Zoning Plan Review Report. Available online: https://www.yumpu.com/en/document/view/49288746/lord-howe-island-marine-park-zoning-plan-review-report (accessed on 25 December 2017).
  35. Linklater, M. An Assessment of the Geomorphology and Benthic Environments of the Lord Howe Island Shelf, Southwest Pacific Ocean, and Implications for Quaternary Sea Level. Ph.D. Thesis, University of Wollongong, Wollongong, Australia, 2009. [Google Scholar]
  36. Environment Australia and Marine Parks Authority. Lord Howe Island Marine Park Issues Paper: A Planning Issues Paper for the Lord Howe Island Marine Park (State and Commonwealth Waters); Environment Australia, Canberra NSW Marine Parks Authority: Canberra, Australia, 2001; p. 116.
  37. Linklater, M.; Carroll, A.G.; Hamylton, S.M.; Jordan, A.R.; Brooke, B.P.; Nichol, S.L.; Woodroffe, C.D. High coral cover on a mesophotic, subtropical island platform at the limits of coral reef growth. Cont. Shelf Res. 2016, 130, 34–46. [Google Scholar] [CrossRef]
  38. New South Wales (NSW) Marine Parks Authority. Marine Parks: Strategic Research Framework 2010–2015; NSW Marine Parks Authority: Sydney, Australia, 2010.
  39. Mleczko, R.; Sagar, S.; Spinoccia, M.; Brooke, B.P. The Creation of High Resolution Bathymetry Grids for the Lord Howe Island Region; Geoscience Australia: Canberra, Australia, 2010; p. 58.
  40. Berk, A.; Bernstein, L.; Robertson, D. MODTRAN: A Moderate Resolution Model for LOWTRAN7; GL-TR-89-0122; AFG Lab., Hanscom Air Force Base: Bedford, MA, USA, 1989; p. 38. [Google Scholar]
  41. Matthew, M.W.; Adler-Golden, S.M.; Berk, A.; Richtsmeier, S.C.; Levine, R.Y.; Bernstein, L.S.; Acharya, P.K.; Anderson, G.P.; Felde, G.W.; Hoke, M.P.; et al. Status of atmospheric correction using a MODTRAN4-based algorithm. In Proceedings of the SPIE Proceedings, Algorithms for Multispectral, Hyperspectral, and Ultraspectral Imagery VI, Orlando, FL, USA, 24–26 April 2000. [Google Scholar]
  42. Jacobs, R. NSW Ocean and River Entrance Tidal Levels Annual Summary 2015–2016; Manly Hydraulics Laboratory: Sidney, Australia, 2016; p. 122. [Google Scholar]
  43. Li, J.; Heap, A.D. A Review of Spatial Interpolation Methods for Environmental Scientists; Geoscience Australia: Canberra, Australia, 2008; p. 137.
  44. Arun, P.V. A comparative analysis of different DEM interpolation methods. Egypt. J. Remote Sens. Space Sci. 2013, 16, 133–139. [Google Scholar]
  45. ArcGIS Benthic Terrain Modeler (BTM); version 3.0; Environmental Systems Research Institute, NOAA Coastal Services Center: Boston, MA, USA, 2012.
  46. International Hydrographic Organisation (IHO). Standardization of Undersea Feature Names: Guidelines, Proposal Form, Terminology, Bathymetric Publication no.6, 4th ed.; International Hydrographic Bureau: Monaco, 2013; p. 38. [Google Scholar]
  47. Madden, C.; Goodin, K.; Allee, R.; Cicchetti, G.; Moses, C.; Finkbeiner, M.; Bamford, D. Coastal and Marine Ecological Classification Standard; National Oceanic and Atmospheric Administration and NatureServe: Washington, DC, USA, 2009.
  48. Nichol, S.L.; Huang, Z.; Howard, F.; Porter-Smith, R.; Lucieer, V.L.; Barrett, N. Geomorphological Classification of Reefs-Draft Framework for an Australian Standard; Geoscience Australia: Report to the National Environmental Science Program; Marine Biodiversity Hub: Hobart, Australia, 2016; p. 27.
  49. Done, T. Coral reef, definition. In Encyclopedia of Modern Coral Reefs: Structure, Form and Process; Hopley, D., Ed.; Springer: Dordrecht, The Nederland, 2011; pp. 261–267. [Google Scholar]
  50. Beaman, R.J.; Webster, J.M.; Wust, R.A.J. New evidence for drowned shelf edge reefs in the Great Barrier Reef, Australia. Mar. Geol. 2008, 247, 17–34. [Google Scholar] [CrossRef]
  51. Brooke, B.P.; Nichol, S.L.; Huang, Z.; Beaman, R.J. Palaeoshorelines on the Australian continental shelf: Morphology, sea-level relationship and applications to environmental management and archaeology. Cont. Shelf Res. 2017, 134, 26–38. [Google Scholar] [CrossRef]
  52. Kennedy, D.; Woodroffe, C.D. Fringing reef growth and morphology: A review. Earth-Sci. Rev. 2002, 57, 255–277. [Google Scholar] [CrossRef]
  53. Kennedy, D.; Brooke, B.P.; Woodroffe, C.D.; Jones, B.; Waikari, C.; Nichol, S.L. The geomorphology of the flanks of the Lord Howe Island volcano, Tasman Sea, Australia. Deep Sea Research Part II: Topical Studies. Oceanography 2011, 58, 899–908. [Google Scholar]
  54. Stoddart, D.R.; Spencer, T.; Woodroffe, C.D. Mauke, Mitiaro and Atiu: Geomorphology of Makatea Islands in the southern Cooks; National Museum of Natural History; Smithsonian Institution: Washington, DC, USA, 1990; p. 65. [Google Scholar]
  55. Speare, P.P.; Cappo, M.M.; Rees, M.M.; Brownlie, J.J.; Oxley, W.W. Deeper Water Fish and Benthic Surveys in the Lord Howe Island Marine Park (Commonwealth Waters): February 2004; Australian Institute of Marine Science: Townsville, Australia, 2004; p. 36.
  56. Anderson, T.; McArthur, M.; Syms, C.; Nichol, S.L.; Brooke, B.P. Infaunal biodiversity and ecological function on a remote oceanic island: The role of biogeography and bio-physical surrogates. Estuar. Coast. Shelf Sci. 2013, 117, 227–237. [Google Scholar] [CrossRef]
  57. Brooke, B.P.; McArthur, M.A.; Woodroffe, C.D.; Linklater, M.; Nichol, S.L.; Anderson, T.J.; Mleczko, R.; Sagar, S. Geomorphic features and infauna diversity of a subtropical mid-ocean carbonate shelf: Lord Howe Island, southwest Pacific Ocean. In Seafloor Geomorphology as Benthic Habitat: Geohab Atlas of Seafloor Geomorphic Features and Benthic Habitats; Harris, P.T., Baker, E.K., Eds.; Elsevier Science: Burlington, ON, Canada, 2012; pp. 375–386. [Google Scholar]
  58. Harriott, V.J.; Harrison, P.L.; Banks, S.A. The coral communities of Lord Howe Island. Mar. Freshw. Res. 1995, 46, 457–465. [Google Scholar] [CrossRef]
  59. Edgar, G.J.; Davey, A.; Kelly, G.; Mawbey, R.B.; Parsons, K. Biogeographical and ecological context for managing threats to coral and rocky reef communities in the Lord Howe Island Marine Park, south-western Pacific. Aquat. Conserv. Mar. Freshw. Ecosyst. 2010, 20, 378–396. [Google Scholar] [CrossRef]
  60. Shumchenia, E.J.; King, J.W. Comparison of methods for integrating biological and physical data for marine habitat mapping and classification. Cont. Shelf Res. 2010, 30, 1717–1729. [Google Scholar] [CrossRef]
Figure 1. World View 2 (2010) image of Lord Howe Island, showing high water clarity evident with visibility to the outer shelf (~60 m water depth) in the southwest corner of the image.
Geosciences 08 00011 g001
Figure 2. Process diagram of steps undertaken during processing satellite imagery and producing bathymetry model. Geoscience Australia bathymetry grids sourced from [39].
Geosciences 08 00011 g002
Figure 3. Comparison of bathymetry estimates and calculated slope for selected filters. Black areas for standard deviation and median 10 filter (Std. Dev. + Median 10) denotes “no data” areas.
Geosciences 08 00011 g003
Figure 4. Polynomial regression of blue/green band ratio with: (a) no filters applied; (b) standard deviation filter applied; (c) standard deviation and median (10 cell circle radius) filters Fapplied.
Geosciences 08 00011 g004
Figure 5. Lord Howe Island shelf: (a) Source data coverages for bathymetry model; (b) integrated high-resolution bathymetry model (regional grid shown, 8 m cell size). Colour scheme stretched to 100 m to emphasise shelf features. Isobaths displayed at 1000 m intervals (white dashed line) together with the 300 m isobath (shown in red) which represents the limit of the shelf bathymetry model; (c) slope calculated for the regional bathymetry model; (d) ruggedness (rugosity) calculated at a three cell window for shelf bathymetry model.
Geosciences 08 00011 g005
Figure 6. Geomorphic feature interpretation of the Lord Howe Island and Balls Pyramid shelves. Inset locations show: (a) linear reefs on the eastern inner shelf of Lord Howe Island; (b) patch reefs on the western mid shelf of Lord Howe Island; and (c) sub-parallel, linear ridges along the southern outer shelf of Balls Pyramid.
Geosciences 08 00011 g006
Figure 7. Zonal histogram for geomorphic features of the: (a) Lord Howe Island shelf; and (b) Balls Pyramid shelf. Line area represents the cumulative area of individual cells beneath the shelf break and terrace step lines, to provide an indication of depth distribution patterns for these linear features.
Geosciences 08 00011 g007
Figure 8. Hillshaded integrated bathymetry grid (8 m cell size) and profiles of: (a) southern forereef buttresses of Lord Howe Island (LHI); (b) eastern forereef buttresses of LHI; (c) eastern forereef buttresses of Balls Pyramid (BP); (d) steep rim of eastern basin of LHI; (e) steep rim of eastern basin of BP; (f) terraces on northeast outer shelf of LHI; (g) terraces on northeast outer shelf of BP.
Geosciences 08 00011 g008
Table 1. Definitions of feature terms used with this study.
Geomorphic FeatureDefinition
Coral reefA tract of corals growing on a massive, wave resistant structure and associated sediments, substantially built by skeletons of successive generations of corals and other calcareous biota [49]
ChannelA linear or sinuous depression on an otherwise flat surface [48]
BasinA depression, in the seafloor, more or less equidimensional in plan and of variable extent [48]
DepressionA low lying area surrounded by higher ground and with no outlet or opening (i.e., closed) [48]
PavementFlat (or gently sloping), low-relief, solid, carbonate rock with little or no fine-scale rugosity. These areas can be covered with algae, hard coral, gorgonians, zooanthids, or other sessile vertebrates; the coverage may be dense enough to partially obscure the underlying surface. On less colonized pavement features, rock may be covered by a thin sand veneer [47]
RidgeA long, narrow elevation, usually sharp crested with steep sides. Larger ridges can form an extended upland between valleys [48]
StepA narrow area on the continental (or island) shelf that has a distinctive steep gradient [50]
TerraceA relatively level or gently inclined surface defined along one edge by a steeper descending slope and along the other by a steeper ascending slope. Terraces may border a valley floor or shoreline, and they can represent the former position of a flood plain or shoreline [48]
Shelf breakThe line along which there is a marked increase of slope at the seaward margin of a continental (or island) shelf [46]
SlopeThe sloping region that deepens from a shelf to a point where there is a general decrease in gradient [46]
Table 2. Regression results and error assessments for selected filters. Results shown for each depth interval.
Filter TypeR2Polynomial TypeRMSE for Each Depth Range (m)
0–100–150–200–250–300–350–40
No filter0.807Order 21.982.122.673.733.553.94.61
Low Pass (3 × 3)0.894Order 20.891.151.822.42.413.224.14
Median 100.93Order 30.751.031.452.422.23.184.23
Low pass + Median 100.931Order 30.741.051.552.462.213.144.2
Standard deviation (Std)0.84Order 21.241.331.83.13.233.855.72
Std + Median 100.935Order 30.720.971.122.42.193.155.36
West 0.720.971.121.481.371.983.1
East --1.114.034.125.256.23
Image partition
Std + Median 10 0.720.971.172.11.742.393.3
West0.935Order 30.720.971.121.481.371.983.1
East0.875Order 3--1.683.753.133.53.88
Table 3. Zonal statistics for the geomorphic features of Lord Howe Island and Balls Pyramid shelves. Depth range (R), average (Av), standard deviation (Std) and area percentage (%) of the shelf. Statistics for depth and slope calculated from the 5 m cell size shelf bathymetry grid.
Shelf RegionGeomorphic FeatureLord Howe Island ShelfBalls Pyramid Shelf
Area (km2)% of ShelfDepth (R)Depth (Av ± Std)Slope (Av ± Std)Area (km2)% of ShelfDepth (R)Depth (Av ± Std)Slope (Av ± Std)
Inner shelfModern fringing reef6.51.32 to 3510 ± 7.42.9 ± 3.4-----
Shallow lagoon3.90.82 to 93 ± 0.30.3 ± 0.3-----
Fossil reefs and bedrock outcrops22.84.51 to 4825 ± 8.94.5 ± 4.45.62.221 to 4132 ± 2.31.6 ± 1.2
Basins and intra-reef depressions18.43.72 to 4026 ± 8.31.9 ± 1.90.80.332 to 4035 ± 0.70.9 ± 1.4
Channels0.30.13 to 3110 ± 5.13.7 ± 4.30.60.231 to 3835 ± 1.21.3 ± 1.1
Mid shelfPatch reefs13.62.719 to 6338 ± 5.14.3 ± 5.31.10.436 to 5746 ± 2.84.5 ± 4.0
Fossil reefs: -Upper56.011.114 to 3531 ± 2.43.2 ± 2.913.95.318 to3533 ± 1.42.7 ± 2.5
-Lower70.914.135 to 7640 ± 4.32.3 ± 2.556.121.535 to 5542 ± 4.02.3 ± 2.2
-Intra-reef depressions28.55.725 to 5537 ± 4.61.7 ± 1.516.96.528 to 5041 ± 4.11.6 ± 1.6
Channels13.92.822 to 6748 ± 9.11.8 ± 2.3- ---
Basins60.011.923 to 6144 ± 6.71.3 ± 1.524.09.230 to 5746 ± 4.31.0 ± 1.3
Outer shelfRidges and patch reefs11.52.343 to 8057 ± 6.53.4 ± 3.110.84.141 to 7453 ± 5.52.1 ± 2.0
Pavement99.719.830 to 8054 ± 5.01.9 ± 2.072.727.936 to 10454 ± 6.41.5 ± 2.4
Basins8.11.642 to 6355 ± 3.91.7 ± 1.97.12.741 to 6752 ± 3.61.2 ± 1.2
Channels9.92.047 to 6759 ± 3.52.0 ± 2.20.60.250 to 5855 ± 1.21.4 ± 1.5
Terraces79.615.845 to 21588 ± 18.45.5 ± 6.050.419.347 to 21794 ± 23.64.9 ± 5.8
Terrace steps (line)--45 to 21379 ± 19.98.8 ± 7.4--47 to 13680 ± 17.57.7 ± 6.7
Shelf breakShelf break (line)--86 to 206130 ± 20.626.8 ± 8.3--83 to 217130 ± 19.926.9 ± 1 2.2
TotalEntire shelf503.81000 to 21549 ± 21.62.8 ± 3.6260.710018 to 21756 ± 22.82.4 ± 3.5

