Geochemical and Isotopic Evidence of Groundwater Salinization Processes in El Dabaa Area, Northwestern Coast, Egypt

 and
and
Abstract
:1. Introduction
2. Background
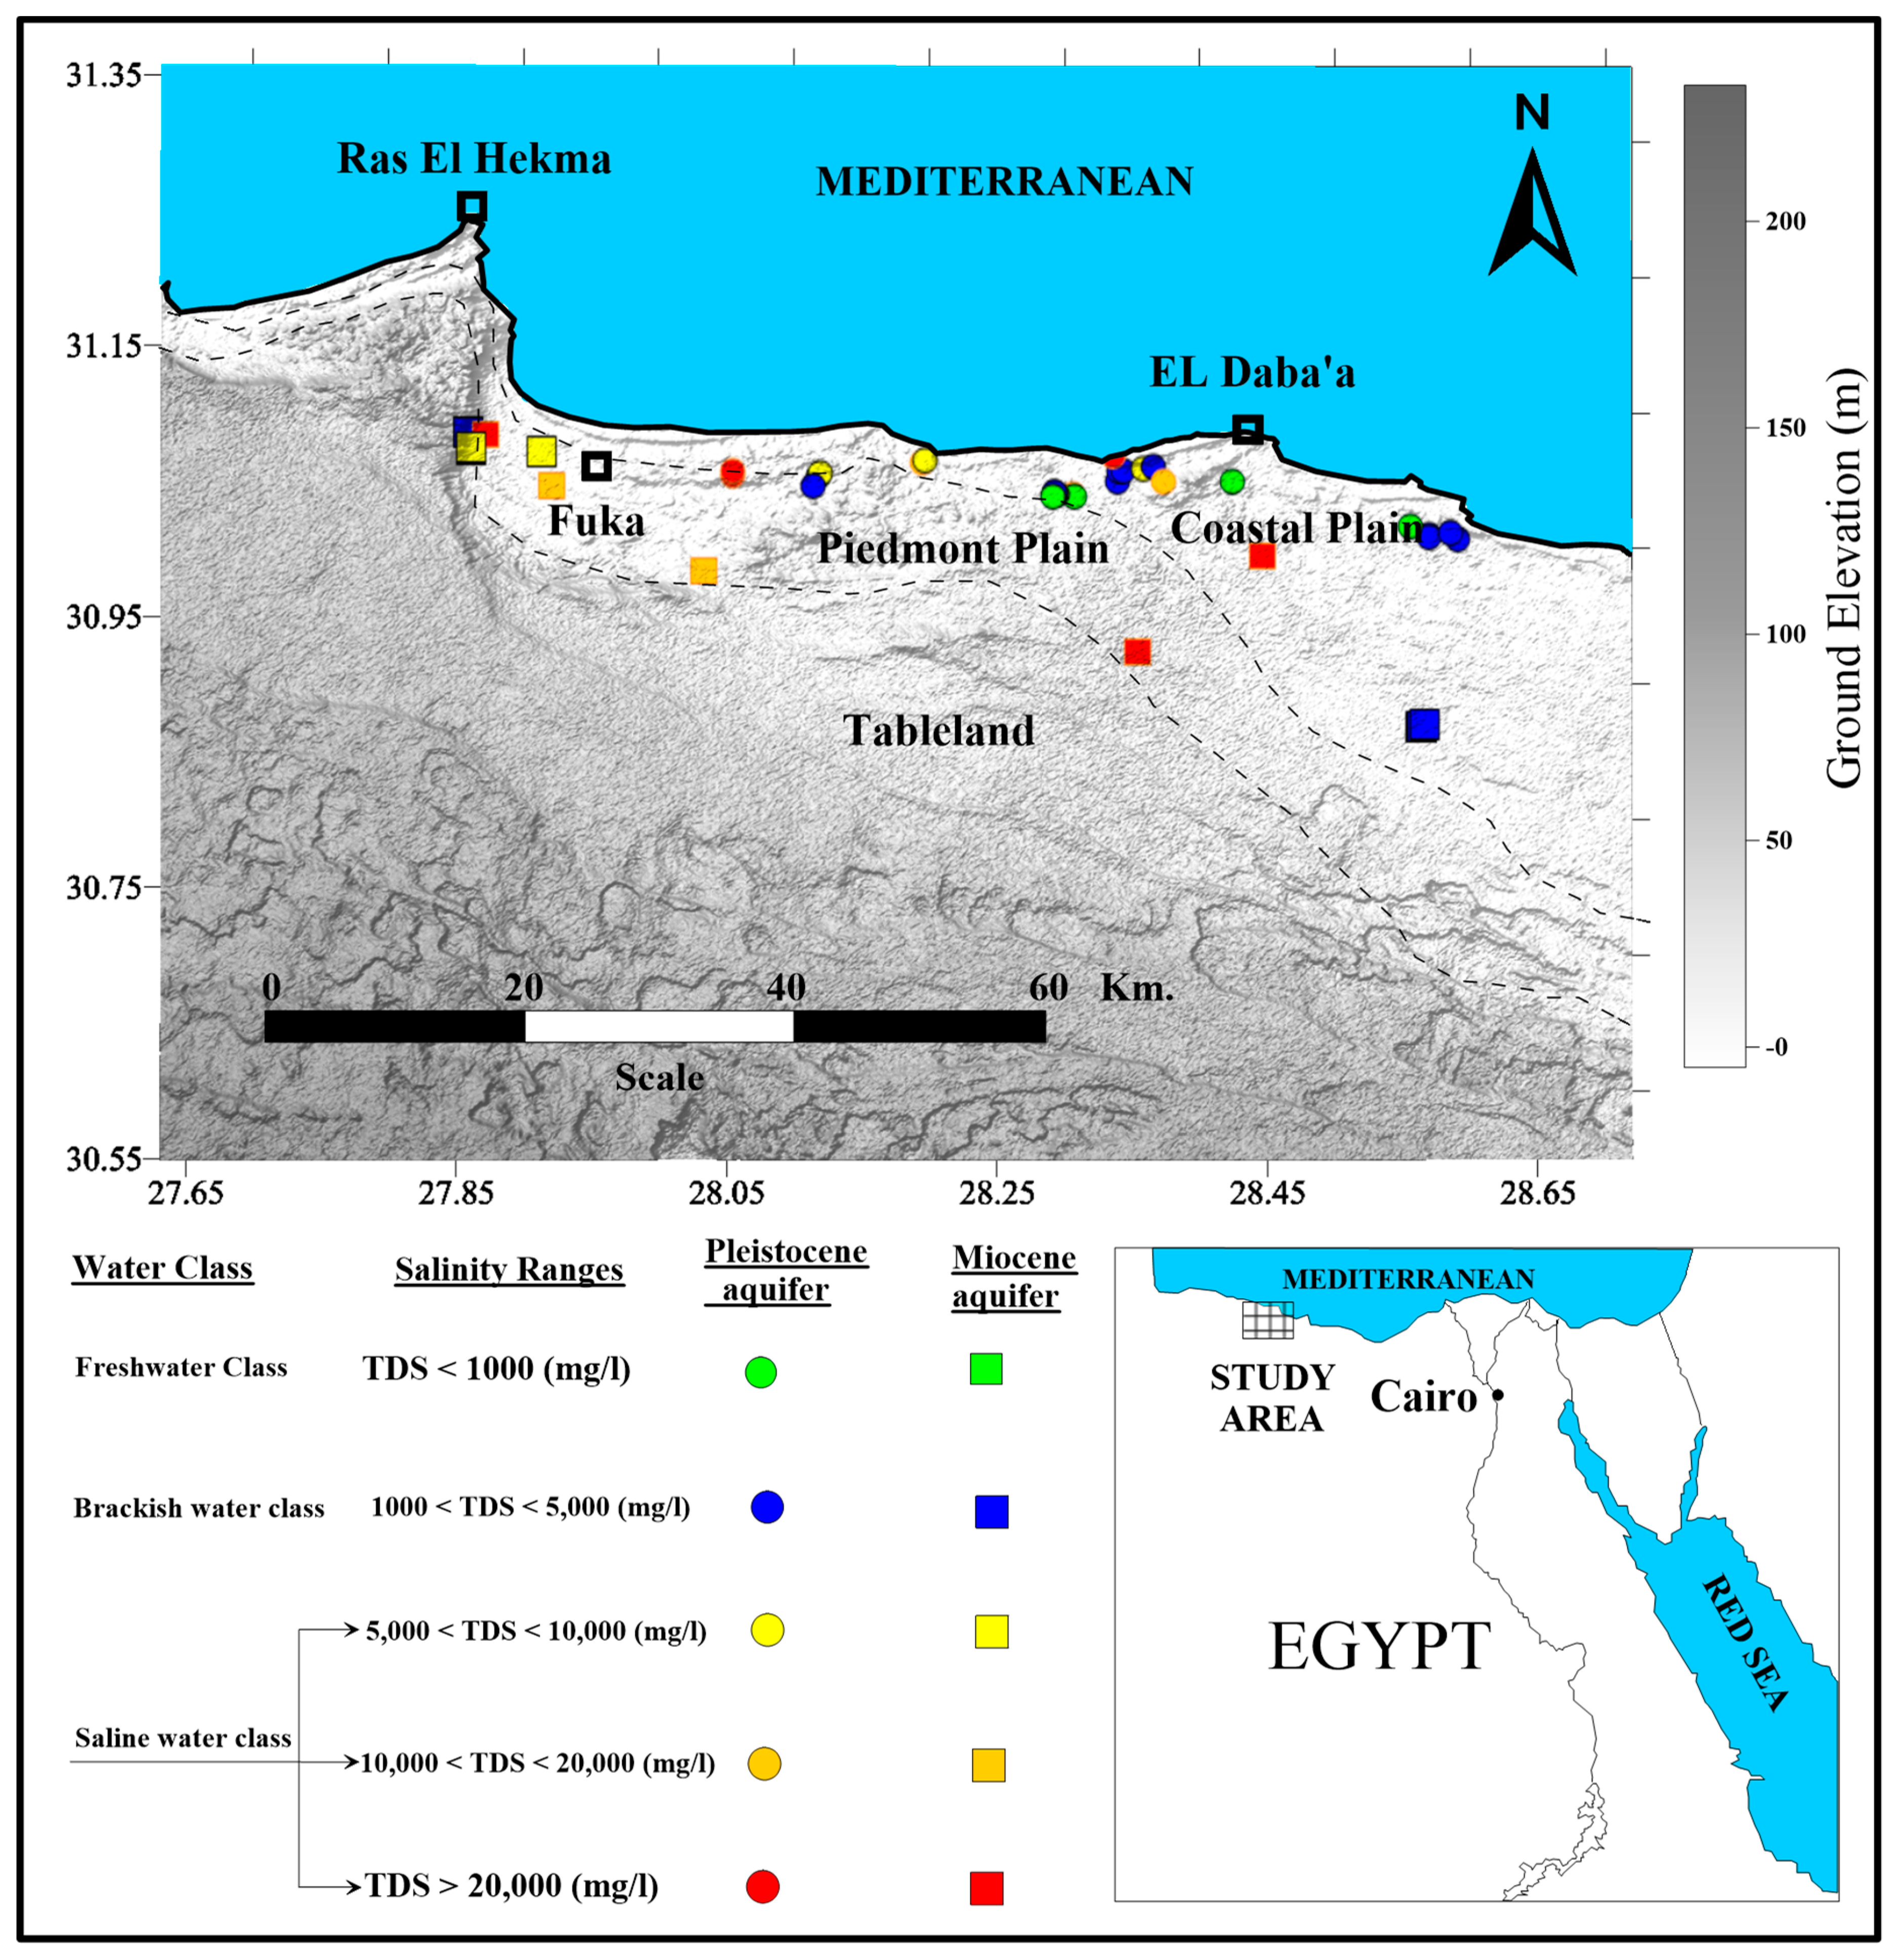
2.1. Study Area
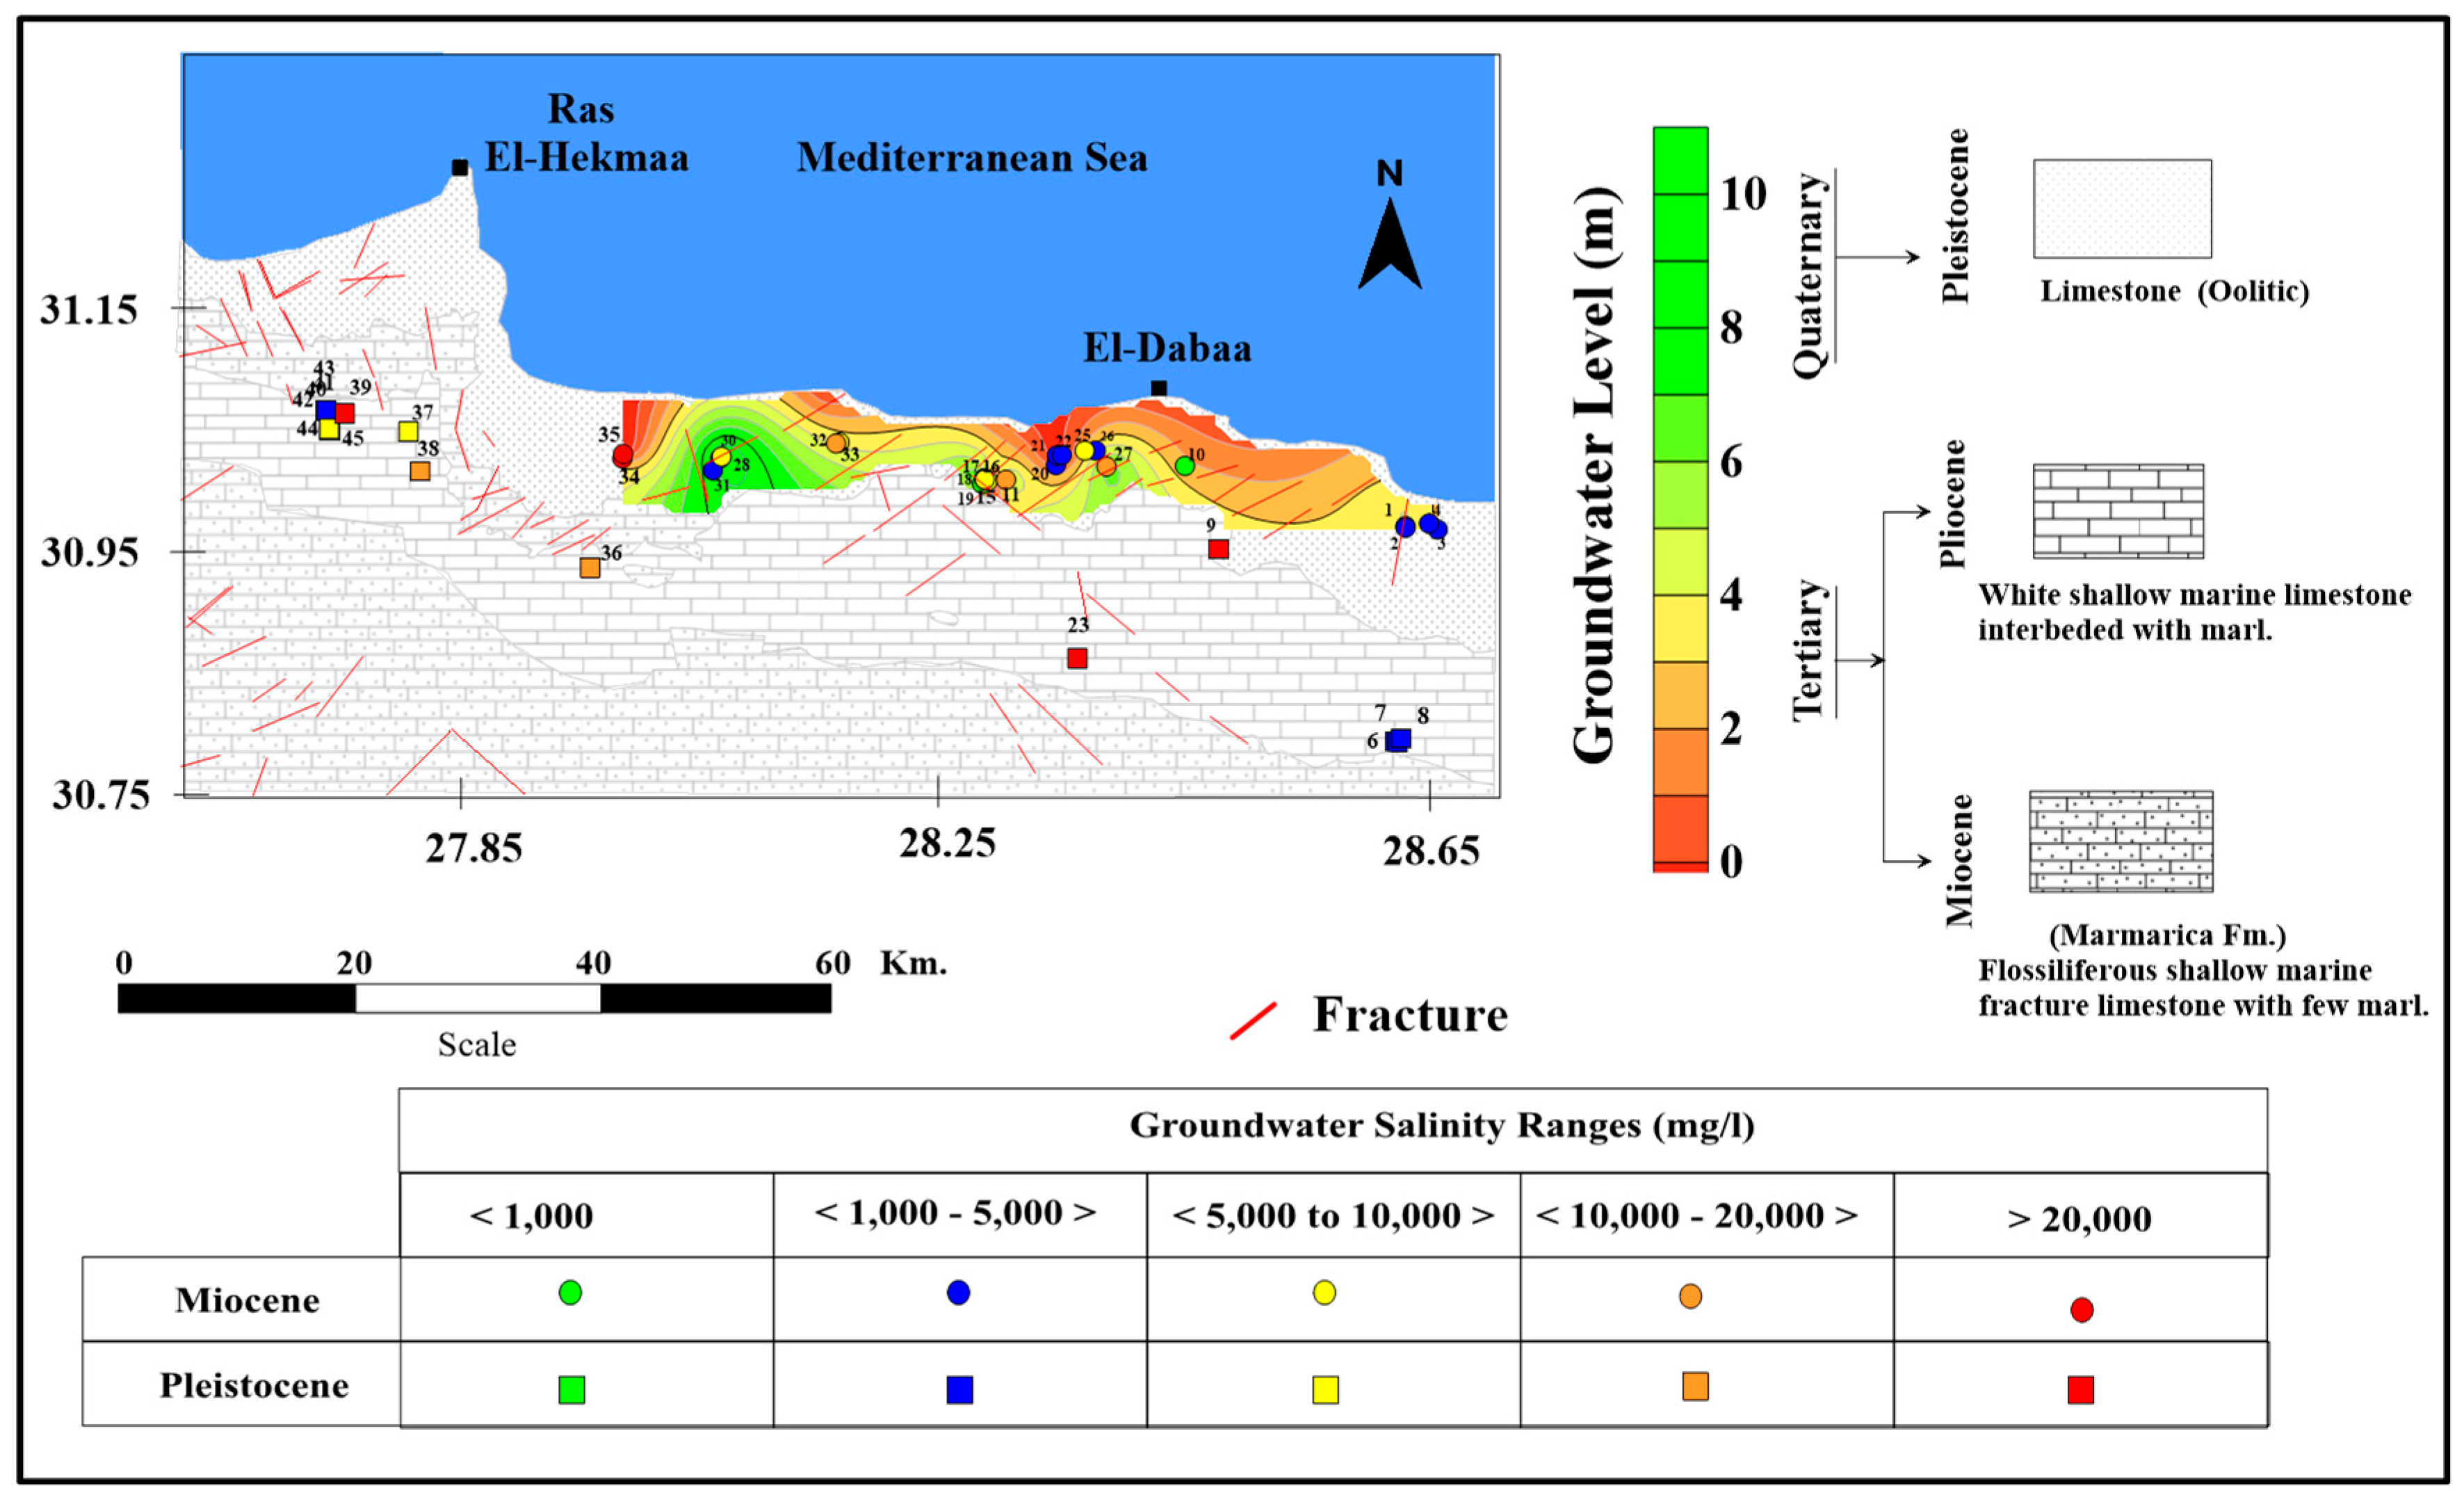
2.2. Geology, Geomorphology and Hydrogeology
3. Methods
4. Results and Discussion
4.1. Groundwater Chemistry
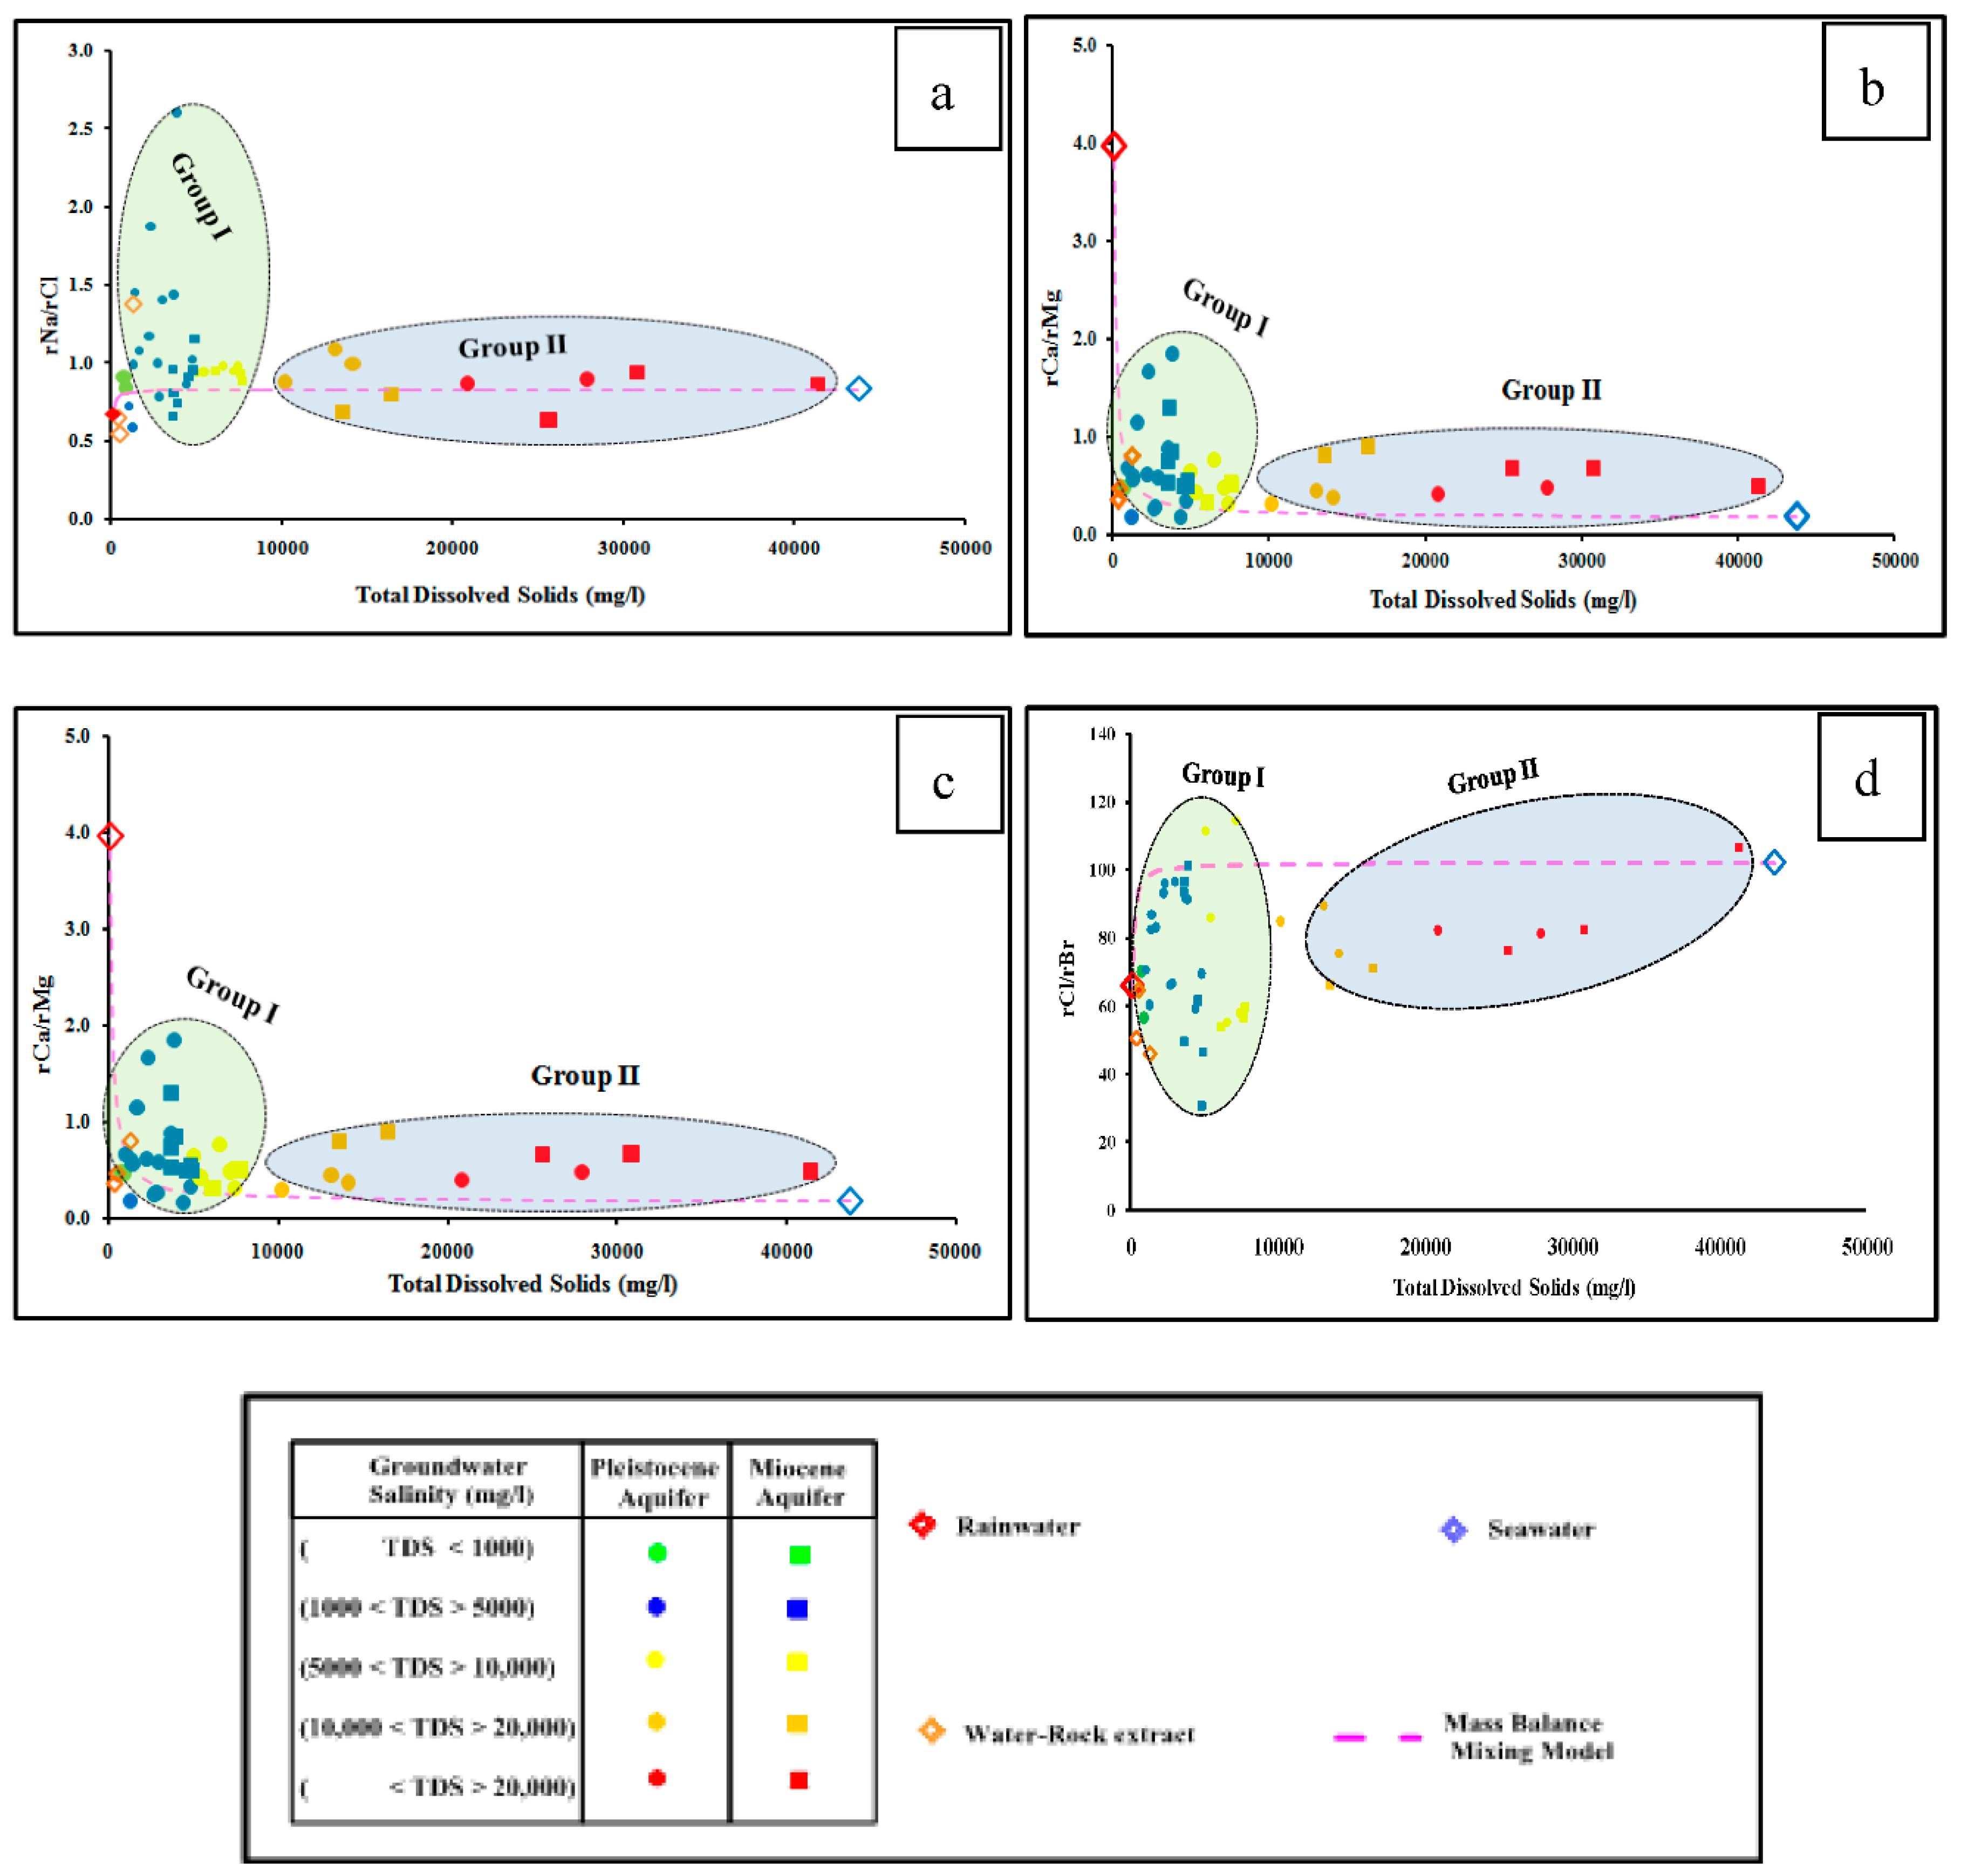
4.2. Ion Chemical Ratios
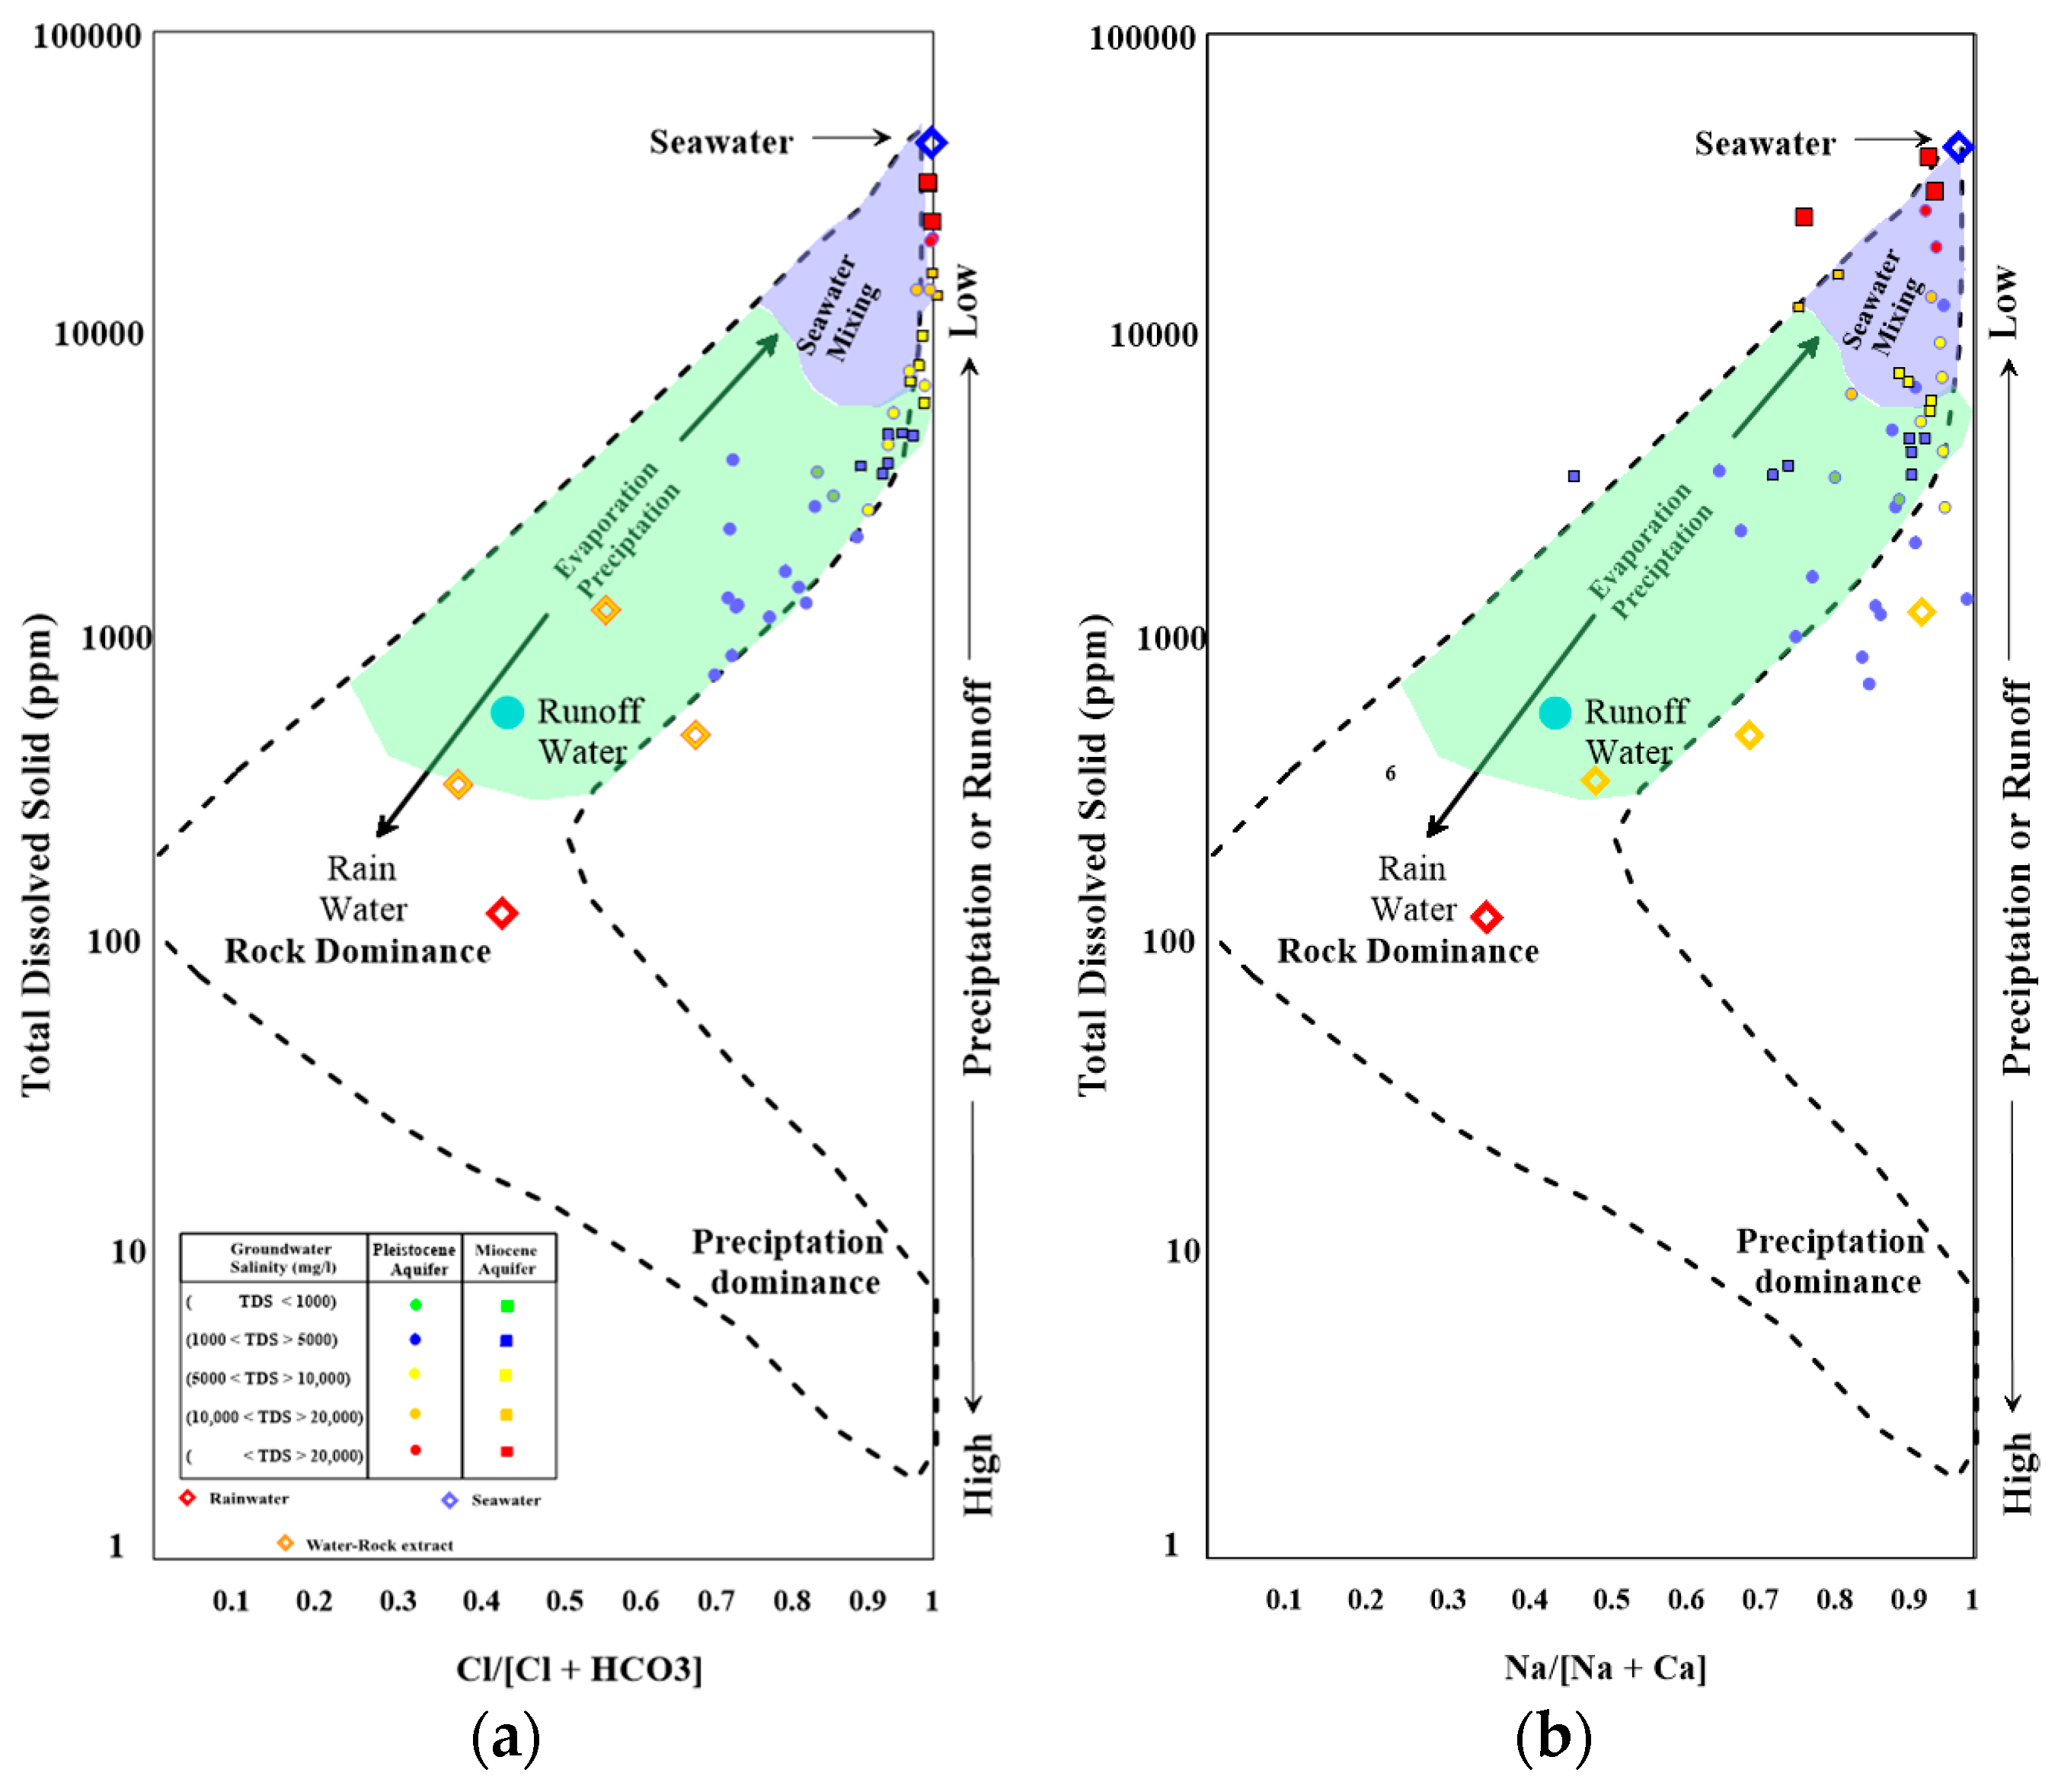
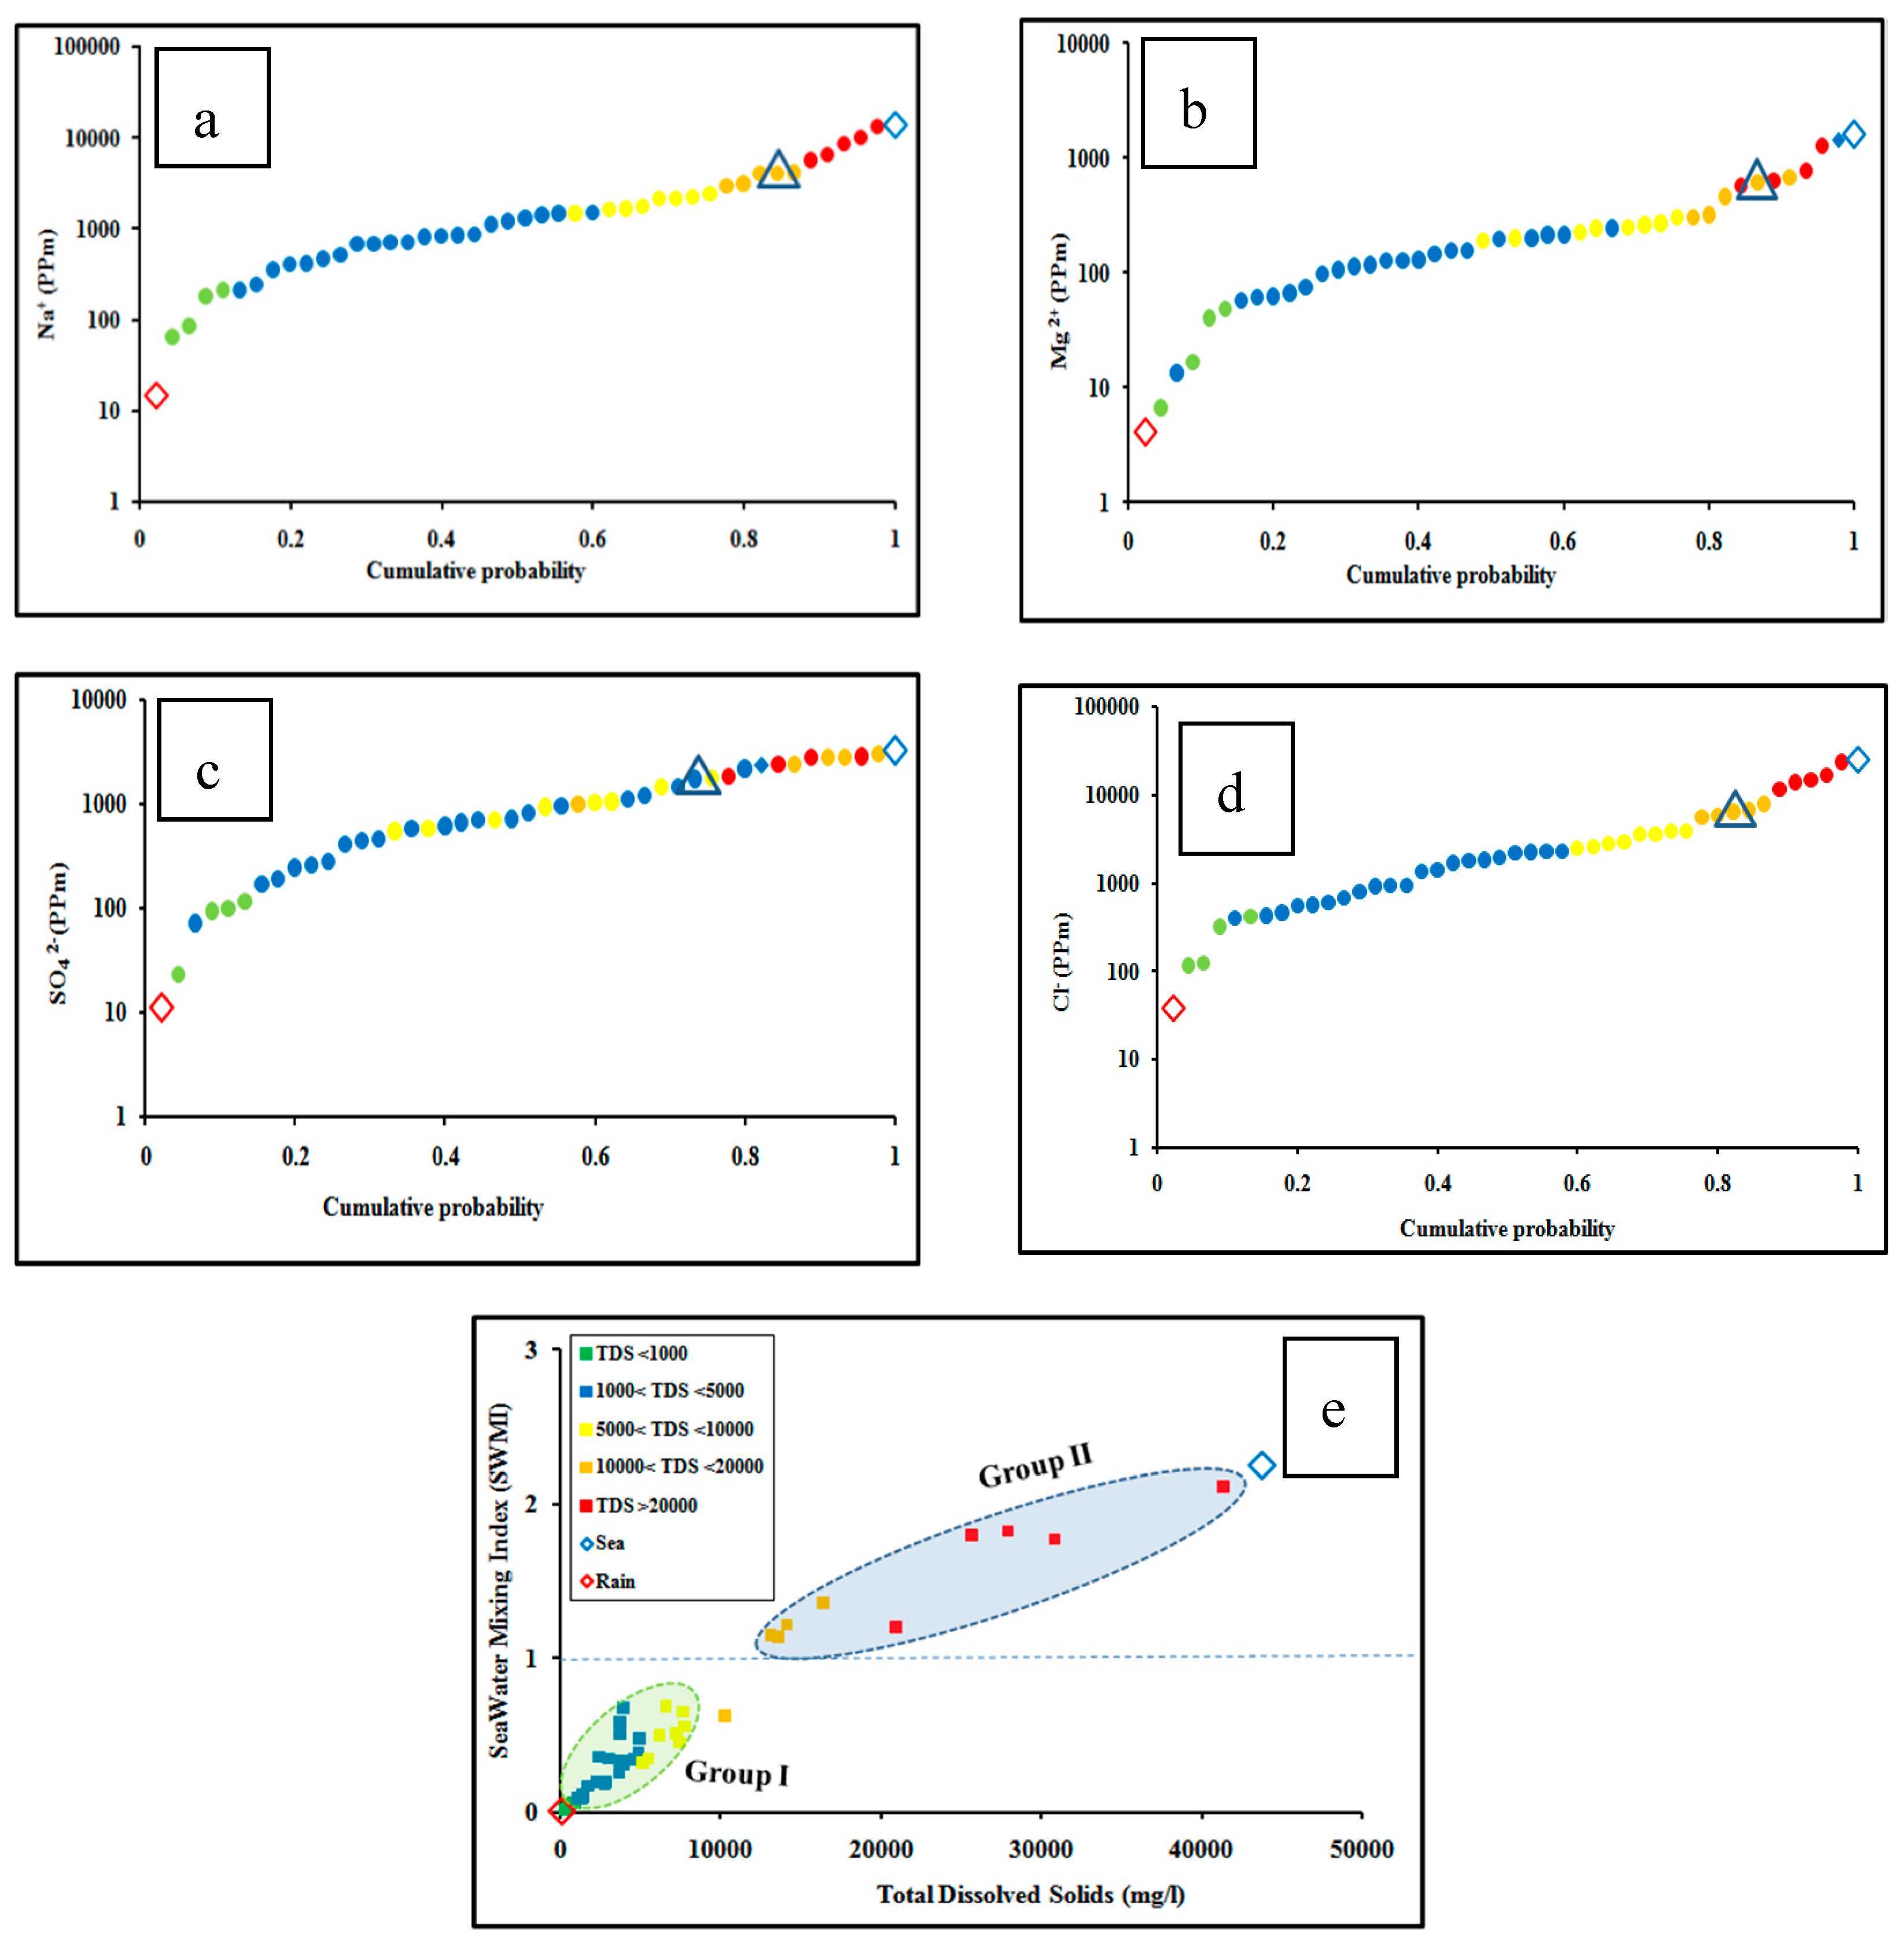
4.3. Seawater Mixing
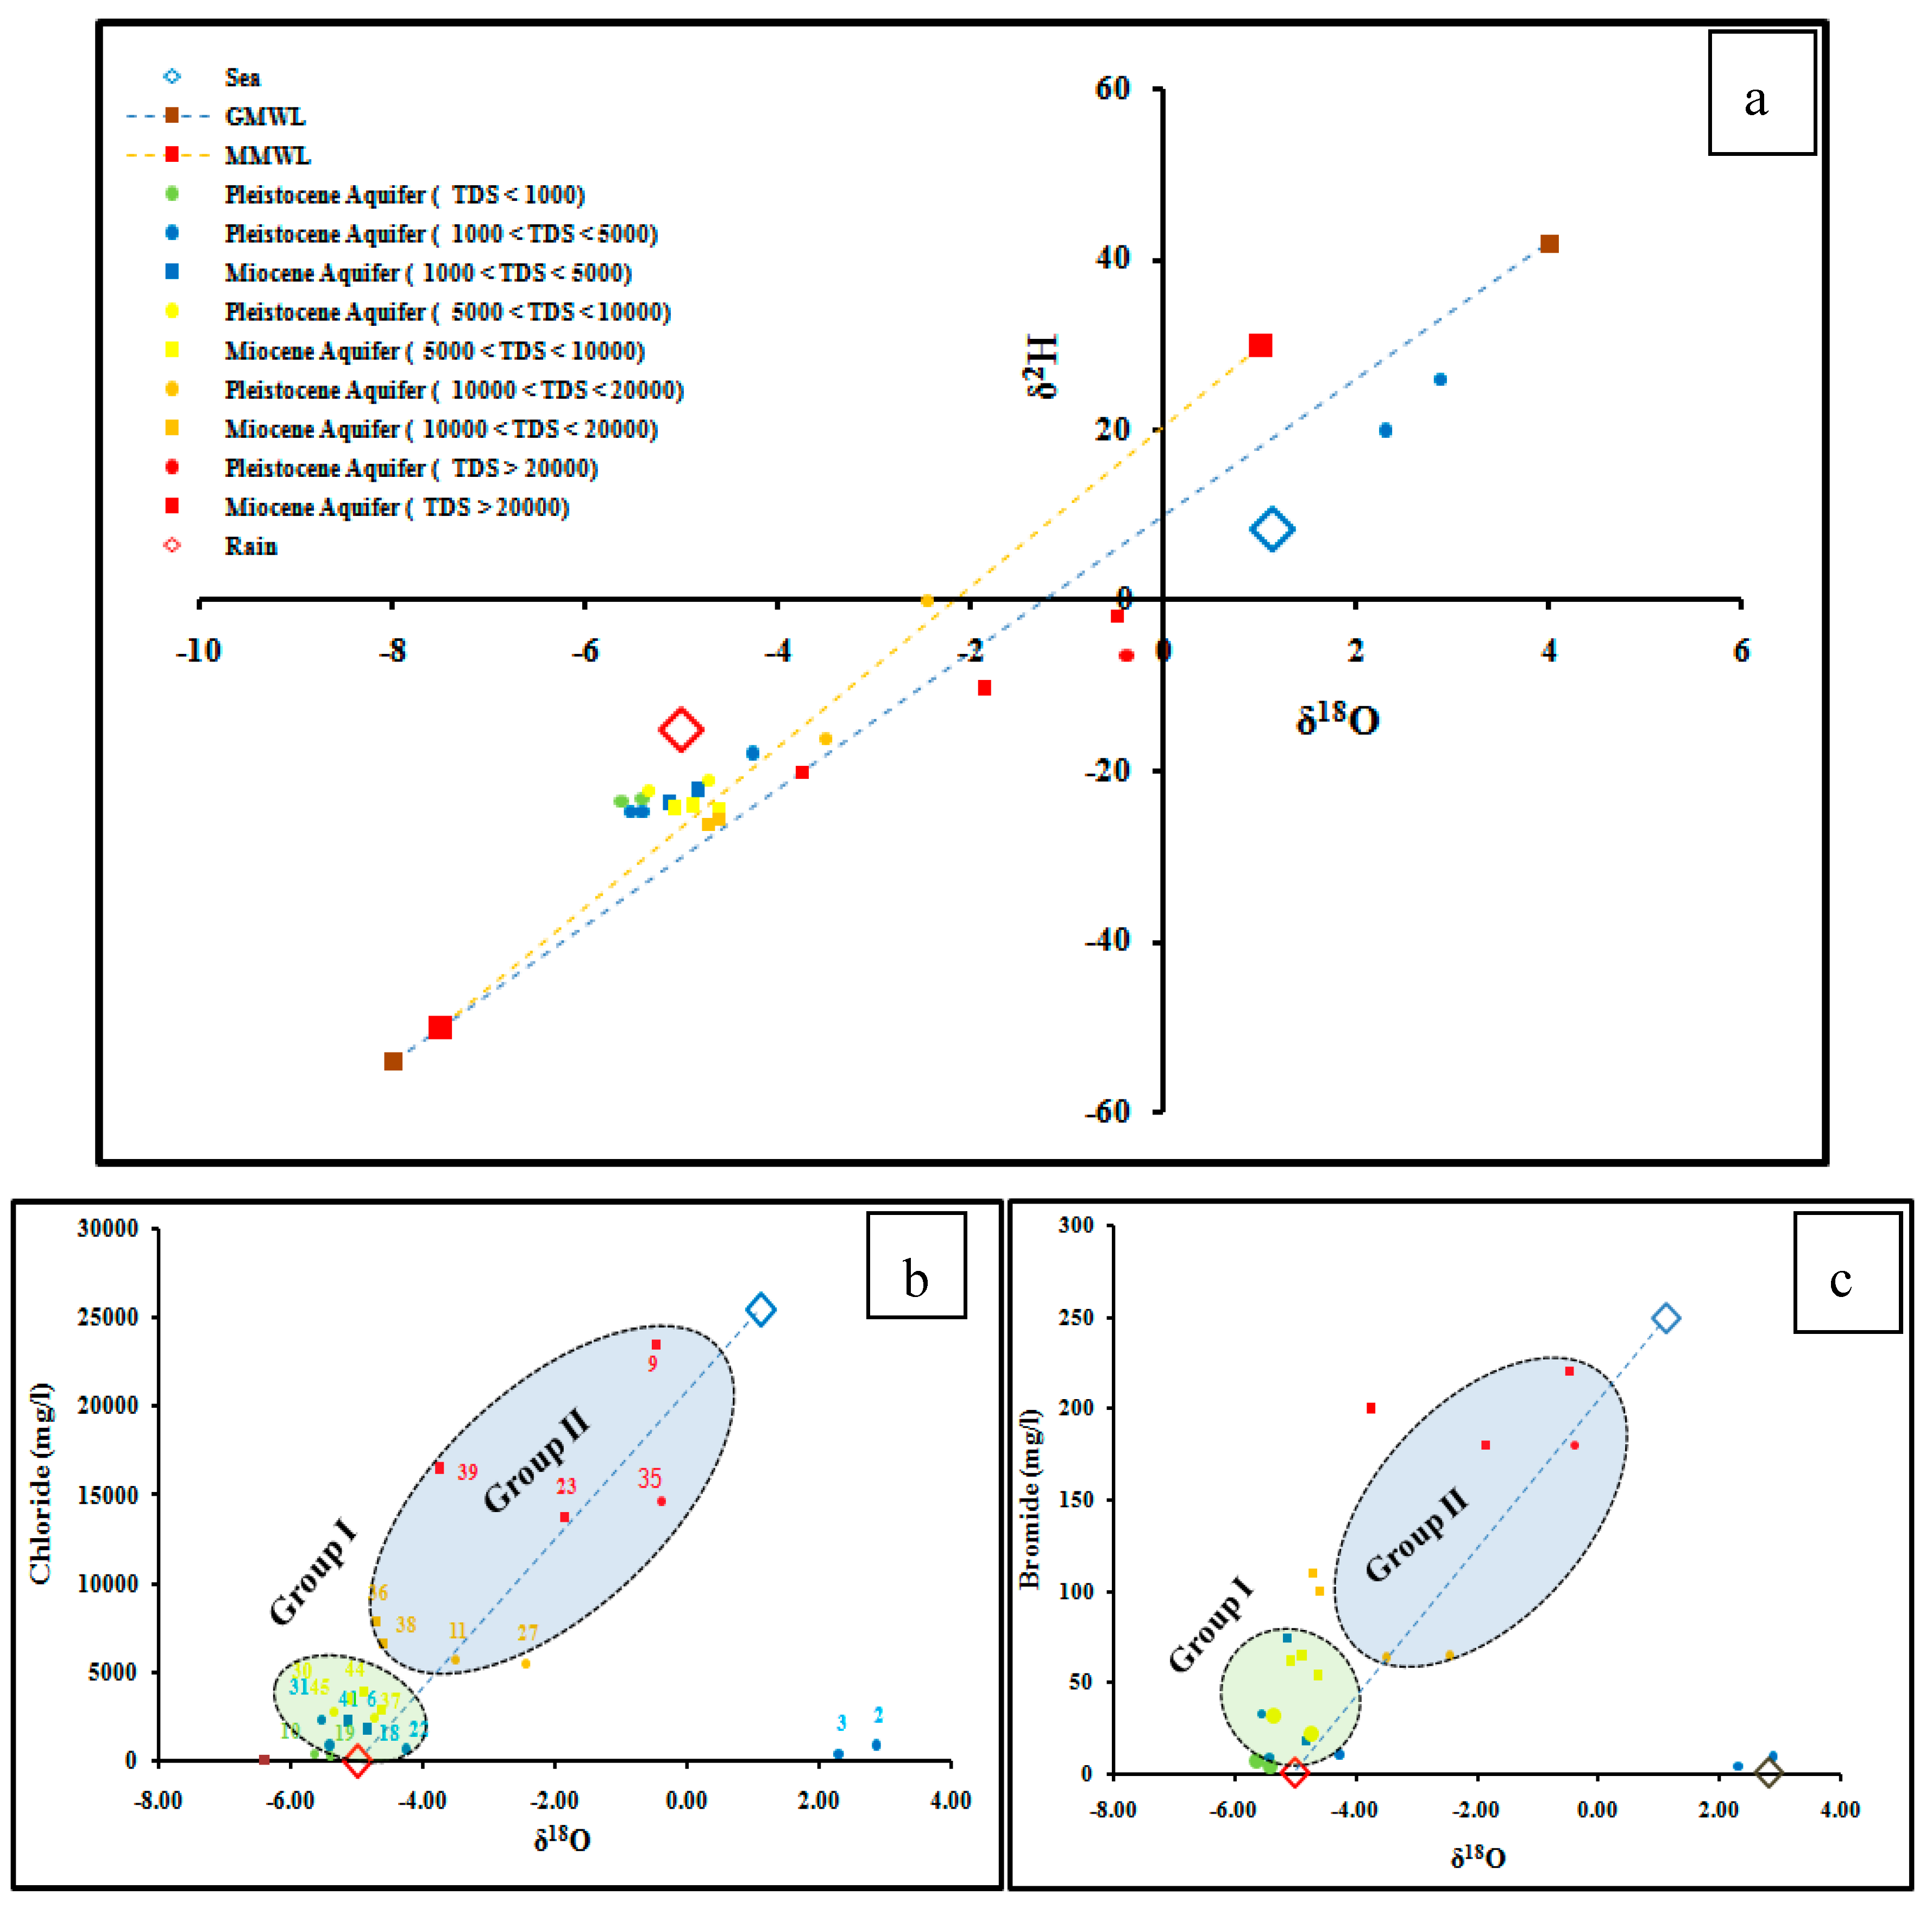
4.4. Environmental Isotopes
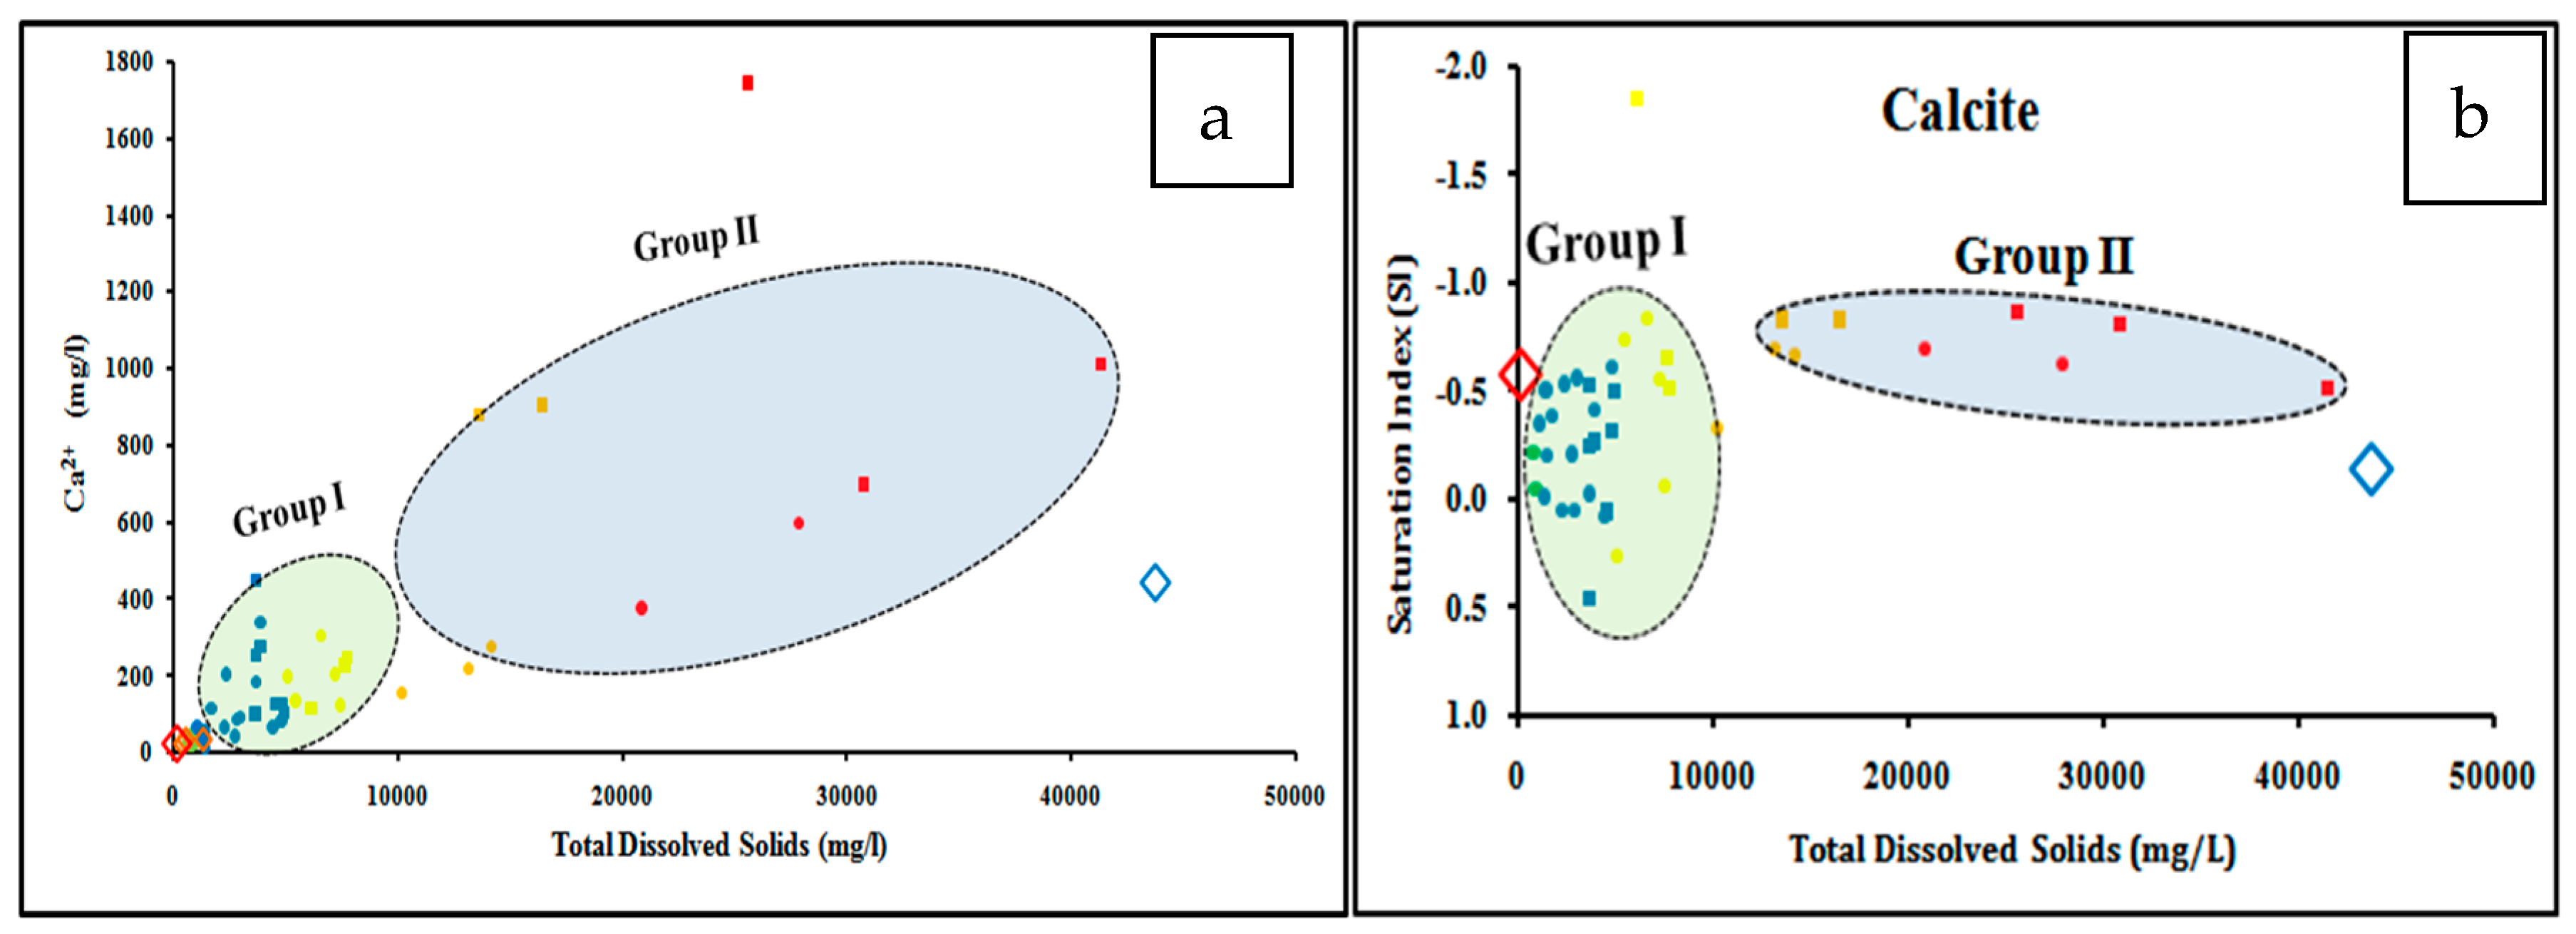
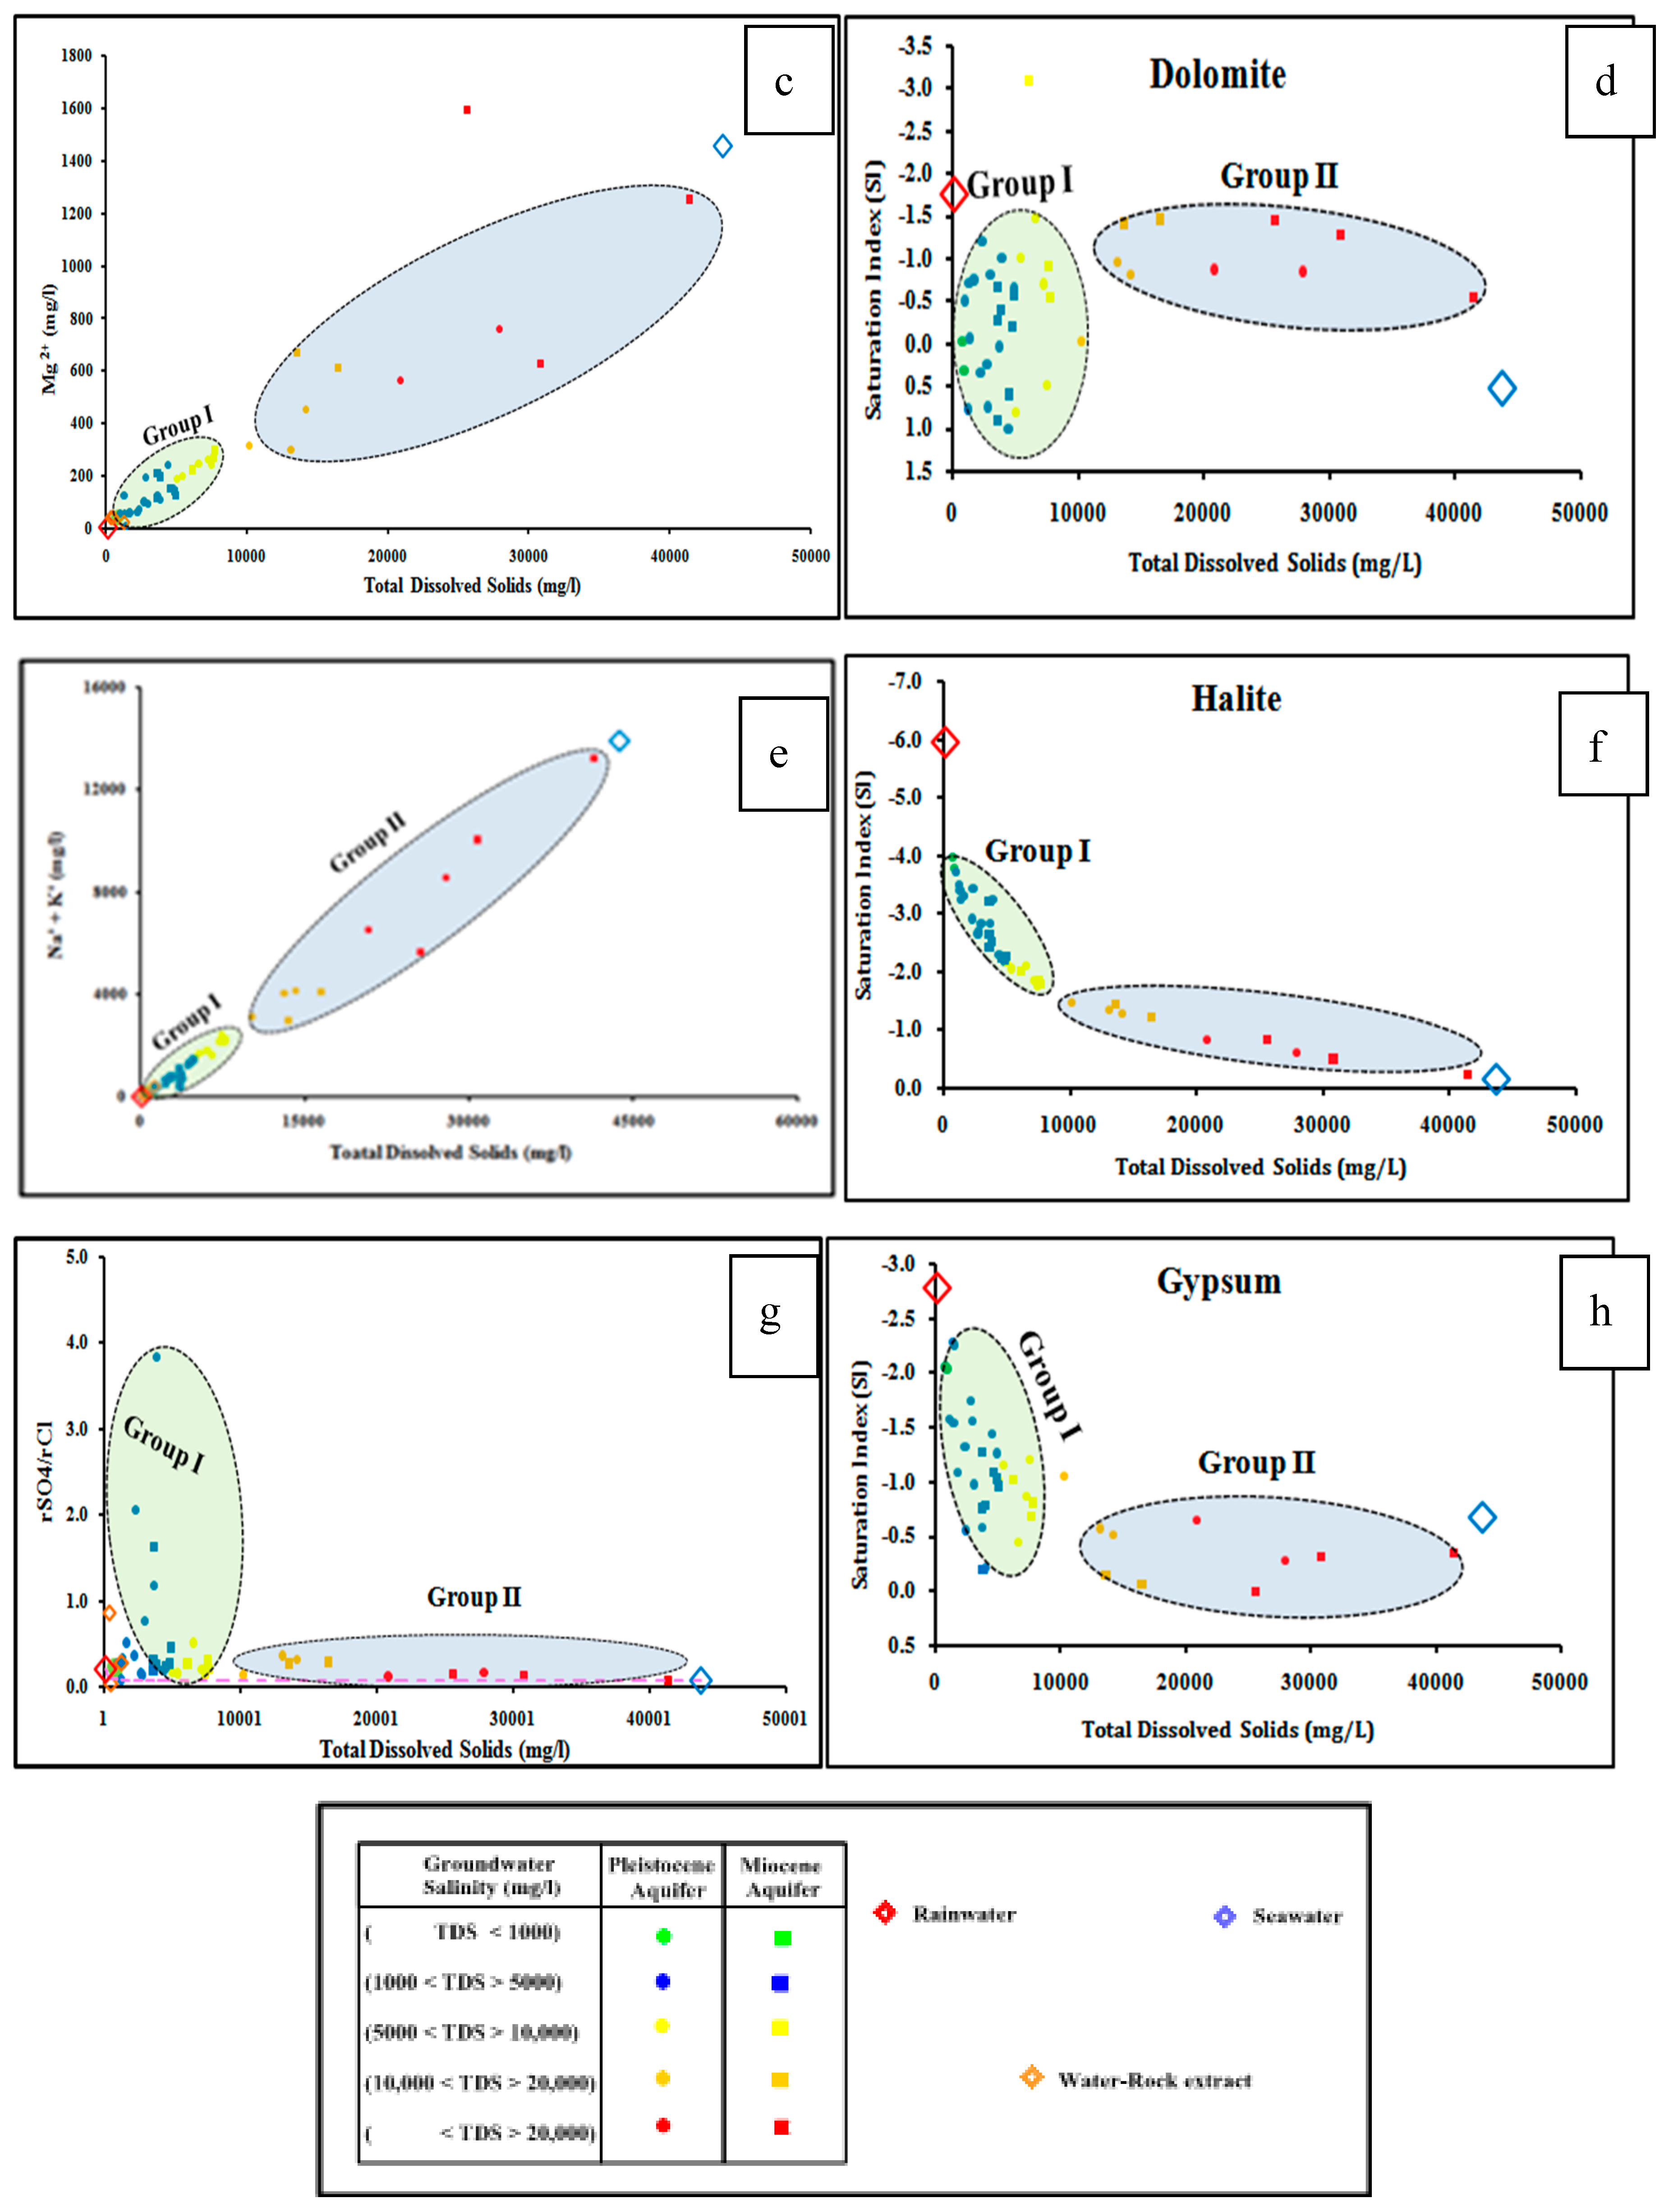
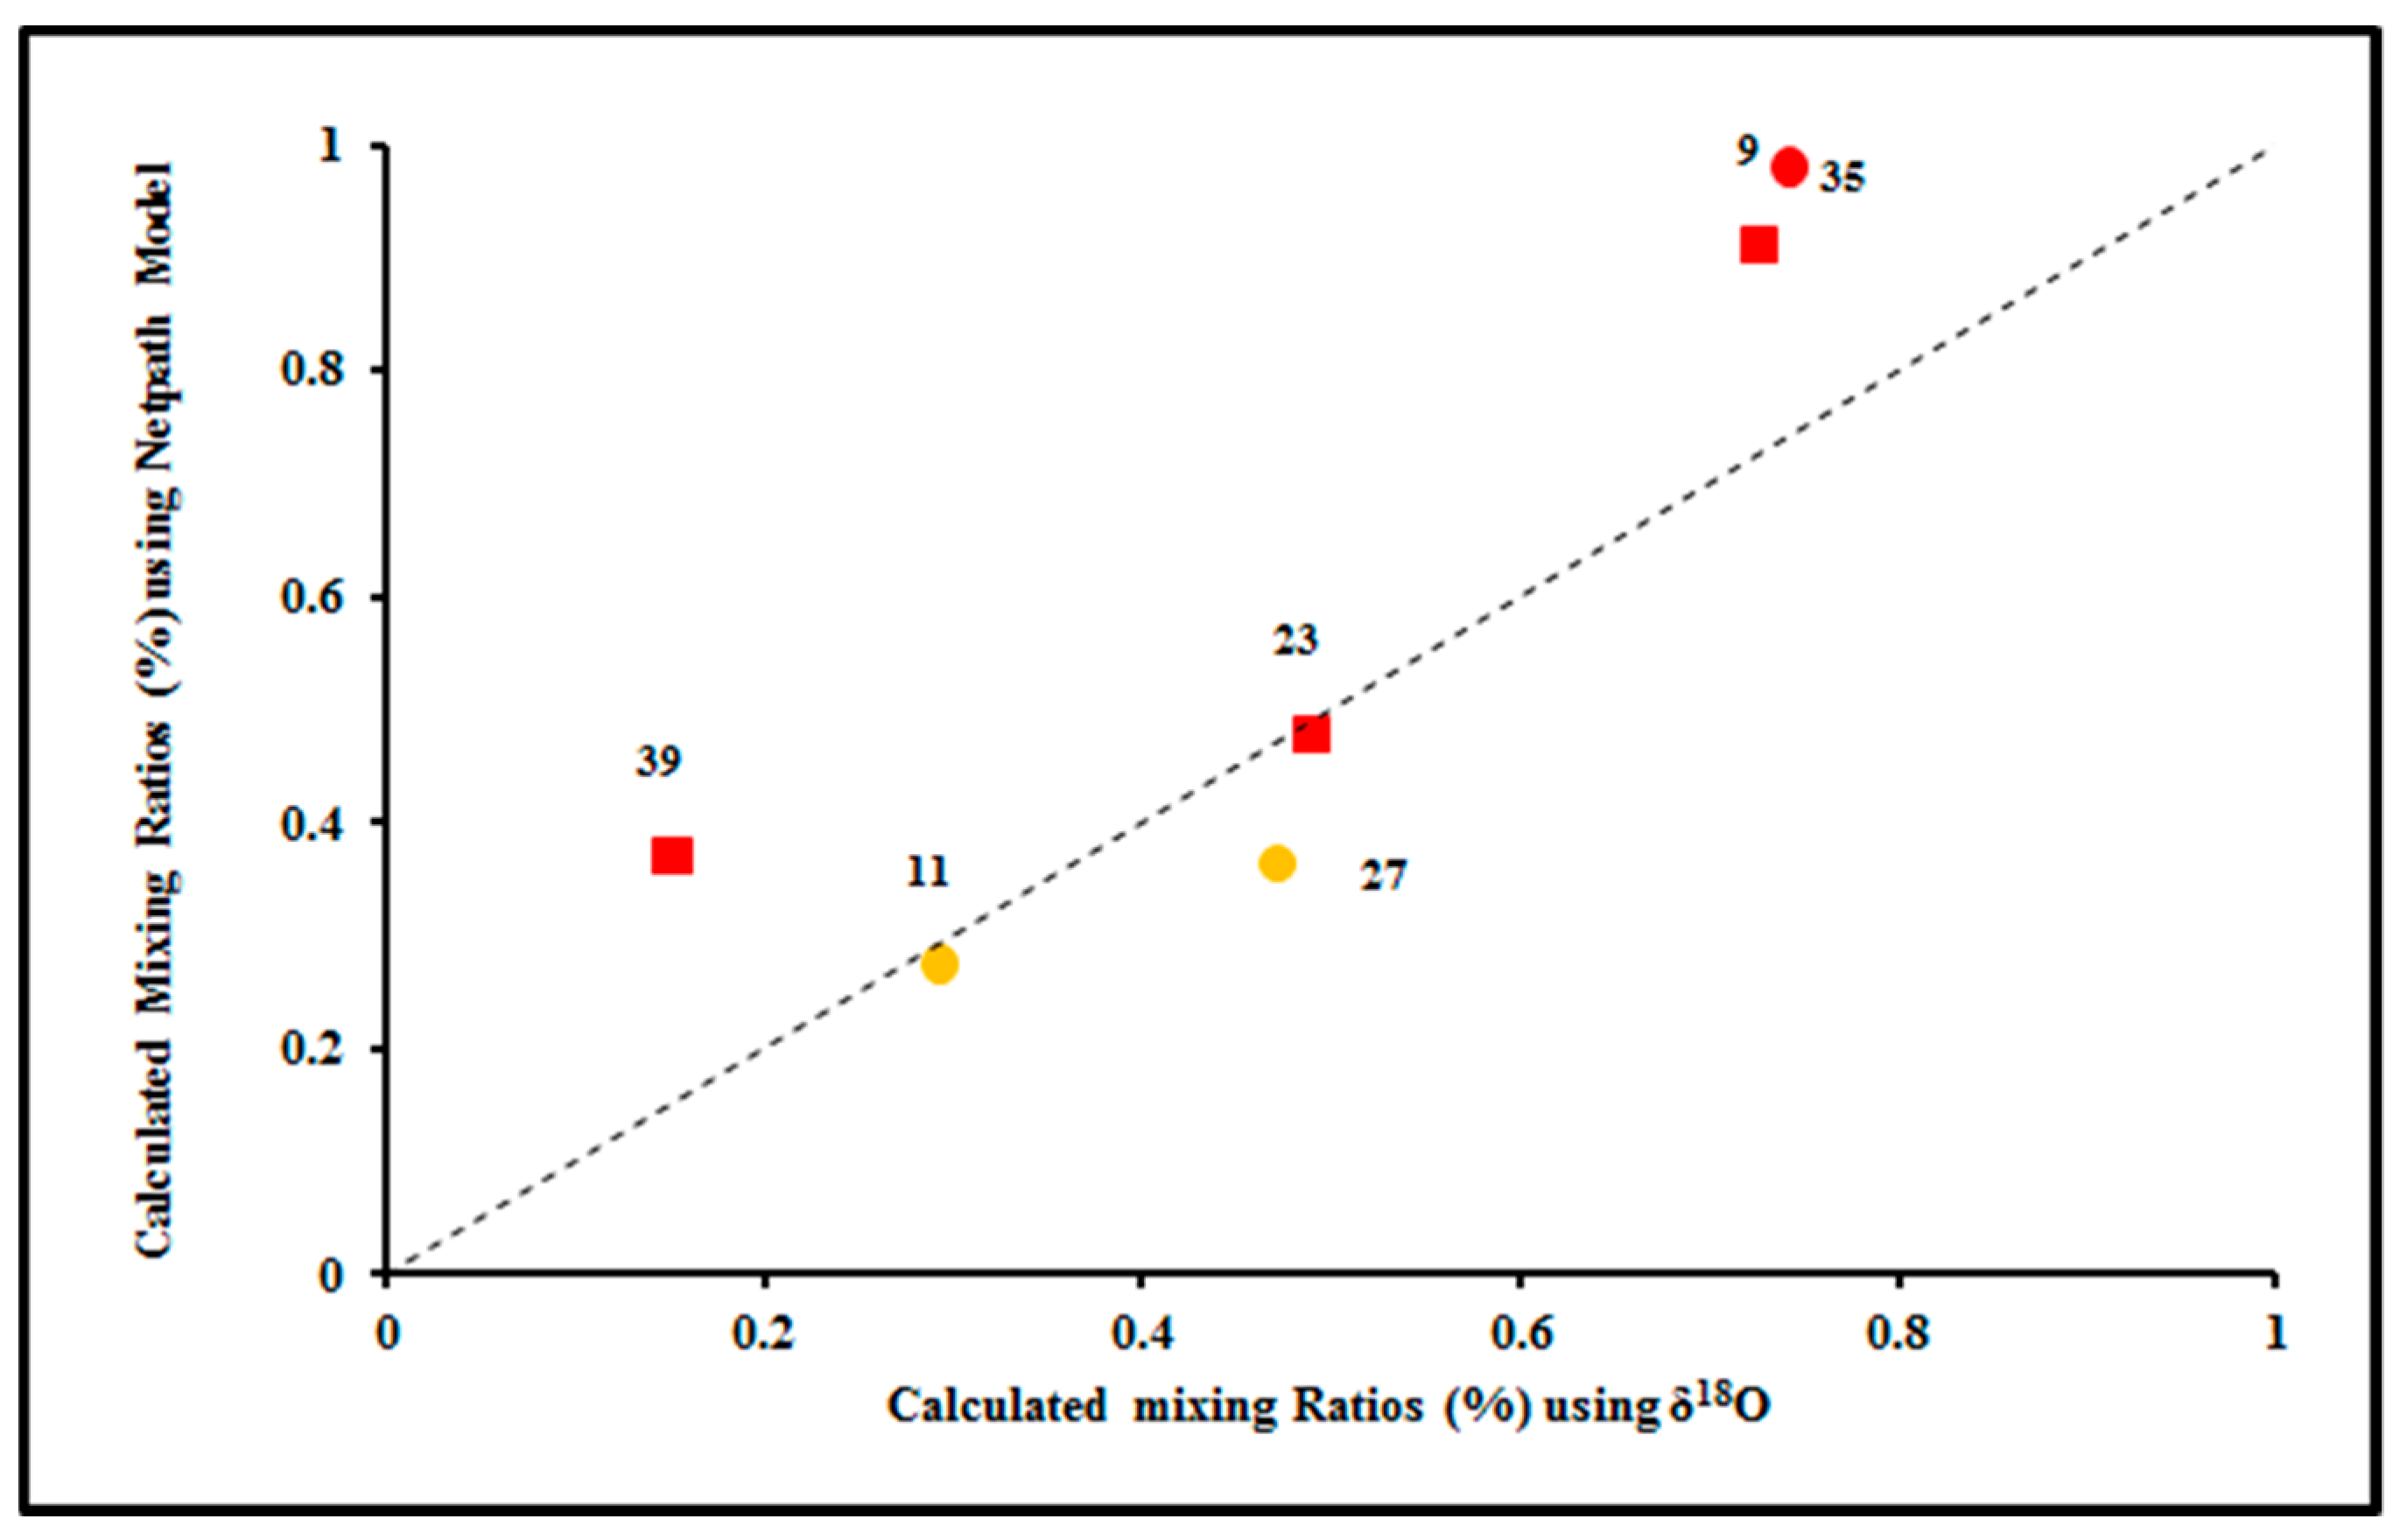
4.5. Water–Rock Interaction and Mixing Model
5. Conclusions
Author Contributions
Acknowledgments
Conflicts of Interest
References
- Mohallel, S.A. Hydrochemistry and Treatment of Groundwater in the Area between Marsa Matruh and El Salloum, Egypt. Master’s Thesis, Al-Azhar University, Cairo, Egypt, 2009. [Google Scholar]
- Aureli, A.; Ganoulis, J.; Margat, J. Groundwater Resources in the Mediterranean Region: Importance, Uses and Sharing; UNESCO International Hydrological Programme (IHP): Paris, France, 2008; pp. 96–105. [Google Scholar]
- Nicod, J. Sur quelques sources littoraleset sous-marines autour de laMéditerranée. Et. Géogr. Phys. 2009, XXXVI, 3–23. [Google Scholar]
- Hammad, F.A. The Geology of Water Supplies in Ras El Hekma Area, Western Mediterranean Coastal Zone, Egypt. Master’s Thesis, Cairo University, Giza, Egypt, 1966. [Google Scholar]
- Eissa, M.; Shouakar-Stash, O.; Parker, B.; De Dreuzy, J. Managing saltwater intrusion in a poorly-constrained arid aquifer, utilizing isotopes and geochemistry, Northwestern coast. Egypt (abstract). Geol. Soc. Am. Abstr. Programs 2015, 47, 324. [Google Scholar]
- El-Shiekh, A.E.; Eissa, M.A.; Mahmoud, H.H. Study the phenomenon of sea water intrusion and its impact on the groundwater of the Quaternary aquifer in Delta Wadi Heneash, Northwestern Coast, Egypt. In Proceedings of the 32nd Anual Meeting Program, Cairo, Egypt, 21 March 2017. [Google Scholar]
- Walton, W.C. Groundwater Resources Evaluation; McGraw Hill Book Co.: New York, NY, USA, 1970. [Google Scholar]
- Magesh, N.S.; Chandrasekar, N. Evaluation of spatial variations in groundwater quality by WQI and GIS technique: A case study of Virudunagar District, Tamil Nadu. India. Arab. J. Geosci. 2011, 6, 1883–1898. [Google Scholar] [CrossRef]
- Prasanth, S.V.; Magesh, N.S.; Jitheshlal, K.V.; Chandrasekar, N.; Gangadhar, K. Evaluation of groundwater quality and its suitability for drinking and agricultural use in the coastal stretch of Alappuzha District, Kerala, India. Appl. Water Sci. 2012, 2, 165–175. [Google Scholar] [CrossRef] [Green Version]
- Skrzypek, G.; Dogramaci, S.; Grierson, P.F. Geochemical and hydrological processes controlling groundwater salinity of a large inland wetland of northwest Australia. Chem. Geol. 2013, 357, 164–177. [Google Scholar] [CrossRef]
- Edmunds, W.M. Renewable and non-renewable groundwater in semi-arid and arid regions. Dev. Water Sci. 2003, 50, 265–280. [Google Scholar]
- Vengosh, A.; Kloppmann, W.; Marie, A.; Livshitz, Y.; Gutierrez, A.; Bana, M.; Guerrot, C.; Pankratov, I.; Ranan, H. Sources of salinity and boron in Gaza Strip: Natural contaminant flow in southern Mediterranean Coastal aquifer. Water Resour. Res. 2005, 41, W01013. [Google Scholar] [CrossRef]
- Bennetts, D.A.; Webb, J.A.; Stone, D.J.M.; Hill, D.M. Understanding the salinization process for groundwater in an area of south-eastern Australia, using hydrochemical and isotopic evidence. J. Hydrol. 2006, 323, 178–192. [Google Scholar] [CrossRef]
- Eissa, M.; Parker, B.; Shouakar-Stash, O.; Hosni, M.H.; El Shiekh, A. Electrical resistivity tomography, geochemistry and isotope tracers for saltwater intrusion characterization along the Northwestern coast. Egypt. Geol. Soc. Am. Abstr. Programs 2015, 47, 486. [Google Scholar]
- Aquilina, L.; Ladouche, B.; Doerfliger, N.; Seidel, J.L.; Bakalowicz, M.; Dupuy, C.; LeStrat, P. Origin, evolution and residence time of saline thermal fluids (Balaruc springs, southern France): Implications for fluid transfer across thecontinental shelf. Chem. Geol. 2002, 192, 1–21. [Google Scholar] [CrossRef]
- Wang, Y.; Guo, Q. Strontium isotope characterization and major iongeochemistry of karst water flow, Shentou, northern China. J. Hydrol. 2006, 328, 592–603. [Google Scholar] [CrossRef]
- Plummer, L.N.; Prestemon, E.C.; Parkhurst, D.L. NETPATH: An interactive code for interpreting NET geochemical reactions from chemical and isotopic data along a flow. In Proceedings of the International 7th Symposium on Water-Rock Interaction, Park City, UT, USA, 9–23 July 1992; pp. 239–242. [Google Scholar]
- Yousif, M.; Geldern, R.V.; Bubenzer, O. Hydrogeological investigation of shallow aquifers in an arid data-scarce coastal region (El Daba’a, northwestern Egypt). J. Hydrogeol. 2016, 24, 159–179. [Google Scholar] [CrossRef]
- Hammad, F.A. The Geology of Soil and Water Resources in the Area between Ras El-Hekma and RasAlam El-Rum, Western Mediterranean Coastal Zone, Egypt. Ph.D. Thesis, Cairo University, Giza, Egypt, 1972. [Google Scholar]
- Zaki, M.H. Assessment of Surface Water Runoff in Marsa Matruh Area, Northwestern Coastal Zone, A.R.E. Ph.D. Thesis, Alexandria University, Alexandria, Egypt, 2000. [Google Scholar]
- Rizk, Z.S. Geological and Hydrogeological Studies on the North Western Coast of Egypt. Master’s Thesis, Menoufia University, Al Minufya, Egypt, 1982; p. 93. [Google Scholar]
- Atwa, S.M. Hydrogeology and Hydrogeochemistry of the Northwestern Coast of Egypt. Ph.D. Thesis, Alexandria University, Alexandria, Egypt, 1979. [Google Scholar]
- Eissa, M.; Mahmoud, H.H.; Shouakar-Stash, O.; El-Shiekh, A.; Parker, B. Geophysical and geochemical studies to delineate seawater intrusion in Bagoush area, Northwestern coast, Egypt. J. Afr. Earth Sci. 2016, 121, 365–381. [Google Scholar] [CrossRef]
- Paver, G.L.; Pretorius, D.A. Report on reconnaissance hydrogeological investigation in the western desert coastal zone. Publ. Inst. Desert Egypt 1954, 5, 145. [Google Scholar]
- Eissa, M. Application of Multi-Isotopes and Geochemical Modeling for Delineating Recharge and Salinization Sources in Dahab Basin Aquifers (South Sinai, Egypt). Hydrology 2018, 5, 41. [Google Scholar] [CrossRef]
- Raslan, S.M. Geomorphological and Hydrogeological Studies on Some Localities along the Northwestern Coast of Egypt. Master’s Thesis, Menoufia University, Al Minufya, Egypt, 1995. [Google Scholar]
- Omar, G.A. Hydrochemistry of the Groundwater in the Area between El Dabaa and Mersa Matruh, North Western Coast, Egypt. Master’s Thesis, Menoufia University, Al Minufya, Egypt, 2008. [Google Scholar]
- Morad, N.A.; Masoud, M.H.; Abdel Moghith, S.M. Hydrologic Factors Controlling groundwater salinity in North Western coastal zone, Egypt. J. Earth Syst. Sci. 2014, 123, 1567–1578. [Google Scholar] [CrossRef]
- Saleh, E. Hydrogeological, Geomorphological and Geoenvironmental Implications for Future Sustainable Development of the Northwestern Coastal Zone of Egypt. Ph.D. Thesis, Mansoura University, Mansoura, Egypt, 2000. [Google Scholar]
- Rainwater, F.H.; Thatcher, L.L. Methods for Collection and Analysis of Water Samples; Paper No. 1454; U.S. Geological Survey: Washington, DC, USA, 1960; p. 301.
- Fishman, M.J.; Friedman, L.C. Methods for Determination of Inorganic Substances in Water and Fluvial Sediments; Open-File Report, 85–495; U.S. Geological Survey: Denver, CO, USA, 1985; Chapter A1; Volume 5.
- Hem, J.D. Study and Interpretation of Chemical Characteristics of Natural Water, 3rd ed.; Paper 1473; U.S. Geological Survey Water Supply: Washington, DC, USA, 1989; p. 2254.
- ASTM (American Society for Testing and Materials). Annual Book of ASTM Standards; ASTM: Baltimore, MD, USA, 2002; Volume 11, 939p. [Google Scholar]
- Faure, G. Principles of ISOTOPE Geology, 2nd ed.; Wiley: New York, NY, USA, 1986. [Google Scholar]
- Clark, I. Groundwater Geochemistry and Isotopes; CRC Press: Boca Raton, FL, USA, 2015. [Google Scholar]
- Mondal, N.C.; Singh, V.P. Hydrochemical analysis of salinization for a tannery belt in Southern India. J. Hydrol. 2011, 405, 235–247. [Google Scholar] [CrossRef]
- Kumar, P.J.S. Evolution of groundwater chemistry in and around Vaniyambadi Industrial Area: Differentiating the natural and anthropogenic sources of contamination. Chem. Erde-Geochem. 2014, 74, 641–651. [Google Scholar] [CrossRef]
- Isawi, H.; El-Sayed, M.H.; Eissa, M.; Shouakar-Stash, O.; Shawky, H.; Abdel Mottaleb, M.S. Integrated geochemistry, isotopes, and geostatistical techniques to investigate groundwater sources and salinization origin in the Sharm EL-Shiekh Area, South Sinia, Egypt. Water Air Soil Pollut. 2016, 227, 151. [Google Scholar] [CrossRef]
- Park, S.C.; Yun, S.T.; Chae, G.T.; Yoo, I.S.; Shin, K.S.; Heo, C.H.; Lee, S.K. Regional hydrochemical study on salinization of coastal aquifers, the western coastal area of South Korea. J. Hydrol. 2005, 313, 182–194. [Google Scholar] [CrossRef]
- Coplen, T.B.; Wildman, J.D.; Chen, J. Improvements in the gaseous hydrogen-water equilibrium technique for hydrogen isotope ratio analysis. Anal. Chem. 1991, 63, 910–912. [Google Scholar] [CrossRef]
- Coplen, T.B. Reporting of stable hydrogen carbon and oxygen isotopic abundances. Pure Appl. Chem. 1994, 66, 273–276. [Google Scholar] [CrossRef]
- Craig, H. Isotopic variations in meteoric waters. Science 1961, 133, 1702–1703. [Google Scholar] [CrossRef] [PubMed]
- Garrels, R.; Mackenzie, F. Origin of the chemical compositions of some springs and lakes. In Equilibrium Concepts in Natural Water Systems; Ground, R.F., Ed.; American Chemical Society Publications: Washington, DC, USA, 1967. [Google Scholar]
- Chebotarev, I.I. Metamorphism of natural waters in the crust of weathering—I. Geochim. Cosmochim. Acta 1955, 8, 22–48. [Google Scholar] [CrossRef]
- Eissa, M.; Thomas, J.M.; Pohll, G.; Shouakar-Stash, O.; Hershey, R.L.; Dawoud, M. Groundwater recharge and salinization in the arid coastal plain aquifer of the WadiWatir delta, Sinai, Egypt. Appl. Geochem. 2016, 71, 48–62. [Google Scholar] [CrossRef]
- Vengosh, A.; Rosenthal, E. Saline groundwater in Israel: Its bearing on the water crisis in the country. J. Hydrol. 1994, 156, 389–430. [Google Scholar] [CrossRef]
- Oliva, P.; Dupre’, B.; Martin, F.; Viers, J. The role of trace minerals in chemical weathering in a high elevation granitic watershed (Estibe’re, France): Chemical and mineralogical evidence. Geochim. Cosmochim. Acta 2004, 68, 2223–2243. [Google Scholar] [CrossRef]
- Vengoush, A. Salinization, and saline environments. In Treatise on Geochemistry, 2nd ed.; Holland, H.D., Turekian, K.T., Eds.; Elsevier Ltd.: Burlington, MA, USA, 2013. [Google Scholar]
- Gibbs, R.J. Mechanisms controlling world water chemistry. Science 1970, 170, 1088–1090. [Google Scholar] [CrossRef] [PubMed]
- Sukhija, B.S.; Varma, V.N.; Nagabhushanam, P.; Reddy, D.V. Differentiation of paleomarine and modern seawater intrudedsalinities in coastal groundwaters (of Karaikal and Tanjavur, India) based on inorganic chemistry, organic biomarker fingerprintsand radiocarbon dating. J. Hydrol. 1996, 174, 173–201. [Google Scholar] [CrossRef]
- Vengosh, A.; Spivack, A.J.; Artzi, Y.; Ayalon, A. Geochemical and boron, strontium, and oxygen isotopic constraints on the origin of the salinity in groundwater from the Mediterranean coast of Israel. Water Resour. Res. 1999, 35, 1877–1894. [Google Scholar] [CrossRef]
- El Moujabber, M.; BouSamra, B.; Darwish, T.; Atallah, T. Comparison of different indicators for groundwater contamination by seawater intrusion on the Lebanese coast. Water Resour. Manag. 2006, 20, 161–180. [Google Scholar] [CrossRef]
- Kouzana, L.; Benassi, R.; Ben Mammou, A.; SfarFelfoul, M. Geophysical and hydrochemical study of the seawater intrusion in Mediterranean semi-arid zones.The case of the Korba coastal aquifer (Cap-Bon, Tunisia). J. Afr. Earth Sci. 2009, 58, 242–254. [Google Scholar] [CrossRef]
- Khaska, M.; La Salle, C.; Lancelot, J.; Aster, M.A.; Verdoux, P.; Noret, A.; Simler, R. Origin of groundwater salinity (current seawater vs. saline deep water) in a coastal karst aquifer based on Sr and Cl isotopes. Case study of the La Clape massif (southern France). Appl. Geochem. 2013, 37, 212–227. [Google Scholar] [CrossRef]
- Alcala, F.J.; Custodio, E. Using the Cl/Br ratio as a tracer toidentify the origin of salinity in aquifers in Spain and Portugal. J. Hydrol. 2008, 359, 189–207. [Google Scholar] [CrossRef]
- Jacobson, R.L.; Langmuir, D. The chemical history of some spring waters in carbonate rocks. Groundwater 1970, 8, 5–9. [Google Scholar] [CrossRef]
- Miesler, H.; Becher, A.E. Hydrogeologic Significance of Calcium/Magnesium Ratios in Groundwater from Carbonate Rocks in the Lancaster Quadrangle, Southern Pennsylvania; The Geological Professional Paper; USGS: Washington, DC, USA, 1967; pp. 232–235.
- Andreasen, D.C.; Fleck, W.B. Use of bromide: Chlorideratiosto differentiate potential sources of chloride in a shallow, unconfined aquifer affected by the brackish-water intrusion. Hydrogeol. J. 1997, 5, 17–26. [Google Scholar] [CrossRef]
- Shaw, D.M. Element distribution laws in geochemistry. Geochem. Cosmochim. Acta 1961, 23, 116–134. [Google Scholar] [CrossRef]
- Sinclair, A.J. Selection of threshold values in geochemical data using probability graphs. J. Geochem. Explor. 1974, 3, 129–149. [Google Scholar] [CrossRef]
- Sinclair, A.J. Application of Probability Graphs in Mineral Exploration; Special Volume No. 4; Association of Exploration Geochemists: Rexdale, ON, Canada, 1976. [Google Scholar]
- Dansgaard, W. Stable isotopes in precipitation. Tellus 1964, 16, 436–468. [Google Scholar] [CrossRef]
- Clark, I.D.; Fritz, P. Environmental Isotopes in Hydrogeology; Lewis Publishers: Boca Raton, FL, USA, 1997. [Google Scholar]
- Gat, J.R.; Mazor, E.; Tzur, Y. The stable isotope composition of mineral waters in the Jordan Rift Valley Israel. J. Hydrol. 1969, 76, 334–352. [Google Scholar] [CrossRef]
- IAEA; WISER. Water Isotope System for Data Analysis, Visualization, and Electronic Retrieval. WISER Version 0.7.2008. Available online: https://websso.iaea.org (accessed on 29 October 2018).
- Eissa, M.A.; Thomas, J.M.; Hershey, R.L.; Dawoud, M.I.; Pohll, G.; Dahab, K.A.; Gomaa, M.A.; Shabana, A.R. Geochemical and isotopic evolution of groundwater in the WadiWatir watershed, Sinai Peninsula, Egypt. Environ. Earth Sci. 2013, 71, 1855–1869. [Google Scholar] [CrossRef]
- Hershey, R.L.; Heilweil, V.M.; Gardner, P.; Lyles, B.; Earman, S.; Thomas, J.; Lundmark, K.W. Ground-Water Chemistry Interpretations Supporting the Basin and Range Regional Carbonate-Rock Aquifer System (BARCAS) Study, Eastern Nevada and Western Utah; DHS Publication No. 41230; Desert Research Institute: Reno, NV, USA, 2007. [Google Scholar]
- Hamdan, A.M.; Sawires, R.F. Hydrogeological studies on the Nubian sandstone aquifer in El-Bahariya oasis, Western Desert, Egypt. Arab. J. Geosci. 2013, 6, 1333–1347. [Google Scholar] [CrossRef]


| Ratios | Pleistocene Aquifer | Miocene Aquifer | Sea Water | Rain Water | ||
|---|---|---|---|---|---|---|
| Range | Mean | Range | Mean | Mean | Mean | |
| r Na+/r Cl− | 0.59–2.6 | 1.09 | 0.63–1.15 | 0.86 | 0.83 | 0.68 |
| r Ca2+/r Mg2+ | 0.16–1.8 | 0.58 | 0.32–1.29 | 0.65 | 0.18 | 3.97 |
| r SO42−/rCl− | 0.08–3.8 | 0.50 | 0.07–1.62 | 0.33 | 0.07 | 0.21 |
| Br−/Cl− | 0.009–0.018 | 0.013 | 0.009–0.032 | 0.016 | 0.01 | 0.015 |
| Constraints | Phases | Parameters |
|---|---|---|
| Calcium, Magnesium, Sodium, Carbon, Sulfur and Chloride | Calcite, Dolomite, Gypsum, Halite, Illite | Evaporation, Mixing with Different Waters |
| Aquifer | Initial Water | Final Water | Phases Precipitated or Dissolved | |||||
|---|---|---|---|---|---|---|---|---|
| Cal | Gyp | It | Hal | Dol | Evap | |||
| Pleistocene | 5 | 2 | - | 5.89 | 1.05 | 8.78 | - | 2.11 |
| 20 | 22 | −8.18 | −1.35 | 0.21 | - | 3.96 | 1.19 | |
| Miocene | 44 | 38 | −20.02 | 3.54 | 1.52 | 38.78 | 9.34 | 1.36 |
| Aquifer | Initial1 | Initial2 | FinalWater | Mixing Percent | Phases Precipitated or Dissolved | |||||
|---|---|---|---|---|---|---|---|---|---|---|
| Initial1 | Initial2 | Cal | Gyp | Ilt | Dol | Evap | ||||
| Pleistocene | Sea | 10 | 27 | 0.36 | 0.64 | 1.54 | 8.58 | −0.77 | - | 1.8 |
| Sea | 36 | 35 | 0.98 | 0.01 | - | - | −8.54 | −0.38 | 1.35 | |
| Sea | 19 | 11 | 0.28 | 0.72 | 4.47 | 29.68 | −0.29 | −1.96 | 1.31 | |
| Miocene | Sea | 36 | 9 | 0.91 | 0.09 | 17.65 | 0.00 | −0.15 | −8.63 | 1.01 |
| Sea | 36 | 23 | 0.48 | 0.52 | 1.09 | - | −8.44 | - | 1.17 | |
| Sea | 38 | 39 | 0.37 | 0.62 | 43.95 | - | −5.44 | −22.12 | 1.22 | |
© 2018 by the authors. Licensee MDPI, Basel, Switzerland. This article is an open access article distributed under the terms and conditions of the Creative Commons Attribution (CC BY) license (http://creativecommons.org/licenses/by/4.0/).
Share and Cite
Eissa, M.A.; Shawky, H.; Samy, A.; Khalil, M.M.H.; El Malky, M. Geochemical and Isotopic Evidence of Groundwater Salinization Processes in El Dabaa Area, Northwestern Coast, Egypt. Geosciences 2018, 8, 392. https://doi.org/10.3390/geosciences8110392
Eissa MA, Shawky H, Samy A, Khalil MMH, El Malky M. Geochemical and Isotopic Evidence of Groundwater Salinization Processes in El Dabaa Area, Northwestern Coast, Egypt. Geosciences. 2018; 8(11):392. https://doi.org/10.3390/geosciences8110392
Chicago/Turabian StyleEissa, Mustafa A., Hosam Shawky, Amira Samy, Mostafa M. H. Khalil, and Mohamed El Malky. 2018. "Geochemical and Isotopic Evidence of Groundwater Salinization Processes in El Dabaa Area, Northwestern Coast, Egypt" Geosciences 8, no. 11: 392. https://doi.org/10.3390/geosciences8110392