Heavy Metal Signature and Environmental Assessment of Nearshore Sediments: Port of Koper (Northern Adriatic Sea)

1
Department of Geology, Faculty of Natural Sciences and Engineering, University of Ljubljana, Aškerčeva 12, 1000 Ljubljana, Slovenia
2
Slovenian National Civil Engineering Institute, Dimičeva 12, 1000 Ljubljana, Slovenia
*
Author to whom correspondence should be addressed.
Geosciences 2018, 8(11), 398; https://doi.org/10.3390/geosciences8110398
Submission received: 30 August 2018
/
Revised: 16 October 2018
/
Accepted: 23 October 2018
/
Published: 31 October 2018
(This article belongs to the Special Issue Geochemical Equilibrium and Processes in Seawater)
Abstract
:Heavy metal abundance and potential environmental risks are reported for surface sediments (n = 21) from the Port of Koper area, Republic of Slovenia. The enrichment factor (EF) indicates minor enrichment in arsenic (As), cadmium (Cd), copper (Cu), molybdenum (Mo), lead (Pb), antimony (Sb), and zinc (Zn), moderately to severely enriched with nickel (Ni). The trace metal chemistries, in the context of sediment quality guidelines (SQG), imply adverse threshold effect concentrations (TEC) and probable effect concentrations (PEC), for Ni only. Sediment sequential leaching experiments demonstrated that the majority of heavy metals were of natural lithogenic origin and low bioavailability. The heavy metals’ potential for “Risk Assessment Code” values exhibited no or low anthropogenic environmental burden, with the exception of Mo.
1. Introduction
Coastal environments are often environmentally burdened by port and traffic infrastructure, large industrial areas, urban settlements, and tourism activities. Thus, the flux of various anthropogenic contaminants, especially heavy metals, are discharged and accumulated into marine coastal ecosystems [1,2,3,4,5]. Heavy metals are among the most persistent pollutants in the aquatic ecosystem, and they are not nullified from water by self-purification [6]. Sediments are a significant repository for heavy metals present in the upper water column and, in addition, they act as a secondary source. Due to a series of physical and biochemical processes (e.g., diagenetic, bioturbation, and resuspension processes, currents and waves, dredging, and shipping activities) the remobilisation of heavy metals occurs at the sediment water interface, affecting overlying water, aquatic organisms, and threatening human health [7,8,9].
The appearance and loading of heavy metals in vulnerable marine environments originates from both anthropogenic and natural processes, e.g., geological background [10,11,12]. A precise designation of anthropogenically/geogenically derived heavy metals is of importance in the evaluation and prevention of the pollution burden, and in planning the appropriate remedial action. Further on, the mobility potential and bioavailability of heavy metals in the surrounding environments is heavily dependent on their specific chemical forms and type of bindings.
The geochemical characteristics of sediment from the Gulf of Trieste (North Adriatic Sea, Italy) have been studied in detail by several groups [13,14,15,16,17,18,19,20,21,22,23] over a significant period of time. Few studies, however, have been conducted on the adjacent Adriatic sediments of the Koper Bay, especially from the Port of Koper [22,23,24]. Thus, precisely defined anthropogenic/geogenic character, heavy metal mobility potential, the application of sediment quality guidelines (SQG), and eligible statistical analyses in Koper Bay sediments, was undertaken for the first time.
Koper/Capodistria is a small coastal city located in Slovenia´s Mediterranean region. Due to its geographic location, it is influenced by various anthropogenic contamination sources from an international port—the Port of Koper, an industrial zone with a chemical factory, agriculture, and viticulture developed in the hinterland of the city. The port is one of the biggest and most important ports in the Northern Adriatic Sea and, thus, represents a major contaminant source to sediments found in the Koper Bay. Additionally, in the framework of the Global Environmental Facility (GEF) project, sediments from the Koper Bay have already been marked as a contamination “hot spot”. Due to massive cargo and intense port activities, we have also included, in our study estimating heavy metals’ anthropogenic impact, Mo, Au, and Sb. Mo can be introduced into the environment through its presence in steel, catalysts, dyes, lubricants; (2) raw Au gold represents an urgent material for jewellers; and (3) Sb is type-metal alloy (with Pb to prevent corrosion); we can find it also in electrical applications, semiconductors, flameproof pigments, and glass [25].
In this context, the main objectives of the present study were as follows: (1) to determine detailed mineralogical and elemental content in the surface sediments of the Port of Koper area; (2) to estimate the degree and distribution of heavy metal contamination in the sediments using contamination indices, sediment quality guidelines (SQGs) and various methods of statistical analysis; and (3) to define the possible natural and/or anthropogenic sources and pathways of heavy metals, as deduced from a sequential extraction procedure.
2. Materials and Methods
2.1. Geographical and Geological Setting of the Study Area
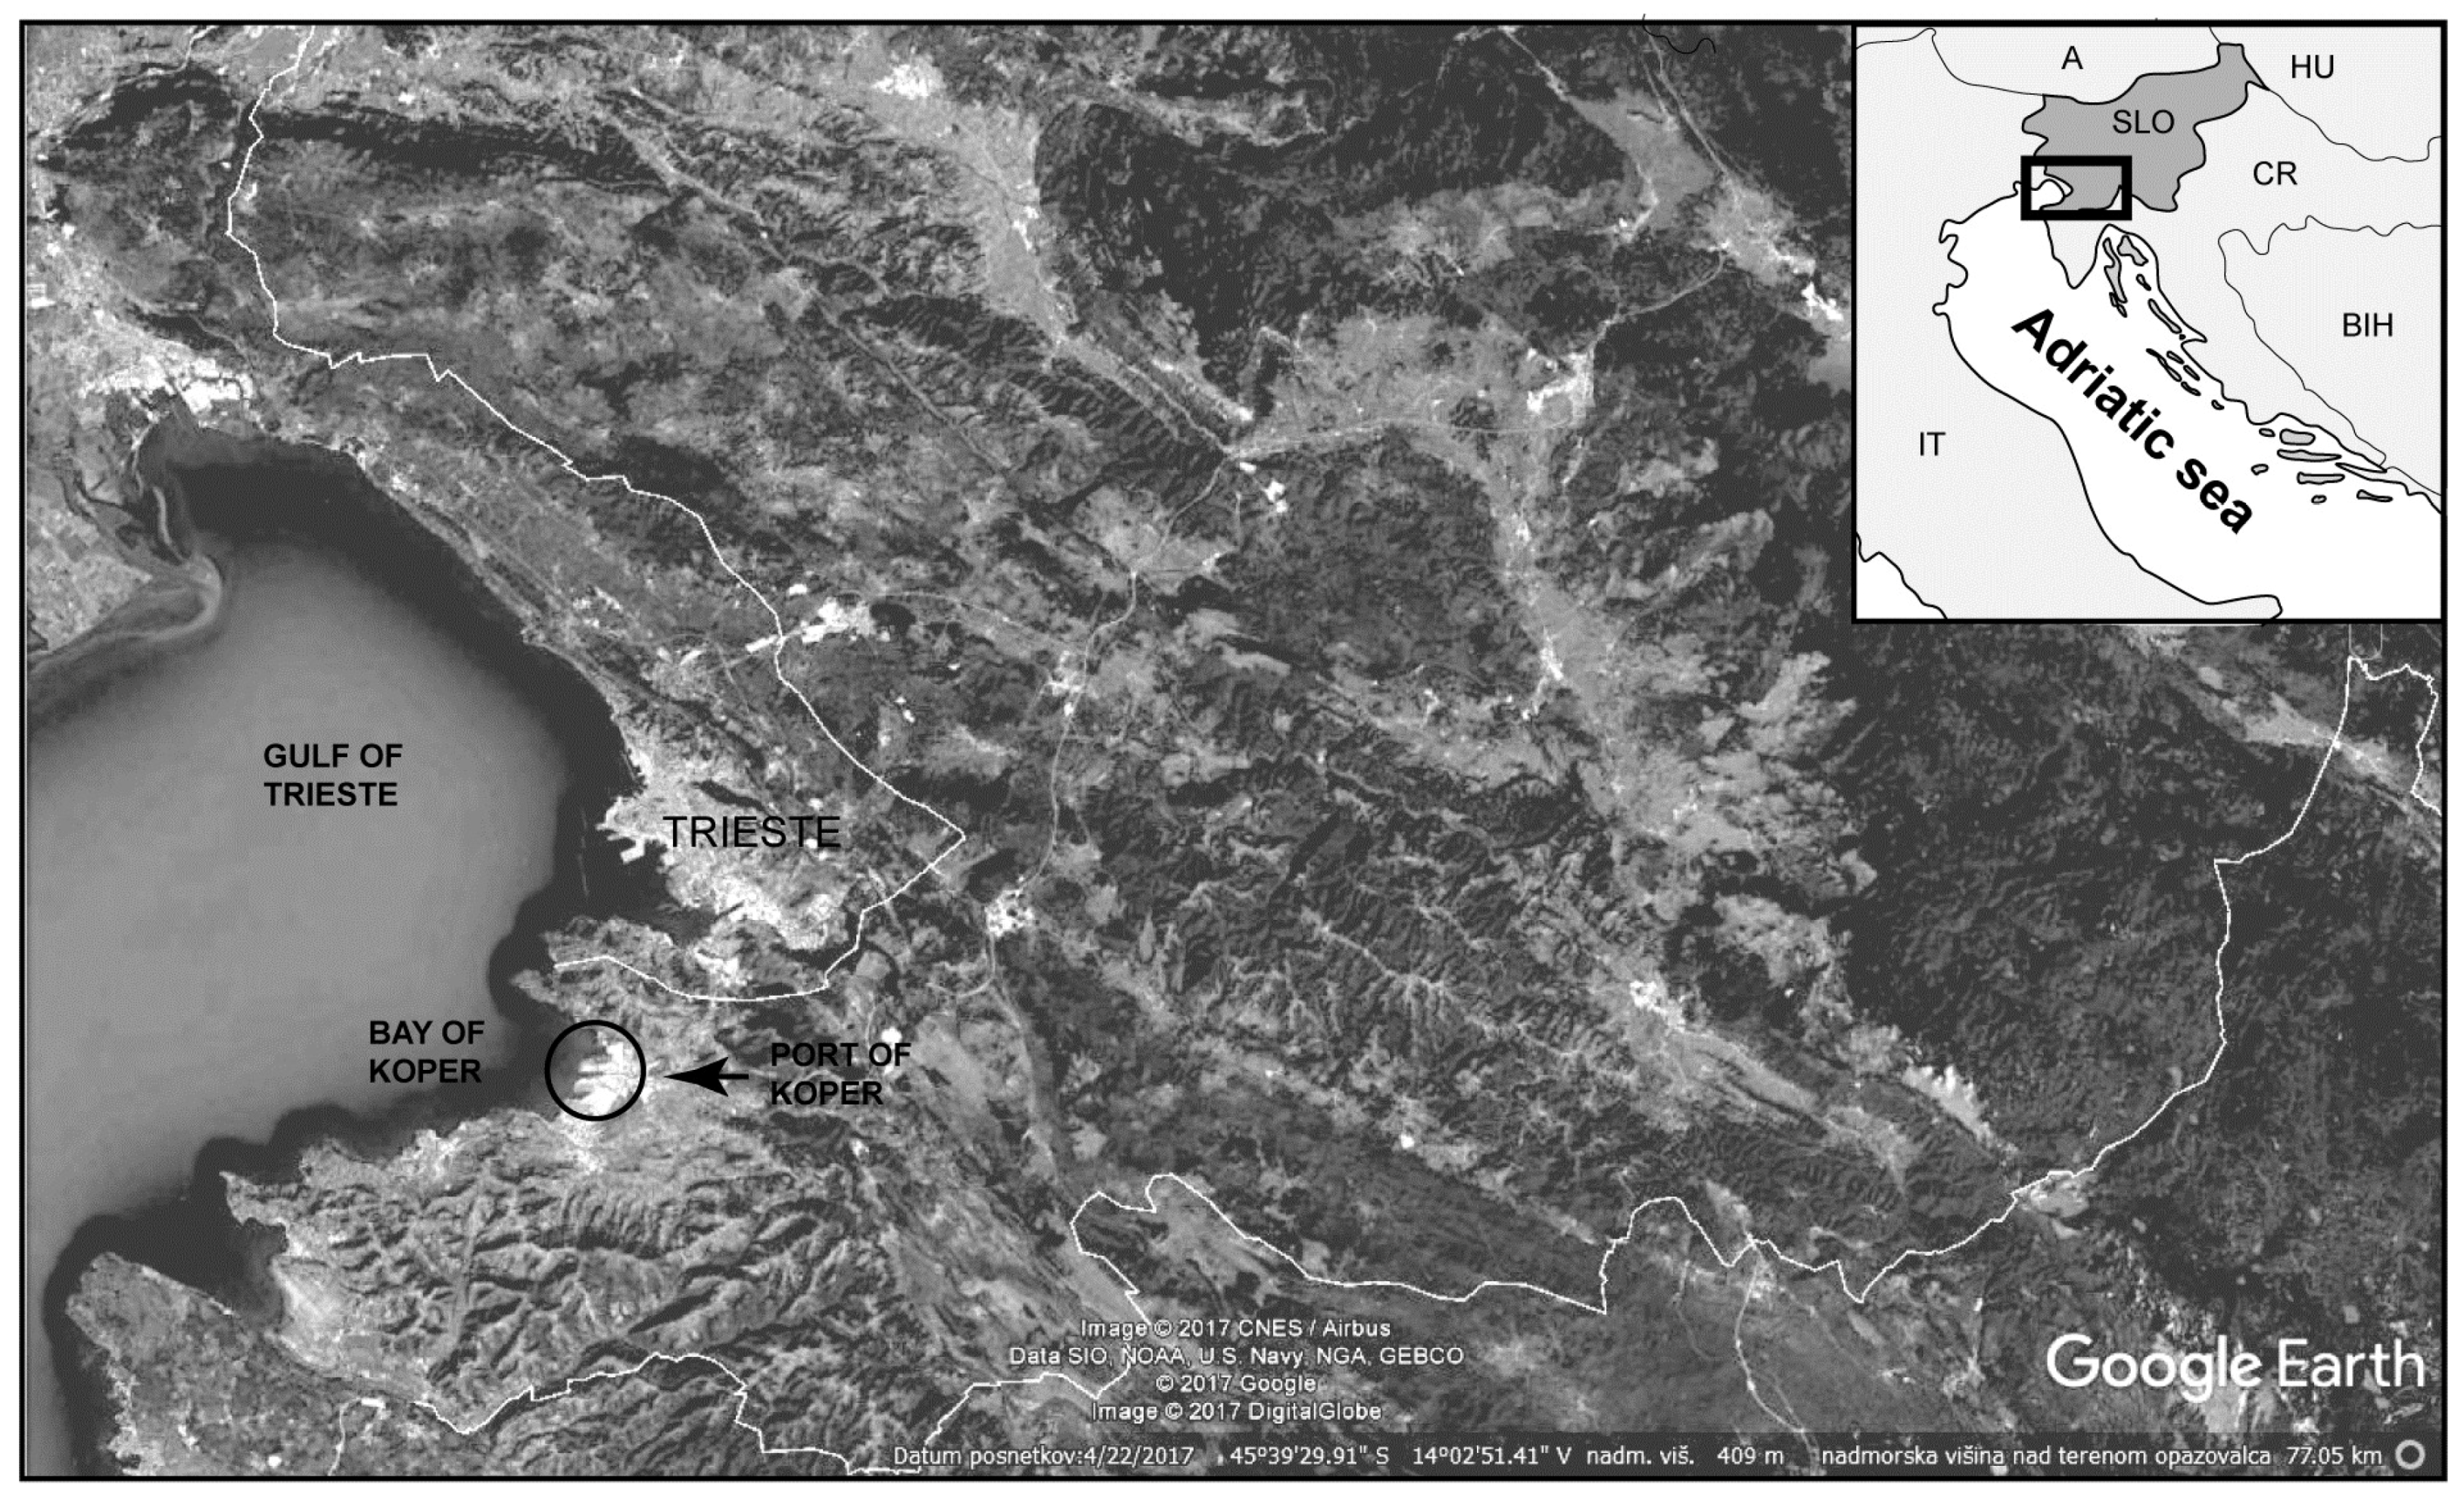
The Port of Koper was established in 1957, and lies in a semi-enclosed basin in the shallowest part of the Adriatic Sea with a maximum depth of approximately 24 m (Figure 1). It is the deepest indentation into the European continent, providing an accessible Mediterranean port with a railway track and road links for intermodal and combined transport. The Port of Koper is a multipurpose port with international trade connections. The current annual maritime throughput is over 15 million tonnes.
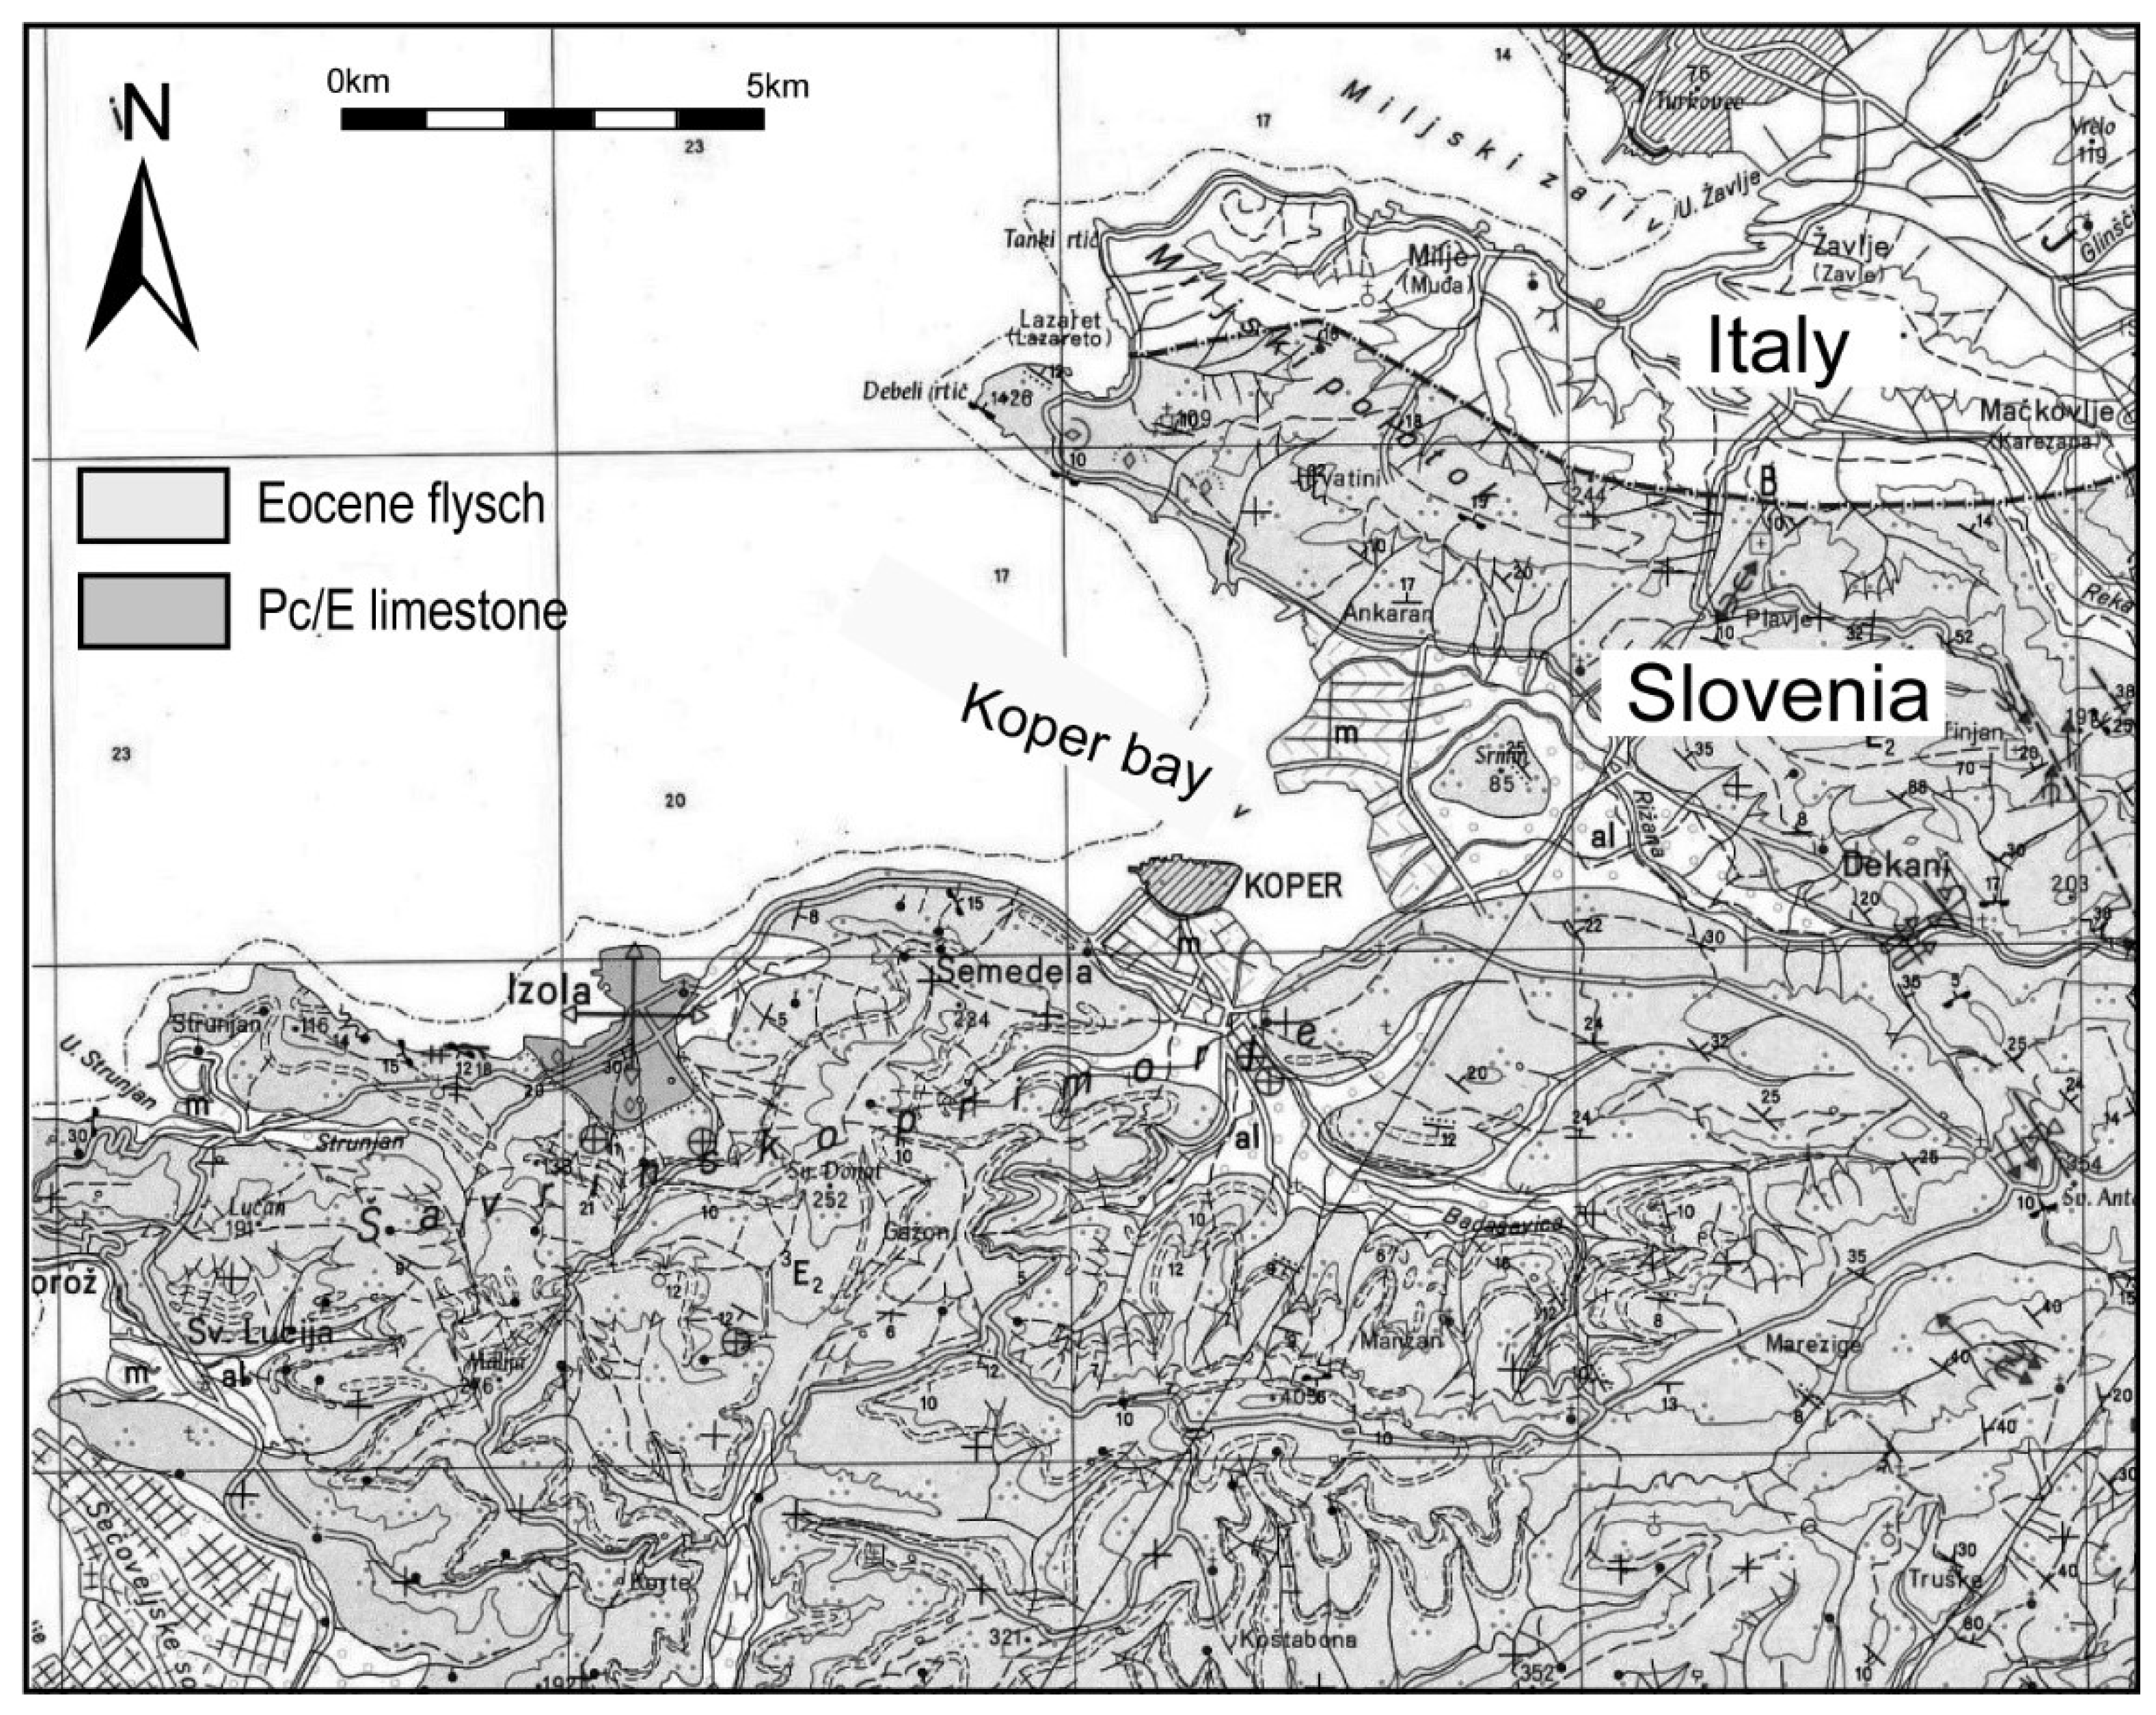
The Bay of Koper and its hinterland structurally belong to the Adriatic-Apulian foreland [26,27]. In the Mesozoic, the area belonged to the Dinaric Carbonate Platform, mainly with shallow-water carbonate sedimentation while, in the Kenozoic, the area became part of the advancing foreland basin with flysch sedimentation [28]. In the Quaternary, the investigated area was an environment with fluvial sedimentation up until 8000 years ago, when the main sea transgression occurred [24,29]. From that time onward, the bay has been characterised by a sedimentation of mainly fine-grained clastics in a shallow embayment area [24,30]. The main tributaries of the Koper Bay are the Rižana and Badaševica Rivers. The catchment of the Rižana River is 240 km2 large, and composed mainly of Cretaceous shallow-water limestones, Paleogene alveolina-nummulite limestones and Eocene flysch deposits, while the Badaševica catchment area is 21.3 km2 large and represented by Eocene flysch deposits (Figure 2).
2.2. Sampling
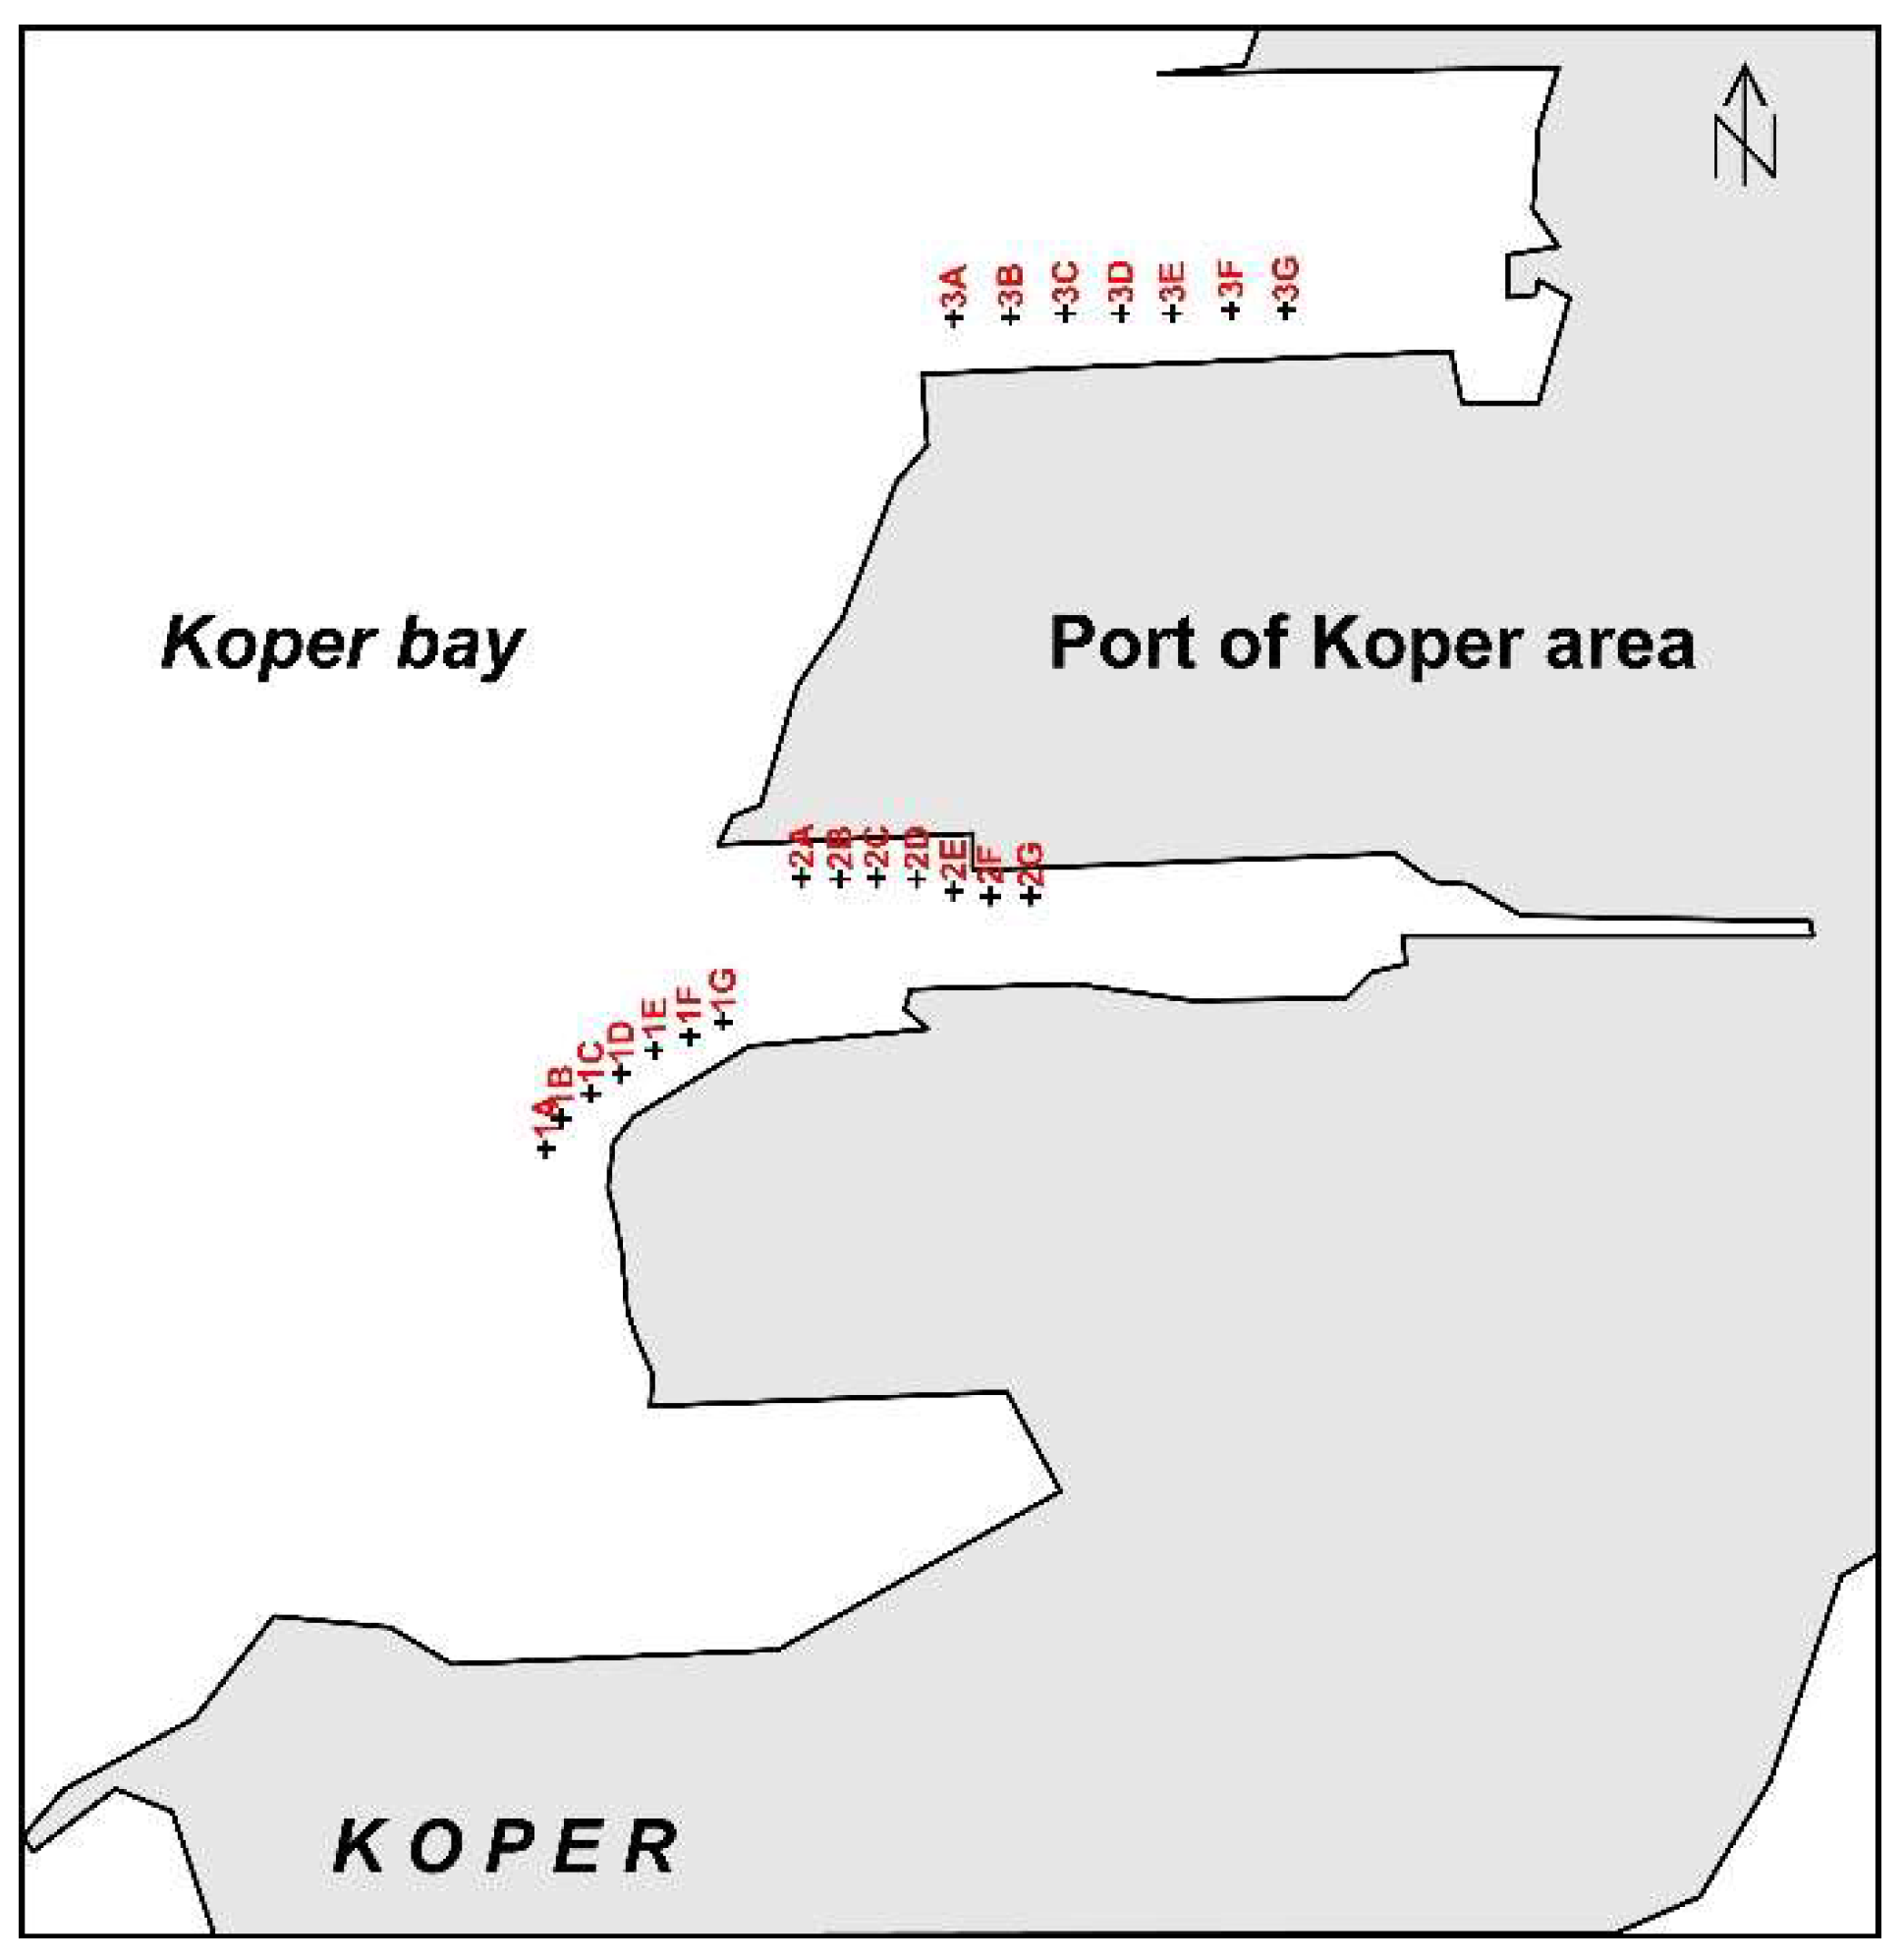
In January 2012, 21 sediment samples were taken from marine cassettes; sampling locations are shown in Figure 3. Surface samples collected with push plastic corers (a 10 cm long tube with an internal diameter of 10 cm) were packed into pre-cleaned plastic bags, and stored in the laboratory at 4 °C until analysis. The sediment samples were dried at 50 °C for 48 h. Samples (10 g) were set aside for particle size analysis; the rest was sieved through a 0.315 mm polyethylene sieve in order to remove any large organic and mollusc debris. For geochemical analysis, the samples (<0.315 mm) were milled and homogenised using a mechanical agate mortar, into a fine powder (<63 µm).
2.3. Laboratory Analysis
The granulometric composition of a split of the original sediment samples was analysed by the standard procedure of wet sieving with a Cilas 920 laser granulometer (fraction <63 µm). Grain size was calculated and described by applying the GRADISTAT program (version 8.0) developed by Blott and Pye [31].
Total carbon and total sulphur content were analysed using a LECO Carbon-Sulphur analyser in an accredited commercial Canadian laboratory (Acme Analytical Laboratories, Vancouver, BC, Canada) on freeze-dried powdered samples.
The mineral association was characterised via X-ray powder diffraction (XRD) using a Philips PW3710 equipped with Cu Kα radiation and a secondary graphite monochromator. Data were collected at 40 kV, and a current of 30 mA in a range from 2 to 70° 2θ, at a speed of 3.4 o/min. Oriented clay mineral aggregate preparation was performed using a combination of ultrasound dispersion, removal of salt by centrifugation (3 × 3 min at 2500 rpm) and the glass slide method. The samples were analysed in an ethylene glycol-solvated condition, and exposed to the reagent vapour for at least 24 h at 70 °C. Diffraction patterns were identified with the X’Pert HighScore Plus diffraction software version 4.6 using PAN-ICSD powder diffraction files and the Rietveld method, a full-pattern fit method where the measured and calculated profiles are compared.
Geochemical analyses were conducted at Acme Analytical Laboratories, Vancouver, BC, Canada. The major oxides and trace metal (e.g., As, Au, Cd, Cu, Ni, Mo, Pb, Sb, and Zn), concentrations were measured by ICP emission spectrometry, following lithium metaborate/tetraborate fusion and dilute nitric digestion. The accuracy and precision of the analysis were clarified using the reference material CCRMR SO-18 CSC. The precision was better than ±5% (Acme Analytical Laboratories, Vancouver, BC, Canada).
Three sediment surface samples (1D, 2G, and 3G) were randomly assigned for the chemical partitioning analysis of As, Cd, Cu, Mo, Ni, Pb, Sb, and Zn by employing a sequential leaching process at Actlabs, Vancouver, BC, Canada. The sediment samples, with particle sizes under 0.315 mm and weighing 0.75 g, were placed in screw-top test tubes. The samples sequentially underwent a leaching process starting with the weakest leach to the strongest leach, with a subsequent analysis of each of the leachates by ICP-MS. The procedure is presented in Table 1.
Two controls for every 49 samples were leached using the same procedure (Actlabs, Vancouver, BC, Canada). The solutions were analysed on a Perkin Elmer ELAN 6000 ICP-MS (Vancouver, Canada) for the determination of 60 or more elements, and one matrix blank was analysed per 49 samples. Two controls ran at the beginning and end of the group of 49 samples. Duplicate samples were leached and ran every 10 samples. Values below the detection limit were calculated with LOD/√2 [36].
2.4. Statistical Analyses
The applied multivariate statistical parameters were performed using Statistica VII and Grapher 8 statistical software. Pearson R correlation analysis was done with the intention of exposing the clay, silt, elemental, TOT/C, and SAKFMP (SiO2, Al2O3, K2O, Fe2O3, MnO, and P2O5) component linkage. Critical values of the correlation coefficient (r) 0.70 at p ≤ 0.05 were considered very highly significant. Principal component analysis was applied in order to identify correlations within the dataset. In PCA, a transformation of the dataset, based on eigenvector methods, was organised to define the direction and magnitude of the maximum variance of the dataset in a reduced hyperspace, determined by the first significant components [37,38].
2.5. Assessment of Sediment Contamination
The enrichment factor (EF) was computed by the following relationship:
where M/Alsample and M/AlKornati sediments are the levels of aluminium (Al) and heavy metals measured in the investigated sediment samples and in Kornati surface sediments, respectively. Selected baseline values for MKornati sediments and AlKornati sediments were adopted from the thesis written by Ilenič [39]. In this thesis, the geochemical study of surface sediments from the Kornati Sea (Central Adriatic Sea) was performed. The values were chosen because Kornati National Park is considered one of the most pristine environments in the area of the Adriatic Sea (in comparison to the Koper Bay and the Gulf of Trieste). Metal to Al ratios are widely adopted, presumably because (1) the concentrations of weathering products and their parent materials are generally comparable [40,41], and (2) aluminium is the normalising element, as it is assumed not to be enriched by local contamination [42].
EF = (M/Al)sample/(M/Al)Kornati sediments,
Sediment quality assessment guidelines (SQGs) are useful for calibrating sediment contamination [43]. SQG guidelines evaluate the degree to which the sediment-associated chemical status might adversely affect aquatic organisms, and are designed to assist in the interpretation of sediment quality [43].
The SQG values, e.g., the threshold effect concentration (TEC) and probable effect concentration (PEC), provide valuable insight regarding the sediment quality conditions in aquatic ecosystems. The TEC value for a particular element represents a concentration below which harmful effects are unlikely to be observed, while the PEC values identify the contaminant concentrations above which harmful effects to benthic organisms are expected to occur [43].
3. Results and Discussion
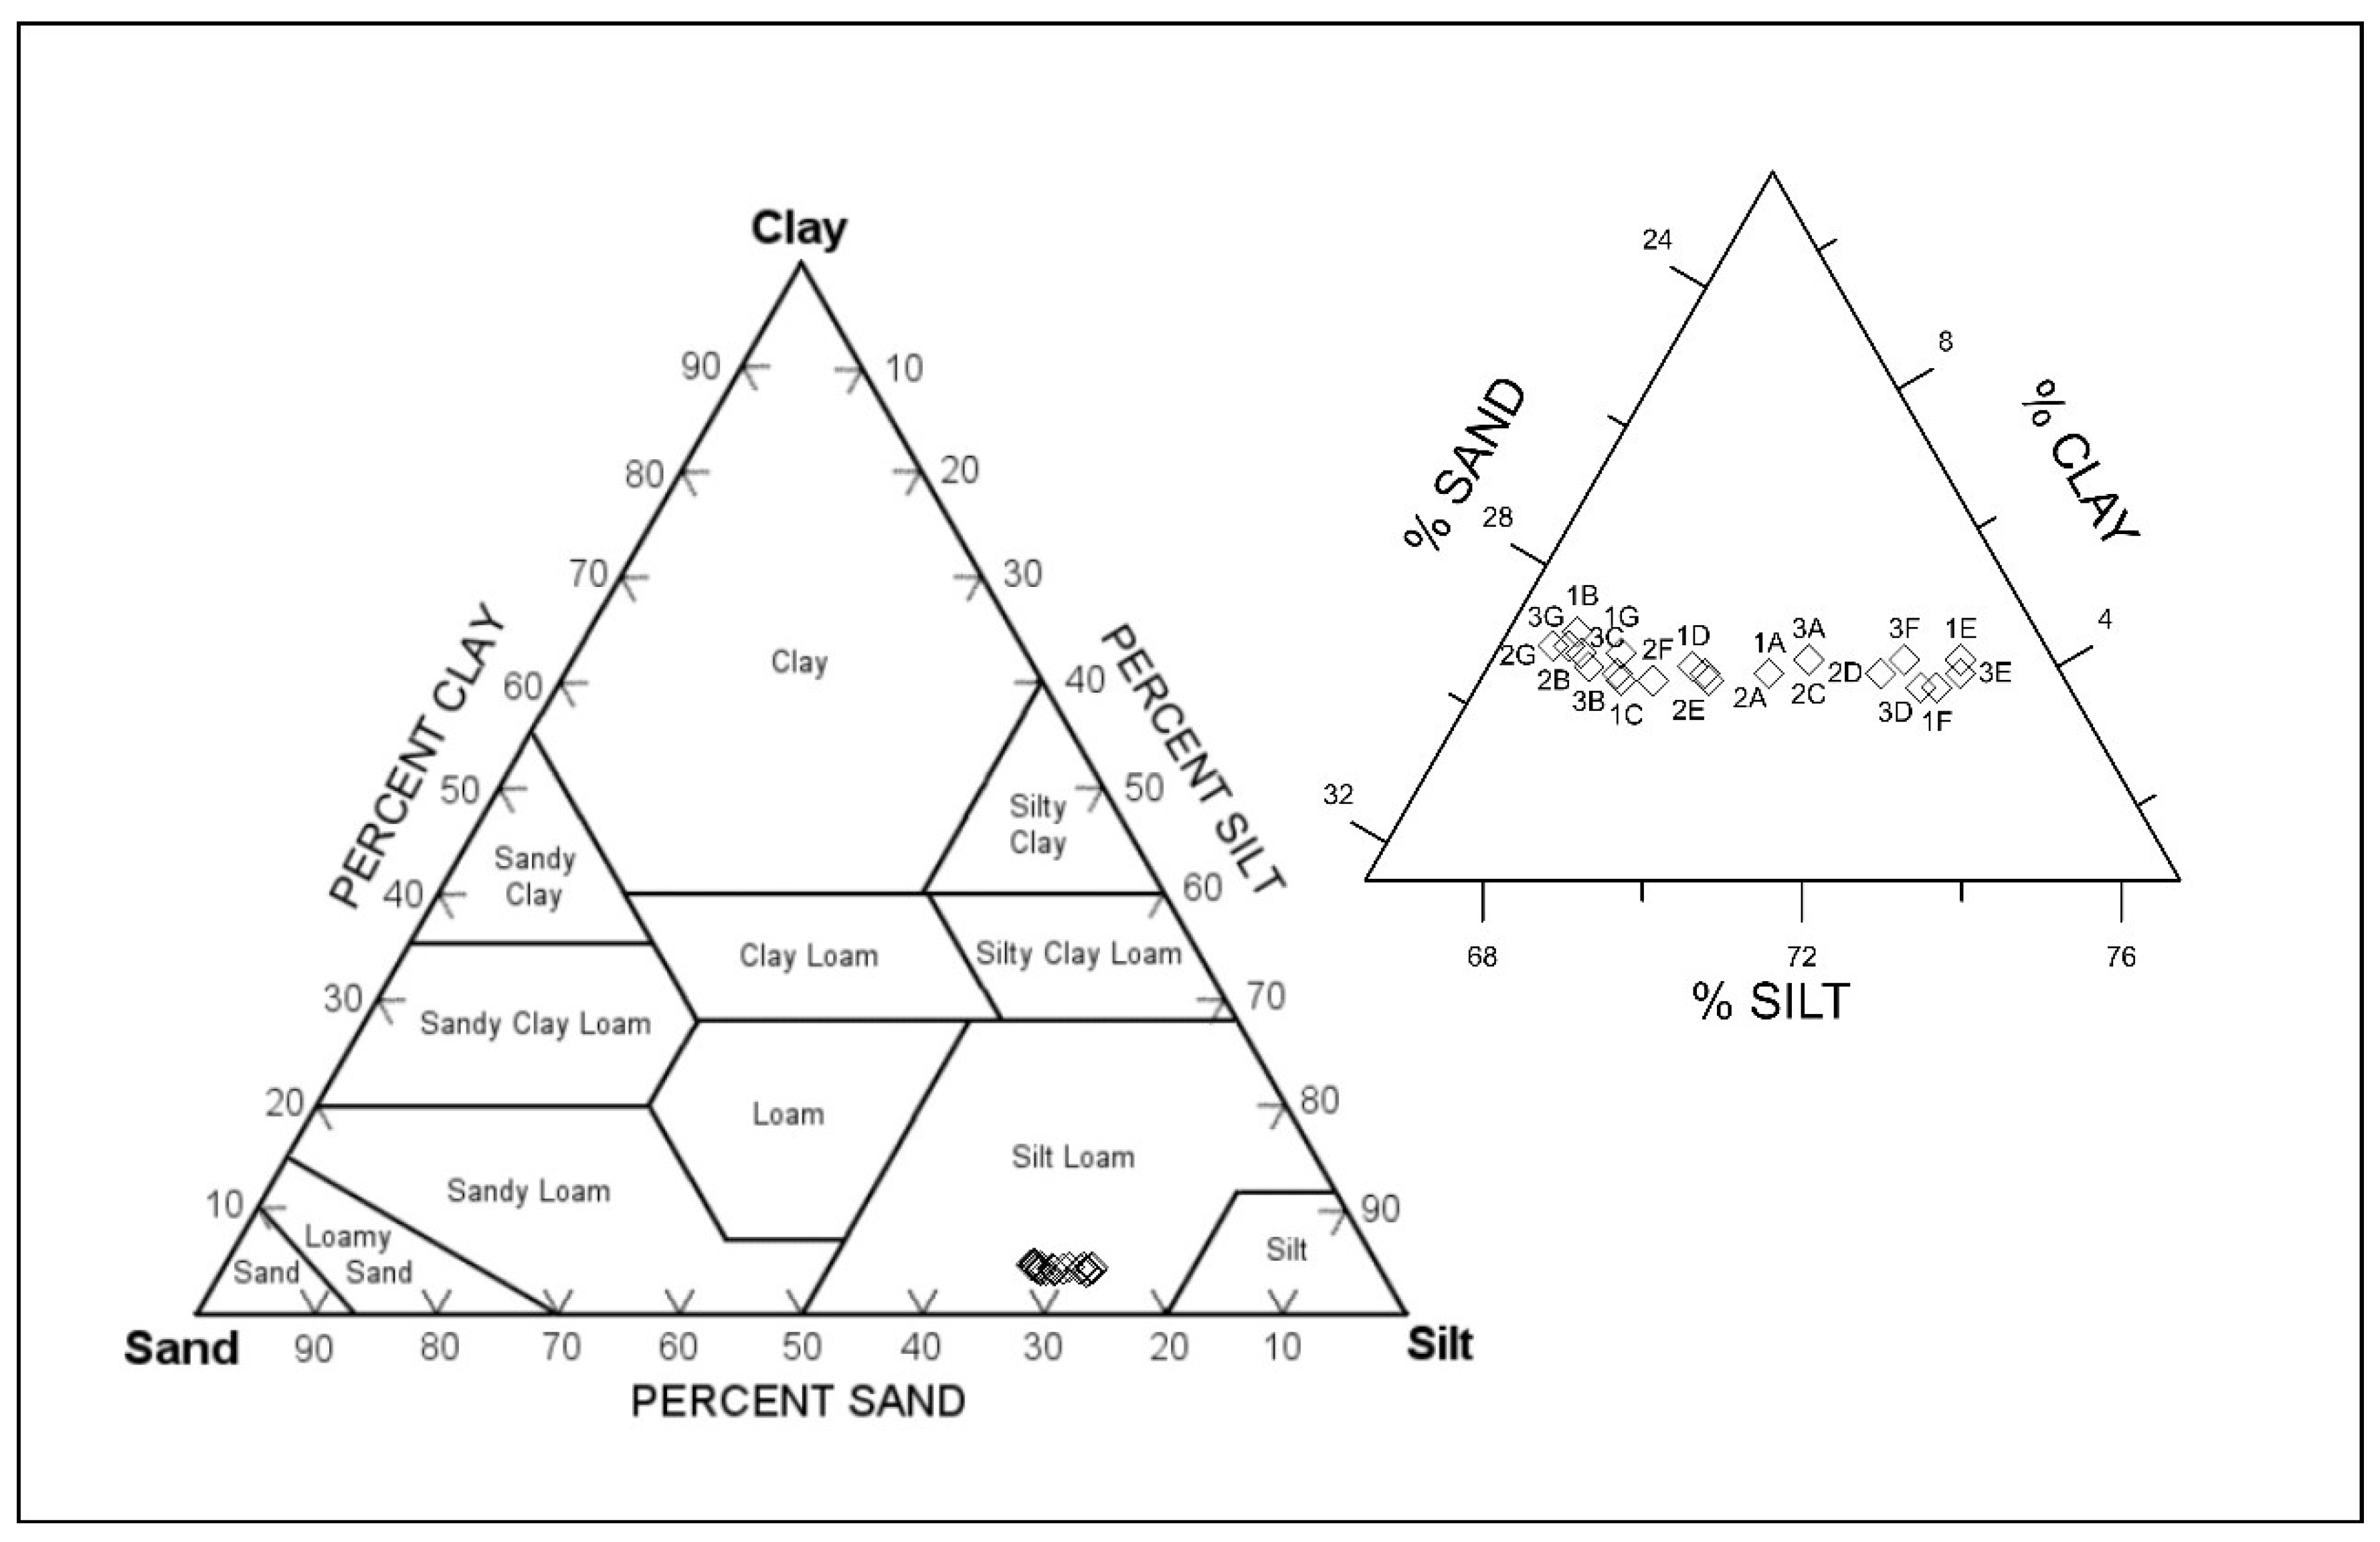
The surface sediment in this study varies widely from clay to sand, with an overall dominant silt composition (Figure 4). There was no spatial difference noted and, thus, the samples are defined as fine sandy medium silt. This composition character was also found in the open area of the Koper Bay [22].
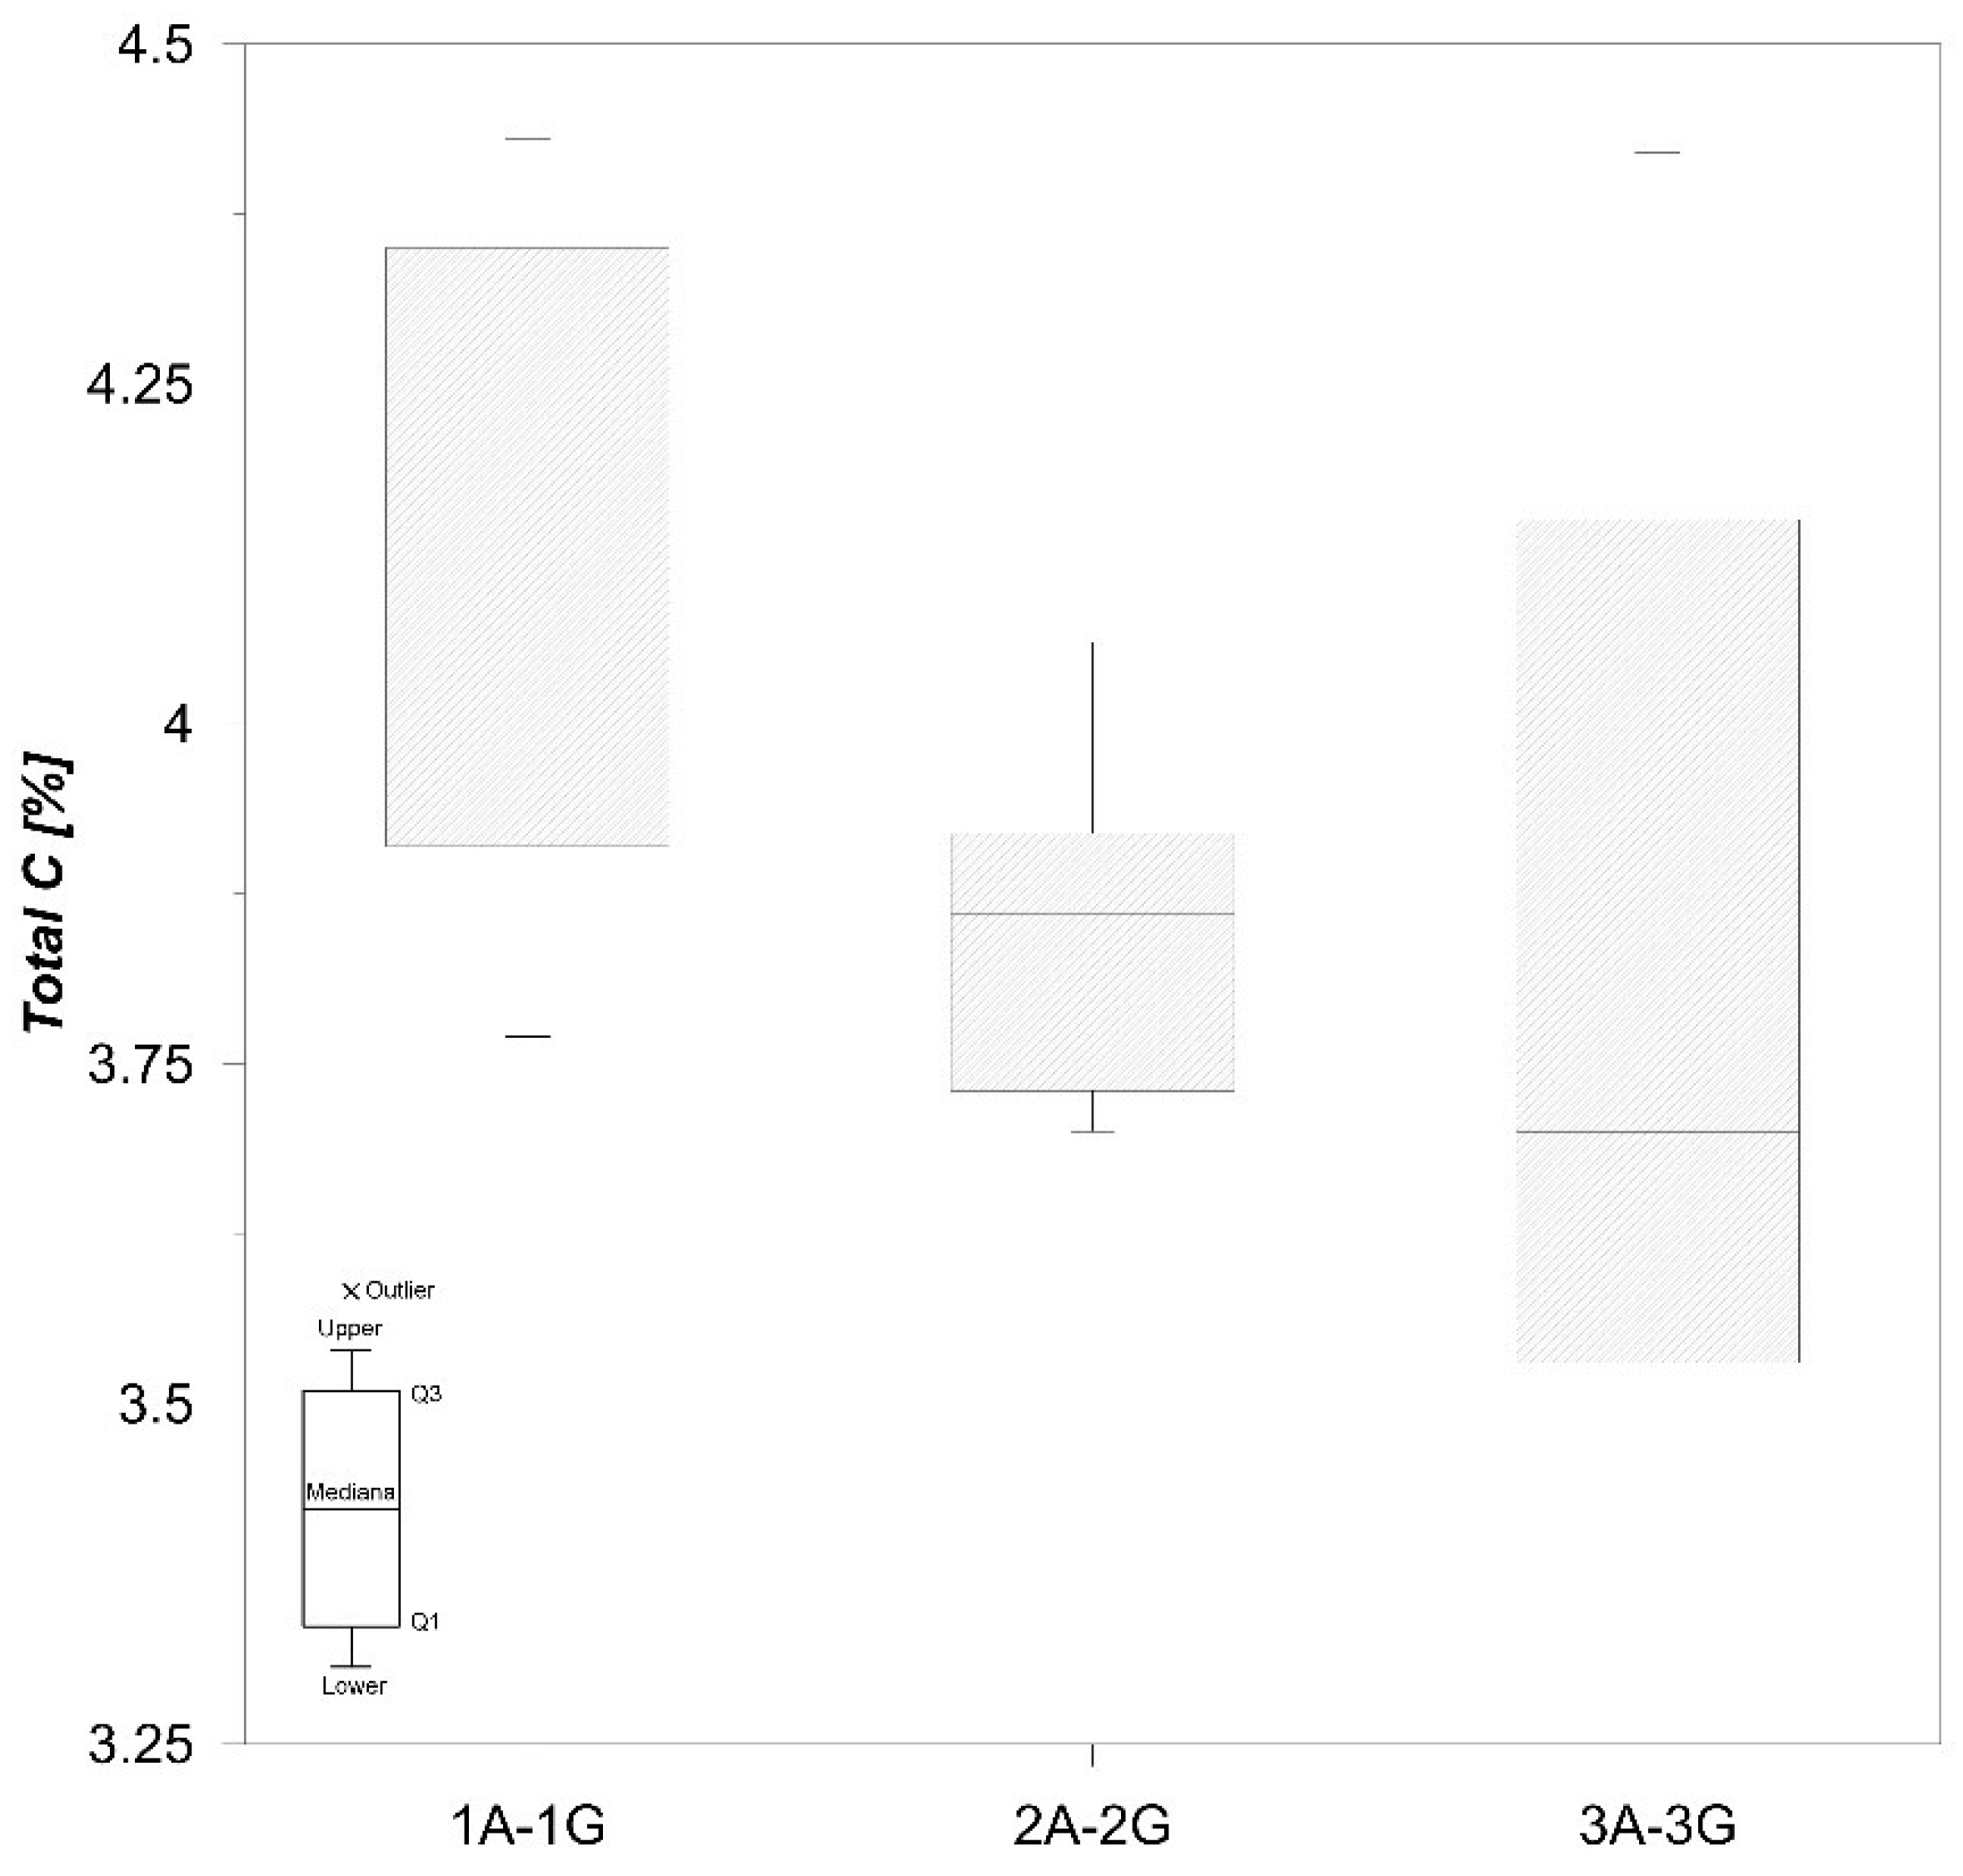
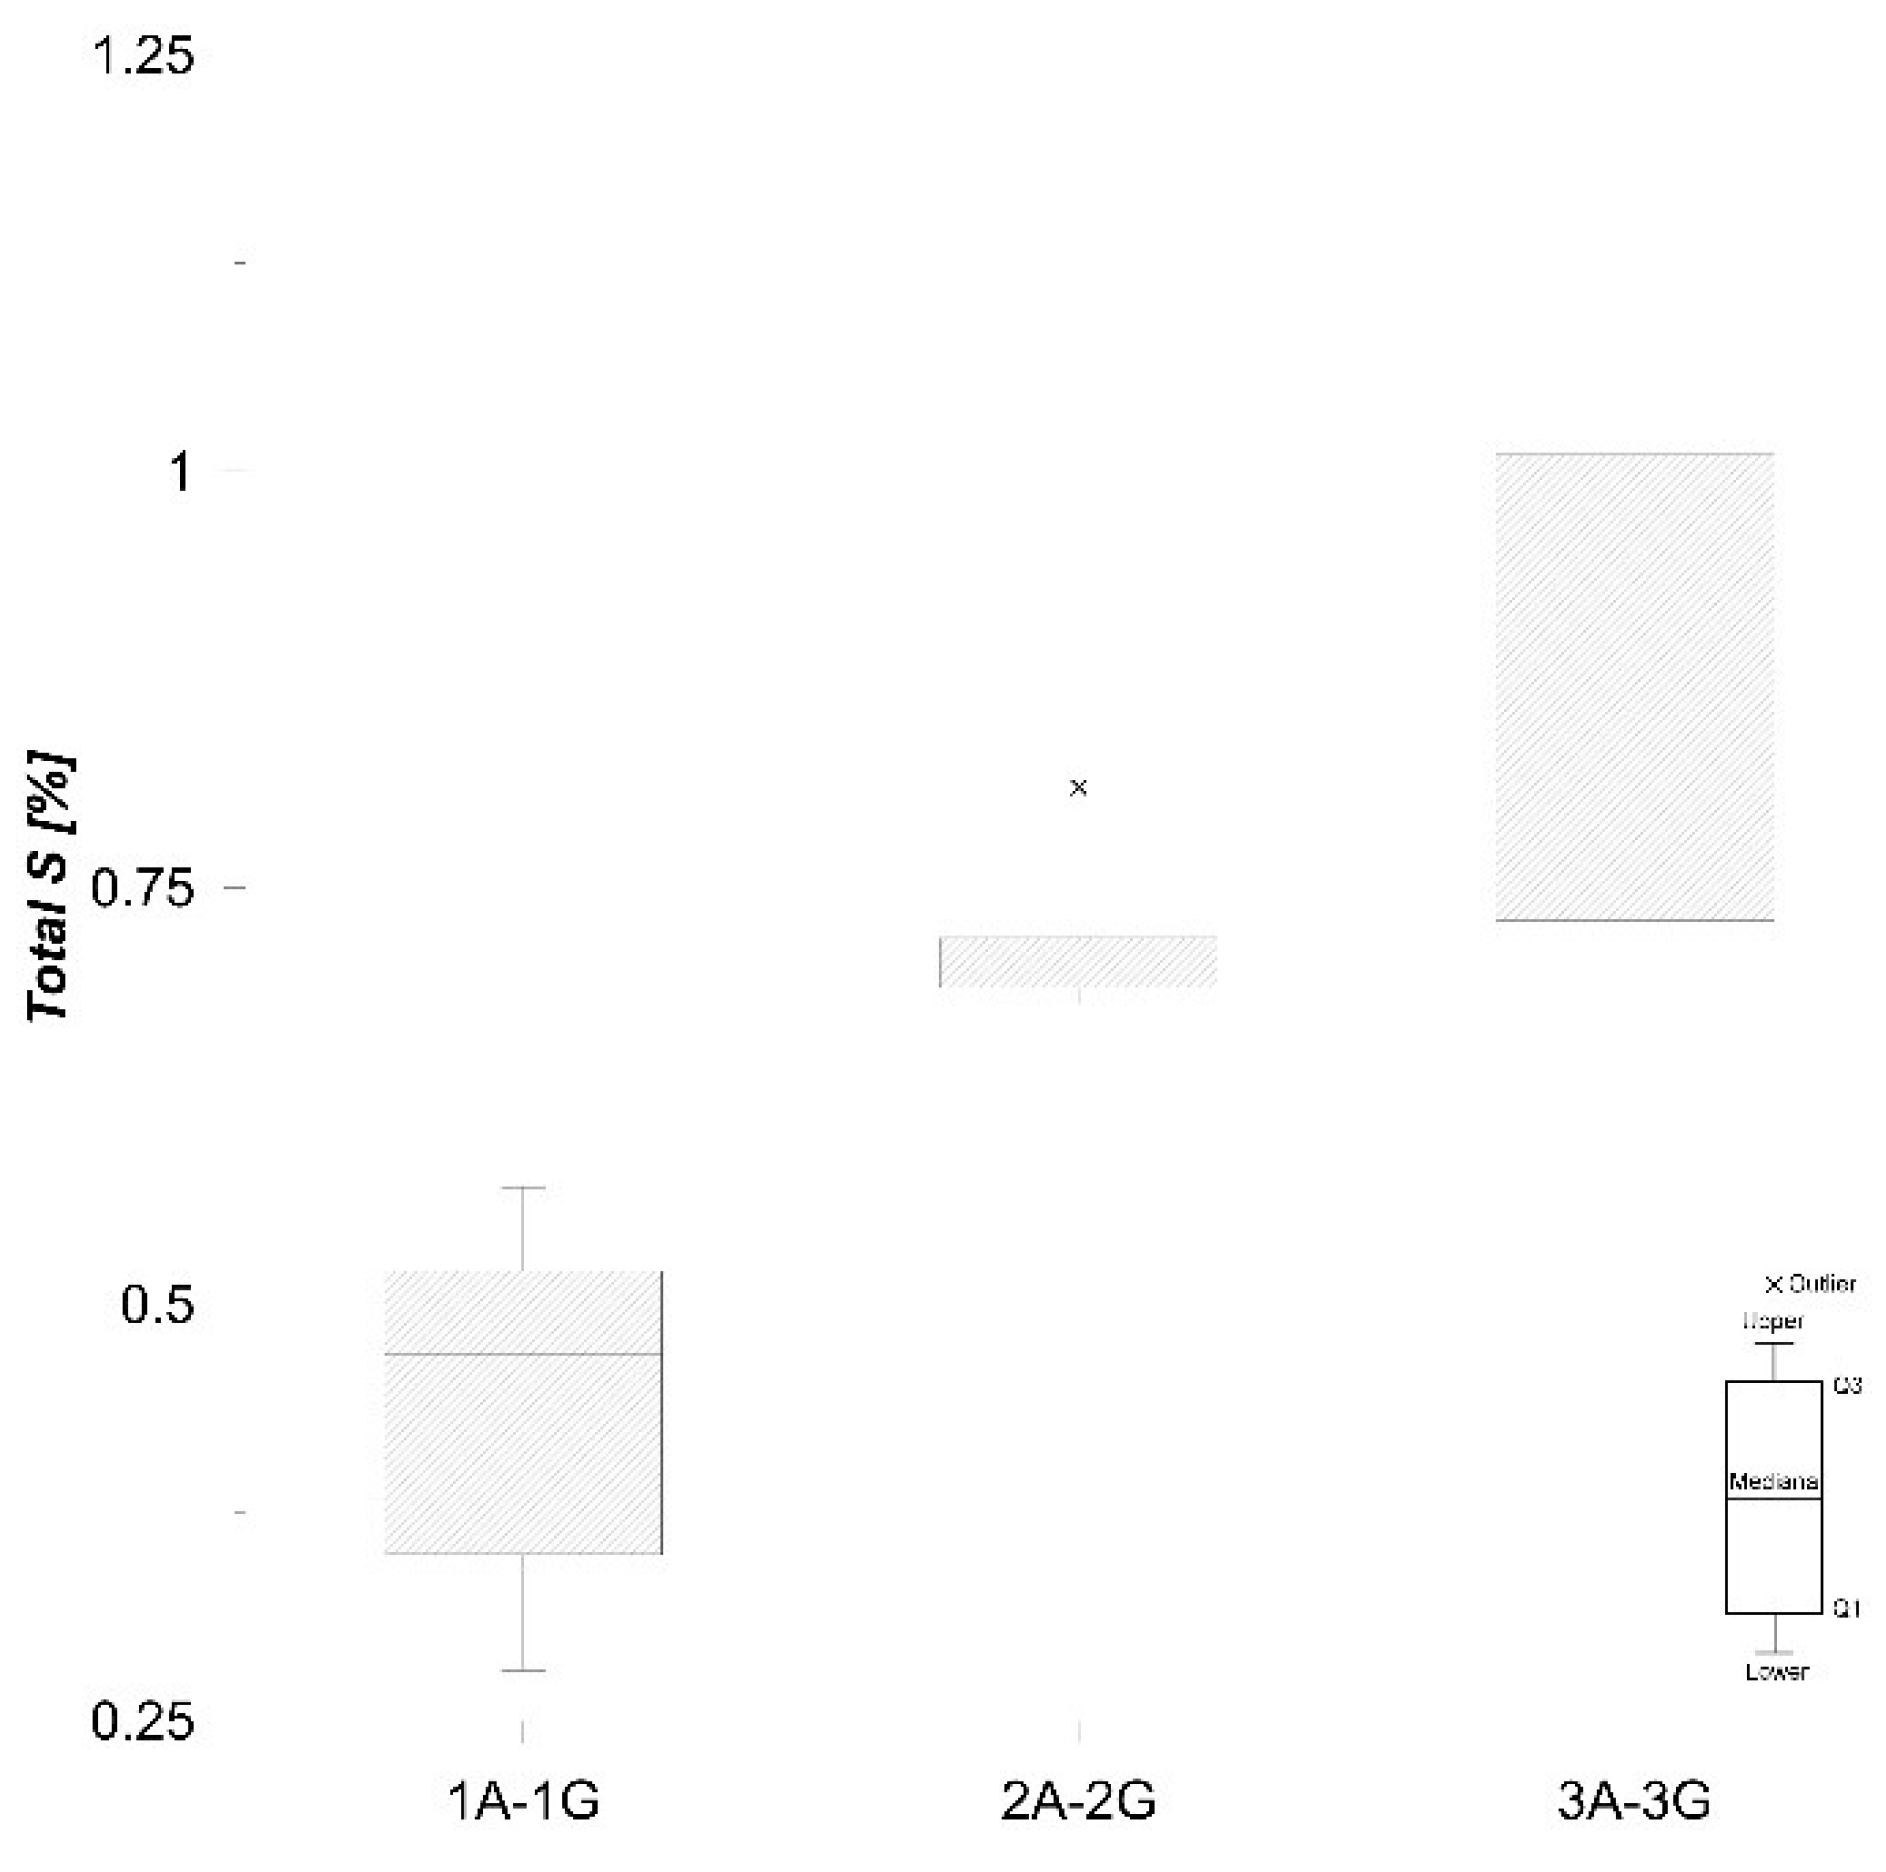
Total C content in the samples studied varies from 3.40% to 4.43% (Figure 5), and total S concentrations are quite low (0.28–1.08%) (Figure 6), which is in accordance with Faganeli et al. [22].
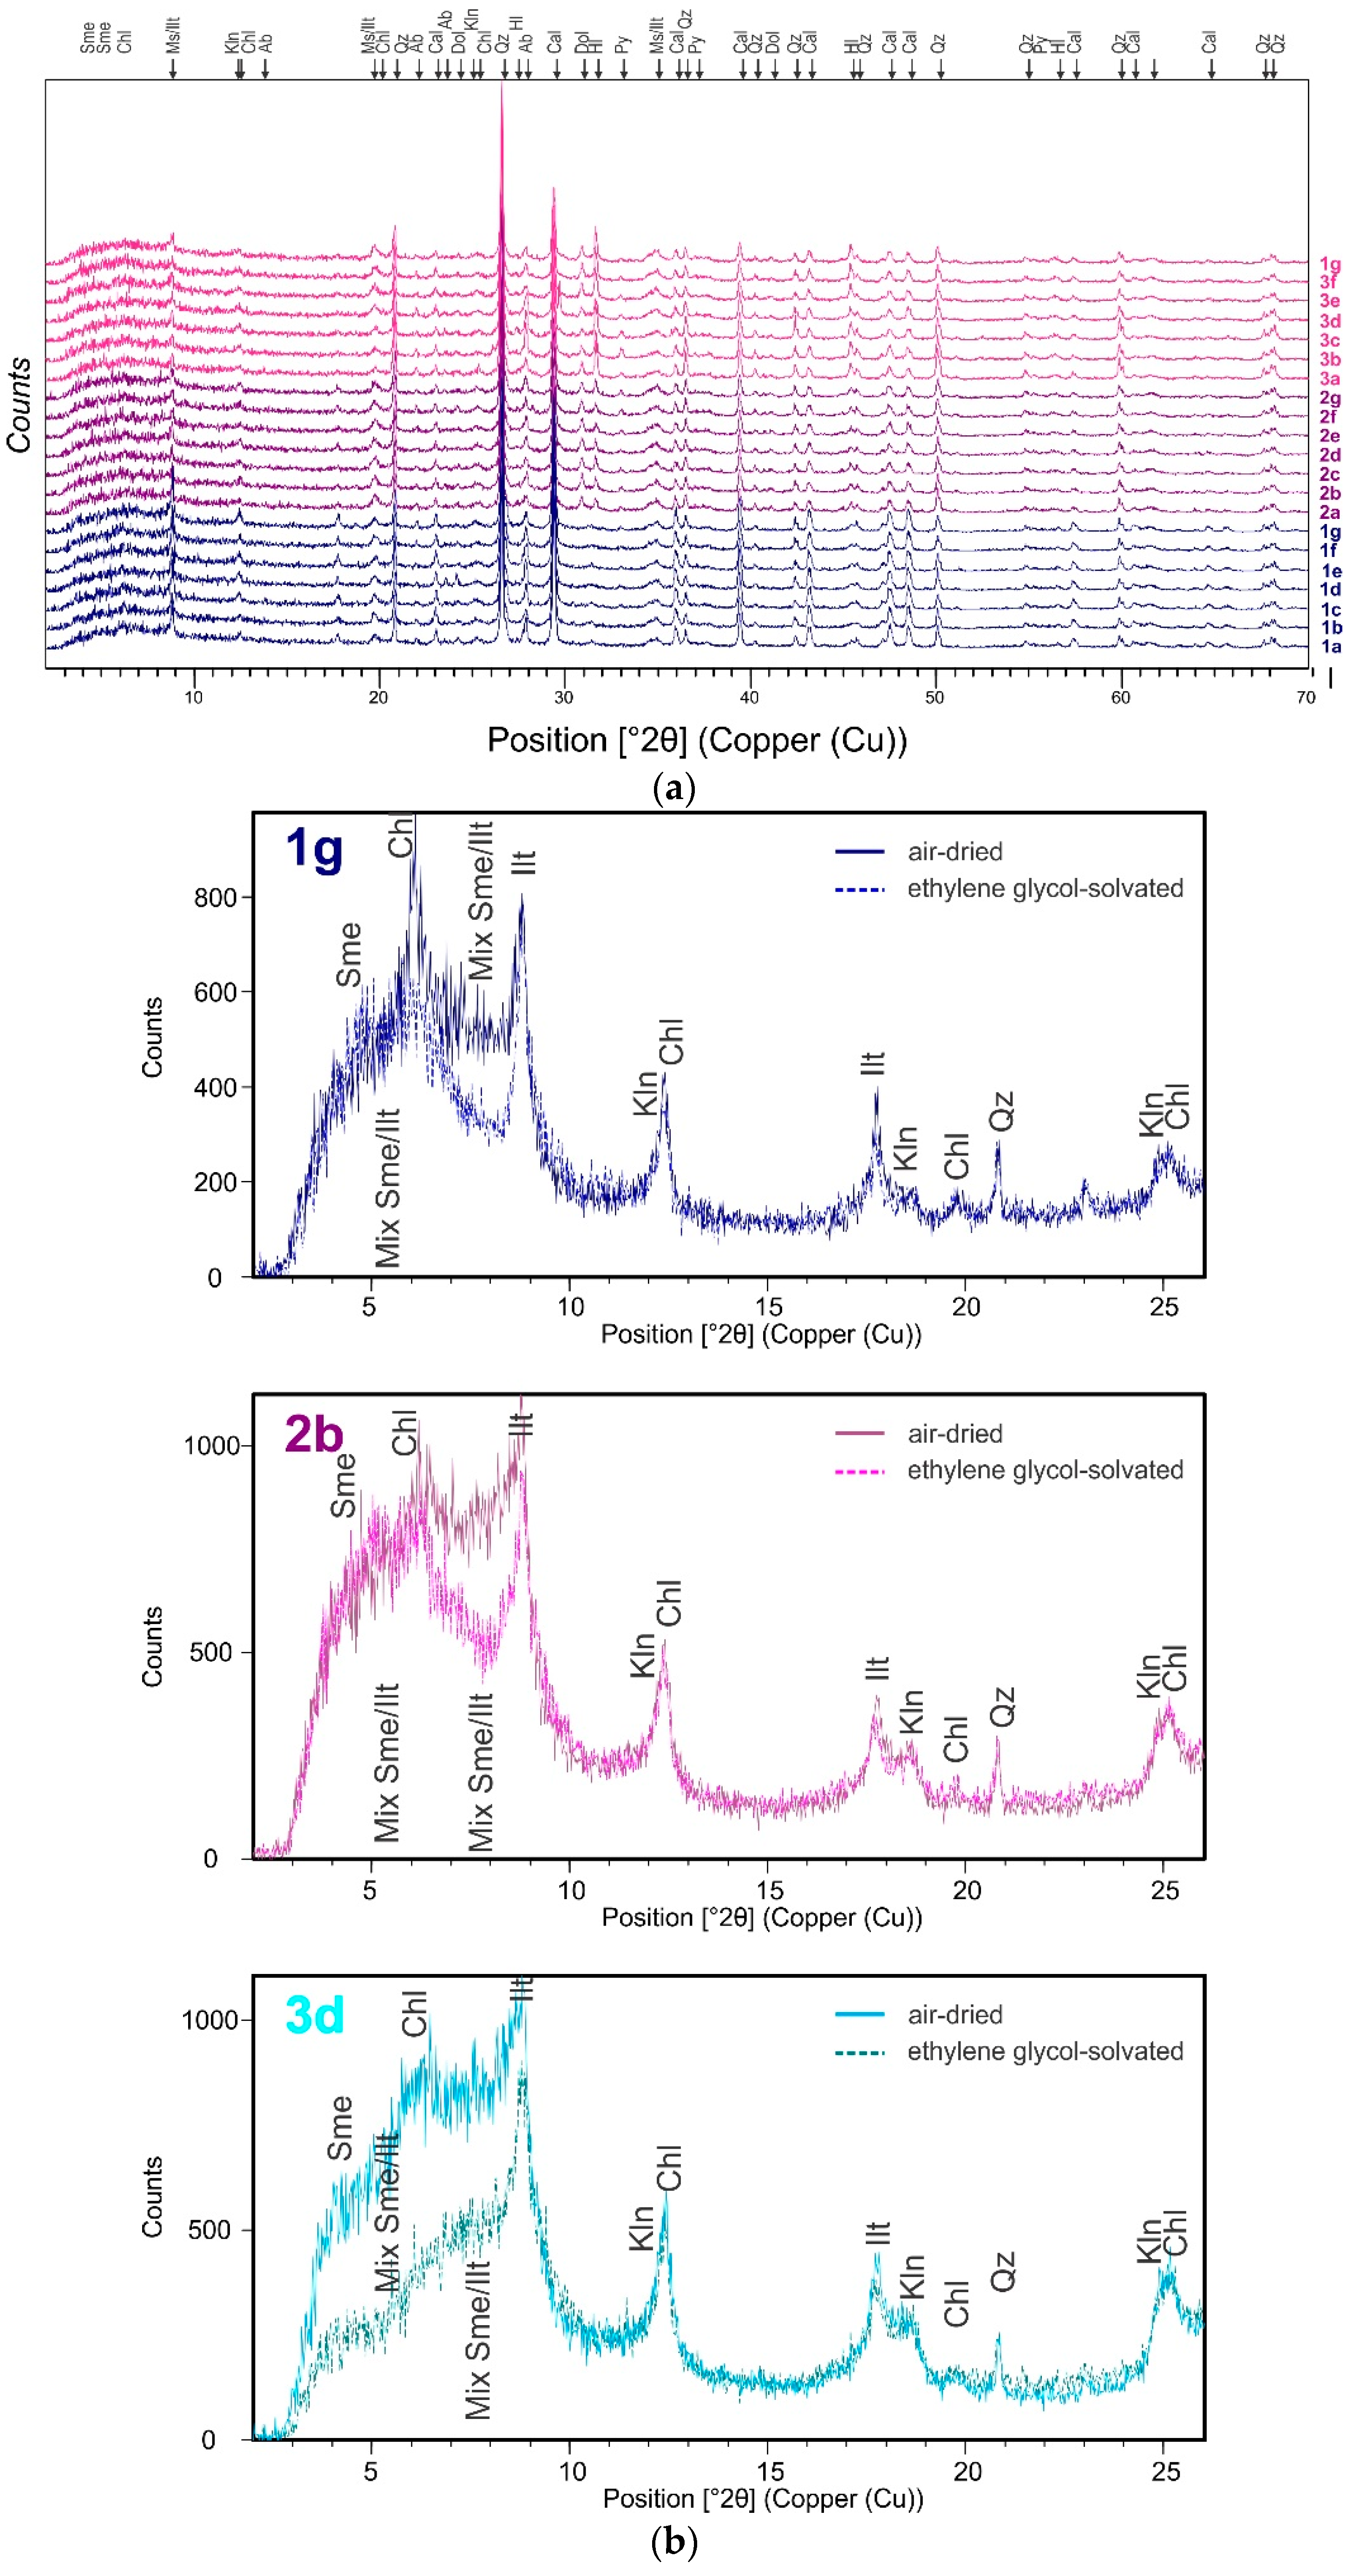
The mineral composition of sediment from the Port of Koper (Figure 7a) is comprised of high quantities of quartz, calcite, muscovite/illite, followed by albite, dolomite, chlorite, halite, and pyrite (Table 2). The above mineral association reflects the geological lithology of the Koper hinterland (e.g., carbonate and flysch) [24]. Minerals halite and pyrite form “in situ” as authigenic minerals. The XRD analysis (Figure 7b) showed trace quantities of kaolinite and interstratified smectite/illite layers present.
The concentrations of SiO2, Al2O3, Fe2O3, MgO, CaO, Na2O, K2O, TiO2, P2O5, MnO, and Cr2O3, detected in the sediment samples, are summarised in Table 3. The abundance of the major oxides in the sediment samples is very similar, especially for Na2O, K2O, TiO2, P2O5, MnO, and Cr2O3. These data correspond to results found in surface sediments from the open Adriatic Sea by Dolenec et al. [44]. As expected, major element values also correspond to the sediment mineralogy.
Concentration ranges for heavy metals in the sediment samples, with reference values, are included in Table 4. There are no significant differences in the metal concentrations between samples and no spatial distribution pattern is apparent for any of the metals along the individual sampling transects.
The Pearson correlation matrix results (Table 5) assigned a highly significant association between As and Sb, with a SAKFMP component and a positive correlation between Co, Cu, Ni, and Pb, with a SAKFMP component. This relation clearly points out the geogenic origin of As and Sb, and the slightly anthropogenic relation of Co, Cu, Ni, and Pb to sulphides, e.g., pyrite. Also, there was a significant relation noted between As and Sb, and between Co, Cu, Ni, and Pb, showing their common origin and geogenic/anthropogenic pathway. There were no other significant correlations recorded, especially for clay, silt, Mo, Sn, Zn, and TOT/C component. We attribute this to the fact that all values/data cannot present a very strong correlation, due to their similarity.
Sediment EF values around or lower than 1.0 indicate that the element in question originates predominantly from crustal material and/or weathering processes [45], whereas EF values greater than 1.0 reflect some level of anthropogenic contamination of the metal [46]. More recently, six contamination categories have been interpreted as suggested by Chen et al. [47]:
- EF < 3 minor enrichment (anthropogenic impact)
- EF = 3–5 moderate enrichment
- EF = 5–10 moderately severe enrichment
- EF = 10–25 severe enrichment
- EF = 25–50 very severe enrichment
- EF > 50 extremely severe enrichment
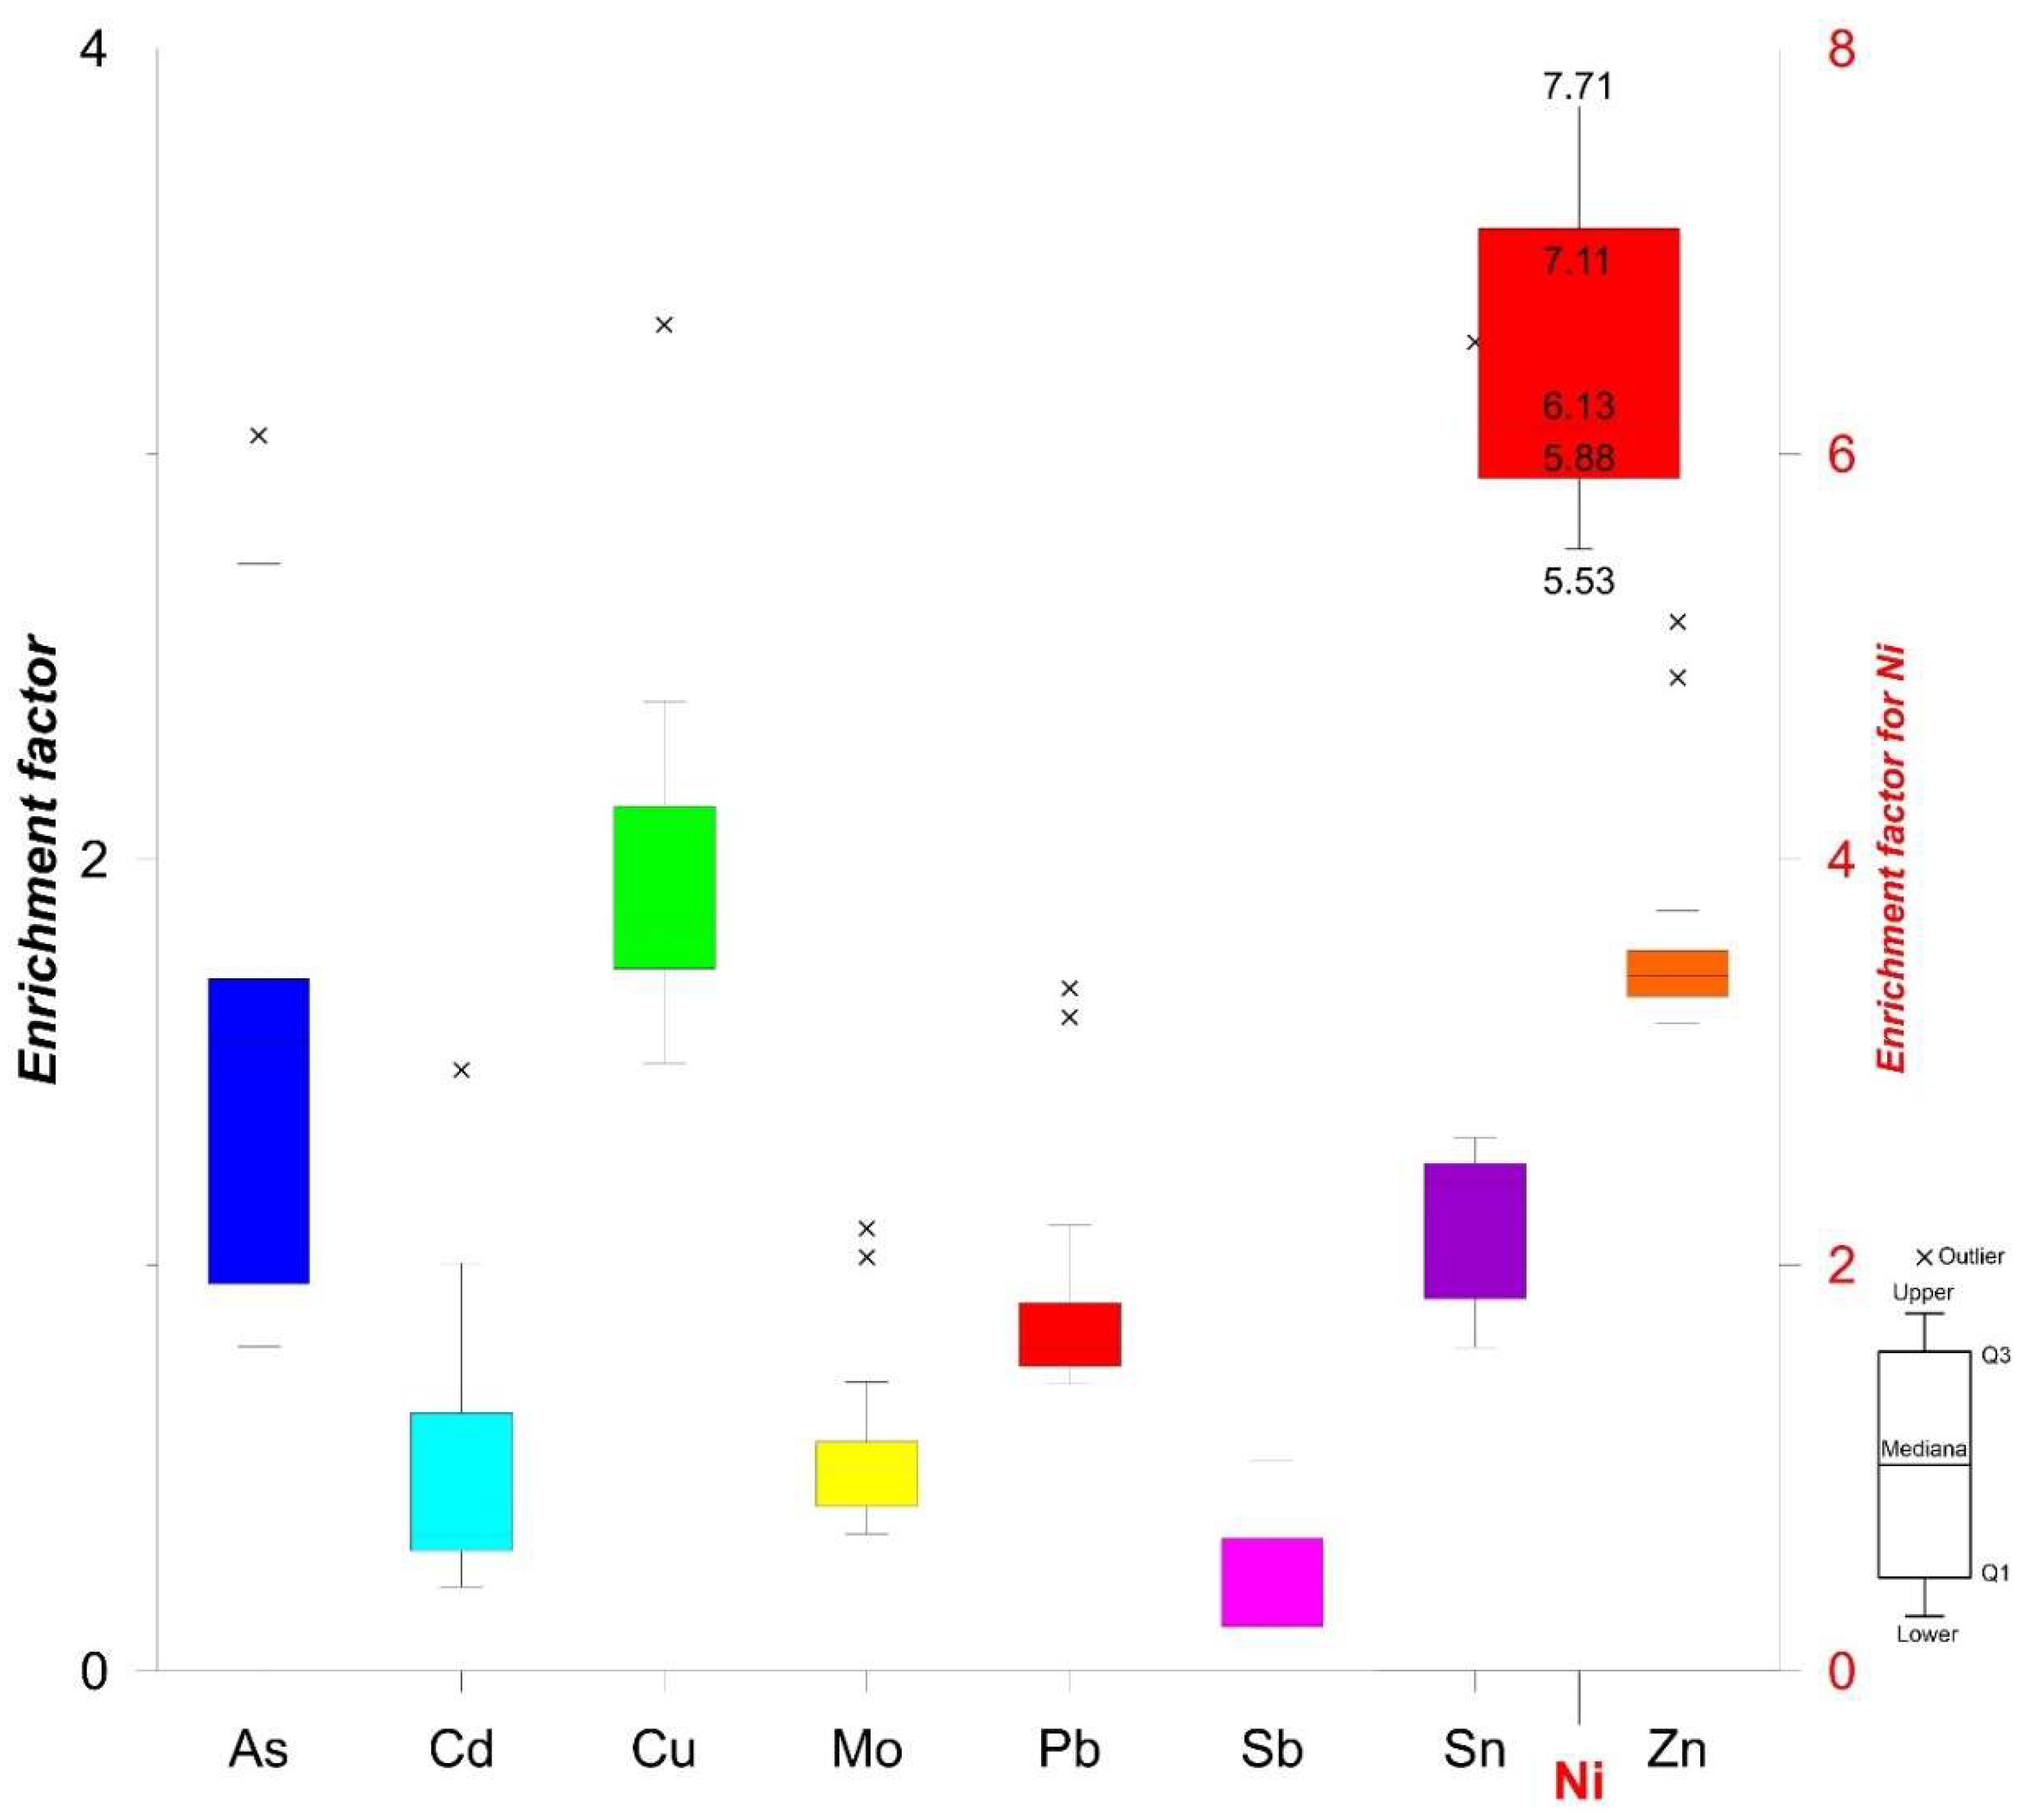
Enrichment factor calculations revealed that As, Cd, Cu, Mo, Pb, Sb, and Zn exhibit the lowest EF values among the heavy metals (Figure 8); these six elements are thus only minorly enriched in the sediments from the Port of Koper. The calculated EF value for Ni signified a moderately severe enrichment. The highest overall EF values were determined in samples from locations 1A–1G (Cu, Pb, Ni, Au, and Sb) and 3A–3C (Mo, Zn, As, and Cd). Ni originates from geogenic sources, i.e., the Eocene flysch basin from inland [24,48]. An average estimated amount of Ni in fine-grained clastic rocks is 60 mg kg−1 [49]. Eocene flysch basin is composed of carbonates and clastic rocks, especially siltstones and mudstones [24,48].
Additionally, the obtained results were compared to consensus-based sediment quality guidelines (SQGs), defined by [43] (Table 3). A comparison of sediment heavy metal concentrations with the consensus-based TEC and PEC values revealed that only mean concentrations of Ni are higher than both the TEC and PEC special values. As a result, the biota of the Koper Bay may currently be in danger of being contaminated with this element.
The EF and SQGs results suggest that ship traffic, the variety of cargo and the activity of the nearby chemical factory contribute to the anthropogenic loading of Ni in the Koper Bay area. However, the results of EF values and comparison with SQGs represent preliminary information regarding the levels of anthropogenic pressure on surface sediments from the Port of Koper.
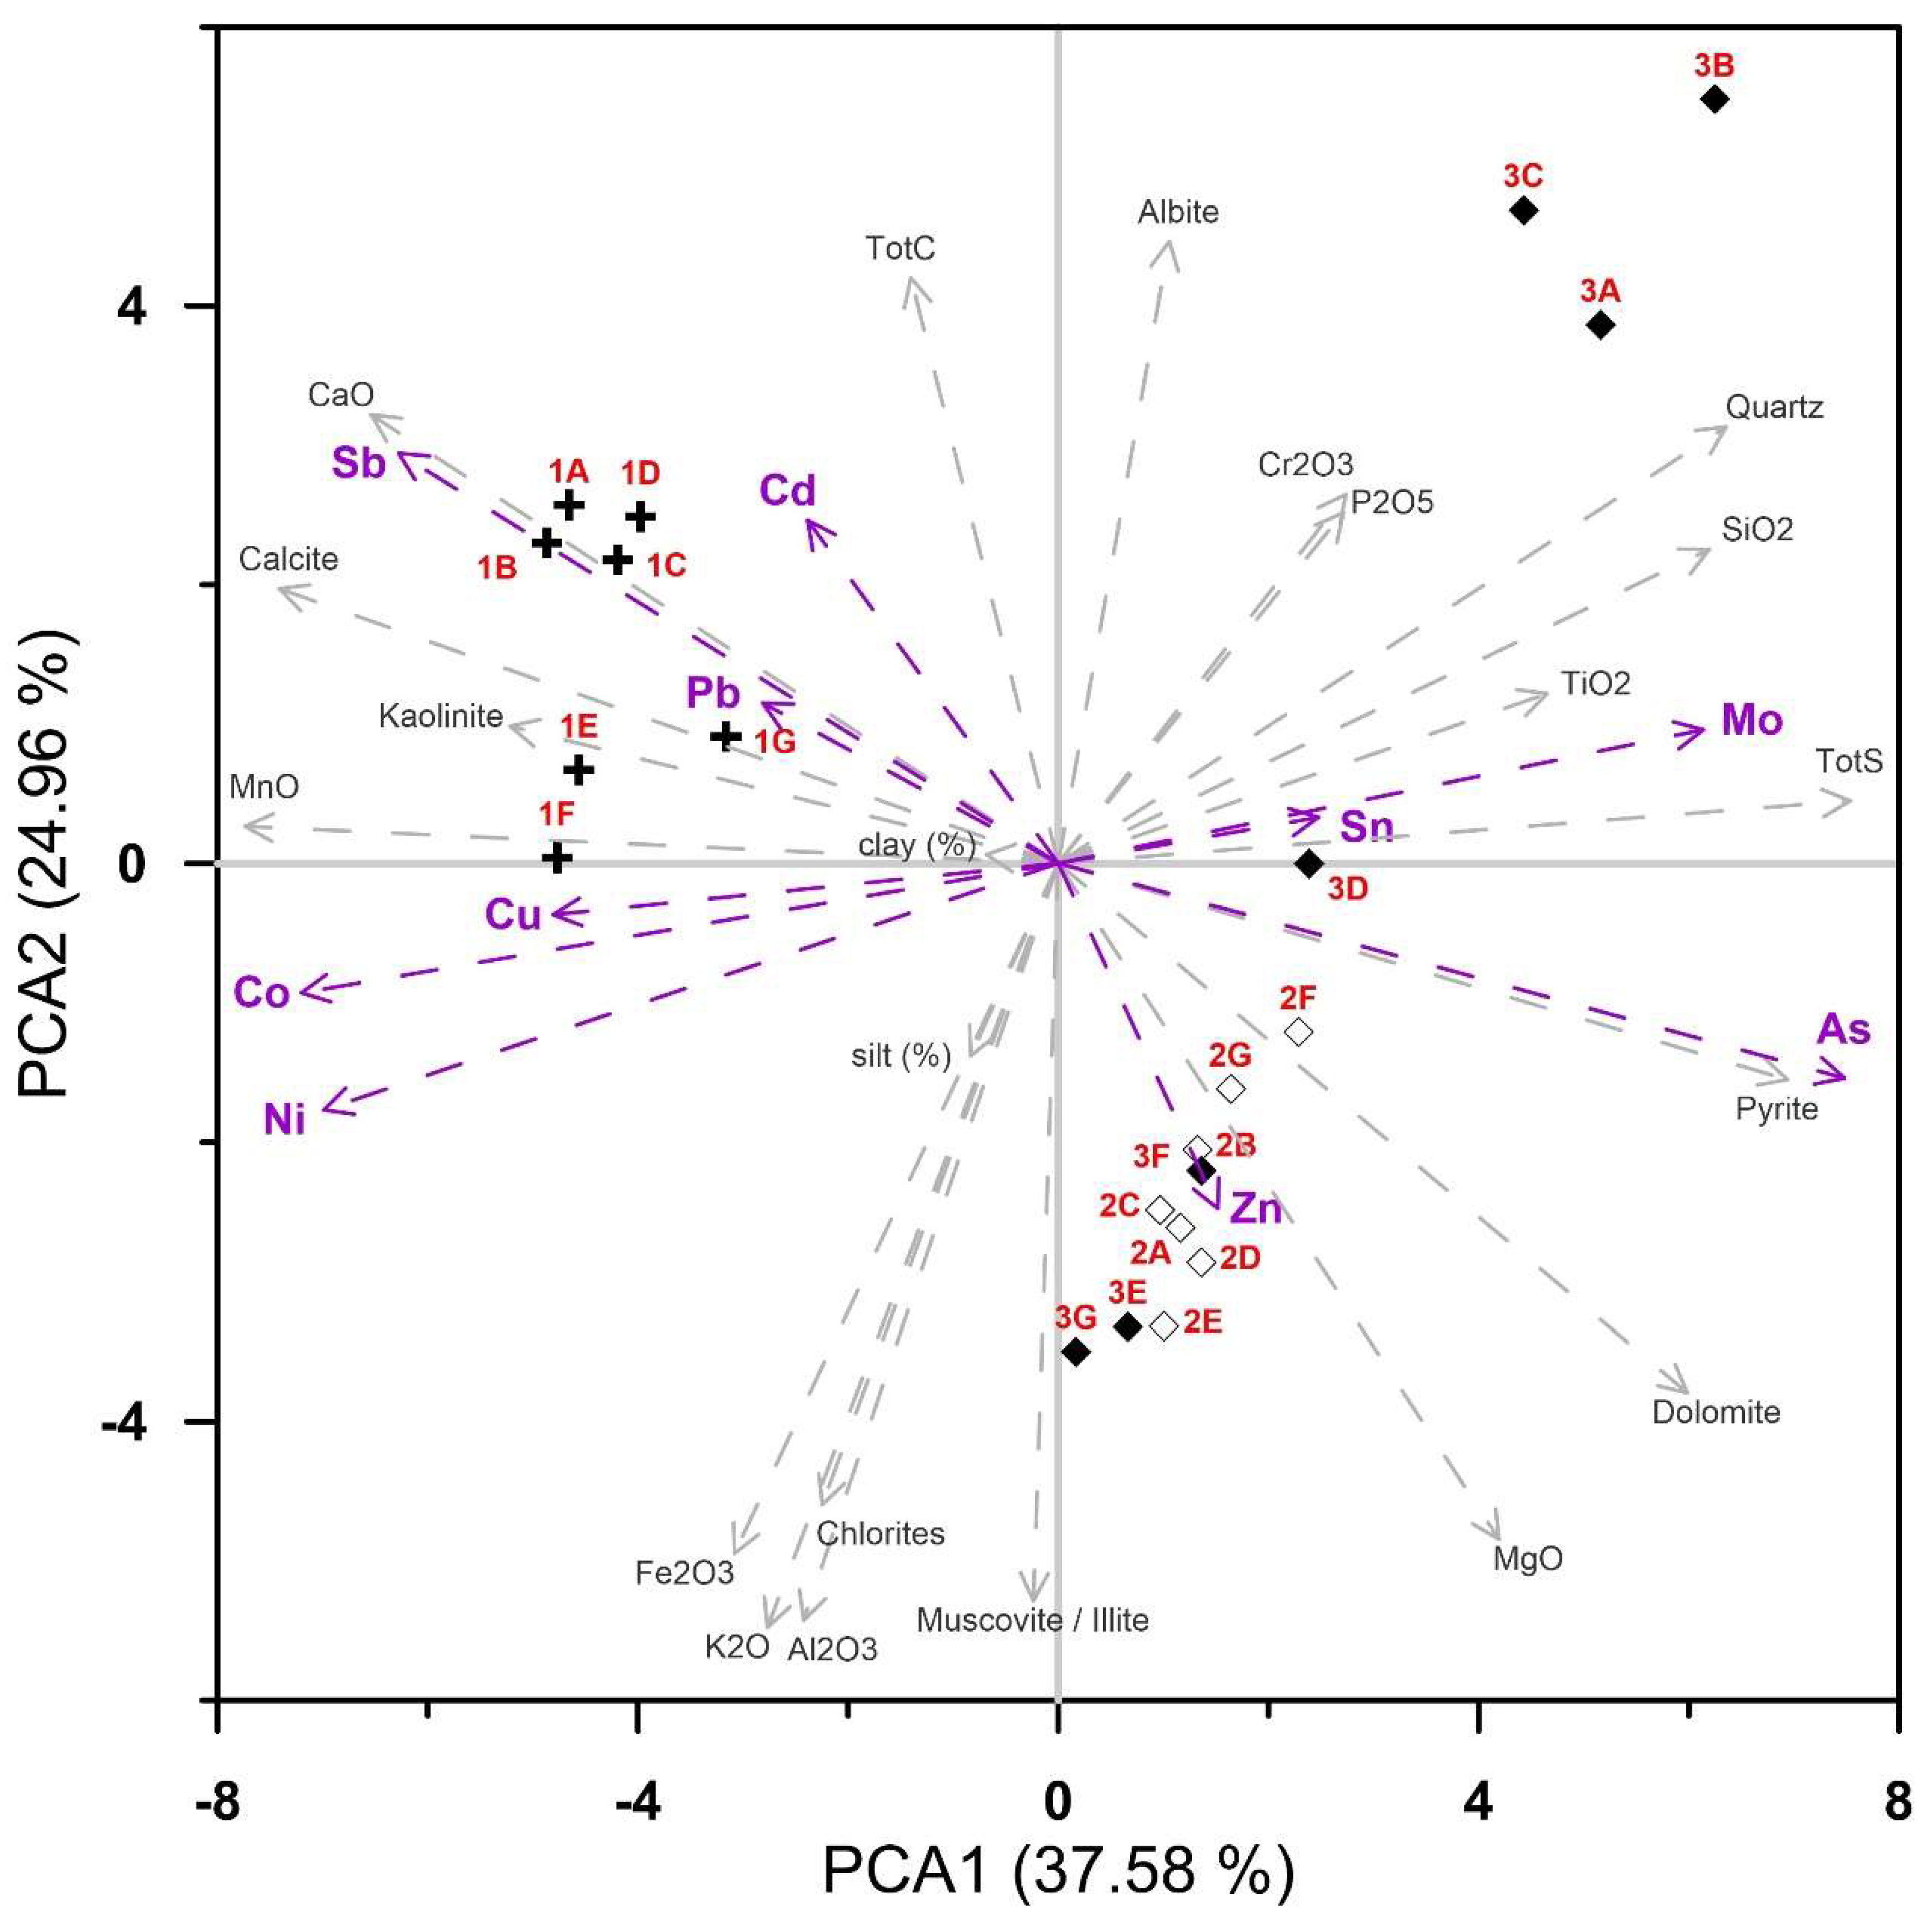
PCA (Figure 9) accounted for 62.5% of data variance in the first two ordination axes, revealing highly significant positive correlations in samples from location 1 between Sb, Pb, Cd, Cu, and Ni present in clay fractions. These heavy metals are generally incorporated into kaolinite lattice and fine carbonate mud with low content of organic matter. Samples from locations 2 and 3 showed elevated concentrations of Zn, As, pyrite, and dolomite. As is closely related to pyrite mineral. Samples 3a, 3b, and 3c displayed elevated values of Mo and Sn due to increased TBT (tributyl tin) sources. Quartz, plagioclase, chlorite, and muscovite/illite originated from flysch geological background. Fe, K, and Al were found in the silt fraction, which is prevailing in location 3.
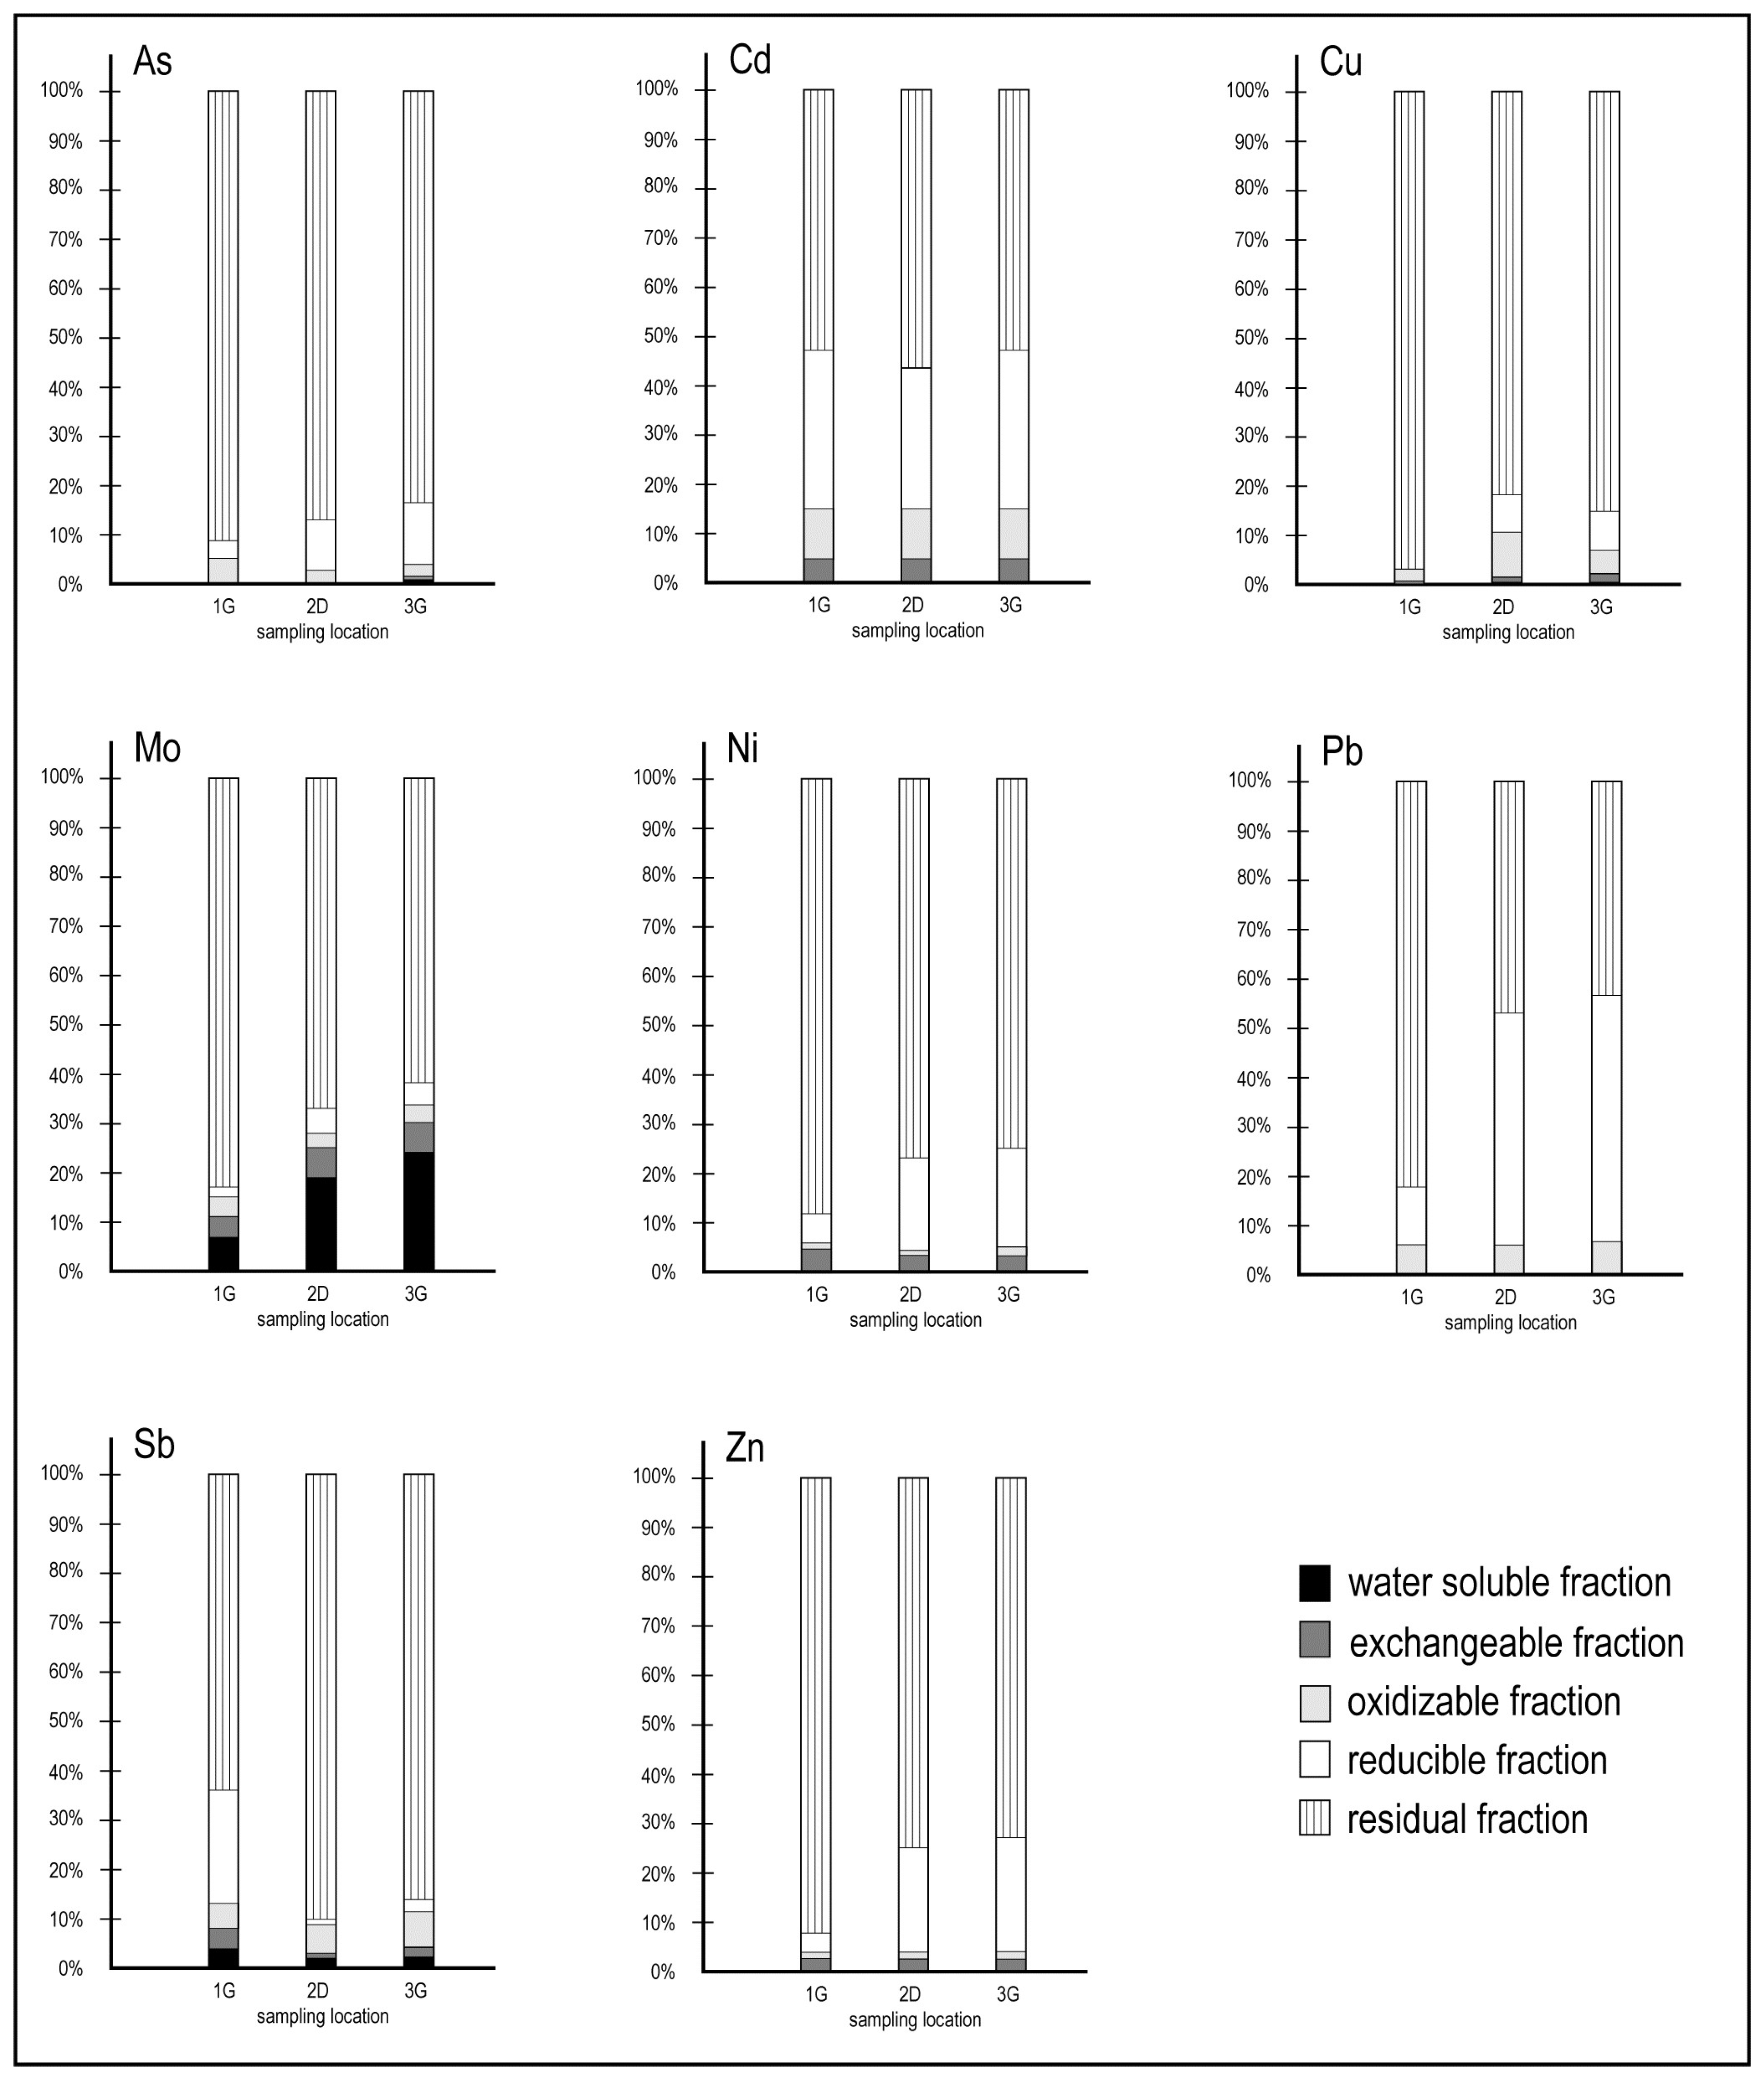
An important and final insight defining heavy metal pathways (bioavailability) and binding forms was decoded with the results of a sequential extraction procedure. The relative proportion in percent (%) obtained for each metal in different extracted fractions is illustrated in Figure 10. As displayed, similar proportions of each element were partitioned in respective fractions in all samples.
In the sequential leaching experiment, the labile/residual fractions considered were as follows: water-soluble fraction (1), exchangeable fraction (2), oxidisable fraction (3), reducible fraction (4), and residual fraction (5). Invariably, the data showed that the proportion of heavy metals fractionated in the residual fraction clearly dominated over those in the non-residual fractions.
Further, relatively minor trace amounts of As, Cd, Cu, Ni, Pb, Sb, and Zn (range from 0.01 to 4%) in the sediments were measured in the water-soluble fraction (1). However, Mo contents in this fraction were significantly higher (up to 24%, Figure 6). Mo becomes very mobile in neutral to alkaline conditions [50,51], and Mo adsorption on solid components is promoted with decreasing pH values [25]. It is deduced that the high proportion of Mo (Figure 10) in the water-soluble fraction of the samples indicates a greater potential ecological risk compared to other heavy metals.
Similar proportions of all elements studied were detected in the exchangeable fraction (2) (ranging from 0.2 to 5.8%, Figure 10), and there was no significant difference noted between the samples [52,53,54].
The oxidisable fraction (3) of As, Mo, Ni, and Zn counts approximately for 1%–5%, followed by 6%–10% for Cd, Pb, and Sb. Up to 10.1% of Cu was measured in the oxidisable phase (Figure 10), and additionally, other studies [52,53,54,55,56] have also reported an association between Cu and the oxidisable fraction, occurring as an organically complex metal species. Cu shows a high affinity with humic substances, which are a fraction of the natural organic matter chemically active in complexing such metals [57].
For the reducible fraction (4), Pb was the most prominent element (up to 50%). Pb can form stable complexes with Fe and Mn dioxide [58] and, accordingly, the highest proportion of Pb was found in the reducible phase. The reducible Pb predominating in the non-residual fractions has been reported by many studies [52,53,54,58,59,60]. The highest non-residual proportions were also determined for As, Cd, Ni, and Zn (Figure 10). As is often linked to amorphous Fe and Mn oxides [54], while Ni and Zn are usually linked to organic matter and sulphides in the oxidisable phase [52,53,54]. This could be connected with lower TOC values [22] and the prevailing sediment mineralogy of the Koper Bay (silt and clay prevail).
Cd speciation, as a typical anthropogenic element, is defined as highly variable, and it mostly enters into the aquatic environment through the discharge of industrial effluents [61]. On the other hand, a large proportion of Cd deposited in sediment can be remobilised as a result of the mineralisation of organic matter under oxic conditions [61].
The residual phase (5) comprises metals strongly bound within aluminosilicate minerals (crystalline lattices) [62] and they are, therefore, unlikely to be easily released in the aqueous phase under natural conditions.
More than 50% of As, Cd, Cu, Mo, Ni, Sb, and Zn (Figure 10) were measured in the residual phase, indicating a strong association within crystal lattices and, for this reason, they represent a geogenic character from a geological background with (1) no observable ecological risk to the surrounding ecosystems and (2) low pollution levels in sediments.
Metal speciation in sediments is of critical importance, indicating their potential toxicity and mobility to the surrounding ecosystems [63]. The “Risk Assessment Code” (RAC) has been used to assess the potential mobility and hazard of heavy metals based on the percentage of heavy metals in the water-soluble (1) and exchangeable (2) fraction. These fractions are considered to have weakly bounded metals that equilibrate with the aqueous phase and, thus, become rapidly bioavailable to the surrounding ecosystems [53,63].
According to calculated RAC values (%) (fraction (1) + fraction (2)), there are the following risks: <1%, no risk for the aquatic system; 1–10%, low risk; 11–30%, medium risk; 31–50%, high risk; and >50%, very high risk [64]. The RAC values are listed in Table 6. The results showed that the RAC values for Pb posed no risk; for As, Cd, Cu, Ni, Sb, and Zn, they exhibited a low risk, and Mo was defined as a medium ecological risk.
Although the mean concentrations of Ni are higher than the TEC and PEC special values, the calculated RAC values implied its low ecological risk. We can conclude that Ni origin in sediments studied is generally geogenic (flysch deposits from geological background, [24]. Medium ecological risk values for Mo indicated that Mo could be treated as anthropogenically imported, in particular, due to various cargo ship activities, the application of artificial fertilisers in agriculture and untreated domestic wastewater from the nearest coastal cities [25]. However, total Mo concentrations measured in the sediment samples are very low (mean values 1.1 mg kg−1), and its extraction values in water-soluble (1) and exchangeable (2) fraction are measured in parts per billion. We could not evaluate the abovementioned fact as a result of anthropogenic impact, though, we point out that Mo mobility potential, in comparison with other heavy metals, is very high.
Additionally, the Port of Koper has been an extremely anthropogenically burdened area for a long period of time and, generally, there is no aggressive anthropogenic heavy metals enrichment detected in the studied sediments.
4. Conclusions
An abundance of As, Cd, Cu, Mo, Ni, Pb, Sb, and Zn, and its environmental impact, were determined for surface sediment samples from the Port of Koper (Koper Bay, Adriatic Sea, Republic of Slovenia). The mineral association, quartz, calcite, illite/muscovite, albite, dolomite, and chlorite reflects the lithology of the source hinterland area.
Total concentrations of heavy metals exhibited a relatively slight spatial variation in the surface sediments of the Koper Bay, indicating mainly nonpoint source inputs. The environmental indices (EF) results showed that samples were marginally enriched with Cd, Cu, Mo, Pb, Sb, and Zn, moderately to severely enriched with Ni. A comparison of sediment heavy metal concentrations with the consensus-based TEC and PEC values pointed out that the mean concentrations of Ni are higher than both special values.
From the sequential chemical extraction experiment results, one can deduce that the majority of heavy metals (As, Cd, Cu, Mo, Ni, Sb, and Zn) can be considered immobile because of their high percentages (more than 50%) measured in the residual phase, suggesting that they are strongly bound to the crystal lattice of minerals. These metals have minimal anthropogenic derivative, and would likely be immobile from sediments (for bioavailability) due to environmental changes in pH and/or Eh.
By contrast, the highest proportion of Pb was found in the reducible phase and Mo was, relatively speaking, the heavy metal most easily extractable in the water-soluble fraction, which indicates adverse vulnerability to the resident biota.
The heavy metals’ potential risk to the surrounding environments as defined by “Risk Assessment Code” values exhibited generally no or low risk for all heavy metals, except for Mo. However, total Mo concentrations in the sediments and in water-soluble and exchangeable fractions are below alarming levels.
Author Contributions
Conceptualization, N.R.Š.; methodology, N.R.Š., M.D., S.K., A.M.; software, M.D.; formal analysis, N.R.Š., M.D., S.K., A.M.; investigation, N.R.Š., M.D., S.K., A.M.; writing—original draft preparation, N.R.Š.; writing—review and editing, N.R.Š.
Funding
The research was financially supported by the Slovenian Research Agency (ARRS), project L1-4311, Sediments in aquatic environments: their geochemical and mineralogical characterisation, remediation, and use as secondary raw materials.
Acknowledgments
We would like to thank Breda Mirtič and Tadej Dolenec for their involvement and support in the project. Many thanks also to the three anonymous reviewers.
Conflicts of Interest
The authors declare no conflicts of interest.
References
- Adamo, P.; Arienzo, M.; Imperato, M.; Naimo, D.; Nardi, G.; Stanzione, D. Distribution and partition of heavy metals in surface an sub-surface sediments of Naples city port. Chemosphere 2005, 61, 800–809. [Google Scholar] [CrossRef] [PubMed]
- Baptista Neto, J.A.; Smith, B.J.; McAllister, J.J. Heavy metal concentrations in surface sediments in a nearshore environment, Jurujuba Sound, Southeast Brazil. Environ. Pollut. 2000, 109, 1–9. [Google Scholar] [CrossRef]
- Dassenakis, M.; Adrianos, H.; Depiazi, G.; Konstantas, A.; Karabela, M.; Sakellari, A.; Scoullos, M. The use of various methods for the study of metal pollution in marine sediments, the case of Euvoikos Gulf, Greece. Appl. Geochem. 2003, 18, 781–794. [Google Scholar] [CrossRef]
- Ridgway, J.; Shimmield, G. Estuaries as repositories of historical contamination and their impact on shelf areas. Estuar. Coast. Shelf. Sci. 2002, 55, 903–928. [Google Scholar] [CrossRef]
- Xu, B.; Yang, X.; Gu, Z.; Zhang, Y.; Chen, Y.; Lv, Y. The trend and extent of heavy metal accumulation over last one hundred years in the Liaodong Bay, China. Chemosphere 2009, 75, 442–446. [Google Scholar] [CrossRef] [PubMed]
- Arnason, J.G.; Fletcher, B.A. A 40+ year record of Cd, Hg, Pb and U deposition in sediments of Patroon Reservoir, Albany County, NY, USA. Environ. Pollut. 2003, 123, 383–391. [Google Scholar] [CrossRef]
- Horvat, M.; Covelli, S.; Faganeli, J.; Logar, M.; Mandic, V.; Rajar, R.; Sirca, A.; Zagar, D. Mercury in contaminated coastal environments; A case study: The Gulf of Trieste. Sci. Total Environ. 1997, 237, 43–56. [Google Scholar] [CrossRef]
- Point, D.; Monperrus, M.; Tessier, E.; Amouroux, D.; Chavaud, L.; Thouzeau, G.; Jean, F.; Amice, E.; Grall, J.; Leynaert, A.; et al. Biological control of trace metal and organometal benthic fluxes in a eutrophic lagoon (Thau Lagoon, Mediterranean Sea, France). Estuar. Coast. Shelf. Sci. 2007, 72, 457–471. [Google Scholar] [CrossRef]
- Westerlund, S.F.G.; Anderson, L.G.; Hall, P.O.J.; Iverfeldt, Ǻ.; Rutgers van der Loeff, M.M.; Sundby, B. Benthic fluxes of cadmium, copper, nickel, zinc and lead in the coastal environment. Geochim. Cosmochim. Acta 1986, 50, 1289–1296. [Google Scholar] [CrossRef]
- Adriano, D.C. Trace Elements in Terrestrial Environments: Biogeochemistry, Bioavailability and Risks of Metals, 2nd ed.; Springer: New York, NY, USA, 2001; 867p. [Google Scholar]
- Alloway, B.J. Heavy Metals in Soils, 1st ed.; Blackie & Son: New York, NY, USA, 1990; 371p. [Google Scholar]
- Förstner, U.; Wittmann, G.T.W. Metal Pollution in the Aquatic Environment, 1st ed.; Springer: Berlin, Germany, 1979; 486p. [Google Scholar]
- Adami, G.; Barbieri, P.; Campisi, B.; Predonzani, S.; Reisenhofer, E. Anthropogenic heavy metal distribution in sediments from an area exposed to industrial pollution (Harbour of Trieste, Northern Adriatic Sea). Bollettino Società Adriatica di Scienze 1996, 77, 5–18. [Google Scholar]
- Brambati, A.; Venzo, G.A. Recent sedimentation in the Northern Adriatic Sea between Venice and Trieste. Studi Trentini Scienze Naturali. Sezione 1967, A44, 202–274. [Google Scholar]
- Barbieri, P.; Adami, G.; Predonzani, S.; Reisenhofer, E. Heavy metals in surface sediments near urban and industrial sewage discharges in the Gulf of Trieste. Toxicol. Environ. Chem. 1999, 71, 105–114. [Google Scholar] [CrossRef]
- Colizza, E.; Fontolan, G.; Brambati, A. Impact of a coastal disposal site for inert wastes on the physical marine environment, Barcola-Bovedo, Trieste, Italy. Environ. Geol. 1996, 27, 270–285. [Google Scholar] [CrossRef]
- Covelli, S.; Fontolan, G. Application of a normalization procedure in determining regional geochemical baselines: Gulf of Trieste, Italy. Environ. Geol. 1997, 30, 34–45. [Google Scholar] [CrossRef]
- Covelli, S.; Fontolan, G.; Faganeli, J.; Ogrinc, N. Anthropogenic markers in the Holocene stratigraphic sequence of the Gulf of Trieste (northern Adriatic Sea). Mar. Geol. 2005, 230, 29–51. [Google Scholar] [CrossRef]
- Cibic, T.; Acquavita, A.; Aleffi, F.; Bettoso, N.; Blasutto, O.; De Vittor, C.; Falconi, C.; Falomo, J.; Faresi, L.; Predonzani, S.; et al. Integrated approach to sediment pollution: A case study in the Gulf of Trieste. Mar. Pollut. Bull. 2008, 56, 1650–1667. [Google Scholar] [CrossRef] [PubMed]
- Donazzolo, R.; Hieke Merlin, O.; Menegazzo Vitturi, I.; Orio, A.A.; Pavoni, B.; Perin, G.; Rabitti, S. Heavy metal contamination in surface sediments from the Gulf of Venice, Italy. Mar. Pollut. Bull. 1981, 12, 417–425. [Google Scholar] [CrossRef]
- Donazzolo, R.; Hieke Merlin, O.; Menegazzo Vitturi, L.; Pavoni, B. Heavy metal content and lithological properties of recent sediments in the Northern Adriatic. Mar. Pollut. Bull. 1984, 15, 93–101. [Google Scholar] [CrossRef]
- Faganeli, J.; Planinc, R.; Pezdic, J.; Smodis, B.; Stegnar, P.; Ogorelec, B. Marine geology of the Gulf of Trieste (North Adriatic): Geochemical aspects. Mar. Geol. 1991, 99, 93–108. [Google Scholar] [CrossRef]
- Ogorelec, B.; Misic, M.; Faganeli, J. Marine geology of the Gulf of Trieste (northern Adriatic): Sedimentological aspects. Mar. Geol. 1991, 99, 79–92. [Google Scholar] [CrossRef]
- Ogorelec, B.; Mišič, M.; Faganeli, J.; Stegnar, P.; Vrišer, B.; Vukovič, A. The recent sediment of the Bay of Koper (Northern Adriatic). Geologija 1987, 30, 87–121. [Google Scholar]
- Bradl, H.B. Heavy Metals in the Environments: Origin, Interaction and Remediation; Elsevier: Amsterdam, The Netherlands, 2005; 282p. [Google Scholar]
- Placer, L. Principles of the tectonic subdivision of Slovenia. Geologija 2008, 51, 205–217. [Google Scholar] [CrossRef]
- Placer, L.; Vrabec, M.; Celarc, B. Osnove razumevanja tektonske zgradbe NW Dinaridov in polotoka Istre. Geologija 2010, 53, 55–86. [Google Scholar] [CrossRef]
- Vrabec, M.; Šmuc, A.; Pleničar, M.; Buser, S. Geological evolution of Slovenia—An overview. In The Geology of Slovenia; Pleničar, M., Ogorelec, B., Novak, M., Eds.; Slovenian Geological Survey: Ljubljana, Slovenia, 2009; pp. 23–40. [Google Scholar]
- Trobec, A.; Šmuc, A.; Poglajen, S.; Vrabec, M. Submerged and buried Pleistocene river channels in the Gulf of Trieste (Northern Adriatic Sea): Geomorphic, stratigraphic and tectonic inferences. Geomorphology 2017, 286, 110–120. [Google Scholar] [CrossRef]
- Trobec, A.; Busetti, M.; Zgur, F.; Baradello, L.; Babich, A.; Cova, A.; Gordini, E.; Romeo, R.; Tomini, I.; Poglajen, S.; et al. Thickness of marine Holocene sediment in the Gulf of Trieste (northern Adriatic Sea). Earth Syst. Sci. Data 2018, 10, 1077–1092. [Google Scholar] [CrossRef]
- Blott, S.J.; Pye, K. GRADISTAT: A grain size distribution and statistics package for the analysis of unconsolidated sediments. Earth Surf. Process. Landf. 2001, 26, 1237–1248. [Google Scholar] [CrossRef]
- Filgueiras, A.V.; Lavilla, I.; Bendicho, C. Chemical sequential extraction for metal partitioning in environmental solid samples. J. Environ. Monit. 2002, 4, 823–857. [Google Scholar] [CrossRef] [PubMed]
- Dean, J.R. Bioavailability, Bioaccessibility and Mobility of Environmental Contaminants; Wiley: London, UK, 2007; 316p. [Google Scholar]
- Rao, C.R.M.; Sahuquillo, A.; Lopez Sanches, J.F. A review of the different methods applied in environmental geochemistry for single and sequential extraction of trace elements in soil and related materials. Water Air Soil Pollut. 2008, 189, 291–333. [Google Scholar] [CrossRef]
- Forghani, G.; Moore, F.; Lee, S.; Qishlaqi, A. Geochemistry and speciation of metals in sediments of the Maharlu Saline Lake. Environ. Earth. Sci. 2009, 59, 173–184. [Google Scholar] [CrossRef]
- Verbovšek, T. A comparison of parameters below the limit of detection in geochemical analyses by substitution methods. RMZ Mater. Geoenviron. 2011, 58, 393–404. [Google Scholar]
- Aitchison, J. Statistical Analysis of Compositional Data; Chapman & Hall: New York, NY, USA, 1986; 416p. [Google Scholar]
- Davis, J.C. Statistical and Data Analysis in Geology, 2nd ed.; John Wiley and Sons: New York, NY, USA, 1986; 646p. [Google Scholar]
- Ilenič, A. Geochemical and Isotopic Study of Surface Sediments and Banded Dye Murex Muscles from Selected Locations in the National Park Kornati, Croatia. Bachelor´s Thesis, University of Ljubljana, Faculty of Natural Sciences and Engineering, Ljubljana, Slovenia, 2017. [Google Scholar]
- Kemp, A.L.W.; Thomas, R.L.; Dell, C.I.; Jaquet, J.M. Cultural impact on the geochemistry of sediments in Lake Erie. Can. J. Fish. Aquat. Sci. 1976, 33, 440–485. [Google Scholar] [CrossRef]
- Van Metre, P.C.; Callender, E. Water quality trends in white rock creek basin from 1912–1994 identified using sediment cores from white rock lake reservoir, Dallas, Texas. J. Paleolimnol. 1997, 17, 239–249. [Google Scholar] [CrossRef]
- Chen, C.W.; Kao, C.M.; Chen, C.F.; Dong, C.D. Distribution and accumulation of heavy metals the sediments of Kaohsiung Harbor, Taiwan. Chemosphere 2007, 66, 1431–1440. [Google Scholar] [CrossRef] [PubMed]
- MacDonald, D.D.; Ingersoll, G.; Berger, T.A. Development and evaluation of consensus-based sediment quality guidelines for freshwater ecosystems. Arch. Environ. Contam. Toxicol. 2000, 39, 20–31. [Google Scholar] [CrossRef] [PubMed]
- Dolenec, T.; Faganeli, J.; Pirc, S. Major, minor and trace elements in surface sediments from the open Adriatic Sea: A regional geochemical study. Geol. Croat. 1998, 51, 59–73. [Google Scholar]
- Zhang, J.; Liu, C.L. Riverine composition and estuarine geochemistry of particulate metals in China—Weathering features, anthropogenic impact and chemical fluxes. Estuar. Coast. Shelf. Sci. 2002, 54, 1051–1070. [Google Scholar] [CrossRef]
- Szefer, P.; Glasby, G.P.; Szefer, K.; Pempkowiak, J.; Kaliszan, R. Heavy-metal pollution in superficial sediments from the southern Baltic Sea of Poland. J. Environ. Sci. Health 1996, 31A, 2723–2754. [Google Scholar]
- Chen, C.; Lu, Y.; Hong, J.; Ye, M.; Wang, Y.; Lu, H. Metal and metalloid contaminant availability in Yundang Lagoon sediments, Xiamen Bay, China, after 20 years continuous rehabilitation. J. Hazard. Mater. 2010, 175, 1048–1055. [Google Scholar] [CrossRef] [PubMed]
- Zupančič, N.; Skobe, S. Anthropogenic environmental impact in the Mediterranean coastal area of Koper/Capodistria, Slovenia. J. Soils Sediments 2014, 14, 67–77. [Google Scholar] [CrossRef]
- Taylor, S.R.; McLennan, S.M. The geochemical evaluation of the continental crust. Rev. Geophys. 1995, 33, 241–265. [Google Scholar] [CrossRef]
- Reimann, C.; de Caritat, P. Chemical Elements in the Environment: Factsheets for the Geochemist and Environmental Scientist; Springer: Berlin, Germany, 1998; 398p. [Google Scholar]
- Yu, C.; Xu, S.; Gang, M.; Zhou, L.; Chen, G. Molybdenum pollution and speciation in Nver River sediments impacted with Mo mining activities in western Liaoning, northeast China. Int. J. Environ. Res. 2011, 5, 205–212. [Google Scholar]
- Gao, X.; Chen, C.A.; Wang, G.; Xue, Q.; Tang, C.; Chen, S. Environmental status of Daya Bay surface sediments inferred from a sequential extraction technique. Estuar. Coast. Shelf. Sci. 2010, 86, 369–378. [Google Scholar] [CrossRef] [Green Version]
- Komar, D.; Dolenec, T.; Dolenec, M.; Vrhovnik, P.; Lojen, S.; Lambaša, Ž.; Kniewald, G.; Rogan Šmuc, N. Physico-chemical and geochemical characterization of Makirina Bay peloid mud and its evaluation for potential use in balneotherapy (N Dalmatia, Republic of Croatia). Indian J. Tradit. Knowl. 2015, 14, 5–12. [Google Scholar]
- Marin, B.; Valladon, M.; Polve, M.; Monaco, A. Reproducibility testing of a sequential extraction scheme for the determination of trace metal speciation in a marine reference sediment by inductively coupled plasma-mass spectrometry. Anal. Chim. Acta 1997, 342, 91–112. [Google Scholar] [CrossRef]
- Pardo, R.; Barrado, E.; Castrillejo, Y.; Velasco, M.A.; Vega, M. Study of the contents and speciation of heavy metals in river sediments by factor analysis. Anal. Lett. 1993, 26, 1719–1739. [Google Scholar] [CrossRef]
- Pempkowiak, J.; Sikora, A.; Biernacka, E. Speciation of heavy metals in marine sediments vs. their bioaccumulation by mussels. Chemosphere 1999, 39, 313–321. [Google Scholar] [CrossRef]
- Fernandes, H.M. Heavy metal distribution in sediments and ecological risk assessment: The role of diagenetic processes in reducing metal toxicity in bottom sediment. Environ. Pollut. 1997, 97, 317–325. [Google Scholar] [CrossRef]
- Ip, C.C.M.; Li, X.D.; Zhang, G.; Wai, O.W.H.; Li, Y.S. Trace metal distribution in sediments of the Pearl River Estuary and the surrounding coastal area, South China. Environ. Pollut. 2007, 147, 311–323. [Google Scholar] [CrossRef] [PubMed] [Green Version]
- Li, X.D.; Shen, Z.G.; Wai, O.W.H.; Li, Y.S. Chemical forms of Pb, Zn and Cu in the sediment profiles of the Pearl River Estuary. Mar. Pollut. Bull. 2001, 42, 215–223. [Google Scholar] [CrossRef]
- Petersen, W.; Wallmann, K.; Li, P.L.; Schroeder, F.; Knauth, H.D. Exchange of trace elements of the sediment-water interface during early diagenesis processes. Mar. Freshw. Res. 1995, 46, 19–26. [Google Scholar]
- Xiao, R.; Bai, J.H.; Lu, Q.Q.; Zhao, Q.Q.; Gao, Z.Q.; Wen, X.J.; Liu, X.H. Fractionation, transfer, and ecological risks of heavy metals in riparian and ditch wetlands across a 100-year chronosequence of reclamation in an estuary of China. Sci. Total Environ. 2015, 517c, 66–75. [Google Scholar] [CrossRef] [PubMed]
- Ghrefat, H.; Yusuf, N. Assessing Mn, Fe, Cu, Zn and Cd pollution in bottom sediments of Wadi Al-Arab Dam, Jordan. Chemosphere 2006, 65, 2114–2121. [Google Scholar] [CrossRef] [PubMed]
- Nemati, K.; Abu Bakar, N.K.; Abas, M.R.; Sobhanzadeh, E. Speciation of heavy metals by modified BCR sequential extraction procedure in different depths of sediments from Sunghai Buloh, Malaysia. J. Hazard. Mater. 2001, 192, 402–410. [Google Scholar]
- Jain, C.K. Metal fractionation study on bed sediments of River Yamuna, India. Water Res. 2004, 38, 569–578. [Google Scholar] [CrossRef] [PubMed]
Figure 1.
Geographical map of the study area.

Figure 2.
Geological map of the study area.

Figure 3.
Sampling positions in the Port of Koper area.

Figure 4.
Grain-size distribution of Koper bay sediments (according to Textural Triangle Diagram ISSS System of Classification).
Figure 4.
Grain-size distribution of Koper bay sediments (according to Textural Triangle Diagram ISSS System of Classification).

Figure 5.
Boxplot of total C values in sediment.

Figure 6.
Boxplot of total S values in sediment.

Figure 7.
(a) XRD diagram of Koper Bay sediments studied; the uppercase letters describe the mineral composition of the samples. (b) XRD diagrams of samples-oriented preparation; abbrevations: Sme (smectite), Chl (chlorite), Ill (illite), Klh (kaolinite), Qz (quartz).
Figure 7.
(a) XRD diagram of Koper Bay sediments studied; the uppercase letters describe the mineral composition of the samples. (b) XRD diagrams of samples-oriented preparation; abbrevations: Sme (smectite), Chl (chlorite), Ill (illite), Klh (kaolinite), Qz (quartz).

Figure 8.
Candlestick chart of enrichment factor (EF) values for investigated heavy metals.

Figure 9.
PCA figure including locations, major oxides, heavy metals, grain-size and mineral composition.
Figure 9.
PCA figure including locations, major oxides, heavy metals, grain-size and mineral composition.

Figure 10.
Heavy metals partitioning in randomly chosen sediment samples 1G, 2D, and 3G.


Table 1.
Summary of sequential leaching process.
| Step | Fraction | Chemical Reagents | Components Extracted and Description |
|---|---|---|---|
| 1. | Water-soluble | Deionised water | The water-soluble leach attacks any water-soluble component or most labile bound components. Thus, the heavy metals extracted are relatively labile, and may be potentially bioavailable to the surrounding ecosystem [32,33,34]. |
| 2. | Exchangeable | Sodium acetate (pH 5) at 30 °C for one hour | Fraction (2) includes exchangeable cations adsorbed by clay and elements co-precipitated with carbonates present in many types of sediments. Changes caused by ion-exchange processes, which influence adsorption–desorption reactions or lower the pH values, could provoke remobilisation of heavy metals from this fraction [32,33,34]. |
| 3. | Oxidisable | Sodium pyrophosphate | Oxidisable fraction (3) corresponds to heavy metals adsorbed by organic material (humic and fulvic components). Heavy metals associated with organic material are assumed to remain in sediments for longer periods, but may be mobilised by decomposition processes. Degradation of organic matter under oxidising conditions can lead to a release of soluble heavy metals bound to this component [34,35]. |
| 4. | Reducible | (hot) Hydroxylamine at 60 °C for two hours | Fraction (4) is linked to amorphous Fe oxides, which are thermodynamically unstable under anoxic circumstances, and to naturally occurring crystalline Fe and Mn oxide minerals. Heavy metals incorporated in Fe and Mn oxides crystal lattices are regarded as stable, and are not susceptible to remobilisation under normal environmental conditions [32,33,34,35]. |
| 5. | Residual | Four acid digestion | Residual (5) contains heavy metals included within lithogenic (primary and secondary minerals) mineral crystal lattices, which are not expected to release from sediments under normal environmental conditions. These elements (heavy metals) have a very low bioavailability potential [32,33,34,35]. |
Table 2.
Mineralogical composition in %.
| Sample | Quartz | Calcite | Pyrite | Albite | Chlorites | Muscovite/Illite | Kaolinite | Halite | Dolomite |
|---|---|---|---|---|---|---|---|---|---|
| 1A | 33.3 | 41.8 | 0.2 | 9.7 | 5.6 | 8.5 | 0.8 | - | - |
| 1B | 31.3 | 43.9 | 0.2 | 6.4 | 4.2 | 13.3 | 0.6 | - | - |
| 1C | 30.7 | 44.6 | 0.4 | 7.3 | 6.3 | 10.4 | 0.3 | - | - |
| 1D | 34.3 | 40.3 | 0.5 | 8.2 | 5.7 | 10.3 | 0.7 | - | - |
| 1E | 32.1 | 40.1 | 0.3 | 10.1 | 8.1 | 8.9 | 0.4 | - | - |
| 1F | 32.3 | 39.2 | 0.2 | 7.8 | 8.3 | 12.1 | 0.1 | - | - |
| 1G | 32.8 | 41.7 | 0.3 | 7.0 | 7.7 | 10.5 | 0.1 | - | - |
| 2A | 34.3 | 23.3 | 0.9 | 5.5 | 8.3 | 16.0 | 0.2 | 2.0 | 9.4 |
| 2B | 35.9 | 21.7 | 0.9 | 7.0 | 6.7 | 15.0 | 0.1 | 2.2 | 10.7 |
| 2C | 35.3 | 24.3 | 0.9 | 4.5 | 6.7 | 14.7 | 0.4 | 2.8 | 10.5 |
| 2D | 35.4 | 23.4 | 0.9 | 4.7 | 7.3 | 15.5 | 0.1 | 0.8 | 11.0 |
| 2E | 31.7 | 24.3 | 1.0 | 5.8 | 8.5 | 15.8 | 0.1 | 1.9 | 11.0 |
| 2F | 38.3 | 22.5 | 1.1 | 6.1 | 7.2 | 12.3 | 0.1 | 2.3 | 10.0 |
| 2G | 38.2 | 22.2 | 1.0 | 6.7 | 6.3 | 12.8 | 0.1 | 2.8 | 9.9 |
| 3A | 46.9 | 18.9 | 0.7 | 9.9 | 5.9 | 5.7 | 0.1 | 4.4 | 7.6 |
| 3B | 44.9 | 21.0 | 1.4 | 10.4 | 2.9 | 7.2 | 0.1 | 5.0 | 7.2 |
| 3C | 43.8 | 20.0 | 0.8 | 11.1 | 3.9 | 9.9 | 0.1 | 5.0 | 5.5 |
| 3D | 39.5 | 21.2 | 1.2 | 12.4 | 6.2 | 9.6 | 0.1 | 3.4 | 6.5 |
| 3E | 32.0 | 21.7 | 0.8 | 5.2 | 7.2 | 16.7 | 0.3 | 5.4 | 10.8 |
| 3F | 33.6 | 22.2 | 0.8 | 7.5 | 6.4 | 14.6 | 0.1 | 5.1 | 9.8 |
| 3G | 31.5 | 22.3 | 0.9 | 3.8 | 8.9 | 15.9 | 0.4 | 5.4 | 11.8 |
Table 3.
Major oxides concentrations (%) detected in the investigated sediments of Port of Koper and their basic statistics.
Table 3.
Major oxides concentrations (%) detected in the investigated sediments of Port of Koper and their basic statistics.
| Major Oxides Samples | SiO2 | Al2O3 | Fe2O3 | MgO | CaO | Na2O | K2O | TiO2 | P2O5 | MnO | Cr2O3 |
|---|---|---|---|---|---|---|---|---|---|---|---|
| 1A | 43.06 | 10.85 | 5.02 | 1.87 | 17.06 | 1.16 | 2.08 | 0.59 | 0.10 | 0.10 | 0.026 |
| 1B | 40.49 | 10.87 | 4.93 | 1.96 | 18.68 | 0.94 | 2.13 | 0.58 | 0.10 | 0.09 | 0.022 |
| 1C | 40.08 | 10.79 | 4.92 | 2.14 | 19.02 | 1.02 | 2.12 | 0.57 | 0.09 | 0.09 | 0.023 |
| 1D | 41.36 | 10.91 | 4.91 | 2.04 | 17.97 | 1.12 | 2.13 | 0.59 | 0.10 | 0.09 | 0.024 |
| 1E | 42.31 | 11.43 | 5.34 | 2.15 | 16.76 | 1.04 | 2.23 | 0.60 | 0.10 | 0.09 | 0.027 |
| 1F | 42.73 | 11.40 | 5.41 | 2.09 | 16.13 | 1.12 | 2.25 | 0.59 | 0.10 | 0.10 | 0.027 |
| 1G | 42.66 | 11.37 | 5.15 | 2.04 | 16.98 | 10.3 | 2.23 | 0.60 | 0.10 | 0.09 | 0.026 |
| 2A | 44.34 | 12.21 | 5.32 | 3.03 | 11.01 | 1.85 | 2.41 | 0.64 | 0.10 | 0.07 | 0.025 |
| 2B | 44.13 | 12.16 | 5.44 | 3.05 | 11.13 | 1.80 | 2.41 | 0.65 | 0.10 | 0.07 | 0.024 |
| 2C | 43.68 | 12.35 | 5.42 | 3.10 | 11.18 | 1.77 | 2.45 | 0.65 | 0.10 | 0.07 | 0.024 |
| 2D | 43.58 | 12.27 | 5.41 | 3.13 | 10.98 | 1.94 | 2.43 | 0.64 | 0.10 | 0.07 | 0.023 |
| 2E | 43.63 | 12.51 | 5.45 | 3.16 | 11.14 | 1.92 | 2.50 | 0.66 | 0.10 | 0.07 | 0.024 |
| 2F | 45.37 | 11.65 | 5.28 | 2.93 | 11.16 | 1.92 | 2.27 | 0.62 | 0.10 | 0.07 | 0.025 |
| 2G | 44.31 | 12.12 | 5.37 | 3.01 | 11.26 | 1.91 | 2.39 | 0.64 | 0.10 | 0.07 | 0.024 |
| 3A | 51.33 | 8.47 | 3.86 | 2.20 | 11.57 | 2.65 | 1.53 | 0.53 | 0.08 | 0.05 | 0.030 |
| 3B | 49.97 | 7.60 | 4.14 | 2.24 | 12.01 | 2.97 | 1.34 | 0.94 | 0.15 | 0.05 | 0.052 |
| 3C | 45.11 | 9.76 | 4.64 | 2.62 | 12.51 | 2.64 | 1.64 | 0.72 | 0.50 | 0.06 | 0.282 |
| 3D | 44.72 | 11.76 | 5.16 | 2.94 | 10.18 | 2.63 | 2.30 | 0.65 | 0.12 | 0.06 | 0.030 |
| 3E | 42.45 | 12.46 | 5.37 | 3.29 | 10.39 | 2.88 | 2.50 | 0.65 | 0.10 | 0.07 | 0.023 |
| 3F | 41.75 | 11.95 | 5.16 | 3.02 | 9.81 | 2.78 | 2.38 | 0.63 | 0.10 | 0.06 | 0.023 |
| 3G | 41.24 | 12.17 | 5.27 | 3.42 | 10.18 | 3.39 | 2.43 | 0.63 | 0.09 | 0.07 | 0.022 |
| Mean | 43.73 | 11.29 | 5.09 | 2.64 | 13.20 | 1.93 | 2.20 | 0.64 | 0.12 | 0.07 | 0.04 |
| Median | 43.58 | 11.65 | 5.27 | 2.93 | 11.26 | 1.91 | 2.27 | 0.63 | 0.10 | 0.07 | 0.02 |
| Std. Dev. | 2.73 | 1.29 | 0.43 | 0.52 | 3.24 | 0.77 | 0.32 | 0.08 | 0.09 | 0.01 | 0.06 |
Table 4.
Concentration ranges (mg/kg) for heavy metals in the studied sediment samples, with 1 Canadian sediment quality guidelines for the protection of aquatic life, threshold effect level [43] and 2 Canadian sediment quality guidelines for the protection of aquatic life, probable effect level [43].
| Elements Samples | Au | As | Cd | Cu | Mo | Ni | Pb | Sb | Zn |
|---|---|---|---|---|---|---|---|---|---|
| 1A | 5.0 | 6.8 | 0.1 | 31.0 | 0.7 | 96.5 | 13.3 | 0.3 | 69.0 |
| 1B | 4.3 | 6.7 | 0.2 | 32.3 | 0.8 | 98.7 | 20.5 | 0.2 | 69.0 |
| 1C | 3.5 | 7.3 | 0.3 | 31.9 | 0.9 | 104.1 | 16.8 | 0.2 | 72.0 |
| 1D | 3.9 | 7.5 | 0.2 | 31.4 | 1.1 | 98.1 | 30.2 | 0.2 | 70.0 |
| 1E | 3.2 | 8.4 | 0.2 | 35.5 | 0.7 | 109.4 | 17.6 | 0.2 | 84.0 |
| 1F | 2.5 | 8.4 | 0.2 | 37.8 | 0.7 | 106.9 | 21.2 | 0.2 | 76.0 |
| 1G | 3.4 | 8.1 | 0.2 | 34.4 | 0.8 | 97.4 | 18.2 | 0.1 | 78.0 |
| 2A | 4.7 | 15.3 | 0.1 | 28.6 | 1.1 | 88.2 | 16.4 | 0.1 | 82.0 |
| 2B | 5.0 | 16.0 | 0.1 | 29.2 | 1.0 | 89.3 | 15.6 | 0.1 | 81.0 |
| 2C | 2.4 | 15.1 | 0.1 | 30.1 | 1.2 | 91.4 | 16.2 | 0.2 | 86.0 |
| 2D | 2.4 | 14.4 | 0.2 | 28.9 | 1.2 | 90.2 | 15.8 | 0.1 | 80.0 |
| 2E | 1.6 | 15.2 | 0.2 | 29.8 | 1.1 | 91.8 | 16.4 | 0.1 | 88.0 |
| 2F | 4.1 | 15.6 | 0.1 | 28.7 | 1.5 | 88.2 | 14.7 | 0.1 | 81.0 |
| 2G | 2.5 | 16.4 | 0.1 | 30.4 | 1.3 | 93.0 | 18.0 | 0.2 | 86.0 |
| 3A | 2.0 | 19.9 | 0.1 | 17.6 | 1.0 | 61.3 | 11.3 | 0.1 | 54.0 |
| 3B | 2.2 | 16.0 | 0.1 | 35.0 | 1.5 | 62.3 | 10.7 | 0.1 | 73.0 |
| 3C | 2.8 | 15.4 | 0.4 | 24.9 | 1.8 | 83.3 | 28.2 | 0.1 | 99.0 |
| 3D | 1.7 | 14.6 | 0.1 | 28.6 | 1.2 | 87.1 | 14.9 | 0.2 | 78.0 |
| 3E | 1.2 | 13.9 | 0.2 | 29.1 | 0.9 | 86.2 | 15.1 | 0.1 | 78.0 |
| 3F | 3.1 | 14.3 | 0.1 | 30.5 | 1.1 | 89.3 | 16.3 | 0.2 | 83.0 |
| 3G | 2.4 | 14.4 | 0.2 | 31.4 | 0.9 | 95.2 | 16.7 | 0.2 | 82.0 |
| Mean | 3.1 | 12.8 | 0.17 | 30.3 | 1.1 | 96.2 | 17.3 | 0.16 | 78.5 |
| Median | 2.8 | 14.4 | 0.25 | 30.4 | 1.1 | 97.0 | 16.4 | 0.20 | 80.0 |
| Std. Dev. | 1.1 | 4.0 | 0.03 | 4.1 | 0.3 | 11.4 | 4.7 | 0.10 | 9.1 |
| 1 | / | 7.24 | 0.68 | 18.7 | / | 15.6 | 30.2 | / | 124.0 |
| 2 | / | 41.6 | 4.21 | 107.0 | / | 42.8 | 112.0 | / | 271.0 |
Table 5.
Pearson R correlation analysis between the clay, silt, elemental, TOT/C, and SAKFMP (SiO2, Al2O3, K2O, Fe2O3, MnO, and P2O5) components; marked (red) correlations are significant at p < 0.05; number of samples = 21.
Table 5.
Pearson R correlation analysis between the clay, silt, elemental, TOT/C, and SAKFMP (SiO2, Al2O3, K2O, Fe2O3, MnO, and P2O5) components; marked (red) correlations are significant at p < 0.05; number of samples = 21.
| Clay | Silt | SAKFMP | As | Co | Cu | Mo | Ni | Pb | Sb | Zn | TOT/C | |
|---|---|---|---|---|---|---|---|---|---|---|---|---|
| Clay | 1.00 | −0.50 | −0.16 | −0.02 | 0.01 | 0.01 | −0.18 | 0.00 | 0.04 | −0.01 | −0.09 | 0.03 |
| Silt | −0.50 | 1.00 | 0.16 | −0.04 | 0.20 | 0.01 | −0.29 | 0.12 | −0.15 | 0.15 | −0.06 | −0.47 |
| SAKFMP | −0.16 | 0.16 | 1.00 | 0.86 | −0.50 | −0.45 | 0.41 | −0.52 | −0.47 | 0.81 | 0.26 | −0.50 |
| As | −0.02 | −0.04 | 0.86 | 1.00 | −0.80 | −0.65 | 0.52 | −0.75 | −0.40 | 0.76 | 0.21 | −0.41 |
| Co | 0.01 | 0.20 | −0.50 | −0.80 | 1.00 | 0.70 | −0.64 | 0.92 | 0.36 | −0.44 | 0.06 | 0.08 |
| Cu | 0.01 | 0.01 | −0.45 | −0.65 | 0.70 | 1.00 | 0.38 | 0.62 | 0.14 | −0.51 | 0.17 | 0.25 |
| Mo | −0.18 | −0.29 | 0.41 | 0.62 | −0.64 | −0.38 | 1.00 | −0.55 | 0.14 | 0.22 | 0.46 | 0.20 |
| Ni | 0.00 | 0.12 | −0.52 | −0.75 | 0.92 | 0.62 | −0.55 | 1.00 | 0.43 | −0.33 | 0.25 | 0.02 |
| Pb | 0.04 | −0.15 | −0.47 | −0.40 | 0.36 | 0.14 | 0.14 | 0.43 | 1.00 | −0.44 | 0.32 | 0.23 |
| Sb | −0.01 | 0.15 | 0.81 | 0.76 | −0.44 | −0.51 | 0.22 | −0.33 | −0.44 | 1.00 | 0.18 | −0.67 |
| Zn | −0.09 | −0.06 | 0.26 | 0.21 | 0.06 | 0.17 | 0.46 | 0.25 | 0.32 | 0.18 | 1.00 | 0.17 |
| TOT/C | 0.03 | −0.47 | −0.50 | −0.41 | 0.08 | 0.25 | 0.20 | 0.02 | 0.23 | −0.67 | −0.17 | 1.00 |
Table 6.
Risk assessment code (RAC) (%) values for heavy metals in Koper Bay sediments.
| Samples | As | Cd | Cu | Mo | Ni | Pb | Sb | Zn |
|---|---|---|---|---|---|---|---|---|
| RAC | RAC | RAC | RAC | RAC | RAC | RAC | RAC | |
| 1G | 0.8 | 5.1 | 0.8 | 11 | 4.8 | 0.21 | 7 | 2.8 |
| 2D | 1.3 | 5.2 | 2 | 24.8 | 3.5 | 0.21 | 3 | 2.6 |
| 3G | 1.8 | 5.3 | 2.7 | 29.5 | 3.5 | 0.21 | 4.1 | 2.7 |
© 2018 by the authors. Licensee MDPI, Basel, Switzerland. This article is an open access article distributed under the terms and conditions of the Creative Commons Attribution (CC BY) license (http://creativecommons.org/licenses/by/4.0/).
Share and Cite
MDPI and ACS Style
Rogan Šmuc, N.; Dolenec, M.; Kramar, S.; Mladenović, A. Heavy Metal Signature and Environmental Assessment of Nearshore Sediments: Port of Koper (Northern Adriatic Sea). Geosciences 2018, 8, 398. https://doi.org/10.3390/geosciences8110398
AMA Style
Rogan Šmuc N, Dolenec M, Kramar S, Mladenović A. Heavy Metal Signature and Environmental Assessment of Nearshore Sediments: Port of Koper (Northern Adriatic Sea). Geosciences. 2018; 8(11):398. https://doi.org/10.3390/geosciences8110398
Chicago/Turabian StyleRogan Šmuc, Nastja, Matej Dolenec, Sabina Kramar, and Ana Mladenović. 2018. "Heavy Metal Signature and Environmental Assessment of Nearshore Sediments: Port of Koper (Northern Adriatic Sea)" Geosciences 8, no. 11: 398. https://doi.org/10.3390/geosciences8110398
Note that from the first issue of 2016, this journal uses article numbers instead of page numbers. See further details here.