1. Introduction
Since the 1920s, the relative effect of production versus preservation in the distribution and heterogeneities of organic matter in sedimentary basins is under debate [
1,
2,
3,
4]. Many studies considered that the oxygen depletion in depositional environment is the key factor for organic-rich sediments accumulation (e.g., Reference [
2]). Other authors suggested that the organic-rich deposits are linked to a primary productivity enhancement (e.g., Reference [
5]). The upwelling hypothesis was adopted in numerous studies [
6,
7,
8]. The high primary productivity in such context allows the expansion of an oxygen minimum zone and leads to anoxia propagation in the basins [
9,
10,
11,
12]. Then, the anoxic environment would be a consequence of the high production of organic matter, and not the primary cause of organic matter accumulation. This controversy is supported by the two main modern analogues for deposition of organic-rich sediments: The coastal upwelling areas associated to high primary productivity that led to oxygen minimum zone (oxygen consumption by organic matter consumers), and the isolated/silled stratified anoxic basins such as the present day Black Sea.
Nonetheless, several other factors are also known to have an influence on the organic matter preservation. The transit time in water column, and consequently the time exposition to organisms that consume organic matter, can be directly linked to paleo-bathymetries in modern open oceans [
13]. Similarly, the sedimentation rate determines the speed of organic matter isolation from oxygenated environment and the dilution rate into the sediment [
14].
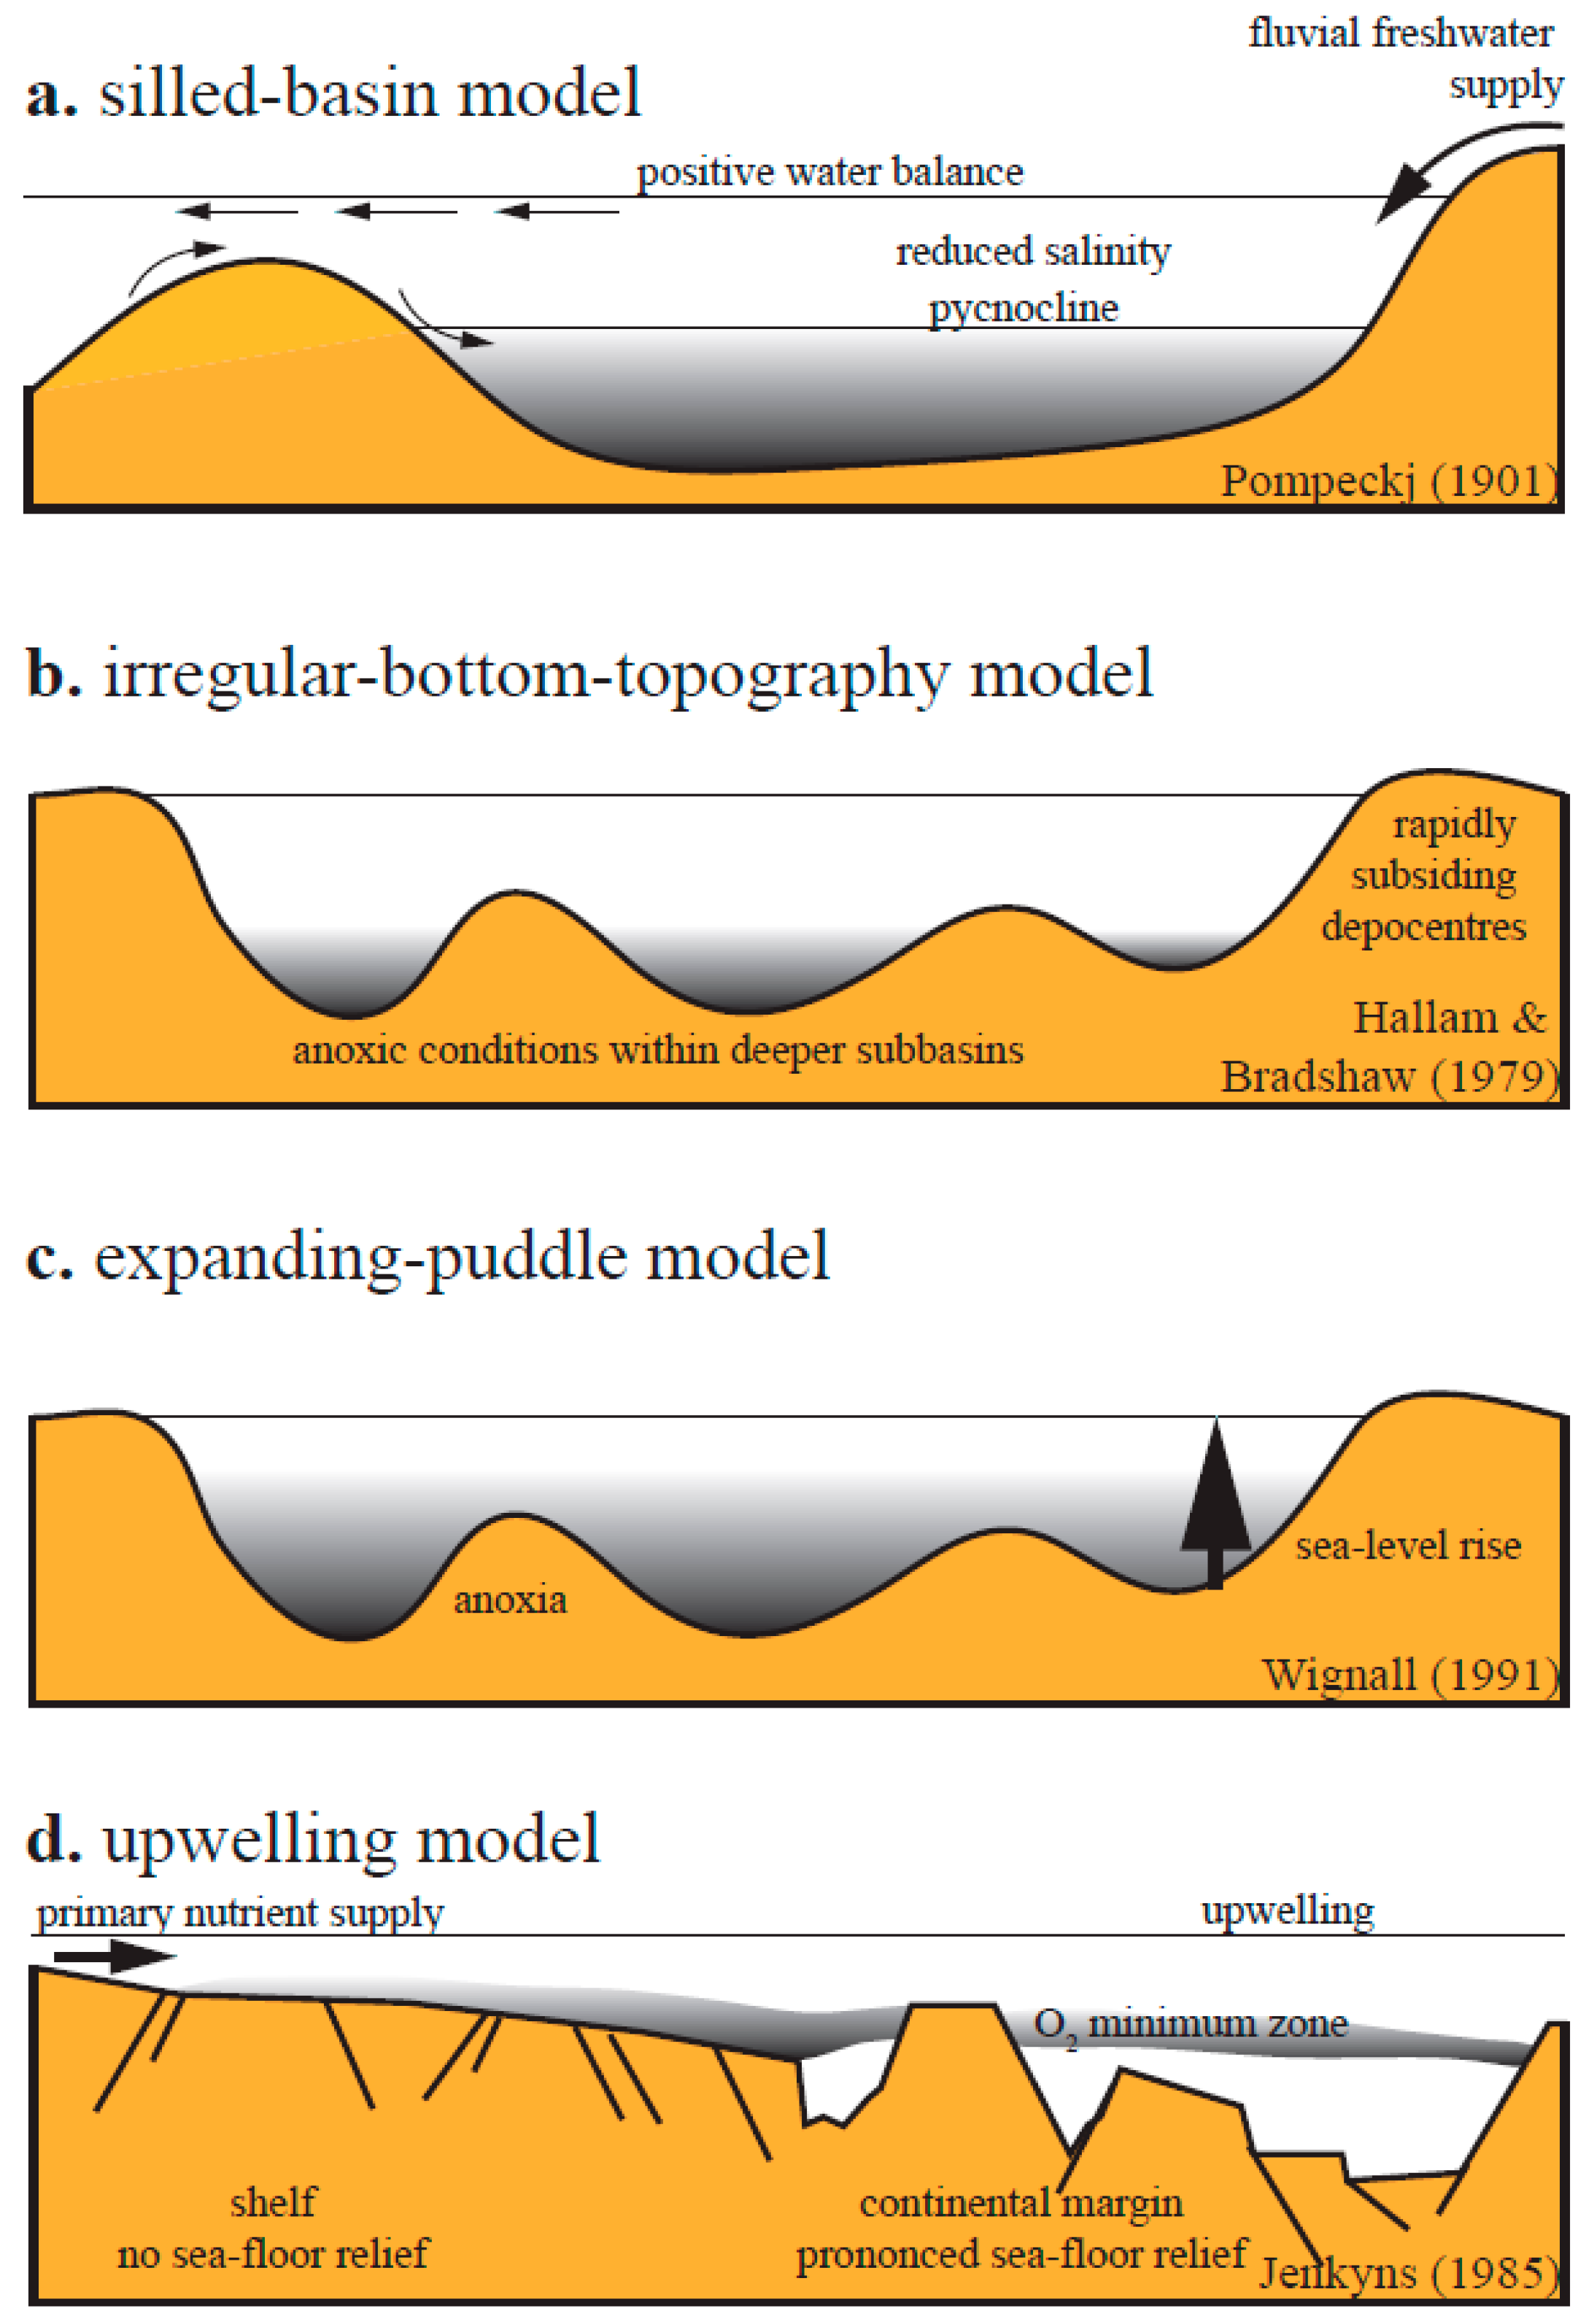
Several theoretical models, which bring hypothesis on the local or global factors that could led to organic-rich deposits, have been proposed. These models have evolved through time by integrating progressively concepts and hypotheses from new studies [
15,
16,
17,
18] (
Figure 1). More recently, several numerical models which integrates empirical equations and physical lows (e.g., Reference [
13,
19]) describing the processes related to the production and the preservation of marine organic matter were developed (e.g., Reference [
20]). DionisosFlow
© [
21], which was already tested for the Lower Jurassic Western European basins [
22,
23] is used in this study.
In this study, we focus on the Lower-Middle Toarcian of the Paris Basin. In this interval, several organic-rich layers have been deposited, especially the Schistes carton black shales. The high variations of the Total Organic Carbon (TOC), which suggest different settings for the processes governing organic matter distribution and heterogeneities (i.e., quantity, quality), makes it a good case study for sensitivity analysis of their key controlling factors. Moreover, it has already been studied in depth by previous works that give access to numerous data (e.g., References [
23,
25,
26]).
The goal of this study is to analyze the processes controlling organic matter distribution and heterogeneity through a numerical quantitative approach coupled to a sensitivity analysis applied to the Lower-Middle Toarcian succession of the Paris Basin. Two main steps were necessary to achieve this goal: (1) The evolution of the Lower-Middle Toarcian of the Paris Basin was first reproduced within a 3D numerical stratigraphic forward simulator. The model was calibrated on thicknesses and facies; (2) in the second step, a set of probability maps and sensitivity analysis were performed on 2 variables of interest (TOC and oxygen level at the sea floor). These analyses are based on a recent Global Sensitivity Analysis (GSA) approach by Gervais et al. [
27] and give access for this study to the spatial influence of the critical parameters (bathymetry, organic matter transport, oxygen mixing rate and primary productivity) on the output parameters (TOC and oxygen level). Besides the results of the sensitivity analysis, several models among the most representatives of the data from well studies and corresponding to different numerical scenario, were also compared to hypothesis available in literature and discussed.
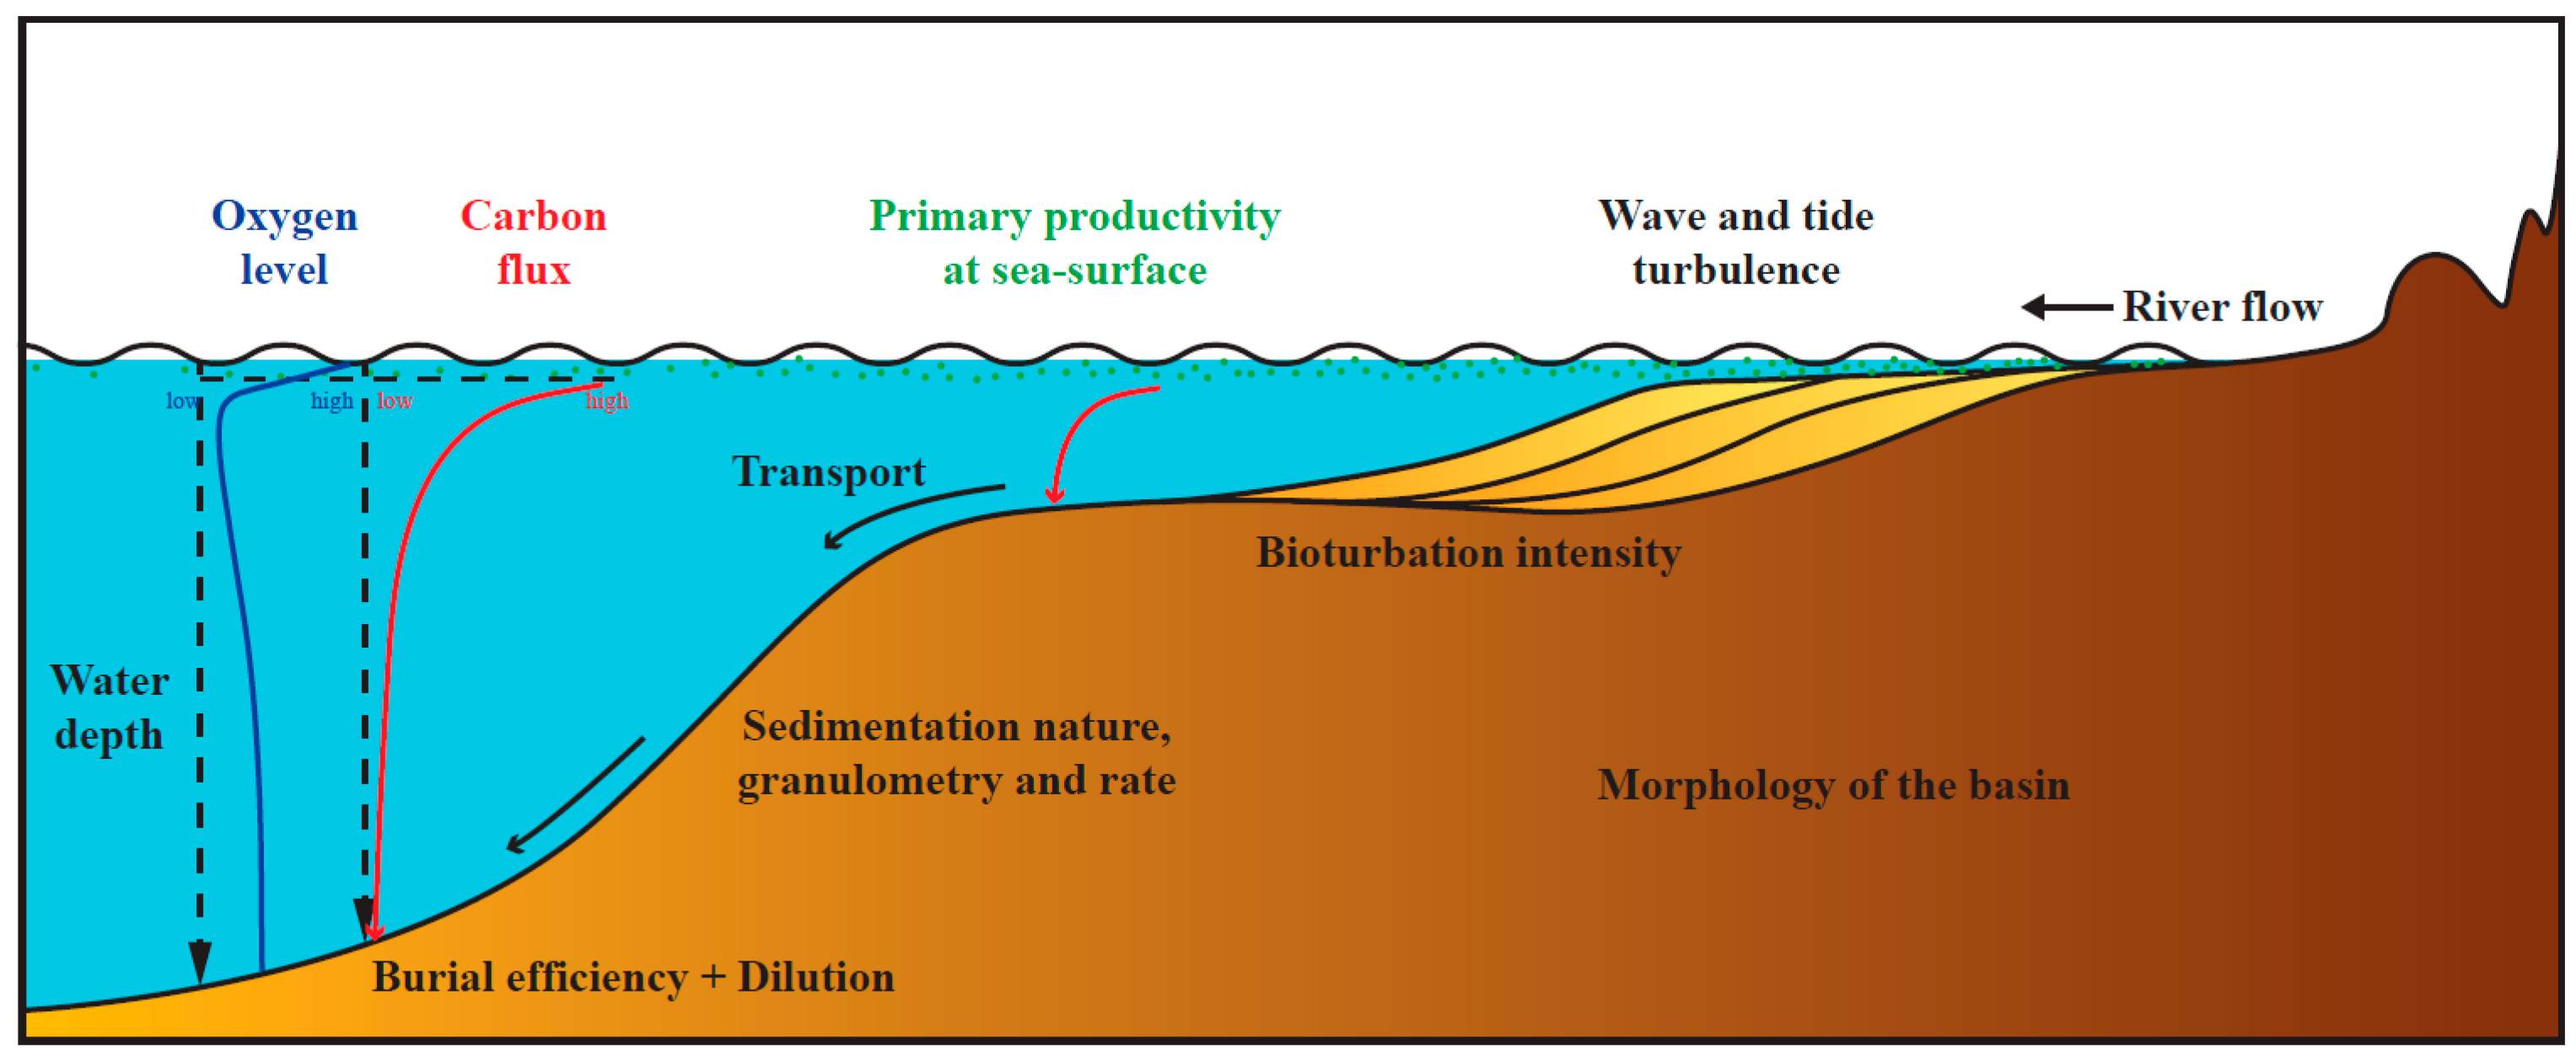
Using this new approach, we are able to discuss the effect of the processes that lead to heterogeneity of organic-rich deposits (
Figure 2) and the interaction between these processes. This new modelling methodology represents a step forward in our ability to make accurate prediction of both source-rock distribution and quality.
2. Geological Setting
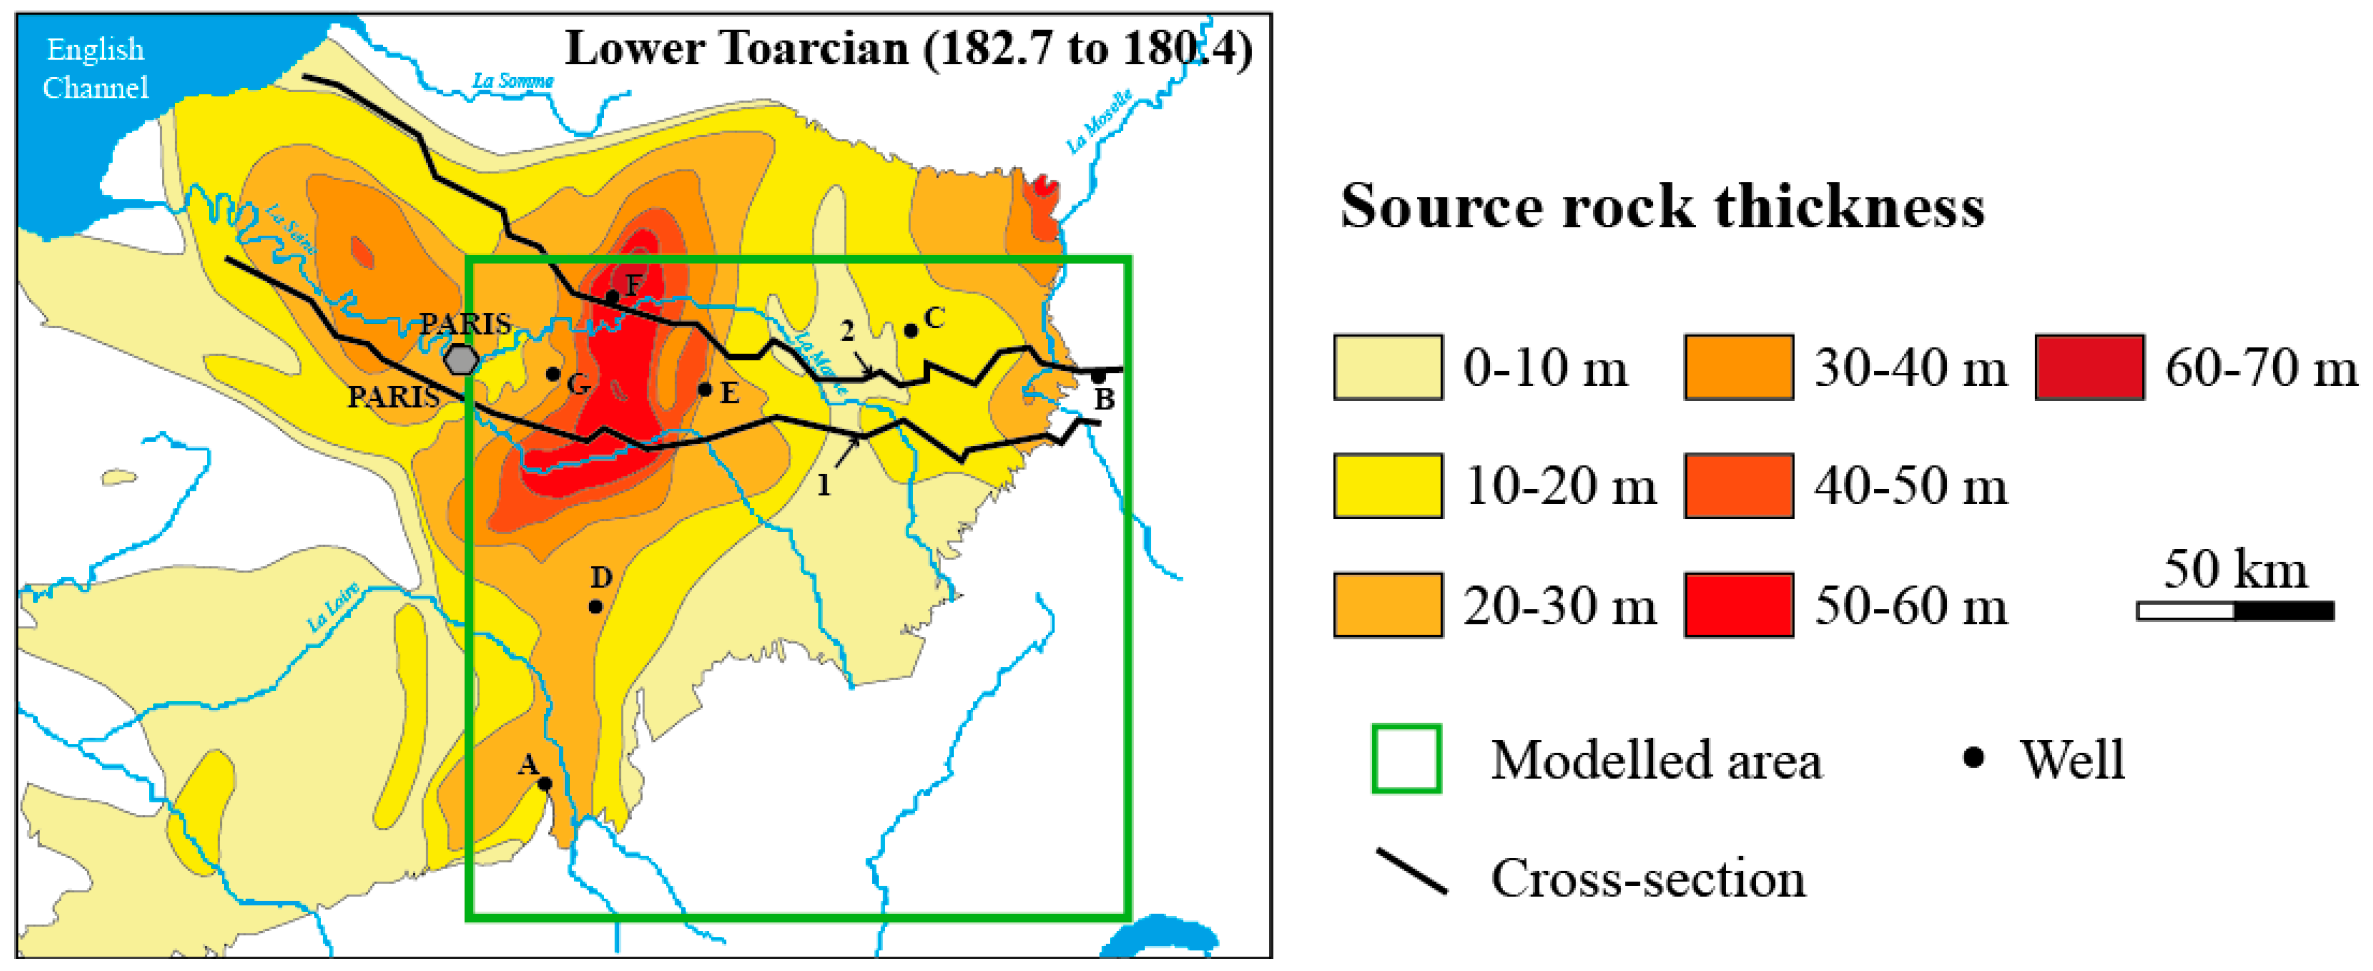
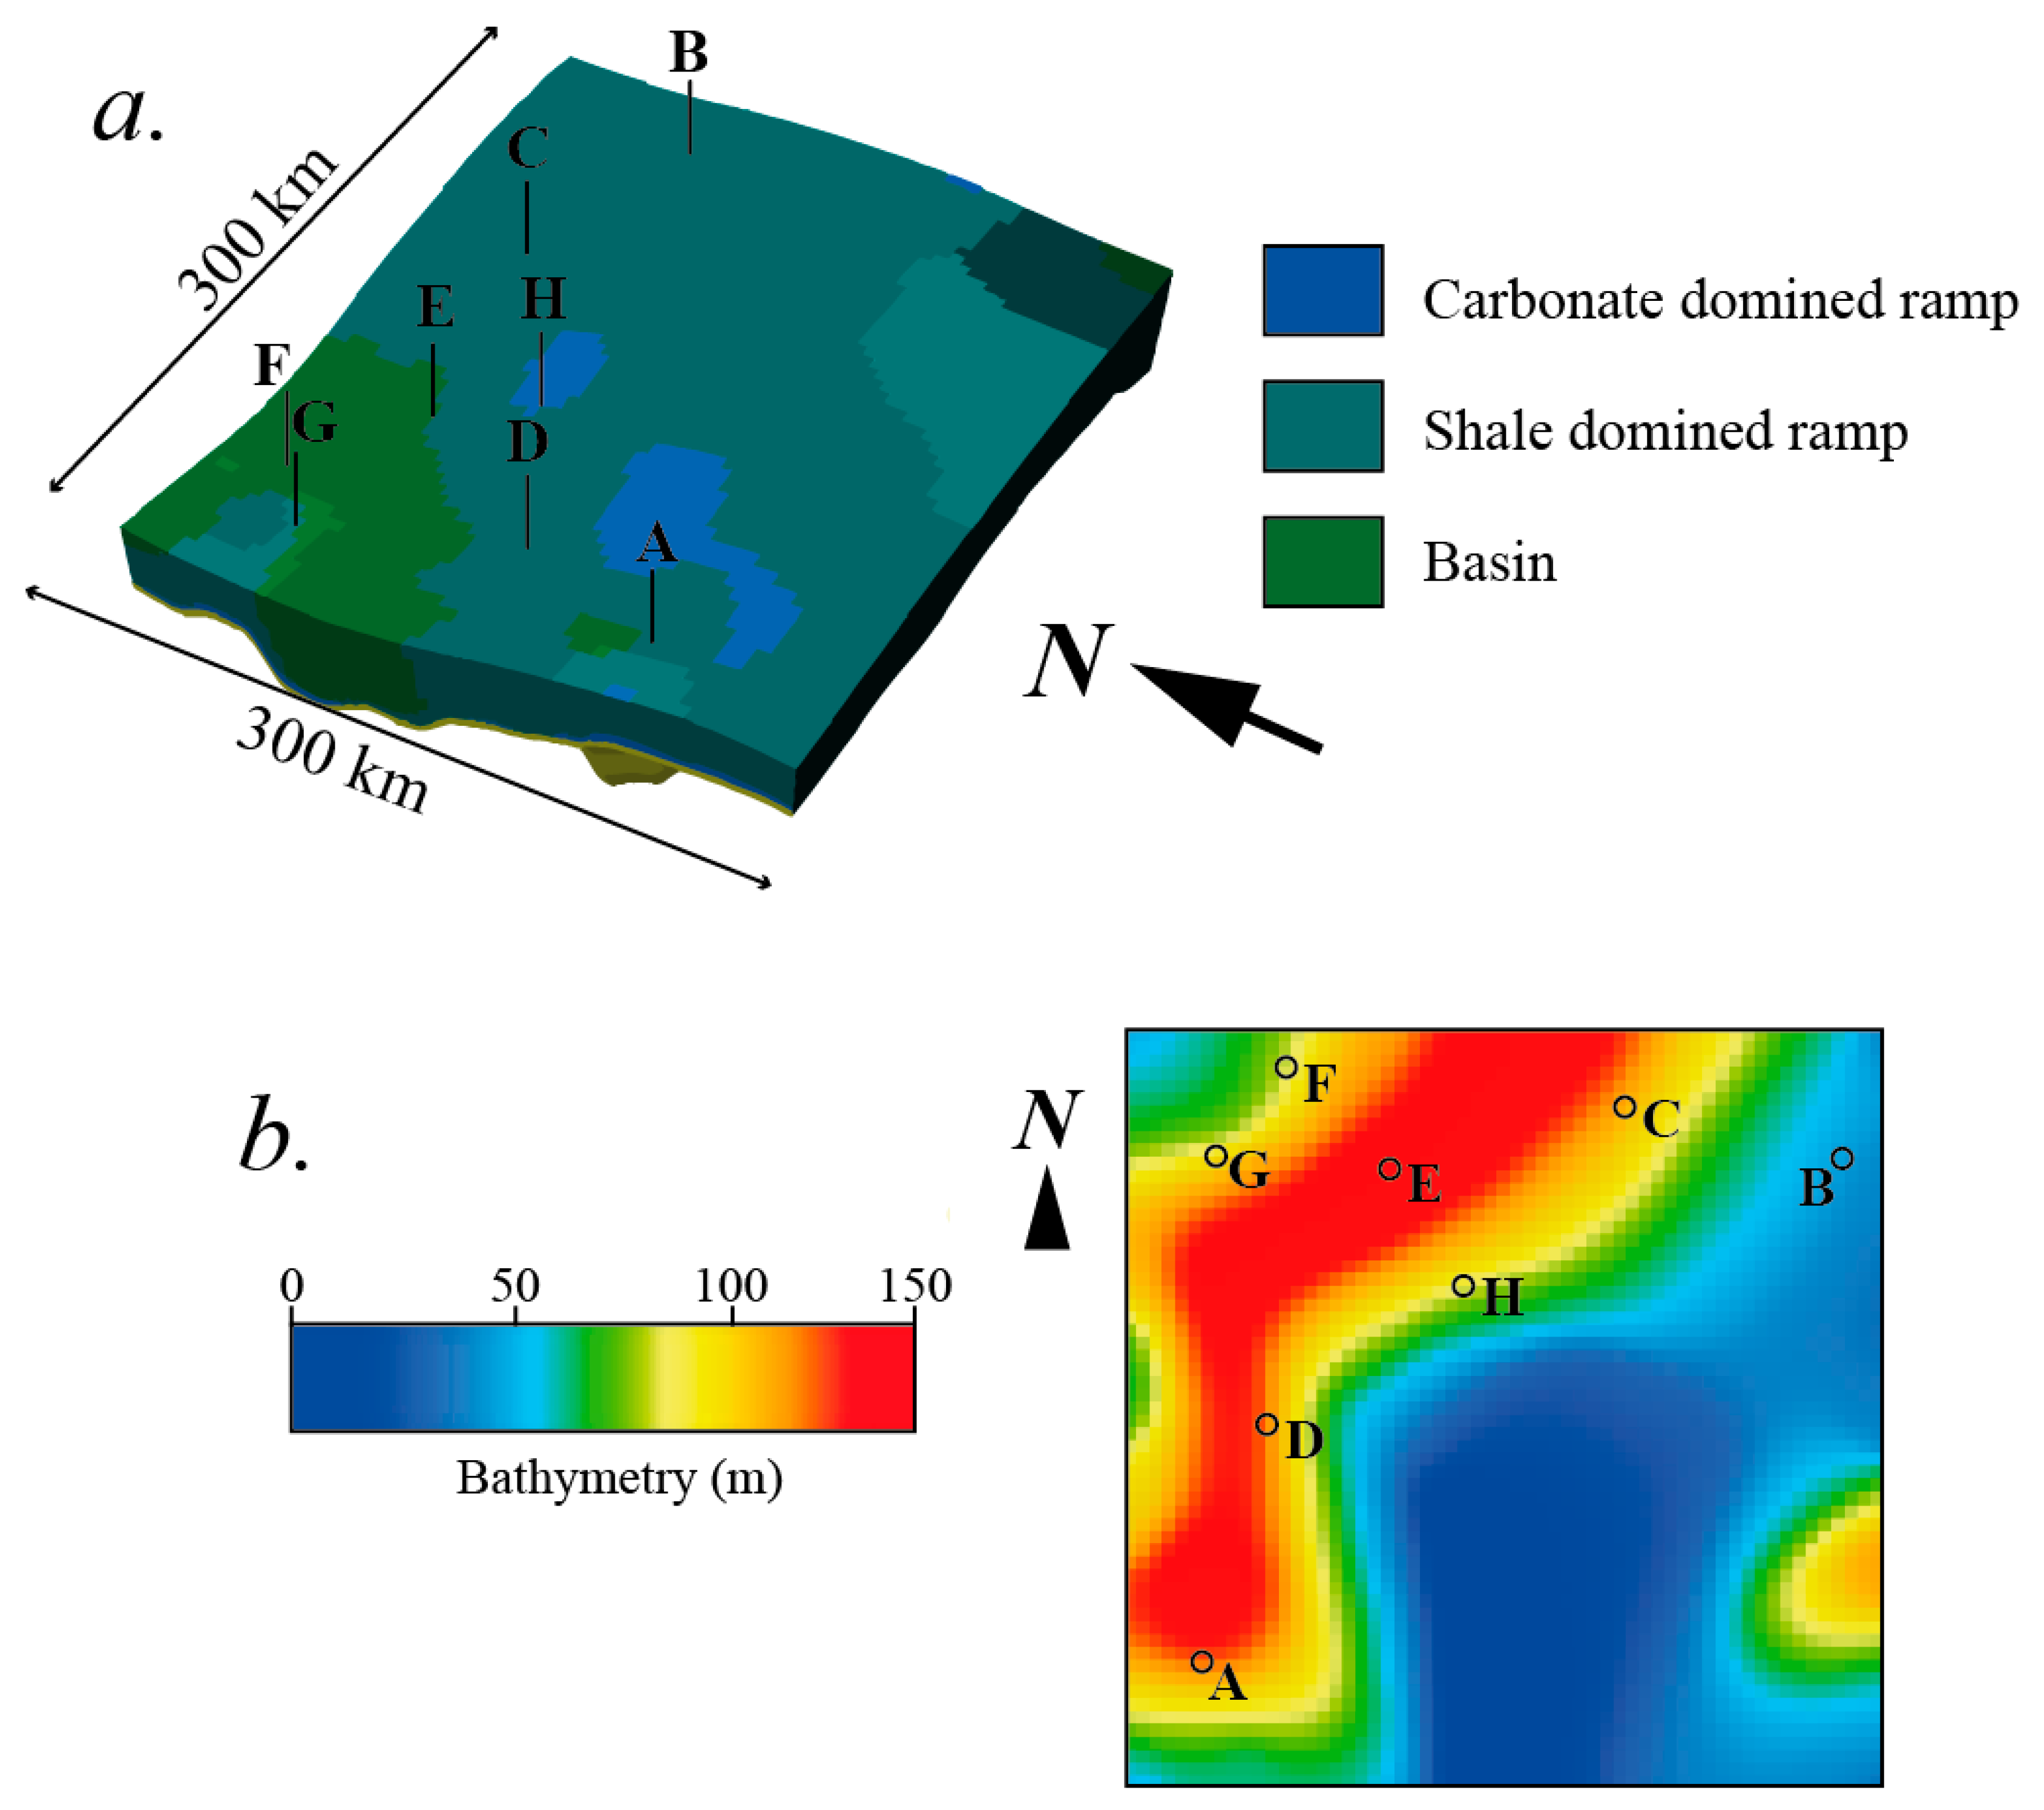
Our study area is located in the Paris Basin (
Figure 3), which is in key position during the opening of the Tethys Ocean that led to its structural development. The extensional tectonic context led to the reactivation of some faults that localize the subsidence (e.g., Reference [
28]). Two successive second-order cycles can be observed in the Paris Basin (e.g., References [
28,
29]) (
Figure 4). The first one corresponds to a regressive episode in the late Pliensbachian, ending at the Pliensbachian—Toarcian boundary, which is marked by a non-deposition in the proximal parts of the basin and by limestone deposits in its distal part. The second one, a transgressive cycle, marks the beginning of the Toarcian anoxic episode (T-OAE) (e.g., References [
16,
30]). The maximum transgressive surface that follows is observable throughout Europe in the lower Toarcian and marked the maximum flooding of the Liassic transgression. The sedimentation became dominated by carbonates with limestone—marl alternations. A further regressive phase recorded by oolitic deposits across Europe marks the end of the Early Jurassic.
3. Dataset
The study area covers a 300 × 300 km zone extending over what was the proximal and distal parts of the Paris Basin during the Toarcian (
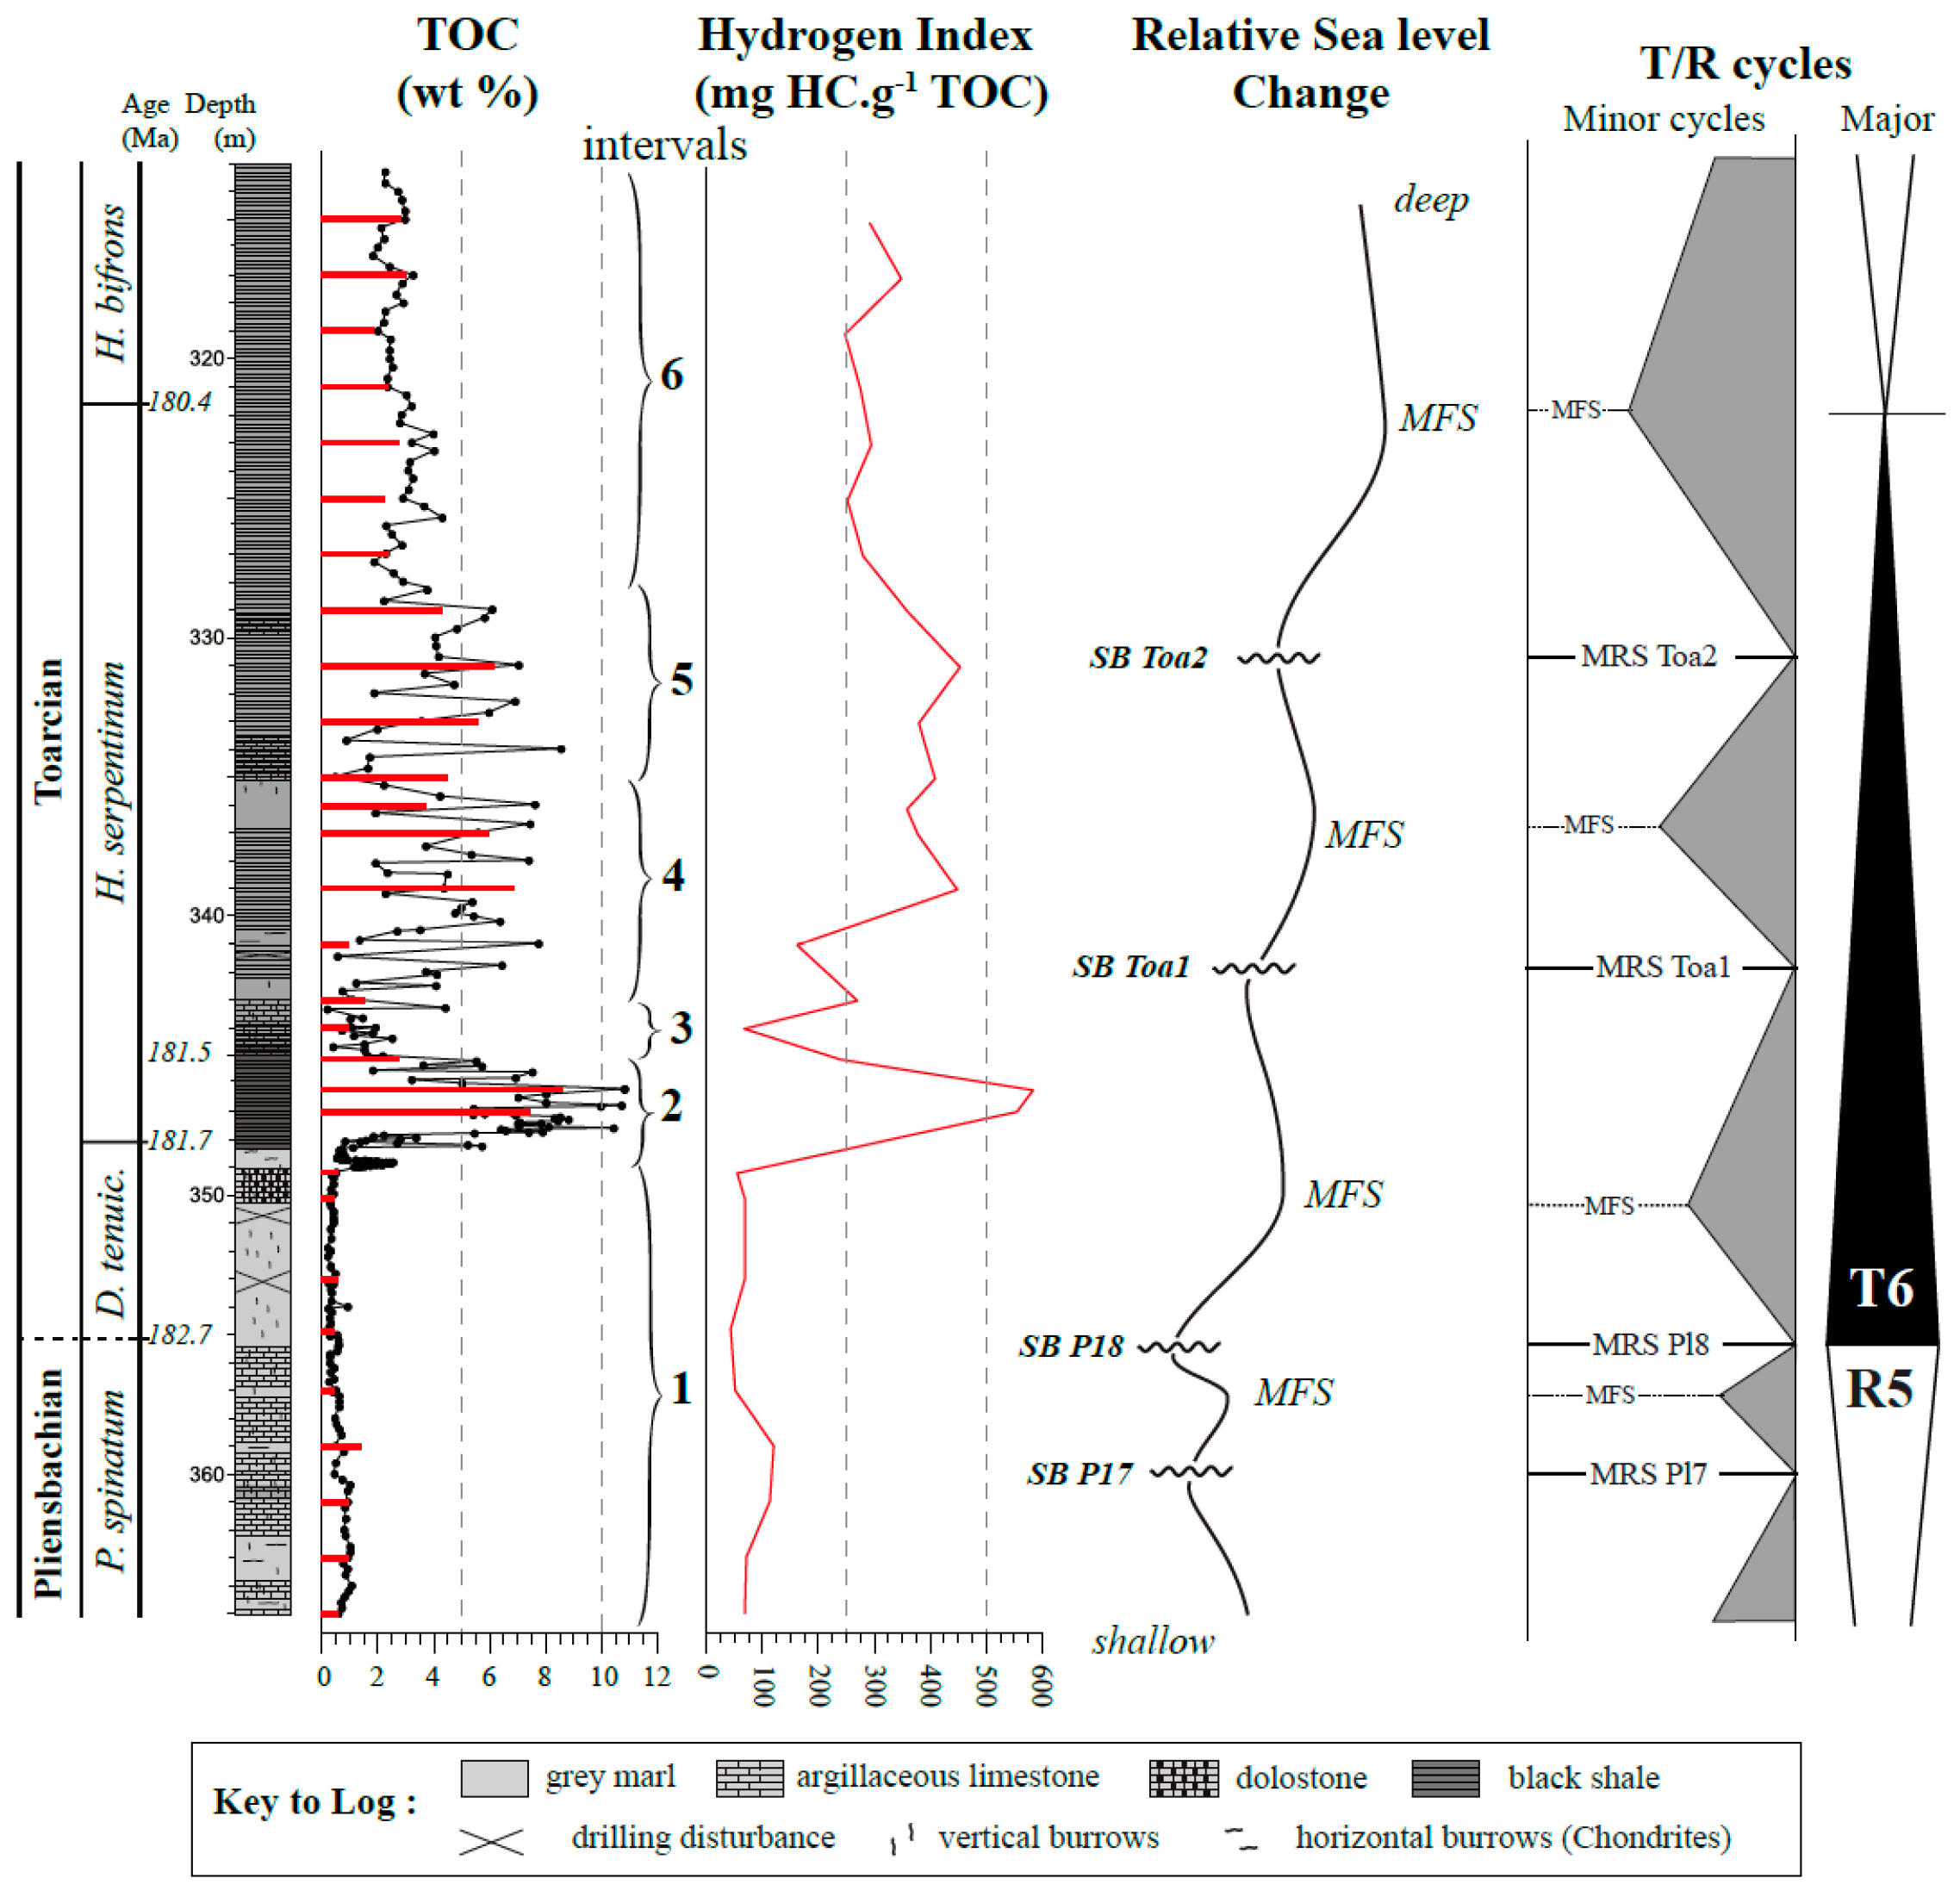
Figure 3). The studied time interval spans for the Lower-Middle Toarcian from the base of Tenuicostatum biozone (182.7 Ma) to Bifrons biozone (179.7 Ma) (
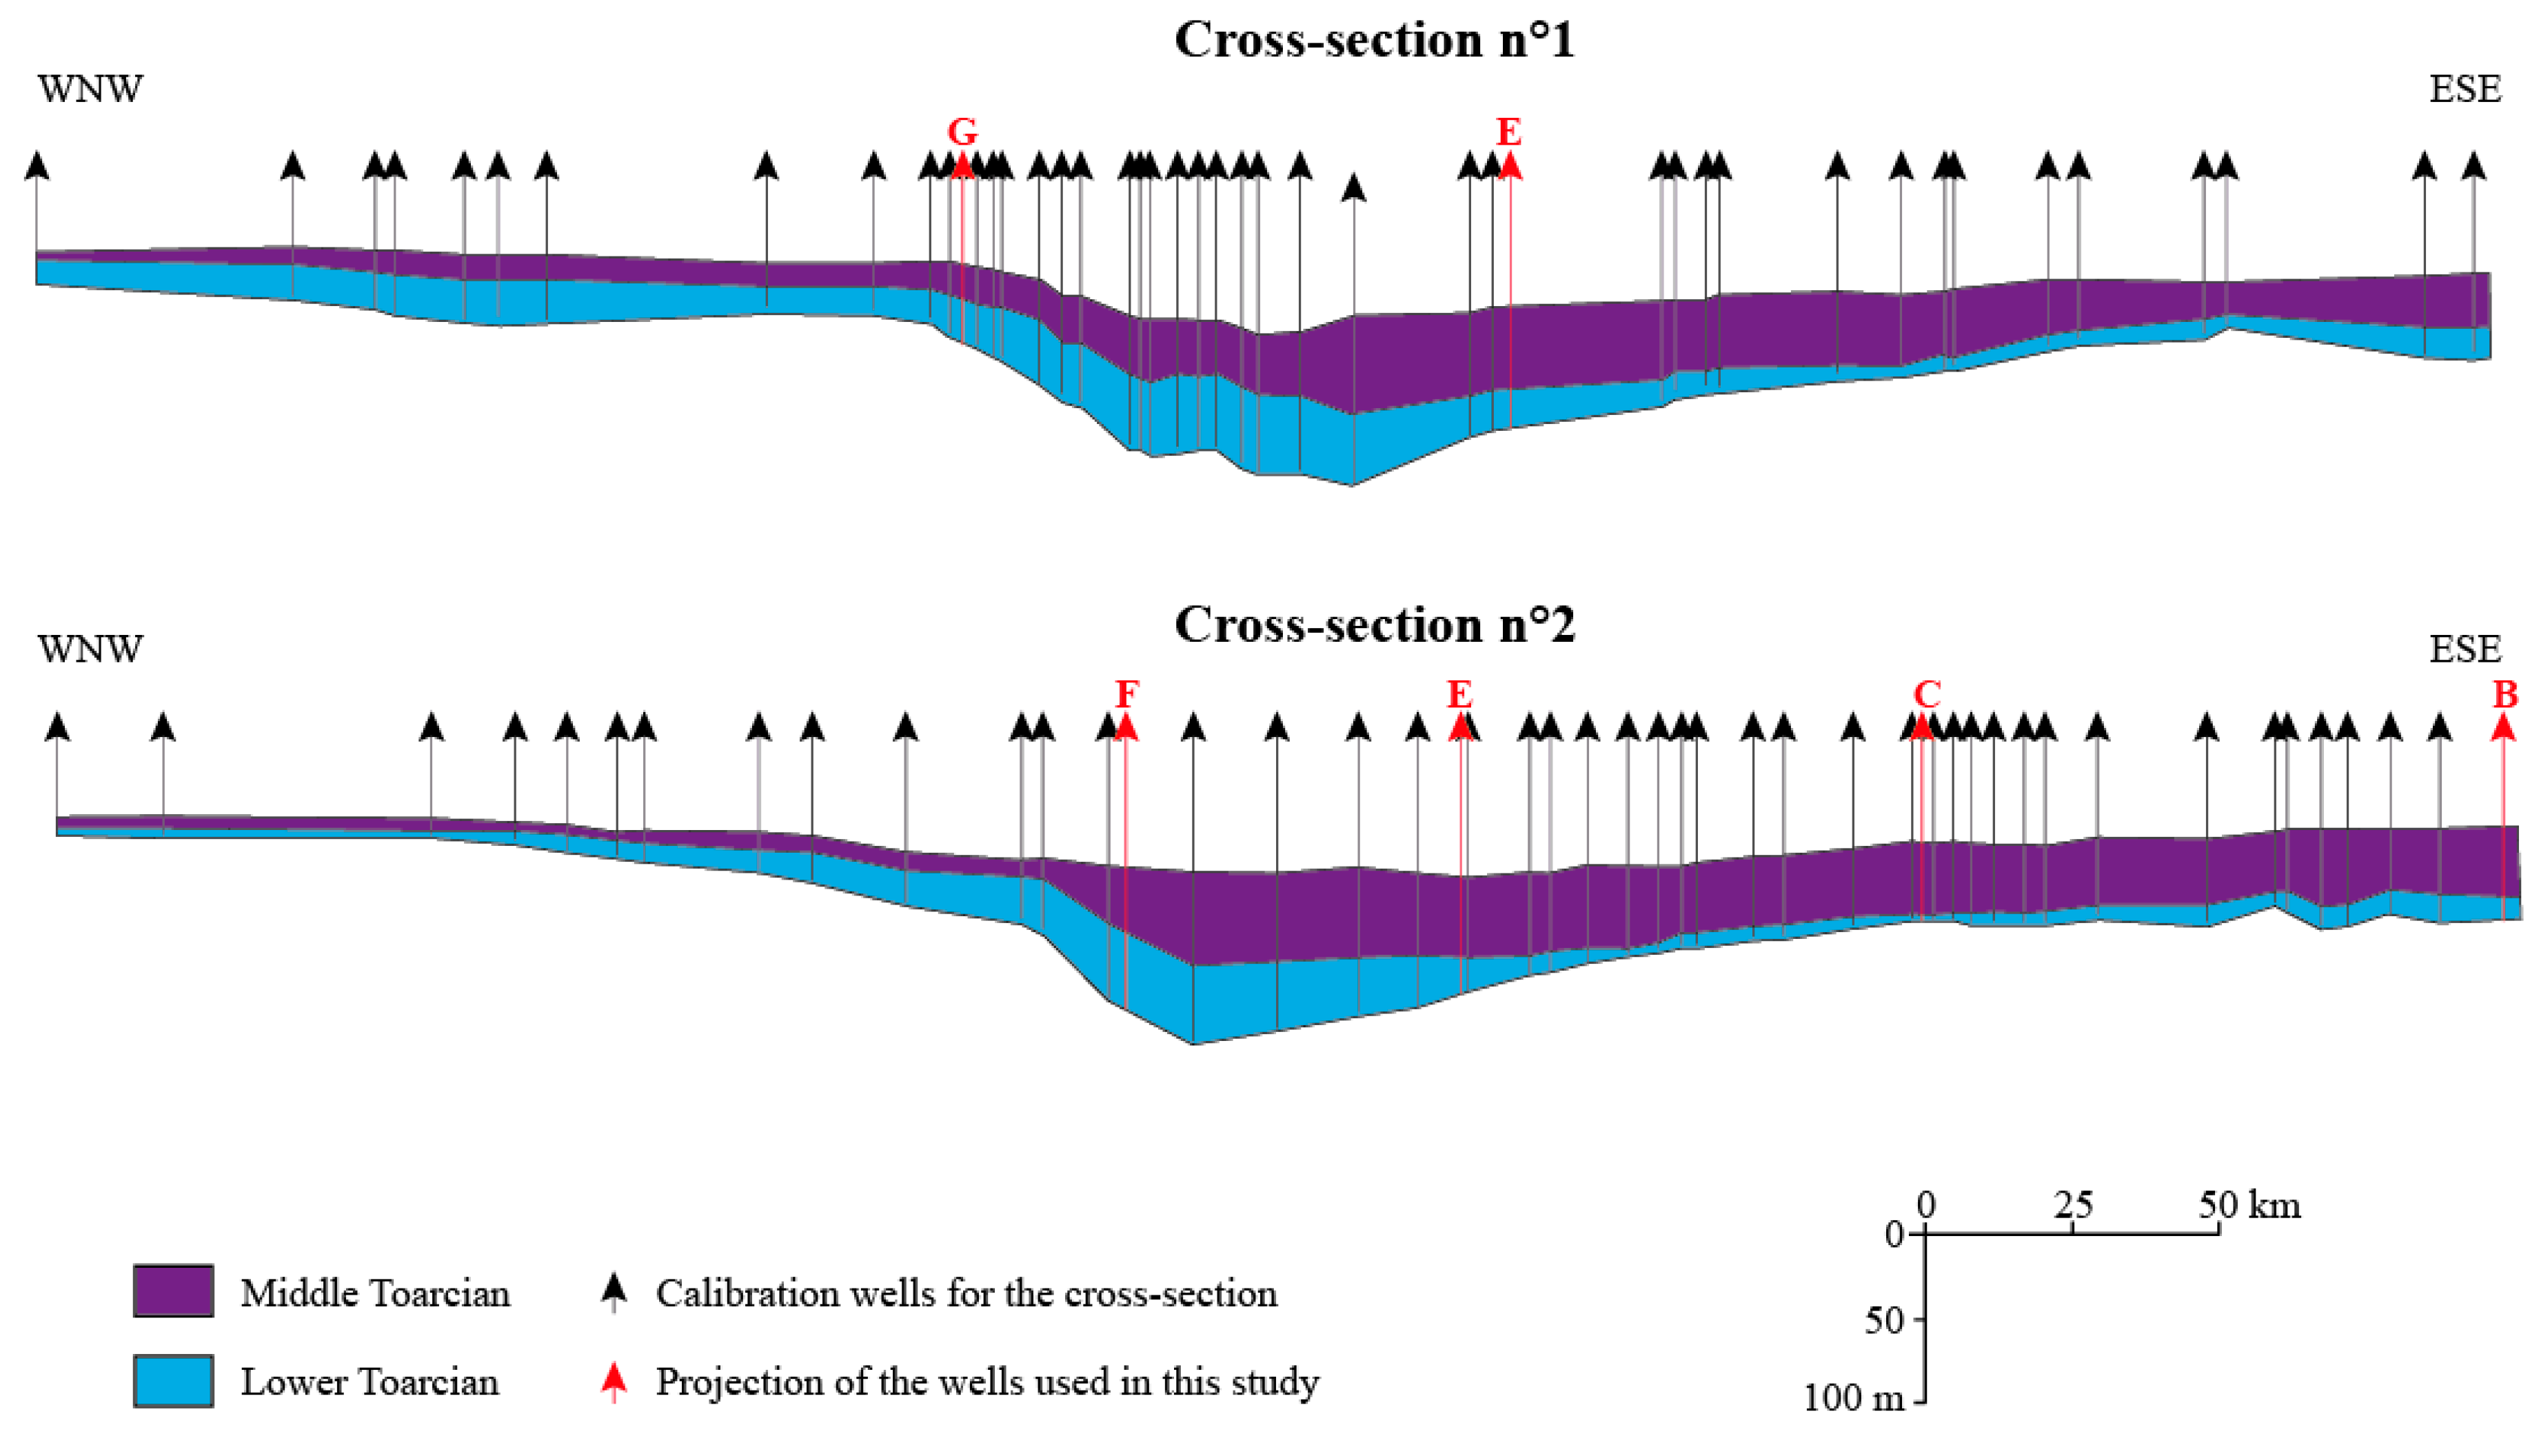
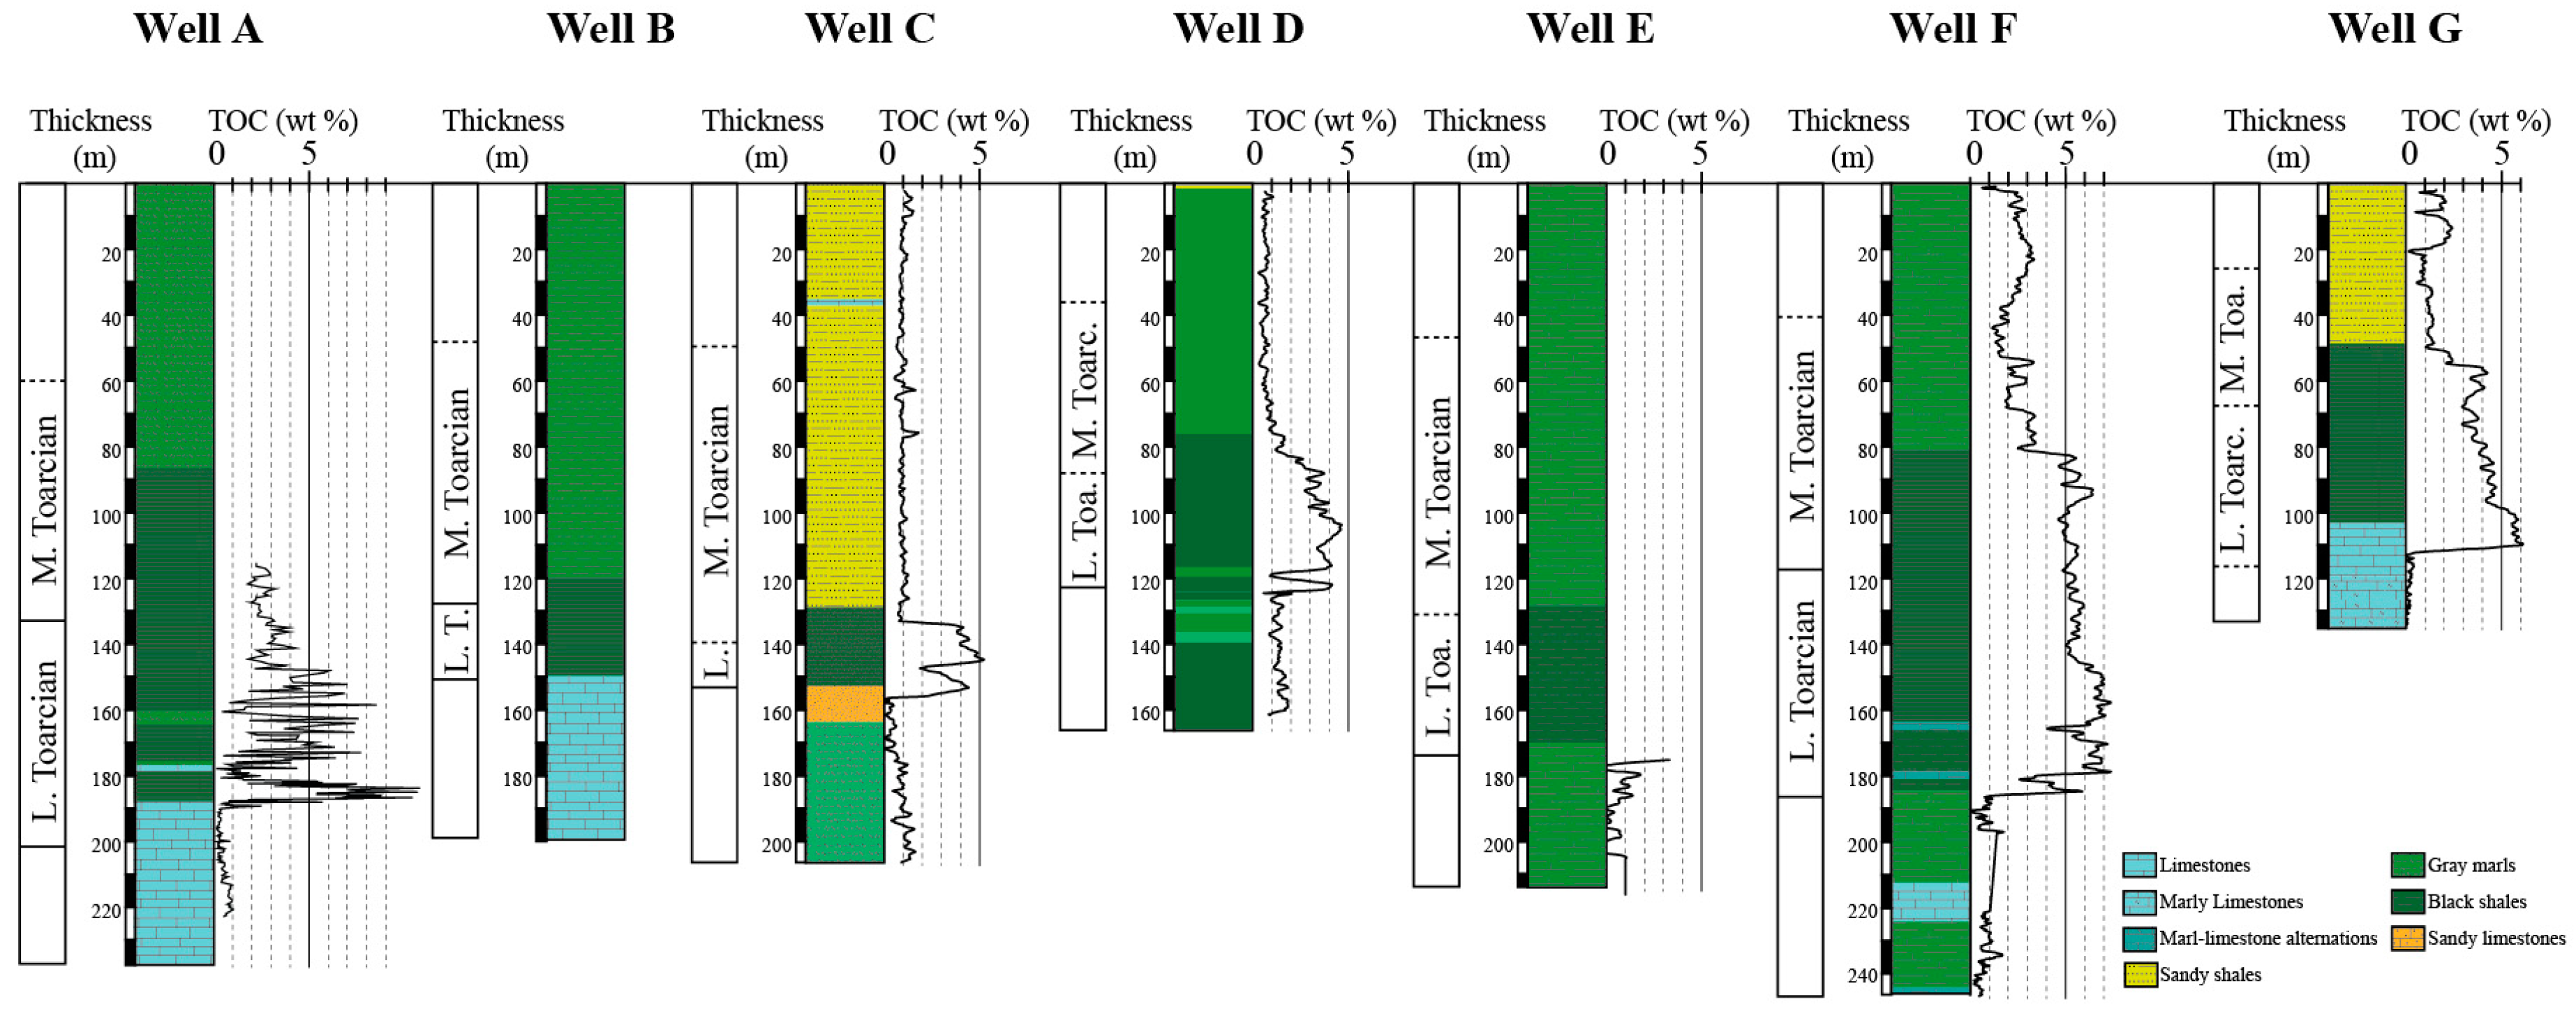
Figure 4). The calibration of the numerical stratigraphic model was based on data from literature, 2 cross-sections (
Figure 5) and 7 wells (
Figure 6), including structural setting, biostratigraphy, sedimentary characterization and mineralogical/geochemical analysis (wireline logging, carbologs analyses, and more than 300 Rock-Eval analyses).
4. 3D Stratigraphic Forward Modelling
We used the DionisosFlow
© 3D stratigraphic forward modelling software [
35,
36,
37] to reconstruct the stratigraphic and palaeo-geographical evolution of the Lower-Middle Toarcian of the Paris Basins. It simulates the evolution of the basin geometry through time, using long-term and large scale sediment transport equations. Its results include facies spatial arrangement and sedimentation rate evolution at basin scale.
The volume and the distribution of sediments in the basin are defined with trial and error simulations in order to reproduce observed thicknesses and facies observed along the selected calibration wells. The simulated facies, which are used to compare observed facies, are defined for each cell of the model according to percentage of each simulated class of sediment.
Following the above methodology, the 3D model was computed using a spatial resolution of 5 × 5 km and a temporal resolution of 0.1 Ma in the selected zone of the Paris Basin (
Figure 3). The construction of the model was based on subsurface and field data observations and measurements. In details, some local minor discrepancies remain for the thickness that may be due to the difficulty to set production and supply for each sediment. In spite of this complexity, the facies and thicknesses computed from the 3D model sustain all the major geological features observed in the basin (
Figure 7). The average sediment thickness error between simulation and real thickness is usually less than 10% (around 15 m on the total sediment column simulated). Both vertical and lateral simulated facies variations match with interpreted data from field study and literature. A detailed description of the model is available in Bruneau et al. [
23].
5. Organic Matter Modelling
This “classical” stratigraphic forward modelling approach provides most of the needed parameters for organic matter simulation (e.g., water depth, morphology of the basin, sedimentation rate). Additional parameters were introduced within the new DionisosFlow
© Organic-Rich Sediment modelling module [
21,
22,
23] in order to simulate all the processes related to organic matter sedimentation (
Figure 2): Primary productivity, carbon flux, organic matter transport, dissolved oxygen level and burial efficiency (which corresponds to relative preservation of the organic matter during the first meters of burial). All the parameters and their numerical simulation are based on empirical equations or observations, which are summarized in Granjeon and Chauveau [
21].
In our case study the primary productivity is defined with a value at sea surface [
38] with a seaward stepwise decrease representative of large time scale (e.g., References [
39,
40,
41]).
Then, the determination of the exported production, the fraction of organic matter which reaches the sea floor, is deduced following the Martin’s law [
13] that respects an exponential decrease with water depth.
Once the remaining organic matter reaches the sea-floor, it can be transported by bottom currents which are accounted for using the same bedload equations of DionisosFlow
© than for inorganic sedimentary particles. Schieber et al. [
42], showed that the transport regime of the residual organic matter at the sea-floor can be reproduced using clay to sand properties.
The dissolved oxygen level calculation is based on works of Mann and Zweigel [
20]. It is possible to differentiate local areas of low dissolved oxygen zones (low mixing rate and/or high primary productivity) and areas of high oxygenation conditions (high mixing rate and/or low primary productivity; e.g., References [
43,
44,
45]) which depend on bathymetry, primary productivity and oxygen mixing rate. The oxygen level is expressed by a non-dimensional value ranging from 0 (anoxic environment) to 1 (fully oxygenated environment). In our model, the external factors which can lead to variation of the oxygen concentration in the water column are not simulated. Instead, we simulated an oxygen mixing rate (with no dimension and ranging from 0.3 to 1, see next section) that simulate the oxygen variation associated to external processes (e.g., water column stratification, inter-basin water exchange).
After sinking and transport, the relative amount of organic matter preservation below the first meters of burial (i.e., early diagenesis), called burial efficiency, is controlled by the sedimentation rate [
19] and the dissolved oxygen level on the seafloor [
26]. The organic matter preserved from degradation is diluted depending on the sedimentation rate. The TOC obtained with this modelling approach represents marine organic matter content after the first meters of burial and before methanogenesis.
In what follows, the “simulated TOC” refers to this initial marine TOC obtained with this modelling approach, and the “measured TOC” refers to the TOC obtained by laboratory analysis of field samples and/or deduced from the wireline logging after calibration [
46]. Comparison of this simulated TOC with measured TOC requires the following cautions: The terrestrial organic matter supply is presently not taken into account in the model. Therefore, comparisons are done on the marine organic matter fraction alone, after estimating the marine/terrestrial ratio of measured TOC.
This approach provides both organic matter distribution and heterogeneity through time and space. The simulated TOC represents an average value at the scale of the cells and of the time steps. The comparisons between simulated marine TOC after the first meters of burial obtained with the DionisosFlow© Organic-Rich Sediment approach and the measured TOC obtained from laboratory analysis of field data should be considered as relative variation comparisons. The average TOC values of organic-rich intervals are simulated rather than the measured high frequency variations, but it does not limit the significance of the model for the identification of key factors of organic matter distribution and heterogeneity.
6. Global Sensitivity Analysis
Since simulations can be very long, sensitivity analysis purely based on Monte-Carlo methods [
47] provide detailed information, but at the cost of very large computation times not compatible with industrial requirements. Therefore, some authors rather consider a small number of uncertain parameters or a reduced sample of the parameter space, even if it narrows the information that can be retained. For instance, sensitivity analyses are often performed testing extreme scenario with parameters varying one at a time (e.g., Reference [
48]). These approaches provides rough estimates of the sensitivity of a result to parameters considered as independent. They are also usually applied on a scalar results of interest (e.g., mean TOC), which makes difficult the link between the result of interest and the input variations.
In this paper, a new methodology proposed by Gervais et al. [
27] and implemented within CougarFlow
© was used to provide a global sensitivity analysis on the processes governing organic matter distribution and heterogeneities in the Paris Basin. It consists in building analytical functions (meta-models) that approximate the simulator output properties based on a limited set of simulations chosen using a Latin hypercube sampling. When these meta-models, also called proxy models, estimate accurately the outputs for any value of the critical parameters, they can be used instead of the simulator to perform the Monte Carlo samplings required for uncertainty quantification and sensitivity analysis. Besides, the chosen methodology provides an estimation of the influence of the varying parameters on the output properties at each location in the basin. This enables to relate the relative contribution of critical parameters with the basin physiography and thus to better understand the effective mechanisms occurring in the different parts of a sedimentary basin.
The methodology is not described in detail in this paper and readers can refer to Gervais et al. [
27] for a more thorough explanation of the mathematical concepts on which it relies. In this work the sensitivity analysis is performed on four parameters: The initial bathymetry of the basin, the efficiency of the organic matter diffusive transport, the rate of oxygen mixing and PP0 (initial primary productivity along the coastline). The range of their variations is determined from values available in literature and summarized in
Table 1. Both variations on bathymetry and efficiency of the diffusive transport can lead to a loss of calibration. Therefore, their ranges of variations where chosen low enough to keep the thickness calibration. For the same reasons, no sedimentation rate variations are allowed in order to keep the calibration of the stratigraphic model. This statistical approach rather focus on the relative influence of primary productivity, oxygen level constraints and organic matter transport behavior.
The variations on these critical parameters have an effect on 3 output parameters: (1) The oxygen level that determines the available oxygen for organic matter degradation; (2) the TOC that is dependent on the amount of organic matter and on its preservation (primary productivity and oxygen level); (3) the HI that is dependent on the HI0 and the preservation of organic matter.
In order to investigate the relative influence of these parameters we divided the stratigraphic forward model into 7 sub-intervals according to their organic content behavior (
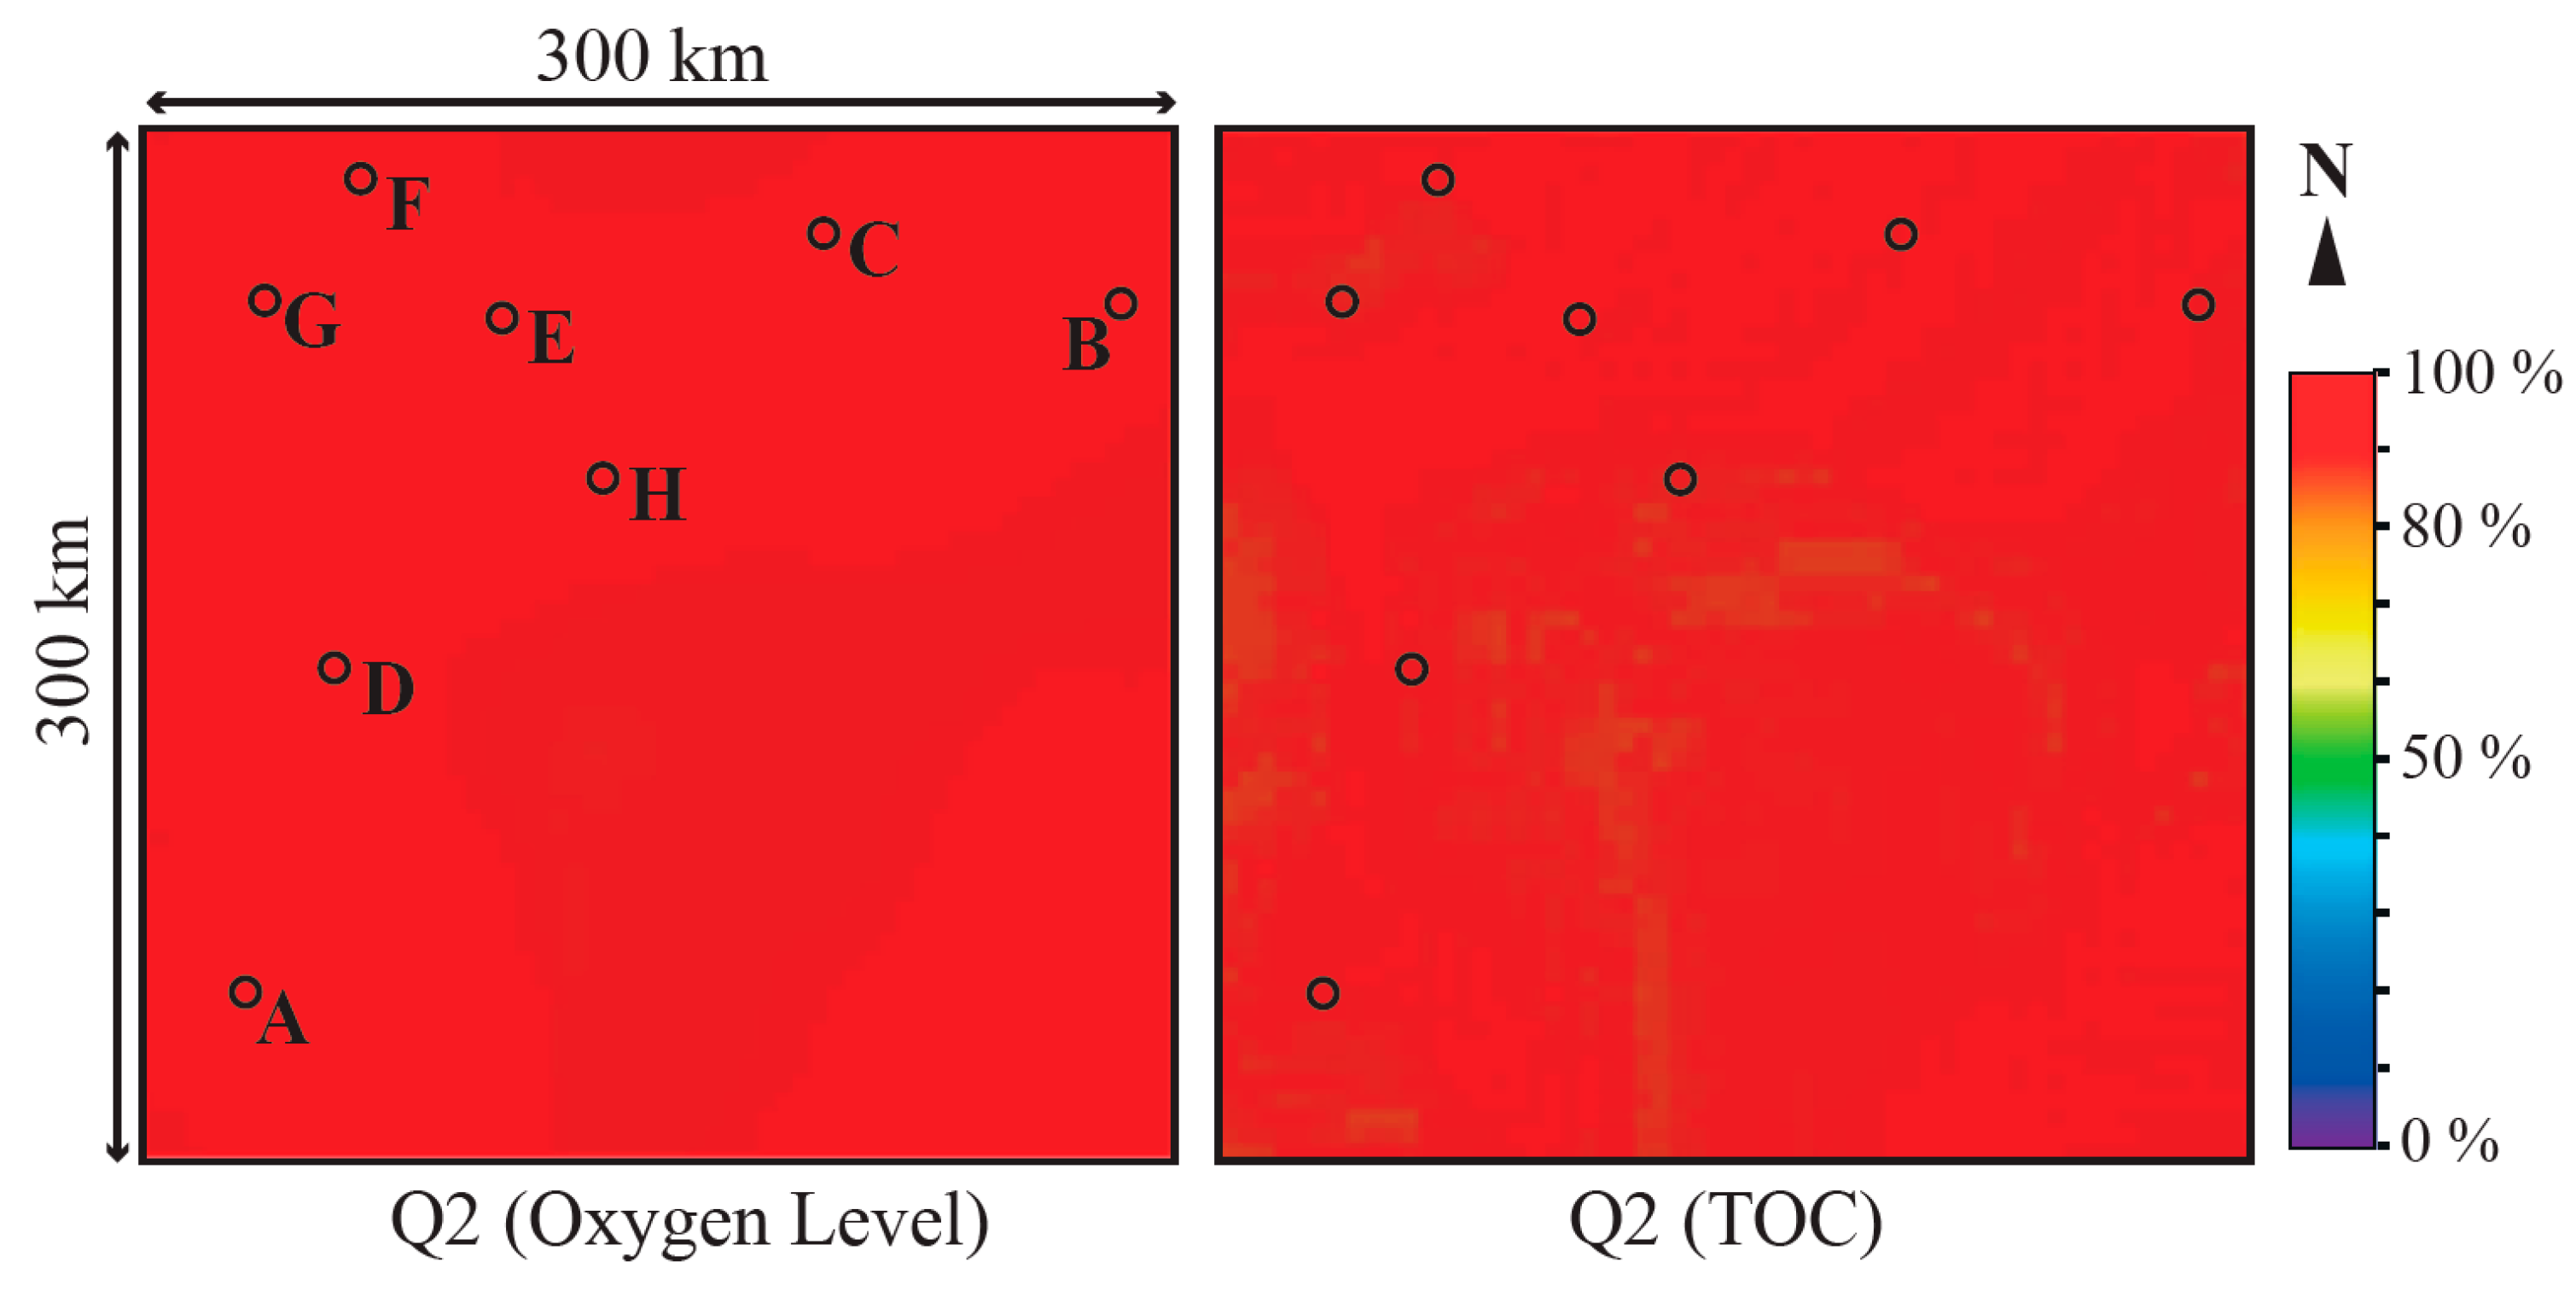
Figure 4). For each sub-interval and for each output variable of interest a meta-model (analytical model relating the value of the output property to the values of the critical parameters) was built based on 200 simulations. A quality indicator (Q2) is computed by cross validation. It represents the capability of the meta-model to consistently predict the value taken by the output properties within the ranges of variation of the critical parameters for the studied model. The closer to one is the Q2, the better is the model [
27]. Good models are considered to have Q2 > 0.9.
Then, the sensitivity analysis can be performed on each meta-model to determine the contribution of each critical parameter (given its range of variation) to the variation of the resulting properties. This analysis is done using a method of variance decomposition based on the computation of Sobol’s indices [
49]. They measure the part of the output variance, which is due to each parameter alone (primary effect) and to each parameter, including its interactions with other parameters (total effect).
A full description of meta-model construction and associated mathematical concepts is available in Gervais et al. [
27].
7. Results and Discussion
7.1. Q2 Maps
Q2 maps resulting from 200 simulations for each output parameters are presented in the
Figure 8. Here we can show that the oxygen level and TOC are well predictable (no value under 80%).
7.2. Global Sensitivity Analysis
The set of 200 meta-models for each interval provided a predictive coverage, including all the possible variations of the parameters of the
Table 1. As the basin morphology and sedimentation rates are roughly the same throughout the Lower-Middle Toarcian time interval, the results are very similar from an interval to another. As an example, the results of the interval 3 (181.7 to 181.5 Ma), which is the interval with the highest TOC content are presented here (
Figure 9).
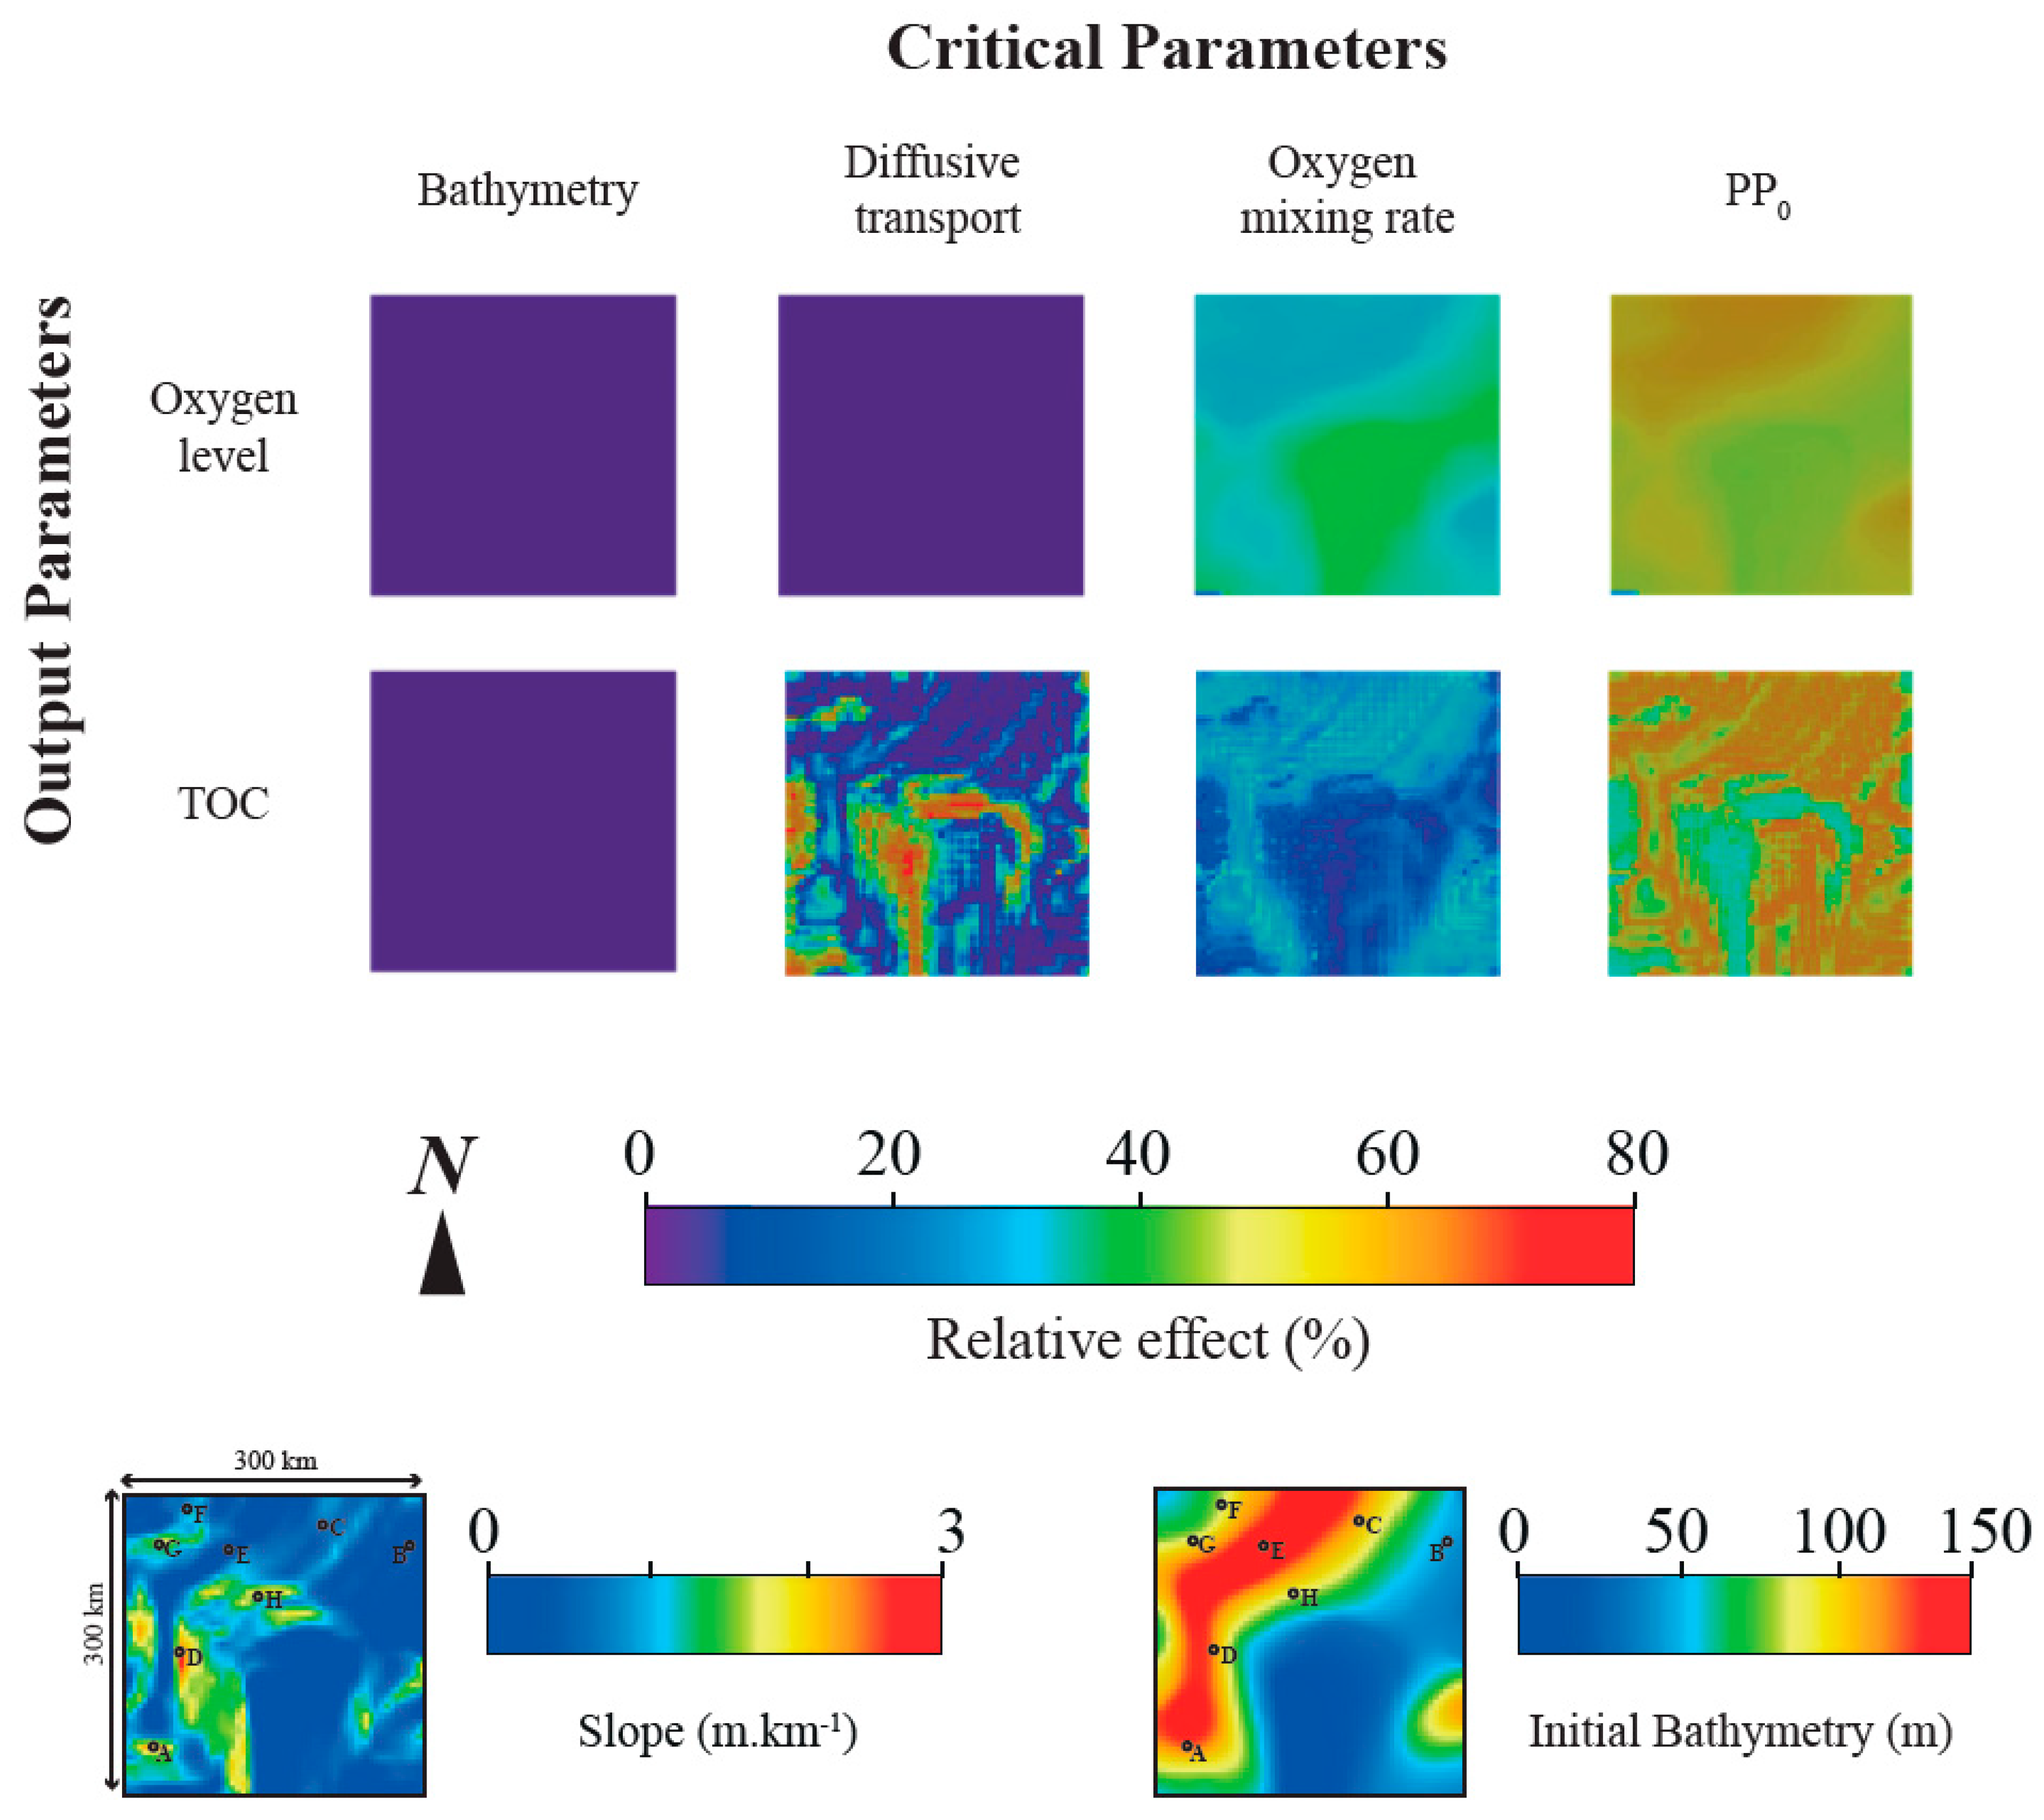
The result maps of the GSA are presented in
Figure 10 (relative effect maps). The relative effect maps provide the quantitative influence of each variable parameter on the output parameters (TOC, oxygen level).
7.3. Bathymetry and Sedimentation Rate
With our approach, the calibration of the sedimentary model (facies and thickness) provide strong constraints on the model. As a result of this strong constraints, bathymetry and sedimentation rate have therefore a small range of variation. The maximum variations allowed on bathymetry are ±20 m from the calibrated stratigraphic model bathymetry (
Table 1). As a result of this limited variations on bathymetry, the GSA results showed a bathymetry impact under 5% on the output parameters (HI, oxygen level and TOC) (
Figure 10). For the same reasons, no sedimentation rate variations are allowed in order to keep the calibration of the stratigraphic model. However, this parameter has a non-negligible impact on organic matter preservation and dilution [
19]. For these reasons, the interpretation of the GSA results have some caveats.
7.4. Oxygen Level
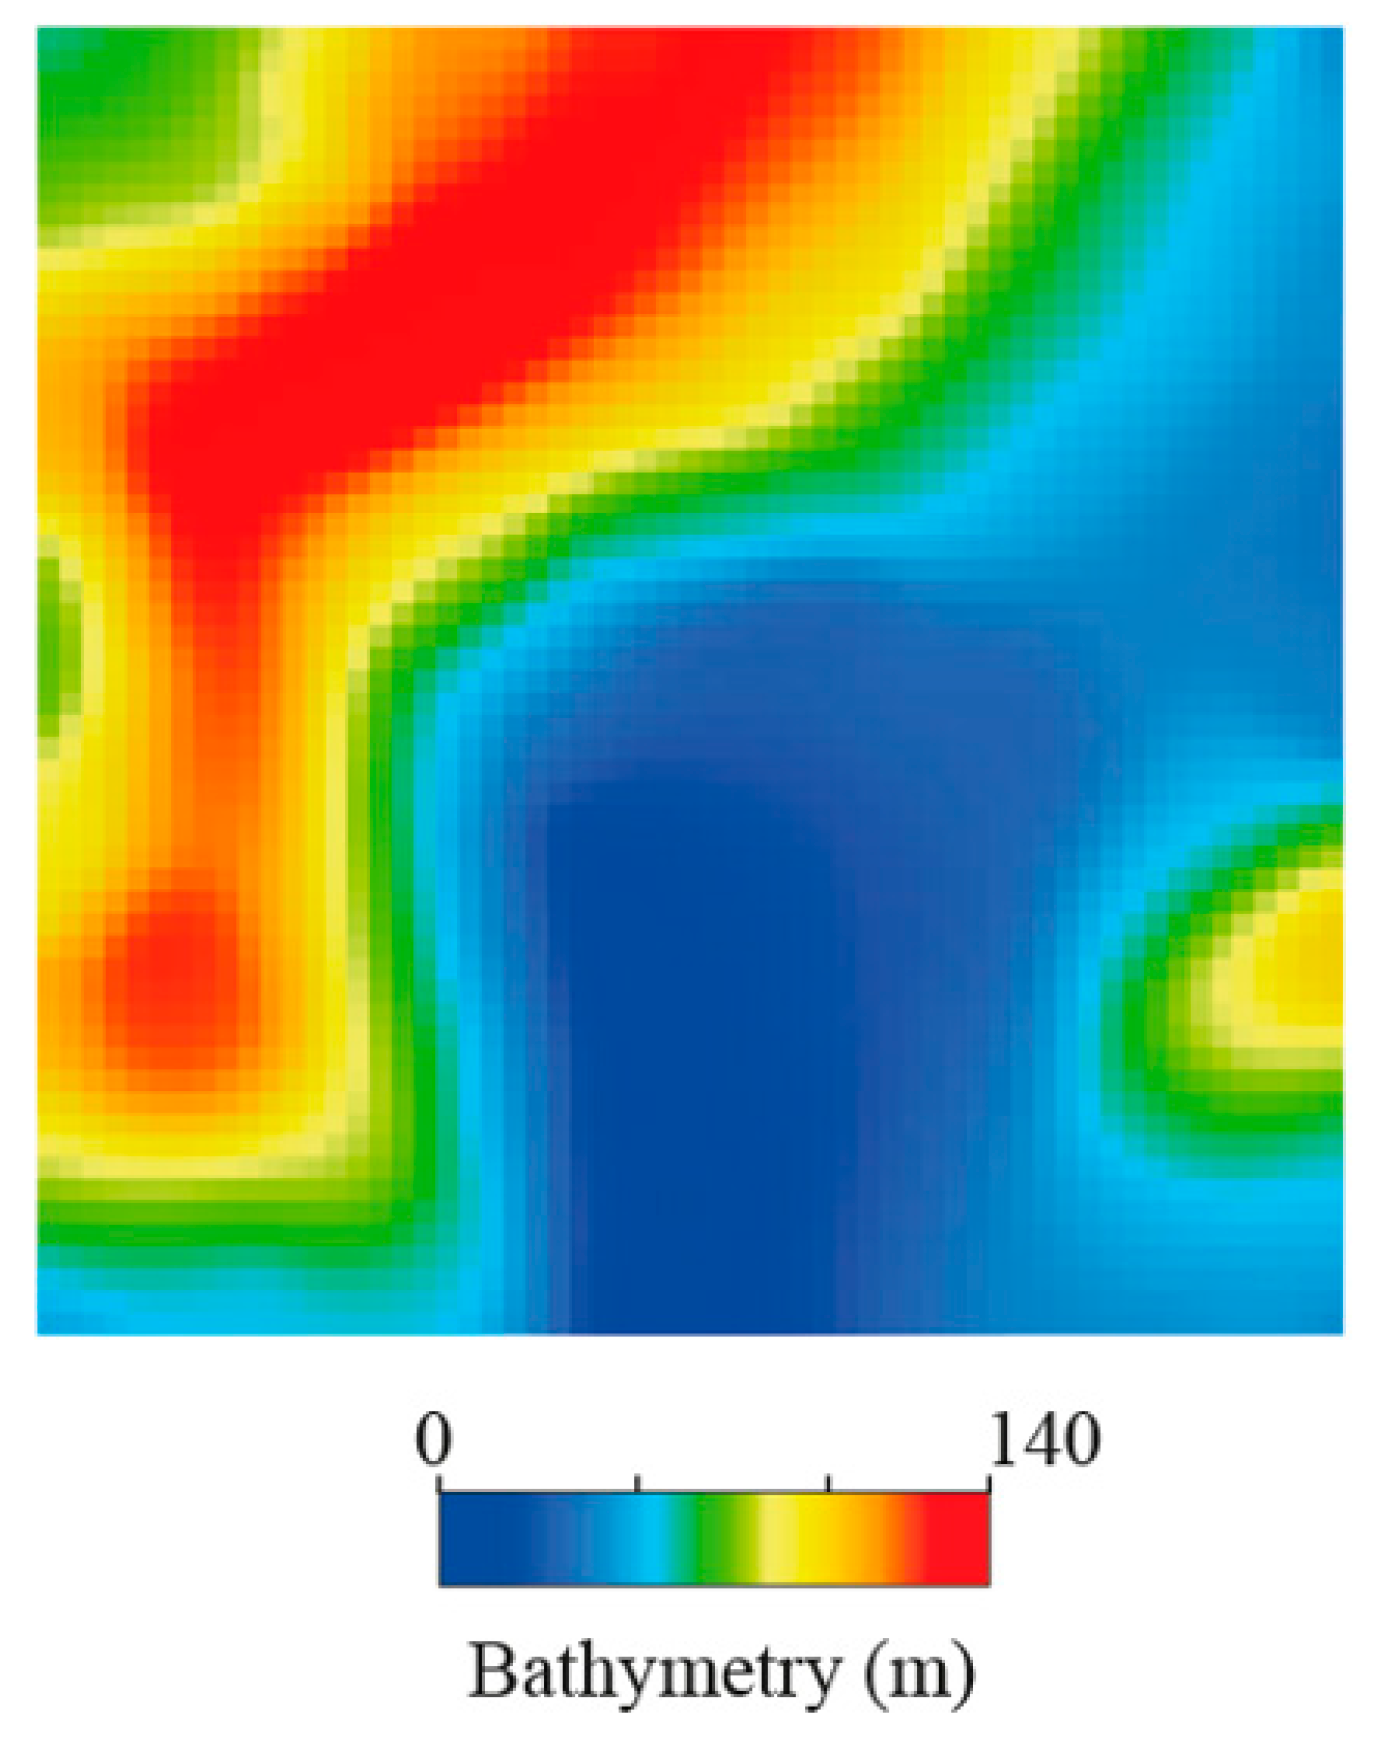
The oxygen level at sea-floor is dependent on primary productivity (PP0; correlated to the amount of used oxygen by organic matter consumers) and oxygen mixing rate. The maps of the GSA can be divided in two domains of very different oxygen level behavior:
(1) The first domain corresponds to shallow areas where bathymetry is under 50 m (
Figure 11). In these areas, the relative effect of oxygen mixing rate and primary productivity (PP0) are roughly the same (between 45 and 55%) (
Figure 10).
(2) The second domain corresponds to deeper areas where bathymetry is higher than 50 m (
Figure 11). In these areas, the relative effect of oxygen mixing rate is lower than in the shallowest areas (between 25 and 35%) (
Figure 10).
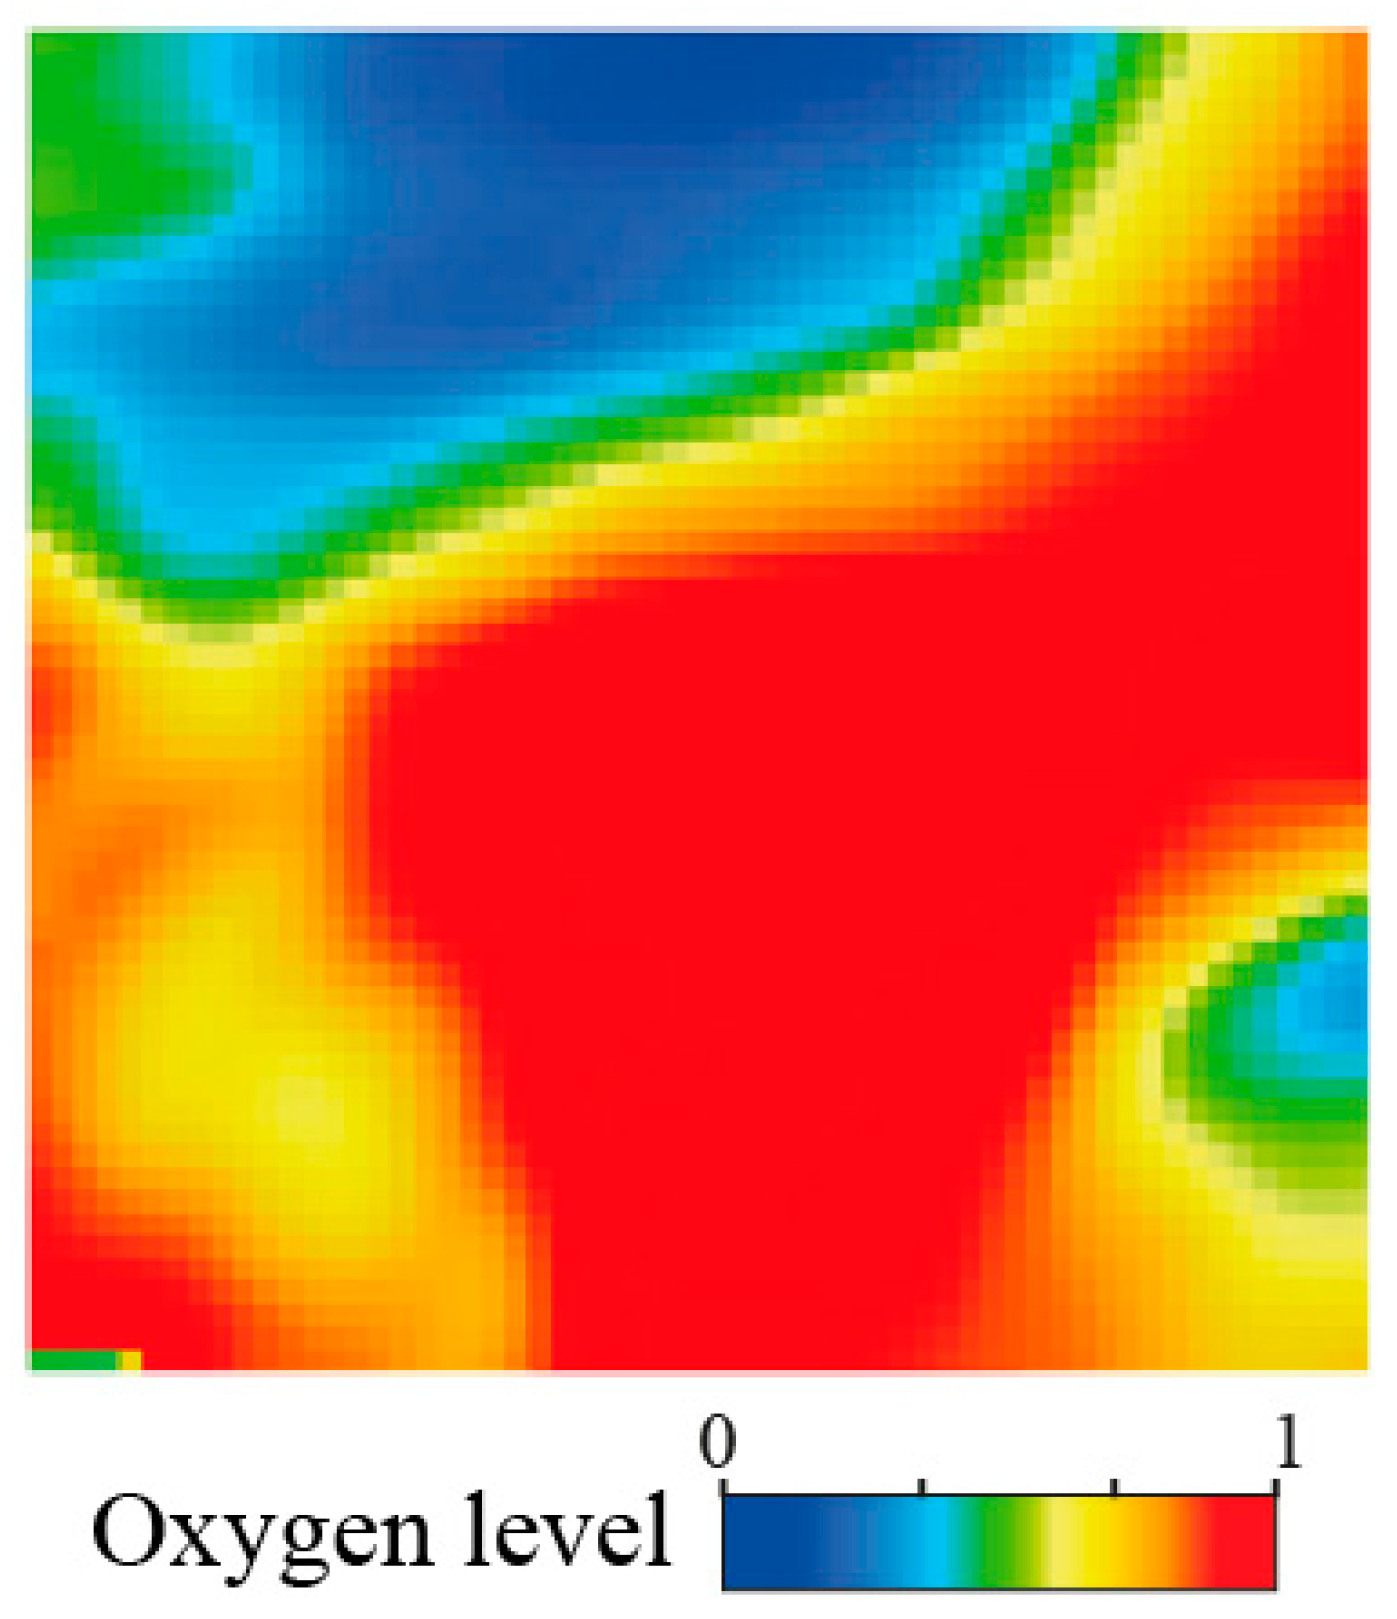
The high impact of oxygen mixing rate in shallow areas is mainly linked to the strong oxygen renewal, due to oxygen diffusion from atmosphere, but also to wind and waves actions, which both increases the mixing rate. This impact is less important in the deepest parts of the basin where water is less agitated. Here, no deep water circulation were modelled because the Paris Basin was an epicontinental basin with low bathymetry during Lower Jurassic. Results also emphasize that fairly high primary productivity (more than 200 gC·m
−2·year
−1) led to oxygen depleted environments (oxygen level at sea floor under 0.6) (
Figure 12). This result suggests that poorly oxygenate environment or anoxia can be driven by primary productivity without involving the oxygen mixing rate. Furthermore, the oxygen depletion occurred in the deepest parts of the basin in the best-fitting models. This interpretation matches the anoxic expanding puddle model of Wignall [
17], which has proposed a propagation of anoxia from the deepest part of the basin during transgression (
Figure 1) and also the irregular bottom stratigraphy of Hallam and Bradshaw [
15] where the anoxia is led within the deep sub-basins, which are created by subsiding depocenters (
Figure 1). The driving force of this model is the development of an anoxic layer in the basin area disconnected from oxygen supply. We suggest that this anoxic layer is rather linked to the primary productivity than oxygen depletion linked to external factors (e.g., water stratification), because the oxygen mixing rate is high in our simulations. This assumption is in accordance with the upwelling model proposed by Jenkyns [
16] (
Figure 1), with the exception that the oxygen minimum zone is located in the deepest part of the basin, due to the low bathymetries and water circulation of the Paris Basin during the Toarcian. Nonetheless, the results indicate that the primary productivity does not need to be extremely high like in present-day upwelling areas. A primary productivity at sea surface (PP0) of 200 gC·m
−2·year
−1 with a seaward decrease of 10 gC·m
−2·year
−1 every 10 km, is sufficient to produce anoxia. These values are low to moderate by comparison with present-day shelves, but they are in accordance with the best estimates of palaeoproductivity from Tyson [
50].
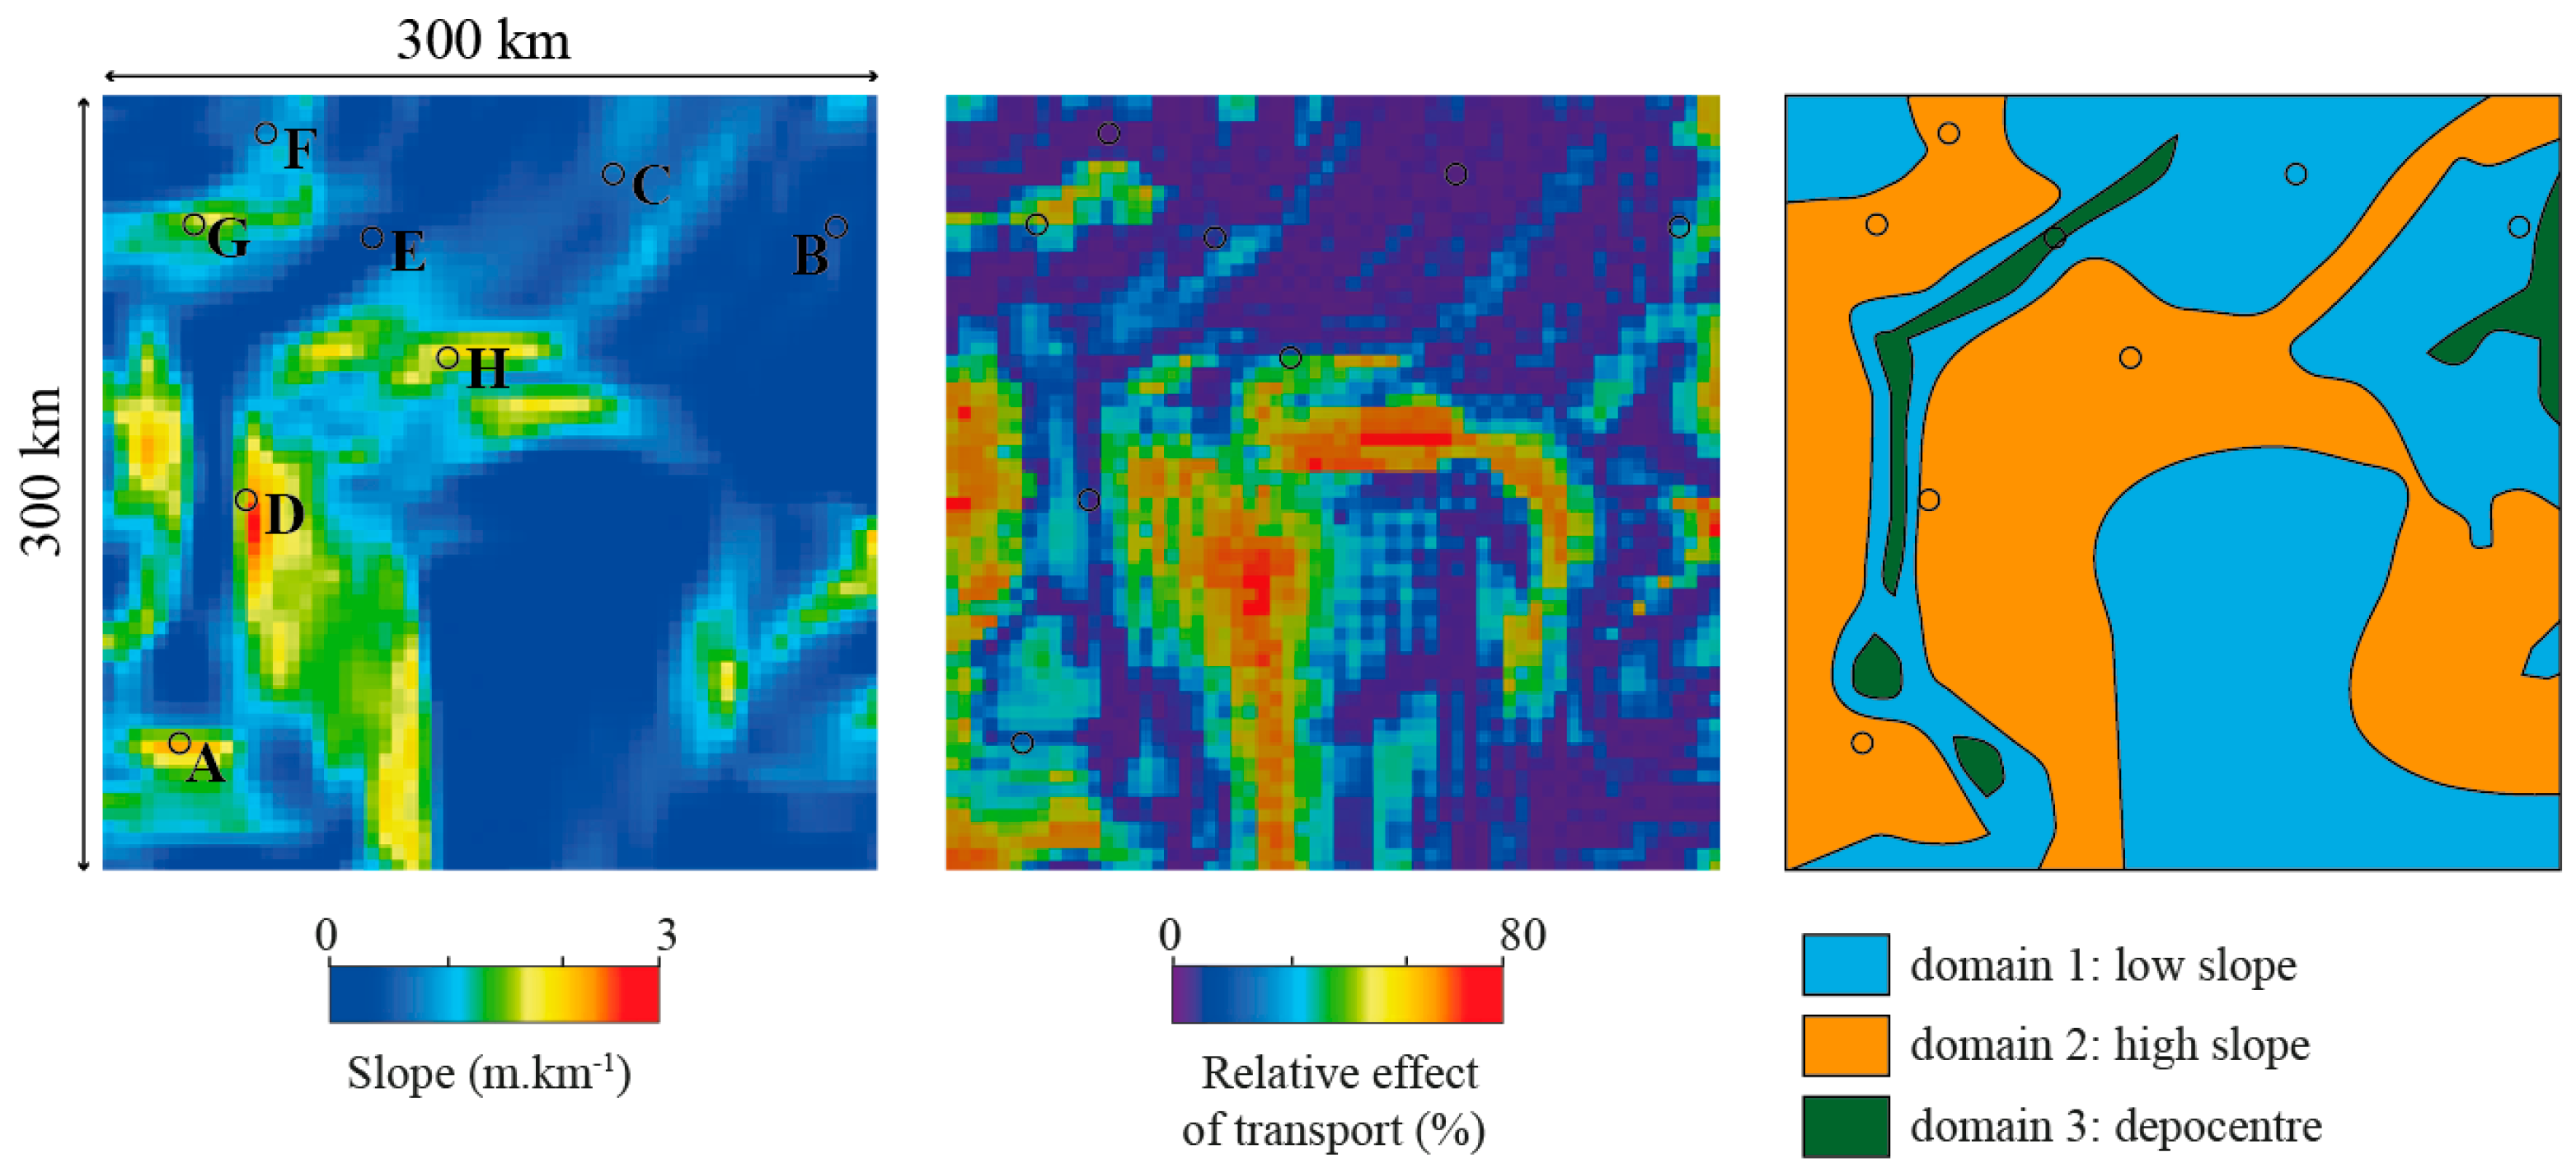
7.5. TOC Distribution
The result maps of the GSA can be divided in three domains for the TOC distribution. The relative impact of critical parameters are different for these three domains (
Figure 13):
(1) The first domain represents the flat areas where the slope is really low (between 0 to 0.5 m·km
−1, ~0.03°) (
Figure 13). In these areas, TOC is mainly controlled by the amount of primary productivity (PP0) (between 60 and 70% of relative effect) and to oxygen mixing rate (between 10 and 30% of relative effect) (
Figure 10).
(2) The second domain represents areas where the slope is higher than 0.5 m·km
−1 (0.03°) (
Figure 13). There, TOC is by far controlled by the diffusive transport behavior of the organic matter (between 60 and 80% of relative effect) (
Figure 10). The primary productivity (PP0) contributes for the remaining part (between 20 to 40%) and the oxygen mixing rate have a very low impact (less than 10% of relative effect) (
Figure 10).
(3) The third domain represents the depocenters, which are located in the deepest parts of the basin, where the slope is generally under 0.5 m·km
−1 (0.03°) and the accumulation of sediment is higher (higher sedimentation rates) than in other areas (
Figure 13). Here, the relative effect on TOC content is roughly the same for primary productivity (PP0), oxygen mixing rate and diffusive transport of the organic matter (between 30 and 35%) (
Figure 10).
With regard to these results, the primary productivity has a strong impact on the TOC distribution. This is due to a double effect: It increases the amount of initial available organic matter and it also consumes oxygen leading to an oxygen depletion in the deepest part of the basin. Nonetheless, the morphology of the basin, through the relative effect of the transport, is also an important factor. The organic matter sinking to the area where the slope of the ramp is higher than 0.5 m·km
−1 (0.03°) is then transported to the central areas where the oxygen level ensures a better preservation (
Figure 10 and
Figure 13). These interpretations are in accordance with the strong impact of nepheloid layers described on higher slopes by Inthorn et al. [
51].
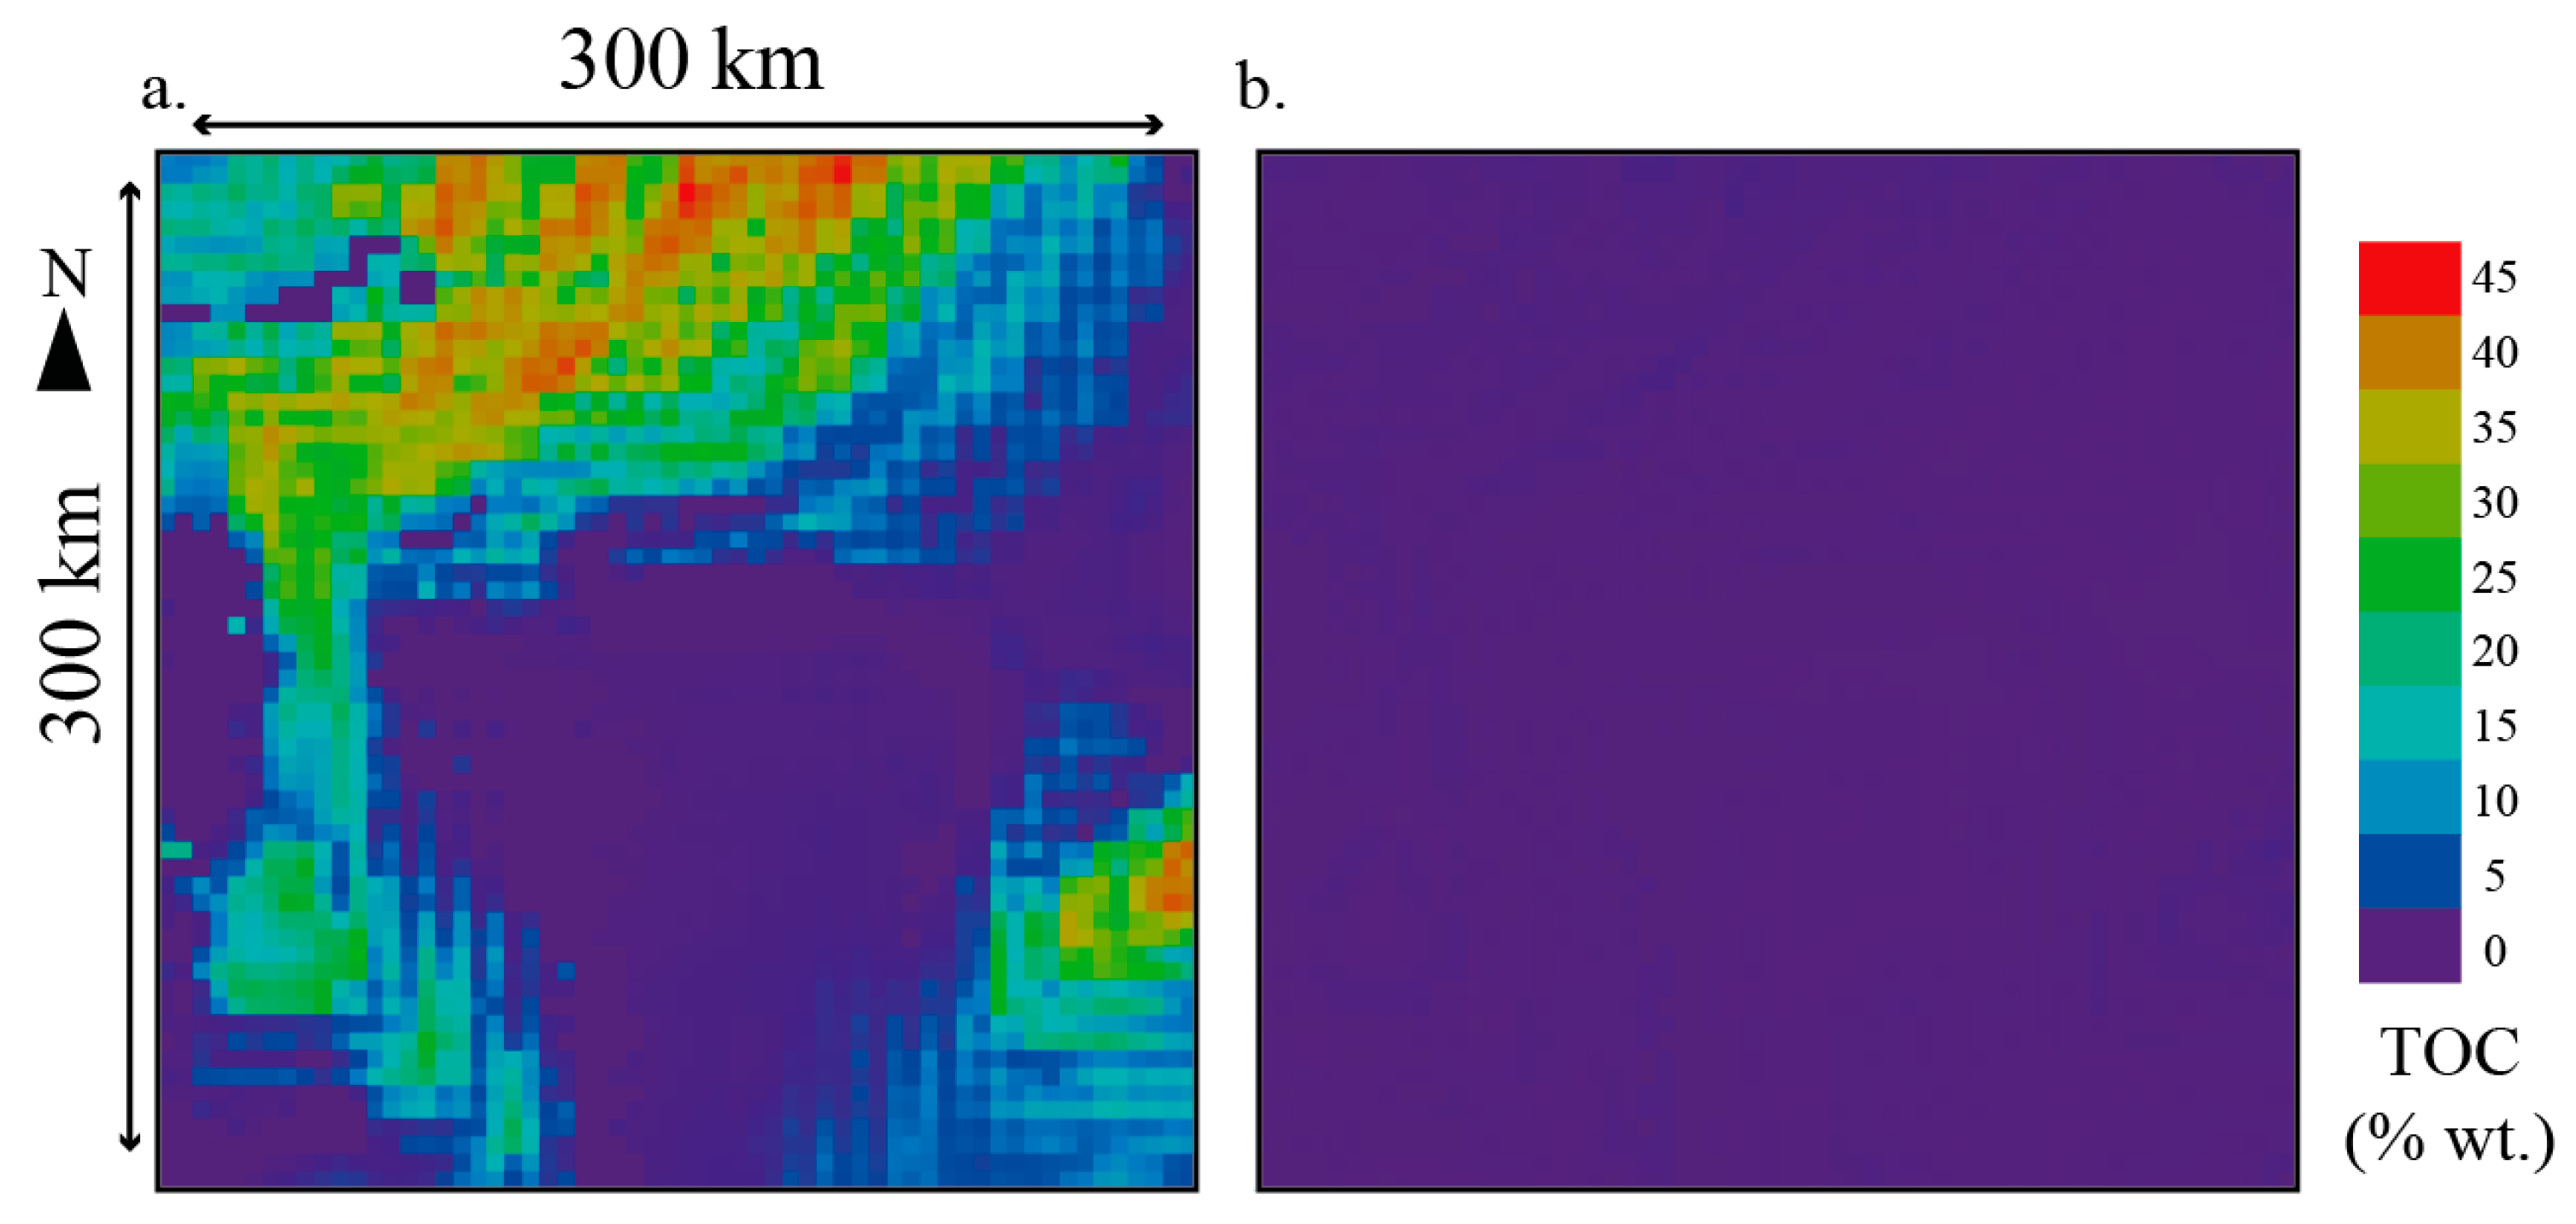
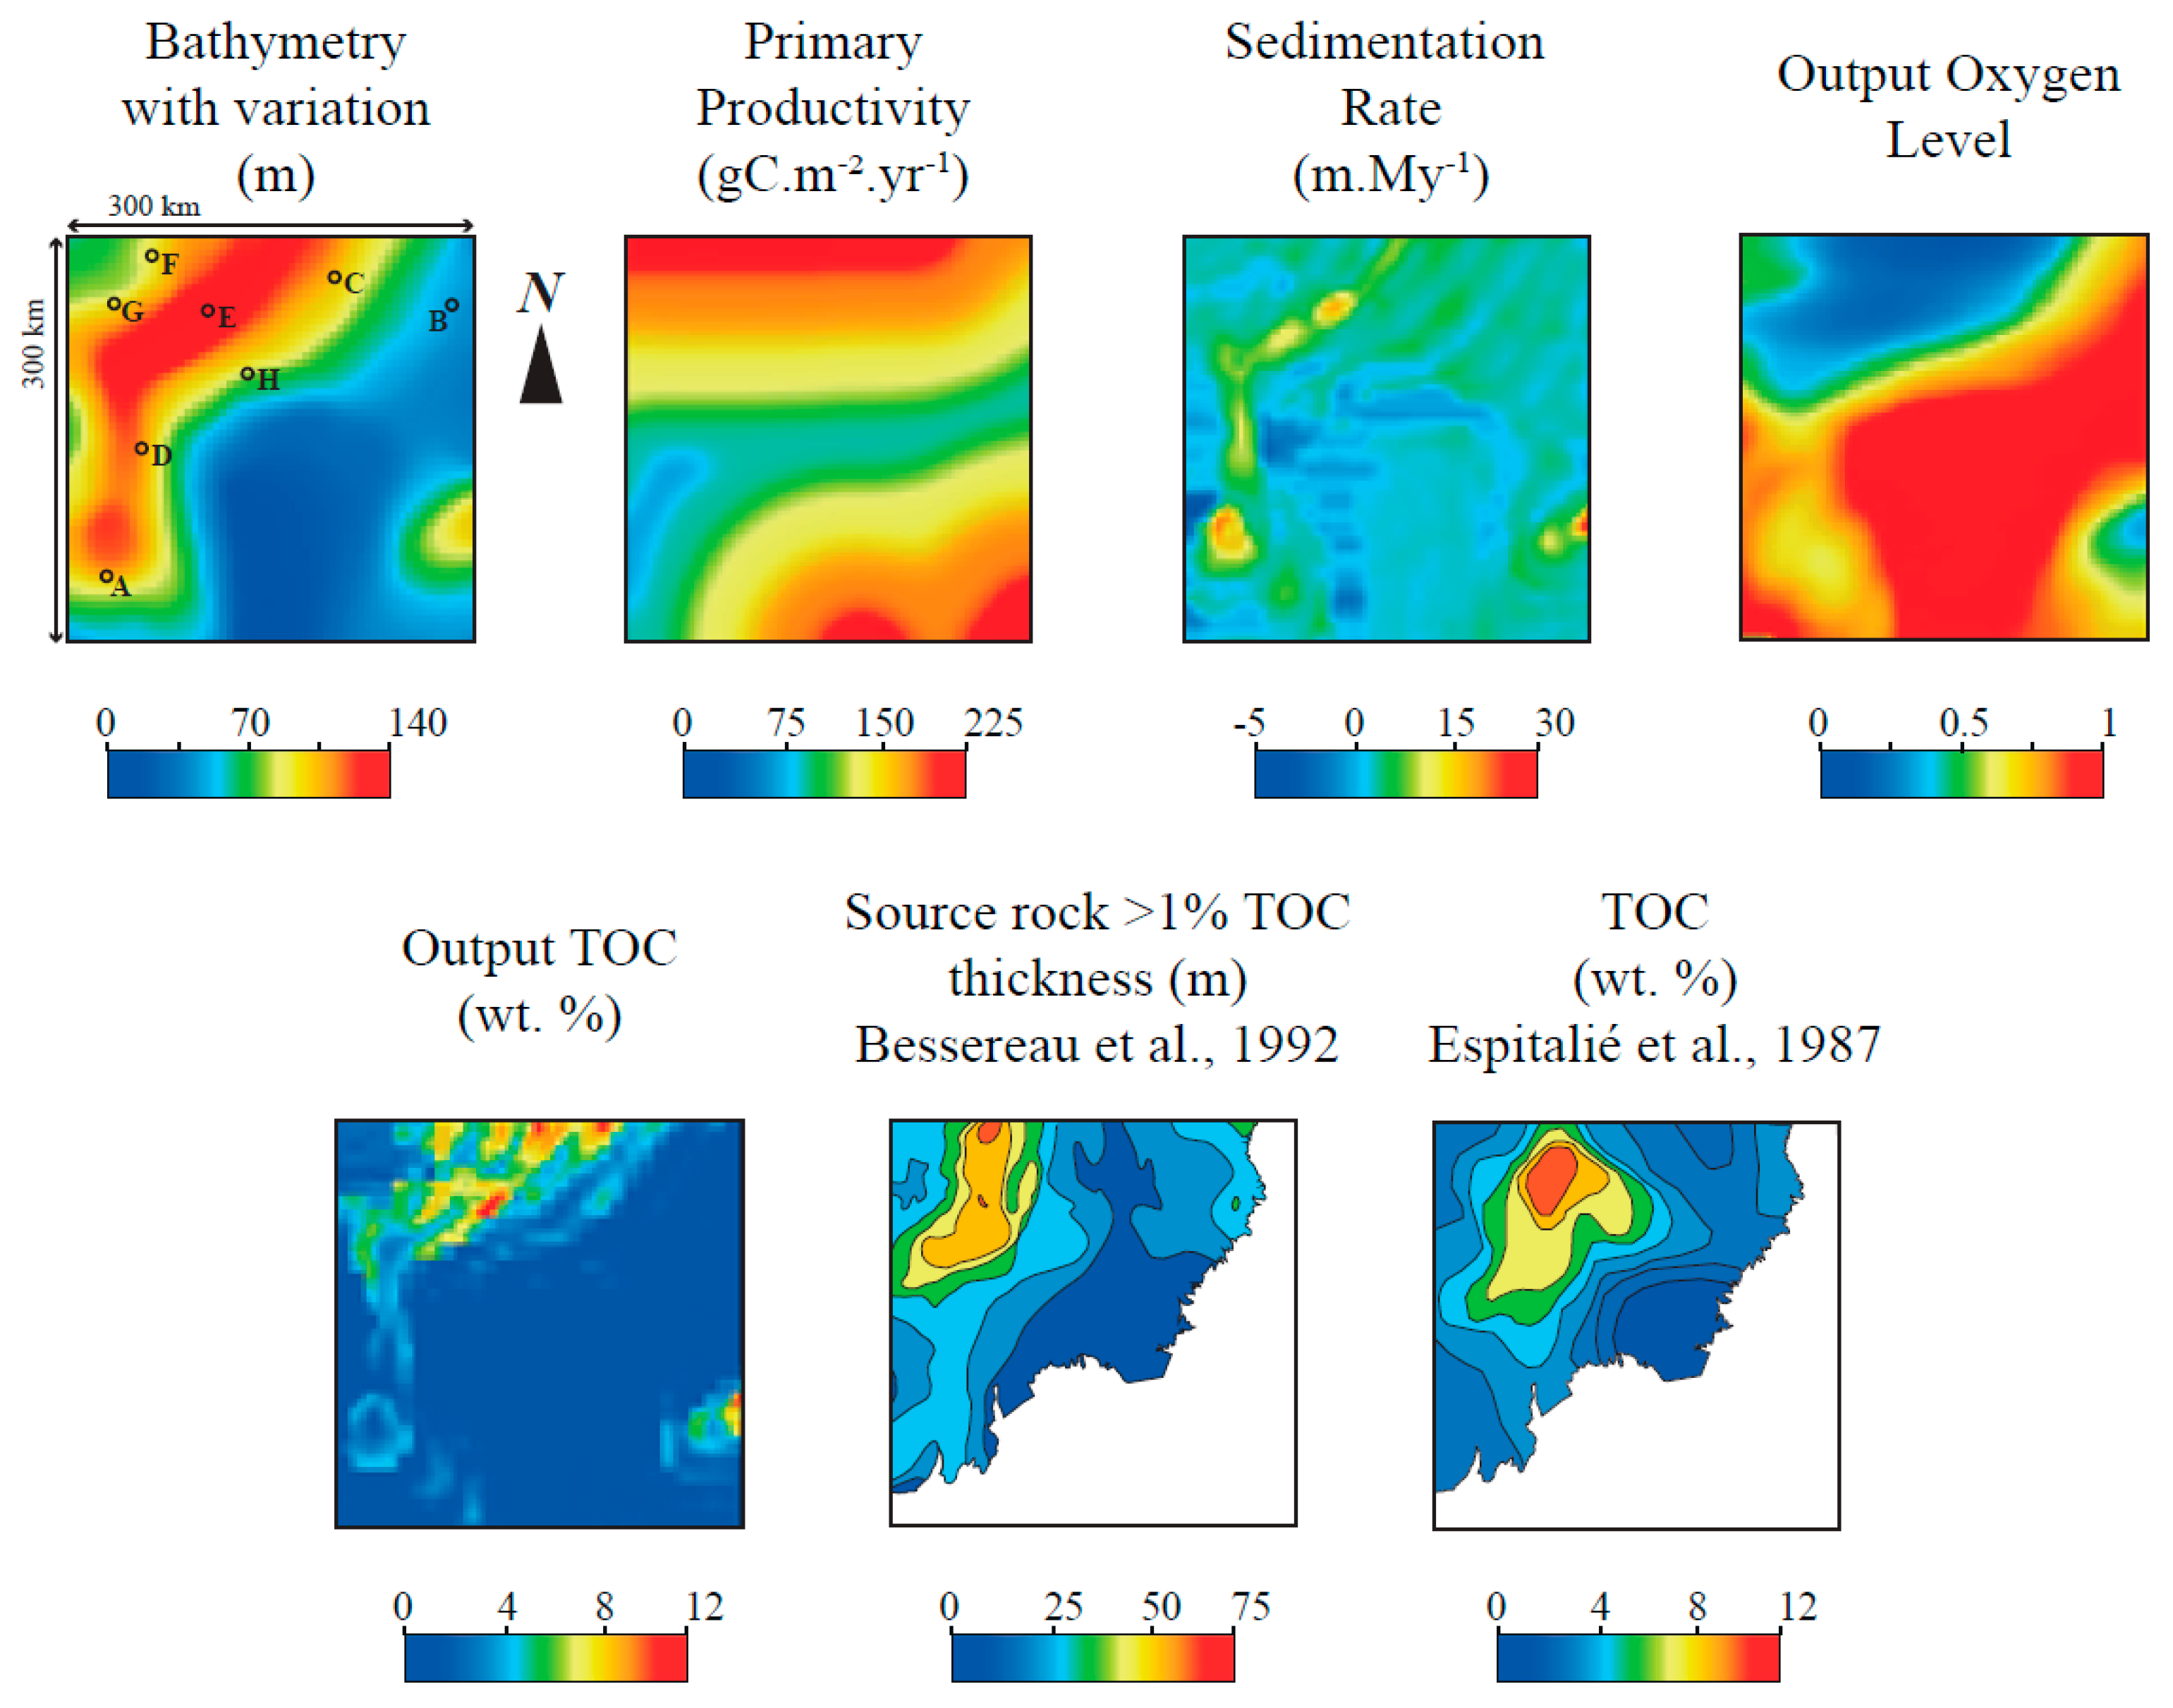
Furthermore, the best-fit models (
Figure 14) show that a transport behavior close to clay particles is required to obtain a good TOC distribution in the basin. The transport and spatial distribution of organic matter—shale aggregates is driven by suspension and advection under influence of nepheloid layer currents and the deposition occurs when hydrodynamism is not sufficient [
51,
52]. Since the very gentle slopes in the models allowed the transport of organic matter (less than 2.5 m·km
−1 or 0.1°) without modelling the currents, which is in accordance with the carbonate ramp environment described by Burchette and Wright [
53] (
Figure 1), the bottom topography also has a strong impact on TOC distribution. Such setting follows the irregular bottom topography models proposed by Hallam and Bradshaw [
15] or by Röhl and Schmid-Röhl [
18] (
Figure 1).
7.6. Best-Fit Models
From the 200 meta-models of interval 3 (181.7 to 181.5 Ma) we have selected 10 models that corresponded the best to the data in terms of TOC distribution and oxygen level (
Figure 14). These meta-models show the same scenario where the critical parameters are always included in the following ranges: Variation on initial Bathymetry between −17 and +9 m; PP0 between 175 and 225 gC·m
−2·year
−1; organic matter diffusive transport between 0.41 to 0.48 km
2·kyrs
−1; oxygen mixing rate between 0.93 and 0.98.
8. Conclusions
The balance between a high primary productivity and the factors favoring organic matter preservation represents an important part of the debate that aims to determine the conditions for the development of high organic carbon contents in sediments. The main goal of this study was to analyze the processes controlling organic matter distribution and heterogeneity through a numerical quantitative approach coupled to a sensitivity analysis applied to the Lower-Middle Toarcian succession of the Paris Basin. A Global Sensitivity Analysis was performed on oxygen mixing rate, primary productivity and diffusive transport of organic matter with CougarFlow© on 3D numerical meta-models built with the software DionisosFlow© Organic-Rich Sediment. The results and associated interpretations allow us to draw several important conclusions:
(1) The primary productivity has a strong impact on oxygen level in shallow epicontinental basins. It can led to anoxia even with low productivity levels (<175 gC·m−2·year−1) in areas where the bathymetry is deeper than 50 m. A low oxygen mixing rate can also led to anoxia, but the resulting modelled TOC distribution is then not in accordance with data from the Paris Basin.
(2) The oxygen consumption can be linked to the amount of organic matter without involving water stratification.
(3) The diffusive transport behavior of organic matter (in the form of organo-mineral floccules) has to be similar to clay particles to reproduce the TOC distribution observed in the Lower-Middle Toarcian of the Paris Basin. It highlights the strong impact of nepheloid layer currents and hydrodynamism on the distribution of the organic matter provided by the primary productivity, even in carbonate ramp environments where the slope is under 0.1°.
These quantitative approaches, and their conclusions, open new perspectives about the understanding of global distribution of organic-rich sediments. We suggest that the current debate opposing primary productivity vs. oxygen level, which widely concentrated the studies about organic-rich deposits in the last decade, should be widened. As the oxygen consumption, and therefore the oxygen level, can be linked to the amount of organic matter (without involving water stratification), the primary productivity is obviously a key parameter that govern organic matter distribution and heterogeneities. That being said, this process in its entirety (from primary production at sea surface to oxygen consummation in the basin) is strongly linked to the basin morphology. In upwelling areas, the oxygen minimum zone, which preserved organic matter is induced because of the high primary productivity linked to the high nutrient supply. This high nutrient supply is itself linked to large and open oceanic basins, which allowed specific conditions of the winds regime and water mass circulations. In the case of the Lower Jurassic Paris Basin, the transport of the organo-mineral floccules along the slope drives the location of oxygen depletion and organic matter accumulation. Such behavior may apply to other epicontinental basins, depending on their sedimentary and geometrical settings.
Author Contributions
Funding acquisition, B.B.; Investigation, B.B. and M.V.; Methodology, B.B., M.V., M.D. and B.C.; Software, B.B., M.D. and B.C.; Supervision, B.B., F.B. and I.M.; Writing—original draft, B.B.
Funding
This research received no external funding.
Acknowledgments
DionisosFlow© is developed in the framework of the IFP Energies Nouvelles project DORS (“Dionisos Organic-Rich Sediment”). We are grateful to Didier Granjeon, Jean-François Deronzier, Jean-Pierre Barde and Laurent Riquier for constructive discussions. We also thank BeicipFranlab for support with DionisosFlow©. We wish to thank four anonymous reviewers for their constructive remarks.
Conflicts of Interest
The authors declare no conflict of interest.
References
- Goldman, M.I. “Black Shale” Formation in and about Chesapeake Bay. Bull. Am. Assoc. Petrol. Geol. 1924, 8, 195–201. [Google Scholar]
- Demaison, G.; Moore, G.T. Anoxic environment and oil source bed genesis. AAPG Bull. 1980, 64, 1179–1209. [Google Scholar] [CrossRef]
- Pedersen, T.F.; Calvert, S.E. Anoxia vs. Productivity: What Controls the Formation of Organic-Carbon-Rich Sediments and Sedimentary Rocks? AAPG Bull. 1990, 74, 454–466. [Google Scholar]
- Tyson, R.V. The “productivity versus preservation” controversy: cause, flaws, and resolution. In The Deposition of Organic-Carbon-Rich Sediments: Models, Mechanisms, and Consequences; Harris, N., Ed.; SEPM Special Publication: Broken Arrow, OK, USA, 2005; Volume 82, pp. 17–33. [Google Scholar]
- Küspert, W. Environmental changes during oil shale deposition as deduced from stable isotope ratios. In Cyclic and Event Stratification; Einsele, G., Seilacher, A., Eds.; Springer: Berlin, Germany, 1982; pp. 482–501. [Google Scholar]
- Fleet, A.J.; Clayton, C.J.; Jenkyns, H.C.; Parkinson, D.N. Liassic source rock deposition in Western Europe. In Petroleum Geology of North West Europe; Brooks, G., Ed.; Geological Society of London: London, UK, 1987; pp. 59–70. [Google Scholar]
- Jenkyns, H.C.; Clayton, C.J. Black shales and carbon isotopes in pelagic sediments from the Tethyan Lower Jurassic. Sedimentology 1986, 33, 87–106. [Google Scholar] [CrossRef]
- Jenkyns, H.C.; Gröcke, D.R.; Hesselbo, S.P. Nitrogen isotope evidence for water mass denitrification during the early Toarcian (Jurassic) oceanic anoxic event. Paleoceanography 2001, 16, 1–11. [Google Scholar] [CrossRef]
- Jenkyns, H.C.; Jones, C.E.; Gröcke, D.R.; Hesselbo, S.P.; Parkinson, D.N. Chemostratigraphy of the Jurassic System: Applications, limitations and implications for palaeoceanography. Geol. Soc. Lond. 2002, 159, 351–378. [Google Scholar] [CrossRef]
- Van De Shootbrugge, B.; Mcarthur, J.M.; Bailey, T.R.; Rosenthal, Y.; Wright, J.D.; Miller, K.G. Toarcian oceanic anoxic event: An assessment of global causes using belemnite C isotope records. Paleoceanography 2005, 20, 1–10. [Google Scholar] [CrossRef]
- Wignall, P.B.; Mcarthur, J.M.; Little, C.T.S.; Hallam, A. Methane release in the Early Jurassic Period. Nature 2006, 441, E5. [Google Scholar] [CrossRef] [PubMed]
- Mcarthur, J.M. Comment on “Carbon-isotope record of the Early Jurassic (Toarcian) Oceanic Anoxic Event from fossil wood and marine carbonate (Lusitanian Basin, Portugal)” by Hesselbo S., Jenkyns H.C., Duarte L.V., Oliveira L.C.V. Earth Planet. Sci. Lett. 2007, 259, 634–639. [Google Scholar] [CrossRef]
- Martin, J.H.; Knauer, G.A.; Karl, D.M.; Broenkow, W.W. VERTEX: Carbon cycling in the northeast Pacific. Deep-Sea Res. 1987, 34, 267–285. [Google Scholar] [CrossRef]
- Schlanger, S.O.; Jenkyns, H.C. Cretaceous oceanic anoxic event: causes and consequences. Geol. Mijnb. 1976, 55, 179–184. [Google Scholar]
- Hallam, A.; Bradshaw, M.J. Bituminous shales and oolithic ironstones as indicators of transgressions and regressions. J. Geol. Soc. Lond. 1979, 136, 57–164. [Google Scholar] [CrossRef]
- Jenkyns, H.C. The early Toarcian and Cenomanian–Turonian Anoxic Events in Europe: comparisons and contrasts. Geol. Rundsch. 1985, 74, 505–518. [Google Scholar] [CrossRef]
- Wignall, P.B. Model for transgressive black shales? Geology 1991, 19, 167–1704. [Google Scholar] [CrossRef]
- Röhl, H.J.; Schmid-Röhl, A. Lower Toarcian (upper liassic) black shales of the central European epicontinental basin: a sequence stratigraphic case study from the SW German Posidonia shale. SPM Spec. Publ. 2005, 82, 165–189. [Google Scholar]
- Betts, J.N.; Holland, H.D. The oxygen content of ocean bottom waters, the burial efficiency of organic carbon, and the regulation of atmospheric oxygen. Glob. Planet. Chang. 1991, 97, 5–18. [Google Scholar] [CrossRef]
- Mann, U.; Zweigel, J. Modeling source-rock distribution and quality variations: the organic facies modelling approach. Spec. Publ. Int. Assoc. Sedimentol. 2008, 40, 139–274. [Google Scholar]
- Granjeon, D.; Chauveau, B. Sedimentary Basin Development Method Using Stratigraphic Simulation Coupled with an Organic Matter Production and Degradation Model. U.S. Patent No. 9,971,061, 15 May 2018. [Google Scholar]
- Bruneau, B.; Chauveau, B.; Duarte, L.V.; Desaubliaux, G.; Moretti, I.; Baudin, F. 3D Numerical Modelling of Marine Organic Matter Distribution: example of the Early Jurassic sequences of the Lusitanian Basin (Portugal). Basin Res. 2018, 30, 1–23. [Google Scholar] [CrossRef]
- Bruneau, B.; Chauveau, B.; Baudin, F.; Moretti, I. 3D stratigraphic forward numerical modelling approach for prediction of organic-rich deposits and their heterogeneities. Mar. Petrol. Geol. 2017, 82, 1–20. [Google Scholar] [CrossRef]
- Pompeckj, J.F. Der Jura zwischen Regensburg und Regenstauf. Geogn. Jahresh. 1901, 14, 139–220. [Google Scholar]
- Baudin, F.; Tribovillard, N.; Trichet, J. Géologie de la Matière Organique; Vuibert, Ed.; Société Géologique de France: Paris, France, 2007; p. 263. [Google Scholar]
- Tyson, R.V. Sedimentary Organic Matter: Organic Facies and Palynofacies; Chapman and Hall: London, UK, 1995; p. 615. [Google Scholar]
- Gervais, V.; Ducros, M.; Granjeon, D. Probability maps of reservoir presence and sensitivity analysis in stratigraphic forward modelling. AAPG Bull. 2018, 102, 613–628. [Google Scholar] [CrossRef]
- Guillocheau, F.; Robin, C.; Allemand, P.; Bourquin, S.; Brault, N.; Dromart, G.; Friedenberg, G.; Garcia, J.-P.; Gaulier, J.-M.; Gaumet, F.; et al. Mesocenozoic geodynamic evolution of the Paris Basin: 3D stratigraphic constraints. Geodin. Acta 2000, 13, 189–246. [Google Scholar]
- Hardenbol, J.; Thierry, J.; Farley, M.B.; Jacquin, T.; De Graciansky, P.-C.; Vail, P.R. Mesozoic and Cenozoic Sequence Chronostratigraphic Framework of European Basins. In Mesozoic and Cenozoic Sequence Stratigraphy of European Basins; De Graciansky, P.C., Hardenbol, J., Jacquin, T., Vail, P.R., Eds.; SEPM Special Publication: Broken Arrow, OK, USA, 1998. [Google Scholar]
- Hesselbo, S.P.; Jenkyns, H.C.; Duarte, L.V.; Oliviera, L. Sequence stratigraphy at times of extraordinary sediment supply in the Jurassic—Formation of a pseudo-sequence boundary during the Early Toarcian Oceanic Anoxic Event? In Proceedings of the SealAix’06 Sea-Level Changes: Records, Processes and Modelling, Aix-en-Provence and Giens, France, 25–29 September 2006. [Google Scholar]
- Bessereau, G.; Huc, A.Y.; Carpentier, B. Distribution of organic matter in the Liassic series of the Paris basin: An example of organic heterogeneity in a source rock interval. In Generation, Accumulation and Production of Europe’s Hydrocarbons II; Spencer, A.M., Ed.; Springer: Berlin/Heidelberg, Germany, 1992; pp. 69–87. [Google Scholar]
- Delmas, J.; Houel, P.; Vially, R. Paris Basin Petroleum Potential. In Rapport Regional D’évaluation Pétrolière; Institut Français du Pétrole: Paris, France, 2002; p. 179. [Google Scholar]
- Hermoso, M.; Pellenard, P. Continental weathering and climatic changes inferred from clay mineralogy and paired carbon isotopes across the early to middle Toarcian in the Paris Basin. Palaeogeogr. Palaeoclimatol. Palaeoecol. 2014, 399, 385–393. [Google Scholar] [CrossRef]
- Ogg, J.G.; Hinnov, L.A. Jurassic. In The Geologic Time Scale; Gradstein, F.M., Ogg, J.G., Schmitz, M.D., Ogg, G., Eds.; Elsevier: Amsterdam, The Netherlands, 2012; pp. 731–791. [Google Scholar]
- Granjeon, D. Modelisation Stratigraphique Deterministe—Conception et Applications d’un Modele Diffusif 3D Multilithologique. Ph.D. Thesis, Geosciences Rennes, Université de Rennes 1, Rennes, France, 1996. [Google Scholar]
- Granjeon, D.; Joseph, P. Concepts and applications of a 3-D multiple lithology, diffusive model in stratigraphic modeling. In Numerical Experiments in Stratigraphy: Recent Advances in Stratigraphic and Sedimentologic Computer Simulations; Harbaugh, J.W., Watney, W.L., Rankey, E.C., Slingerland, R., Goldstein, R.H., Eds.; Geological Society Special Publication: London, UK, 1999; Volume 62, pp. 197–210. [Google Scholar]
- Granjeon, D.; Wolf, S. 3D stratigraphic modeling in complex tectonics area. AAPG Search and Discover Article #90063©2007 Am. In Proceedings of the AAPG Annual Convention and Exhibition: American Association of Petroleum Geologists, Long Beach, CA, USA, 2–4 April 2007. [Google Scholar]
- Falkowski, P.G.; Raven, J.A. Aquatic Photosynthesis, 2nd ed.; Blackwell Science: Malden, MA, USA, 2007; p. 488. [Google Scholar]
- Berger, W.H.; Smetacek, V.S.; Wefer, G. Productivity of the Ocean: Present and Past. In Dahlem Workshop Report; Berger, W.H., Smetacek, V.S., Wefer, G., Eds.; Wiley: Hoboken, NJ, USA, 1989; Volume 44, pp. 1–34. [Google Scholar]
- Pilson, M.E. An Introduction to the Chemistry of the Sea; Cambridge University Press: Cambridge, UK, 2012; pp. 287–294. [Google Scholar]
- Sathyendranath, S.; Platt, T. Primary Production Distribution. In Reference Module in Earth Systems and Environmental Sciences; Elsevier: Amsterdam, The Netherlands, 2003. [Google Scholar]
- Schieber, J.; Southard, J.; Thaisen, K. Accretion of Mudstone Beds from Migrating Floccule Ripples. Science 2007, 318, 1760–1763. [Google Scholar] [CrossRef] [PubMed]
- Garrett, C. Marginal mixing theories. Atmos. Ocean 1991, 29, 313–339. [Google Scholar] [CrossRef]
- Bastviken, D.; Persson, L.; Odham, G.; Tranvik, L. Degradation of dissolved organic matter in oxic and anoxic lake water. Limnol. Oceanogr. 2004, 49, 109–116. [Google Scholar] [CrossRef]
- Jenkyns, H.C. The geochemistry of Oceanic Anoxic Events. Geochem. Geophys. Geosyst. 2010, 11, 1–30. [Google Scholar] [CrossRef]
- Carpentier, B.; Huc, A.Y.; Bessereau, G. Wireline logging and source rocks—Estimation of organic carbon content by the Carbolog@ method. Log Anal. 1991, 32, 279–297. [Google Scholar]
- Falivene, O.; Frascati, A.; Gesbert, S.; Pickens, J.; Hsu, Y.; Rovira, A. Automatic calibration of stratigraphic forward models for predicting reservoir presence in exploration. AAPG Bull. 2014, 98, 1811–1835. [Google Scholar] [CrossRef]
- Burgess, P.M.; Lammers, H.; van Oosterhout, C.; Granjeon, D. Multivariate sequence stratigraphy: Tackling complexity and uncertainty with stratigraphic forward modeling, multiple scenarios, and conditional frequency maps. AAPG Bull. 2006, 90, 1883–1901. [Google Scholar] [CrossRef]
- Sobol, I. Sensitivity analysis for non-linear Mathematical models. Math. Model. Comput. Exp. 1993, 1, 407–414. [Google Scholar]
- Tyson, R.V. Variation in marine total organic carbon through the type Kimmeridge Clay Formation (Late Jurassic), Dorset, UK. J. Geol. Soc. 2004, 161, 667–673. [Google Scholar] [CrossRef]
- Inthorn, M.; Wagner, T.; Scheeder, G.; Zabel, M. Lateral transport controls distribution, quality, and burial of organic matter along continental slopes in high-productivity areas. Geology 2006, 34, 205–208. [Google Scholar] [CrossRef]
- Beaulieu, S.E. Resuspension of phytodetritus from sea floor: A laboratory flume study. Limnol. Oceanogr. 2003, 48, 1235–1244. [Google Scholar] [CrossRef]
- Burchette, T.P.; Wright, V.P. Carbonate ramp depositional systems. Sediment. Geol. 1992, 79, 3–57. [Google Scholar] [CrossRef]
- Espitalié, J.; Marquis, F.; Sage, F.; Barsony, I. Géochimie organique du Bassin de Paris. Revue de l’Institut Français du Pétrole 1987, 42, 271–302. (In French) [Google Scholar] [CrossRef]
© 2018 by the authors. Licensee MDPI, Basel, Switzerland. This article is an open access article distributed under the terms and conditions of the Creative Commons Attribution (CC BY) license (http://creativecommons.org/licenses/by/4.0/).


