Abstract
The Tavan Bogd mountains (of which, the main peak, Khuiten Uul, reaches 4374 m a.s.l.) are situated in the central part of the Altai mountain system, in the territories of Russia, Mongolia and China. The massif is the largest glacierized area of Altai. The purposes of this study were to provide a full description of the scale and structure of the modern glacierized area of the Tavan Bogd massif, to reconstruct the glaciers of the Little Ice Age (LIA), to estimate the extent of the glaciers in 1968, and to determine the main glacial trends, and their causes, from the peak of the LIA. This work was based on the results of long-term field studies and analysis of satellite and aerial data. At the peak of the LIA, Tavan Bogd glaciation comprised 243 glaciers with a total area of 353.4 km2. From interpretation of Corona images, by 1968 the number of glaciers had decreased to 236, with a total area of 242 km2. In 2010, there were 225 glaciers with a total area of 201 km2. Thus, since the peak of the LIA, the glacierized area of the Tavan Bogd mountains decreased by 43%, which is somewhat less than for neighboring glacial centers (i.e., Ikh-Turgen, Tsambagarav, Tsengel-Khairkhan and Mongun-Taiga mountains). The probable causes are higher altitude and the predominance of larger glaciers resistant to warming. Accordingly, the smallest decline in Tavan Bogd occurred in the basins of the Tsagan-Gol (31.7%) and Sangadyr (36.4%) rivers where the largest glaciers are located. In contrast, on the lower periphery of the massif, where small glaciers predominate, the relative reduction was large (74–79%). In terms of general retreat trends, large valley glaciers retreated faster in 1968–1977 and after 2010. During the 1990s, the retreat was slow. After 2010, glacial retreat was rapid. The retreat of glaciers in the last 50–60 years was caused by a trend decrease in precipitation until the mid-1970s, and a sharp warming in the 1990s and early 2000s.
1. Introduction
Glaciers are among the most important indicators of climate change [1], mainly of such characteristics as mean annual temperature, summer air temperature and precipitation. This role is especially important in regions with a sparse network of meteorological stations. At the same time, glaciers also act as an important climatic factor themselves, influencing the overall albedo of the Earth. Mountain glaciers, more vulnerable to climate change than ice sheets, are the main contributors of glacier melt water that causes rises in sea level [2]. Changes in mountain glaciers also have important implications for surface hydrology, most notably in terms of changes in runoff from glacier catchments [3], and changes in glacial lakes, which pose serious hazards in some regions [4,5,6]. In arid areas, melt water from mountain glaciers can be the main source of water [7,8,9,10]. Glacial dynamics plays an important role in exogenous processes. All these factors emphasize the importance of studying glaciers and their dynamics.
The longest series of observations of the dynamics of glaciers [11] covers the period from the last worldwide cooling and the culmination of glaciers known as the Little Ice Age (LIA) [12]. Internationally coordinated glacier monitoring began in 1894, when there was already a well-pronounced trend of glacial retreat [11]. As a result, there are few direct estimations of the positions of the glaciers at the peak of the LIA, and these relate mostly to the Alps [13]. However, it is usually possible to reconstruct the glacierized area of the LIA peak on a geomorphological basis [14]. After the LIA, glacial retreat, which began between 1800 and 1850, was uneven. For example, in the Alps end moraines were formed in 1890, 1920 and 1980, during short oscillations or episodes of glacier standstill [15,16]. Recent decades have seen a global acceleration of the glacial retreat. Glaciological and geodetic observations show that the rates of early 21st-century mass loss are globally unprecedented, at least for the time period observed [17].
Though the pattern of glacial dynamics after the LIA peak is relatively well-known in several humid areas (the Alps [16,18,19], Scandinavia [20,21,22], etc.), there is still less information available about arid intracontinental areas. Most of these data are based on remote sensing and paleo reconstructions [14,23,24,25,26,27]. In the Altai mountains, it was only in 1835 that glaciers were discovered by Gebler, who made the first descriptions of the position of the edges of the glaciers (i.e., Katun glacier, Belukha mountain) [28]. In 1897, systematic measurements of the change in the positions of glacial termini began, however very few glaciers were affected. The most studied is the Katun glacier: its last advance occurred somewhere between 1835 and 1880, but by 1880 it had already retreated from its position in 1835 by 350–380 m. From 1897 to 1937, the glacier retreated with an average speed of 15 m per year, with the highest rates of reduction occurring in 1935–1937 (20.7 m per year). In subsequent years, the periods of rapid shortening of the glacier’s length, with rates reaching 45 m per year, were separated by episodes of a slower retreat of the glacier in 1937–1952, 1961–1965, 1970–1972, 1986–1989, and 1993 [29]. In the North Chuya Range, halting of the retreat of glaciers took place in 1936, 1940, 1969, and 1993 (Right Aktru) and in 1911, 1936, 1960, 1966, 1979, and 1993 (Malyi Aktru) [30].
The glaciers of Tavan Bogd were first discovered in 1897 by V.V. Sapozhnikov [31]. In 1905, he discovered the largest glacier in the Altai-Sayan mountain region—the Potanin Glacier. From 1905 to 1909, he studied and mapped all the main glaciers of the massif. In 1916, B.V. Tronov and M.V. Tronov visited the Przewalski (Halasi) and Potanin glaciers before climbing to the summit of Khuiten Uul [32]. In the “Catalog of the Glaciers of Altai” published in 1925, Tavan Bogd was represented by 36 glaciers with a total area of 158 km2 [33]. The next glaciological research of Tavan Bogd took place in 1959, when Chinese glaciologists started the study of glaciers in the upper reaches of the river Halasi (Kanas). As a result, the glaciers of the Chinese portion of Tavan Bogd were included in the “Glacier Inventory of China” [34,35].
In 1964, the scientists of Tomsk University started glaciological studies of the northern slopes of Tavan Bogd. Their aim was to collect data for the “Catalog of Glaciers of the USSR” [36,37]. In 1984, the work was continued by carrying out geodetic surveys of the largest glaciers [38]. In 1971, Selivanov and Bjamba [39] used aerial imagery to estimate the area of the snow-firn fields of the Mongolian portion of Tavan Bogd at 94 km2 [39]. In 1987, several glaciers of Tavan Bogd, including two glaciers on the northern slope and the Potanin glacier, were studied by the Soviet-Mongolian glaciological expedition. Based on those results, the total area of the glaciers of Tavan Bogd in 1987 was estimated to be 222.3 km2, and a rough estimate of the LIA area of the glaciers (260 km2) was also made [40]. Since 1999, the glaciers of the north slope have been continuously studied by the scientists of Saint Petersburg State University, via field observations and remote sensing [41,42,43]. In 2000–2001, a group of scientists from the Altai State University made field observations of the glaciers of the northern slope and of the largest Mongolian glaciers of Tavan Bogd [44]. In 2001, Galakhov and R’edkin estimated the glacierized area of the Mongolian part of the massif to be about 134 km2 [45]. In 2005–2009, mass balance and geophysical studies of the Potanin glacier were undertaken by a Japanese-Mongolian group of scientists [46,47,48,49]. Since 2013, the scientists of Saint Petersburg State University have made field observations of the Potanin and Kozlov glaciers in Mongolia [50].
In recent years, significant progress has been made in the study of the glaciers of Tavan Bogd due to the use of remote methods [51,52]. Notably, this work includes compilation of the “Second Chinese Glacier Inventory” [53], in which the area of the glaciers in the Chinese portion of the massif was estimated to be 76 km2. The Global Land Ice Measurements from Space (GLIMS) database and the Randolph Glacier Inventory estimates the total area of the glaciers of the massif to be 204 km2 [54], and the area of the Mongolian glaciers to be 95.2 km2 [52] and 99 km2 [50], respectively.
However, information about present and past glaciers of Tavan Bogd is far from being complete. First, the data on modern glaciers are fragmentary, mainly due to research within the borders of individual states. Consequently, these data were obtained from different materials, by different methods, with varying accuracy, and refer to different years. At the same time, studies consisting of field observations are small. Second, there is almost no information about the glacial extent during the LIA. Third, the information about glacial recession is also fragmentary and refers mostly to the period after 1990.
Accordingly, the aims of this article are the following:
- To give a full description of the scale and structure of the modern glacierized area in Tavan Bogd.
- To reconstruct the glaciers of the Little Ice Age.
- To estimate the extent of the glaciers in 1968.
- To determine the main glacial trends, and their causes, since the peak of the LIA.
2. Study Region
The Tavan Bogd massif (Figure 1) has an area of about 2600 km2 and is situated in a remote intracontinental arid area. It is the largest glacial center of the Altai. The mountain ranges of the Southern Altai from the west, Saylugem from the north-east and the Mongolian Altai from the south converge at this point. The watershed ridge in the northern part of the massif separates Argut river basin from Irtysh river basin, which is located to the southwest, and from Kobdo river basin (internal drainage zone), located to the south-east. The northern area (in the territory of Russia) is weakly dissected and has a gentle slope; the foot of the massif here is at its highest (2000–2400 m, Ukok plateau). Five dome-shaped peaks, whose heights reach 4000 m (the highest point is Russkiy Shater, which translates as “Russian tent”, at 4134 m a.s.l.) are situated here. In contrast, the western and eastern slopes of the massif are strongly dissected and have a pronounced alpine type of relief. Deep troughs with hanging valleys of tributaries are framed by crests up to 4000 m and higher: Khuiten Uul (“Cold Mountain”), 4374 m a.s.l., the highest mountain in Mongolia; Burged (“Eagle”), 4310 m a.s.l.; Naran (“Sunny”), 4280 m a.s.l.; Olgii (“Motherland”), 4100 m a.s.l.; and Malchin (“Herdsman”) 4050 m a.s.l. These mountain peaks are elevated well above the current average firn line/equilibrium line altitude (ELA) (3285 m) and that persisting during the LIA (3235 m), which makes it possible for glaciers to exist.
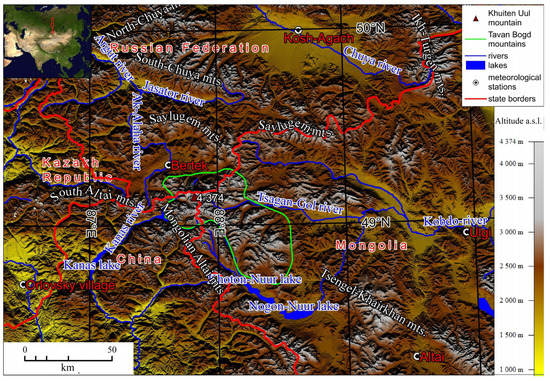
Figure 1.
Geographical location of the Tavan Bogd mountain range.
The climate of the massif is determined by the Asian anticyclone in the winter. In the summer, when most of the annual precipitation falls, the cyclones that develop on the polar front prevail [55]; south-western cyclones (from the Aral, Caspian and, to a lesser extent, Black Seas) are frequent, which strongly influences the formation of precipitation. The western part of the massif that is not shielded from western streams is open from the west (through the valley of the Bukhtarma River) and especially from the southwest (through the valley of the Kanas River). Climatic conditions are best known for the northern slope. The closest (only 10 km from the glaciers) Bertek meteorological station (altitude 2200 m a.s.l.) functioned between 1959 and 1982. According to its data, the climate at the foot of the massif is cold (average summer temperature 8.2 °C, average annual temperature −8.3 °C). Precipitation is low (average annual precipitation 200.6 mm) with a pronounced summer maximum (59% of the annual total precipitation) and an almost snowless winter (5% of the total). In the glaciated zone, annual precipitation is significantly higher; for example, on the firn line altitude it increases from about 365 mm to 880 mm from the east to the west along the slope [56].
Climatic conditions of the western and south-western slopes are less known. The closest meteorological stations are situated in Kazakhstan—Orlovskiy village (1106 m a.s.l.)—and Katon-Karagai (1081 m a.s.l.), about 90 km to the south-west and 140 km to the west of the nearest glaciers of Tavan Bogd, respectively. In China, the nearest weather stations are Habane (534 m a.s.l.) and Altai (736.9 m a.s.l.) about 140 and 120 km, respectively, to the south-west of the glaciers. Precipitation is higher than on the northern slope (354 mm per year in Orlovskiy village and 457 mm per year in Katon-Karagai) with a less pronounced summer maximum (41–42% of the annual precipitation) and winter minimum (18–12%). According to the snow pit data from the Kanas glacier (south-western slope), the annual precipitation at the ELA is 700–800 mm water equivalent [34,35,57].
Glaciers of the north-eastern slope of Tavan Bogd are located about 100 km from the nearest meteorological stations: Ulgi (1716 m a.s.l.) in the east and Altai (2182 m a.s.l.) in the south-east. Climatic conditions are significantly drier; for example, in Ulgi the average annual precipitation is only 128.5 mm, with 67% of this amount coming in the summer months and only 2% in the winter months. Climatic conditions in the glaciated zone have been estimated by in situ measurements made by automatic station at an altitude of 3040 m a.s.l. In 2007, summer season precipitation was 191.6 mm, which is significantly higher than at Ulgi (54.2 mm for the same period) [46]. With such a pluviometric gradient (10 mm/100 m) used for the annual precipitation, its value at the ELA can be estimated to be about 300 mm. Other estimations, based on the results of modeling without direct observations give higher values: 785 mm [50], 790 mm [58] and even 1000 mm [59].
3. Materials and Methods
This article is mostly based on the results of studies that include three groups of methods.
3.1. Continuous Monitoring Observations of the Glaciers
In the late 1980s, the geographers of Saint Petersburg State University (our research group) established the monitoring of the glaciers of Altai mountains in a regime of part-time observation stations (hydrological, glaciological, meteorological, geomorphological, and dendrochronological in situ observations were made in the ablation periods).
Since 1999, such field studies have been undertaken for the Tavan Bogd massif. Expeditions took place in 1999, 2000, 2001, 2002, 2003, 2004, 2006, 2009, 2011, 2013, 2014, 2015, and 2018, mostly to the northern (Russian) part of the massif. Glaciological observations included monitoring of the positions of the glacial edges, locating the ELA, mass balance observations and mass balance index calculations. Monitoring of the positions of the glacial edges is based on survey activities, such as geodetic surveying, GPS tracking of the glacial edges, measurements of the changes of the glacial length (repeated measurements of the distance between the benchmarks and the glacial edges), the usage of repeated photographs, and remote sensing. The results of this monitoring provides the opportunity to estimate the rates of advance and retreat of the glaciers.
The monitoring of the positions of the glacial edges was done for different types of glaciers, but preference was given to the larger valley glaciers that are the most representative glaciers (due to less dependence on geomorphic factors) with the longest observation periods (being at the same time easier to reach due to the lower positions of the snouts). The largest valley glaciers, Argamgi-3 and Argamgi-2, have the longest in situ range of observations, which starts in 1984. There are also nine glaciers (two cirque, one cirque-valley, and six slope glaciers) where continuous instrumental observations started in 2000–2001.
3.2. Remote Sensing
Remote sensing study was based on the analysis of space imagery with spatial resolution ranging from 0.5 to 80 m per pixel, collected for the period 1968–2013, and of aerial photos of 1962 (Table 1). Most of the images were provided by RDC ScanEx [60] and processed by the Space and Geoinformation Technologies Resource Center of Saint Petersburg State University. Several images were also provided by the USGS [61].

Table 1.
Satellite and aerial imagery used in the study of Tavan Bogd glaciers.
The choice of time points for the inventory of the glaciers was, in many respects, due to the availability of the required high-resolution satellite images (Table 1). In addition to high resolution, images had several more requirements: images should correspond to the end of the ablation season, when the height of the snow line is maximal, and the snow cover does not interfere with delineation of the boundaries of glaciers; it is desirable that images not include clouds; and, images should not be taken after snowfalls. High resolution SPOT-5 and Geoeye-1 images taken in 2010 covered over 90% of the glaciated area of Tavan Bogd, excluding the far eastern periphery. Consequently, 2010 was chosen as a suitable year for establishing the recent glacierized area of Tavan Bogd. For the eastern periphery of Tavan Bogd, Landsat-5 imagery was used. Reconstruction of the glacierized area in 1968 was based on Corona satellite images.
Other satellite and aerial imagery (2013, 2008, 2007, 2006, 1989, 1977, 1962) was used to get additional information for several of the largest glaciers.
Every scene was radiometrically normalized and geographically referenced using orbital parameters. The automatic and systematic geometric correction of raster data was applied, based on a mathematical model of the view angles of the satellite camera and its position at the moment of the image collection (i.e., a rigorous model). UTM/WGS 84 projection (zone 46) was identified as the reference frame for georeferencing. The imagery has been orthorectified using 30 m SRTM 1 Arc-Second Global (DEM) downloaded from the USGS EROS Data Center [62] and treated with a moderate-sharpening filter for graphic quality preservation.
All aerial photographs were also geographically referenced using ground control points (GCP) and transformed into the international coordinate system (UTM/WGS 84, zone 46).
Processing of space imagery and aerial photographs was carried out using photogrammetric software.
The mapping of glaciers was done manually; the minimum size of glaciers to be mapped was 0.01 km2. To determine the accuracy of the manual representation of the boundaries of the glaciers, repeated contouring of several glaciers with an area of more than 0.1 km2 was done. As a result, it was revealed that the error in determining the area of individual glaciers was less than 5%. The error in determining the area of a large sample of glaciers (more than 100) is reduced to <3% by compensating for positive and negative errors. SRTM 30 m DEM was used to outline the ice divides in areas with continuous glacial cover.
In the areas where no field observations were held, the boundary line between the glacier and the dead ice was found using indicators defined by Loibl et al. [25]: active ice indicators are “smooth” debris surface, linear flow structures, and constrained tributaries; dead ice indicators are rugged debris surface, melting ponds, unconstrained tributaries, and pioneer plants. We should also add another typical feature of dead ice, namely, the water flow into tunnels and its exit from other tunnels down the slope. All these indicators work well, with the exception of pioneer plants, which, due to the dry climate, are absent near the glaciers and appear only on the surface of inactive rock glaciers. In our area of research, this is typical when the active glacial edge is marked by marginal flows that join at the lowest point of the glacier.
Other typical problems are overestimation of the glacial area after snowfalls or when the seasonal snow cover has not melted, and the shading of some parts of the glacier and the adjacent non-glacial areas. The means of solving these problems are to use images made at the end of the ablation season and with the least snow, and to compare the images of the same area with different acquisition times and different angles of sunlight.
We used a 30 m SRTM 1 Arc-Second Global DEM [62] to characterize our glacier outlines with parameters including mean, minimum, and maximum elevation ranges, and mean slope and aspect.
The present firn line altitude in the area of research is generally equivalent to the ELA (the difference is usually within 10 m). The firn line altitude was found by combination of direct observations and analysis of satellite imagery. We used images with acquisition dates at the end of the ablation seasons.
On some small glaciers, the firn line was not distinguished, and the Kurowsky method [63,64] was used. In this method the firn line altitude or ELA is calculated as the average altitude of the glacier: , where is the firn line altitude or ELA, are the areas of the different altitudinal zones of the glacier, are the average altitudes of these zones, and . The calculations were based on the measurements from topographic maps (1:100,000 and 1:50,000 scales) and SRTM DEM. The Kurowsky method was also used to verify the values of ELA, found by remote sensing.
3.3. Paleo Reconstructions
Reconstruction of the LIA extent of glaciers was done based on geomorphological methods. LIA moraines were mapped using space imagery, aerial photos, tachometry, GPS tracking of the lateral and terminal moraines, and visual in situ observations. We used the method of ground-based route interpretation that included descriptions, measurements and photography in reference areas. The measurements in the mountain massif were all made by using GPS. For object recognition, we used the visual interpretation method according to reference standards [65,66]. The reference standards were compiled from ground-based observations, indicating the following characteristics: characteristic images of objects on the terrain, on the aerial photograph, on the satellite image and on the topographic map; distinctive characteristics of objects; and, methods of transferring objects to the map. The criteria which we used to identify moraines using the satellite imagery and DEM are largely similar to those suggested in [67]: “identification criteria include shadowing due to changes in topography (relative relief) and changes in color due to changes in soil, soil moisture, and vegetation cover. Associated landforms such as deflected abandoned meltwater channels are also useful in delineating the break-of-slope of these features.” Furthermore, we used high-resolution images and compared interpretation results with in situ field observations. Recently, the same study has been undertaken for the Mongun-Taiga mountain massif (Russian Altai). Because the area has some similar features relating to present and past glaciers and its climatic conditions [68], this experience was also useful.
A characteristic property of the study area favorable for visual interpretation includes the persistence of glacial topographic features associated with climate aridity, low erosion rates, low rates of biological processes, and poor development of land cover. Low temperatures, high intensity of frost weathering and small precipitation amounts promote a long-lasting preservation of buried glacier ice. All of this causes sharpness of most glacial landforms on aerial photographs and satellite images whose interpretation is made easier by an almost total absence of forest vegetation.
Diagnostic features of LIA moraines are their bareness, steep fronts and relatively large thickness, glacial ice cores that are sometimes exposed by thermokarst processes, and position adjacent to modern glaciers. The low turfness of LIA moraines (Figure 2) in multispectral images is expressed by a grey or brown color of moraines, in sharp contrast with greenish color of the surrounding subalpine meadows and tundra, so they are easily identified. This is particularly characteristic for the LIA moraines which, usually, partly or fully overlap the more ancient moraines of the historical stage. The third characteristic feature is the presence of the ice core of glacial origin. Starting in the late 1990s, an intensification of thermokarst processes on the LIA moraines has given rise to numerous thermokarst depressions, thermoerosional forms and landslides [6], which stand out in steep areas of dumped moraines in the form of sharp and contrasting dark bands visible in images with a resolution better than 15 m.
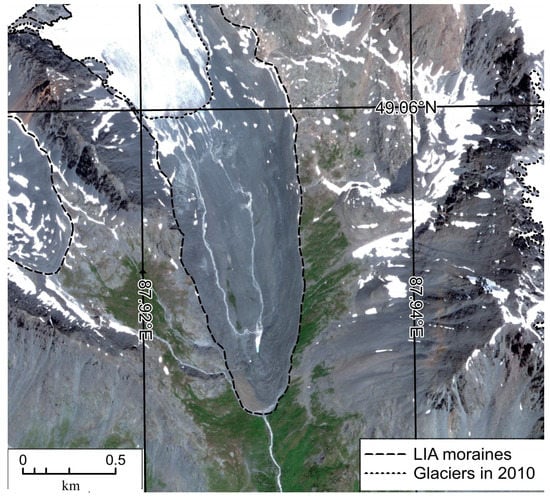
Figure 2.
Delineation of the Little Ice Age (LIA) moraine, Postigiyn-Gol basin, using a Geoeye-1 image.
The end of the LIA maximum and the start of the general retreat of the glaciers was referred to 1810–1820, basing on our studies in the neighboring areas of the Russian Altai [27].
4. Results
4.1. Recent Glacierized Area
According to our studies, in 2010 there were 225 glaciers with a total area of about 201 km2 (Table 2, Figure 3). The lowest point of elevation was 2496 m, and the highest was 4374 m (Khuiten Uul peak). The weighted average ELA was 3285 m.
Table 2.
Glacier inventory of Tavan Bogd for 2010.
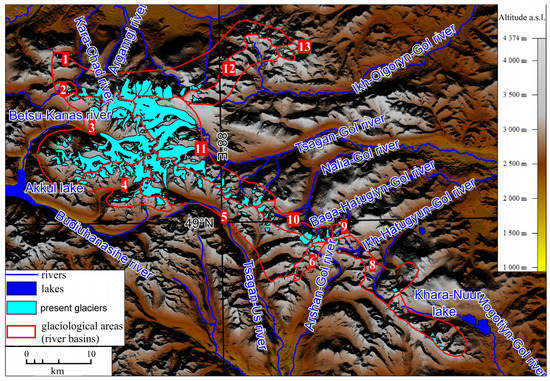
Figure 3.
Glacial areas (river basins) of Tavan Bogd. 1—Kalguty, 2—Ak-Alaha, 3—Sangadyr, 4—Budiuhanasıhe, 5—Postgiyn-Gol, 6—Arshan-Gol, 7—Mogotiyn-Gol, 8—Ikh-Hatugiyn-Gol, 9—Baga-Hatugiyn, 10—Nalia-Gol, 11—Tsagan-Gol, 12—Ikh-Oigoryn-Gol, 13—Shepk-Oygoryn-Gol.
The distribution of the number of glaciers between the different area intervals has a clearly pronounced maximum in the range of less than 0.1 km2, and a secondary maximum in the range of 1.0–5.0 km2 (Figure 4). For the area, the contribution of the largest glaciers (more than 10 km2) and glaciers in the 1–5 km2 area range is the most important. Obviously, it can be said that the largest compound valley glaciers (i.e., Potanin, Kanas) play the main role in the glacial structure of the massif, as well as the more numerous small (mainly simple) valley glaciers.
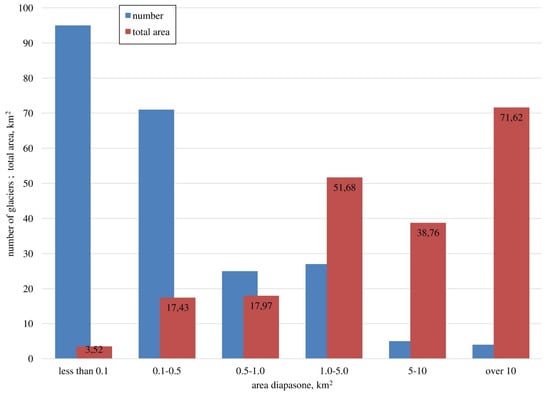
Figure 4.
Distribution of the quantity and total area of glaciers in different intervals of areas.
The quantitative predominance of small glaciers and the area dominance of the largest glaciers is reflected in the morphological distribution of glaciers (Figure 5 and Figure 6). The most common in the Tavan Bogd area are small hanging and cirque glaciers. At the same time, almost three-quarters of the total area of glaciation falls on valley glaciers, which enables the characterization of Tavan Bogd as a glacial center of the valley type. Comparison with the relative area of the valley glaciers of the nearest glacial centers (Ikh-Turgen ~50% [69], Mongun-Taiga ~50% [70], Turgeni-Nuru ~55% [71], Kharkhiraa 58% [71]) reveals the high grade of this type of glacier for Tavan Bogd. Attention is drawn to the small number and area proportion of flat summit glaciers (1–2%), which is not typical for the Mongolian Altai and the southeast of the Russian Altai; for example in the total area of Tsambagarav ridge, flat summit glaciers comprise about 40% [72].
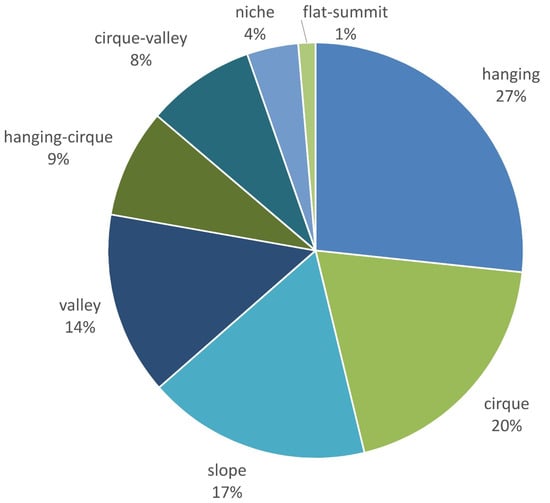
Figure 5.
Distribution of the number of glaciers in 2010 by morphological types.
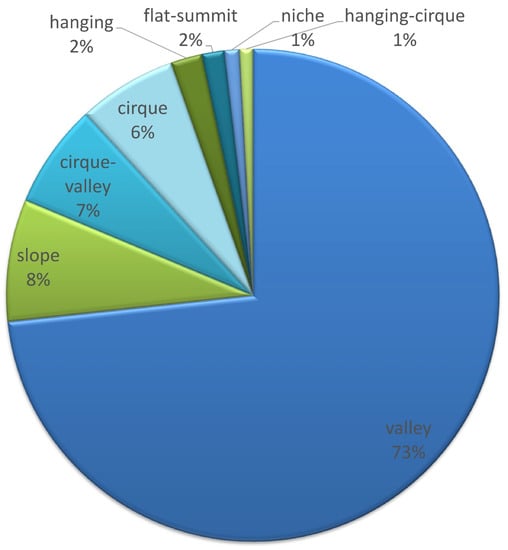
Figure 6.
Distribution of glacial area in 2010 by morphological types.
It should be noted that in different parts of the massif, the relationship between the morphological types of glaciers is also different. Valley glaciers are most developed in the highest, central part, and slope glaciers predominate on the northern weakly dissected slopes, while small cirque glaciers dominate the lower eastern and southeastern periphery.
The aspect distribution of the number of glaciers (Figure 7) is quite typical for the study region: glaciers on the northeastern and northern slopes prevail. This position of the glaciers is most favorable due both to reduced insolation on shaded slopes, and because of the accumulation of snow that is swept to the leeward slopes by the prevailing south-western winds.
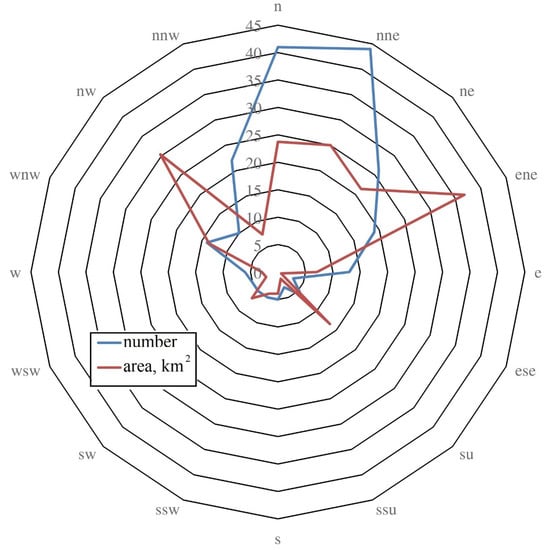
Figure 7.
The aspect distribution of the number and area of glaciers in 2010.
Nevertheless, the aspect distribution of glacial area (Figure 7) is more complex, with several peaks in the north-western, north-north-eastern, east-north-eastern (main) and southeastern (the least pronounced). Such a distribution, obviously, is determined by the complex geomorphological configuration of Tavan Bogd mountain massif, with varying lengths and heights of the slopes of different orientations.
Consideration of the specific glacial features of different river basins makes it possible to establish more precisely the features of the aspect distribution of the glaciers of the Tavan-Bogd massif (Table 3). The total areas of the glaciers of the Tsagan-Gol (east-north-east exposure) and Sangadyr (west-north-western) basins are approximately equal. Nevertheless, the average area of glaciers in the basin of Tsagan-Gol is about twice as large, i.e., the glaciers themselves are larger here. On the contrary, the ELA in the basin of the Sangadyr river is about 150 m lower, which indicates a more abundant nourishment of glaciers. Obviously, the windward slopes of the massif receive significantly more precipitation than the leeward slopes, and the transfer of snow to the leeward slopes is not enough to equalize differences in glacial accumulation. The geomorphological structure of the glacial basin is the factor which equates the conditions for the existence of glaciers on the windward and leeward slopes. From the point of view of the extent of the mountain ridges, the basins of the Tsagan-Gol and Sangadyr rivers are in an equal position, as evidenced by approximately equal values of glacial intensity (average glacial area per 1 km of mountain ridge). However, the area of the firn basin for Tsagan-Gol is much higher. To prove this fact, let us consider the areas above the climatic snow boundary (the height from which, in horizontal areas, accumulation on average exceeds the ablation for an average year). The best approximation to this theoretical indicator is the position of the ELA on flat-topped glaciers, the surface slopes of which are minimal. Based on the ELA on the flat-topped glaciers of Tavan Bogd, this height can be drawn approximately at the level of 3500 m. As can be seen from Table 3, for the Tsagan-Gol basin, the area of territory with a height of more than 3500 m is almost twice that of the Sangadyr river basin.
Table 3.
Glacio-geomorphologic features of different river basins of Tavan-Bogd.
4.2. LIA Reconstruction
According to our reconstruction, at the peak of the LIA there were 243 glaciers in Tavan Bogd, and the total glacierized area was 353.4 km2, which is about 1.8 times the current area. The estimated average glacier-weighted ELA was 3235 m, which is about 50 m lower than at present. The glaciers reached 2240 m at their lowest (in the western part of the massif), which is about 160 m lower than in 2010, and the average height of the glacial snouts was 3025 m, which is about 110 m higher than in 2010.
The distribution of glaciers in size at the peak of the LIA, despite the much larger average size (1.45 km2 compared to 0.89 km2 in 2010) had a character similar to that of the modern distribution (Figure 8). Quantitatively, small glaciers predominated, although the maximum of their occurrence was shifted to a range of 0.1–0.5, i.e., there was a much smaller proportion of glaciers on the verge of extinction. In terms of area, as in 2010, there were two maxima in the area intervals from 1–5 km and >10 km, although the dominance of the largest glaciers was more pronounced.
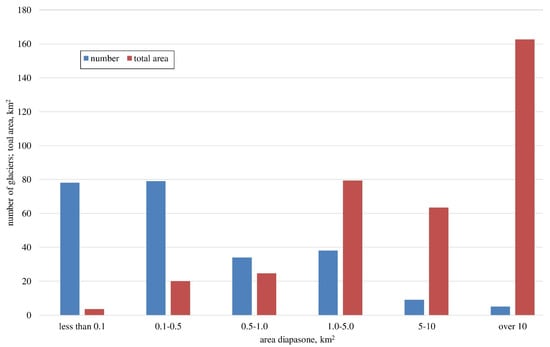
Figure 8.
Distribution of the quantity and total area of glaciers at the peak of the LIA in different intervals of areas.
The largest glacier of Tavan Bogd during this period was the Kanas glacier (66.85 km2), considerably exceeding the area of the Potanin glacier (47.2 km2), while the picture is now reversed (in 2010, the Potanin-Alexandra glacier has an area of 36.84 km2 and the Kanas glacier an area of 24.49 km2). This fact, nevertheless, does not indicate the predominance of glaciers on the western slopes of the massif but is caused by the centripetal configuration of the valley of the Sangadyr river, due to which the main glacial stream merged with glaciers of the tributary valleys.
The assumption that the glaciers of the western slopes of the massif at the LIA peak were not dominant is confirmed by the aspect distribution of the number and areas of glaciers (Figure 9). As at present, at this time the greatest number of glaciers was located on the northeastern and northern slopes, and the maximal glacierized area was situated on the northeastern, southeastern and western slopes.
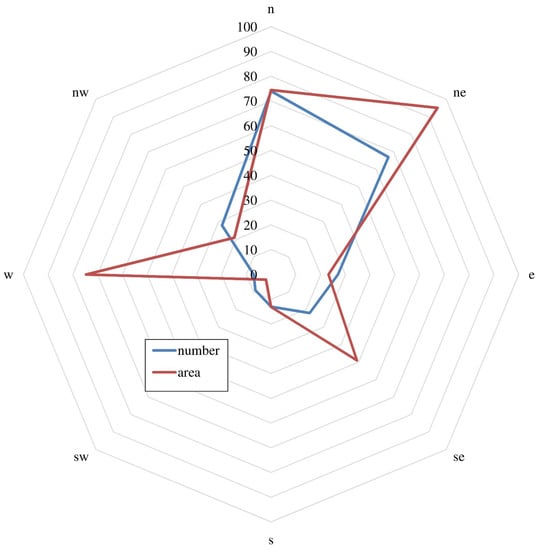
Figure 9.
The aspect distribution of the number and area of glaciers at the peak of the LIA.
The morphology of the glaciers in the LIA maximum did not differ much from the current morphology. Valley and flat top glaciers constituted a somewhat larger proportion of the total quantity and total area of the glaciers (5% difference for the valley glaciers, for both quantity and area), which reflects the greater development of large glacial forms (Figure 10 and Figure 11). After the LIA, some valley glaciers divided into smaller glaciers of other morphological types or simply transformed into cirque-valley glaciers.
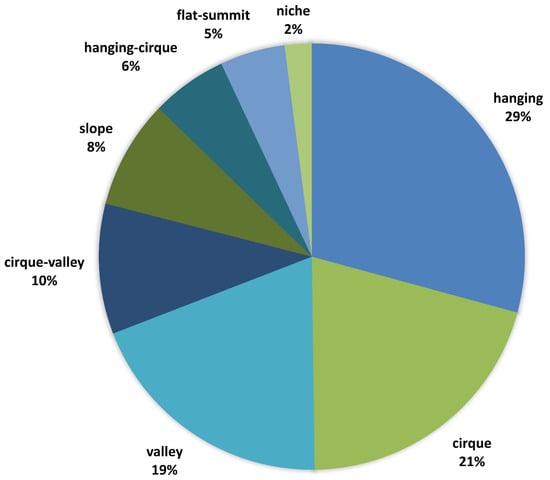
Figure 10.
Distribution of the number of glaciers at the peak of the LIA by morphological types.
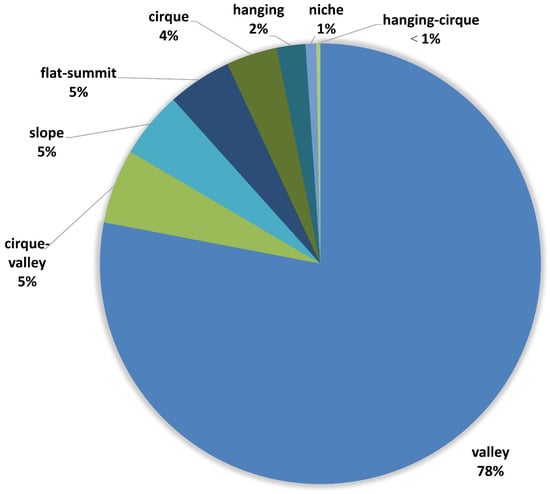
Figure 11.
Distribution of glacial areas in the LIA by morphological types.
4.3. Glacial Recession after the LIA Maximum
After the LIA peak, the general tendency of glacial retreat resulted in 152.42 km2 loss of area, or about 43.1% of the total, by 2010 (Table 4). Glacial shrinkage was uneven: during the period of 1820–1968, the total area of glaciers decreased at a rate of 0.74 km2/year, but in 1968–2010, the retreat sped up to 1.02 km2/year. This tendency is seen for all the river basins of Tavan Bogd.
Table 4.
Glacial shrinkage in different river basins after the LIA peak.
In the north-eastern periphery of Tavan Bogd, large glaciers were absent even at the time of the LIA peak (Figure 12). Glacial recession here was mostly expressed by the disappearance of small hanging and cirque glaciers (31 after the LIA peak). If the rates of glacial retreat that took place in 1968–2010 continue into the future, the glaciers here will disappear completely by 2060.
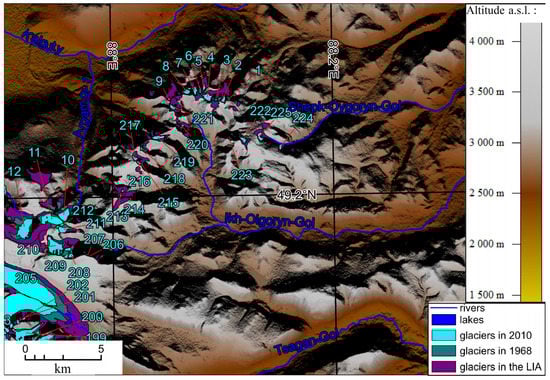
Figure 12.
Glacial shrinkage after the LIA peak in the north-east of Tavan Bogd.
However, in the higher part of Tavan Bogd (Figure 13), in the upper reaches of Agramgi-2 and Argamgi-3, the disappearance of the glaciers was not typical due to larger glaciers. Degradation of the glaciers here mostly happened in the form of retreat of the snouts of valley glaciers (Figure 13, No. 20, 23) or complete disappearance of the snouts, resulting in disintegration of the valley glaciers or their transformation to other morphological types (Figure 13, No. 12, 14–16).
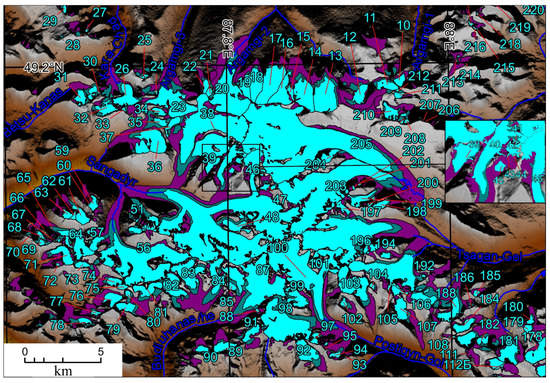
Figure 13.
Glacial shrinkage after the LIA maximum in the central part of Tavan Bogd.
According to the information obtained for the two largest glaciers of the northern slope of Tavan Bogd (Table 5), they behaved synchronously. The periods of rapid retreat happened around 1968 and after 2009, while slow retreat took place in the 1990s. The recent fast degradation of the glaciers has been attributed to a delayed response to the period of rapid increase of temperature in the 1990s [73].
Table 5.
Recession of the glaciers of the north slope of Tavan Bogd.
On the western slope of Tavan Bogd, disappearance of a group of small cirque glaciers on the watershed of Sangadyr and Budiuhanasıhe rivers and the disintegration of a dendrite valley glacial system of Kanas were the main features of the glacial recession.
At the peak of the LIA, Kanas (Halasi, Przewalski) glacier was the largest (66.85 km2) and the second longest (12.9 km) glacier of Tavan Bogd, its terminus reaching 2240 m a.s.l. By 2010, the main glacier lost four large tributaries, the total area of Kanas glacial system decreased to 47.5 km2 (a decline of 29%), the glacial terminus was 3.1 km shorter, and its lowest point was 250 m higher. The pattern of retreat of Kanas glacial terminus (Table 6) is like the one revealed for the glaciers of the northern slope: rapid retreat in 1968–1989, slower retreat in the 1990s, and an abrupt acceleration after 2006, accelerating to extremely high rates in 2010–2018. Also, a longer range of observations gave the opportunity to reveal a generally slow retreat in 1820–1909, fast retreat in 1909–1916, and a slowdown in 1959–1968. In recent years, rapid glacial retreat is a sign of the further disintegration of the Kanas glacier and the loss of further tributaries, primarily the lower south-western ones.
Table 6.
Rates of retreat of Kanas (Halasi, Przewalski, No. 46, Figure 13) glacier.
On the eastern slope of Tavan Bogd (Figure 13), the complete disappearance of glaciers during the period under review was not a characteristic phenomenon, which is due to the predominance of large glaciers here. In addition, the prevalence of valleys parallel to each other, characteristic of the upper reaches of the Tsagan-Gol river, did not contribute to the detachment of tributaries from large glaciers, in contrast to the upper reaches of the Sangadyr river. The reduction of the Potanin-Alexandra glacier system, which is the largest on the eastern slope, corresponds to the regularities revealed by us for the glaciers of the northern and western slopes.
At the LIA peak, the Potanin-Alexandra glacier reached an area of 47.42 km2 and was the longest glacier of Tavan Bogd (about 13 km), with a lowest point at a height of about 2783 m a.s.l. By 2010, the glacier lost about 22% of its area, was about 3 km shorter, and its lowest point had moved 110 m higher. This is similar to the characteristics of the retreat of the Kanas glacier, although the Potanin and Alexandra glaciers have not yet completely separated from each other, forming a compound valley glacier. Though Potanin and Alexandra glaciers were not completely synchronous in their dynamics, generally several periods can be revealed: faster retreat around 1968, slower retreat in the 1990s, followed by acceleration of retreat, reaching extremely high rates in the last 8 years (Table 7).
Table 7.
Rates of retreat of Alexandra (No. 203) and Potanin (No. 205) glaciers.
In the southeastern periphery of the massif (Figure 14), the glaciers from the LIA peak have lost from 53 to 79% of their area. Disintegration of valley and cirque-valley glaciers has led to the present-day dominance of small hanging and cirque glaciers in this part of Tavan Bogd.
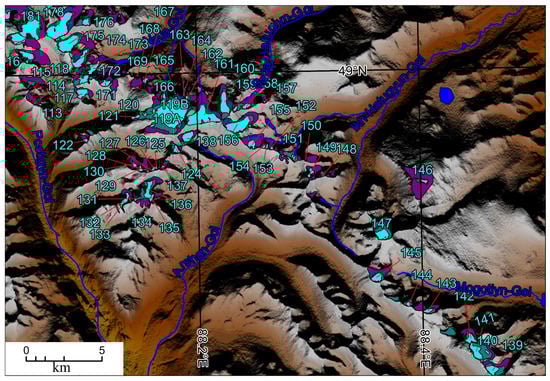
Figure 14.
Glacial shrinkage after the LIA maximum in the south-east of Tavan Bogd.
The most remote low-lying part of the southeastern periphery of the massif (the Mogotiyn-Gol river basin, Figure 14) at the peak of the LIA had a poorly developed glaciation of the cirque- and cirque-valley type. To date, only small cirque glaciers have survived here, and their complete disappearance, if the same retreat rates are maintained, is a matter of one or two decades.
Summarizing the reconstruction of the dynamics of glaciers from the peak of the LIA, we shall single out its main features.
1. There is a clear general tendency to glacial reduction, which is evident everywhere in Tavan Bogd, and since 1968 the rate of glacial reduction has increased.
2. The aspect of the slopes had little effect on the degree of glacier shrinkage. At the same time, there is a clear negative correlation between the size of the glaciers and the rate of degradation, evidenced by the glaciers of the relatively low-altitude periphery of Tavan Bogd, which have decreased to the greatest extent. This is clearly seen in the example of the relationship between the average area of glaciers in river basins in the Tavan Bogd area in the LIA and the proportional reduction of their area (Figure 15).
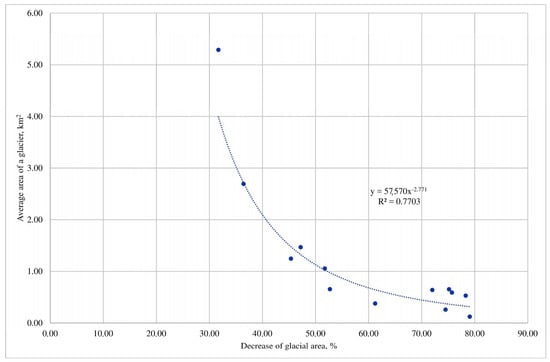
Figure 15.
Relationship between the average area of the glaciers in different river basins of Tavan Bogd at the LIA peak and glacial reduction (%) between the LIA peak and 2010.
3. Large valley glaciers retreated unevenly, with a certain synchronicity of their behavior noted. Fast retreat took place in 1968–1977 and after 2010; during this second period, degradation of the glaciers was especially fast, reaching extreme values. In the 1990s, the retreat was slow. To understand the reasons for this behavior, it is necessary to consider the climatic data series for the relevant period. Unfortunately, the data of meteorological stations are available in free access only for the territory of China and the Russian Federation, and obtaining information for the territories of Kazakhstan and Mongolia is difficult. In Figure 16, data on the change in summer temperatures for three weather stations are presented. They characterize climatic conditions of the northern (Bertek), western (Altai, China) and eastern (Altai, Mongolia) slopes. Data on the Bertek weather station (closed in 1982) were extended based on data from the Kosh-Agach weather station, which were highly correlated with the Bertek data. The temperature changes are quite synchronous, although the general warming trend is less pronounced for the Altai (China) weather station. Relatively warm conditions in the 1960s–1970s, a cold period in 1981–1995, and very warm conditions after 1995 were distinguished. Proceeding from this, it is possible to assume the time of glacier response to changes in summer temperatures is in the range of 9–15 years. This assumption is supported by the mass balance calculations that have been done for the glaciers Argamgi-2 and Argamgi-3 [73].
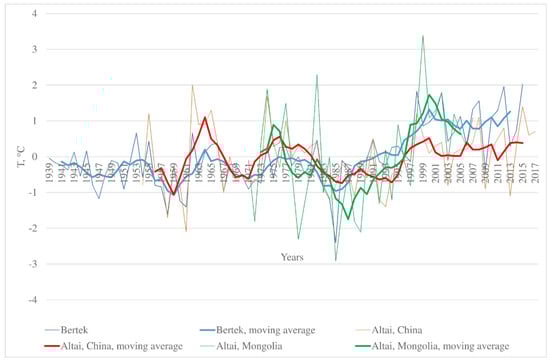
Figure 16.
Changes of average summer temperature (relative to multiyear average) for three meteorologic stations of Altai and 5-year moving average curves.
The second important climatic characteristic relevant to glaciers is the annual amount of precipitation. The series of data on meteorological stations Katon-Karagai (northern slope), Altai (China) and Altai (Mongolia) were considered (Figure 17). The change in the amount of precipitation on the northern and western slopes, according to meteorological stations, has an undeniable similarity: a trend of reduction of precipitation values until the mid-1970s and a subsequent gradual increase in precipitation. This correlates well with the acceleration of the retreat of glaciers in 1968–1977 and its slowdown in the 1990s. Afterwards, the sharp warming since the mid-1990s was more significant in its effect than a small increase in the amount of precipitation. That warming caused a rapid retreat of glaciers after 2010. Unfortunately, the data duration for the meteorological station Altai (Mongolia) is not long enough to assess trends in precipitation change until the mid-1970s, and there is no clearly defined trend in the subsequent period. But it is quite possible that the general trend of decrease of precipitation that was pronounced for the western and northern slopes of the massif played the main role in the general trend of glacial retreat in that period because there was no warming trend until the 1990s.
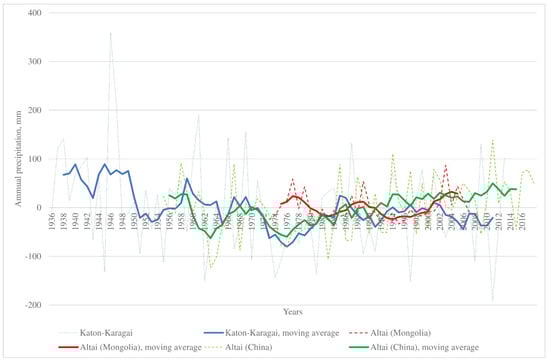
Figure 17.
Changes of annual precipitation (relative to multiyear average) for three meteorological stations of Altai and 5-year moving average curves.
5. Discussion
5.1. Recent Glacier Extent of Tavan Bogd and Comparison between Different Estimations and Inventories
According to our results, in 2010, 225 glaciers of Tavan Bogd covered the total area 200.98 km2. The average weighted ELA was 3285 m a.s.l. The area of glaciers in the territory of the Russian Federation was 25.28 km2, 75.39 km2 of glacial area was situated in the Chinese territory, and 100.31 km2 in the Mongolian part of Tavan Bogd. This study presents the first detailed analysis of the current structure of the entire glacial center of the Tavan Bogd massif.
It should be noted that no special survey or article devoted to the results for Tavan Bogd has yet appeared for the data that were obtained within the framework of the RGI 5.0/GLIMS database for the northern slope [74,75] and the “Second Glacier Inventory of China” [76,77] for the western slope.
Differences in the estimates of glacial areas obtained by us and other researchers (Table 8) are due to several reasons, as follows.
Table 8.
Estimation of glacierized area of Tavan Bogd by different authors.
1. Difference of source materials. Various authors used topographic maps, aerial photographs, and space images, and in some cases these materials were used in combination with the results of route observations. The least reliable sources are topographic maps, which are usually not detailed enough to accurately determine the boundaries of glaciers. In addition, maps of this territory were compiled as of 1960–1970 using aerial photographs. Aerial photographs distort the shape of glaciers, which sometimes leads to significant errors. Many of the estimates of the recent glacierized area are obtained from old materials that do not correspond to the present state of the glaciers.
2. Different techniques used. For example, the authors of [50] mapped only the open parts of the glaciers, without the moraine cover. Also, different lower limits of the glacier delineation area were used, from 0.01 to 0.1 km2.
3. Uncertainty in the definition of the lower boundary of the glacier, especially in areas of glacier coverage by moraine material. This problem is exacerbated when working with Landsat 2, 4, 5 images, which have relatively low resolution. The problem can be resolved if further interpretation of other images with close acquisition dates is made, as well as in the years before and after the acquisition date. When considering the maximum number of images and creating long time series, the errors of individual years are compensated and reduced to a minimum. In addition, ground-based observations are a good way to correct the results. In the case of our work, the position of the boundaries of the glaciers of the northern slope of Tavan Bogd over the past 19 years has been adjusted in this way.
4. Difference between perennial snowfields and small glaciers (diagnostic signs of glaciers, such as crevasses and presence of zones of accumulation and ablation) is not always clearly seen in satellite images, and the same objects can be treated differently by one or the other class of objects. A relatively high area of the glaciers given in the RGI 5.0/GLIMS database [74,75] for the Russian portion of the massif is a good example of overestimation of glacial area due to misinterpretation of perennial snow patches. In our previous article [73] we gave an example of differences between our results of delineation of the glaciers of the northern slope of Tavan Bogd and the results from the RGI 5.0/GLIMS database [74,75].
5. Differences in the delineation of ice divides in the areas of development of continuous ice cover at the borders of different river basins. In solving this problem, the use of digital elevation models, which display the relief significantly more accurately than topographic maps, is helpful.
However, in some cases our results are quite close to those obtained by other authors [52,54]. Generally, these cases are when the researchers used satellite images of higher quality with acquisition dates closer to the ones that we used. Nevertheless, in some cases the difference for particular glaciers was quite large, but the positive and the negative errors compensated each other and thus were not seen in the total sum. In this article we will consider, as an example, the contours of glaciers according to the “Second Glacier Inventory of China” (this data set, for 2006, was provided by the Cold and Arid Regions Science Data Center at Lanzhou [77]) and according to our data (Figure 18). In general, the contours of the glaciers are in good agreement with each other. Nevertheless, in the “Second Glacier Inventory of China” the glacial outlines are more generalized, and the shape of glaciers is simplified. This is especially true for the accumulation zone. For example, in the contours of the glaciers of the “Second Glacier Inventory of China”, many nunataqs are not shown (Kanas Glacier, No. 46, Figure 18). This is probably because in the process of creation of the “Second Glacier Inventory of China”, Landsat images were used for this territory. Those Landsat images have lower resolution than the Spot 5 images that we used. This probably led to significant differences in the contours of glaciers in some sites. For example, the small glaciers No. 41–44 (total area 0.22 km) identified by us in the north of the site are not identified in the Chinese catalog. In contrast, the glacier in the Chinese catalog having an area of 1.78 km2, located to the west of the Kanas Glacier, corresponded to small glaciers No. 49–55 with a total area of 0.67 km2 in our catalog. As can be seen from the fragment of the Spot 5 satellite image, by 2010 a larger glacier divided into several smaller ones, and in place of its former snout there was a moraine complex or a rock glacier. To verify, we used a Landsat 7 image dated 7 August 2000 with a resolution of 15 m to verify that the snout of that glacier had degraded by 2000.
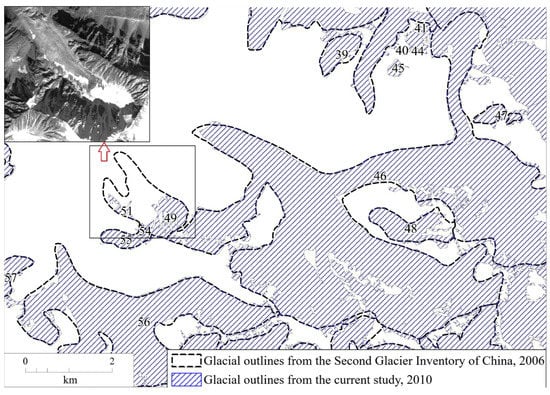
Figure 18.
Comparison of the contours of glaciers in the basin of the Sangadyr river, obtained by us, with the contours from the “Second Glacier Inventory of China”. Upper left corner—a fragment of SPOT 5 satellite image (2010).
5.2. Glacial Recession after the LIA
According to our reconstruction, in the period from the peak of the LIA, there was a 43% reduction of the glacierized area of the Tavan Bogd range. About 31% area loss took place by 1968, and 12% in the period 1968–2010 (about twice as fast as during the period from the LIA peak to 1968). The estimated area-weighted average ELA uplift was about 50 m.
Comparison with the other mountainous areas of the world shows similarity of processes and their scale. There is a tendency of increase in the rate of glacial recession beginning in the last quarter of the 20th century. For example, the European Alps have experienced a 50% decrease in ice coverage in 1850–2000, and the percentage area loss during each decade between the 1970s and 2000 was almost three times greater than the related loss of ice between 1850 and the 1970s [79]. In northern Norway, there was a steady reduction in area (~0.3% per year) between the LIA peak (~1915) and 1988, which paused due to recession between 1988 and 2001, before the rate of recession accelerated to ~1% per year between 2001 and 2014 [21].
In arid mountainous areas glaciers demonstrate roughly the same dynamics. The glacier retreat in the tropical Andes over the last three decades is unprecedented since the peak extent of the LIA (mid-17th–early 18th century). In terms of changes in mass balance, the trend has been quite negative over the past 50 years, with a mean mass balance deficit for glaciers in the tropical Andes that is slightly more negative than the one computed on a global scale. A break point in the trend appeared in the late 1970s, with mean annual mass balance per year decreasing from −0.2 m water equivalent. in the period 1964–1975 to −0.76 m water equivalent in the period 1976–2010. The retreat was much more pronounced on small glaciers at low altitudes [23]. Evaluation of the recession of Akshiirak and Ala Archa glacial centers, Tien Shan, central Asia, showed that the area shrinkage of Akshiirak and Ala Archa was 4.2% and 5.1%, respectively, from 1943 to 1977, and 8.7% and 10.6%, respectively, from 1977 to 2003 [24]. In the eastern Terskey–Alatoo Range of the Tien Shan Mountains, mapping of 109 glaciers using the 1965 1:25,000 maps revealed that glacier surface area decreased by 12.6% of the 1965 value between 1965 and 2003 [80].
In Altai, in most cases the reconstructed values of glacial shrinkage after the LIA demonstrate higher values. For example, Lehmkuhl [14] on the basis of field work in 1995–1998, topographic maps on a scale of 1:100,000 from 1948, and aerial photographs from 1991 estimated glacial area decreases for the Turgen and Kharkhiraa mountains of 56%, and snowline elevation was estimated to be about 80 m.
Some of the results of the previous studies of LIA glacial shrinkage included parts of Tavan Bogd. Recently we obtained information about the glacial recession after the LIA peak from the different glacial centers of the south-east Altai, including the north slope of Tavan Bogd and half of its Mongolian area (Nairamdal ridge) (Table 9) [27]. Comparison shows that the glacial decrease for Tavan Bogd was generally lower than for the other glacial centers of the region. Possible reasons for this phenomenon are the larger dimensions of the Tavan Bogd glaciers combined with the large absolute heights of their orographic base.
Table 9.
Reconstructed LIA glazierisation of different glacial centers and their changes till present (2002–2013) [27].
Based on a comparison of aerial photographs from 1962 with field data of 2015, the reduction of the glaciers of the northern slope of Tavan Bogd was estimated to be 24.3% [43]; data from that study have been used in the current article (i.e., in the estimation of retreat of the valley glaciers of the north slope).
Based on statistical analyses of field data, Chinese researchers revealed a linear relationship between the LIA peak area and that of modern glaciers. They found out that from the time of the LIA to the middle of the 20th century (1950s through to the 1980s), glaciers in western China lost a total area of about 26.9%, but in the Ob river basin this shrinkage was higher (47.5%) [81]. Unfortunately, no statistics about the glacial shrinkage in the Ob basin after the middle of the 20th century were provided.
Wang et al. found that glaciers in the Altai Mountains were in a state of retreat from 1959 to 2000 based on topographic maps and Landsat ETM images. The annual shrinkage rate was 29.94% by area, and the total area of the Kanas Glacier decreased by 4.21% with an annual rate of 0.0011 km2 per year [82]. Another group of scientists using topographic maps from 1959 and ASTER remote sensing data from 2008 for the Friendship Peak in the Chinese Altai Mountains found that the collective area of 201 glaciers was reduced by 30.4% between 1959 and 2008, and that 55 glaciers disappeared entirely. The average rates of reduction in area of glaciers with sizes less than 0.5, 0.5–1, 1–4, 4–10, and over 10 km2 were 25.9%, 30.8%, 30.9%, 35.9%, and 27.4%, respectively [83]. This is different from our results for 1968–2010 (38% for the whole of the Tavan Bogd massif and 47% for its Chinese portion), which is not surprising considering that the glaciers studied by Wang et al. also included glaciers of the South Altai Ridge and Mongolian Altai.
5.3. Retreat of Glacial Fronts
Information on the change in the position of the glacier termini is of particular value, since it often contains information on periods beyond the time frame of aerial and space imagery. On the other hand, it is difficult to create continuous series of data because of the remoteness of the study area and the difficulties of its field study, the large intervals between visits to glaciers, the lack of information on the position of the benchmarks, and their possible destruction or displacement by exogenous processes. It seems promising to link these series to the earliest aerial photographs and space images, allowing us to both extend and detail them, and to eliminate errors.
Solomina [84] analyzed materials on the retreat of about 1000 glaciers located in the mountain ranges of the former Soviet Union (Caucasus, Polar Urals, Pamir-Alay, Tien Shan, Altay, Kodar, Cherskiy range, Suntar-Khayata, Koryakskoye Nagorye, and Kamchatka) between the LIA peak and the second half of the 20th century, and found that the scale of glacier shrinkage was much smaller in continental Siberia than in Central Asia and along the Pacific margins. For Altai, the magnitude of shrinkage was from 90 m to 2300 m, with a median of 458 m and mean of 558 m. For the five glaciers that we studied, the retreat of the terminus between the LIA and 2000–2001 ranged from 1207 m to 2875 m (average 2068 m), being closer to the values for Central Asia. This is probably because Tavan Bogd is situated on the border of Siberia and Central Asia.
In the eastern Terskey–Alatoo Range of the Tien Shan Mountains, detailed mapping of 10 glaciers using historical maps and aerial photographs from the 1943–1977 period has enabled glacier extent variations during the 20th century to be identified with a higher temporal resolution. Glacial retreat was slow in the early 20th century but increased considerably between 1943 and 1956, and then again after 1977. The post-1990 period has been marked by the most rapid glacier retreat since the end of the LIA [80].
For the Altai mountain system, most information is available for its Russian portion. In the Katun’–Chuya glacial center after the last advance of the LIA, there was a general retreat with periods of oscillation in 1911–1914 and 1927–1930 [85]. Nikitin and Narozhnyj noted that oscillations took place in 1979–1980, 1987–1988, and 1993 [86]. In terms of a general retreat, the Right Aktru Glacier stabilized or even advanced in 1936, 1940, 1969, and 1993, and the Malyi Aktru Glacier in 1911, 1936, 1960, 1979, and 1993 [30]. These data are in good agreement with our information on the slowing or halting of retreat of Tavan Bogd glaciers in the 1990s.
The data of other authors on the retreat of Tavan Bogd glaciers in most cases cover short time intervals and cannot be integrated into our data series. In some cases, they are inconsistent. For the Potanin glacier, it is known that in 1905 the medial moraine and the wedge of ice buried by it reached the moraine of the LIA, dividing the periglacial lake into two parts. However, it is not possible to establish the position of the edges of the open ice of the glaciers of Potanin and Alexandra using this data. It is also known that by 1916 this wedge of ice did not change its position, but the open ice experienced a retreat, due to which the lake’s dimensions increased. According to [40], in the period from the LIA maximum to 1987, Potanin and Alexandra glaciers retreated by 2000 m and 1970 m, respectively. The data of Revyakin and Muhametov were obtained by route observations. This finding is close to our results for the period from the LIA peak until 1988: 2053 m and 2061 m, respectively. The difference in results could be caused by the difference of methods used.
According to Mikhailov and Ostanin [44], in the period from 1987 to 2001, the Potanin Glacier retreated by 600 m. However, according to our data, the retreat was close to 318 m in during the similar period of 1988–2000. The implication that in the two missing years the glacier could retreat by 282 m seems implausible. A probable cause of such a difference could be because Mikhailov and Ostanin [44] obtained their information using the benchmarks installed by Revyakin and Muhametov in 1987, however, they acknowledged that they could not restore the information from those benchmarks. Therefore, they may have misinterpreted the distance between the benchmark and the glacial termini in 1987, which could have led to further mistakes. In contrast, Syromyatina et al. [50] estimated a retreat of only 60 m (5 m per year) for the similar period of 1989–2001. However, this finding is also not very reliable because, according to the scientists who visited the glacier in 1987 and 2001, it had the appearance typical of a fast retreating glacier, namely, a flat snout without crevasses.
Another estimation of glacial retreat was made by Krumwiede et al. [54]. Between 1989 and 2009, the Potanin Glacier receded by 516 m, a mean rate of 25.8 m year−1, and by 5.1% of its total length. Over the same period, the adjacent Alexandra Glacier receded by 653 m, a mean rate of 32.7 m year−1. This is close to our results for 1988–2010 for the Potanin Glacier (503 m), but completely different to our estimation of retreat for the Alexandra Glacier (349 m). This is probably due to problems of delineating the front of the glacier, especially due to its progressive moraine coverage.
According to [46], in the period 2003–2009, the Potanin Glacier retreated about 90 m, at an average rate of 15 m year−1, which is in good agreement with our estimated rate of retreat of 18.5 m year−1 in 2000–2010. However, this is quite different to the rapid retreat of the Potanin glacier for almost the same period: 180 m from 2001 to 2006 [50]. It is surprising, but the same authors give quite different estimations of the retreat of Potanin glacier: 290 m for 2001–2013 [50] and 364 m (28 m per year) for 2001–2014 [78]. This means either a correction of the initial estimations to higher values of retreat or a very high (74 m) retreat of the glacier between 2013 and 2014, which may also be possible considering our estimations of a rapid glacial retreat in 2010–2018 (Table 7).
6. Conclusions
Based on remote sensing data and in situ observations, we estimated the LIA glacial extent of Tavan Bogd (area 353.4 km2, average ELA 3235 m), and its glacial extent in 1968 (244 km2) and in 2010 (area 200.98 km2, average ELA 3285 m). Glacial shrinkage in 1968–2010 was significantly faster than in the period between the LIA peak and 1968. The aspect of the slopes had little effect on the degree of glacier shrinkage, but there was a negative correlation between the size of the glaciers and the rate of degradation. In terms of general retreat trends, large valley glaciers retreated faster in 1968–1977 and after 2010. In the 1990s, the retreat was slow. After 2010, the glacial retreat was extremely fast. Climatic preconditions for this kind of glacier dynamics were the general trend decrease of precipitation until the mid-1970s, relatively warm conditions in the 1960s–1970s, a cold interval in 1981–1995, and very rapid warming after 1995. Based on this, it is possible to assume the time period of the glacier response to changes in summer temperatures is in the range of 9–15 years.
Possible prospects for further work relate to obtaining the latest information on the dynamics of the fronts of the largest Tavan Bogd glaciers, carrying out mass-balance observations and calculations, and obtaining information on additional time periods by analyzing available images of suitable quality.
Author Contributions
Conceptualization, D.A.G. and K.V.C.; Data curation, D.A.G., D.V.B. and D.O.; Investigation, D.A.G. and I.V.V.; Methodology, D.A.G., E.P.K., T.A.A. and A.V.T.; Writing—original draft, D.A.G.
Funding
This research received no external funding.
Conflicts of Interest
The authors declare no conflict of interest.
References
- Haeberli, W. Glacier Fluctuations and Climate Change Detection. Geogr. Fis. Din. Quat. 1995, 18, 191–199. [Google Scholar]
- Bahr, D.B.; Dyurgerov, M.B.; Meier, M.F. Sea-level rise from glaciers and ice caps: A lower bound. Geophys. Res. Lett. 2009, 36. [Google Scholar] [CrossRef]
- Radić, V.; Hock, R. Glaciers in the Earth’s Hydrological Cycle: Assessments of Glacier Mass and Runoff Changes on Global and Regional Scales. Surv. Geophys. 2014, 35, 813–837. [Google Scholar] [CrossRef]
- Carey, M. Living and dying with glaciers: People’s historical vulnerability to avalanches and outburst floods in Peru. Glob. Planet. Chang. 2005, 47, 122–134. [Google Scholar] [CrossRef]
- Rudoy, A.N. Glacier-dammed lakes and geological work of glacial superfloods in the late Pleistocene, southern Siberia, Altai mountains. Quat. Int. 2002, 87, 119–140. [Google Scholar] [CrossRef]
- Chistyakov, K.V.; Ganiushkin, D.A. Glaciation and Thermokarst Phenomena and Natural Disasters in the Mountains of North-West Inner Asia. In Environmental Security of the European Cross-Border Energy Supply Infrastructure; Culshaw, M.G., Osipov, V.I., Booth, S.J., Victorov, A.S., Eds.; Springer: Dordrecht, The Netherlands, 2015; pp. 207–218. [Google Scholar]
- Meier, M.F.; Roots, E.F. Glaciers as a water resource. Nat. Resour. 1982, 18, 7–14. [Google Scholar]
- Barnett, T.P.; Adam, J.C.; Lettenmaier, D.P. Potential impacts of a warming climate on water availability in snow-dominated regions. Nature 2005, 438, 303–309. [Google Scholar] [CrossRef] [PubMed]
- Francou, B.; Coudrain, A. Glacier shrinkage and water resources in the Andes. Eos Trans. Am. Geophys. Union 2005, 86, 415. [Google Scholar] [CrossRef]
- Bradley, R.S.; Vuille, M.; Diaz, H.F.; Vergara, W. Threats to water supplies in the tropical Andes. Science 2006, 312, 1755–1756. [Google Scholar] [CrossRef] [PubMed]
- Oerlemans, J. Ectracting a climate signal from 169 gkacier records. Science 2005, 308, 675–677. [Google Scholar] [CrossRef] [PubMed]
- Grove, J.M. The Little Ice Age; Methuen: London, UK, 1988. [Google Scholar]
- Holzhauser, H.; Zumbühl, H.J. To the history of the Lower Grindelwald Glacier during the last 2800 years—Paleosols, fossil wood and pictorical records—New results. Zeitschrift für Geomorphologie Supplement Issues 1996, 104, 95–127. [Google Scholar]
- Lehmkuhl, F. Holocene glaciers in the Mongolian Altai: An example from the Turgen-Kharkhiraa Mountains. J. Asian Earth Sci. 2012, 52, 12–20. [Google Scholar] [CrossRef]
- Patzelt, G. The period of glacier advances in the Alps, 1965 to 1980. Z. Gletscherkd. Glazialgeol. 1985, 21, 403–407. [Google Scholar]
- Zemp, M.; Paul, F.; Hoelzle, M.; Haeberli, W. Alpine glacier fluctuations 1850–2000: An overview and spatio-temporal analysis of available data and its representativity. In The Darkening Peaks: Glacial Retreat in Scientific and Social Context; Orlove, B., Wiegandt, E., Luckman, B., Eds.; University of California Press: Berkeley, CA, USA, 2007; pp. 152–167. [Google Scholar]
- Zemp, M.; Frey, H.; Gärtner-Roer, I.; Nussbaumer, S.U.; Hoelzle, M.; Paul, F.; Haeberli, W.; Denzinger, F.; Ahlstrøm, A.P.; Anderson, B.; et al. Historically unprecedented global glacier decline in the early 21st century. J. Glaciol. 2015, 61, 745–762. [Google Scholar] [CrossRef]
- Zasadni, J. The Little Ice Age in the Alps: Its Record in Glacial Deposits and Rock Glacier Formation. Stud. Geomorphol. Carpatho-Balc. 2007, 41, 117–137. [Google Scholar]
- Colucci, R.R.; Žebre, M. Late Holocene evolution of glaciers in the southeastern Alps. J. Maps 2016, 12, 289–299. [Google Scholar] [CrossRef]
- Andreassen L, M.; Elvehøy, H.; Kjøllmoen, B.; Engeset R, V.; Haakensen, N. Glacier mass-balance and length variation in Norway. Ann. Glaciol. 2005, 42, 317–325. [Google Scholar] [CrossRef]
- Stokes, C.R.; Andreassen, L.M.; Champion, M.R.; Corner, G.D. Widespread and accelerating glacier retreat on the Lyngen Peninsula, northern Norway, since their “Little Ice Age” maximum. J. Glaciol. 2018, 64, 100–118. [Google Scholar] [CrossRef]
- Nesje, A.; Bakke, J.; Dahl, S.O.; Lie, Ø.; Matthews, J.A. Norwegian mountain glaciers in the past, present and future. Glob. Planet. Chang. 2008, 60, 10–27. [Google Scholar] [CrossRef]
- Rabatel, A.; Francou, B.; Soruco, A.; Gomez, J.; Cáceres, B.; Ceballos, J.L.; Basantes, R.; Vuille, M.; Sicart, J.E.; Huggel, C.; et al. Current state of glaciers in the tropical Andes: A multi-century perspective on glacier evolution and climate change. Cryosphere 2013, 7, 81–102. [Google Scholar] [CrossRef]
- Aizen, V.B.; Kuzmichenok, V.; Surazakov, A.B. Glacier changes in central and northern Tien Shan during the last 140 years based on surface and remote sensing data. Ann. Glaciol. 2006, 43, 202–213. [Google Scholar] [CrossRef]
- Loibl, D.; Lehmkuhl, F.; Grießinger, J. Reconstructing glacier retreat since the Little Ice Age in SE Tibet by glacier mapping and equilibrium line altitude calculation. Geomorphology 2014, 214, 22–39. [Google Scholar] [CrossRef]
- Kutuzov, S. The retreat of Tien Shan glaciers since the Little Ice Age obtained from the moraine positions, aerial photographs and satellite images. In Proceedings of the PAGES Second Open Science Meeting, Beijing, China, 10–12 August 2005. [Google Scholar]
- Ganiushkin, D.; Chistyakov, K.; Kunaeva, E. Fluctuation of glaciers in the southeast Russian Altai and northwest Mongolia Mountains since the Little Ice Age maximum. Environ. Earth Sci. 2015, 74, 1883–1904. [Google Scholar] [CrossRef]
- Tronov, M.V. Essays of the Altai Glacierization; Geografgiz: Moscow, Russia, 1949. [Google Scholar]
- Narozhny, J.K.; Nikitin, S.A.; Borodavko, P.S. Glaciers of the Belukha mountain knot (Altai): Mass exchange, dynamics and ice resourses distribution. Data Glaciol. Stud. 2006, 101, 117–128. [Google Scholar]
- Narozhnyj, J.K. Resource assessment and trends in glacier change in the Aktru basin (Altai) over the past century and a half. Data Glaciol. Stud. 2001, 90, 117–125. (In Russian) [Google Scholar]
- Sapozhnikov, V.V. Mongolian Altai in the Sources of the Irtysh and Kobdo. Travels of 1906–1911; Empire Tomsk University: Tomsk, Russia, 1911. [Google Scholar]
- Tronov, B.V.; Tronov, M.V. Investigations in the Southern Altai—A short report on trips to the Altai in 1912, 13, 15 and 16. Bull. Tomsk State Univ. 1924, 24, 210. [Google Scholar]
- Tronov, B.V. Catalog of Altai Glaciers. Bull. Russ. Geogr. Soc. 1925, 57, 107–159. [Google Scholar]
- Lilun, W.; Chaohai, L.; Ping, W. Modern glaciers in Altai Mountains of China. Acta Geogr. Sin. 1985, 40, 142–153, (In Chinese with English Abstract). [Google Scholar]
- Liu, C.H.; You, G.X.; Pu, J.C. Glacier Inventory of China II: Altay Mountains; Lanzhou Institute of Glaciology and Cryopedology, Academia Sinica: Lanzhou, China, 1982. (In Chinese) [Google Scholar]
- Revyakin, V.S.; Okishev, P.А. Present-day glaciation of r. Argut upper basin. Glaciol. Altai 1970, 6, 29–36. (In Russian) [Google Scholar]
- Katalog lednikov SSSR. The USSR Glacier Inventory. 1977, 15, 47. (In Russian)
- Revyakin, V.S.; Muhametov, R.M. Dynamics of the glaciers of Altai-Sayan mountain system over the last 150 years. Data Glaciol. Stud. 1986, 57, 95–99. (In Russian) [Google Scholar]
- Bjamba, Z.; Selivanov, E.I. Present glaciation of Mongolia. Bull. All-Union Geogr. Soc. 1971, 103, 249–254. (In Russian) [Google Scholar]
- Revyakin, V.S.; Muhametov, R.M. Dynamics of the glaciers of Tabyn-Bogdo-Ola. Glaciol. Sib. 1993, 19, 83–92. (In Russian) [Google Scholar]
- Seliverstov, Y.P.; Moskalenko, I.G.; Chistyakov, K.V. Glaciation of the northern slope of Tavan-Bogdo-Ola massif and its dynamics. Proc. Russ. Geogr. Soc. 2003, 135, 1–16. (In Russian) [Google Scholar]
- Chistyakov, K.V.; Moskalenko, I.G. Oledenenie severnogo sklona massiva Tavan-Bogdo-Ola i ego dinamika. Glaciation of the northern slope of Tabyn-Bogdo-Ola Massif and its dynamics. Data Glaciol. Stud. 2006, 101, 111–116. (In Russian) [Google Scholar]
- Ganyushkin, D.A.; Chistyakov, K.V.; Volkov, I.V.; Bantsev, D.V.; Kunaeva, E.P.; Kharlamova, N.F. Modern data on glaciation of the northern slope of Tavan-Bogdo-Ola massif (Altai). Led i Sneg 2017, 57. [Google Scholar] [CrossRef]
- Mihajlov, N.N.; Ostanin, O.V. Glaciers of the South and Mongolian Altai and their changes in the 20th century. Geogr. Nat. Manag. Sib. 2002, 5, 3–20. [Google Scholar]
- Galakhov, V.P.; Red’kin, A.G. Sovremennoe i drevnee oledenenie gornogo uzla Tabyn-Bogdo-Ola. Present and past glaciation of Tavan Bogd mountain knot. Geogr. Prir. Sib. 2001, 4, 153–175. (In Russian) [Google Scholar]
- Kadota, T.; Gombo, D.; Kalsan, P.; Namgur, D.; Ohata, T. Glaciological research in the Mongolian Altai, 2003–2009. Bull. Glaciol. Res. 2011, 29, 41–50. [Google Scholar] [CrossRef]
- Kadota, T.; Gombo, D. Recent glacier variations in Mongolia. Ann. Glaciol. 2007, 46, 185–188. [Google Scholar] [CrossRef]
- Konya, K.; Kadota, T.; Nakazawa, F.; Davaa, G.; Kalsan, P.; Yabuki, H.; Ohata, T. Surface mass balance of the Potanin Glacier in Mongolian Altai Mountains and comparison with Russian Altai glaciers in 2005, 2008 and 2009. Bull. Glaciol. Res. 2013, 31, 9–18. [Google Scholar] [CrossRef]
- Nakazawa, F.; Konya, K.; Kadota, T.; Ohata, T. Depositional and summer snow melting features in 2007–2011 on the upstream side of Potanin Glacier, Mongolian Altai, reconstructed by pollen and oxygen isotope analysis. Environ. Earth Sci. 2015, 74, 1851–1859. [Google Scholar] [CrossRef]
- Syromyatina, M.V.; Kurochkin, Y.N.; Chistyakov, K.V.; Ayurzana, C. Current state and changes of glaciers in the Tavan Bogd Mountains (Mongolia). Ice Snow 2014, 54, 31–38. [Google Scholar] [CrossRef]
- Kamp, U.; Krumwiede, B.; Mcmanigal, K.; Pan, C.; Walther, M.; Dashtseren, A. The Glaciers of Mongolia; University of Colorado: Denver, CO, USA, 2013. [Google Scholar]
- Kamp, U.; Pan, C.G. Inventory of glaciers in Mongolia, derived from Lanfsat imagery from 1989 to 2011. Geogr. Ann. Ser. A Phys. Geogr. 2015, 97, 653–669. [Google Scholar] [CrossRef]
- Guo, W.; Liu, S.; Xu, J.; Wu, L.; Shangguan, D.; Yao, X.; Wei, J.; Bao, W.; Yu, P.; Liu, Q.; et al. The second Chinese glacier inventory: Data, methods and results. J. Glaciol. 2015, 61, 357–372. [Google Scholar] [CrossRef]
- Krumwiede, B.S.; Kamp, U.; Leonard, G.J.; Kargel, J.S.; Dashtseren, A.; Walther, M. Recent Glacier Changes in the Mongolian Altai Mountains: Case Studies from Munkh Khairkhan and Tavan Bogd. In Global Land Ice Measurements from Space; Kargel, J.S., Leonard, G.J., Bishop, M.P., Kääb, A., Raup, B.H., Eds.; Springer: Berlin/Heidelberg, Germany, 2014; pp. 481–508. ISBN 978-3-540-79818-7. [Google Scholar]
- Egorina, A.V.; Popova, K.I.; Dyukarev, A.D.; Kondrat’ev, V.P. Klimat Yugo-Zapadnogo Altaya (Climate of South-Western Altai); Altay State University, East Humanitarian Iinstitute, East—Kazakhstan Center of Hidrometeorology: Ust’-Kamenogorsk, Russia, 2002. (In Russian) [Google Scholar]
- Ganyushkin, D.A.; Chistyakov, K.V.; Volkov, I.V.; Bantcev, D.V.; Kunaeva, E.P.; Kharlamova, N.F. Modern data on glaciation of the northern slope of Tavan-Bogdo-Ola massif (Altai). Ice Snow 2017, 57, 307–325. [Google Scholar] [CrossRef]
- LiLun, W. Precipitation condition of glaciated region in Altay mountains in China and its influence on glacial development. In Conference on Glaciology of the Geographical Society of China (Selection); Institute of Geographic Sciences and Natural Resources Research: Beijing, China, 1990; pp. 64–71. [Google Scholar]
- Sevast’janov, V.V.; Shantykova, L.N. Characteristics of the field of annual precipitation in the Altai Mountains according to glacial climatic parameters. Bull. Tomsk State Univ. 2001, 274, 63–69. (In Russian) [Google Scholar]
- Krenke, A.N. Mass Exchange in Glacier Systems on the USSR Territory; Hydrometeoizdat: Leningrad, Russia, 1982; (In Russian, Extended English Abstract). [Google Scholar]
- Scanex. Available online: www.scanex.ru (accessed on 1 May 2017).
- USGS. Available online: https://earthexplorer.usgs.gov/ (accessed on 1 May 2017).
- Earth Resources Observation and Science (EROS) Center. Available online: https://eros.usgs.gov/ (accessed on 3 April 2018).
- Kurowsky, L. Die Hohe der Schneegrenze mit besonderer Berucksichtigung der Finsteraargorngruppe. Pencks Geogr. Abh. 1891, 5, 115–160. (In German) [Google Scholar]
- Glazyrin, G.E. Distribution and Regime of Mountain Glaciers; Hydrometeoizdat: Leningrad, Russia, 1985. [Google Scholar]
- Labutina, L.A. Nterpretation of Aerospace Images. Manual; Aspekt-Press: Moscow, Russia, 2004. [Google Scholar]
- Akovetskii, V.I. Image Interpretation; Nedra: Moscow, Russia, 1983. [Google Scholar]
- Blomdin, R.; Heyman, J.; Stroeven, A.P.; Haettestrand, C.; Harbor, J.M.; Gribenski, N.; Jansson, K.N.; Petrakov, D.A.; Ivanov, M.N.; Alexander, O.; et al. Glacial geomorphology of the Altai and Western Sayan Mountains, Central Asia. J. Maps 2016, 12, 123–136. [Google Scholar] [CrossRef]
- Ganyushkin, D.A.; Kunaeva, E.P.; Chistyakov, K.V.; Volkov, I.V. Interpretation of Glaciogenic Complexes from Satellite Images of the Mongun-Taiga Mountain Range. Geogr. Nat. Resour. 2018, 39, 63–72. [Google Scholar] [CrossRef]
- Ganyushkin, D.A.; Chistyakov, K.V.; Kunaeva, E.P.; Volkov, I.V.; Bantsev, D.V. Current glaciation of the Chikhachev ridge (South-Eastern Altai) and its dynamics after maximum of the Little Ice Age. Ice Snow 2016, 56, 29–42. [Google Scholar] [CrossRef]
- Chistyakov, K.V.; Ganushkin, D.A.; Moskalenko, I.G.; Dullo, W.-C. The glacier complexes of the mountain massifs of the north-west of Inner Asia and their dynamics. Geogr. Environ. Sustain. 2011, 4, 4–21. [Google Scholar] [CrossRef]
- Ganyushkin, D.A. Glacigenic Complexes of Sharply Continental Area of North-West Inner Asia; Saint-Petersburg state university: Saint-Petersburg, Russia, 2015. [Google Scholar]
- Ganyushkin, D.A.; Otgonbayar, D.; Chistyakov, K.V.; Kunaeva, E.P.; Volkov, I.V. Recent glacierization of the Tsambagarav ridge (North-Western Mongolia) and its changes since the Little Ice Age maximum. Ice Snow 2016, 56, 437–452. [Google Scholar] [CrossRef]
- Ganyushkin, D.A.; Chistyakov, K.V.; Volkov, I.V.; Bantcev, D.V.; Kunaeva, E.P.; Terekhov, A.V. Present glaciers and their dynamics in the arid parts of the Altai mountains. Geosci. 2017, 7, 117. [Google Scholar] [CrossRef]
- Cogley, G.; Gardner, A.; Cogley, G.; Earl, L.; Raup, B.H. GLIMS Glacier Database; National Snow and Ice Data Center: Boulder, CO, USA, 2015. [Google Scholar]
- Earl, L.; Gardner, A. A satellite-derived glacier inventory for North Asia. Ann. Glaciol. 2016, 57, 50–60. [Google Scholar] [CrossRef]
- Shiyin, L.I.U. The 2nd Glacier Inventory of China. Ann. Glaciol. 2009, 50, 1–4. [Google Scholar]
- Cold and Arid Regions Science Data Center at Lanzhou. Available online: http://westdc.westgis.ac.cn (accessed on 1 May 2018).
- Syromyatina, M.V.; Kurochkin, Y.N.; Bliakharskii, D.P.; Chistyakov, K.V. Current dynamics of glaciers in the Tavan Bogd Mountains (Northwest Mongolia). Environ. Earth Sci. 2015, 74, 1905–1914. [Google Scholar] [CrossRef]
- Zemp, M.; Paul, F.; Hoelzle, M.; Haeberlie, W. Glacier Fluctuations in the European Alps, 1850–2000: An overview and spatio-temporal analysis of available data. Darkening Peaks Glacial Retreat Sci. Soc. Context 2006, 152–167. [Google Scholar] [CrossRef]
- Kutuzov, S.; Shahgedanova, M. Glacier retreat and climatic variability in the eastern Terskey-Alatoo, inner Tien Shan between the middle of the 19th century and beginning of the 21st century. Glob. Planet. Chang. 2009, 69, 59–70. [Google Scholar] [CrossRef]
- Liu, S.; Junli, X.; Guo, W.; Zhang, S. Glaciers in China and Their Variations. In Global Land Ice Measurements from Space; Springer: Berlin/Heidelberg, Germany, 2014; pp. 583–608. ISBN 978-3-540-79817-0. [Google Scholar]
- Wang, S.H.; Xie, Z.C.; Dai, Y.N.; Liu, S.Y.; Wang, X. Structure, change and its tendency of glacier systems in Altay Mountains. Arid L. Geogr. 2011, 34, 115–123. [Google Scholar]
- Wang, P.; Li, Z.; Luo, S.; Bai, J.; Huai, B.; Wang, F.; Li, H.; Wang, W.; Wang, L. Five decades of changes in the glaciers on the Friendship Peak in the Altai Mountains, China: Changes in area and ice surface elevation. Cold Reg. Sci. Technol. 2015, 116, 24–31. [Google Scholar] [CrossRef]
- Solomina, O.N. Retreat of mountain glaciers of northern Eurasia since the Little Ice Age maximum. Ann. Glaciol. 2000, 31, 26–30. [Google Scholar] [CrossRef]
- Dushkin, M.A. Long-term fluctuations of the Aktru glaciers and the conditions for the development of young moraines. Glaciol. Altai 1965, 4, 83–101. (In Russian) [Google Scholar]
- Narozhnyj, J.K.; Nikitin, S.A. The modern glaciation of Altai at the turn of the 21st century. Data Glaciol. Stud. 2003, 95, 93–111. (In Russian) [Google Scholar]
© 2018 by the authors. Licensee MDPI, Basel, Switzerland. This article is an open access article distributed under the terms and conditions of the Creative Commons Attribution (CC BY) license (http://creativecommons.org/licenses/by/4.0/).