Methane Content in Ground Ice and Sediments of the Kara Sea Coast
by

Irina D. Streletskaya
1, 
Alexander A. Vasiliev
2,3,
Gleb E. Oblogov
2,3,* and
Dmitry A. Streletskiy
4 1
Moscow State University, Faculty of Geography, Department of Cryolitology and Glaciology, 119991 Moscow, Russia
2
Institute of the Earth’s Cryosphere of Tyumen Scientific Center of Siberian Branch of Russian Academy of Sciences, 625000 Tyumen, Russia
3
Tyumen State University, International Centre of Cryology and Cryosophy, 625003 Tyumen, Russia
4
George Washington University, Department of Geography, Washington, DC 20052, USA
*
Author to whom correspondence should be addressed.
Geosciences 2018, 8(12), 434; https://doi.org/10.3390/geosciences8120434
Submission received: 13 September 2018
/
Revised: 31 October 2018
/
Accepted: 21 November 2018
/
Published: 23 November 2018
(This article belongs to the Special Issue Gas and Gas Hydrate in Permafrost)
Abstract
:Permafrost degradation of coastal and marine sediments of the Arctic Seas can result in large amounts of methane emitted to the atmosphere. The quantitative assessment of such emissions requires data on variability of methane content in various types of permafrost strata. To evaluate the methane concentrations in sediments and ground ice of the Kara Sea coast, samples were collected at a series of coastal exposures. Methane concentrations were determined for more than 400 samples taken from frozen sediments, ground ice and active layer. In frozen sediments, methane concentrations were lowest in sands and highest in marine clays. In ground ice, the highest concentrations above 500 ppmV and higher were found in massive tabular ground ice, with much lower methane concentrations in ground ice wedges. The mean isotopic composition of methane is −68.6‰ in permafrost and −63.6‰ in the active layer indicative of microbial genesis. The isotopic compositions of the active layer is enriched relative to permafrost due to microbial oxidation and become more depleted with depth. Ice-rich sediments of Kara Sea coasts, especially those with massive tabular ground ice, hold large amounts of methane making them potential sources of methane emissions under projected warming temperatures and increasing rates of coastal erosion.
1. Introduction
Methane emissions from permafrost are one of the topics requiring immediate attention due to potential significant implications to the Arctic and global climate system [1]. Some studies speculated that methane emissions due to subsea permafrost degradation can significantly effect the climate [2,3], while others suggest that even under the most extreme scenarios, methane release from subsea permafrost will have little to no effect on the state of the climate [4]. Due to the divergent views, methane content in permafrost regions requires further investigation as general lack of field data adds to uncertainty of timing and magnitude of methane emissions from both terrestrial and subsea permafrost regions. The major sources of methane from terrestrial permafrost are bogs and wetlands and degrading permafrost, with a considerably smaller contribution from the geologic sources [5,6,7,8]. The methane emissions from permafrost of a shelf of the East Siberian Arctic seas are expected due to high organic content of the sediments [8,9,10,11,12,13,14,15]. However not all permafrost affected soils are characterized by high methane content. Sediments of marine and lacustrine genesis of Western Siberia which were freezing epigenetically (after sedimentation ceased) are generally characterized by high methane concentrations [8,9], while the ice complex (“yedoma”) sediments characteristic of Russian Northeast which were freezing syngenetically (simultaneously with sedimentation) are generally characterized by low methane concentrations [16,17]. The distribution of methane with depth in permafrost depends on the presence of buried organic layers and soil texture, for example, clayey soils are known to have higher methane contents relative to sandy soils [5,6,7,8,9,10,11,12,13,14,15]. The complexity of methane distribution in permafrost increases in areas where permafrost caps gas-bearing sediments formed through the processes of diagenesis and catagenesis resulting in further transformation of organic material under pressure and temperature [18].
Field studies of methane concentrations in permafrost are rare due to logistical constraints associated with obtaining methane from frozen samples for such analysis. Investigations conducted by the Canadian Geologic Survey in the Mackenzie Delta found methane concentrations above 5 mL/kg in frozen sands at 18 to 345 m depth [19]. Several studies reported generally higher than atmospheric methane content in the ground ice wedges in Canadian Arctic [20] and Eastern Siberia [7,16,17]. The analysis of texture ice extracted from the Pechora Sea seafloor (43–45 m water depth) near Kara Gate Straight showed that methane content of trapped gas was above 4390 ppm [21]. Analysis of the gas composition of the massive tabular ground ice (MTGI) was conducted in Canadian Arctic [22,23,24] and Western Yamal [9,25,26,27]. These studies report high concentrations of methane trapped in the air bubbles within the ice. In some cases, the methane content in MTGI samples was one to two orders of magnitude higher than in the atmospheric air [26]. These high concentrations were attributed to microbial methanogenesis occurring under conditions of temperatures below freezing point [25,28,29,30]. Several studies found that methane production in the active layer can be substantial, but only if labile organic material is abundant in the soil [31].
The isotopic composition of methane in ground ice and frozen ground is indicative of its genesis, with the majority of studies showing biogenic genesis of the gas [25,32]. Studies of isotopic composition of methane in ground ice of East Siberia found δ13С(СН4) varies from −64‰ to −99‰ [16]. Similar values were reported from the Mackenzie delta, from −77.9‰ to −89.9‰ [22]. These values are lighter compared to the deep gas-bearing deposits of Yamal Peninsula which are generally characterized by δ13C(CH4) from −50‰ to −43‰, which is usually indicative that gas was formed through thermogenic process or explained by highly fractionationed methane due to methane oxidation [33].
Additional studies of methane content and origin in permafrost are needed in order to evaluate the role of permafrost carbon feedback. This paper presents data on methane content and distribution in permafrost, active layer and ground ice collected in coastal exposures of Kara Sea region. The major goal of this research was to evaluate variability of methane concentrations in various types of coastal sediments and landscapes of coastal zone. Particular attention was given to methane content and genesis of the massive tabular ground ice deposits which are common to this region.
2. Study Area
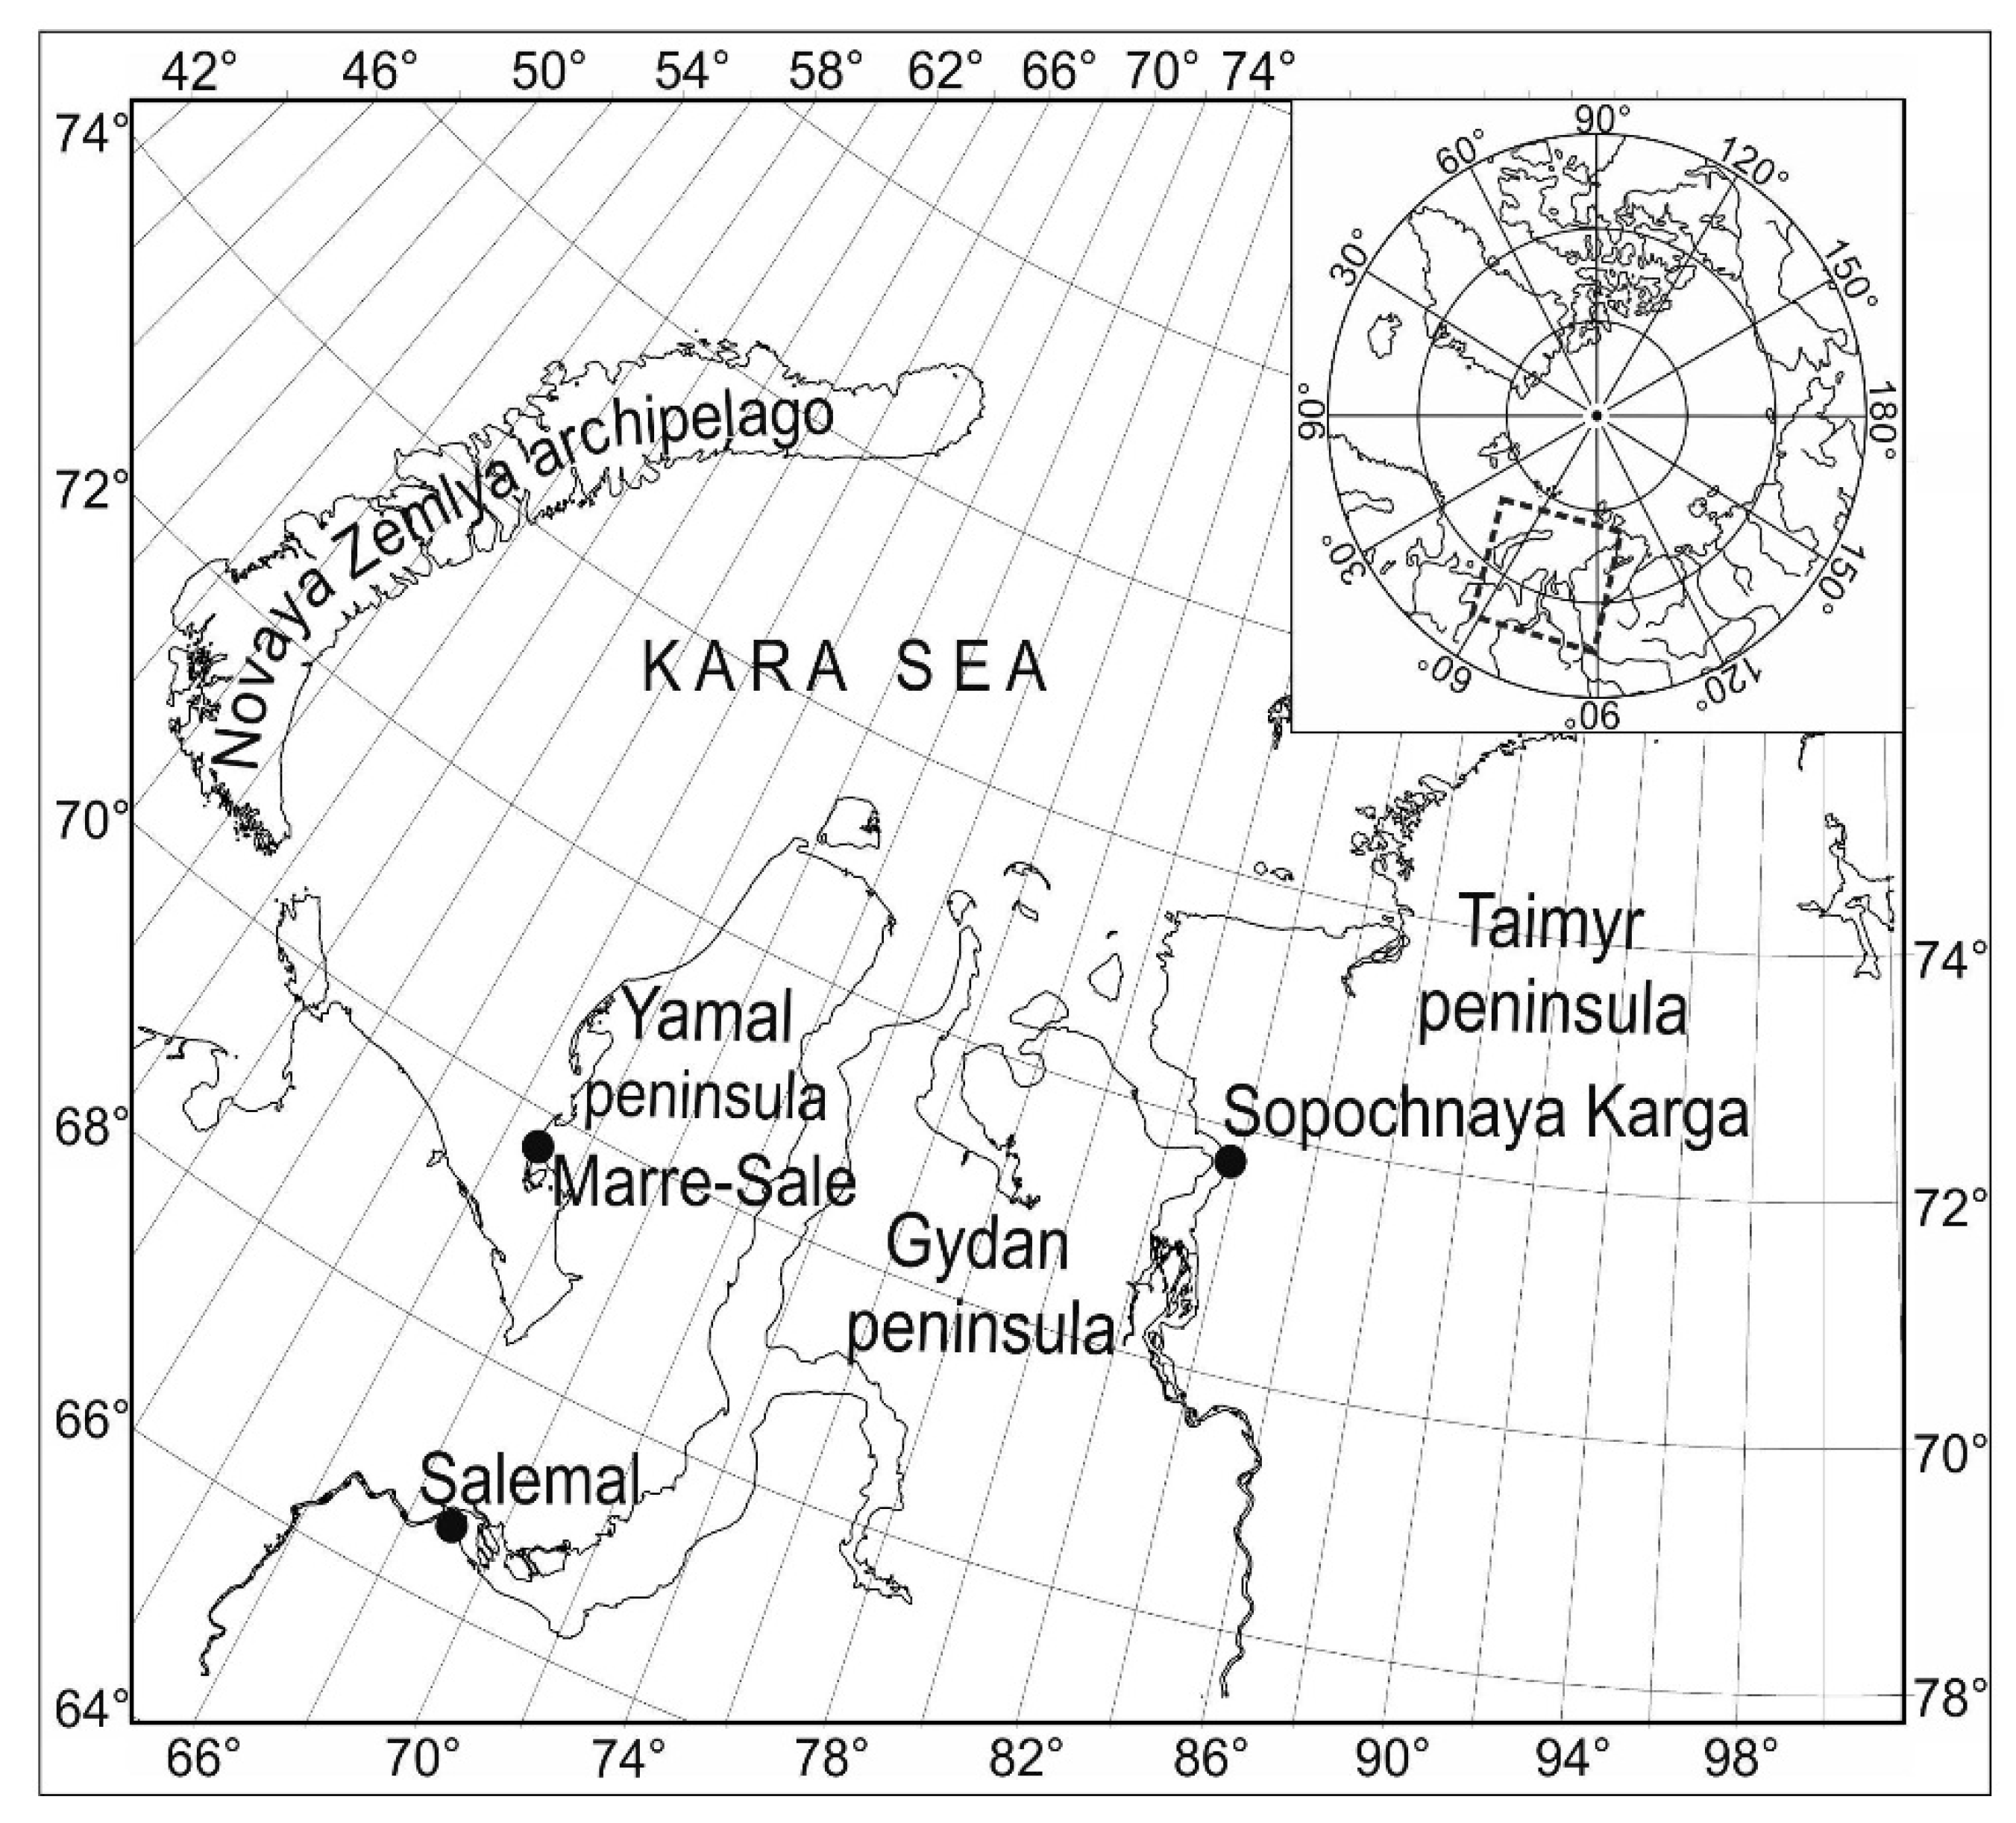
The methane concentrations were determined in permafrost and ground ice typical to the Kara Sea region at three key sites (Figure 1). These sites represent various stratigraphic and permafrost conditions characteristic of coastal environments of the region. Two sites were located at the western coast of Yamal Peninsula (Cape Marre-Sale) and Taimyr Peninsula (Cape Sopochnaya Karga) and had outcrops of Late Pleistocene sediments. The third site, Cape Salemal was located at the southern part of Yamal Peninsula at the mouth of Ob River and had typical Middle-Pleistocene clays profile. Mare-Sale has a permanent monitoring station and was a base camp during 2012–2017 field campaigns. Cape Sopochnaya Karga was accessed occasionally during 2015–2017. Cape Salemal was only visited once in 2016. The descriptions of each study site are given below.
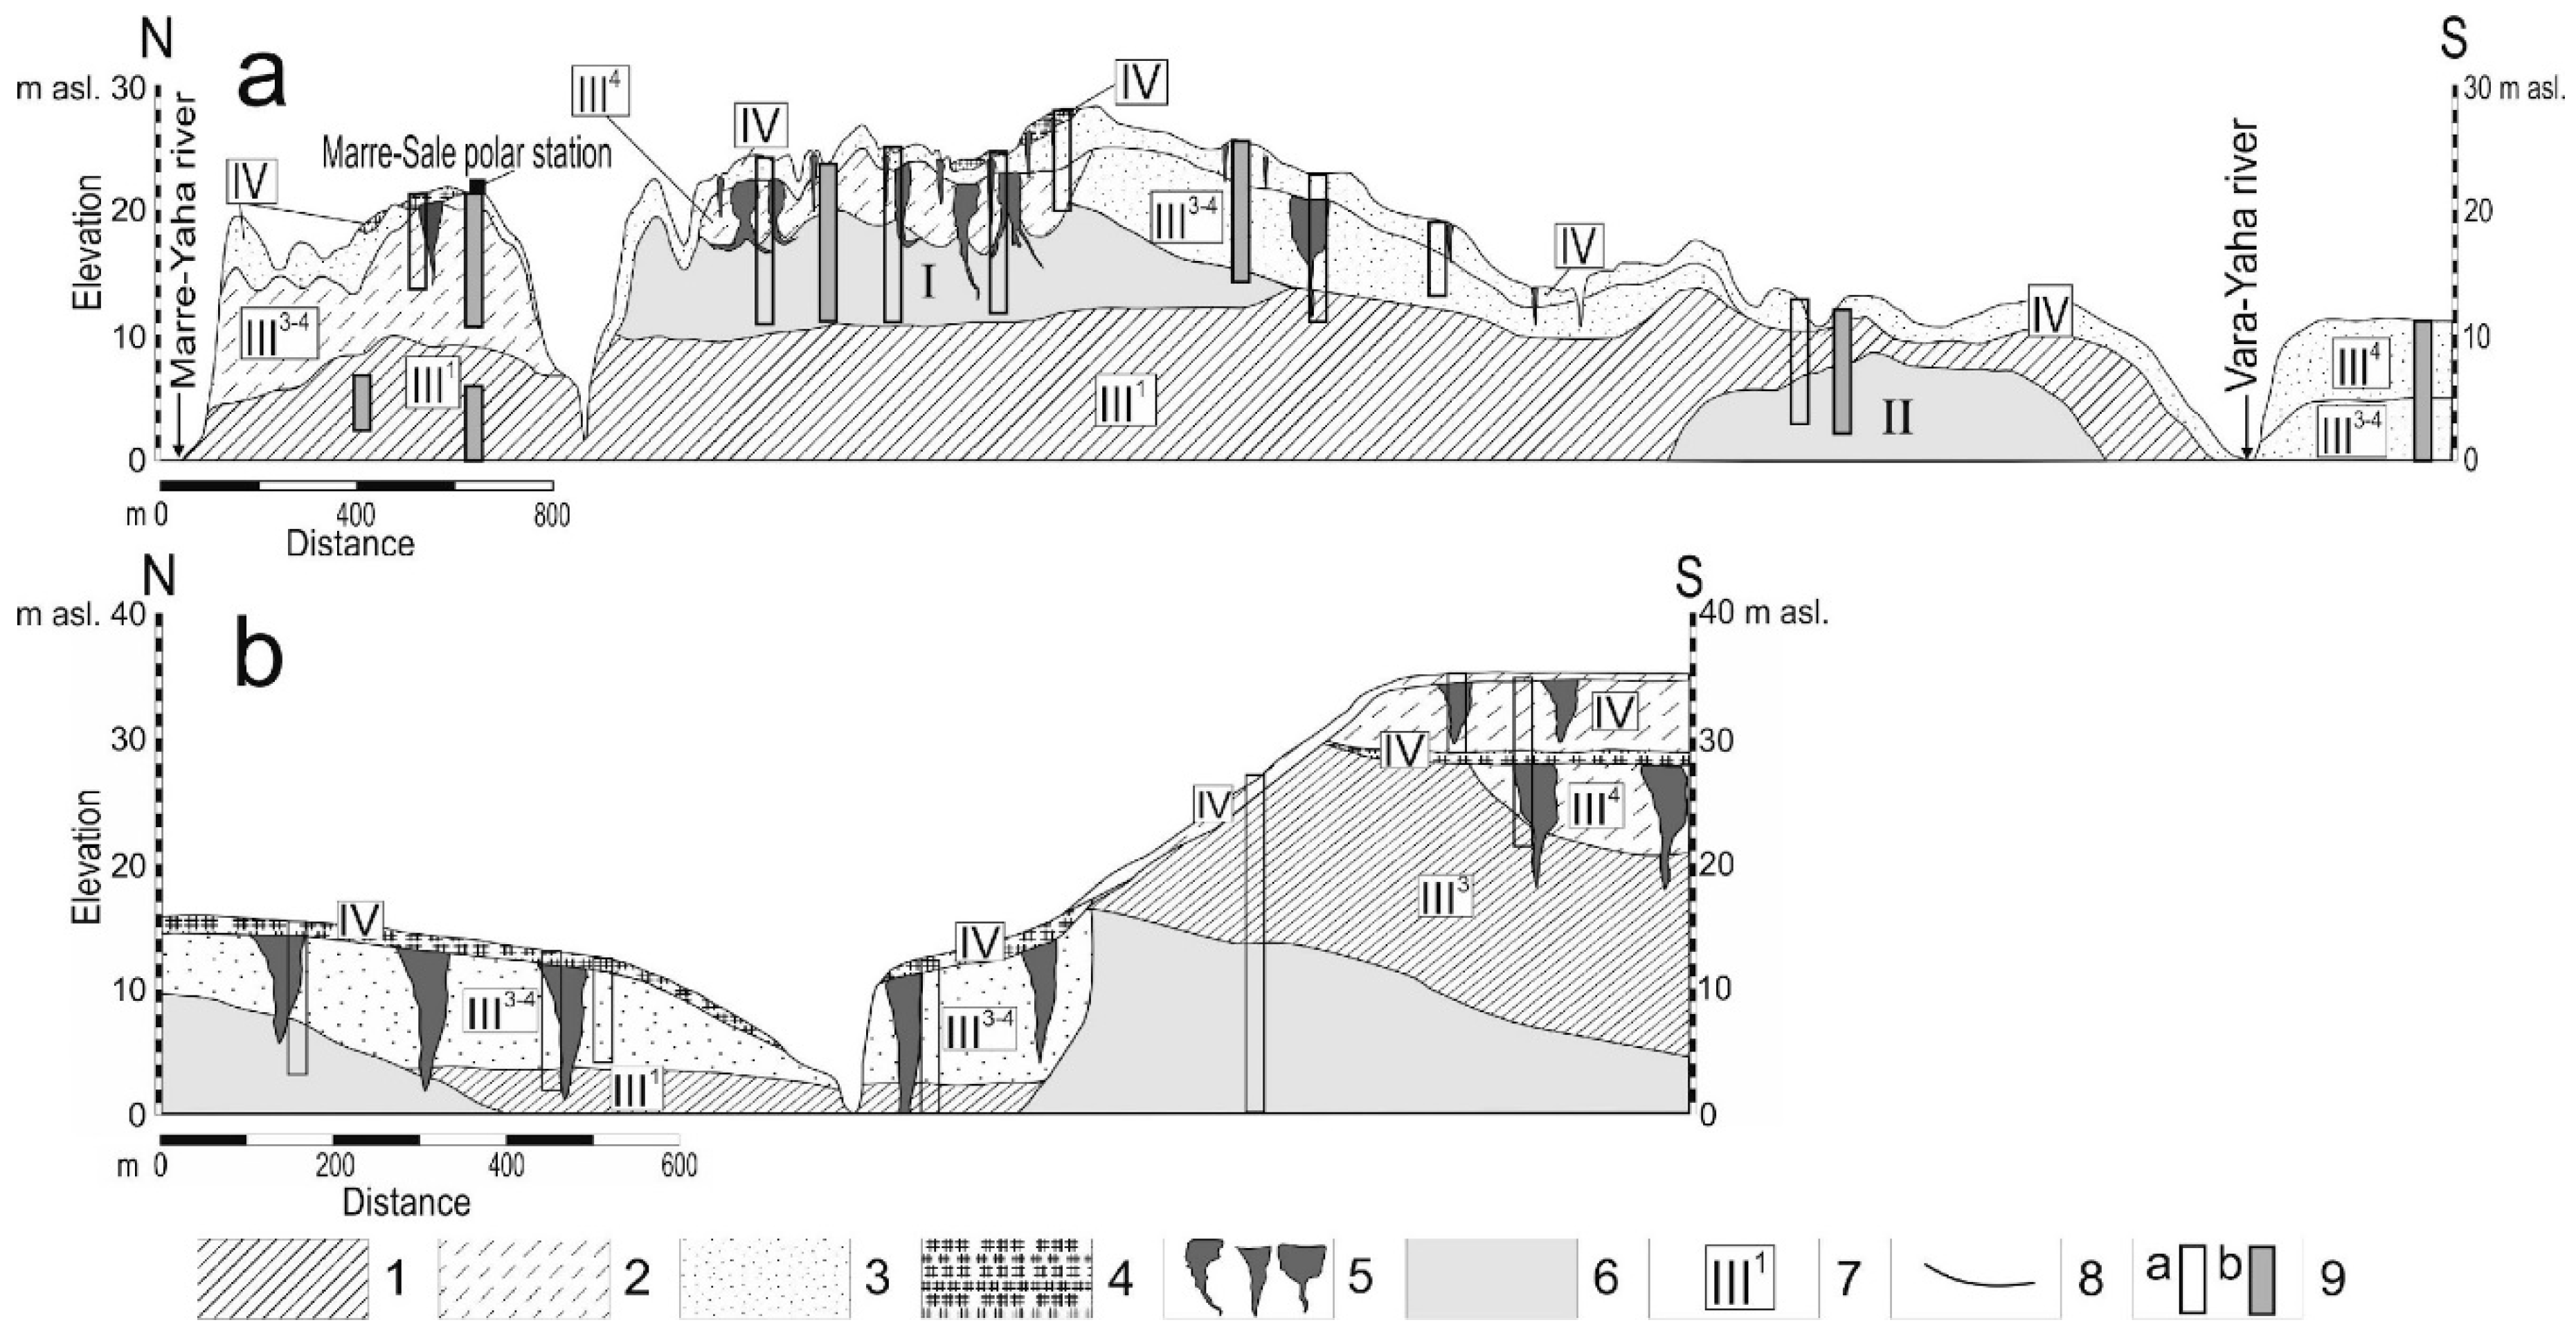
Marre-Sale is located on the west coast of the Yamal Peninsula in the zone of continuous permafrost (Figure 1 and Figure 2a). The landscape is dominated by typical well-drained tundra, with water tracks on slopes, and bogs and moist tundra occupying lower elevations. The coastal exposures in the area are typically 15 m to 30 m high and composed of combinations of marine and terrestrial sediments. Detailed stratigraphic and cryogenic structure studies were previously conducted at this site [34,35,36,37]. The lower part of profile in this area is composed by Late Pleistocene saline marine clays with the inclusion of sand layers formed during Marine Isotope Stage (MIS) 5 (127–71 kyr BP cal) [38]. The layer has no visible organic inclusions, the mean total organic carbon (TOC) is 0.84% [27]. Marine clays were freezing epigenetically as a result of retreating sea. The upper part of the profile is composed of alluvial lacustrine sands and sandy loams formed during MIS 3 (57–24 kyr BP cal) and MIS 2 (24-11 kyr BP cal) [34]. These sediments contain visible organic detritus, but mean organic content is only 0.34% [27]. The thin layer of Holocene sediments is mostly represented by aeolian sands and peatlands tops the profile. The ground ice is present as texture ice, ice wedges and MTGI. The ice wedges are presented by two distinct generations. Smaller Holocene wedges are characteristic of the upper part of the profile, while larger and wider Pleistocene ice wedges (MIS 2) penetrate to the lower layer of marine clays [39]. Ice wedges have visible inclusions of organic detritus and numerous vertically oriented gas bubbles of 1 to 3 mm in diameter. Two distinct types of MTGI are present in the profile. First type is ice body in which layers of thick and clear ice with small unevenly distributed mineral inclusions are separated by layers of ice-rich sandy sediments with inclusions of organic material. This MTGI is 3 m to 10 m thick and 300 m long and separates upper part of the profile composed by sands from the part composed by marine clays. Ice has unevenly distributed rounded and horizontally elongated bubbles of 1 to 2 mm in diameter in size. The second type of MTGI is represented by clear ice body, 6 m to 8 m thick and 150 m to 200 m long and is located within the marine clays. Multiple air bubbles up to 4 mm in diameter are unevenly distributed within the ice. In both types of MTGI, gas in bubbles is under the pressure as ice bubbles are actively bursting when ice surface is exposed.
Sopochnaya Karga exposure is located in the western coast of Taimyr Peninsula, in the right bank of the Yenisei river Gulf. The area is characterized by continuous permafrost up to 300 m thick with mean annual ground temperatures from −8.5 to −9.6 °C [40]. The geologic conditions are similar to those in Marre-Sale study area. The coastal exposure shows horizontally oriented marine clays and loams without visible organic inclusions formed during MIS 5 (Figure 2b) [41]. Mean TOC is 1%. Marine clays are overlaid by alluvial sands and loamy sands formed during MIS 3-2 with mean TOC below 0.7% [42]. The profile is capped by Holocene sands and peatland 1 to 2 m thick. Syngenetic ice wedges are found in the northern part of the exposure and are likely formed during MIS 3-2. The ice in wedges has white milky color, inclusions of sand particles and vertically oriented gas bubbles of 1–2 mm in diameter. The MTGI located inside the marine clays strata or at the boundary between marine clays and terrestrial sands. The ice has inclusions of clay blocks with preserved horizontal orientation. The gas bubbles are round and range from 0.5 to 5 mm in diameter. The southern part of exposure has sands and silts with organic detritus, roots and lenses of peats, most likely formed in the conditions of flood plain environment during MIS2. The TOC is 1.5%. Two types of ice wedges are present; the Holocene wedges form the upper layer and have mineral and organic inclusions. The lower layer ice wedges are wider and formed during MIS 2 [41].
Cape Salemal exposure is located at the southern part of the Ob Gulf in the zone of sporadic permafrost with mean annual ground temperature around −1 °C. The profile is presented by grey glacio-marine clay sediments with low ice content formed during Mid Pleistocene, MIS 6-8 [43]. There are no visible inclusions of ice wedges or MTGI; however, wedge-casts are well preserved suggesting epigenetic freezing of sediments under conditions of retreating sea basin in Mid Pleistocene followed by the formation of ice wedges on the exposed to atmospheric cold surface [44].
3. Materials and Methods
Methane concentrations were determined in various types of sediments collected from the active layer, frozen ground and ground ice in the three key study sites.
The sample size varies at each site and reflects time and logistical constraints. Marre-Sale was a base camp during 2012–2017 field campaigns and had more detailed investigations and a considerably larger number of samples collected relative to other two sites which were visited sporadically during 2015–2017 field seasons. Out of 434 samples, 93 were from ground ice, 153 from frozen sedimentary strata, and 159 from the active layer collected at the Marre-Salle site. Twenty one samples were taken from ground ice at Sopochnaya Karga Cape, and 8 samples were obtained from frozen soil in Cape Salemal. All samples were collected during field seasons of 2012–2017, between the end of July and the end of August. The samples collected prior to 2015 in Marre-Sale were partially presented in earlier works [35,36,37,38,39,41]. The number and geography of samples were extended in 2016–2017 to include areas of Sapochnaya Karga and Cape Salemal.
During 2012–2013 field seasons, the degassing of frozen samples was performed using a dynamic method of degassing by SUOK-DG degassing unit (Patent (19) RU (11) 2348931 (13) C1). Gas composition was then determined by chromatography with flame ionization detector (FID) Shimadzu GC-2014 (Japan) in the laboratory of Federal State Institution “VNIIOkeangeologiya” (Saint-Petersburg, Russia).
After 2013, samples were degassed using a “Head Space” method [45]. Cylindrical frozen soil samples (about 50 cm3) were collected with the cutting ring and placed in a 150 mL plastic Janet’s syringe (Russia). After sampling, a soil or ice sample was weighed and placed in syringes immediately after sampling, the syringe along with the sample was filled with salt water, so that only about 50 cm3 remained free space filled with air. The free space volume was measured at each degassing. After complete thawing, a gas sample was taken from the free space. The concentration of methane in free space was recalculated for the volume of soil, which was calculated based on the weight of each sample and density. The density was determined in parallel with the sampling of the gas composition by the cutting ring method. The residence time of the sample in the syringe until complete thawing was about 3–5 h. Methane production during thawing could not be more or less noticeable. Gas samples from air-gas mixture in syringes were transferred into 10 mL glass penicillin vials (Russia) then transported to several laboratories.
Concentration of methane in gas phase was determined in the Institute of Physical, Chemical, and Biological Problems in Soil Science RAS (Pushchino, Russia) using a gas chromatograph HPM.4 (Russia) with flame ionization detector. A subset of samples was used for quality control and independently processed in the “VNIIOkeangeologiya” (Saint-Petersburg, Russia), where analysis was made using gas chromatograph Shimadzu GC-2014 with FID detector. The difference of results did not exceed the measurement accuracy.
The δ13С(CH4) composition was determined for samples with methane content >0.1%. Twenty-six gas samples of ground ice and permafrost were analyzed in the Institute of Microbiology RAS using gas chromatography combustion isotope ratio mass spectrometry (GC/C/IRMS). Six samples were analyzed in the laboratory of Faculty of Geology, Moscow State University, Russia. To determine the genesis of the MTGI, six samples collected at Marre-Sale were analyzed for δD(CH4) content in the ISOLAB B.V. laboratory, Netherlands.
Mean TOC was determined for 74 samples selected to characterize major stratigraphic facies found in the study areas using Shimadzu TOC-VCSH total organic carbon analyzer at the “VNIIOkeangeologiya” laboratory.
4. Results and Discussion
4.1. Methane Concentration in Ice Wedges and Massive Tabular Ground Ice
Methane is the most abundant hydrocarbon gas found in the ground ice. It has an order of magnitude higher concentrations than any other hydrocarbon detected. The concentration of methane varies substantially depending on the age and genesis of the strata, type of ground ice and cryogenic conditions. The summary statistics is given in Table 1. The details on sampling distribution are presented in Figure S1.
Samples from Marre-Sale have on average 146 ppmV (0.16 mL/kg) in Holocene and 40 ppmV (0.04 mL/kg) in Late Pleistocene ground ice wedges. Relatively high methane concentrations in ground ice wedges (GIW) can be attributed to accumulation with meltwater and/or in situ methanogenesis within the wedges [25]. Both types of MTGI have an order of magnitude higher methane concentration relative to GIW averaging 1413 ppmV (1.57 mL/kg) for the first type and 558 ppmV (0.62 mL/kg) for the second type. These high concentrations can be attributed to migration of methane away from the freezing front and conservation of methane in gas bubbles within the tabular massive ice body. The migration of methane away from the freezing front is similar to migration of mineral solutions under conditions of rapid freezing. High methane concentrations are indicative of non-atmospheric conditions of MTGI. MTGI of glacier origin will likely to have little presence of methane, such as Antarctic glacial ice has concentrations around 0.3–0.7 ppmV [46].
The samples from the ground ice wedges collected at Sopochnaya Karga have generally smaller methane concentrations relative to Marre-Sale, with Holocene GIW mean of 74 ppmV (0.08 mL/kg) and Pleistocene mean concentrations of 55 ppmV (0.06 mL/kg). The MTGI exposed here is similar to the first type of MTGI exposed at Marre-Sale, but has smaller methane concentration with an average of 301 ppmV (0.33 mL/kg) (Table 1).The minimal values in all samples of ground ice are exceeding those characteristic for the ice of atmospheric origin and are considerably higher than previously reported for the Laptev Sea coast, where concentration of methane in GIW of Mamontovy Klyk were from 1 to 7 ppmV [47]. This difference is likely due to much colder climatic conditions during formation of ground ice wedges in Mamontovy Klyk. Meteorological data show that mean annual temperature decreases from −8 to −15 °C along the latitudinal gradient from Western Yamal to Lena River delta. During MIS 2 the temperatures were 6–10 °C colder and similar latitudinal temperature gradient was similar to contemporary climatic conditions [47] resulting in very limited to no methanogens within the ice wedges.
4.2. Methane Concentrations in Frozen Sediments and Active Layer
Concentration of methane in frozen sediments varies depending on genesis, texture, age, and permafrost conditions (Table 2). The lowest methane concentrations, between 195 ppmV (0.11 mL/kg) and 147 ppmV (0.08 mL/kg) on average, were found in sands and sandy loams. The methane concentrations in marine clays are on average several times higher than in sands. Average concentration of methane in clays (or loams) were 3875 ppmV (2.02 mL/kg) in Mare-Salle and 1275 ppmV (0.67 mL/kg) in Salemal clays with individual samples having methane concentrations above 3000 ppmV. The obtained values are comparable with methane concentrations previously reported for non-frozen clays sampling from sediment cores on the South Kara Sea shelf, where methane concentrations were generally below 1000 ppm [48].
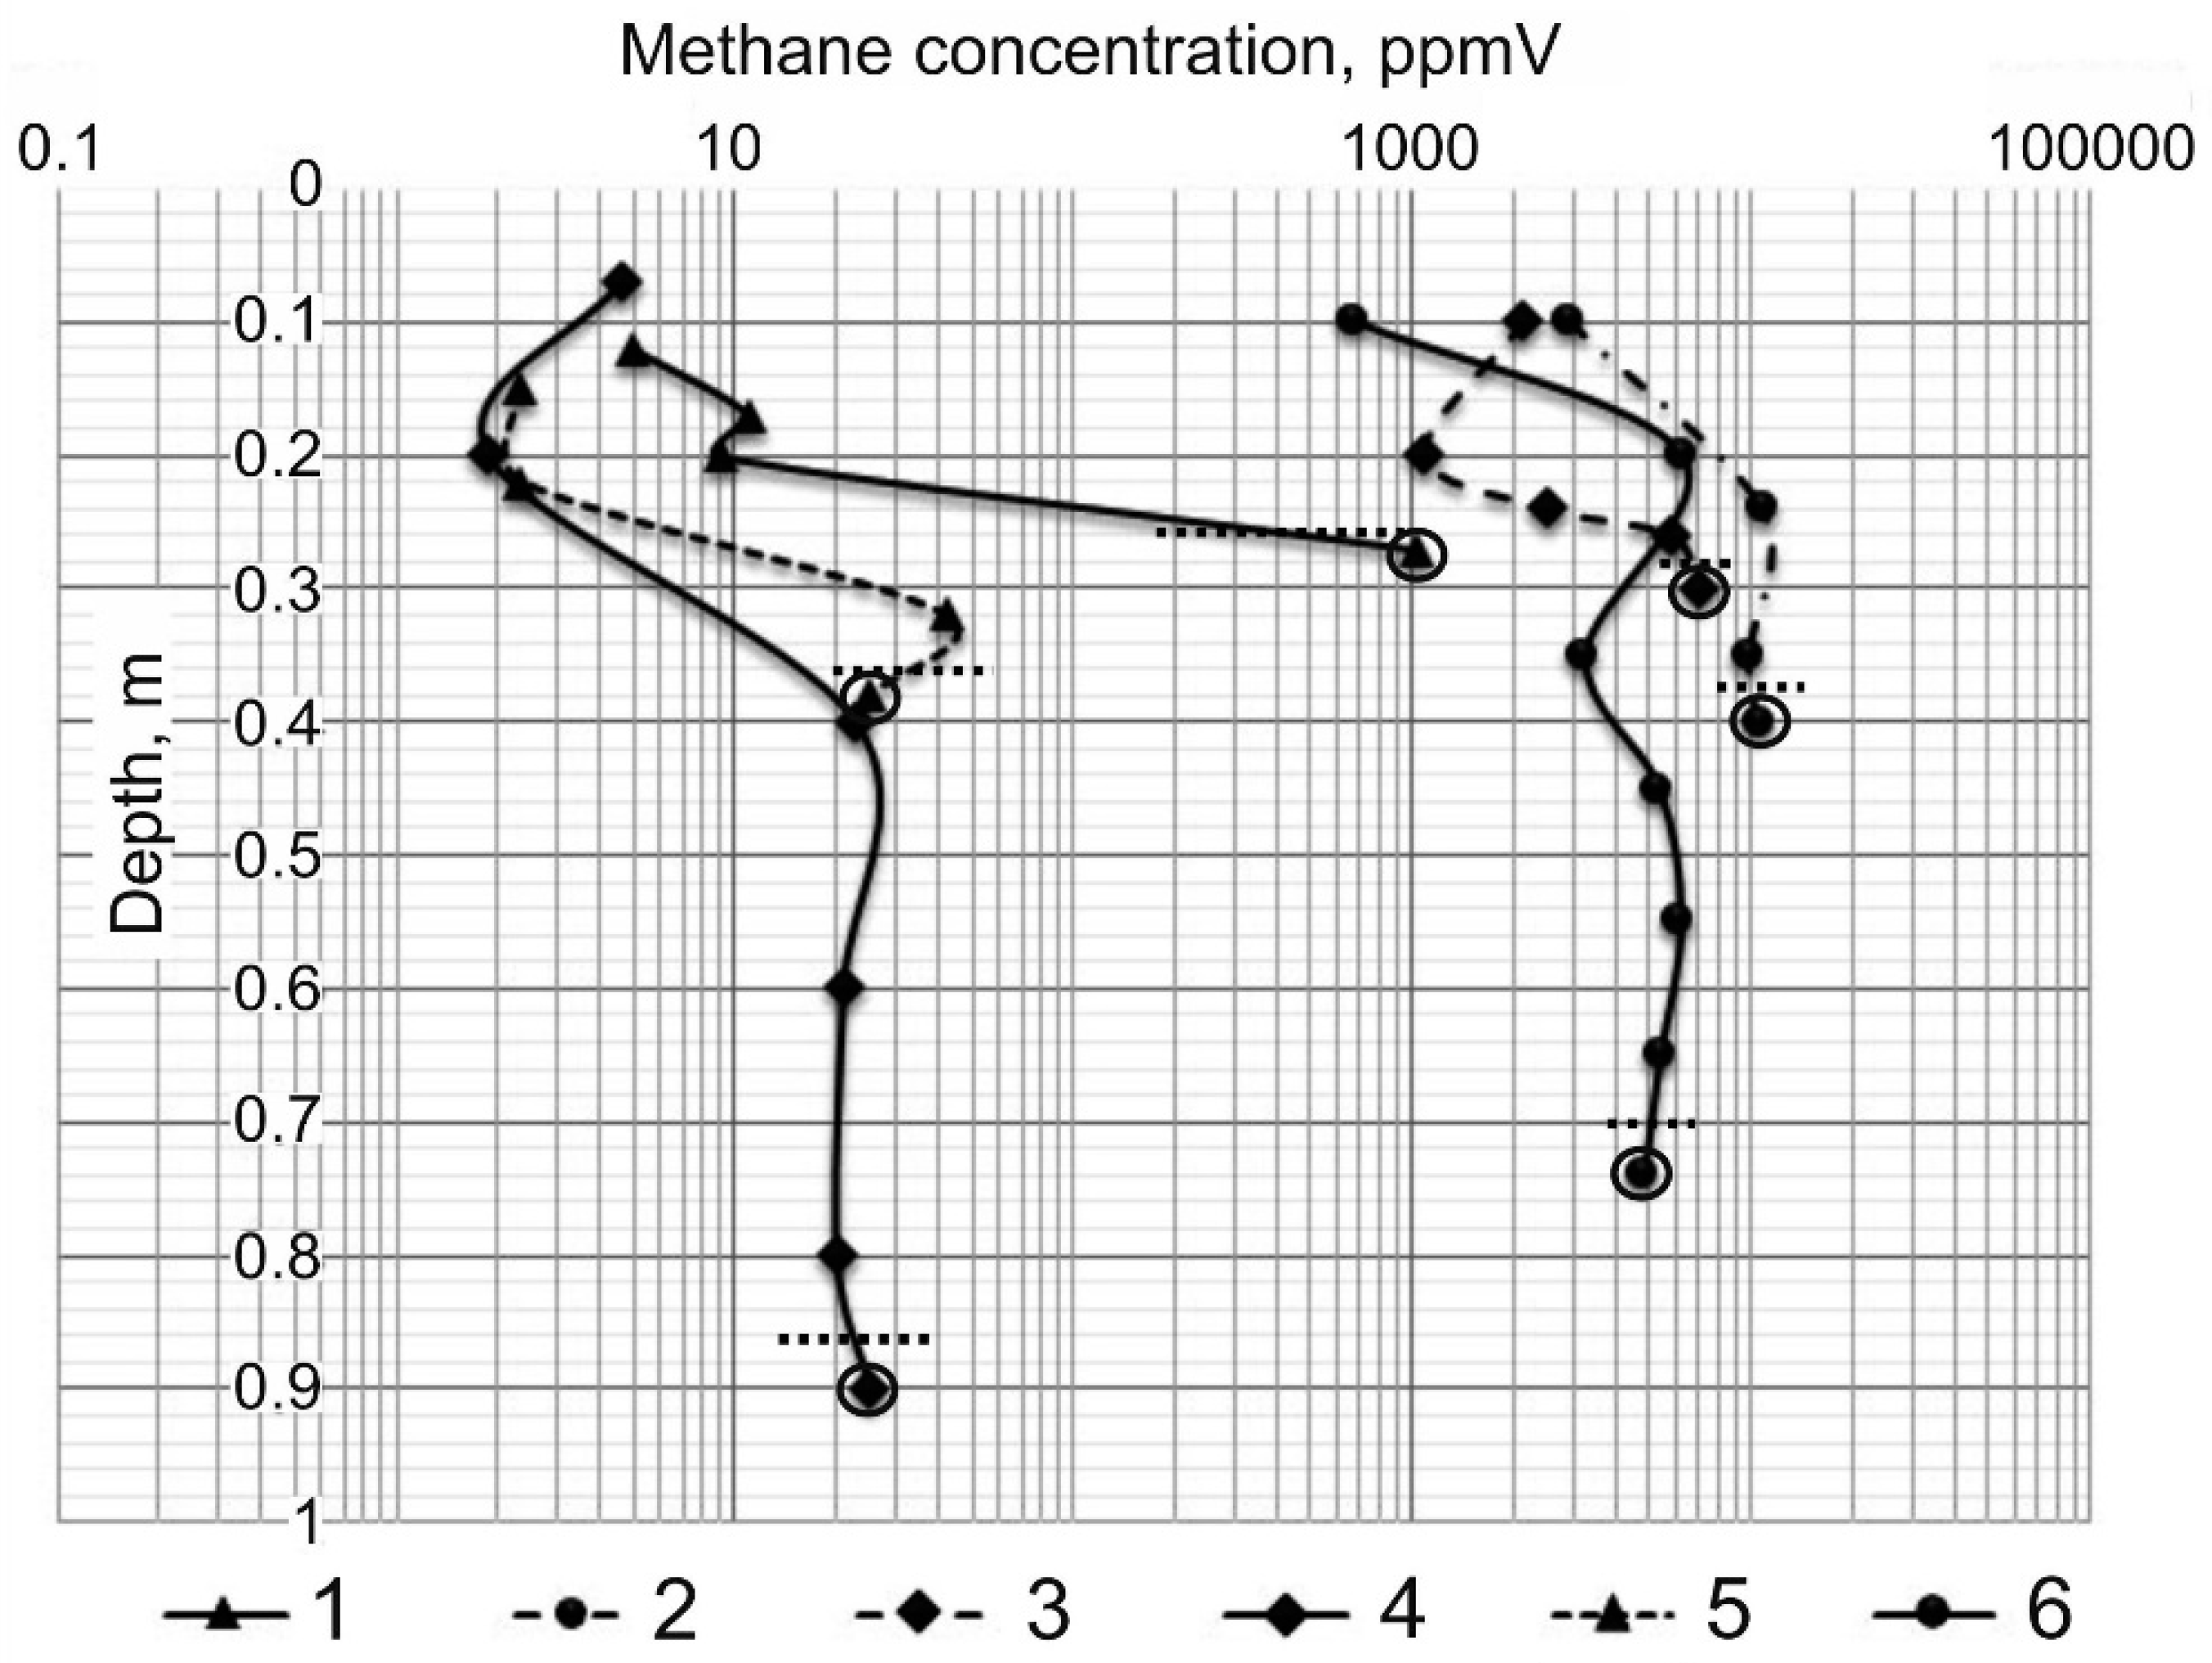
A detailed analysis of methane distribution with depth was conducted at Marre-Sale tidal flats and typical tundra landscapes. The distribution of methane concentration at the tidal flats showed high methane concentration near the surface (up to 1000 ppmV) and then gradual decrease with depth till the permafrost table previously estimated at 1.5–1.7 m depth [30,49]. Within permafrost, concentration of methane is from 15 to 75 ppmV, which is similar to the previous studies and can be considered as background values for the bottom sediments of the southwestern part of the Kara Sea region [48]. The total organic carbon content within the sediments is one of the limiting factors of methanogenesis (Figure 3). TOC below 0.8–0.9% corresponds to significantly lower methane concentrations. The methane concentration in the active layer of various types of landscape units varies depending on drainage. For typical tundra of Western Yamal methane concentrations vary from less than 20 ppmV in well drained sandy tundra and blowouts more than 3500 in water tracks and bogs (Table 3). The highest methane concentrations are characteristic for wet polygonal tundra landscapes and reach 8516 ppmV with single samples, methane concentration exceeded 10,000 ppmV (Figure 4).
Well-drained tundra landscapes with low methane concentrations occupy the majority of the area as evident from the land cover classification of the area, suggesting that only 30–40% (bogs, water tracks, wet polygonal tundra) of the study area has a potential for high methane emissions to the atmosphere. Unlike tidal flats, almost all landscapes are characterized by the increasing methane concentrations with depth and a maximum around the transient layer, the ice rich layer just below the active layer that is subject to thawing on decadal to millennial time scales (Figure 4). This distribution is similar to the one reported by [32] in Kolyma region and is likely to be typical of permafrost fine grained soils.
4.3. Methane Isotope Composition in Ground Ice and Frozen Sediments
Methane isotope composition from the MTGI showed that δ13С(CH4) varies from −62 to −74‰ with a mean of −68.6‰, while D(CH4) varies from −259 to −330‰. Collected samples of ground ice indicates to biological origin of the methane (Figure 5). Similar isotopic composition of GIW and MTGI suggests similar processes of methanogenesis in various ground ice types. The reported value δ13С(CH4) in methane collected from depth of 20–130 m at the Bovanenkovo Gas Field (Central Yamal) is −70‰ [9], which is similar to our results and further supports microbial origin of the methane in permafrost of Yamal Peninsula.
The active layer is characterized by heavier isotopic composition (δ13С(CH4) is −63.6 ± 5.6‰) relative to the permafrost (δ13С(CH4) is −68.6 ± 7.3‰). The isotopic compositions of the active layer become lighter with depth approaching composition of the permafrost (Figure 6). This suggests fractionation by bacterial oxidation of methane within the active layer. The fractionation further suggests that interpretations of abiogenic mantle methane which is commonly associated with enriched isotopic composition should be taken with caution in permafrost regions of the Kara Sea [33].
5. Conclusions
Methane concentration in ground ice and Quaternary sediments of the Kara Sea region have a substantial variability. High methane concentrations are found in marine clays with the presence of MTGI, where methane concentrations are the highest. The sands which freeze simultaneously with sedimentation have lower methane concentrations. Ground ice wedges are characterized by an order of magnitude less methane concentrations than MTGI, but several times higher than reported for ice of glacial origin.
Results of this study further support evidence of higher methane concentration in epigenetic relative to syngenetic permafrost, previously reported for the Eastern Siberia regions [7,16]. High concentrations of methane in permafrost is attributed to migration and conservation of methane in ice bubbles under advancing freezing fronts, which is supported by the isotopic content of methane. The microbial origin of methane confirms that methane in permafrost is not related to seepage or migration of mantle methane through permafrost [18,31]. It also confirms the non-atmospheric origin of massive tabular ground ice bodies widely present in the study area.
The highest mean methane concentrations were found in wet polygonal tundra (8516 ppmV), bogs (4507 ppmV) and bottoms of the water tracks (3681 ppmV). These types of landscapes, which together compose almost 40% of typical landscapes of Western Yamal can be a significant source of methane emissions to the atmosphere. The landscape types that are characterized by good drainage, primarily sands and blowouts, have little methane available.
Northwest Siberia has experienced one of the highest rates of climate change with increasing air temperatures, increased thaw depth and permafrost warming with these trends likely to continue in the future [52,53]. The upper part of the coasts in the region is composed by ice-rich marine clays characterized by high methane content. Permafrost degradation due to climate change will be exacerbated along the coasts where declining sea ice is likely to result in accelerated rates of coastal erosion, especially in areas with presence of MTGI, further releasing the methane which is not yet accounted for in the models [54]. The estimates of methane in various types of permafrost and ground ice are therefore an important contribution in regional assessments of the methane emissions from permafrost and as validation to the Earth System Models. The stable isotope analysis of methane as an indicator of ground ice formation can be a useful tool in the paleo reconstructions, particularly in the areas where the glacial versus marine origins of massive ground ice are still debated.
Supplementary Materials
The following are available online at https://www.mdpi.com/2076-3263/8/12/434/s1, Figure S1: Methane concentration in typical permafrost sediments of the study region (presented as box-plots). Figure S2: Methane concentration in air bubbles of ground ice wedges (GIW) and massive tabular ground ice (MTGI) of Marre-Sale and Sopochnaya Karga (presented as box-plots).
Author Contributions
A.A.V. acquired funding for the work that created the foundation for the manuscript; the manuscript was conceptualized by I.D.S. and D.A.S.; field data were collected by I.D.S., A.A.V., G.E.O. All authors equally contributed to writing the manuscript. G.E.O. prepared the illustrations.
Funding
Field and laboratory work of this research was funded by RFBR according to the research project 18-05-60004, analytical work was funded by RFBR according to the research project 18-05-60080.
Acknowledgments
The authors thank many individuals who helped with collection of field data in logistically and climatically challenging conditions. We sincerely thank Elizaveta Rivkina who determined concentration of methane in the Institute of Physical, Chemical, and Biological Problems in Soil Science RAS; P.B. Semenov and Boris Vanshtein from VNIIokeangeologiya who made quality control of the samples; and Aleksandr Savichev from Institute of Microbiology RAS who determined δ13С(CH4) isotope composition of ground ice and permafrost. We are grateful to the three reviewers for their constructive comments which helped to substantially improve the quality of the manuscript.
Conflicts of Interest
The authors declare no conflict of interest. The funders had no role in the design of the study; in the collection, analyses, or interpretation of data; in the writing of the manuscript, or in the decision to publish the results.
References
- AMAP. Assessment 2015: Methane as an Arctic Climate Forcer; Arctic Monitoring and Assessment Programme (AMAP): Oslo, Norway, 2015; 139p. [Google Scholar]
- Shakhova, N.; Semiletov, I.; Sergienko, V.; Lobkovsky, L.; Yusupov, V.; Salyuk, A.; Salomatin, A.; Chernykh, D.; Kosmach, D.; Panteleev, G.; et al. The East Siberian Arctic Shelf: Towards further assessment of permafrost-related methane fluxes and role of sea ice. Philos. Trans. R. Soc. 2015, A373, 2014045. [Google Scholar] [CrossRef] [PubMed]
- Thornton, B.F.; Geibel, M.C.; Crill, P.M.; Humborg, C.; Mörth, C.-M. Methane fluxes from the sea to the atmosphere across the Siberian shelf seas. Geophys. Res. Lett. 2016, 43, 5869–5877. [Google Scholar] [CrossRef] [Green Version]
- Anisimov, O.A.; Zaboikina, Y.G.; Kokorev, V.A.; Yurganov, L.N. Vozmozhnye prichiny emissii metana na shelfe morey Vostochnoy Arktiki. Possible causes of methane release from the East Arctic seas shelf. Led I Sneg Ice Snow 2014, 2, 69–81. (In Russian) [Google Scholar]
- Olefeldt, D.; Turetsky, M.R.; Crilland, P.M.; McGuire, A.D. Environmental and physical controls on northern terrestrial methane emissions across permafrost zones. Glob. Chang. Biol. 2012, 19, 589–603. [Google Scholar] [CrossRef] [PubMed] [Green Version]
- Rivkina, E.M.; Gilichinskiy, D.A.; Fedorov-Davydov, D.G.; Rivkin, F.M.; Shcherbakova, V.M. Zakonomernosti Raspredeleniya Parnikovykh Gazov v Vechnomerzlykh Porodakh. (Regularities in the Distribution of Greenhouse Gases in Permafrost Rocks); Materialy Pervoy Konferentsii Geokriologov Rossii (Materials of the First Conference of Geocryologists of Russia); MGU: Moscow, Russia, 1996; Volume 4, pp. 157–162. (In Russian) [Google Scholar]
- Rivkina, E.M.; Gilichinskiy, D.A. Metan kak paleoindikator genezisa i dinamiki merzlykh tolshch. Methane as a paleo-indicator of genesis and dynamics of frozen sequences. Litologiya i Poleznyye Iskopayemyye Lithol. Miner. 1996, 4, 183–193. (In Russian) [Google Scholar]
- Rivkin, F.M. O Raspredelenii Metana v Merzlykh Porodakh na Territorii Bovanenkovskogo Gazokondensatnogo Mestorozhdeniya na Poluostrove Yamal. (The Distribution of Methane in Frozen Rocks in the Bovanenkovo Gas Condensate Field on the Yamal Peninsula); Itogi Fundamental’nykh Issledovaniy Kriosfery Zemli v Arktike i Subarktike. Results of Fundamental Research of the Earth’s Cryosphere in the Arctic and Subarctic; Nauka: Novosibirsk, Russia, 1997; pp. 168–173. (In Russian) [Google Scholar]
- Chuvilin, E.M.; Perlova, E.V.; Baranov, Y.B.; Kondakov, V.V.; Osokin, A.B.; Yakushev, V.S. Stroenie i Svoistva Porod Kriolitozony Yuzhnoy Chasti Bovanenkovskogo Gazokondensatnogo Mestorozhdeniya. (Structure and Properties of Permafrost in the Southern Part of the Bovanenkovskoye Gas Condensate Field); GEOS: Moscow, Russia, 2007; 137p. (In Russian) [Google Scholar]
- Vasilchuk, Y.K.; Krylov, G.V.; Podbornyu, E.E. Kriosfera neftekondensatnykh mestorozhdeny poluostrova Yamal. Cryosphere of oil and gas condensate fields of Yamal peninsula. Nedra 2006, 1, 347. (In Russian) [Google Scholar]
- Badu, Y.B.; Gafarova, N.A.; Podbornyu, E.E. Kriosfera Neftekondensatnykh Mestorozhdeny Poluostrova Yamal. (Cryosphere of Oil and Gas Condensate Fields of Yamal Peninsula); OOO “Gazprom Ekspo”: Moscow, Russia, 2013; Volume 2, 424p. (In Russian) [Google Scholar]
- Shakhova, N.; Semiletov, I.; Salyuk, A.; Yusupov, V.; Kosmach, D.; Gustafsson, Ö. Extensive methane venting to the atmosphere from sediments of the East Siberian Arctic shelf. Science 2010, 327, 1246–1250. [Google Scholar] [CrossRef] [PubMed]
- Rokos, S.I.; Kostin, A.D.; Dlugach, A.G. Svobodnyy Gaz i Mnogoletnyaya Merzlota v Osadkakh Verkhney Chasti Razreza Melkovodnykh Rayonov Shel’fa Pechorskogo i Karskogo Morey. (Free Gas and Permafrost in the Sediments of the Upper Part of the Section of the Shallow Areas of the Shelf of the Pechora and Kara Seas); Sedimentologicheskiye Protsessy i Evolyutsiya Morskikh Ekosistem v Usloviyakh Morskogo Periglyatsiala; Sedimentological Processes and Evolution of Marine Ecosystems in Marine Periglacial Conditions; Kola Scientific Center of the Russian Academy of Sciences: Apatity, Russia, 2001; pp. 40–51. (In Russian) [Google Scholar]
- Coffin, R.B.; Smith, J.P.; Plummer, R.E.; Yoza, B.; Larsen, R.K.; Millholland, L.C.; Montgomery, M.T. Spatial variation in shallow sediment methane sources and cycling on the Alaskan Beaufort Sea Shelf Slope. Mar. Pet. Geol. 2013, 45, 186–197. [Google Scholar] [CrossRef]
- Portnov, A.; Mienert, J.; Serov, P. Modeling the evolution of climate-sensitive Arctic subsea permafrost in regions of extensive gas expulsion at the West Yamal shelf. J. Geophys. Res. Biogeosci. 2014, 119, 2082–2094. [Google Scholar] [CrossRef] [Green Version]
- Rivkina, E.M.; Krayev, G.N.; Krivushin, K.V.; Laurinavichyus, K.S.; Fedorov-Davydov, D.G.; Kholodov, A.L.; Shcherbakova, V.A.; Gilichinskiy, D.A. Metan v vechnomerzlykh otlozheniyakh severo-vostochnogo sektora Arktiki. Methane in the permafrost deposits of the northeastern sector of the Arctic. Kriosfera Zemli. Cryosphere Earth 2006, 10, 23–41. (In Russian) [Google Scholar]
- Cherbunina, M.Y.; Brushkov, A.V. Metan v Pozdnepleystotsenovom Ledovom Komplekse Tsentral’noy Yakutii (Mamontova Gora). (Methane in the Late Pleistocene Ice Complex of Central Yakutia (Mamontova Gora)); Materialy Pyatoy Konferentsii Geokriologov Rossii; Materials of the Fifth Conference of Russian Geocryologists; Universitetskaya Kniga: Moscow, Russia, 2016; Volume 3, pp. 168–173. (In Russian) [Google Scholar]
- Kurchatova, A.N.; Rogov, V.V. Formirovanie geokhimicheskikh anomaliy pri migratsii uglevodorodov v kriolitozone Zapadnoy Sibiri. Formation of geochemical anomalies in hydrocarbon migration in the permafrost zone of Western Siberia. Led I Sneg Ice Snow 2018, 58, 199–212. (In Russian) [Google Scholar] [CrossRef]
- Dallimore, S.R.; Collett, T.S. Intrapermafrost gas hydrates from a deep core hole in the Mackenzie Delta, Northwest Territories. Geology 1995, 23, 527–530. [Google Scholar] [CrossRef]
- St-Jean, M.; Lauriol, B.; Clark, I.D.; Lacelle, D.; Zdanowicz, C. Investigation of ice-wedge infilling processes using stable oxygen and hydrogen isotopes, crystallography and occluded gases (O2, N2, Ar). Permafr. Periglac. Process. 2011, 22, 49–64. [Google Scholar] [CrossRef]
- Melnikov, V.P.; Spesivtsev, V.I.; Kulikov, V.N. O Struynoy Degazatsii Uglevodorodov Kak Istochnike Novoobrazovaniy l’da na Shel’fe Pechorskogo Moray. (Degassing of Hydrocarbons as a Source of Ice Formation on the Shelf of the Pechora Sea); Itogi Fundamental’nykh Issledovaniy Kriosfery Zemli v Arktike i Subarktike. Results of Fundamental Research of the Earth’s Cryosphere in the Arctic and Subarctic; Nauka: Novosibirsk, Russia, 1997; pp. 259–269. (In Russian) [Google Scholar]
- Moorman, B.J.; Michel, F.A.; Wilson, A.T. Development of tabular massive ground ice at Peninsula Point. In Proceedings of the 7th International Conference on Permafrost, Yellowknife, NT, Canada, 23–27 June 1998; pp. 757–761. [Google Scholar]
- Lacelle, D.; Bjornson, J.; Lauriol, B.; Clark, I.D.; Troutet, Y. Segregated intrusive ice of subglacial meltwater origin in retrogressive thaw flow headwalls. Quat. Sci. Rev. 2004, 23, 681–696. [Google Scholar] [CrossRef]
- Cardyn, R.; Clark, I.D.; Lacelle, D.; Lauriol, B.; Zdanowicz, C.; Calmels, F. Molar gas ratios of air entrapped in ice: A new tool to determine the origin of relict massive ground ice bodies in permafrost. Quat. Res. 2007, 68, 239–248. [Google Scholar] [CrossRef]
- Lein, A.Y.; Leybman, M.O.; Savichev, A.S.; Miller, Y.M.; Pimenov, N.V. Izotopno–biogeokhimicheskiye osobennosti podzemnogo plastovogo l’da poluostrovov Yugorskogo i Yamal. Isotope-biogeochemical features of underground formation ice of the Yugorsk and Yamal peninsulas. Geokhimiya Geochem. 2003, 10, 1084–1104. (In Russian) [Google Scholar]
- Vasiliev, A.A.; Streletskaya, I.D.; Melnikov, V.P.; Oblogov, G.E. Methane in ground ice and frozen quaternary deposits of western Yamal. Dokl. Earth Sci. 2015, 465, 604–607. [Google Scholar] [CrossRef]
- Streletskaya, I.D.; Vasiliev, A.A.; Oblogov, G.E.; Semenov, P.B.; Vanshtein, B.G.; Rivkina, E.M. Metan v podzemnykh ldakh I merzlykh otlozheniyakh na poberezhe I shelfe Karskogo moray. Methane in ground ice and frozen sediments in the coastal zone and on the shelf of Kara Sea. Led I Sneg Ice Snow 2018, 58, 65–92. (In Russian) [Google Scholar] [CrossRef]
- Rivkina, E.M.; Samarkin, V.A.; Gilichinskiy, D.A. Metan v mnogoletnemerzlykh otlozheniyakh Kolymo-Indigirskoy nizmennosti. Methane in the permafrost sediments of the Kolyma-Indigirskaya lowland. Doklady Akademii Nauk. Proc. Natl. Acad. Sci. USA 1992, 323, 559–563. (In Russian) [Google Scholar]
- Wright, J.F.; Chuvilin, E.M.; Dallimore, S.R. Methane hydrate formation and dissociation in fine sands at temperatures near 0 °C. In Proceedings of the 7th International Conference on Permafrost, Yellowknife, NT, Canada, 23–27 June 1998; pp. 1147–1153. [Google Scholar]
- Vasiliev, A.A.; Melnikov, V.P.; Streletskaya, I.D.; Oblogov, G.E. Permafrost aggradation and methane production in low accumulative laidas (tidal flats) of the Kara Sea. Dokl. Earth Sci. 2017, 476, 1069–1072. [Google Scholar] [CrossRef]
- Kraev, G.; Schulze, E.-D.; Kholodov, A.; Chuvilin, E.; Rivkina, E. Cryogenic Displacement and Accumulation of Biogenic Methane in Frozen Soils. Atmosphere 2017, 8, 105. [Google Scholar] [CrossRef]
- Leibman, M.O.; Hubberten, H.-W.; Lein, A.Y.; Streletskaya, I.D.; Vanshtein, B.G. Tabular ground ice origin in the Arctic coastal zone: Cryolithological and isotope-geochemical reconstruction of conditions for its formation. In Proceedings of the 8th International Conference on Permafrost, Zurich, Switzerland, 21–25 July 2003; A.A. Balkema Publishers: Lisse, The Netherlands, 2003; Volume 1, pp. 645–650. [Google Scholar]
- Bondarev, V.L.; Mirotvorskiy, M.Y.; Zvereva, V.B.; Oblekov, G.I.; Shaydullin, R.M.; Gudzenko, V.T. Gazogeokhimicheskaya kharakteristika nadsenomanskikh otlozheniy poluostrova Yamal (na primere Bovanenkovskogo neftekondensatnogo mestorozhdeniya). Gaseogeochemical characteristics of the supernormal deposits of the Yamal Peninsula (on the example of the Bovanenkovo oil-condensate field). Geologiya, Geofizika i Razrabotka Neftyanykh i Gazovykh Mestorozhdeniy Geol. Geophys. Dev. Oil Gas Fields 2008, 5, 22–34. (In Russian) [Google Scholar]
- Forman, S.L.; Ingolfsson, O.; Gataullin, V.; Manley, W.F.; Lokrantz, H. Late Quaternary stratigraphy, glacial limits and paleoenvironments of Maresale area, western Yamal Peninsula, Russia. Quat. Res. 2002, 21, 1–12. [Google Scholar]
- Kanevskiy, M.Z.; Streletskaya, I.D.; Vasiliev, A.A. Zakonomernosti formirovaniya kriogennogo stroyeniya chetvertichnykh otlozheniy Zapadnogo Yamala (na primere rayona Marre-Sale). Regularities in the formation of the cryogenic structure of the Quaternary deposits of the Western Yamal (on the example of the Marre-Sale district). Kriosfera Zemli Cryosphere Earth 2005, 9, 16–27. (In Russian) [Google Scholar]
- Streletskaya, I.D.; Kanevskiy, M.Z.; Vasiliev, A.A. Plastovyye l’dy v dislotsirovannykh chetvertichnykh otlozheniyakh zapadnogo Yamala. Massive ground ice in dislocated Quaternary sediments of western Yamal. Kriosfera Zemli Cryosphere Earth 2006, 10, 68–78. (In Russian) [Google Scholar]
- Streletskaya, I.D.; Shpolyanskaya, N.A.; Kritsuk, L.N.; Surkov, A.V. Kaynozoyskiye otlozheniya Zapadnogo Yamala i problema ikh genezisa. Cenozoic deposits of the Western Yamal and the problem of their genesis. Vestnik Mosc. State Univ. Ser. 5 Geogr. 2009, 3, 50–57. (In Russian) [Google Scholar]
- Bassinot, F.C.; Labeyrie, L.L.; Vincent, E.; Quidelleur, X.; Shackleton, N.J.; Lancelot, Y. The astronomical theory of climate and the age of the Brunhes-Matuyama magnetic reversal. Earth Planet. Sci. Lett. 1994, 126, 91–108. [Google Scholar] [CrossRef]
- Streletskaya, I.D.; Vasiliev, A.A.; Oblogov, G.E.; Matyukhin, A.G. Izotopnyy sostav podzemnykh l’dov Zapadnogo Yamala (Marre-Sale). Isotopic composition of the underground ice of the Western Yamal (Marre-Sale). Led i Sneg Ice Snow 2013, 2, 83–92. (In Russian) [Google Scholar]
- Zagorskaya, N.G.; Yashina, Z.I.; Slobodin, V.Y.; Levina, F.M.; Belevich, A.M. Morskie neogen(?)-chetvertichnye otlozheniya nizov’ev reki Eniseya. Trudy NIIGA 1965, 144, 92. (In Russian) [Google Scholar]
- Streletskaya, I.D.; Gusev, E.A.; Vasiliev, A.A.; Oblogov, G.E.; Anikina, N.Y.; Arslanov, K.A.; Derevyanko, L.G.; Pushina, Z.V. Geokriologicheskoye stroyeniye chetvertichnykh otlozheniy beregov zapadnogo Taymyra. Geocryological structure of Quaternary sediments of the shores of western Taimyr. Kriosfera Zemli Cryosphere Earth 2013, 17, 17–26. (In Russian) [Google Scholar]
- Streletskaya, I.D.; Vasiliev, A.A.; Vanstein, B.G. Erosion of Sediment and Organic Carbon from the Kara Sea Coast. Arct. Antarct. Alp. Res. 2009, 41, 79–87. [Google Scholar] [CrossRef] [Green Version]
- Lazukov, G.I. Antropogen Severnoy Poloviny Zapadnoy Sibiri (Paleogeografiya). (Anthropogen of the Northern Part of Western Siberia (Paleogeography)); Izd-vo MGU. MSU Publishing House: Moscow, Russia, 1972; 250p. (In Russian) [Google Scholar]
- Baulin, V.V.; Shmelev, L.M.; Solomatin, V.I. O Sledakh Drevnikh Merzlotnykh Protsessov v Srednechetvertichnykh Otlozheniyakh Nizhnego Techeniya r. Obi. (On the Traces of Ancient Permafrost Processes in the Middle Quaternary Sediments of the Lower Reaches of the River Ob); Periglyatsial’nyye Yavleniya na Territorii SSSR. Periglacial Phenomena in the Territory of the USSR; Izd-vo MGU. MSU Publishing House: Moscow, Russia, 1960; pp. 206–219. (In Russian) [Google Scholar]
- Alperin, M.J.; Reeburgh, W.S. Inhibition experiments on anaerobic methane oxidation. Appl. Environ. Microbiol. 1985, 50, 940–945. [Google Scholar] [PubMed]
- Raynaud, D. The integrity of the ice record of greenhouse gases with a special focus on atmospheric. Ice Snow 2012, 2, 5–14. [Google Scholar] [CrossRef]
- Boereboom, T.; Samyn, D.; Meyer, H.; Tison, J.-L. Stable isotope and gas properties of two climatically contrasting (Pleistocene and Holocene) ice wedges from Cape Mamontov Klyk, Laptev Sea, northern Siberia. Cryosphere 2013, 7, 31–46. [Google Scholar] [CrossRef] [Green Version]
- Serov, P.; Portnov, A.; Mienert, J.; Semenov, P.; Ilatovskaya, P. Methane release from pingo-like features across the South Kara Sea shelf, an area of thawing offshore permafrost. Geophys. Res. Earth Surf. 2015, 120, 1515–1529. [Google Scholar] [CrossRef] [Green Version]
- Treat, C.C.; Susan, N.M.; Ernakovich, J.; Iversen, C.M.; Lupascu, M.; McGuire, A.D.; Norby, R.J.; Chowdhury, T.R.; Richter, A.; Šantrůčková, H.; et al. A pan-Arctic synthesis of CH4 and CO2 production from anoxic soil incubations. Glob. Chang. Biol. 2015, 21, 2787–2803. [Google Scholar] [CrossRef] [PubMed]
- Vasiliev, A.A.; Korostelev, Y.V.; Moskalenko, N.G.; Dubrovin, V.A. Izmerenie sezonno-talogo sloya v Zapadnoy Sibiri po programme CALM (baza dannykh) Measurement of active layer depth in Western Siberia under CALM program (data base). Kriosfera Zemli Earth’s Cryosphere 1998, 2, 87–90. [Google Scholar]
- Whiticar, M.J. Carbon and hydrogen isotope systematics of bacterial formation and oxidation of methane. Chem. Geol. 1999, 161, 291–314. [Google Scholar] [CrossRef]
- Streletskiy, D.A.; Anisimov, O.A.; Vasiliev, A.A. Permafrost degradation. In Snow and Ice-Related Risks, Hazards and Disasters; Haeberli, W., Whiteman, C., Eds.; Elsevier: Oxford, UK, 2014; pp. 303–344. [Google Scholar]
- Streletskiy, D.A.; Sherstukov, A.B.; Nelson, F.E.; Frauenfeld, O.W. Changes in the 1963–2013 shallow ground thermal regime in Russian permafrost regions. Environ. Res. Lett. 2015, 10, 125005. [Google Scholar] [CrossRef] [Green Version]
- Bohn, T.J.; Melton, J.R.; Ito, A.; Kleinen, T.; Spahni, R.; Stocker, B.D.; Zhang, B.; Zhu, X.; Schroeder, R.; Glagolev, M.V.; et al. WETCHIMP-WSL: Intercomparison of wetland methane emissions models over West Siberia. Biogeosciences 2015, 12, 3321–3349. [Google Scholar] [CrossRef] [Green Version]
Figure 1.
Study area map showing the location of three study key sites.

Figure 2.
Stratigraphic profiles at two study sites: (a)—Marre-Sale; (b)—Sopochnaya Karga. 1—marine clays and loams; 2—alluvial and lacustrine sandy and sandy-loams; 3—alluvial, lacustrine and aeolian sands; 4—peat deposits; 5—ground ice wedges; 6—massive tabular ground ice; 7—age (indexes correspond to the Quaternary general stratigraphic scale); 8—boundaries; 9—location of sampling profiles (samples collected during (a)—2012–2015, (b)—2016–2017). Profiles are built on the basis of the previous works of the authors [35,36,37,38,39,41].

Figure 3.
Concentration of methane in frozen sediments versus total organic carbon content at the Marre-Sale site.
Figure 3.
Concentration of methane in frozen sediments versus total organic carbon content at the Marre-Sale site.

Figure 4.
Methane content in the active layer and upper permafrost of the typical landscape units characteristic to the Marre-Sale site (august, 2017): 1—wet tundra; 2—wet polygonal tundra; 3—water tracks; 4—sand blowouts; 5—well-drained tundra; 6—bogs. The horizontal dotted lines show the active layer depths. Samples obtained from frozen soils are marked with circles.

Figure 5.
Methane isotope composition (black circles) of gas bubbles collected from MTGI of the Marre-Sale site on the CD-diagram by Whiticar [51] for the classification of microbial and thermogenic natural gas, depending on the ratio of isotopes δ13С (methane) and D (methane).
Figure 5.
Methane isotope composition (black circles) of gas bubbles collected from MTGI of the Marre-Sale site on the CD-diagram by Whiticar [51] for the classification of microbial and thermogenic natural gas, depending on the ratio of isotopes δ13С (methane) and D (methane).

Figure 6.
Distribution of δ13С(CH4) values with depth at the Marre-Sale site in different landscape unit types: 1—water tracks; 2—wet tundra; 3—bog; 4—active floodplain; 5—tidal flats.
Figure 6.
Distribution of δ13С(CH4) values with depth at the Marre-Sale site in different landscape unit types: 1—water tracks; 2—wet tundra; 3—bog; 4—active floodplain; 5—tidal flats.


Table 1.
Methane concentration (ppmV) in air bubbles of ground ice wedges (GIW) and massive tabular ground ice (MTGI) of Marre-Sale and Sopochnaya Karga.
Table 1.
Methane concentration (ppmV) in air bubbles of ground ice wedges (GIW) and massive tabular ground ice (MTGI) of Marre-Sale and Sopochnaya Karga.
| Age and Genesis of Ice | Marre-Sale | Sopochnaya Karga |
|---|---|---|
| Holocene GIW | 146(241)/927/2 1 | 74(89)/207/7 |
| Late Pleistocene GIW | 40(82)/357/2 | 55(30)/90/24 |
| MTGI first type | 1413(2437)/9182/2 | 301(534)/1177/6 |
| MTGI second type | 558(1300)/4663/12 | NA |
1 Mean (standard deviation), maximum and minimum concentration.
Table 2.
Methane concentration (ppmV) in typical permafrost sediments of the study region.
| Age and Genesis | Marre-Sale | Salemal |
|---|---|---|
| MIS 1, sands | 147(170)/620/2 1 | |
| MIS 2, sands and sandy loams | 195(265)/875/2 | |
| MIS 2-3, sandy loam, loams | 269(689)/3482/2 | |
| MIS 5, loams and clays | 3875(3468)/13541/4 | |
| MIS 6, clay | 1275(1210)/3037/48 |
1 Mean (standard deviation), maximum and minimum concentration.
Table 3.
Spatial variability of the methane in the active layer of various types of landscape units characteristic of typical tundra of the Marre-Sale site.
Table 3.
Spatial variability of the methane in the active layer of various types of landscape units characteristic of typical tundra of the Marre-Sale site.
| Landscape Unit Type and Percent Coverage [50] | Well-Drained Tundra (33%) | Wet Tundra (17%) | Bogs (16%) | Water Tracks (11%) | Sand Blowouts (11%) | Wet Polygonal Tundra (9%) |
|---|---|---|---|---|---|---|
| Soil texture | Silt | Silty clay | Silt | Silt | Sand | Silty clay |
| Active layer thickness, m | 1.2 | 0.7 | 0.7 | 0.6 | 1.8 | 0.4 |
| Volumetric moisture content, % | 30.3 | 36.4 | 48.2 | 47.2 | 25.6 | 46.4 |
| Ground surface temperature, °C | 6-7 | 7-9 | 7-8 | 6-8 | 8-9 | 7-9 |
| Organic carbon content, % | 0.45 | 1.26 | 0.68 | 4.5 | 0.34 | 1.12 |
| Mean methane content in the active layer, ppmV | 18 | 263 | 4507 | 3681 | 16 | 8516 |
| Near-surface methane concentration in the air, ppmV | 2.1 | 2.2 | 4.02 | 3.82 | - | 6.67 |
© 2018 by the authors. Licensee MDPI, Basel, Switzerland. This article is an open access article distributed under the terms and conditions of the Creative Commons Attribution (CC BY) license (http://creativecommons.org/licenses/by/4.0/).
Share and Cite
MDPI and ACS Style
Streletskaya, I.D.; Vasiliev, A.A.; Oblogov, G.E.; Streletskiy, D.A. Methane Content in Ground Ice and Sediments of the Kara Sea Coast. Geosciences 2018, 8, 434. https://doi.org/10.3390/geosciences8120434
AMA Style
Streletskaya ID, Vasiliev AA, Oblogov GE, Streletskiy DA. Methane Content in Ground Ice and Sediments of the Kara Sea Coast. Geosciences. 2018; 8(12):434. https://doi.org/10.3390/geosciences8120434
Chicago/Turabian StyleStreletskaya, Irina D., Alexander A. Vasiliev, Gleb E. Oblogov, and Dmitry A. Streletskiy. 2018. "Methane Content in Ground Ice and Sediments of the Kara Sea Coast" Geosciences 8, no. 12: 434. https://doi.org/10.3390/geosciences8120434
Note that from the first issue of 2016, this journal uses article numbers instead of page numbers. See further details here.