Forecast of Gas Hydrates Distribution Zones in the Arctic Ocean and Adjacent Offshore Areas
by
Vasily Bogoyavlensky
1,2,*, 
Aleksei Kishankov
1,2,
Alisa Yanchevskaya
2 and
Igor Bogoyavlensky
1,2 1
Oil and Gas Research Institute of the Russian Academy of Sciences, 3, Gubkina St., 119333 Moscow, Russia
2
Gubkin Russian State University of Oil and Gas (National Research University), 65, Leninsky Prospekt, 119991 Moscow, Russia
*
Author to whom correspondence should be addressed.
Geosciences 2018, 8(12), 453; https://doi.org/10.3390/geosciences8120453
Submission received: 12 October 2018
/
Revised: 29 November 2018
/
Accepted: 1 December 2018
/
Published: 4 December 2018
(This article belongs to the Special Issue Gas and Gas Hydrate in Permafrost)
Abstract
:Gas hydrates (GH) are perspective energy sources, containing significantly more gas resources compared with conventional fields. At the same time, GH pose a danger for exploration and production of hydrocarbon fields. Methane release to the atmosphere is also a substantial factor of climate change. The objective of this research was the forecast of distribution of zones, favorable for GH existence in the Arctic Ocean and adjacent offshore areas, limited by the 45° latitude. For conducting research, existent data of National Oceanic and Atmospheric Administration (NOAA) on near-bottom water temperatures was analyzed. Using CSMHYD software, based on empirical equations of GH stability, minimal depths appropriate for methane hydrates formation at different temperatures were calculated. On the basis of obtained values, a cartographic scheme with a zone favorable for methane hydrates existence was created. The zone corresponded to distribution of BSRs defined in seismic sections, including those discovered for the first time on the continental slope of the Laptev Sea and in the TINRO Depression of the Sea of Okhotsk. Besides, the zone concurred with the results of other authors research, summarized in the geoinformation system “AWO” (The Arctic and the World Ocean), which could verify the validity of conducted forecast.
Keywords:
gas hydrates; methane; methane hydrates; Arctic; Arctic Ocean; World Ocean; Gulf Stream; pockmarks; CDP seismic; BSR1. Introduction
It is widely accepted that the World Ocean, including its part in the Arctic, contains significant resources of liquid and gas hydrocarbons (HC) [1,2,3,4,5]. However, apart from conventional HC, there are also giant resources of gas hydrates (GH). The latter, according to various estimates, including those of the United States Geological Survey (USGS) and Energy Information Administration (EIA), contain from 280 to 2800 trillion cubic meters of gas, substantially exceeding world total conventional gas resources [6]. This is why GH studying is undoubtedly important in terms of supplying humankind with energy in future. GH are solid compounds, formed as a result of interaction of gas with water at enhanced pressures and decreased temperatures. Thickness of GH stability zone depends on such parameters, as seafloor water temperature, pressure, gas composition, salinity of water, geothermal gradient [7,8,9].
Discoveries in the Arctic Ocean and other regions of the World Ocean, made by different organizations, including institutes of Russian Academy of Sciences, in past two decades, demonstrate lack of existing knowledge not only on deep formations, but also on structure of the bottom and processes occurring in the upper part of geological section (depths up to 500–900 m) [1,2,8,9,10,11,12,13,14,15,16,17,18,19,20,21,22,23,24,25,26,27,28,29,30,31,32,33,34,35,36,37,38,39,40,41,42,43,44,45,46,47,48,49,50,51,52,53,54,55,56,57,58,59,60]. In many regions of the World Ocean, including offshore areas of the Arctic, bottom zones with numerous pockmarks have been revealed. Pockmarks are craters of gas blowout, often containing fragments of ejected rocks [2,12,23,33]. On the land part of the Russian Federation Arctic Zone, in the north of the West Siberian Oil and Gas Province, on the Yamal Peninsula, ca. 300 lakes with up to hundreds and, occasionally, thousands of such craters in the bottom have been discovered. Apart from this, onshore Russian Federation Arctic Zone, more than 10 giant craters have been found, many of which had appeared as a result of explosion and flaming of gas, blown from subsurface [2,14,60]. All these craters serve as evidence of active degassing of deposits. The sources of degassing may be either free gas accumulations or GH, genesis of gas can be biogenic, catagenic or mixed [33].
GH stability zone in the World Ocean corresponds to bottom depths from 200 m for polar regions and from 500–700 m for equatorial conditions [42]. Organic matter is accumulated mainly on peripheral zones of the oceans, such as shelves and continental slopes. Much less organic matter is deposited within abyssal plains of deep ocean zones. Therefore, the most favorable locations of GH occurrence include zones of deep shelf and continental slope. According to recent evaluations, 97% of all GH reserves are concentrated offshore, whereas only 3% refer to land areas [42].
In spite of great value of GH, they pose danger for exploration and production of conventional HC resources, especially in zones of permafrost (PF) existence. Decreasing of pressure and increasing of temperature during well drilling in areas of GH distribution cause their dissociation into gas and water, which may result in accidents and even disasters, including gas blowouts and explosions [2,15,23]. Man-made GH formation in wells and pipelines is a major problem of petroleum production in the Arctic and deep zones of the World Ocean.
Besides, GH may play an important role in global climate change on the Earth, which may lead to catastrophic consequences, as methane is a stronger greenhouse gas than CO2. Extensive emission of methane from GH into atmosphere can result in global warming [29,37,51]. This may initiate additional methane emission. Possible volumes of GH dissociation, connected with change of climatic conditions, were estimated in numerous studies [8,9,44,49,55,57,60]. GH, as well as PF, serve as a cap rock for subvertically migrating free gas, which can form large accumulations under GH deposits, also migrate laterally and blow out through permeable zones (taliks) to surface, forming giant craters. Additionally, existence of regional seals, consisting of PF or GH, leads to occurrence of gas-saturated zones with anomalously high pore pressures, that are dangerous for well drilling.
Concerning the significance of forecast of GH distribution zones in the World Ocean, complex research was conducted for the northern part of the Earth, limited by the 45° latitude, including analysis of existing thermobaric conditions, results of which are described below. The research is a logical continuation of studies, conducted earlier by the authors, for northern offshore areas limited by the 64° latitude [19].
2. Materials and Methods
2.1. Overview of Gas Hydrates Indications in the Arctic
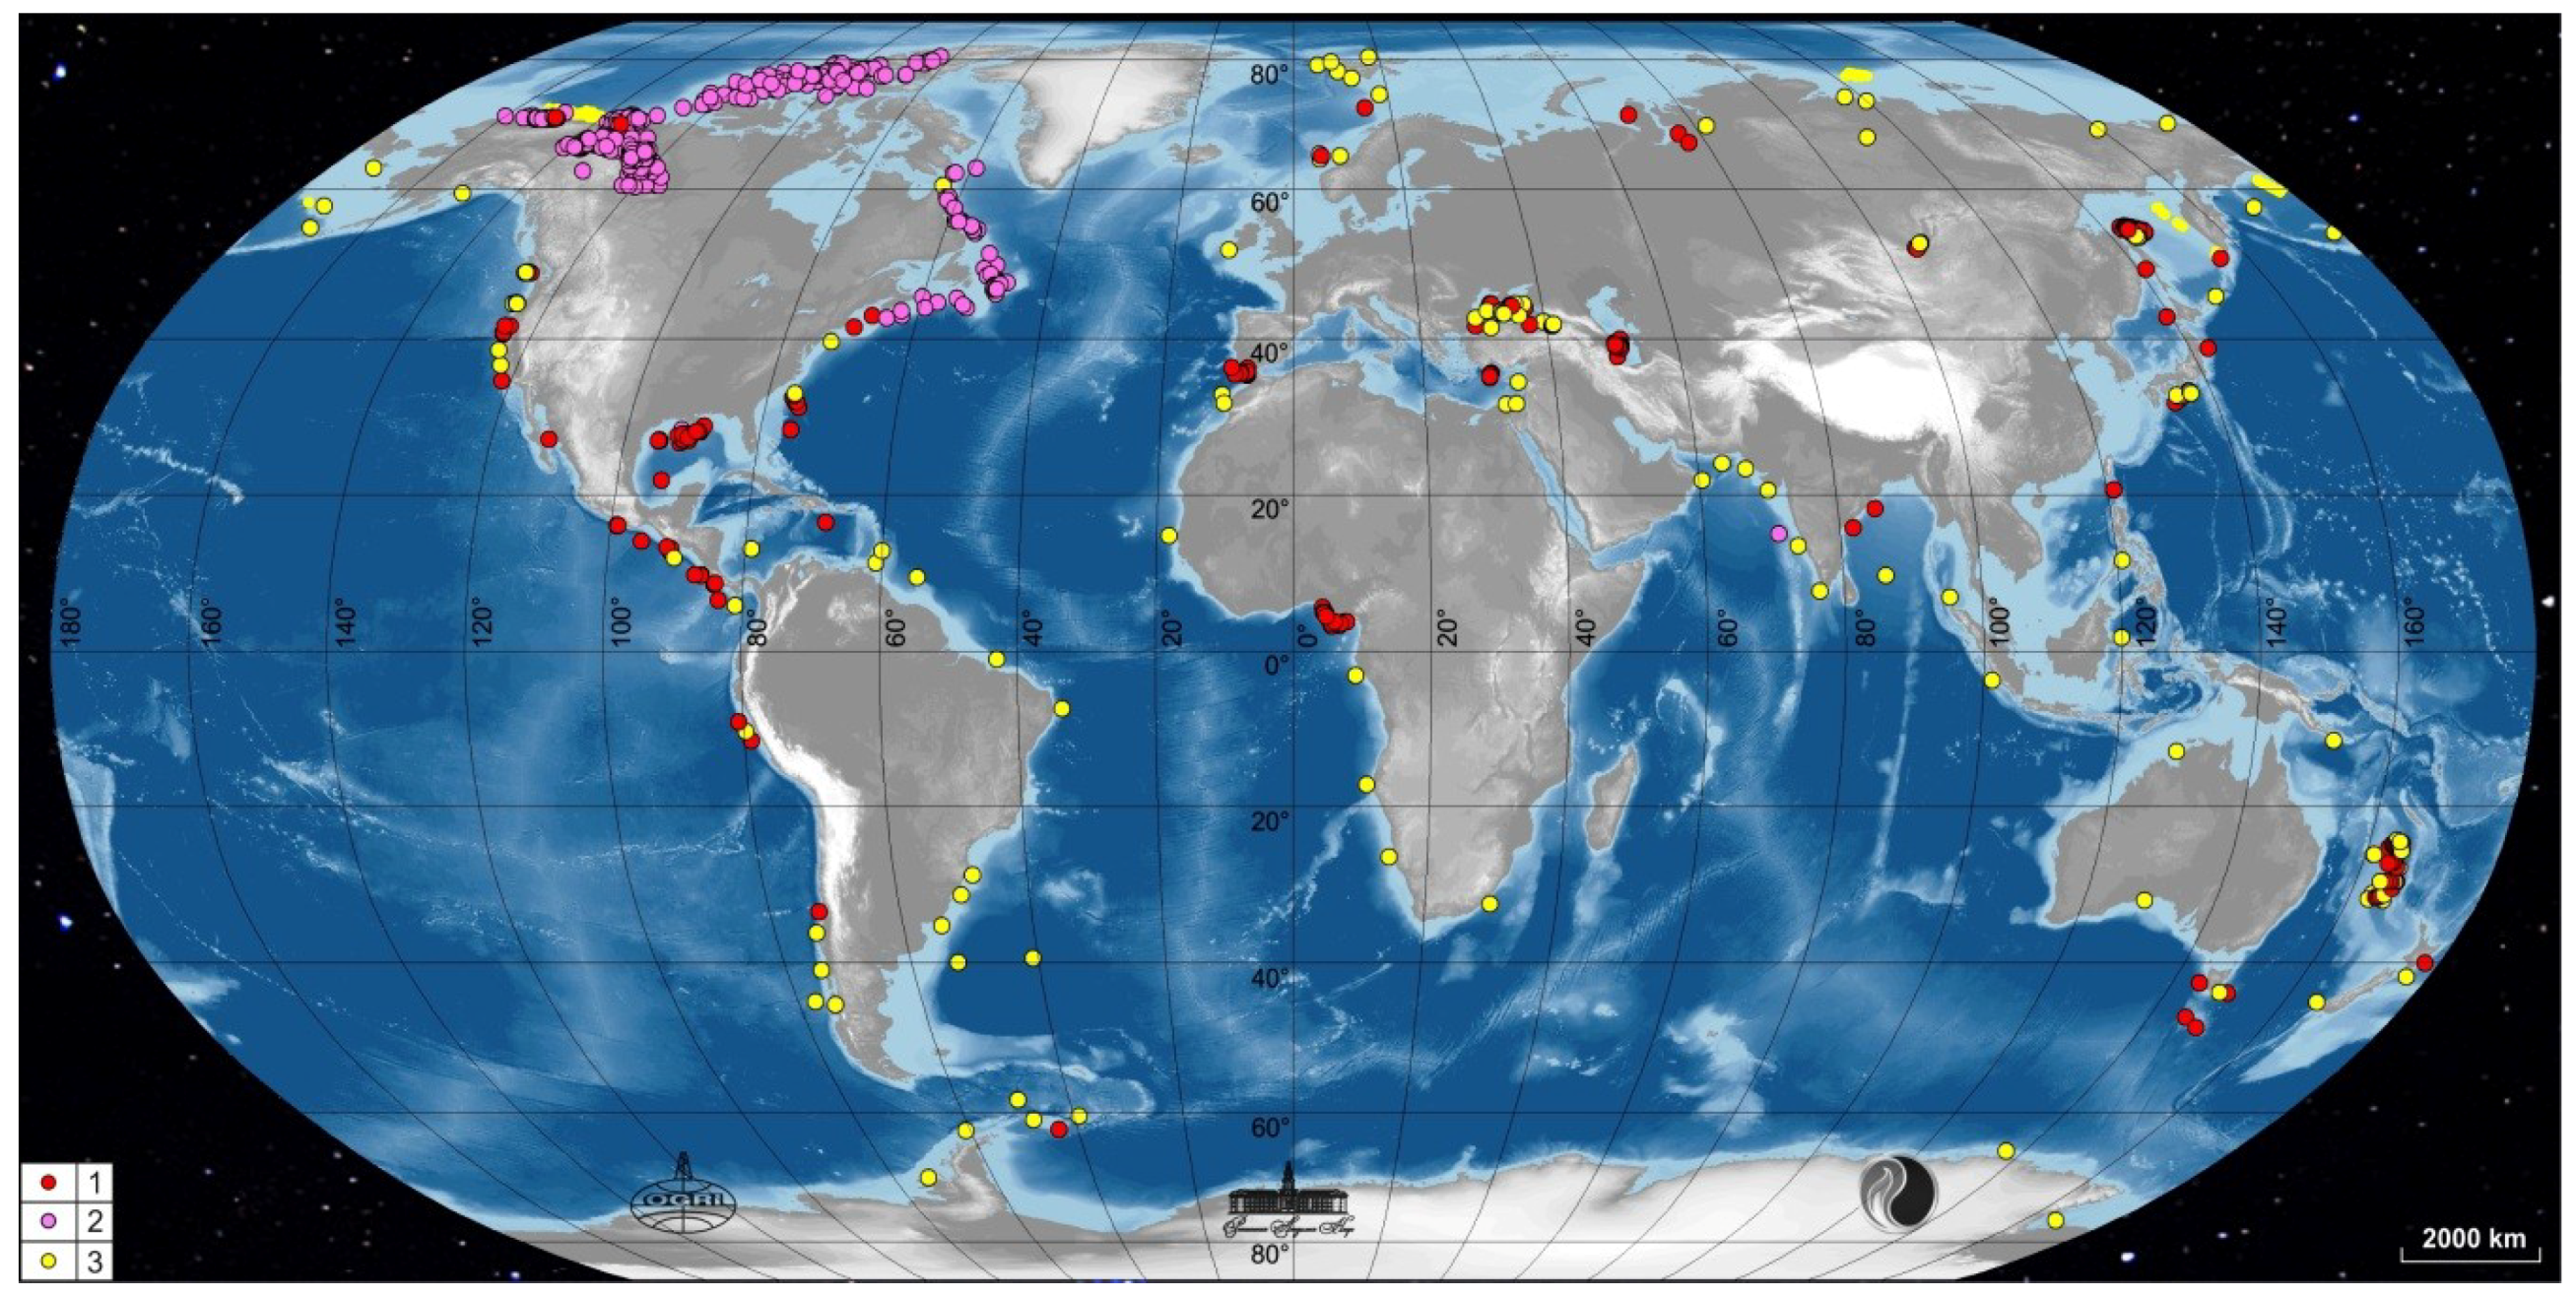
During continuous collecting, studying and systematization of existing data on GH distribution, the geoinformation system “The Arctic and the World Ocean” (GIS “AWO”) was created by the authors of the present research [2,13,14,15,16,17,18,19]. This system significantly complements previously created database [10,26,38] and contains information on 1153 objects (large zones and local areas) of confirmed (476) and possible (677) GH occurrence, predicted with different levels of probability by log data (466) and other indirect evidence (211) Distribution of these objects is demonstrated in Figure 1, created on the base of data of General Bathymetric Chart of the Oceans (GEBCO) [61]. Among 211 objects defined by indirect evidence, there are several zones and areas, where GH are forecasted by separate independent studies. Particularly, four seismic sections were analyzed for the continental slope of the Laptev Sea and 20 seismic sections—for the Beaufort Sea. In the opinion of the authors, GIS “AWO” is the world most complete database, summarizing hundreds of different sources of information on GH distribution [1,2,8,9,10,11,12,13,14,15,16,17,18,19,20,21,22,23,24,25,26,27,28,29,30,31,32,33,34,35,36,37,38,39,40,41,42,43,44,45,46,47,48,49,50,51,52,53,54,55,56,57,58,59,60].
As a result of special programs of the World Ocean research, GH samples were collected from bottom of different offshore areas. Also, GH were revealed in cores of wells, located both onshore and offshore, including wells in the zone of Prudhoe Bay—Kuparuk River in Alaska (Mount Elbert-1, NW Eileen St-2, Kuparuk St-1 (BP), Beechy St-1, KRU 1H-6 and others) (red dots in Figure 1) [2,22]. GH existence on the Mallik Field on the Beaufort Sea coast was confirmed by drilling of four wells—one in 1998 and three in 2002 [22]. The first experiments on gas production from GH saturated formations were conducted there by the international consortium (Japan—JNOC and Japex, Canada—GSC and USA—USGS).
On the basis of GH existence evidence in certain wells in the Arctic, there were defined criteria of GH indication on log data (high velocities and electric resistivities, enhanced gas content in drilling mud and others) [40]. As a result of analysis of data from the North Slope of Alaska and adjoining areas, highly probable GH existence was proposed for 50 out of 445 wells [21]. Up to six GH saturated layers were detected with top depths ranging from 207 m to 255 m and base depths from 423 to 1036 m. It is worth noting, that the minimum depth of PF base is 286 m, the maximum depth is 616 m. In the well Prudhoe Bay Unit R-1, GH were revealed in the most continuous interval 829 m within depths 207–1036 m. It was confirmed that in the majority of wells, GH were composed of not only biogenic, but also catagenic gas, which had migrated from deep formations. Thus, the fact of wide GH distribution on the North Slope of Alaska is justified.
According to data of Geological Society of Canada (GSC), GH exist with different levels of probability in 416 out of 661 wells in the Arctic regions of Canada, including land areas (North-West territories, Yukon, Canadian Arctic Archipelago and Mackenzie River delta), the Beaufort Sea and the Atlantic Ocean [53]. In total, 466 wells are characterized with highly probable GH existence, they are marked with pink dots on the map (Figure 1).
Offshore Northern Norway, GH were revealed in bottom sediments, collected during several expeditions in the Norwegian Sea, including the area of Haakon Mosby Mud Volcano on depth ca. 1250 m and on the bottom of the Nyegga Pockmark [48].
Determination of GH indirect evidence mainly consists in analysis of seismic common depth point (CDP) time sections, in which Bottom Simulating Reflector (BSR) can be recognized. BSR is characterized by phase inverse, conformity to sea bottom and intersection of sedimentation bedding. Phase inversion occurs because of lower acoustic impedance of porous rocks, filled with free gas, located immediately below GH saturated layer [10,17,38]. Usually, dim reflections are observed above BSR and bright reflections are seen below.
Thermobaric conditions for GH formation exist on most part of the Arctic Ocean and almost on the entire Russian Arctic Shelf, including the area of the giant Shtokman Field (73.162° N, 43.91° E), with estimated gas reserves of 4 trillion cubic meters, in the Barents Sea. Bottom temperature in this area, on depth of 300 m, is negative (ca. −1 °C) [43]. This fact significantly complicates the project of this field development, since it causes additional problems, connected with possible formation of technogenic GH in wells and subsea pipelines.
Apart from favorable thermobaric conditions for current formation and conservation of GH, there is also an area of predicted subaquatic PF distribution on the Arctic Shelf, which serves as a zone of GH metastability. Due to the effect of self-preservation, relic GH may exist within this zone [32,56,59]. Considering World Ocean level rise by ca. 120 m, caused by global warming after the Last Glacial Maximum and thawing of thick (up to 2–3 km) ice sheets, relic metastable GH can be predicted for depths to 120 m [45,62]. The process of subaquatic PF degradation has finished in certain locations (e.g., in areas of warm currents influence), however, on vast shelf zones, PF has not degraded completely due to negative temperatures of near-bottom water. There are known studies of distribution of PF and associated GH within the areas of the Laptev and the East-Siberian seas [50], which involved modeling of PF and GH stability zone thickness, considering boundary conditions of different geological factors and geothermal gradient. Results of the modeling demonstrated that in the mentioned areas, continuous PF exists at bottom depths to 60 m. On greater depths, PF becomes discontinuous.
As Russian Arctic Shelf is characterized by vast area and wide distribution of cryolithic zone, it is reasonable to propose that the largest resources of not only conventional HC, but also GH, are concentrated there. Nevertheless, GH existence has not been confirmed for any Russian Arctic offshore areas yet, whereas onshore, GH are predicted with different levels of probability in few locations, and on the Bovanenkovo and Yamburg fields they have been confirmed by core samples. On the Messoyakha Field, GH existence is forecasted, although direct evidence has not been revealed [31]. These facts, however, do not affirm rarity of GH. Actually, they demonstrate lack of special prospecting studies. Traditional well drilling technologies, oriented at deep formations, do not assume determination of GH existence. At the same time, as a result of intended studies within other offshore areas of Russia and CIS, GH were detected in a number of zones of the Sea of Okhotsk, the Caspian Sea, the Black Sea and also on the bottom of the Baikal Lake [24,25,30,36].
2.2. Ocean Bottom Temperatures Analysis
For the forecast of GH distribution zones in shallow deposits of the World Ocean, information on existing thermobaric conditions in near-bottom water is essential. These conditions depend on bottom depth, Earth heat flow, thermohaline currents.
The central object of the studied megaregion is the Arctic Ocean, bordered by the northern coasts of Eurasia and North America. The Arctic Ocean has the widest continental shelf among other oceans. Most part of the ocean is covered with ice, partially melting in summer. The Arctic Ocean is connected to the Pacific by the Bering Strait, and to the Atlantic by the Greenland and Norwegian seas [63]. The most intensive exchange of the Arctic Ocean water masses occurs with those of the Atlantic Ocean.
Rate of solar radiation causes impact on temperatures of atmosphere and upper part of hydrosphere, depending on the season. Yet deep and near-bottom water masses are actually not affected by seasonal temperature changes on the surface. Temperature regime of ocean water in the Northern Hemisphere, particularly, in some Arctic regions, is influenced by the Gulf Stream warm current and its continuation known as the North Atlantic Current. The current width occasionally reaches 150 km, and the speed is up to 7 km h [64]. Water masses of this current submerge in the northern part of the Atlantic Ocean, due to cooling, and form a current in the opposite direction, reaching the Indian and the Pacific oceans. There, water gradually moves upwards, as a result of heating, and flows in reverse direction, thus forming the Ocean Conveyor [65]. Due to lack of solar energy coming to the Arctic, and downward migration of saline waters, cooled as a result of ice formation [66], temperatures near seafloor in the Arctic Ocean are mainly negative, excluding the zone where the North Atlantic Current affects the Barents Sea. Because of the current, the western and central parts of the Barents Sea radically differ from other Arctic offshore areas, in terms of temperature regime.
For temperatures analysis, bathythermographs of different types, including autonomous, are used. Measurements of these devices cover the area of the World Ocean, forming a network of varying density. National Oceanic and Atmospheric Administration (NOAA), founded in USA in 1970, since 1994 has formed the largest oceanographic database—the World Ocean Database (WOD). In 2013 the version of this base WOD13 consisted of 12.76 million stations of temperature measurements in the World Ocean. As of May 2018, number of stations increased up to 15.6 million. For obvious reasons, in deep, hard accessible part of the Arctic Ocean, density of these stations is the lowest. Using data from the WOD13 base and computer software Ocean Data View (ODV) [67], it is possible to make a plot of temperature as a function of depth for any existing station and also to create a section of temperature values for any line in the World Ocean.
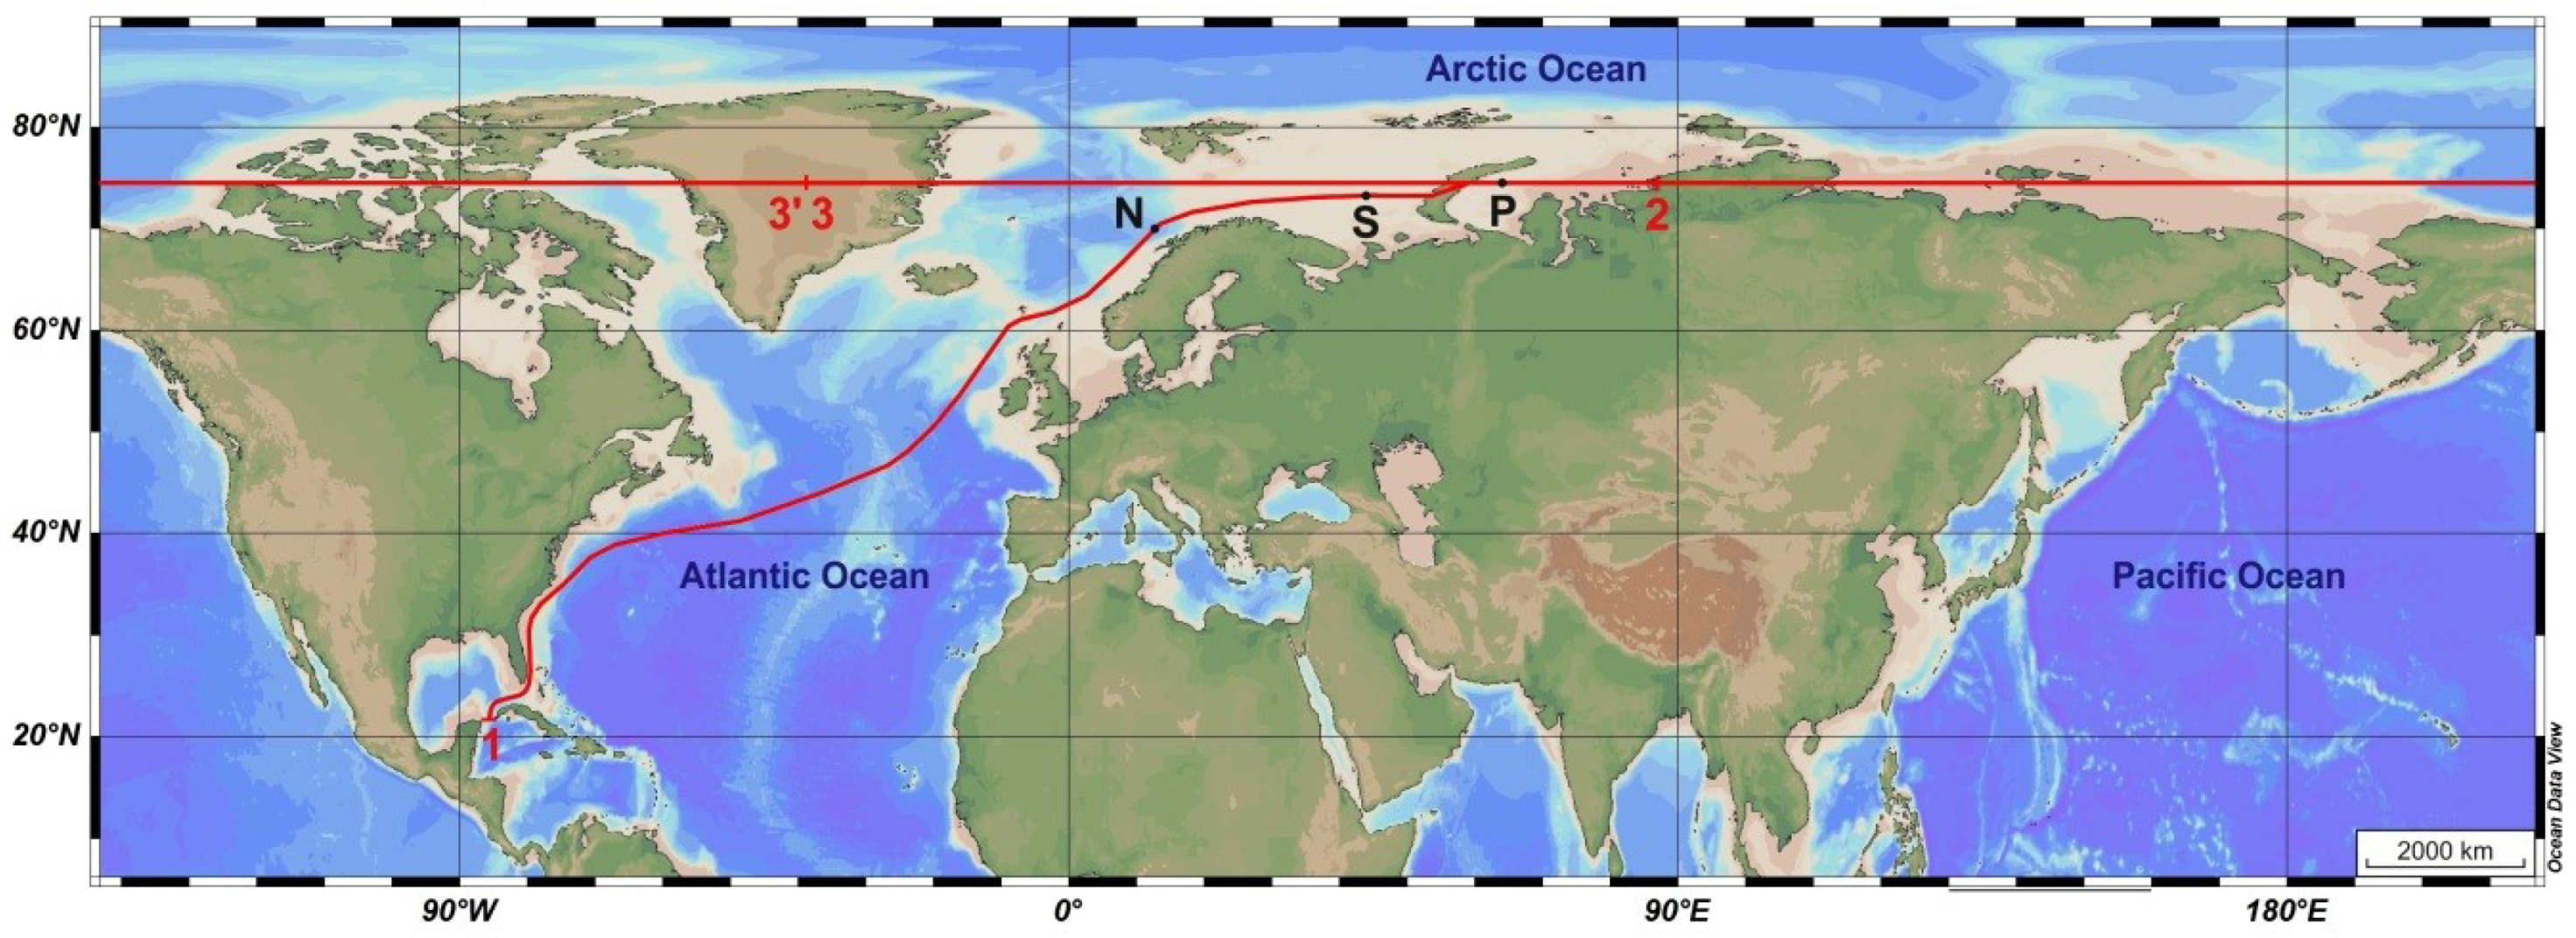
In the cartographic scheme of Figure 2, created using ODV 5.0.0 software, locations of two studied megaregional lines are shown. Location of one of the studied areas (N) is also depicted in the scheme. For this area, referring to deep part of the Norwegian Sea, plots of temperatures were created with data from four neighboring stations (Figure 3). Red and yellow plots correspond to measurements conducted in summer, blue and purple ones depict measurements carried out in winter. The plots demonstrate that warming influence of the North Atlantic Current is limited by depth ca. 1000 m. On larger depths, temperatures from separate stations almost coincide and near bottom they are ca. −1 °C.
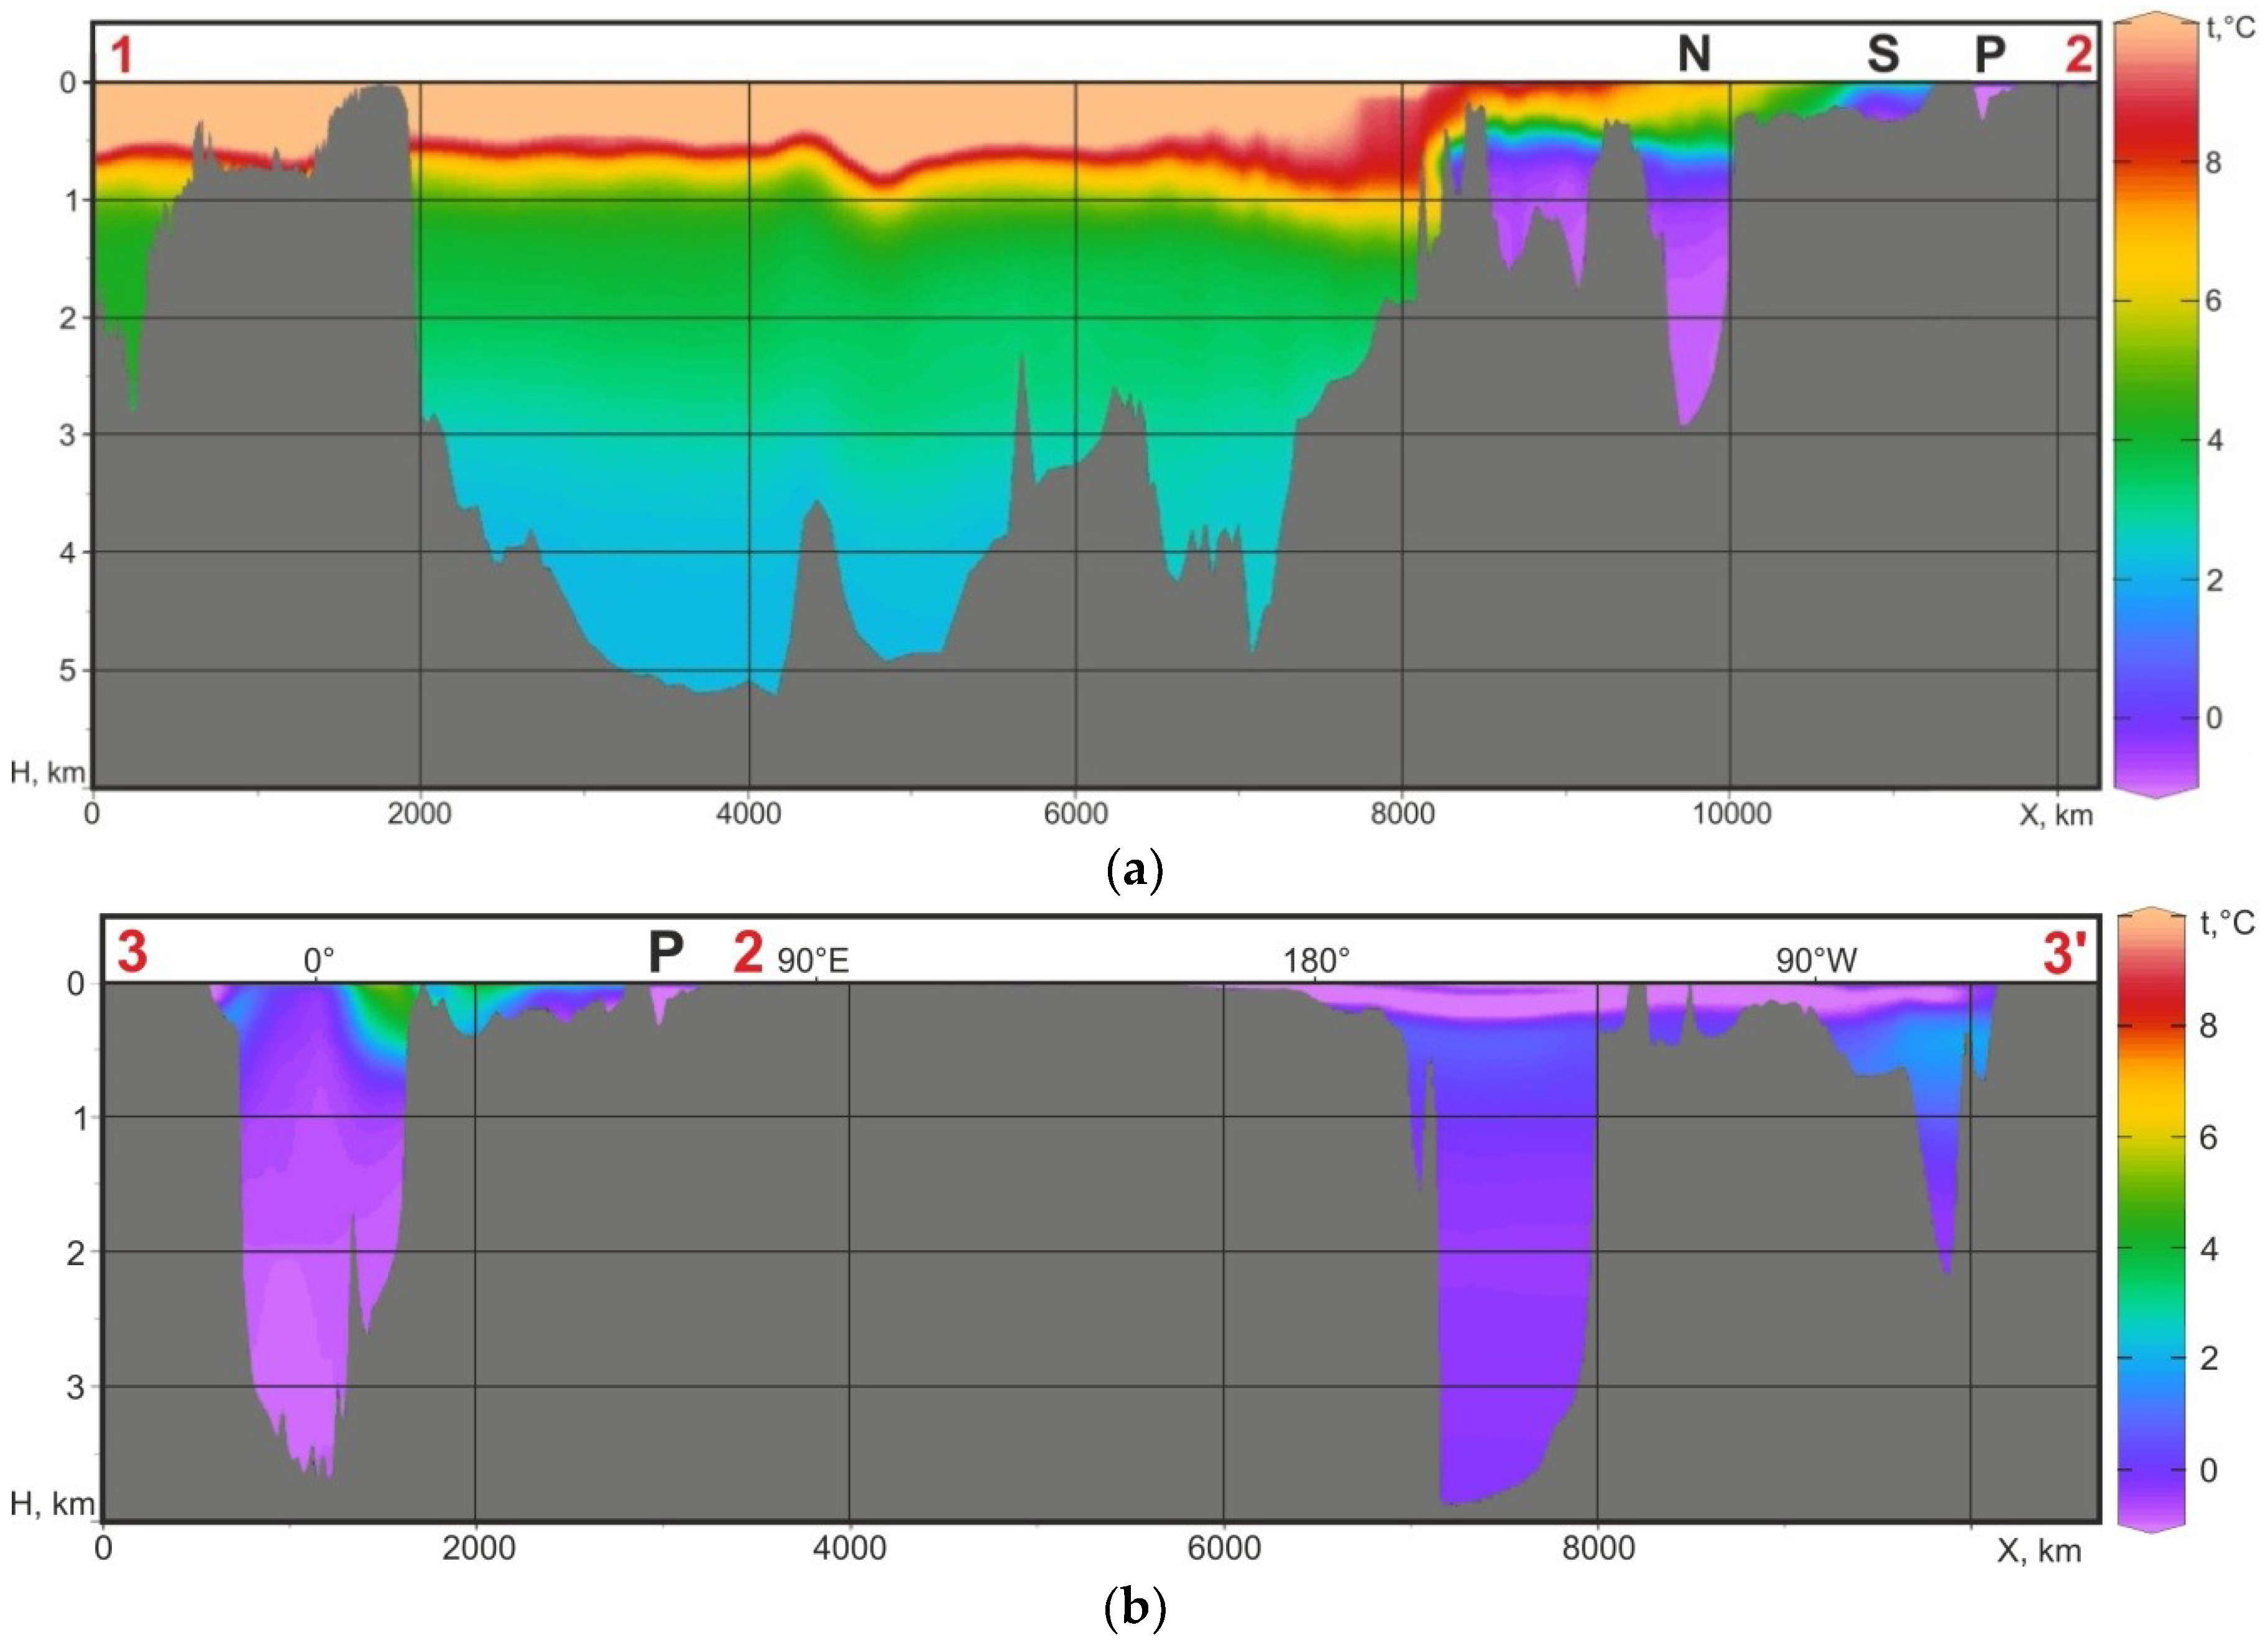
Created water temperature sections for lines 1–2 and 3–3’ are shown in Figure 4. The first Transatlantic-Arctic line is more than 12 thousand km long. It goes along the Gulf Stream and the North Atlantic Current, enters the Barents and Kara seas, crossing the Shtokman and Pobeda fields (S and P respectively in Figure 2). The second line (3–3’), ca. 11 thousand km long, follows the 74.5° latitude. Lines 1–2 and 3–3’ have a common segment in the Kara Sea, intersecting the Pobeda Field. In the section 1–2, warming effect of the Gulf Stream and the North Atlantic Current is observed (Figure 4a). The effect covers depths not more than 1 km. However, the rate of warming decreases in the northern direction. Thus, in the deep part of the Norwegian Sea and on the Barents Sea shelf, near-bottom temperatures are not influenced by the warm current and are negative. The section 3–3’ demonstrates that near-bottom temperatures on the 74.5° latitude are mainly negative (Figure 4b). Particularly, in the area of the Pobeda Field in the Kara Sea, the temperature is less than −1 °C. Positive temperatures are observed only on the branch of the North Atlantic Current in the Norwegian Sea, in direction to Svalbard (to the east from the 0° longitude).
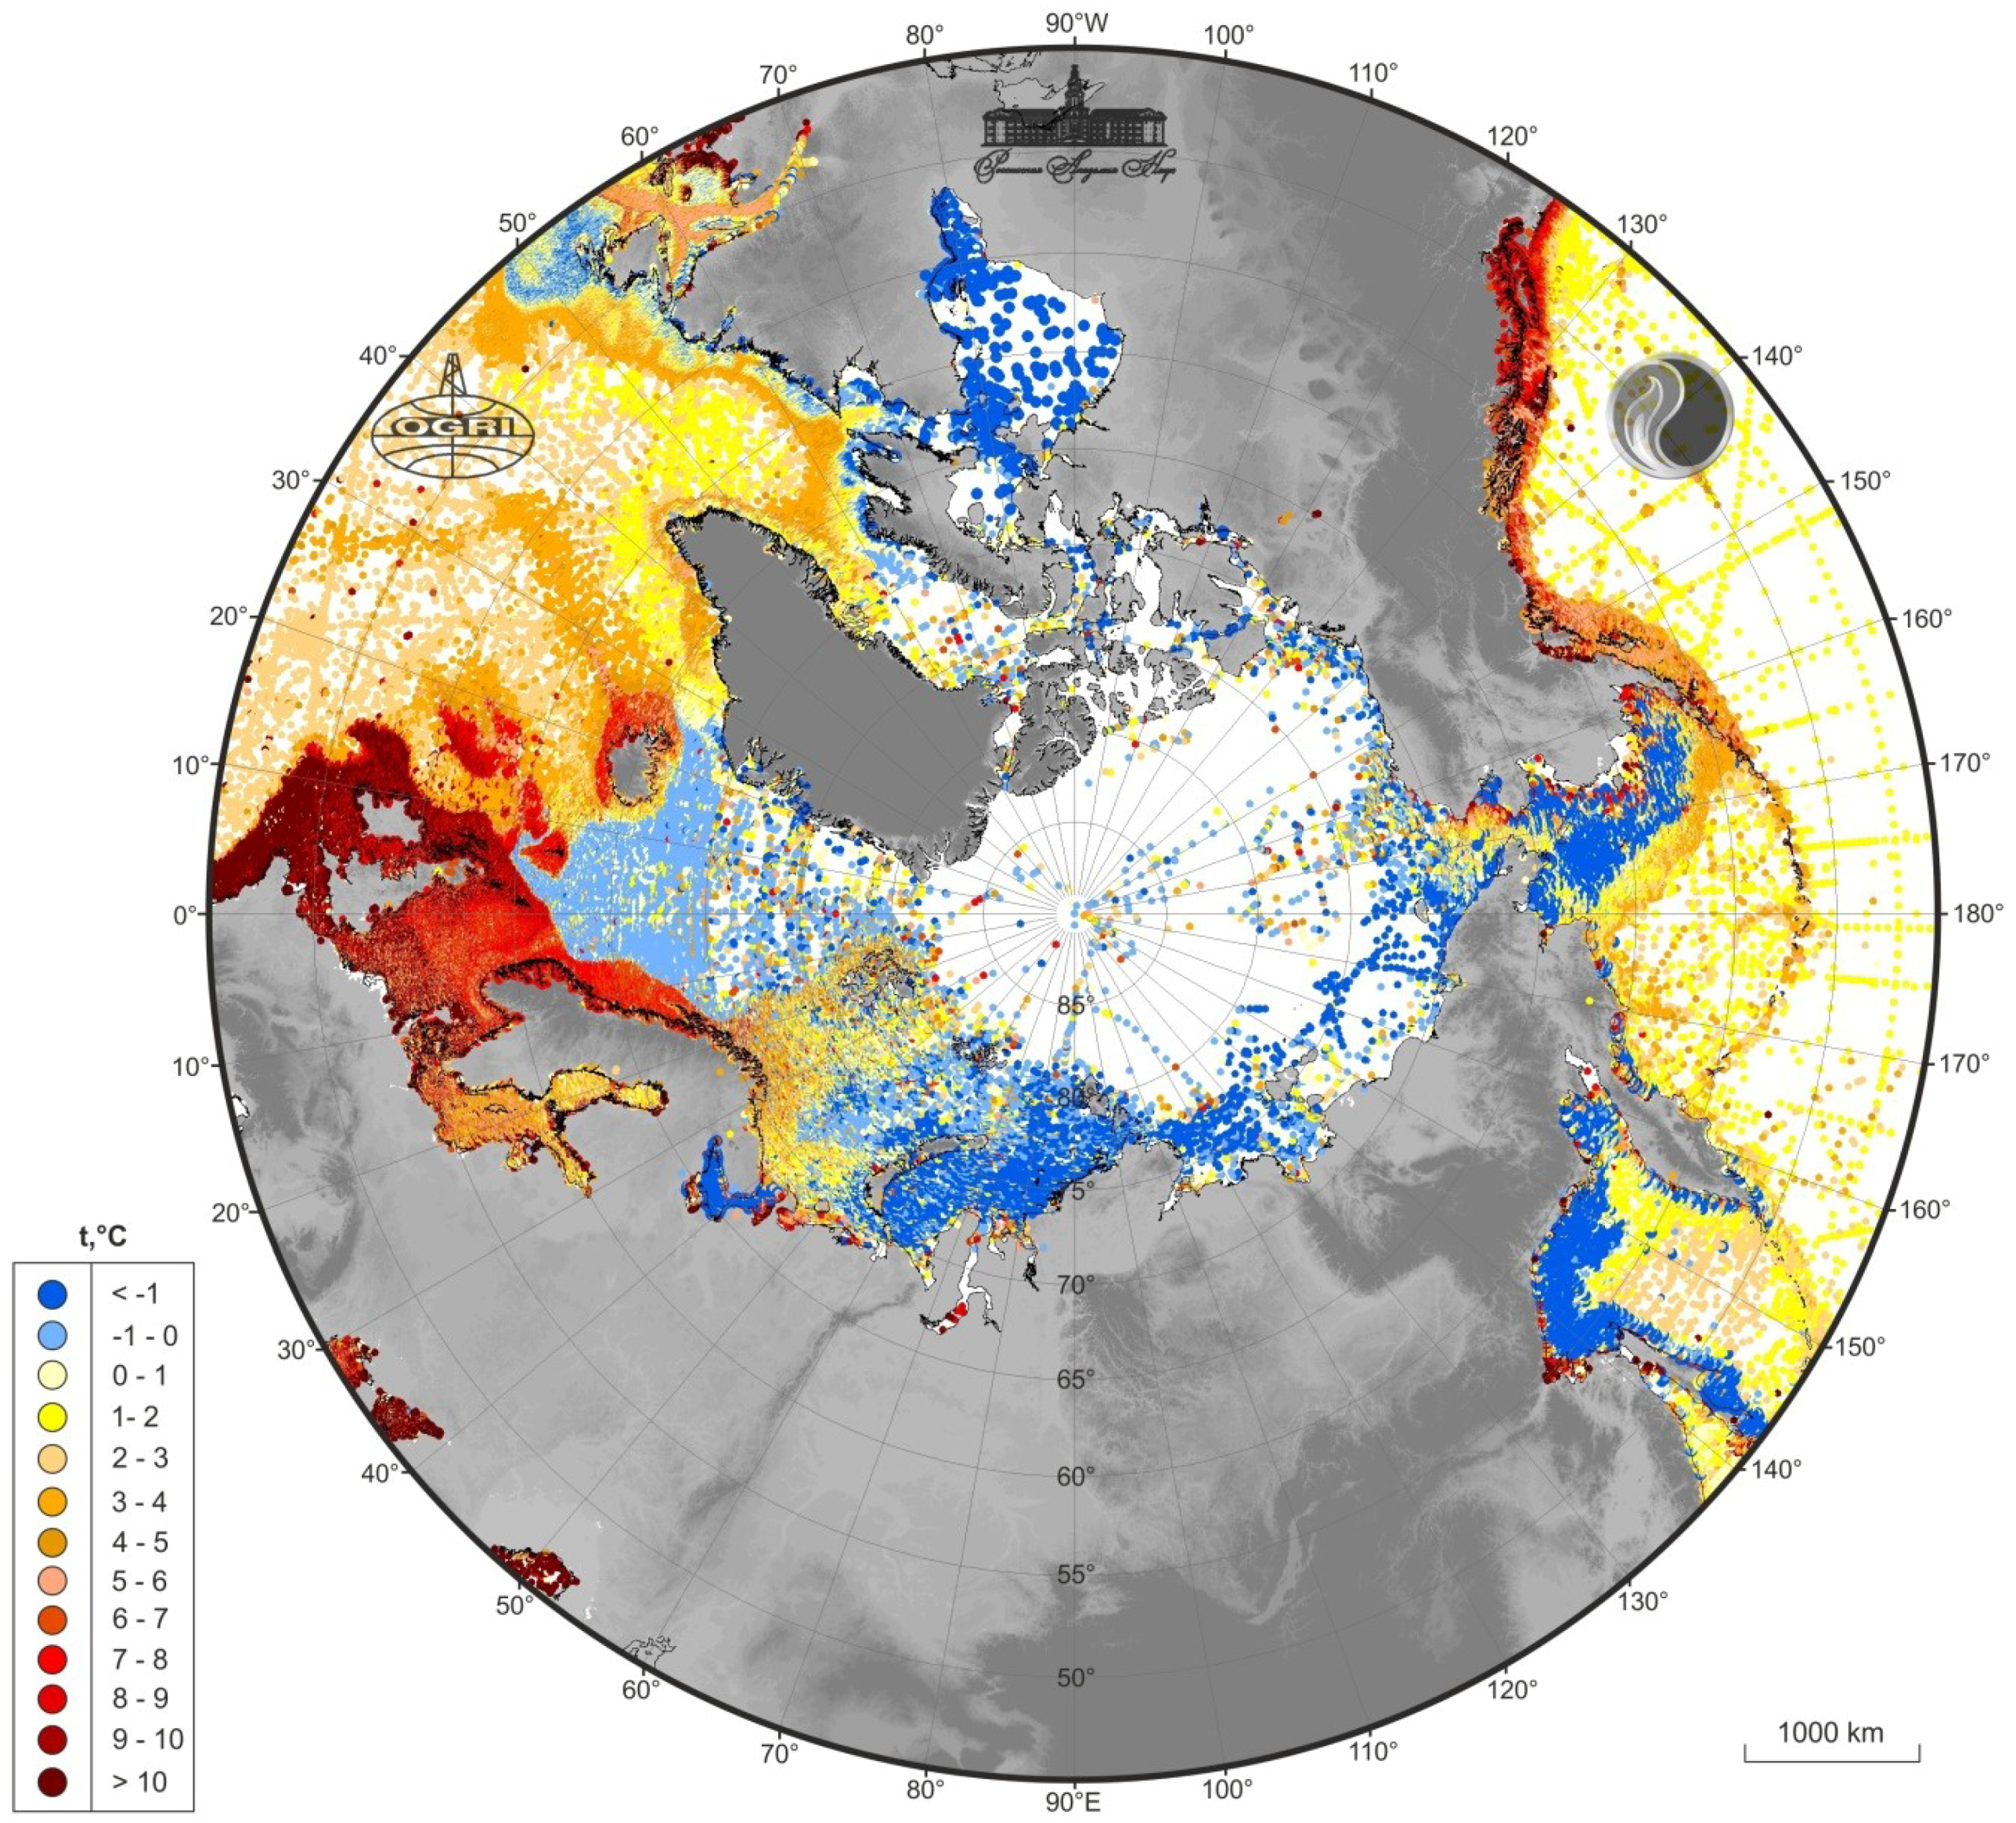
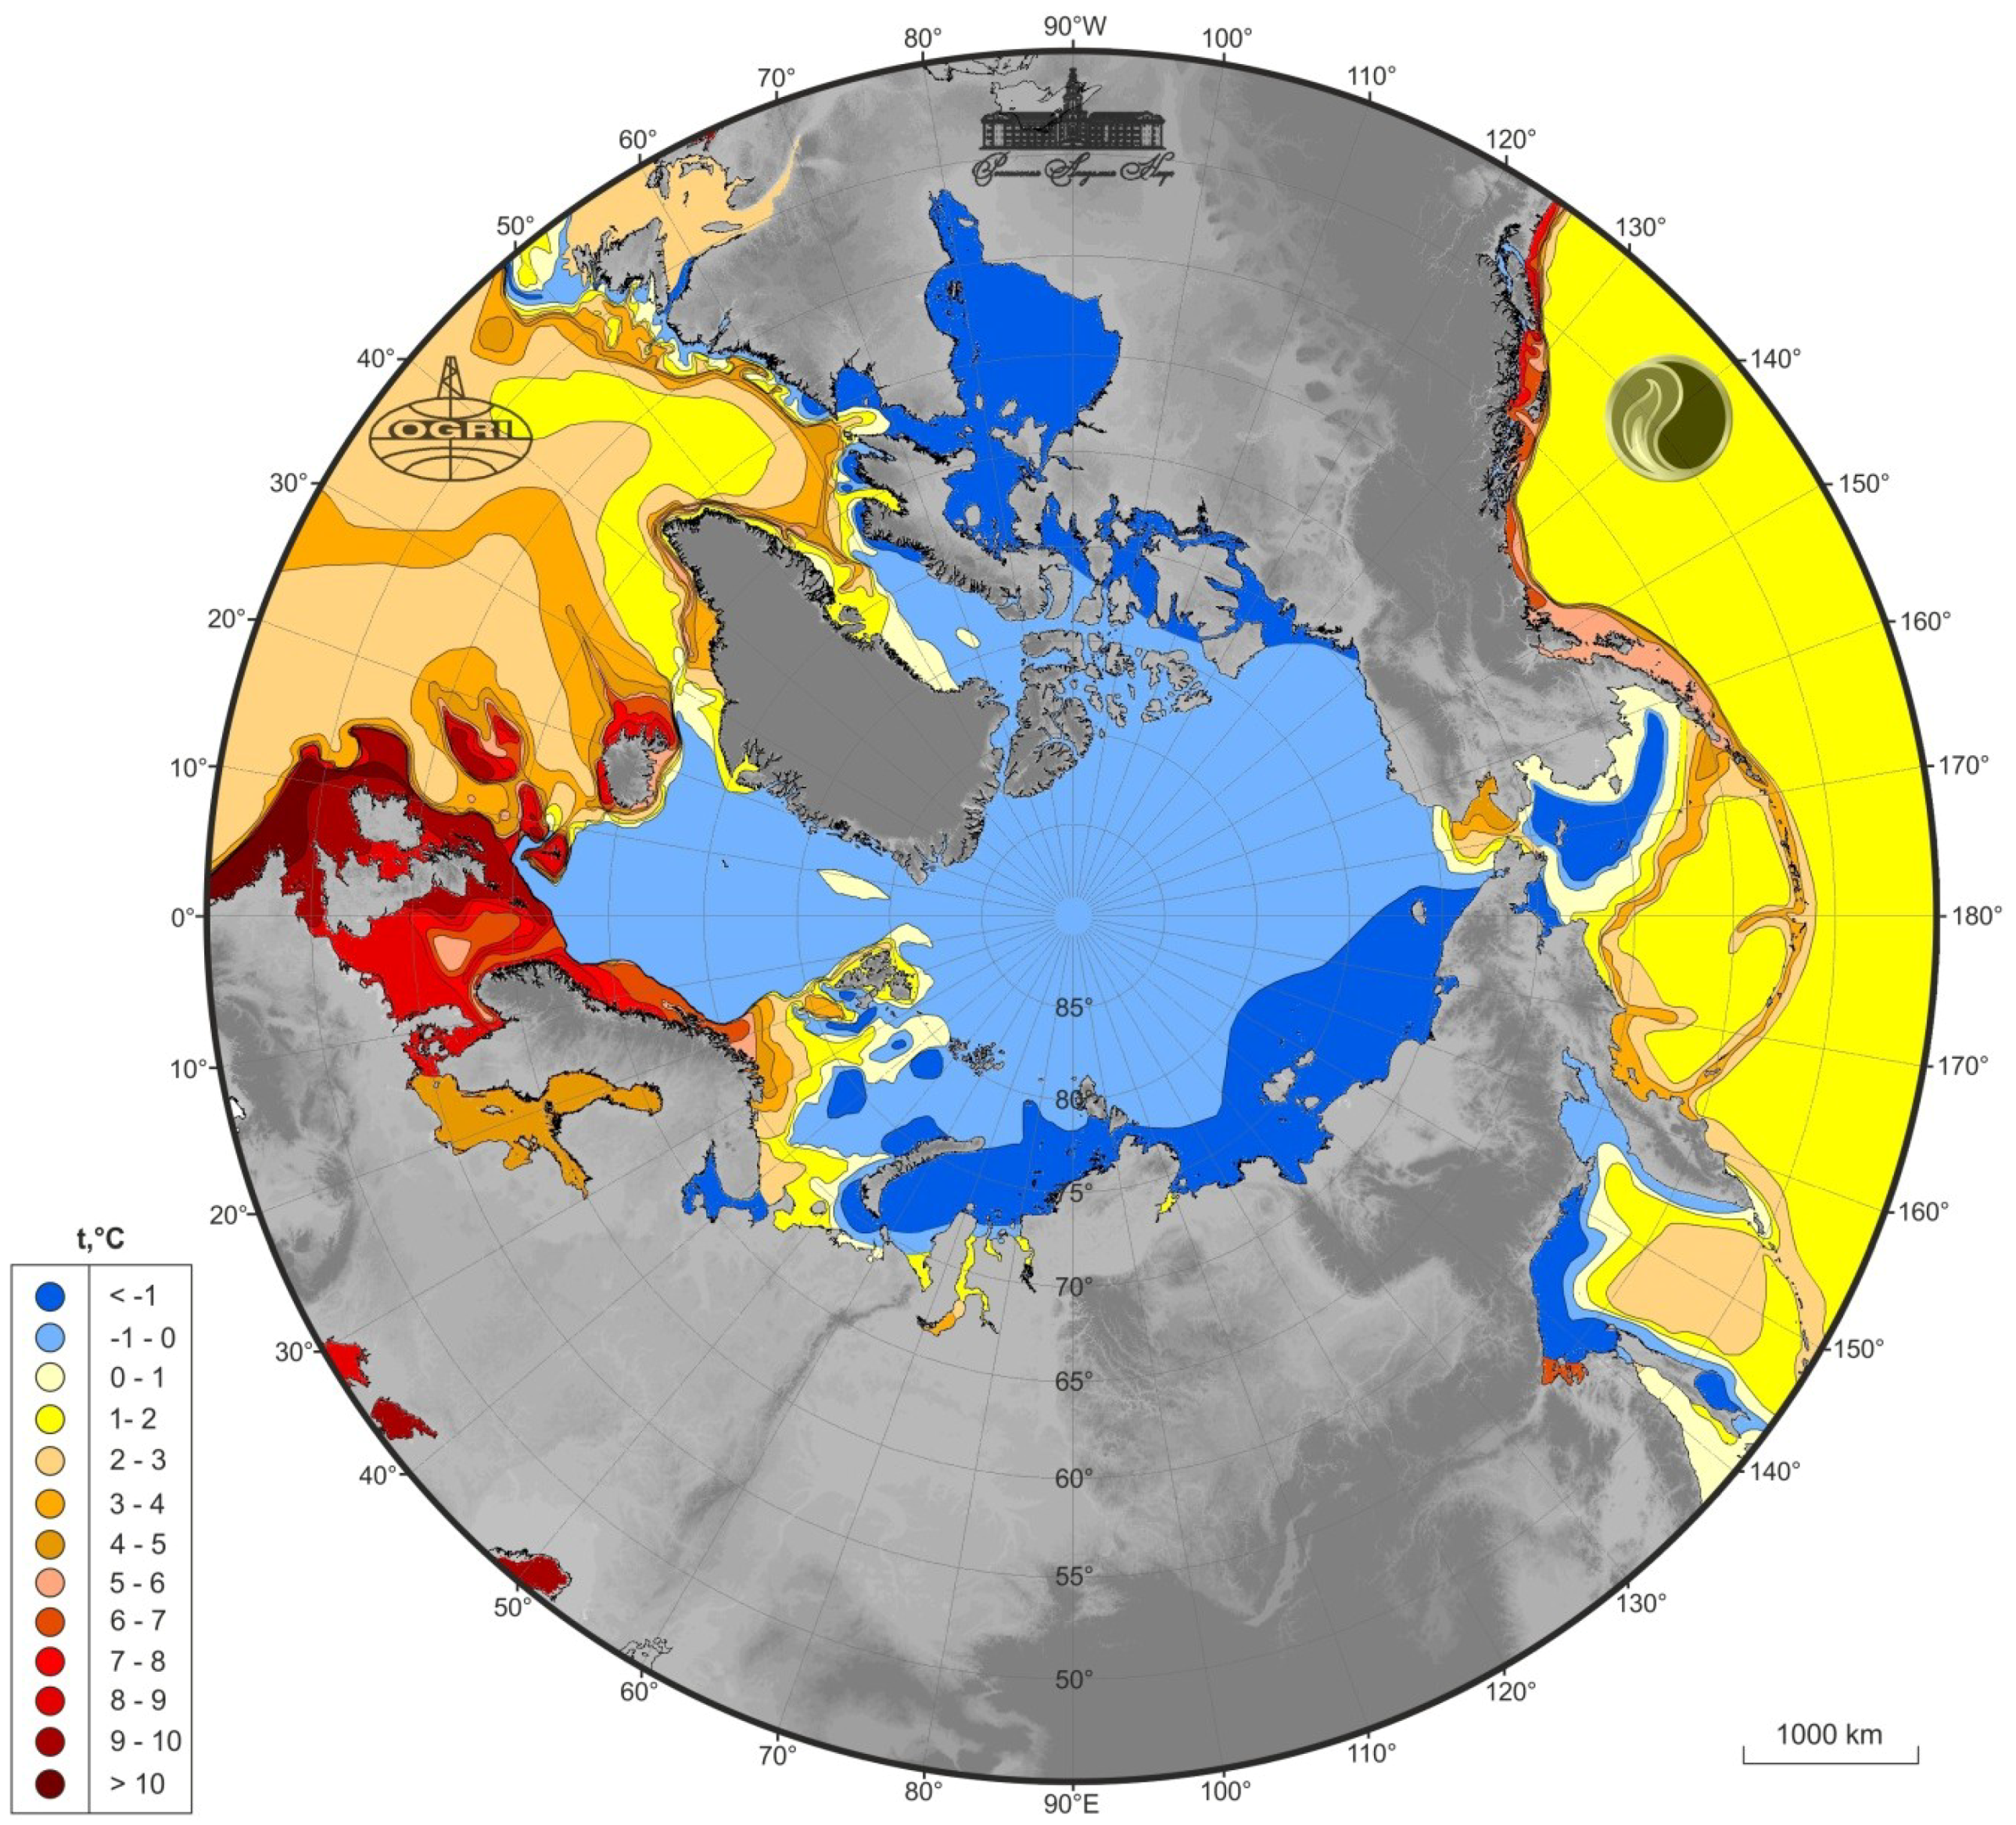
For creating a cartographic scheme of near-bottom temperatures in the studied region of the Northern Hemisphere, including the Arctic Ocean and adjoining northern parts of the Atlantic and Pacific oceans, limited by the 45° latitude, actual temperature measurements were downloaded from the WOD13 database [68]. Total number of gauge stations within this area was 2,689,737, on 882,138 among them, measurements had been conducted on various depths. This data was represented by an array of dots, corresponding to stations, with coordinates and measurements of temperatures from sea level down to certain depths, not always reaching near-bottom water layer. Therefore, in the beginning, the deepest measurement was selected for each station. Further, only those measurements were left, which referred to depths differing from bottom depths on respective stations by less than 10%. Described data filtration was necessary for the most reliable forecast of near-bottom thermobaric conditions. After the data filtration, total array of measured temperatures consisted of 622,451 values. All these values were downloaded to ESRI ArcGIS 10.2 software for creating a scheme of distribution of near-bottom temperatures in the studied region, demonstrated in Figure 5. The cartographic scheme was thoroughly interpreted in ESRI ArcGIS 10.2 software and represented in a form of contrast color temperature classification. On the basis of this, an average scheme of near-bottom water temperatures was manually created with 1 °C interval (Figure 6), which was necessary for further defining of favorable zones for GH existence. This scheme of near-bottom water temperatures differs to a certain extent from those created earlier [8,9], probably, since the filtration, described in the present research, was not applied before.
In the southern part of the Barents Sea, near the shore of the Scandinavian Peninsula, due to the Northern Atlantic Current, near-bottom water temperatures are positive and reach 4 °C (Figure 5 and Figure 6). They are also stably positive around Iceland and to the south along the Mid-Atlantic Ridge—zone of oceanic spreading with high rate of the Earth heat flow. However, such local objects, as Haakon Mosby Mud Volcano, with maximum measured temperature 25.8 °C [34], unfortunately, are not distinguished at megaregional scale, being single extremum points in big arrays of background temperatures around volcanoes, below 0 °C.
It is worth noting, that water temperatures in shallow zones of northern rivers mouths and coastal zones are subjected to sufficient seasonal fluctuations. Due to this, in the Bering Strait and in the southern part of the Chukchi Sea, seasonal positive near-bottom temperatures occur (Figure 5 and Figure 6). This circumstance is connected with the Alaska Current, bringing water masses from the Pacific to the Arctic Ocean, which increase water temperature of the Chukchi Sea in summer. One branch of the current goes to the north through the Bering Strait, and the other part, changing direction, goes through the Bering Sea to the south-west along the Asian coast and further turns into the Kamchatka Current.
2.3. Thermobaric Conditions Analysis
For predicting thermobaric conditions of GH stability for known bottom depths (e.g., GEBCO bathymetric database) and temperatures, usually, empirical equations are used [7,31,59]. Researchers of Colorado School of Mines generated parameters for such equations that were then implemented in the software CSMHYD [69,70]. This software is publicly available for downloading at the website of Center for Hydrate Research of Colorado School of Mines [71].
The base data for calculation in CSMHYD includes near-bottom water temperature, mineralization of formation water and composition of hydrate former gas [7]. The result of calculation is a minimum value of pressure, necessary for GH formation at a chosen temperature. Obtained pressure is used to calculate the height of water column—actually, the bottom depth.
Cartographic schemes of GH stability zones distribution were created for two different models. In both models, the same array of near-bottom water temperatures (Figure 5 and Figure 6) and GEBCO data on bathymetry were used. The hydrate former gas was assumed 100% methane. The difference between models consisted in value of water mineralization in shallow sediments. In Model 1, mineralization was supposed to be the same as in near-bottom water. This approach is reasonable, provided that shallow sediments have good permeability and easily communicate with ocean water. Mineralization was assigned with a value 34.5‰, as an average value of near-bottom water salinity [72]. However, in shallow deposits, reservoirs may be isolated from ocean water with either impermeable or poorly permeable rocks. In this case, reservoir water may have lower mineralization. As an example, salinity in the Albian-Cenomanian reservoirs of the Yamal Peninsula is ca. 15‰ [73]. In Model 2, mineralization of water in shallow deposits was assigned with the minimum value 0 (fresh water).
Calculated depths in Model 1 were 244 m at a temperature −2 °C, 295 m at 0 °C, 714 m at 9 °C (this value is typical for shallow deposits of the Black Sea). Calculated depths in Model 2, assuming fresh formation water in near-bottom deposits, were 238 m at −2 °C, 248 m at 0 °C, 612 m at 9 °C. For conditions of the Arctic Ocean with near-bottom water temperatures −2 °C and 0 °C, differences between Models 1 and 2 were 6 and 47 m respectively. At the same temperatures, GH stability zone corresponds to smaller depths for fresh water than for saline water in shallow sediments. The difference between minimum depths, necessary for GH stability, for fresh and saline water increases with the near-bottom water temperature. This is explained by the fact, that only fresh water takes part in the reaction of GH formation, whereas salt ions resist this process, decreasing the water activity [74]. Thus, in Model 2, the zone of possible methane hydrates (MH) formation is to a certain extent wider, in comparison with Model 1.
It is worth noting, that the geothermal gradient was not considered in the research. The objective was to predict minimal depths of sea bottom, at which MH may occur, and an area of their possible distribution. Thus, the study did not include defining thickness of MH stability zone.
3. Results
3.1. Results of Forecast of Methane Hydrates Distribution Zones
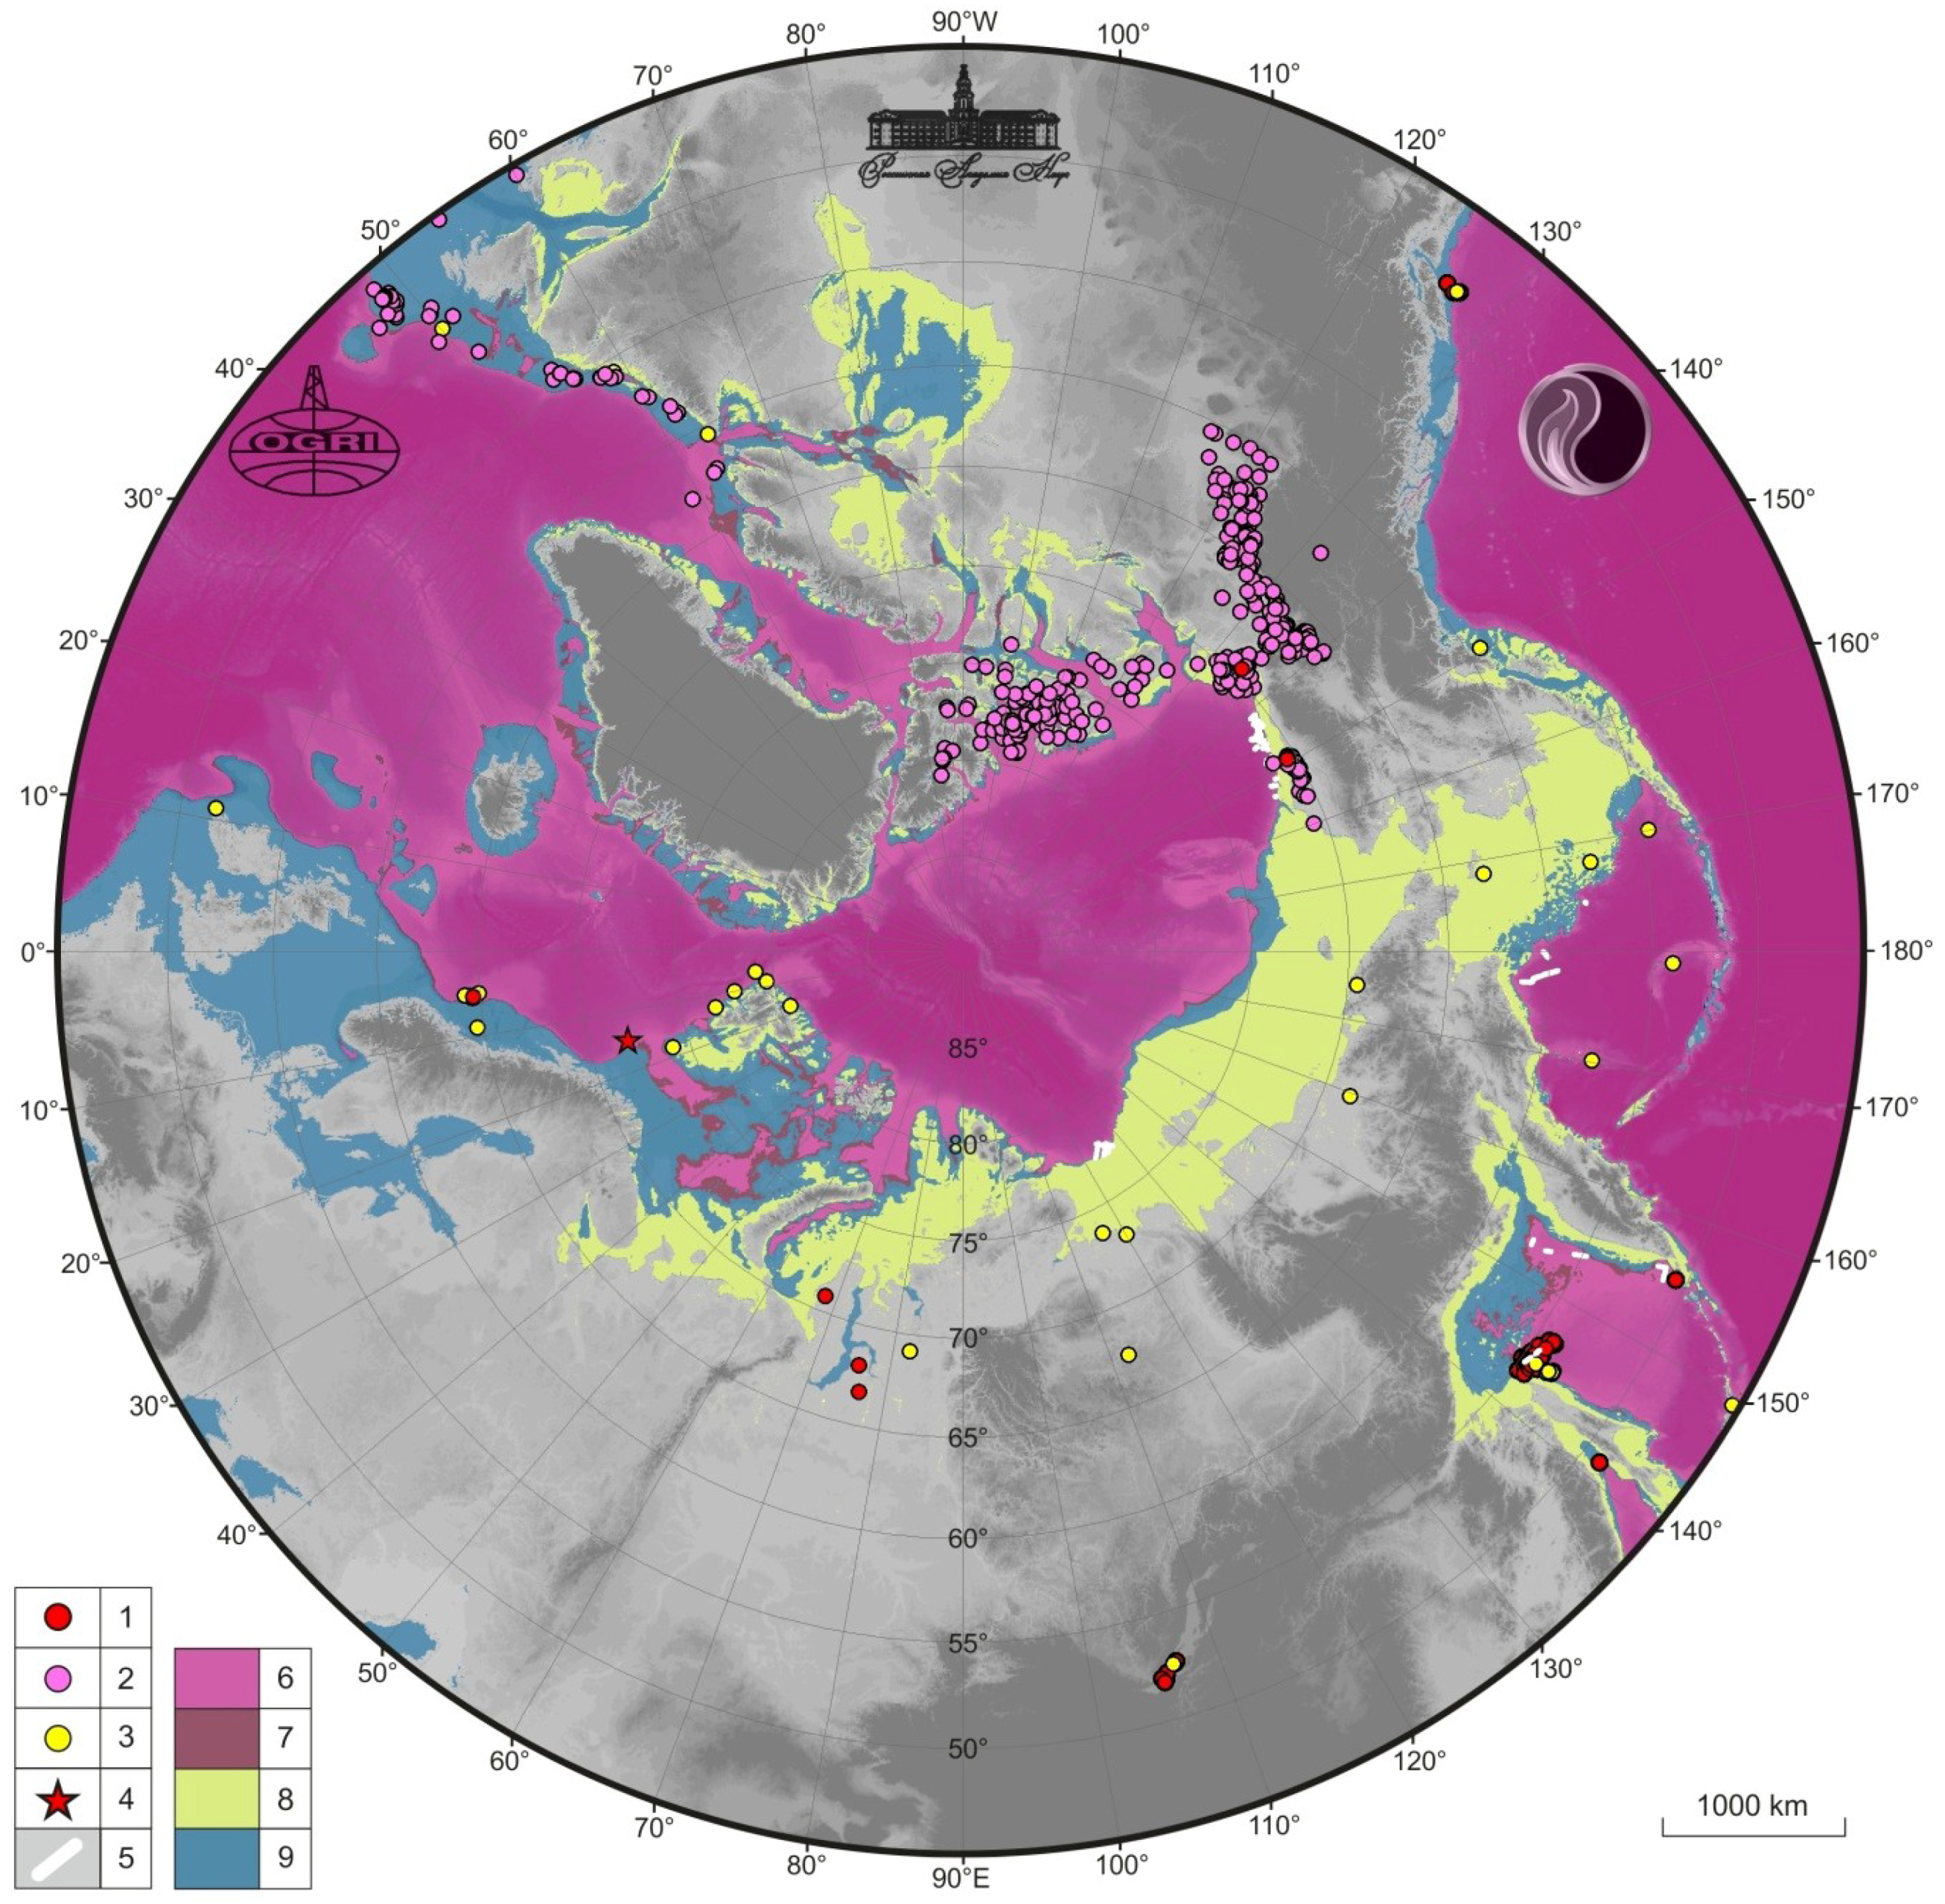
The cartographic scheme of MH distribution zones (Figure 7) was created, according to Models 1 and 2, described above, using ESRI ArcGIS 10.2 software. Cartographic base of the Figure 7 was made also in ESRI ArcGIS 10.2, using GEBCO data on bathymetry and altitudes of relief [61].
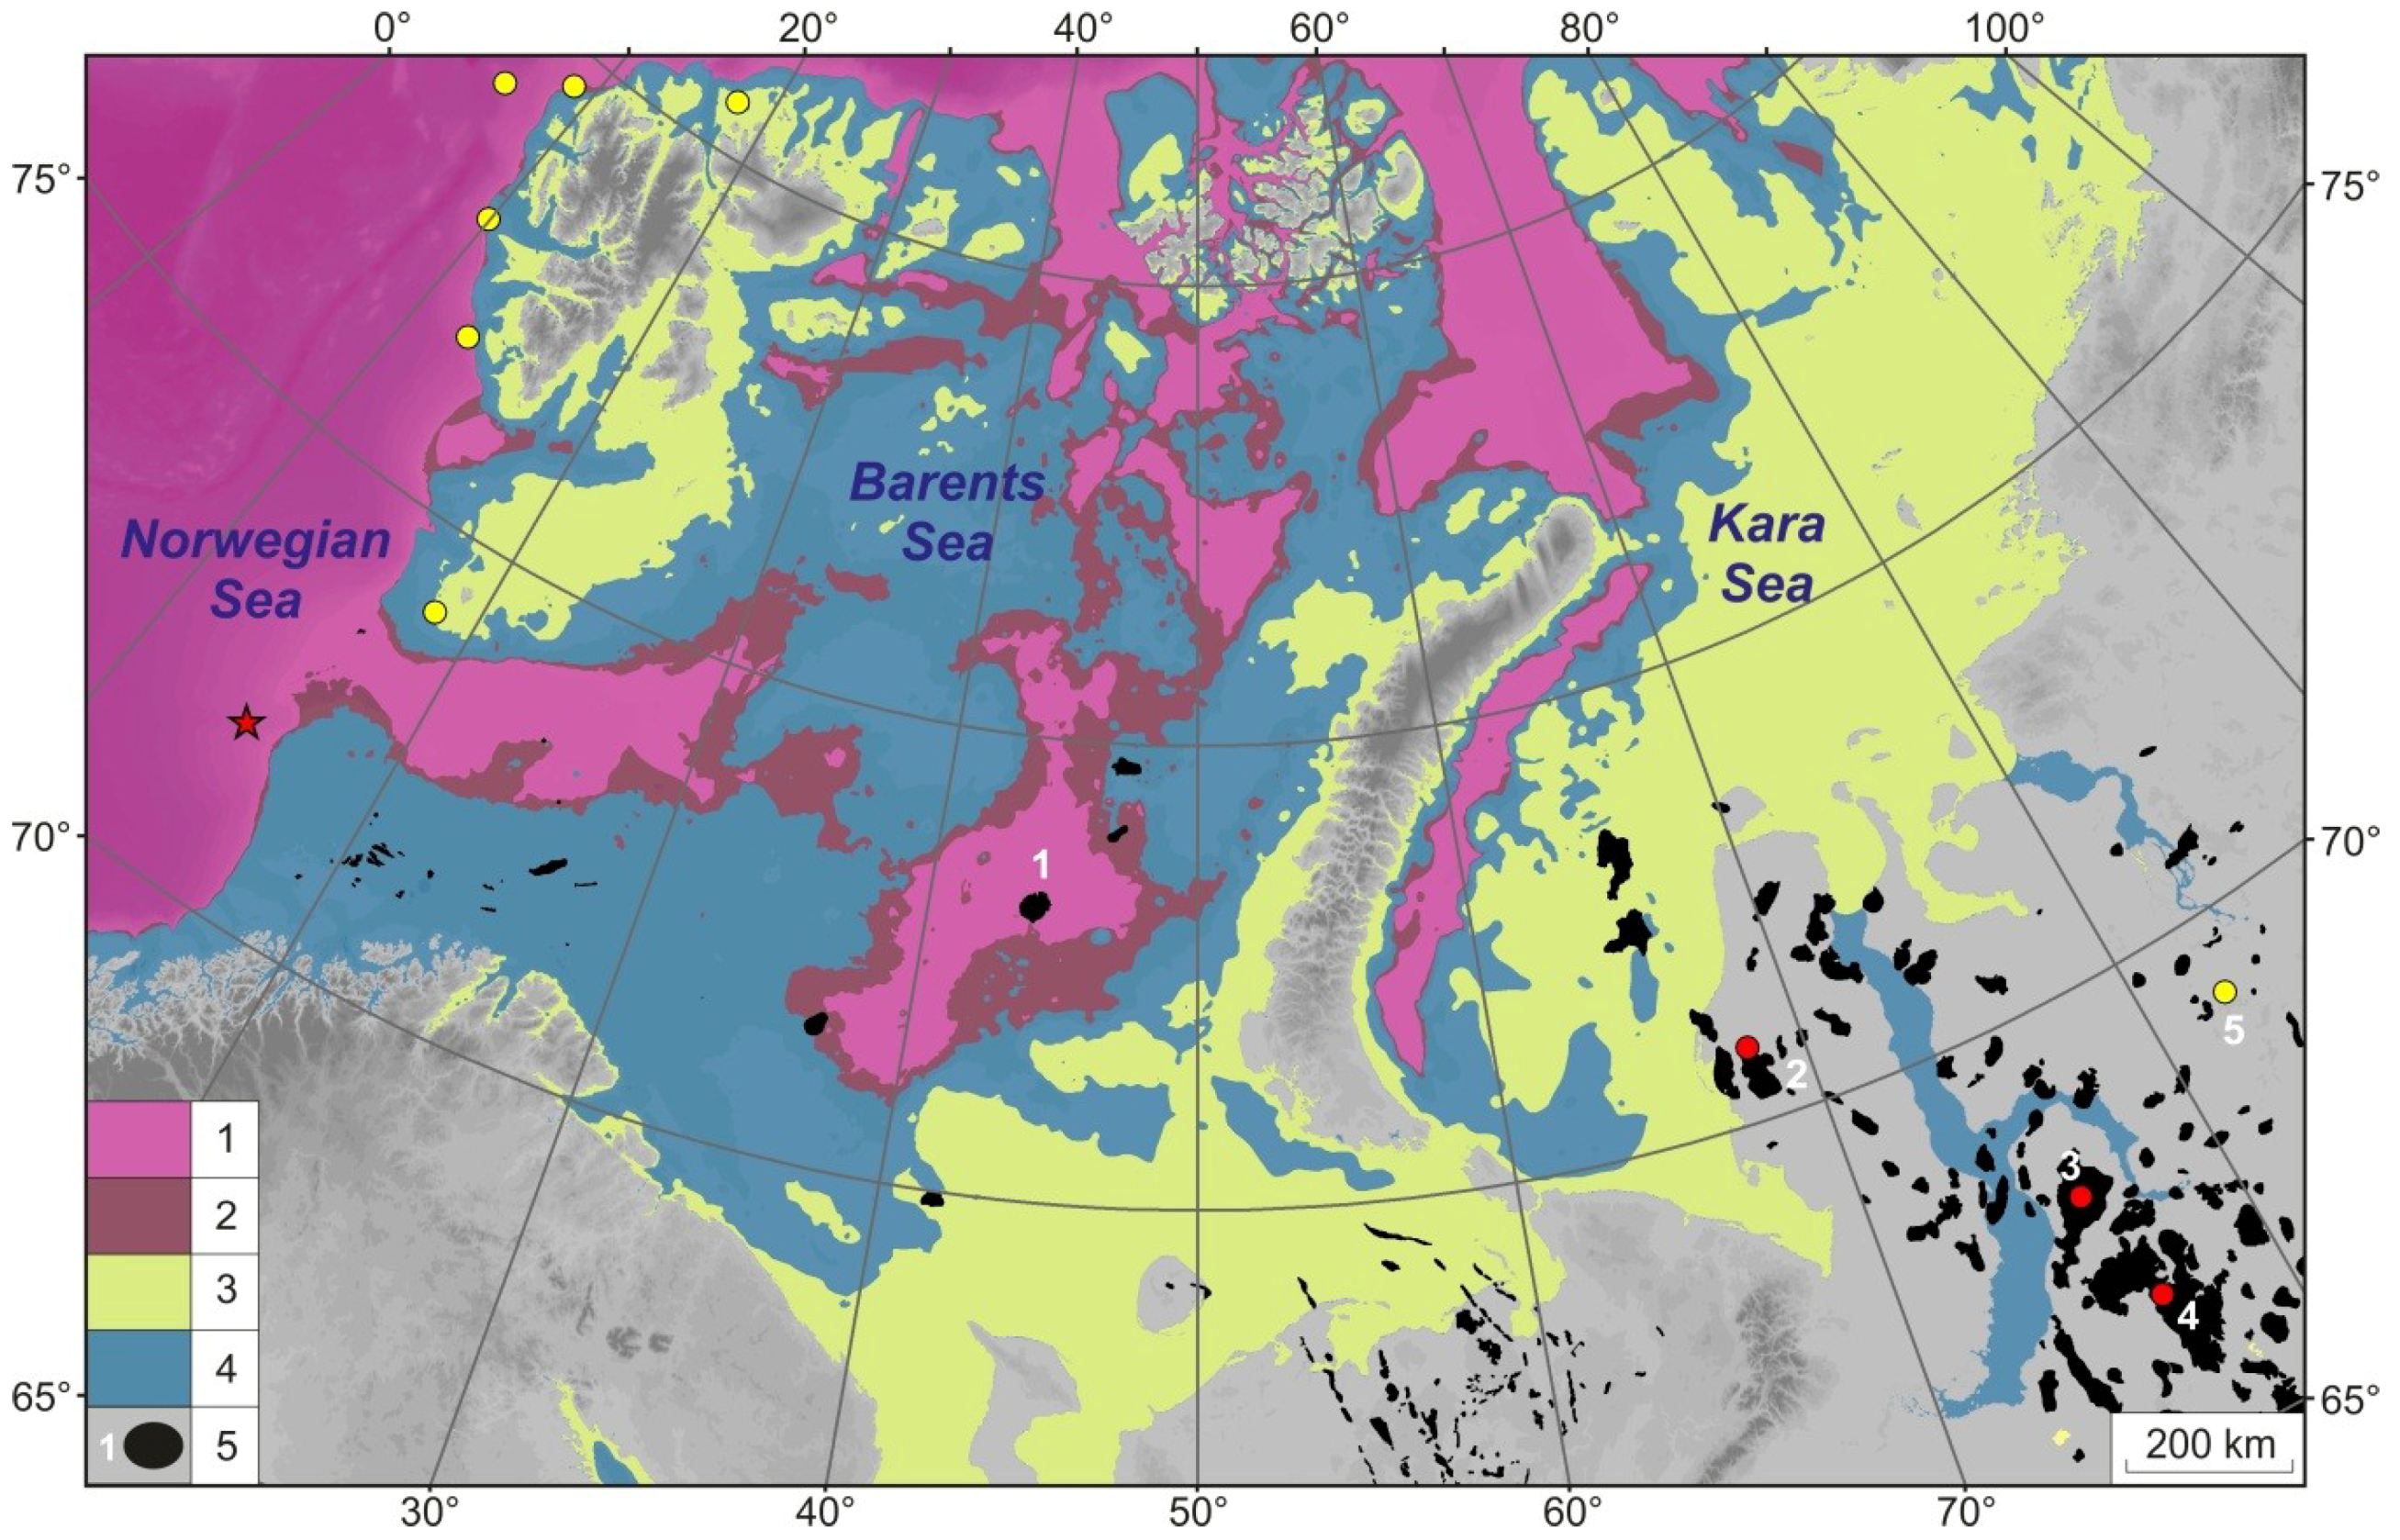
Figure 7 demonstrates that in most offshore areas, differences in distribution of zones for Models 1 and 2 are rather slight and they are certainly not distinguished at present scale. However, they are well observed in shelf areas of the Barents Sea with drastic variation of bottom depth from 0 to 600 m (Figure 8).
In schemes of Figure 7 and Figure 8, shelf zones with depths to 120 m are additionally shown. These zones refer to probable distribution of subaquatic PF with possible occurrence of relic GH connected with the effect of self-preservation [32,56,59]. Existence of subaquatic PF has been confirmed by drilling in the Pechora and Kara seas. Thus, due to the effect of self-preservation, favorable zones for MH existence expand (Figure 7 and Figure 8). However, in a number of shallow zones of Pechora and Kara seas, including areas of large northern rivers mouths (especially, in the Ob and Taz gulfs), PF has degraded and wide taliks have formed. Actually, PF remains only in narrow coastal zones. During formation of taliks, GH dissociated and emitted gas entered or still continues entering the atmosphere, causing formation of pockmarks in the bottom. Similar processes occur also in adjacent land area (Yamal, Gydan peninsulas and others), as well as in the Laptev and East-Siberian seas [39].
3.2. Verification of the Research Results Based on BSR and Other Evidence of Gas Hydrates Occurrence
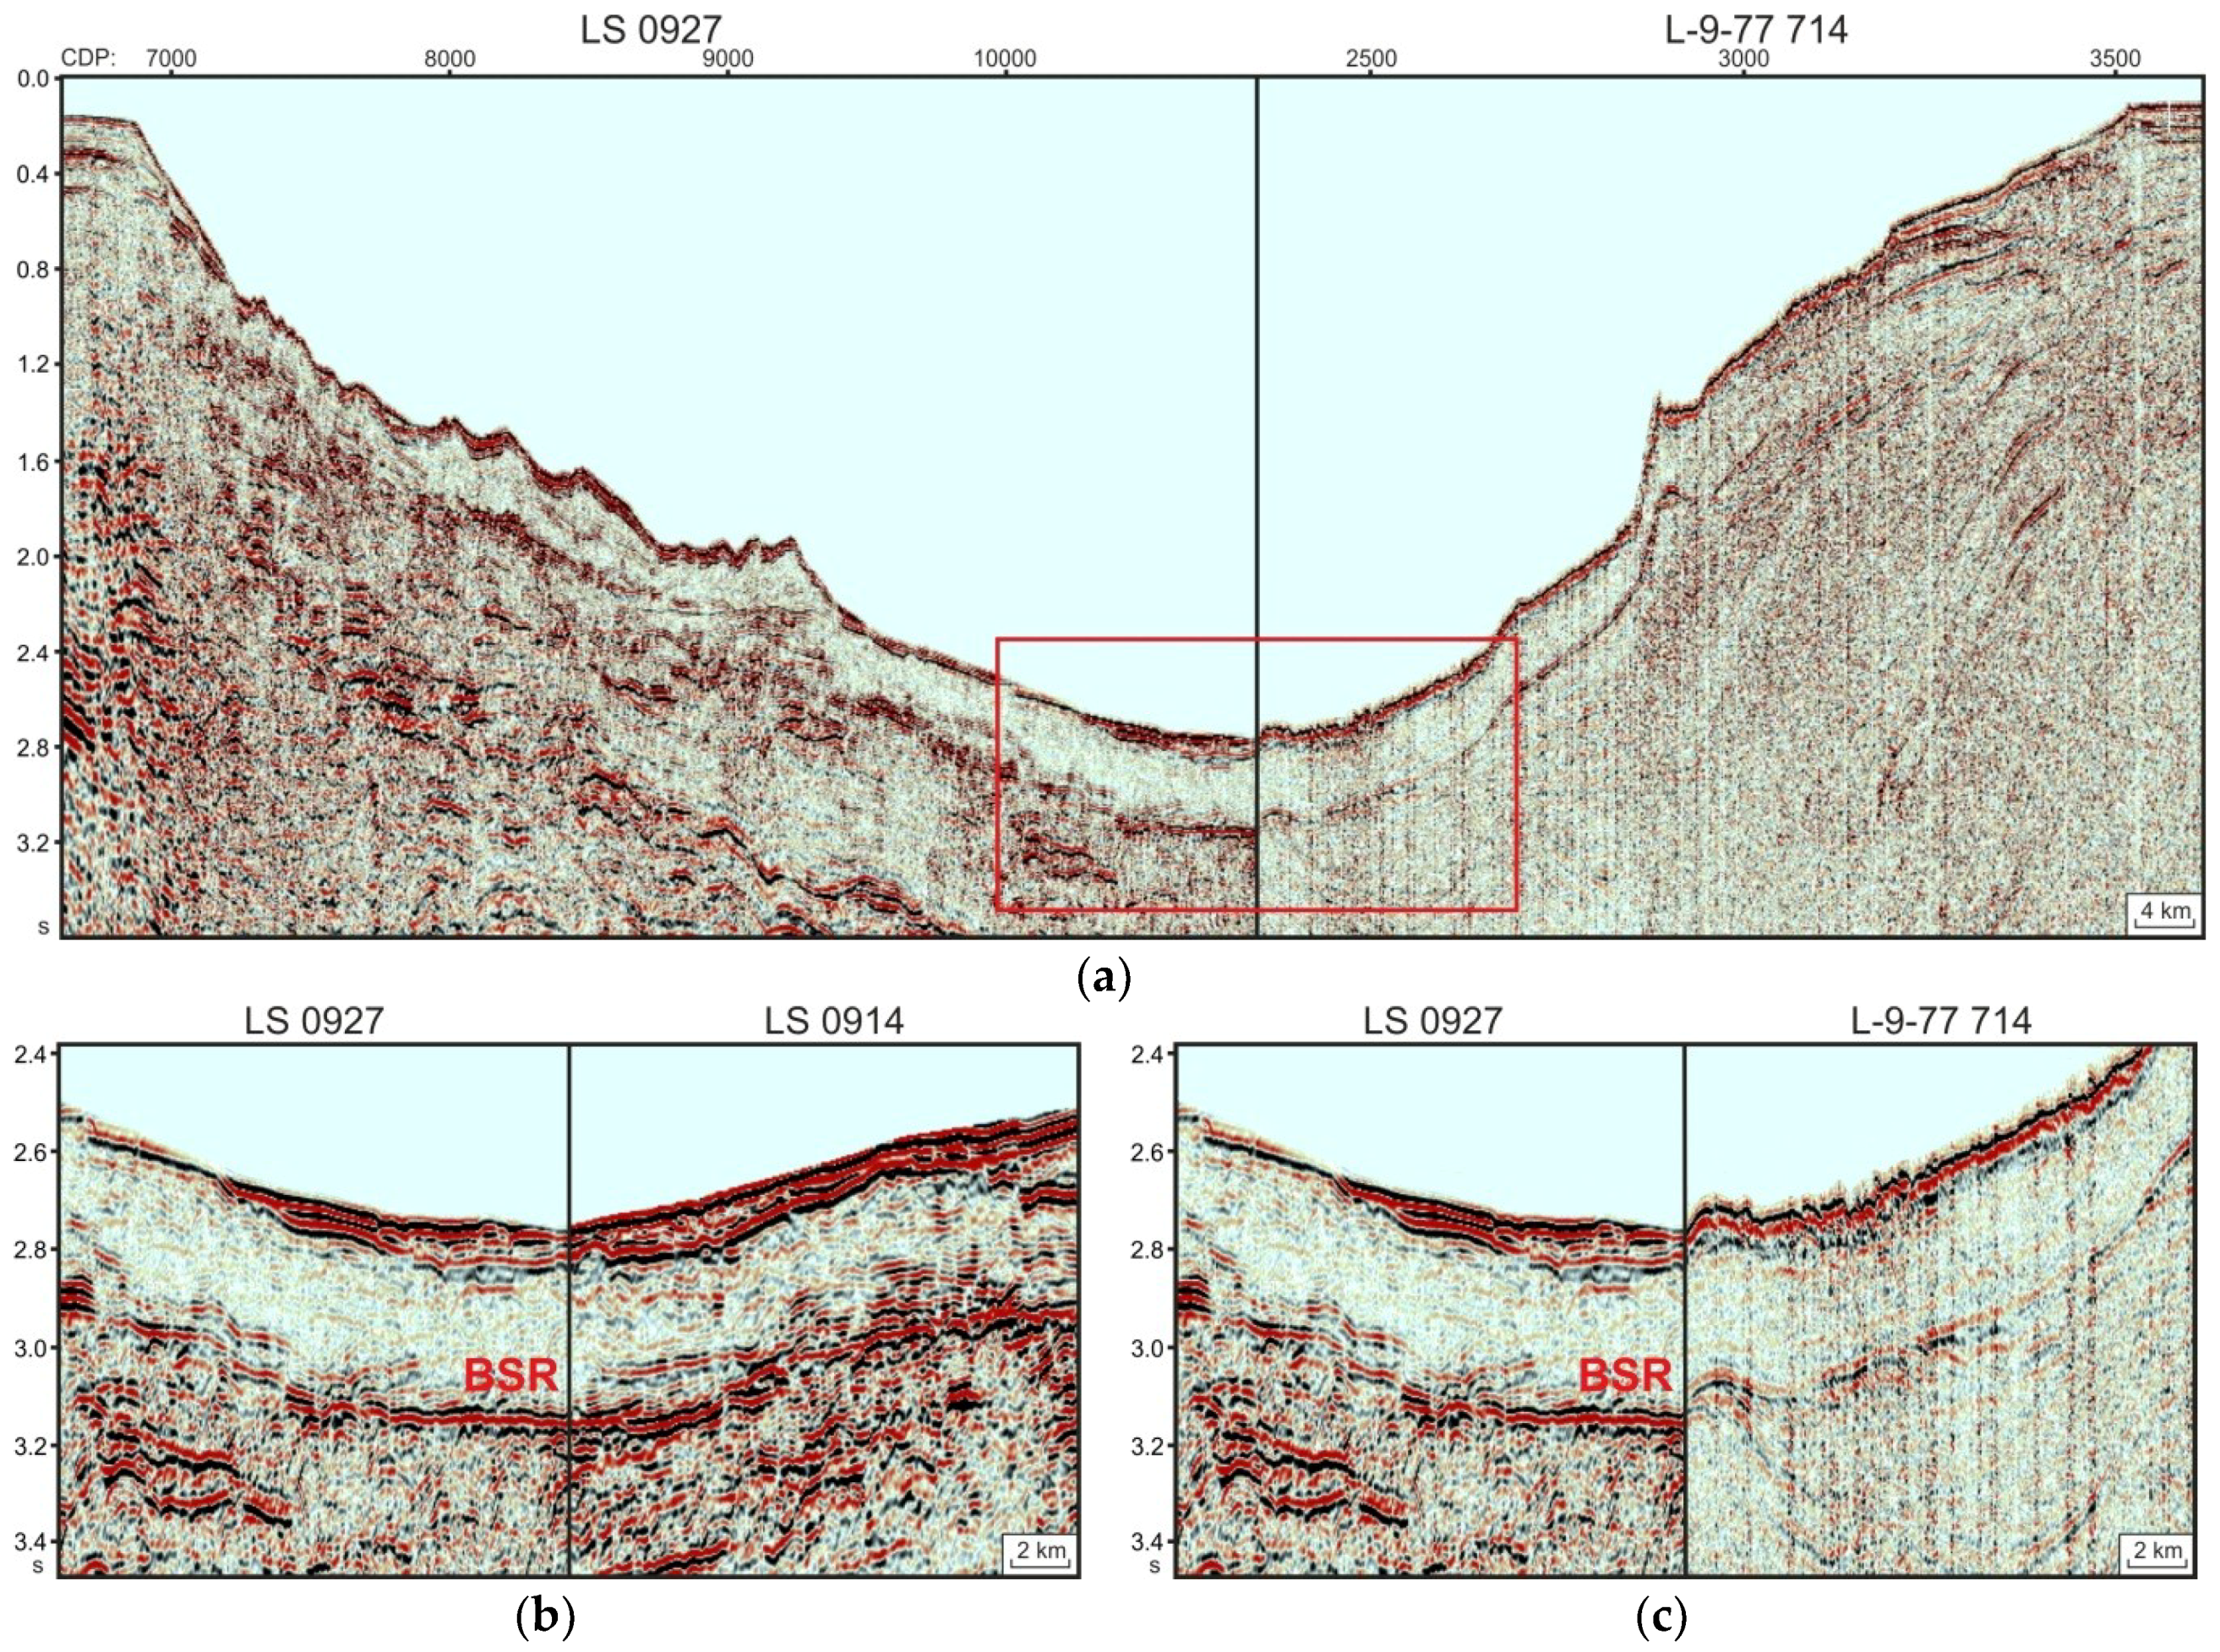
Conducted forecast of MH distribution zones is an important stage of the authors’ continuous research of the upper part of geological section of the World Ocean and, especially, the Arctic offshore areas. By the present moment, the authors of the research have analyzed 208 CDP seismic sections in the Sea of Okhotsk, Laptev Sea (JSC “Dalmorneftegeofizika” and JSC “MAGE” respectively) and also in the Bering, Chukchi and Beaufort seas (USGS). At total seismic sections length of ca. 30 thousand km, approximately one thousand anomalies of seismic record, indicating possible free gas accumulations, were revealed. In the Bering Sea, in shallow deposits of the Aleutian Basin, eight anomalies were identified with local appearance of BSR, supposing potential existence of GH. These anomalies have features of acoustic velocity-amplitude anomalies (VAMPs), originally distinguished earlier by researchers [52]. In 32 seismic sections of the Okhotsk, Laptev, Bering and Beaufort seas, continuous (from 6 to 90 km) BSRs were defined. In fact, on the continental slope of the Laptev Sea and in the TINRO Depression of the Sea of Okhotsk, zones of BSR existence were determined for the first time.
As an example, in Figure 9, results of analysis of seismic sections from the Laptev (LS0927 and LS0914) and Beaufort (L-9-77 714) seas in IHS Kingdom 8.5 software, with defined BSRs, are demonstrated. In Figure 9a, the left section (LS0927) is from the Laptev Sea, the right one (L-9-77 714) is from the Beaufort Sea. Located in separate regions, the sections are oriented towards each other. For better visual analysis, seismic sections were cut vertically at points of the same bottom depth in the Laptev and Beaufort seas (time 2.77 s) and then joined. The regions have similar geomorphological features—in both regional sections transition from shelf through continental slope to deep ocean zone is observed. The Laptev Sea shelf borders with the Amundsen and Nansen basins, the Beaufort Sea shelf—with the Canada Basin.
BSR in the seismic sections of the Beaufort Sea had been reported in a number of studies [8,23,30]. In the section L-9-77 714, BSR is observed on the continental slope from CDP 3030, time 1.5 s.
In the Laptev Sea, BSR was for the first time defined by the authors of the present research in 2018, in four seismic sections (LS0914, LS0923, LS0924, LS0927), acquired by JSC “MAGE” from the research vessel “Geolog Dmitriy Nalivkin” in 2009 [16]. In the section LS0927, proposed BSR is distinguished from the shelf break (CDP 7090, time 0.97 s). In Figure 9b, enlarged fragment of the sections LS0927 and LS0914 crossing is depicted [19], where certainly perfect coincidence of all seismic reflectors is observed, including BSR on time 3.12 s (0.35 s or ca. 600 m from the sea bottom, assuming acoustic waves velocity in GH saturated deposits 3500 ms). In central parts of regional sections LS0927 and L-9-77 714 (Figure 9a) remarkable forms of bathymetry are observed, probably connected with landslides on the continental slopes.
In Figure 9c, enlarged fragment of the seismic sections LS0927 and L-9-77 714 merging zone is depicted. It is evident, that BSRs are also located on approximately the same depth (time 3.12 s from bottom) there. This fact demonstrates high probability of the single genesis of BSRs, defined in these regions. Additionally, their location is in accordance with the defined zone of favorable thermobaric conditions for MH existence (Figure 7). It is worth noting, that in the zone of sections merging, in the Laptev Sea section, one more BSR is recognized on shallower depth (time 0.1 s from bottom), pinching out ten kilometers away from the merging point, also having phase inversed. Probably, this is caused by existence of more than one layer of GH, similar to the zone of Prudhoe Bay, mentioned above in this article. However, in the Beaufort Sea (Figure 9c) this horizon is not distinguished. As mentioned above, BSR serves as indirect evidence of GH, and further studies are needed to confirm their existence in these regions.
4. Discussion
All the parts of seismic sections, where the authors had revealed BSR, appeared to be within the forecast zone of MH stability, proposed in the current research, which is well observed in Figure 7. Moreover, almost all locations of confirmed GH existence in the Arctic Ocean, including Haakon Mosby Mud Volcano, and also sites of GH prediction on the basis of log data and BSR matched the forecast zone of MH existence. On the shallow part of the Siberian seas, subaquatic PF and gas seeps had been discovered. The latter are recognized by gas flares anomalies in echograms. In the north of the Laptev Sea shelf, near its transition to continental slope, a number of expeditions, including SWERUS-C3 in 2014, have revealed a zone of intensive gas emission [39]. Discovered seeps are probably connected with GH dissociation during PF degradation. Thus, the resulting scheme of zones with appropriate thermobaric conditions for MH existence in the studied area corresponds well to data of previous different independent studies, including those of the authors.
Meanwhile, a group of sites in the Atlantic Ocean near the Canadian East Coast did not concur with the predicted zone. It is assumed, that GH in this area were formed not only by methane, but also by its homologues, which had migrated from deep sources through faults and fracture zones [41]. By empirical data, it is known, that ethane, propane, butane form GH at lower pressures and higher temperatures, in comparison with methane [7]. Even minor presence of these components in mainly methane gas causes expanding of GH stability thermobaric conditions. Therefore, the zone of possible distribution of GH, formed by mixed HC gases, is wider than the zone, proposed in the current research for the forecast of MH. This circumstance specifies, that the authors’ forecast of favorable zones for GH occurrence is ultimately pessimistic, as in real conditions shallow deposits may contain not only pure methane.
Conducted forecast considerably differs from the regional research of the Russian scientists [54], in which the authors studied specifically Russian offshore areas, assuming Model 1, with high mineralization of water in shallow deposits. Besides, the substantial part of these areas (with bottom depths to 120 m) was eliminated from favorable zones, which was justified by absence of appropriate thermobaric conditions. However, actually, relic (metastable) GH conservation is possible there, as it has been confirmed by different studies [32,56,59].
Numerous studies of other researchers are devoted to the forecast of GH distribution in the Arctic region. Zone of MH distribution, proposed in the study of Wood, Jung [58], mainly concurs with the zone of favorable thermobaric conditions, obtained in the research [19] for Model 1, covering northern offshore areas, limited by the 64° latitude. Estimation of MH stability zone was also conducted by Giustiniani et al. [8], Marin Moreno et al. [9], on the basis of data, similar to that used in the present research. Besides, it is reasonable to consider significant studies of GH distribution, covering separate regions. Particularly, in the research of Miles [46], the forecast for European continental margins was made. Camps et al. [20] estimated stability zone of MH, as well as CO2 hydrates, offshore Scotland. Vadakkepuliyambatta et al. [55] investigated possible zones of GH distribution in the South-Western part of the Barents Sea, assuming hydrate-forming gas both as pure methane and as a mixture, also containing ethane and propane. It is worth noting, that GH studies are also conducted for the Antarctic. Giustiniani et al. [27] made forecast of GH distribution in the Ross Sea.
In the studies, mentioned above, GH distribution forecast was carried out with an assumption of high salinity of reservoir water. An important feature of the present research consists in assuming possibility of pure water presence in shallow deposits, which allows to predict an extended zone of hydrates distribution (Model 2). Apart from this, scrupulous processing of existent temperature data of NOAA was done, supposing selection of values, which referred to depths differing from bottom depths on respective measurement stations by less than 10%. Another crucial aspect of the present research is the extent of studied area, including the Arctic Ocean and adjacent northern offshore areas, limited by the 45° latitude.
It is significant to clarify, that GH exist not necessarily in all areas with favorable thermobaric conditions for their formation and conservation, but only in particular locations and zones, where gas either is present in situ in shallow sediments or comes from deep formations through faults, subvertical fractures, gas chimneys, channels of mud volcanoes and other migration paths.
5. Conclusions
The authors have created the cartographic schemes, including the scheme of GH distribution in the Arctic and the World Ocean (on the basis of the summarizing database GIS “AWO”) and the schemes of near-bottom water temperatures and possible MH distribution for northern latitudes from 45° to 90°. These schemes allow to conduct further important studies, connected with the forecast of GH saturation of shallow deposits and estimation of their gas resources. Besides, obtained results are significant for revealing zones of potential danger for development of conventional HC fields. It is reasonable to continue studies of existent CDP seismic data for identifying anomalies, associated with free gas or GH.
Author Contributions
V.B. developed methodology, supervised the research, analyzed the results, wrote the manuscript. A.K., A.Y. and I.B. collected and processed data using special software, conducted research. All authors reviewed and approved the final version of the article.
Funding
This research received no external funding.
Acknowledgments
The work was carried out in the framework of the research program “Conducting complex geological and geophysical research with the purposes of forecast, safe and efficient development of petroleum resources of the Arctic and Subarctic zones of the Earth” of the Russian Academy of Sciences. Authors are grateful to NOAA, USGS, GEBCO, Center for Hydrate Research of Colorado School of Mines for the open access data and software; JSC “MAGE” and its general director G.S. Kazanin for providing seismic data for the Laptev Sea. Authors are also grateful to anonymous reviewers whose recommendations helped to improve the article.
Conflicts of Interest
The authors declare no conflict of interest.
References
- Altynov, A.I.; Alyabina, I.O.; Arakcheev, A.N.; Ashik, A.M.; Baburin, V.L.; Badina, S.V.; Barsova, N.Y.; Baryshev, I.B.; Belousov, S.K.; Berdnikov, N.M.; et al. National Atlas of the Arctic; Roskartografiya: Moscow, Russia, 2017; p. 496. (In Russian)
- Bogoyavlensky, V.I. The Arctic and the World Ocean: Current Status, Prospects and challenges of Development of Hydrocarbon Resources. In Transactions of Free Economic Society of Russia; VEO Publ.: Moscow, Russia, 2014; Volume 182, pp. 11–175. (In Russian) [Google Scholar]
- Bogoyavlensky, V.I.; Bogoyavlensky, I.V.; Bogoyavlenskaya, O.V.; Nikonov, R.A. Perspectives of petroleum potential of sedimentary basins and basement of the Circum-Arctic Region. Geol. Oil Gas 2017, 5, 5–20. (In Russian) [Google Scholar]
- Gautier, D.L.; Bird, K.J.; Charpentier, R.R. Assessment of undiscovered oil and gas in the Arctic. Science 2009, 324, 1175–1179. [Google Scholar] [CrossRef] [PubMed]
- Gramberg, I.; Suprunenko, O.; Viskunov, K. Petroleum potential of the Arctic Super-basin. Prospect Prot. Miner. Resour. 2000, 12, 24–30. (In Russian) [Google Scholar]
- Potential of Gas Hydrates is Great, But Practical Development is Far Off. Today in Energy; U.S. Energy Information Administration, Independent Statistics and Analysis: Washington, DC, USA, 2012. Available online: https://www.eia.gov/todayinenergy/detail.php?id=8690 (accessed on 8 September 2018).
- Sloan, E.D. Offshore Hydrate Engineering Handbook; Center for Hydrate Research, Colorado School of Mines: Golden, CO, USA, 1998; 255p. [Google Scholar]
- Giustiniani, M.; Tinivella, U.; Jakobsson, M.; Rebesco, M. Arctic ocean gas hydrate stability in a changing climate. J. Geol. Res. 2013, 2013, 783969. [Google Scholar] [CrossRef]
- Marín-Moreno, H.; Giustiniani, M.; Tinivella, U.; Pinero, E. The challenges of quantifying the carbon stored in Arctic marine gas hydrate. Mar. Pet. Geol. 2016, 71, 76–82. [Google Scholar] [CrossRef] [Green Version]
- Andreassen, K.; Hogstad, K.; Berteussen, K.A. Gas hydrate in the southern Barents Sea, indicated by a shallow seismic anomaly. First Break 1990, 8, 235–245. [Google Scholar] [CrossRef]
- Andreassen, K.; Hart, P.E.; Grantz, A. Seismic studies of a bottom simulating reflection related to gas hydrate beneath the continental margin of the Beaufort Sea. J. Geophys. Res. Solid Earth 1995, 100, 12659–12673. [Google Scholar] [CrossRef]
- Andreassen, K.; Hubbard, A.; Winsborrow, M.; Patton, H.; Vadakkepuliyambatta, S.; Plaza-Faverola, A.; Gudlaugsson, E.; Serov, P.; Deryabin, A.; Mattingsdal, R.; et al. Massive blow-out craters formed by hydrate-controlled methane expulsion from the Arctic seafloor. Science 2017, 356, 948–953. [Google Scholar] [CrossRef]
- Bogoyavlensky, V.I. Emissions of gas and oil on land and offshore Arctic and the World Ocean. Drill. Oil 2015, 6, 4–9. (In Russian) [Google Scholar]
- Bogoyavlensky, V. Gas Blowouts on the Yamal and Gydan Peninsulas. GEO ExPro 2015, 12, 74–78. [Google Scholar]
- Bogoyavlensky, V.I.; Bogoyavlensky, I.V. Natural and technogenic threats in Arctic hydrocarbon fields search, prospecting and development. Miner. Resour. Russ. Econ. Manag. 2018, 2, 60–70. (In Russian) [Google Scholar]
- Bogoyavlensky, V.I.; Kazanin, G.S.; Kishankov, A.V. Dangerous gas-saturated objects in the World Ocean: The Laptev Sea. Drill. Oil 2018, 5, 20–29. (In Russian) [Google Scholar]
- Bogoyavlensky, V.I.; Kerimov, V.Y.; Olkhovskaya, O.O. Dangerous gas-saturated objects in the World Ocean: The Sea of Okhotsk. Oil Ind. 2016, 6, 43–47. (In Russian) [Google Scholar]
- Bogoyavlensky, V.I.; Kishankov, A.V. Dangerous gas-saturated objects in the World Ocean: The Bering Sea. Drill. Oil 2018, 9, 4–12. (In Russian) [Google Scholar]
- Bogoyavlensky, V.I.; Yanchevskaya, A.S.; Bogoyavlensky, I.V.; Kishankov, A.V. Gas hydrates in the Circum-Arctic Region aquatories. Arct. Ecol. Econ. 2018, 3, 42–55. (In Russian) [Google Scholar]
- Camps, A.P.; Long, D.; Rochelle, C.A.; Lovell, M.A. Mapping hydrate stability zones offshore Scotland. Geol. Soc. Lond. Spec. Publ. 2009, 319, 81–91. [Google Scholar] [CrossRef]
- Collett, T.S. Natural Gas Hydrates of the Prudhoe Bay and Kuparuk River area, North Slope Alaska. AAPG Bull. 1993, 77, 793–812. [Google Scholar]
- Dallimore, S.; Collett, T.; Uchida, T. Scientific Results from JAPEX/JNOC/GSC Mallik 2L-38 Gas Hydrate Research Well, Mackenzie Delta, Northwest Territories, Canada; Geological Survey of Canada: Ottawa, ON, Canada, 1999; Volume 544, 403p.
- Folder, P. Gas Hydrates: Resource and Hazard; Congressional Research Service, Library of Congress: Washington, DC, USA, 2011.
- Ginsburg, G.D.; Guseinov, R.A.; Dadashev, A.A.; Ivanova, G.A.; Kazantsev, S.A.; Solov’yev, V.A.; Telepnev, E.V.; Askeri-Nasirov, R.Y.; Yesikov, A.D.; Mal’tseva, V.I.; et al. Gas hydrates of the South Caspian. News AS Geol. Ser. 1992, 7, 5–20. (In Russian) [Google Scholar]
- Ginsburg, G.D.; Soloviev, V.A.; Cranston, R.E.; Lorenson, T.D.; Kvenvolden, K.A. Gas hydrates from the continental slope, offshore Sakhalin Island, Okhotsk Sea. Geo-Mar. Lett. 1993, 13, 41–48. [Google Scholar] [CrossRef]
- Ginsburg, G.D.; Soloviev, V.A. Submarine Gas Hydrates; VNIIOkeangeologia: Saint Petersburg, Russia, 1994; 199p. (In Russian) [Google Scholar]
- Giustiniani, M.; Tinivella, U.; Sauli, C.; Della Vedova, B. Distribution of the gas hydrate stability zone in the Ross Sea, Antarctica. Andean Geol. 2017, 45, 78–86. [Google Scholar] [CrossRef]
- Grantz, A.; Boucher, G.; Whitney, O.T. Possible solid gas hydrate and natural gas deposits beneath the continental slope of the Beaufort Sea. US Geol. Surv. Circ. 1976, 733, 17. [Google Scholar]
- Henriet, J.P.; Mienert, J. Gas Hydrates: Relevance to World Margin Stability and Climate Change; Geological Society of London: Bath, UK, 1998; Volume 137, 348p. [Google Scholar]
- Hutchinson, D.R.; Golmshtok, A.J.; Scholz, C.A.; Moore, T.C.; Lee, M.W.; Kuzmin, M. Bottom simulating reflector in Lake Baikal. EOS Trans. Am. Geophys. Union 1991, 72, 307. [Google Scholar]
- Istomin, V.A.; Yakushev, V.S. Gas Hydrates in Natural Conditions; Nedra: Moscow, Russia, 1992; 236p. (In Russian) [Google Scholar]
- Istomin, V.A.; Yakushev, V.S.; Makhonina, N.A.; Kvon, V.G.; Chuvilin, Y.M. Effect of gas hydrates self-conservation. Gas Ind. 2006, 3, 36–46. (In Russian) [Google Scholar]
- Judd, A.; Hovland, M. Seabed Fluid Flow. The Impact on Geology, Biology, and the Marine Environment; Cambridge University Press: New York, NY, USA, 2007; 475p. [Google Scholar]
- Kaul, N.; Foncher, Y.P.; Heesemann, M. Estimating mud expulsion rates from temperature measurements on Haakon Mosby Mud Volcano, SW Barents Sea. Mar. Geol. 2006, 229, 1–14. [Google Scholar] [CrossRef]
- Kayen, R.E.; Lee, H.J. Pleistocene slope instability of gas hydrate-laden sediment on the Beaufort Sea margin. Mar. Georesources Geotechnol. 1991, 10, 125–141. [Google Scholar] [CrossRef]
- Kruglyakova, R.P.; Byakov, Y.A.; Kruglyakova, M.V.; Chalenko, L.A.; Shevtsova, N.T. Natural oil and gas seeps on the Black Sea floor. Geo-Mar. Lett. 2004, 24, 150–162. [Google Scholar] [CrossRef]
- Kvenvolden, K.A. Methane hydrates and global climate. Glob. Biogeochem. Cycles 1988, 2, 221–229. [Google Scholar] [CrossRef] [Green Version]
- Kvenvolden, K.A.; Ginsburg, G.D.; Soloviev, V.A. Worldwide distribution of subaquatic gas hydrates. Geo-Mar. Lett. 1993, 13, 32–40. [Google Scholar] [CrossRef]
- Lobkovsky, L.I.; Nikiforov, S.L.; Ananiev, R.A.; Khortov, A.V.; Semiletov, I.P.; Jakobsson, M.; Dmitrievskiy, N.N. Recent geological–geomorphological processes on the east Arctic shelf: Results of the expedition of the icebreaker Oden in 2014. Oceanology 2015, 55, 926–929. [Google Scholar] [CrossRef]
- Lorenson, T.D.; Collett, T.S. Gas Hydrate Prospecting Using Well Cuttings and Mud-Gas Geochemistry from 35 Wells, North Slope, Alaska; U.S. Geological Survey Scientific Investigations Report 2011-5195; U.S. Geological Survey: Reston, VA, USA, 2011; 27p.
- Majorowicz, J.A.; Osadetz, K.G. Natural gas hydrate stability in the east coast offshore-Canada. Nat. Resour. Res. 2003, 12, 93–104. [Google Scholar] [CrossRef]
- Makogon, Y.F. Natural gas hydrates—A promising source of energy. J. Nat. Gas Sci. Eng. 2010, 2, 49–59. [Google Scholar] [CrossRef]
- Maksimov, V.M.; Tupysev, M.K.; Pronyushkina, S.M.; Kulpin, L.G. Problems of ecological and industrial safety of natural and technogenic offshore objects during exploration of the Arctic Shelf. Arct. Ecol. Econ. 2014, 16, 60–67. [Google Scholar]
- Marín-Moreno, H.; Minshull, T.A.; Westbrook, G.K.; Sinha, B.; Sarkar, S. The response of methane hydrate beneath the seabed offshore Svalbard to ocean warming during the next three centuries. Geophys. Res. Lett. 2013, 40, 5159–5163. [Google Scholar] [CrossRef] [Green Version]
- Mienert, J. Methane hydrate and submarine slides. In Encyclopedia of Ocean Sciences, 2nd ed.; Elsevier Ltd.: Oxford, UK, 2009; pp. 790–798. [Google Scholar]
- Miles, P.R. Potential distribution of methane hydrate beneath the European continental margins. Geophys. Res. Lett. 1995, 22, 3179–3182. [Google Scholar] [CrossRef]
- Obzhirov, A.; Shakirov, R.; Salyuk, A. Relations between methane venting, geological structure and seismo-tectonics in the Okhotsk Sea. Geo-Mar. Lett. 2004, 24, 135–139. [Google Scholar] [CrossRef]
- Pape, T.; Feseker, T.; Kasten, S.; Fischer, D.; Bohrmann, G. Distribution and abundance of gas hydrates in near-surface deposits of the Håkon Mosby Mud Volcano, SW Barents Sea. Geochem. Geophys. Geosyst. 2011, 12, 22. [Google Scholar] [CrossRef]
- Reagan, M.T.; Moridis, G.J. Oceanic gas hydrate instability and dissociation under climate change scenarios. Geophys. Res. Lett. 2007, 34. [Google Scholar] [CrossRef] [Green Version]
- Romanovskii, N.N.; Hubberten, H.-V.; Gavrilov, A.V.; Eliseeva, A.A.; Tipenko, G.S. Offshore permafrost and gas hydrate stability zone on the shelf of East Siberian Seas. Geo-Mar. Lett. 2005, 25, 167–182. [Google Scholar] [CrossRef] [Green Version]
- Schmidt, G.A.; Shindell, D.T. Atmospheric composition, radiative forcing, and climate change as a consequence of a massive methane release from gas hydrates. Paleoceanogr. Paleoclimatol. 2003, 18. [Google Scholar] [CrossRef] [Green Version]
- Scholl, D.W.; Cooper, A.K. VAMPs—Possible Hydrocarbon-Bearing Structures in Bering Sea Basin. AAPG Bull. 1978, 62, 2481–2488. [Google Scholar]
- Smith, S.L.; Judge, A.S. Estimates of methane hydrate volumes in the Beaufort-Mackenzie region, Northwest Territories. In Current Research; Golden Screen Cinemas (GSC): Mid Valley, Malaysia, 1995; pp. 81–88. [Google Scholar]
- Soloviev, V.A.; Ginsburg, G.D. Arctic seas of Russia. Gas hydrates environments and potential gas hydrate water areas. In Geology and Mineral Resources of the Russian Shelf Areas, Atlas; Scientific World: Moscow, Russia, 2004; pp. 128–132. [Google Scholar]
- Vadakkepuliyambatta, S.; Chand, S.; Bünz, S. The history and future trends of ocean warming-induced gas hydrate dissociation in the SW Barents Sea. Geophys. Res. Lett. 2017, 44, 835–844. [Google Scholar] [CrossRef]
- Weaver, J.S.; Stewart, J.M. In situ hydrates under the Beaufort Sea shelf. In Proceedings of the Fourth Canadian Permafrost Conference; Associate Committee on Geotechnical Research, National Research Council of Canada: Ottawa, ON, Canada, 1982. [Google Scholar]
- Westbrook, G.K.; Thatcher, K.E.; Rohling, E.J.; Piotrowski, A.M.; Pälike, H.; Osborne, A.H.; Nisbet, E.G.; Minshull, T.A.; Lanoisellé, M.; James, R.H.; et al. Escape of methane gas from the seabed along the West Spitsbergen continental margin. Geophys. Res. Lett. 2009, 36. [Google Scholar] [CrossRef] [Green Version]
- Wood, W.T.; Jung, W.Y. Modeling the extent of Earth’s marine methane hydrate cryosphere. In Proceedings of the 6th International Conference on Gas Hydrates (ICGH 2008), Vancouver, BC, Canada, 6–10 July 2008; pp. 6–10. [Google Scholar]
- Yakushev, V.S. Natural Gas and Gas Hydrates in Cryolithic Zone; VNIIGAZ: Moscow, Russia, 2009; 192p. (In Russian) [Google Scholar]
- Yakushev, V.S.; Semenov, A.P.; Bogoyavlensky, V.I.; Medvedev, V.I.; Bogoyavlensky, I.V. Experimental modeling of methane release from intrapermafrost relic gas hydrates when sediment temperature change. Cold Reg. Sci. Technol. 2018, 149, 46–50. [Google Scholar] [CrossRef]
- The General Bathymetric Chart of the Oceans (GEBCO). Available online: https://www.gebco.net/ (accessed on 15 July 2018).
- Landvik, J.Y.; Bondevik, S.; Elverhoi, A.; Jeldskaar, W.; Mangerud, J.; Salvigsen, O.; Siegert, M.J.; Svendsen, J.-I.; Vorren, T.O. The last glacial maximum of Svalbard and the Barents Sea area: Ice sheet extent and configuration. Quat. Sci. Rev. 1998, 17, 43–75. [Google Scholar] [CrossRef]
- Arctic Ocean. The Columbia Encyclopedia, 6th ed. Available online: https://www.encyclopedia.com (accessed on 30 October 2018).
- Phillips, P.; Gasparovic, R. The Gulf Stream. Ocean Remote Sensing Group, Johns Hopkins University Applied Physics Laboratory. Available online: http://fermi.jhuapl.edu/student/phillips/ (accessed on 10 July 2018).
- Woods Hole Oceanographic Institution. The Ocean Conveyor. Available online: https://www.whoi.edu/main/topic/ocean-conveyor (accessed on 30 October 2018).
- Aagaard, K.; Coachman, L.K.; Carmack, E. On the halocline of the Arctic Ocean. Deep Sea Research Part A. Oceanogr. Res. Pap. 1981, 28, 529–545. [Google Scholar]
- Schlitzer, R. Ocean Data View. 2018. Available online: https://odv.awi.de/ (accessed on 15 July 2018).
- National Centers for Environmental Information, National Oceanic and Atmospheric Administration. World Ocean Database Select and Search. Available online: https://www.nodc.noaa.gov/OC5/SELECT/dbsearch/dbsearch.html (accessed on 15 July 2018).
- Mehta, A.P.; Sloan, E.D. Improved thermodynamic parameters for prediction of structure H hydrate equilibria. AIChE J. 1996, 42, 2036–2046. [Google Scholar] [CrossRef]
- Sloan, E.D.; Sparks, K.A.; Johnson, J.J. Two-phase liquid hydrocarbon-hydrate equilibrium for ethane and propane. Ind. Eng. Chem. Res. 1987, 26, 1173–1179. [Google Scholar] [CrossRef]
- Center for Hydrate Research, Chemical Engineering Department, Colorado School of Mines. Publicly Available Software. Available online: http://hydrates.mines.edu/CHR/Software.html (accessed on 20 May 2018).
- Atlas of Hydrometeorological and Ice Conditions of the Russian Arctic Seas: Summary of Archive Materials and Results of Expedition Research of JSC “Arctic Scientific and Project Center of Shelf Developments” in 2012–2014; Oil Industry: Moscow, Russia, 2015; 128p. (In Russian)
- Skorobogatov, V.A.; Stroganov, L.V.; Kopeev, V.D. Geological Structure and Gas and Oil Content in Yamal; Nedra-Biznestsentr: Moscow, Russia, 2003; 352p. (In Russian) [Google Scholar]
- Mimachi, H.; Takeya, S.; Gotoh, Y.; Yoneyama, A.; Hyodo, K.; Takeda, T.; Murayama, T. Dissociation behaviors of methane hydrate formed from NaCl solutions. Fluid Phase Equilib. 2016, 413, 22–27. [Google Scholar] [CrossRef]
Figure 1.
Distribution of gas hydrates in the Arctic and the World Ocean. 1—confirmed by direct studies, including drilling, 2—predicted by log data, 3—predicted by other indirect evidence, including seismic data (BSR).
Figure 1.
Distribution of gas hydrates in the Arctic and the World Ocean. 1—confirmed by direct studies, including drilling, 2—predicted by log data, 3—predicted by other indirect evidence, including seismic data (BSR).

Figure 2.
Location of the studied area N and two megaregional lines 1–2 and 3–3’.

Figure 3.
Plots of water temperatures for stations in the area N, demonstrated in Figure 2.
Figure 3.
Plots of water temperatures for stations in the area N, demonstrated in Figure 2.

Figure 4.
Megaregional water temperature sections for lines 1–2 (a) and 3–3’ (b), demonstrated in Figure 2.
Figure 4.
Megaregional water temperature sections for lines 1–2 (a) and 3–3’ (b), demonstrated in Figure 2.

Figure 5.
Cartographic scheme of near-bottom water temperatures distribution in the Northern Hemisphere (above the 45° latitude) on the basis of available National Oceanic and Atmospheric Administration (NOAA) data.
Figure 5.
Cartographic scheme of near-bottom water temperatures distribution in the Northern Hemisphere (above the 45° latitude) on the basis of available National Oceanic and Atmospheric Administration (NOAA) data.

Figure 6.
Cartographic scheme of near-bottom water temperatures distribution in the Northern Hemisphere (above the 45° latitude), obtained as a result of analysis of data, demonstrated in Figure 5.
Figure 6.
Cartographic scheme of near-bottom water temperatures distribution in the Northern Hemisphere (above the 45° latitude), obtained as a result of analysis of data, demonstrated in Figure 5.

Figure 7.
Scheme of probable methane hydrates (MH) distribution in the Arctic Ocean and adjacent offshore areas, limited by the 45° latitude. 1—confirmed by direct studies, including drilling, 2—predicted by log data, 3—predicted by seismic data (BSR) and other indirect evidence, 4—Haakon Mosby Mud Volcano with gas hydrates, 5—BSR observations in the Laptev, Okhotsk, Bering and Beaufort seas, 6 and 7—zones with favorable thermobaric conditions for MH existence for Models 1 and 2 respectively, 8—favorable zone for subaquatic permafrost existence, 9—absence of appropriate conditions for MH existence in offshore areas.

Figure 8.
Scheme of probable MH distribution in the Norwegian, Barents and Kara seas. 1 and 2—zones with favorable thermobaric conditions for MH existence for Models 1 and 2 respectively, 3—favorable zone for subaquatic permafrost existence, 4—absence of appropriate conditions for MH existence in offshore areas, 5—conventional hydrocarbon fields, including those marked with white numbers—Shtokman (1), Bovanenkovo (2), Yamburg (3), Urengoy (4) and Messoyakha (5) [19].

Figure 9.
Results of joining seismic sections from the Laptev Sea (LS0927 and LS0914) and the Beaufort Sea (L-9-77 714): (a) regional sections LS0927 and L-9-77 714; (b,c) enlarged fragments of sections LS0927 and LS0914 (b), LS0927 and L-9-77 714 (c).
Figure 9.
Results of joining seismic sections from the Laptev Sea (LS0927 and LS0914) and the Beaufort Sea (L-9-77 714): (a) regional sections LS0927 and L-9-77 714; (b,c) enlarged fragments of sections LS0927 and LS0914 (b), LS0927 and L-9-77 714 (c).

© 2018 by the authors. Licensee MDPI, Basel, Switzerland. This article is an open access article distributed under the terms and conditions of the Creative Commons Attribution (CC BY) license (http://creativecommons.org/licenses/by/4.0/).
Share and Cite
MDPI and ACS Style
Bogoyavlensky, V.; Kishankov, A.; Yanchevskaya, A.; Bogoyavlensky, I. Forecast of Gas Hydrates Distribution Zones in the Arctic Ocean and Adjacent Offshore Areas. Geosciences 2018, 8, 453. https://doi.org/10.3390/geosciences8120453
AMA Style
Bogoyavlensky V, Kishankov A, Yanchevskaya A, Bogoyavlensky I. Forecast of Gas Hydrates Distribution Zones in the Arctic Ocean and Adjacent Offshore Areas. Geosciences. 2018; 8(12):453. https://doi.org/10.3390/geosciences8120453
Chicago/Turabian StyleBogoyavlensky, Vasily, Aleksei Kishankov, Alisa Yanchevskaya, and Igor Bogoyavlensky. 2018. "Forecast of Gas Hydrates Distribution Zones in the Arctic Ocean and Adjacent Offshore Areas" Geosciences 8, no. 12: 453. https://doi.org/10.3390/geosciences8120453
Note that from the first issue of 2016, this journal uses article numbers instead of page numbers. See further details here.