Article

Terraced Iron Formations: Biogeochemical Processes Contributing to Microbial Biomineralization and Microfossil Preservation

1
School of Biological Sciences, The University of Adelaide, Adelaide, South Australia 5005, Australia
2
CSIRO Land and Water, Contaminant Chemistry and Ecotoxicology, PMB2 Glen Osmond, South Australia 5064, Australia
3
School of Earth, Atmosphere & Environment, Monash University, Clayton, Victoria 3800, Australia
*
Author to whom correspondence should be addressed.
Geosciences 2018, 8(12), 480; https://doi.org/10.3390/geosciences8120480
Submission received: 30 October 2018 / Revised: 29 November 2018 / Accepted: 10 December 2018 / Published: 13 December 2018
(This article belongs to the Special Issue Microbial Biomineralization)

Abstract

:
Terraced iron formations (TIFs) are laminated structures that cover square meter-size areas on the surface of weathered bench faces and tailings piles at the Mount Morgan mine, which is a non-operational open pit mine located in Queensland, Australia. Sampled TIFs were analyzed using molecular and microanalytical techniques to assess the bacterial communities that likely contributed to the development of these structures. The bacterial community from the TIFs was more diverse compared to the tailings on which the TIFs had formed. The detection of both chemolithotrophic iron-oxidizing bacteria, i.e., Acidithiobacillus ferrooxidans and Mariprofundus ferrooxydans, and iron-reducing bacteria, i.e., Acidobacterium capsulatum, suggests that iron oxidation/reduction are continuous processes occurring within the TIFs. Acidophilic, iron-oxidizing bacteria were enriched from the TIFs. High-resolution electron microscopy was used to characterize iron biomineralization, i.e., the association of cells with iron oxyhydroxide mineral precipitates, which served as an analog for identifying the structural microfossils of individual cells as well as biofilms within iron oxyhydroxide laminations—i.e., alternating layers containing schwertmannite (Fe16O16(OH)12(SO4)2) and goethite (FeO(OH)). Kinetic modeling estimated that it would take between 0.25–2.28 years to form approximately one gram of schwertmannite as a lamination over a one-m2 surface, thereby contributing to TIF development. This length of time could correspond with seasonable rainfall or greater than average annual rainfall. In either case, the presence of water is critical for sustaining microbial activity, and subsequently iron oxyhydroxide mineral precipitation. The TIFs from the Mount Morgan mine also contain laminations of gypsum (CaSO·2H2O) alternating with iron oxyhydroxide laminations. These gypsum laminations likely represented drier periods of the year, in which millimeter-size gypsum crystals presumably precipitated as water gradually evaporated. Interestingly, gypsum acted as a substrate for the attachment of cells and the growth of biofilms that eventually became mineralized within schwertmannite and goethite. The dissolution and reprecipitation of gypsum suggest that microenvironments with circumneutral pH conditions could exist within TIFs, thereby supporting iron oxidation under circumneutral pH conditions. In conclusion, this study highlights the relationship between microbes for the development of TIFs and also provides interpretations of biogeochemical processes contributing to the preservation of bacterial cells and entire biofilms under acidic conditions.

1. Introduction

Terrace iron formations (TIFs) are travertine-like structures that commonly occur within engineered and natural environments, e.g., streams or rivers, that are impacted by acid mine drainage (AMD). The overall morphology of these structures is analogous to steps: horizontal surfaces are relatively flat, while the rise and rim, i.e., edge or ‘nose’ of each step is coarse and composed of centimeter-size lobate structures (Figure 1; also see [1,2,3,4] and references therein). The development of TIFs has been attributed to a combination of biogeochemical and hydrological factors of acid mine drainage environments in which these structures form. From a biogeochemical perspective, acidophilic, iron-oxidizing bacteria, e.g., Acidithiobacillus ferrooxidans and Leptospirillum ferriphilum, are known to colonize and accelerate the dissolution of metal sulfides. In doing so, they form secondary iron oxyhydroxide mineral (IOM) precipitates, such as schwertmannite, which comprises TIFs [1,2,3,4,5,6,7,8,9,10,11,12]. In addition to chemolithotrophic bacteria, iron oxidation has also been attributed to phototrophic microbes, such as cyanobacteria and algae, which produce oxygen as by-products [2]. From a physical perspective, TIF morphology has also been attributed to water flow rates [3]. Therefore, the overall step-like morphology can depend on what factors influence its structural development. Previous studies have suggested that TIF structure and development could be considered a modern analog for stromatolites or Martian iron oxyhydroxides [13,14]. More recently, these structures have been used to estimate the mobility of silver, since Ag+ can form argentojarosite (AgFe3(SO4)2(OH)6) [15,16,17]. Additionally, gold biogeochemical cycling has been closely linked to iron cycling. Under acidic, ferric iron-rich conditions, gold would likely be mobile as pure gold nanoparticles or gold sulfide nanoparticles [18].
Microfossils are nanometer to micrometer-size textural features within a rock. The preservation of microfossils with an ancient or modern iron-bearing matrix provides insight into the biogeochemical conditions under which microbial cells and biofilms were preserved [19,20,21,22]. Previous studies have primarily focused on TIFs that developed on gently sloping surfaces where quiescent water often forms meter-size pools–e.g., AMD-affected rivers, streams, and abandoned mine drainage channels [2,3,4,17]. Additionally, few studies have looked at the internal ‘architecture’ of TIFs at the micrometer scale as a means of interpreting past biogeochemical processes [2,14]. The purpose of this study was to use a multianalytical approach by combining biomolecular analyses with structural and chemical characterization of nanometer to millimeter-sized features comprising TIFs that formed on steeply sloped surfaces–i.e., TIFs primarily comprised of coarse rims and centimeter-size ‘steps’. In doing so, this study aims to highlight the interaction between microbes and minerals, as well as how this interaction corresponds to environmental conditions promoting TIF development.

2. Materials and Methods

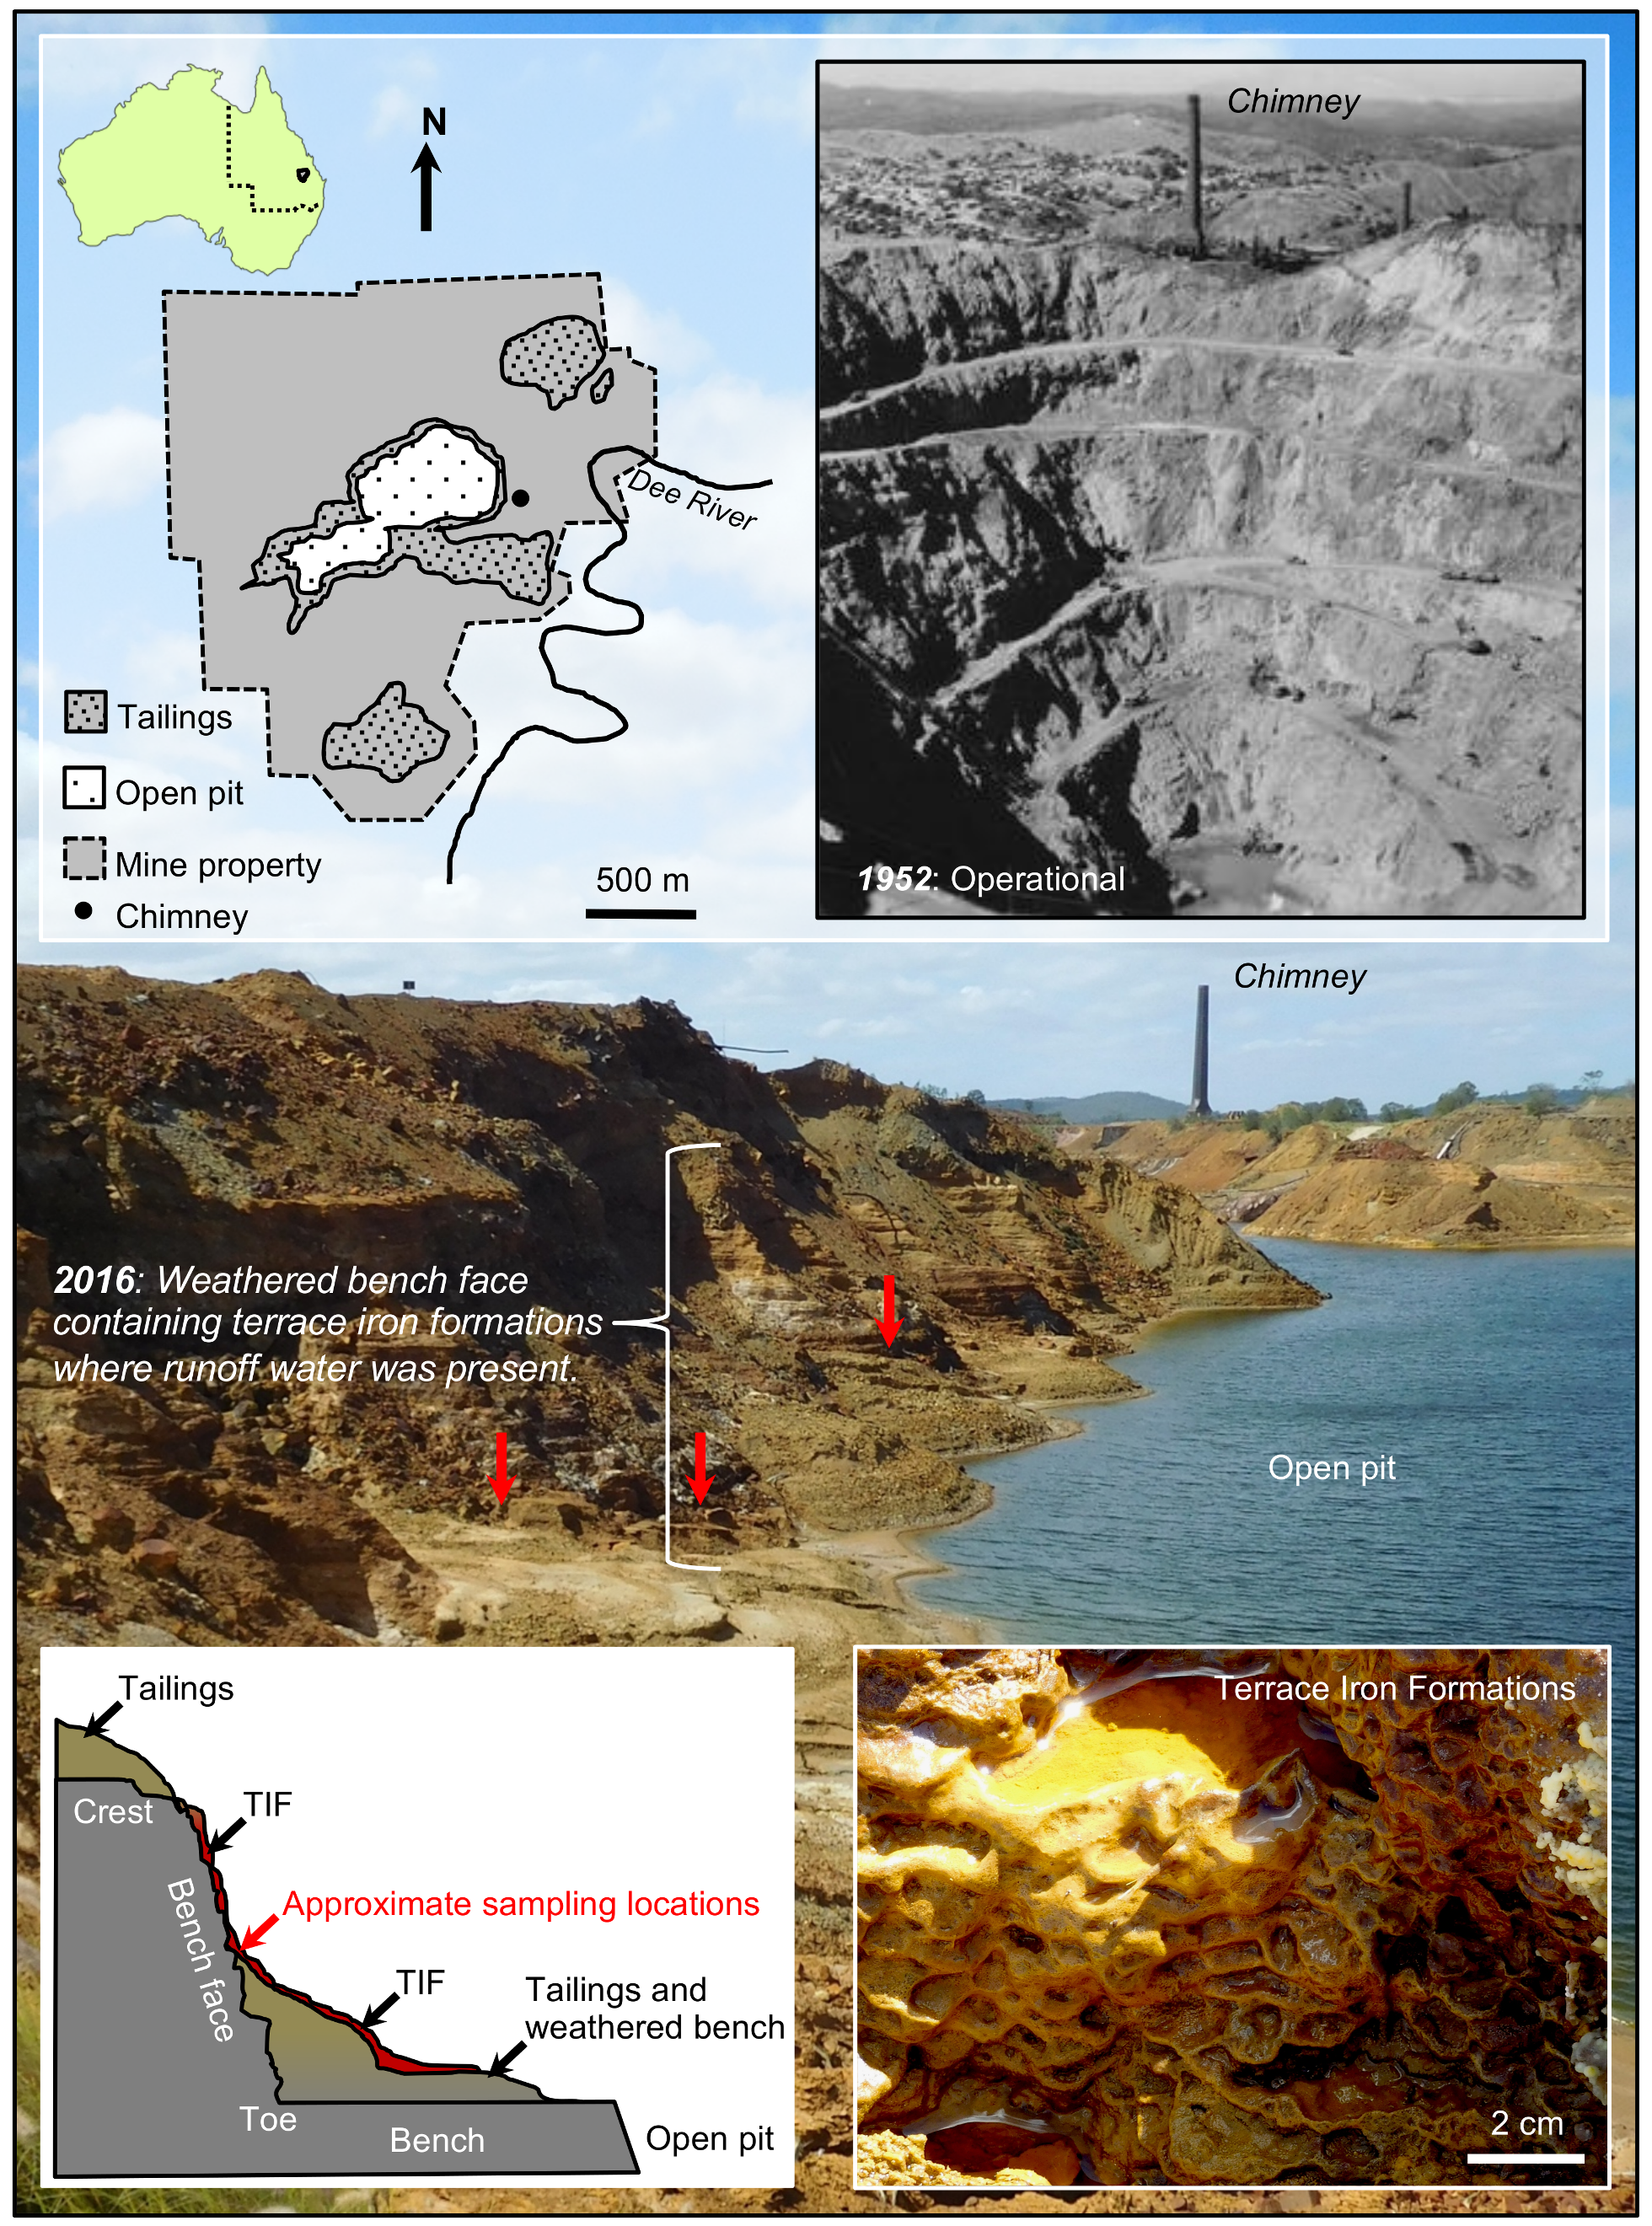
2.1. Field Site and Sampling Acquisition

The Mount Morgan mine (Queensland, Australia) is an open pit mine that was a source of gold and copper from 1882–1981. Recently, the mine has been the focus of rehabilitation as AMD has impacted the nearby Dee River [23]. Tailings are located throughout the mine and are primarily composed of pyrite (FeS2), pyrrhotite (Fe1−xS), chalcopyrite (CuFeS2), and sphalerite ((Zn,Fe)S). During a field excursion (April 2016), bench faces and tailings piles were covered with TIFs (Figure 2). For this study, TIFs and associated tailings were aseptically collected from accessible locations where trickling water was present. Small standing pools on TIFs had an average pH of 3.2 ± 0.2 units; these measurements were obtained using a Trans Instruments pH meter calibrated using pH 1.5, 7.0, and 14 as reference standards. The TIF samples were divided into aliquots for analysis.

2.2. Microbe and Mineral Characterization

2.2.1. Molecular Analysis

Using a PowerSoil® DNA isolation kit (Mo Bio Laboratories Inc., Carlsbad, USA), DNA was extracted from both a TIF aliquot and a tailings sample. The extracted DNA was used as a template for polymerase chain reaction (PCR) amplification of 16S rRNA using universal primers 27F and 1492R using the Applied Biosystem Veriti Thermal Cycler. Amplicons were checked using 1.5% agarose gel with 1:10,000 (v/v) Gel Red and run at a constant voltage of 80 V for one hour [24,25,26,27]. Further amplification, using 27F and 519R primers [24,28] was performed at the Australian Genome Research Facility (AGRF, Melbourne, Australia). Maximum-likelihood phylogenetic trees were constructed for the TIF and tailing samples using Biomatters Ltd. GENEIOUS 11.0.2. Sequences for tree construction were deposited in GenBank with accession number MK123312-MK123317.

2.2.2. Iron-oxidizing Bacterial Enrichment

Acidic, iron-oxidizing bacteria can be enriched from TIFs [17,18]. Using a sterile mortar and pestle, a second TIF aliquot was crushed into coarse granules—i.e., 10-mesh sieve size. Primary enrichments of an acidic, iron-oxidizing bacterial consortia were made by inoculating one gram of the crushed TIF into borosilicate glass test tubes containing 4.0 mL of modified growth medium defined for Acidithiobacillus ferrooxidans [29]. This medium, containing 3.03 mM of (NH4)2SO4, 0.57 mM of K2HPO4, 1.62 mM of MgSO4·7H2O, and 0.12 M of FeSO4·7H2O, was adjusted to pH 3.2 using 2 M of H2SO4, and was filter-sterilized using 0.22-µm pore size filters prior to use. The test tubes were covered with plastic push caps to prevent contamination and placed in a stationary 25 °C incubator for three weeks to ensure bacterial growth. Four sequential transfers were made by inoculating 0.5 mL of supernatant from the preceding enrichment into 4.5 mL of fresh growth medium. The purpose of these transfers was to obtain an enrichment without any remnants of the original TIF inoculum. From here on, the term ‘bacterial enrichment’ will refer to the terminal transfer. The conditions and duration of incubation were the same as previously described. After incubation of the bacterial enrichment, cells were harvested by centrifuging the supernatant (13,000 × g for two minutes) to form a bacterial pellet from which DNA was extracted and analyzed according to the method previously described. Sequences for tree construction were deposited in GenBank accession number with number MK129547-MK129548. Acidophilic, iron-oxidizing bacteria produce increased H+ concentrations as well as schwertmannite and hydronium jarosite ((H3O)Fe3(SO4)2(OH)6) as by-products of their active metabolism. These IOM precipitates occur as pseudoacicular and euhedral crystal morphologies, respectively [11,17,18,29,30]. The average pH of the bacterial enrichments was determined, and IOM precipitates were collected, air dried for 24 h, and weighed to obtain an average mass.

2.2.3. Electron Microscopy–Energy Dispersive Spectroscopy

Glutaraldehyde was added to additional bacterial enrichments for a final 2.5%(aq) glutaraldehyde concentrations. These bacterial enrichments were mixed by vortex and incubated for 48 h at 4 °C to insure the thorough fixation of cells. For scanning electron microscopy, a fixed bacterial enrichment was centrifuged to form a bacterial IOM pellet. Cells were dehydrated by sequentially resuspending the pellet in 25%(aq), 50%(aq), 75%(aq) and 3 × 100% ethanol solution for 15 min at each concentration. The dehydrated sample was critical point dried using a Tousimis Research Corporation Samdri-PVT-3B CP dryer, placed on an aluminum stub, and coated with a 10-nm thick deposition of iridium. This bacterial enrichment was analyzed using a JEOL JSM-7100 field emission gun (FEG) scanning electron microscope, which was equipped with an energy dispersive spectrometer (SEM–EDS). Secondary electron (SE) and backscatter electron (BSE) micrographs were taken using 1 kV and 20 kV, respectively. Micrographs were analyzed using ImageJ 1.50i data image processing software to estimate the relative amounts of schwertmannite (pseudoacicular mineral) and jarosite (euhedral mineral) within the bacterial enrichment.
For transmission electron microscopy, a second fixed bacterial enrichment was pelleted by centrifugation and enrobed in 2%(wt/vol) Noble agar, which was dehydrated in a serial 25%(aq), 50%(aq), 75%(aq) and 3 × 100% acetone solution for 30 min at each concentration and embedded in EponTM resin. The embedded samples were made into 80-nm thick ultrathin sections using a Reichert-Jung Ultracut E ultramicrotome. These ultrathin sections were collected on Formvar–carbon coated 200-square mesh copper grids and analyzed using a JEOL 1010 Transmission Electron Microscope (TEM) operating at 80 kV or 100 kV.

2.3. TIF Chemistry, Mineralogy, and Structure

2.3.1. Inductively Coupled Plasma–Mass Spectroscopy

A third TIF aliquot was air dried for 24 h and made into a powder with a particle size less than five µm, using a mortar and pestle. Approximately one gram of powdered TIF was dissolved in aqua regia, i.e., a 1:3 ratio of 70%(aq) HNO3 and 37%(aq) HCl, for two hours at 95 °C. The solution was cooled to 25 °C, diluted with deionized water (50 mL final volume), and twice filtered. The final solution was analyzed for soluble B, Na, Mg, Al, P, S, K, Ca, Cr, Mn, Fe, Co, Ni, Cu, Zn, As, Se, Mo, Ag, Cd, Sb, Au, and Pb using an Agilent 5100 Synchronous Vertical Dual View inductively coupled plasma–mass spectrometer (ICP–MS).

2.3.2. X-ray Diffraction

The remaining powdered TIF was pack-mounted onto slides and analyzed using a Bruker diffractometer operating at 40 kV with a copper anode source. X-ray diffraction data were collected from 2° to 40° 2θ with a 0.02° step-size and 230.4 s per step. Data were analyzed using the Bruker DIFFRAC.EVA software package and analyzed using the International Centre for Diffraction Data (ICDD) PDF-4 database.

2.3.3. X-Ray Florescence Microscopy

A fourth TIF aliquot was embedded in Epo-Tek® Resin and cut in half to obtain a cross-section. One half of the block was analyzed using the X-ray fluorescence microscopy (XFM) beamline equipped with a Maia detector at the Australian Synchrotron. The X-ray microprobe was operating at 18.5 keV, and the X-ray beam was focused to a 2 × 2 µm2 spot size. The block was mounted onto a sample holder that was attached to a translocation stage. The cross-section of the TIF was raster-scanned, and X-ray fluorescence spectra were acquired with a dwell time of 0.5 ms per pixel [31]. The accumulated spectra were analyzed using GeoPIXE software [32] to produce high-resolution elemental maps of Fe, Ca, and Cu [33]. Elemental detections were calibrated to pure Pt, Fe, and Mn foil standards with known densities. The XFM map was analyzed using ImageJ 1.50i to identify and triage regions, based on varying Fe:Ca:Cu ratios, for high-resolution scanning electron microscopy.

2.3.4. Solid Phase Scanning Electron Microscopy–Energy Dispersive Spectroscopy

The other half of the resin-embedded TIF was made into petrograph thin sections. These thin sections were coated with a 10-nm thick iridium deposition and analyzed using a JEOL JSM-7100 FEG–SEM or a FEI DualBeamTM focused ion beam (FIB)–SEM equipped with an EDS and operating at 1 kV or 20 kV. Nanometer and micrometer-scale structures from each identified region of the XFM map were characterized.

3. Results

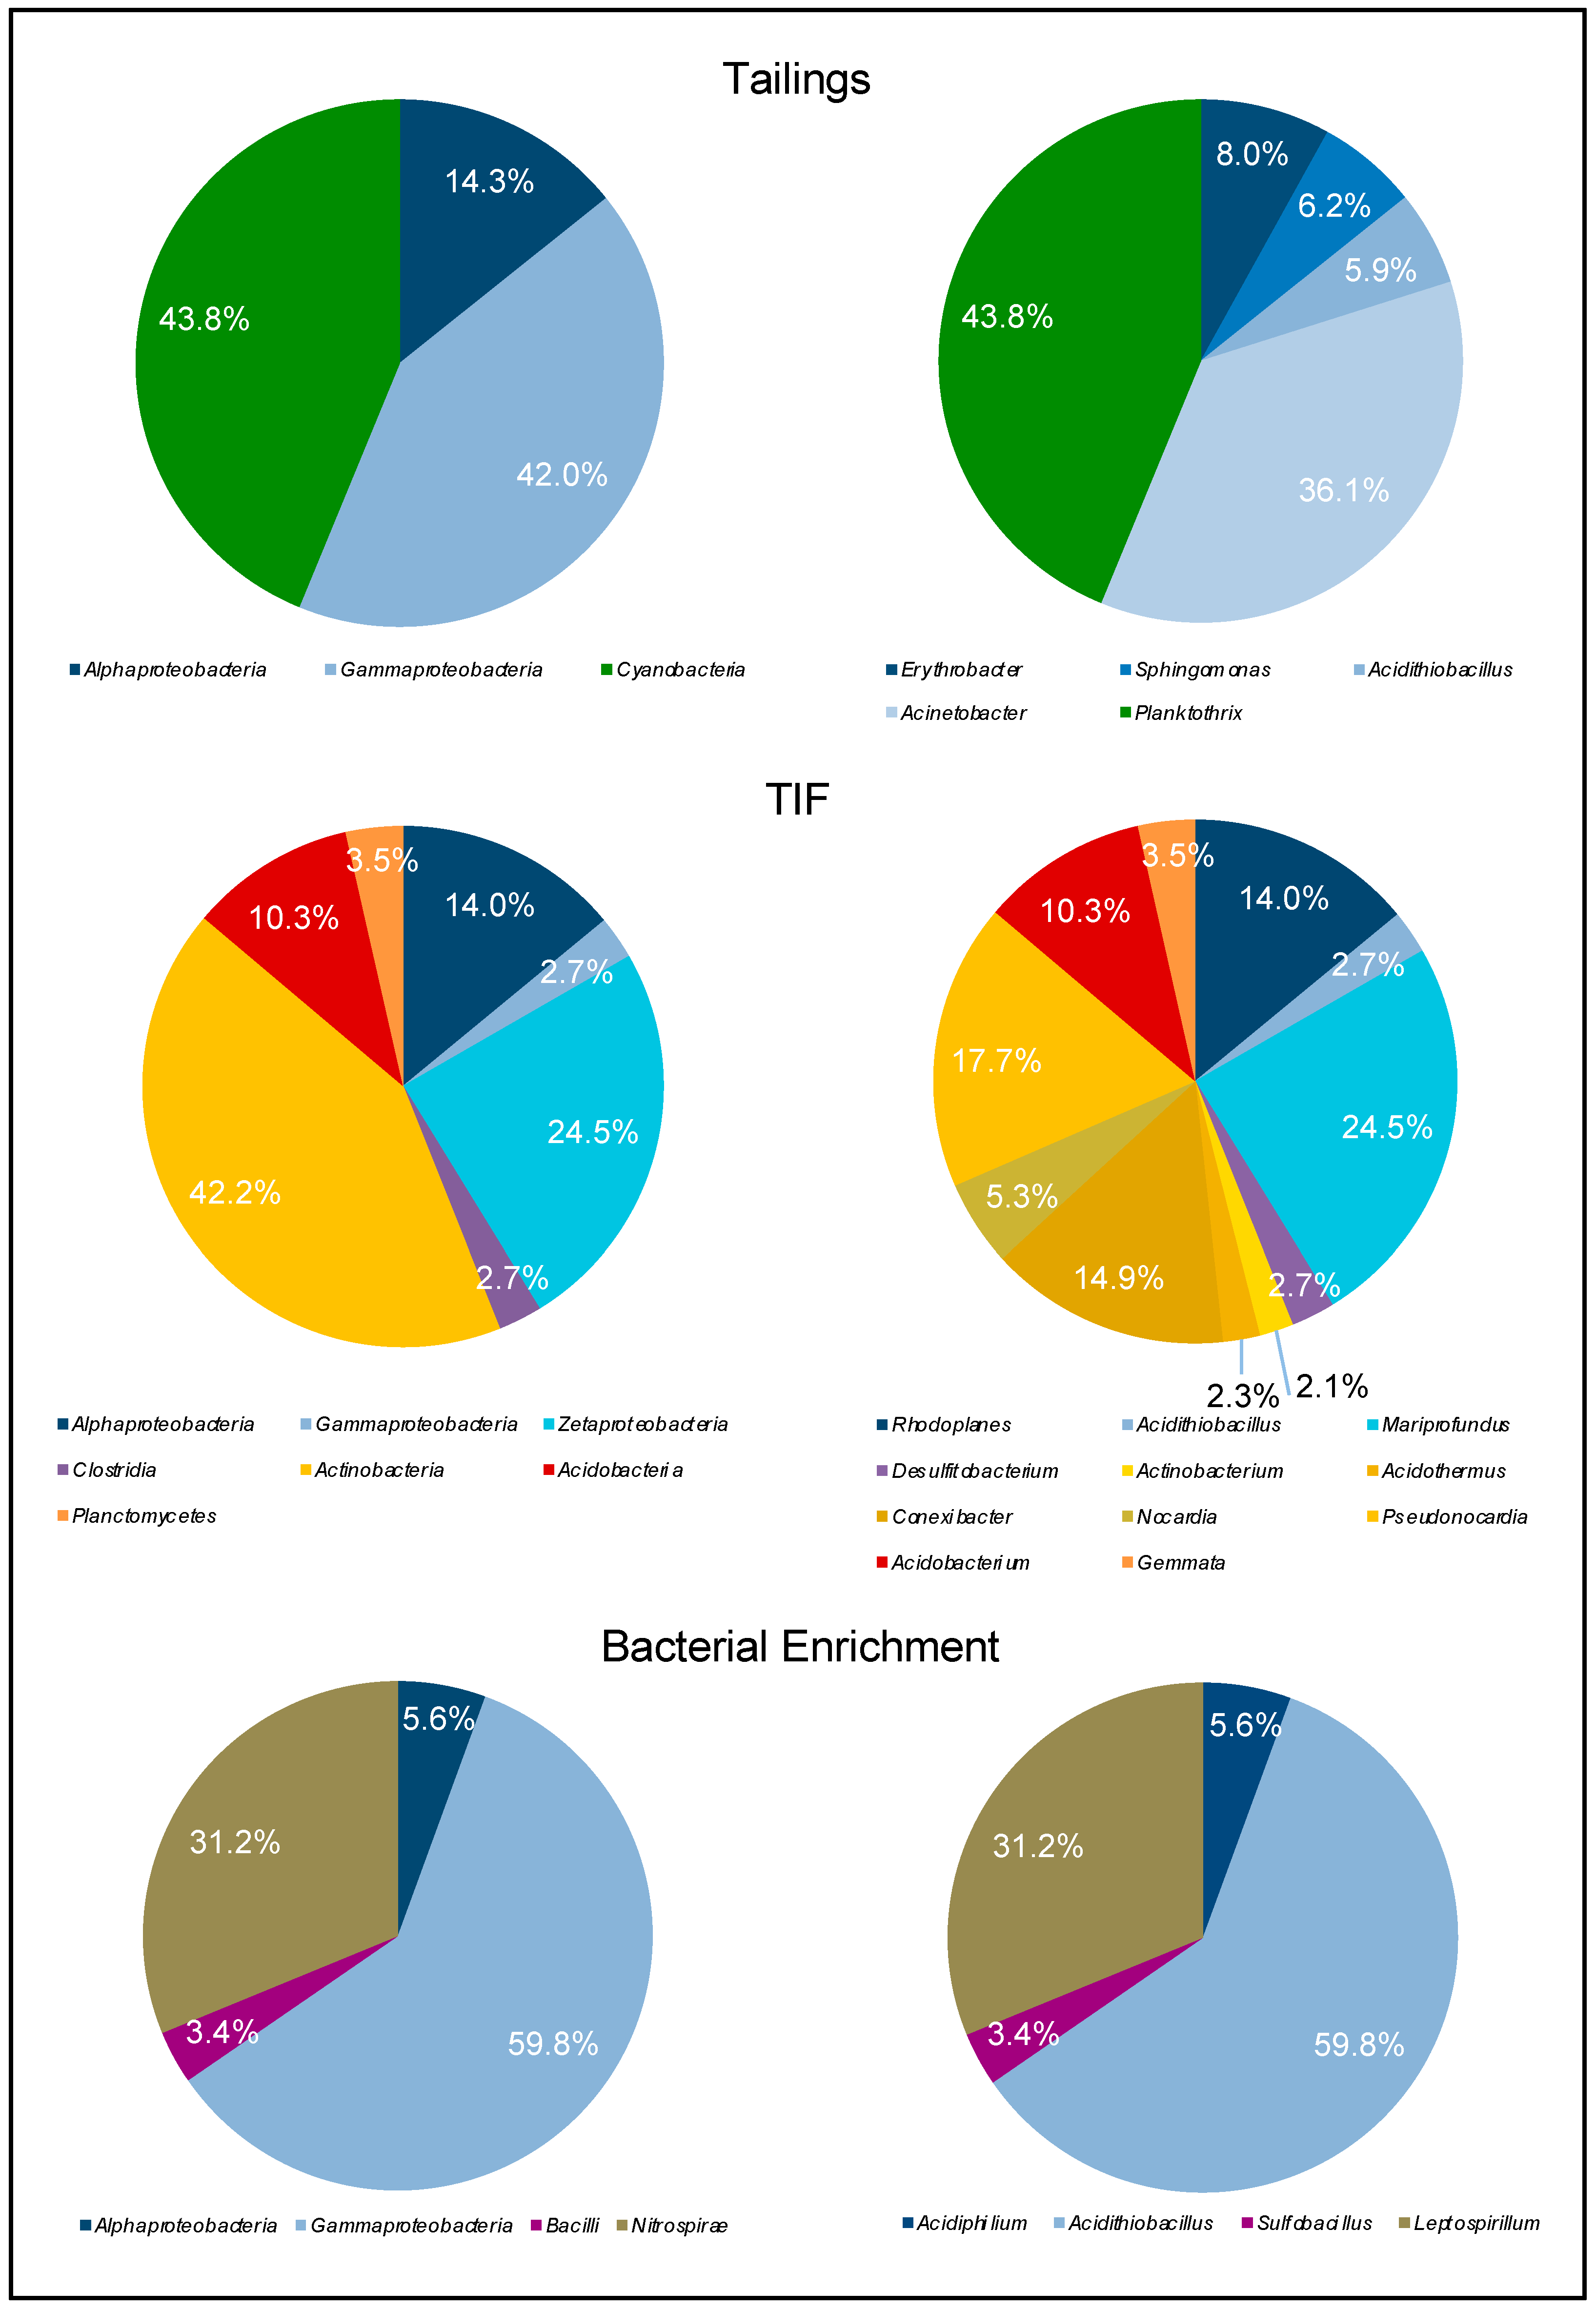
3.1. Microbial Diversity

The microbial community from the tailings was comprised of Proteobacteria and Cyanobacteria (Figure 3 and Figure 4). At the genus level, the tailings primarily contained Planktothrix sp. (43.8%) and Acidithiobacillus sp. (36.1%). In comparison, the microbial community of the TIFs was more diverse and was comprised of Actinobacteria, Acidobacteria, Proteobacteria, and Firmicutes (Figure 3 and Figure 4). Although Actinobacteria comprised the greater portion of the TIFs microbial community, the operational taxonomic units (OTUs) for Mariprofundus (24.5%) were most abundant. Pseudonocardia (17.7%) and Conexibacter (14.9%) were the next most abundant genera based on OTU abundances. Comparatively, Acidithiobacillus only constituted 2.7% of the bacterial community from the TIFs (Figure 4). It is important to note that the presence of a bacterial strain does not necessarily imply that it is actively mediating a particular reaction in an environment. However, a high relative abundance of microorganisms in an environment is suggestive of their capacity to regulate a particular process.

3.2. Iron-Oxidizing Bacterial Enrichment

The acidophilic, iron-oxidizing bacterial enrichment was composed of Acidithiobacillus sp. NU-1_LC115032, Acidithiobacillus ferriphilus DSM 100412_KY002491, Acidiphilium sp. X91796, Leptospirillum ferriphilum Am502933, and Sulfobacillus sp. BGR 123_GU168017 (Figure 3 and Figure 4). After incubation, the pH decreased from 3.2 to 2.4. The average mass of the IOM precipitate was 1.87 × 10⁻² g (± 7.57 × 10⁻⁴ g) and represented 6.1% of the total amount of ferrous iron, i.e., 0.12 M FeSO4·7H2O, from the growth medium that was oxidized and formed an IOM precipitate. Based on micrograph analysis, the IOM precipitate was composed of ca. 88.6% schwertmannite (pseudoacicular crystals; Figure 5a) and 11.4% jarosite (euhedral crystals; Figure 5b). Note that cells were closely associated with schwertmannite and appeared slightly mineralized (Figure 5a,c). Bacterial-shaped molds were present within the pseudoacicular schwertmannite (Figure 5b,d).

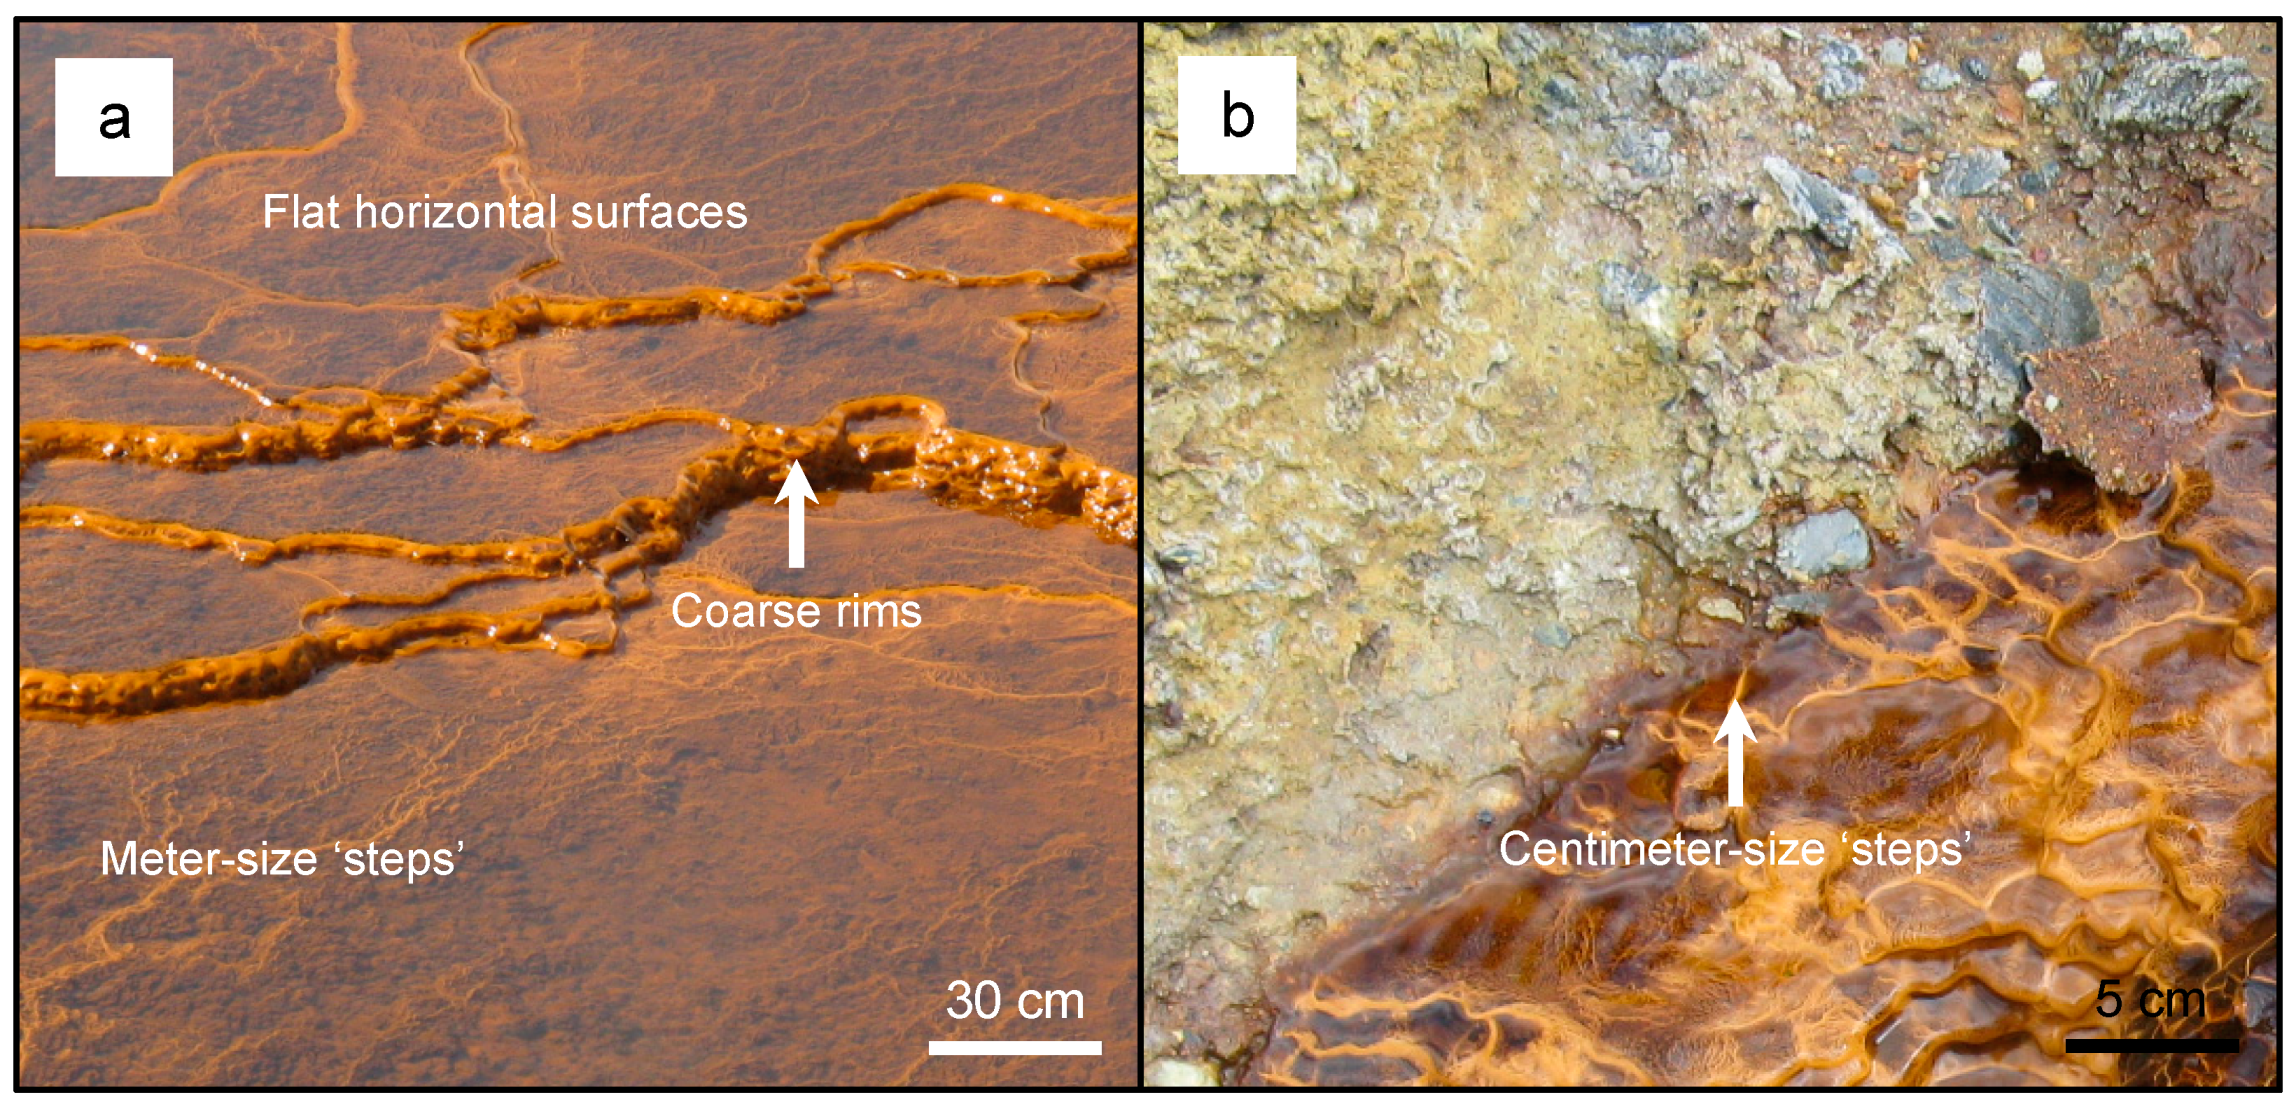
3.3. Structure and Chemistry of Terrace Iron Formations

The TIFs contained a variety of metals (Table 1). The average concentration of Fe, Ca, and Cu were 2.78 × 10⁵ (± 3.56 × 10⁴) µg g−1, 3.14 × 10⁴ (± 8.14 × 10²) µg/g, and 2.28 × 101 (± 2.11 × 100) µg/g, respectively. Based on XRD analysis, schwertmannite (Fe16O16(OH)12(SO4)2), goethite (FeO(OH)), gypsum (CaSO4·2H2O), and quartz (SiO2) were the minerals detected in the TIF (Supplemental Figure S1).
The distribution of Fe, Ca, and Cu in the XFM map highlighted the internal architecture of the TIF that was comprised of schwertmannite/goethite laminations and gypsum laminations. Image analysis of the XFM map identified a lower, middle, and upper region based on pixels representing Fe:Ca:Cu ratios. The lower region (1.0:0.1:0.2) was comprised of 200 µm to 2 mm size quartz grains—i.e., black particle structures. The interstitial space between these grains was filled with IOMs and Cu. The middle region (1.0:0.2:0.1) was primarily comprised of schwertmannite/goethite laminations with a small amount of gypsum. The upper region (1.0:0.5:0.1) had schwertmannite/goethite laminations alternating with laminations of larger gypsum crystals (Figure 6).
High-resolution SEM analysis confirmed that the lower region contained quartz particles and irregular shaped metal sulfide minerals (Figure 7a, inset). The IOMs surrounding metal sulfides contained oval and circular molds that also occurred at depth (Figure 7a,b). In the middle region, schwertmannite/goethite occurred as coatings on the outer surface of micrometer-size gypsum crystals. Some gypsum crystals were absent, thereby forming molds of these crystals and giving the schwertmannite/goethite lamination a pseudoporous appearance (Figure 8a). These schwertmannite/goethite coatings also contained circular and oval molds of varying size (Figure 8b–d). In the upper region, schwertmannite/goethite coatings occurred around larger gypsum crystals, and also contained an abundance of oval, circular, and filamentous-shaped molds of varying sizes (Figure 9).

4. Discussion

4.1. Interpreting Biogeochemical Processes Contributing to TIF Development

Terrace iron formations are a type of regolith material that act as a record of physical and biogeochemical weathering processes that contribute to their development over time within acid mine drainage environments. The Mount Morgan mine is located in a sub-tropical environment that receives an average annual rainfall of 741.8 L m−2 [34]. Within the mine, TIFs occur on bench faces and tailings piles (Figure 2), which are steeply sloped surfaces in comparison with the TIF-bearing rivers, hills, and drainage channels from previous studies [2,3,4,13,17]. Therefore, the majority of the water entering the open pit flows over the TIFs, thereby supporting the notion that TIF development is influenced, in part, by the hydrological dynamics of the environment [2]. In the presence of water, tailings provide an ideal substrate for bacterial attachment and biofilm development [6,35,36]. Sánchez España et al. [2] suggested that microbially mediated iron oxidation can be attributed to the metabolic activity of chemolithotrophic and phototrophic microbes. Additionally, iron oxidation and reduction can occur contemporaneously in weathered banded iron formation systems [37]. In the present study, A. ferrooxidans and Planktothrix spiroides were detected from the tailings. Therefore, it is reasonable to suggest that these microbes contributed, in part, to the oxidative weathering of metal sulfides, thereby producing ferric iron for TIF development (Reactions 1–3). It is important to note that Acidithiobacillus sp. E6-1, 3-8 HM769771 (Figure 3 and Figure 4, tailings and TIF) and Acidithiobacillus sp. NU-1_LC115032 (Figure 3 and Figure 4, bacterial enrichment) are phylogenetically similar to A. ferrooxidans ATCC19859 [38,39]. The detection of these acidophilic, iron-oxidizing bacteria is consistent with microbial communities from acid mine drainage environments [2,3,10,17,18,19,21,40,41,42,43]. The precipitation of pseudoacicular (or poorly crystalline) schwertmannite and the biomineralization of cellular structures from the bacterial enrichments (Figure 5) were analogs for identifying microfossils within the TIFs. Under more acidic conditions, i.e., between pH 2.2–2.5, schwertmannite can be converted into jarosite [30]. Additionally, jarosite can precipitate out of solution, depending on ferric iron concentration, temperature, and pH [44]. Therefore, the growth of acidophilic iron-oxidizing bacteria in the enrichments promoted conditions that were favorable for the abiotic precipitation of euhedral jarosite over time. The lack of jarosite detection from the TIFs in accordance with the pH of standing pools (pH 3.2 ± 0.2) suggests that conditions may not promote the conversion of schwertmannite to jarosite; hence, microfossils were preserved in the pseudoacicular IOM precipitate. The enrichment of A. ferrooxidans from TIFs can yield 4.8 × 10⁵ to 5.4 × 10⁷ cells mL−1 [17,18]. Based on the abundance of cells observed by microscopy in this study (Figure 4a), the number of cells in the bacterial enrichment likely occurred within this range. An A. ferrooxidans cell is comparable in mass (ca. 1.0 × 10⁻¹² g) to Escherichia coli, which is a model bacterium [45]. Therefore, the total mass of cells would be approximately 2.4 × 10⁻⁶ to 2.7 × 10⁻⁴ g, which is at least two orders of magnitude smaller than the mass of IOM precipitate (1.87 × 10⁻² g).
FeS2(s) + 14Fe3+(aq) + 8H2O(l) → 2SO42−(aq) + 15Fe2+(aq) + 16H+(aq)
6CO2(aq) + 6H2O(l) → C6H12O6(aq) + 6O2(aq)
4Fe2+(aq) + O2(aq) + 4H+(aq) → 4Fe3+(aq) + 2H2O(l)
Based on an analysis of the XFM map (Figure 6), the lower, middle, and upper regions represented different stages of biogeochemical Fe cycling concomitant with episodic, abiotic Ca dissolution/reprecipitation. The cycling of both elements contributed to TIF development. Tailings are known to contain chalcopyrite (CuFeS2) [46]. Although other copper sulfide minerals could exist in the tailings, e.g., chalcocite (Cu2S) or covellite (CuS), copper in the lower region was likely derived from chalcopyrite. The dispersion of copper and iron within interstitial spaces between tailing particles highlights the dissolution of metal sulfides and the mobility of copper under acidic conditions (Reactions 4–6). In terms of cellular preservation within a matrix, coccoid cells will appear as circular structures in cross-sections, depending on their orientation. Rod-shaped and filamentous cells will appear as circular to oval structures; however, the latter cell morphology can also appear as tubular structures [20,47,48]. In the lower region, structures within the IOM surrounding metal sulfides were interpreted as microfossils of clustered A. ferrooxidans (compare Figure 5a,b with Figure 7a) that were mineralized in poorly crystalline and pseudoacicular schwertmannite (compare Figure 5d and Figure 7b). As metal sulfides weathered, secondary ferrous iron minerals, i.e., schwertmannite and goethite, consolidated tailings particles. Therefore, it is reasonable to suggest that bacteria contributed, in part, to the stabilization of tailings particles, thereby making it a more cohesive substrate that is less susceptible to sedimentation and can function as a ‘foundation’ for TIF development. It is important to note that secondary mineral precipitates as well as extracellular polymeric substances can act as a passivation layer that inhibits metal dissolution [6,49,50].
CuFeS2(s) + 4O2(aq) → Cu2+(aq) + Fe2+(aq) + 2SO42−(aq)
4Fe2+(aq) + O2(aq) + 4H+(aq) → 4Fe3+(aq) + 2H2O
CuFeS2(s) + 16Fe3+(aq) + 8H2O → Cu2+(aq) + 17Fe2+(aq) + 2SO42−(aq) + 16H+(aq)
Based on the thickness of schwertmannite/goethite and gypsum lamination, the middle and upper regions were interpreted to represent different environmental conditions during TIF development. The precipitation of schwertmannite on the inside surface of the test tubes from the bacterial enrichments was an in vitro analog for the formation of schwertmannite/goethite on the surface of gypsum crystals (compare Figure 5a with Figure 8a,b and Figure 9a). Throughout the history of the mine, lime was used to minimize the generation of acid mine drainage [46], and is the likely source of Ca that is cycled in this environment [Reaction 7]. The pseudoporous appearance of the IOM precipitate (Figure 8a,b) can be attributed to the dissolution of gypsum [Reaction 8]. Therefore, it is reasonable to suggest that the middle regions represented wetter environmental conditions. As such, a greater input of water would have likely promoted abiotic/biotic metal sulfide dissolution, the growth of A. ferrooxidans, subsequent precipitation of thick schwertmannite/goethite laminations, and gypsum dissolution. Note that cells mineralized in pseudoacicular minerals were observed in both the lower and middle region (compare Figure 7c with Figure 8b inset). The study by Levett et al. [51] suggested that aluminum could have an important role in the preservation of cellular structures within iron duricrusts—i.e., canga. The acidic conditions of this environment would intuitively support the solubilization of aluminum and could also have an important role in the preservation of larger cellular structures within the schwertmannite/goethite laminations (Figure 8c).
CaO(s) + SO42−(aq) + 2H+(aq) + H2O(l) → CaSO4·2H2O(s)
CaSO4·2H2O(s) ⇆ Ca2+(aq) + SO42−(aq) + 2H2O(aq)
The upper regions represented drier environmental conditions, as interpreted by the large gypsum crystals that precipitated as adsorbed water evaporated. Additionally, the development of thinner schwertmannite/goethite laminations would likely occur with less water input. It is important to remember that the bacterial community from the TIFs was more diverse compared to the tailings (Figure 3 and Figure 4, tailings). More importantly, the detection of Mariprofundus ferrooxydans, i.e., a neutrophilic iron-oxidizing bacterium, and Acidobacterium capsulatum, i.e., an acid-tolerant, iron-reducing bacterium, highlights the continuum of iron biogeochemical cycling within the TIF. It should also be noted that TIFs can also act like a ‘trap’ for unconsolidated tailing particles that are mobile within water flowing over the TIF surface (Figure 6, arrows). Additionally, it is likely that Ca2+ concentrations in water vary locally and/or over time, so that circumneutral conditions can exist within microenvironments, thereby enabling the contribution of neutrophilic, iron oxidizers to contribute to TIF development. Therefore, the diversity of the microbial community from the TIFs could reflect the diversity of microfossil morphologies that were interpreted as mineralized biofilms (Figure 9b).

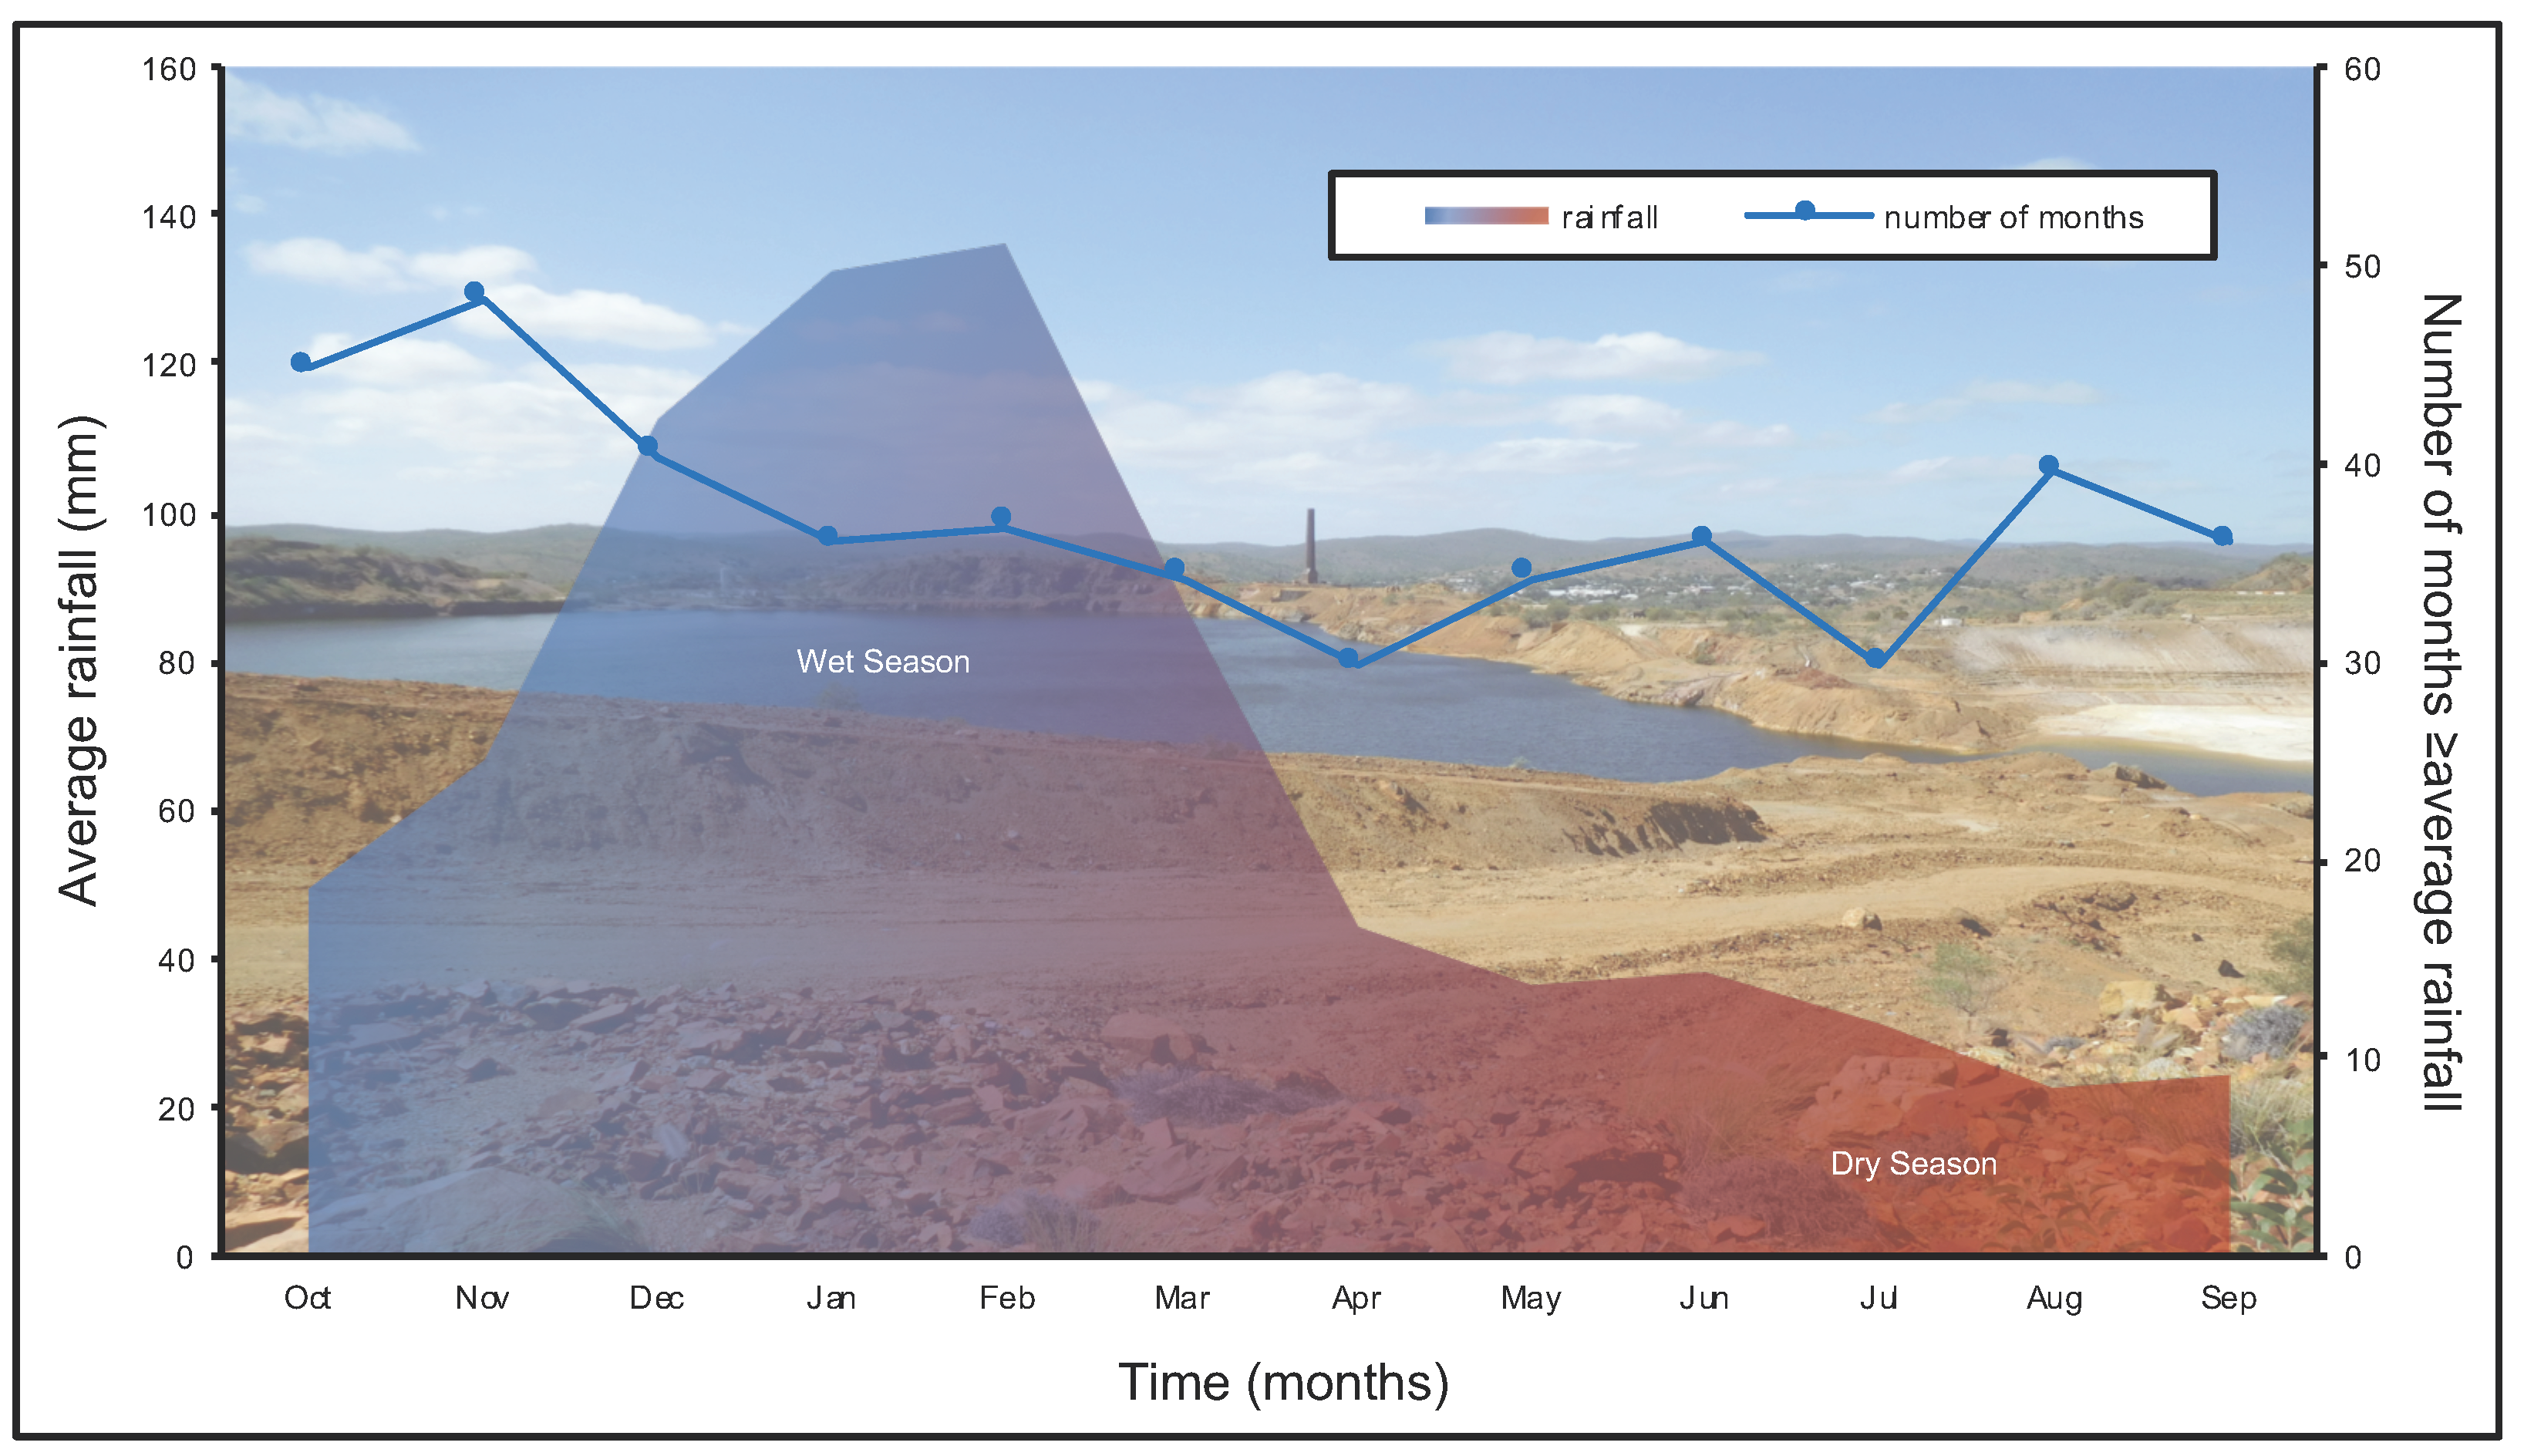
4.2. Estimating the Kinetics of TIF Development

To understand development of TIFs over time, the kinetics of schwertmannite lamina formation can be estimated. In acidic environments, the rate of (bio)geochemical iron oxidation can range between 1.22 × 101 to 1.11 × 10² ppm L−1 h−1 [2,52]. In this study, the amounts of ferric iron in IOM precipitates constituted 6.1% of the total amount of ferrous iron in the growth medium (0.12 M FeSO4·7H2O). Schwertmannite, which mineralized bacterial cells, constituted 88.6% of the IOM precipitate. It is important to note that the bacterial enrichments were incubated under optimal growth conditions and selected for A. ferrooxidans. However, it was evident that these acidophilic chemolithotrophic bacteria only comprised 2.7% of the bacterial community from the TIFs. Iron in the TIFs primarily represents the amount of ferrous iron that was oxidized and subsequently precipitated as a solid mineral. The length of time to develop a TIF was estimated by dividing the amount of iron in the TIFs by the iron oxidation rates as well as taking into account the rate-limiting factors—i.e., bacterial abundance, bacterially-mediated pseudoacicular IOM precipitation, and water availability (Table 2). In doing so, it would take between 0.25–2.28 years to develop one gram of schwertmannite over a 1 m2 to develop more TIF on benches or tailings within the Mount Morgan mine.
Interestingly, tens to hundreds of centimeter-thick TIFs were not observed. It is important to note that the wet season occurs between November and March; additionally, this region is subject to periods of drought, as well as higher than average rainfall (Figure 10). It is reasonable to suggest that TIF development within Mount Morgan is predominantly dependent on (1) water to sustain metabolic activity for iron biogeochemical cycling and (2) water evaporation to promote gypsum precipitation. Greater than average rainfall could dissolve gypsum laminations, thereby weakening the structural integrity of the TIFs as they become more porous. It is possible that the TIFs would also be subjected to hydromechanical weathering. Intuitively, sedimentation processes would weather TIFs, leading to bench surface destabilization and the deposition of TIF debris/fragments into the open pit. Therefore, TIFs occurring on the surface of bench faces and tailings likely represent the most recent seasonal to annual environmental conditions.
In regard to precious metal mobility, TIFs have been used to estimate the kinetics of silver mobility under acidic and ferric iron-rich conditions; additionally, iron biogeochemical cycling is closely linked to gold biogeochemical cycling [17,18,50,53,54]. In this present study, the detection of silver and gold from TIFs were close to detection limits (Supplemental Table S1), and likely occurred as residual silver/gold nanoparticles from the tailings that were ‘trapped’ within the TIF structure. Variable silver and gold concentrations as well as the difficulty of locating these precious metals within the TIFs highlights the challenge in estimating the kinetics of silver and gold mobility from these structures, especially if the entire TIF is subjected to physical weathering and sedimentation processes.

5. Conclusions

Terrace iron formations can act as a record of past biogeochemical conditions and processes. While these structures commonly occur within water-saturated locations of acid mine drainage environments, Mount Morgan TIFs formed on steep bench faces where runoff water was present. Molecular analyses revealed that the microbial communities comprising the TIFs were more diverse in comparison to the mine tailings on which they had formed. The detection of acidophilic iron-oxidizing bacteria (A. ferrooxidans), neutrophilic iron-oxidizing bacteria (M. ferrooxydans), as well as acid-tolerant iron-reducing bacteria (A. capsulatum) suggests that Fe biogeochemical cycling within TIFs is dynamic. The amount of secondary mineral precipitates, i.e., poorly crystalline schwertmannite and euhedral jarosite, produced by the bacteria enrichments represents a small fraction (6.1%) of the total amount of bacterially catalyzed ferric iron. However, the characterization of these secondary minerals and biomineralization served as an analog for identifying structural microfossils within the schwertmannite laminations of the TIFs as well as making interpretations of microbial contributions to TIF development. The development of schwertmannite laminations contributing to the overall structure of TIFs likely took approximately 0.25 to 2.28 years, based on calculation estimates. Interestingly, this duration could correspond with either the wet season or the months during the year that received greater than average rainfall. The input of water is critical for supporting microbial life, the (bio)oxidation of iron, and the precipitation of schwertmannite. Reduced water input, i.e., the dry season, likely contributed to the formation of gypsum laminations, on which bacteria colonized and eventually became mineralized in iron during the wet season. Therefore, this study highlights microbe–mineral interactions and structural microfossil preservation that can be used as a means for interpreting biomineralization and biogeochemical processes that contributed to TIF development.

Supplementary Materials

The following are available online at https://www.mdpi.com/2076-3263/8/12/480/s1, Figure S1: A powdered X-ray diffractogram of a TIF; Table S1: The elemental concentration (µg g−1) of three TIF samples based on ICP-MS analysis.

Author Contributions

The manuscript was developed through contributions of all authors. For this manuscript: conceptualization, methodology, data interpretation of microanalysis and writing—original draft preparation, J.S.; X-ray Florescence Mapping, J.S., M.A.R., B.E., J.B., F.R.; molecular analysis, M.A.R.; writing—review and editing. J.S., M.A.R., B.E., J.B., F.R. All authors have given approval to the final version of the manuscript.

Funding

This research was funded by Australian Research Council through the Australia Research Council Future Fellowship (FT150100250) granted to F. Reith.

Acknowledgments

Micro-analysis–i.e., XRD, SEM, and TEM analyses–were performed at the Center for Microscopy and Microanalysis (CMM) and Adelaide Microscopy (AM); nodes of the Australian Microscopy & Microanalysis Research Facility, Australia. Aqueous geochemical analysis–i.e., ICP-OES–was performed at CSIRO Analytical Chemistry Laboratory, Glen Osmond, Australia. Synchrotron-based elemental mapping–i.e., XFM mapping–was performed at the Australian Synchrotron (AS); proposal M12309. Thanks to Anya Yago, Rick Webb and Robyn Chapman (CMM), John Gouzos (CSIRO), David Paterson (AS) for their technical support. Additional thanks to Gordon Southam and Jenine McCutcheon for their support and insight.

Conflicts of Interest

The authors declare no conflict of interest.

References

  1. España, J.S.; Pamo, E.L.; Pastor, E.S.; Andrés, J.R.; Rubí, J.A.M. The natural attenuation of two acidic effluents in Tharsis and La Zarza-Perrunal mines (Iberian Pyrite Belt, Huelva, Spain). Environ. Geol. 2005, 49, 253–266. [Google Scholar] [CrossRef]
  2. Sánchez España, J.; Santofimia Pastor, E.; López Pamo, E. Iron terraces in acid mine drainage systems: A discussion about the organic and inorganic factors involved in their formation through observations from the Tintillo acidic river (Riotinto mine, Huelva, Spain). Geosphere 2007, 3, 133–151. [Google Scholar] [CrossRef]
  3. Brown, J.F.; Jones, D.S.; Mills, D.B.; Macalady, J.L.; Burgos, W.D. Application of a depositional facies model to an acid mine drainage site. Appl. Environ. Microbiol. 2011, 77, 545–554. [Google Scholar] [CrossRef] [PubMed]
  4. Sánchez España, J.; López Pamo, E.; Santofimia, E.; Aduvire, O.; Reyes, J.; Barettino, D. Acid mine drainage in the Iberian Pyrite Belt (Odiel river watershed, Huelva, SW Spain): Geochemistry, mineralogy and environmental implications. Appl. Geochem. 2005, 20, 1320–1356. [Google Scholar] [CrossRef]
  5. Jones, D.S.; Kohl, C.; Grettenberger, C.; Larson, L.N.; Burgos, W.D.; Macaladya, J.L. Geochemical niches of iron-oxidizing acidophiles in acidic coal mine drainage. Appl. Environ. Microbiol. 2015, 81, 1242–1250. [Google Scholar] [CrossRef]
  6. Jones, R.A.; Koval, S.F.; Nesbitt, H.W. Surface alteration of arsenopyrite (FeAsS) by Thiobacillus ferrooxidans. Geochim. Cosmochim. Acta 2003, 67, 955–965. [Google Scholar] [CrossRef]
  7. Bigham, J.M.; Schwertmann, U.; Carlson, L.; Murad, E. A poorly crystallized oxyhydroxysulfate of iron formed by bacterial oxidation of Fe(II) in acid mine waters. Geochim. Cosmochim. Acta 1990, 54, 2743–2758. [Google Scholar] [CrossRef]
  8. Bigham, J.M.; Schwertmann, U.; Traina, S.J.; Winland, R.L.; Wolf, M. Schwertmannite and the chemical modeling of iron in acid sulfate waters. Geochim. Cosmochim. Acta 1996, 60, 2111–2121. [Google Scholar] [CrossRef]
  9. Nordstrom, D.K. Aqueous pyrite oxidation and the consequent formation of secondary iron minerals. In Acid Sulfate Weathering; Kittrick, J.A., Fanning, D.S., Hosner, L.R., Eds.; Soil Science Society of America: Madison, WI, USA, 1982; pp. 37–56. [Google Scholar]
  10. Nordstrom, D.K.; Southam, G. Geomicrobiology of sulphide mineral oxidation. Rev. Mineral. 1997, 35, 362–390. [Google Scholar]
  11. Sasaki, K.; Sakimoto, T.; Endo, M.; Konno, H. FE-SEM study of microbially formed jarosite by Acidithiobacillus Ferrooxidans. Mater. Trans. 2006, 47, 1155–1162. [Google Scholar] [CrossRef]
  12. Sánchez-España, J.; Yusta, I.; Gray, J.; Burgos, W.D. Geochemistry of dissolved aluminum at low pH: Extent and significance of Al–Fe(III) coprecipitation below pH 4.0. Geochim. Cosmochim. Acta 2016, 175, 128–149. [Google Scholar] [CrossRef]
  13. Brake, S.S.; Hasiotis, S.T.; Dannelly, H.K. Diatoms in Acid Mine Drainage and Their Role in the Formation of Iron-Rich Stromatolites. Geomicrobiol. J. 2004, 21, 331–340. [Google Scholar] [CrossRef]
  14. Fernández-Remolar, D.C.; Knoll, A.H. Fossilization potential of iron-bearing minerals in acidic environments of Rio Tinto, Spain: Implications for Mars exploration. Icarus 2008, 194, 72–85. [Google Scholar] [CrossRef]
  15. Sasaki, K.; Tsunekawa, M.; Konno, H. Characterisation of argentojarosite formed from biologically oxidised Fe3+ ions. Can. Mineral. 1995, 33, 1311–1319. [Google Scholar]
  16. Groat, L.A.; Jambor, J.L.; Pemberton, B.C. The crystal structure of argentojarosite. Can. Miner. 2003, 41, 921–928. [Google Scholar] [CrossRef]
  17. Shuster, J.; Reith, F.; Izawa, M.; Flemming, R.; Banerjee, N.; Southam, G. Biogeochemical Cycling of Silver in Acidic, Weathering Environments. Minerals 2017, 7, 218. [Google Scholar] [CrossRef]
  18. Shuster, J.; Bolin, T.; MacLean, L.C.W.; Southam, G. The effect of iron-oxidising bacteria on the stability of gold (I) thiosulfate complex. Chem. Geol. 2014, 376, 52–60. [Google Scholar] [CrossRef]
  19. Ferris, F.; Hallbeck, L.; Kennedy, C.; Pedersen, K. Geochemistry of acidic Rio Tinto headwaters and role of bacteria in solid phase metal partitioning. Chem. Geol. 2004, 212, 291–300. [Google Scholar] [CrossRef]
  20. Levett, A.; Gagen, E.; Shuster, J.; Rintoul, L.; Tobin, M.; Vongsvivut, J.; Bambery, K.; Vasconcelos, P.; Southam, G. Evidence of biogeochemical processes in iron duricrust formation. J. S. Am. Earth Sci. 2016, 71, 131–142. [Google Scholar] [CrossRef]
  21. Preston, L.J.; Shuster, J.; Fernandez-Remolar, D.; Banerjee, N.R.; Osinski, G.R.; Southam, G. The preservation and degradation of filamentous bacteria and biomolecules within iron oxide deposits at Rio Tinto, Spain. Geobiology 2011, 9, 233–249. [Google Scholar] [CrossRef]
  22. Chi Fru, E.; Ivarsson, M.; Kilias, S.P.; Bengtson, S.; Belivanova, V.; Marone, F.; Fortin, D.; Broman, C.; Stampanoni, M. Fossilized iron bacteria reveal a pathway to the biological origin of banded iron formation. Nat. Commun. 2013, 4, 2050. [Google Scholar] [CrossRef] [Green Version]
  23. Edraki, M.; Golding, S.D.; Baublys, K.A.; Lawrence, M.G. Hydrochemistry, mineralogy and sulfur isotope geochemistry of acid mine drainage at the Mt. Morgan mine environment, Queensland, Australia. Appl. Geochem. 2005, 20, 789–805. [Google Scholar] [CrossRef]
  24. Lane, D.J. 16S:23S rRNA sequencing. In Nucleic Acid Techniques in Bacterial Systematics; Stackebrandt, E., Goodfellow, M., Eds.; John Wiley & Sons: New York, NY, USA, 1991; pp. 115–175. [Google Scholar]
  25. Osborn, A.M.; Moore, E.R.B.; Timmis, K.N. An evaluation of terminal-restriction fragment length polymorphism (T-RFLP) analysis for the study of microbial community structure and dynamics. Environ. Microbiol. 2000, 2, 39–50. [Google Scholar] [CrossRef] [PubMed]
  26. Reith, F.; Fairbrother, L.; Nolze, G.; Wilhelmi, O.; Clode, P.L.; Gregg, A.; Parsons, J.E.; Wakelin, S.A.; Pring, A.; Hough, R.; et al. Nanoparticle factories: Biofilms hold the key to gold dispersion and nugget formation. Geology 2010, 38, 843–846. [Google Scholar] [CrossRef]
  27. Bissett, A.; Fitzgerald, A.; Court, L.; Meintjes, T.; Mele, P.M.; Reith, F.; Dennis, P.G.; Breed, M.F.; Brown, B.; Brown, M.V.; et al. Introducing BASE: The Biomes of Australian Soil Environments soil microbial diversity database. Gigascience 2016, 5, 21. [Google Scholar] [CrossRef]
  28. Lane, D.J.; Pace, B.; Olsen, G.J.; Stahl, D.A.; Sogin, M.L.; Pace, N.R. Rapid determination of 16S ribosomal RNA sequences for phylogenetic analyses. Proc. Natl. Acad. Sci. USA 1985, 82, 6955–6959. [Google Scholar] [CrossRef]
  29. Silverman, M.P.; Lundgren, D.G. Studies on the chemoautotrophic iron bacterium Ferrobacillus Ferrooxidans. J. Bacteriol. 1959, 77, 642–647. [Google Scholar]
  30. Sánchez-España, J.; Yusta, I.; López, G.A. Schwertmannite to jarosite conversion in the water column of an acidic mine pit lake. Mineral. Mag. 2012, 76, 2659–2682. [Google Scholar] [CrossRef]
  31. Paterson, D.; de Jonge, M.D.; Howard, D.L.; Lewis, W.; McKinlay, J.; Starritt, A.; Kusel, M.; Ryan, C.G.; Kirkham, R.; Moorhead, G.; et al. The X-ray Fluorescence Microscopy Beamline at the Australian Synchrotron. In Proceedings of the AIP Conference, Chicago, IL, USA, 15–20 Aug 2010; pp. 219–222. [Google Scholar]
  32. CSIRO. GeoPIXE Software for SXRF Imaging. 2011. Available online: http://nmp.csiro.au/GeoPIXE.html (accessed on 7 October 2017).
  33. Li, K.; Etschmann, B.; Rae, N.; Reith, F.; Ryan, C.; Kirkham, R.; Howard, D.; Rosa, D.; Zammit, C.; Pring, A.; et al. Ore petrography using megapixel X-ray imaging: Rapid insights into element distribution and mobilization in complex Pt and U-Ge-Cu ores. Econ. Geol. 2016, 111, 487–501. [Google Scholar] [CrossRef]
  34. Bureau of Meteorology (Australian Government). Available online: www.bom.gov.au (accessed on 12 June 2018).
  35. Ehrlich, H.L. Bacterial oxidation of arsenopyrite and enargite. Econ. Geol. 1964, 59, 1306–1312. [Google Scholar] [CrossRef]
  36. Ehrlich, H.L. Microbes and metals. Appl. Microbiol. Biotechnol. 1997, 48, 687–692. [Google Scholar] [CrossRef]
  37. Gagen, E.J.; Levett, A.; Shuster, J.; Fortin, D.; Vasconcelos, P.M.; Southam, G. Microbial Diversity in Actively Forming Iron Oxides from Weathered Banded Iron Formation Systems. Microbes Environ. 2018. [Google Scholar] [CrossRef] [PubMed]
  38. Mazuelos, A.; Moreno, J.M.; Carranza, F.; Palomino, C.; Torres, A.; Villalobo, E. Biotic factor does not limit operational pH in packed-bed bioreactor for ferrous iron biooxidation. J. Ind. Microbiol. Biotechnol. 2012, 39, 1851–1858. [Google Scholar] [CrossRef] [PubMed]
  39. Ueoka, N.; Kouzuma, A.; Watanabe, K. Missing Iron-Oxidizing Acidophiles Highly Sensitive to Organic Compounds. Microbes Environ. 2016, 31, 244–248. [Google Scholar] [CrossRef] [PubMed] [Green Version]
  40. Rowe, O.F.; Sanchez-Espana, J.; Hallberg, K.B.; Johnson, D.B. Microbial communities and geochemical dynamics in an extremely acidic, metal-rich stream at an abandoned sulfide mine (Huelva, Spain) underpinned by two functional primary production systems. Environ. Microbiol. 2007, 9, 1761–1771. [Google Scholar] [CrossRef] [PubMed]
  41. Lopez-Archilla, A.I.; Marin, I.; Amils, R. Microbial Community Composition and Ecology of an Acidic Aquatic Environment: The Tinto River, Spain. Microb. Ecol. 2001, 41, 20–35. [Google Scholar] [PubMed]
  42. Johnson, D.B.; Hallberg, K.B. The microbiology of acidic mine waters. Res. Microbiol. 2003, 154, 466–473. [Google Scholar] [CrossRef]
  43. Schippers, A.; Sand, W. Bacterial leaching of metal sulfides proceeds by two indirect mechanisms via thiosulfate or via polysulfides and sulfur. Appl. Environ. Microbiol. 1999, 65, 319–321. [Google Scholar]
  44. Bigham, J.M.; Jones, F.S.; Özkaya, B.; Sahinkaya, E.; Puhakka, J.A.; Tuovinen, O.H. Characterization of jarosites produced by chemical synthesis over a temperature gradient from 2 to 40 °C. Int. J. Miner. Process. 2010, 94, 121–128. [Google Scholar] [CrossRef]
  45. Capaldo-Kimball, F.; Barbour, S. Involvement of recombination gemes in growth and viability of Eschichia coli K-12. J. Bacteriol. 1971, 106, 204–212. [Google Scholar]
  46. Gasparon, M.; Smedley, A.; Costagliola, P.; Benvenuti, M. Acid mine drainage at mount Morgan, Queensland (Australia): Experimental simulation and geochemical modelling of buffering reactions. In Proceedings of the IMWA Symposium 2007: Water in Mining Environments, Cagliari, Italy, 27–31 May 2007; pp. 433–436. [Google Scholar]
  47. Westall, F. The nature of fossil bacteria: A guide to the search for extraterrestrial life. J. Geophys. Res. Planet 1999, 104, 16437–16451. [Google Scholar] [CrossRef] [Green Version]
  48. McCutcheon, J.; Southam, G. Advanced biofilm staining techniques for TEM and SEM in geomicrobiology: Implications for visualizing EPS architecture, mineral nucleation, and microfossil generation. Chem. Geol. 2018, 498, 115–127. [Google Scholar] [CrossRef]
  49. Chan, C.S.; McAllister, S.M.; Leavitt, A.H.; Glazer, B.T.; Krepski, S.T.; Emerson, D. The Architecture of Iron Microbial Mats Reflects the Adaptation of Chemolithotrophic Iron Oxidation in Freshwater and Marine Environments. Front. Microbiol. 2016, 7, 796. [Google Scholar] [CrossRef] [PubMed]
  50. Shuster, J.; Lengke, M.F.; Márquez-Zavalía, M.F.; Southam, G. Floating gold grains and nanophase particles produced from the biogeochemical weathering of a gold-bearing ore. Econ. Geol. 2016, 111, 1485–1494. [Google Scholar] [CrossRef]
  51. Levett, A.; Gagen, E.J.; Diao, H.; Guagliardo, P.; Rintoul, L.; Paz, A.; Vasconcelos, P.M.; Southam, G. The role of aluminium in the preservation of microbial biosignatures. Geosci. Front. 2018. [Google Scholar] [CrossRef]
  52. Olson, G.J. Rate of pyrite bioleaching by Thiobacillus ferrooxidans: Results of an interlaboratory comparison. Appl. Environ. Microbiol. 1991, 57, 642–644. [Google Scholar] [PubMed]
  53. Shuster, J.; Marsden, S.; Maclean, L.; Ball, J.; Bolin, T.; Southam, G. The immobilization of gold from gold (III) chloride by a halophilic sulfate-reducing bacterial consortium. Geol. Soc. Lond. Spec. Pub. 2013, 393, 249–263. [Google Scholar] [CrossRef]
  54. Shuster, J.; Southam, G. The in-vitro “growth” of gold grains. Geology 2014, 43, 79–82. [Google Scholar] [CrossRef]
Figure 1. A photograph of meter-sized terraced iron formations (TIFs) (a) and centimeter-sized TIFs (b) that formed within the Lousal (Portugal) and Tharsis (Spain) open pit mines, respectively. Note that the coarse rims and centimeter-size steps that lobate the structures (arrows).
Geosciences 08 00480 g001
Figure 2. A schematic diagram of the Mount Morgan mine illustrating the deposition of mine tailings within the mine property and the sampling location (red arrows). The historic photograph, courtesy of State Library of Queensland, demonstrates the depth of the open pit during operation in 1952. Terrace iron formations had formed on weathered bench faces and on tailing piles.
Geosciences 08 00480 g002
Figure 3. A neighbor-joining phylogenetic tree of the bacterial species based on (OTUs) from the tailing, TIF, and bacterial enrichment samples.
Geosciences 08 00480 g003
Figure 4. Pie charts of the relative OTU abundances at the phylum level (left) and genus level (right) from the tailings, TIFs, and bacterial enrichment samples.
Geosciences 08 00480 g004
Figure 5. A low-magnification secondary electron (SE) scanning electron microscope (SEM) micrograph of the pseudoacicular schwertmannite with bacterial cells (a). The ‘flat’ edge (a, arrow) is attributed to the inside surface of the borosilicate glass test tubes on which the iron oxyhydroxide mineral (IOM) precipitate had nucleated. A high-magnification SE SEM micrograph of the euhedral jarosite (b). Note the bacterial-size mold within schwertmannite (b, arrow) and the bacterium to the left. A low-magnification transmission electron microscope (TEM) micrograph of two cells from the bacterial enrichment (c). Note the tangential section (left) and the cross-section (right) through the cells as well as preservation of the cell wall structure (c, arrow). A low-magnification TEM micrograph confirming the structure of bacterial molds within schwertmannite (d, arrow).
Geosciences 08 00480 g005
Figure 6. An X-ray fluorescence microscopy (XFM) map of the resin-embedded TIF showing the distribution of Fe, Ca, and Cu. The lower, middle, and upper regions are distinguished by the dashed line. Although tailing particles primarily occurred at the bottom, there also appeared to be accumulations on the ‘surface’ of the TIF. Note that the cleat-like fractures are an artifact of sample processing.
Geosciences 08 00480 g006
Figure 7. A low-resolution backscatter electron (BSE) SEM micrograph of a weathered metal sulfide and a quartz grain from the lower region (a, inset). A high-resolution BSE SEM micrograph of schwertmannite/goethite containing clusters of microfossils (a). Note that rod-shaped cells produce circular to oval-shaped structures in cross-section (a, arrows). A high-resolution SE SEM micrograph of the focused ion beam (FIB)-milled section, demonstrating that these microfossils also occurred at depth (b). Note the extensive extracellular mineralization of pseudoacicular minerals in comparison to the intercellular space, which has less mineralization (arrow, b).
Geosciences 08 00480 g007
Figure 8. A low-magnification BSE SEM micrograph of schwertmannite/goethite on the outer surface of the gypsum crystals from the middle region. Note the pseudoporous texture of the IOM when gypsum crystals are missing (a). A high-magnification BSE SEM micrograph of the pseudoporous IOM containing microfossils. Note that the arrow and box highlight microfossils with varying sizes. A high-magnification BSE SEM micrograph of a FIB-milled section is highlighted in the box. These molds occurred within pseudoacicular mineral (b, inset). A high-magnification BSE SEM micrograph of larger microfossils with preserved cell walls (arrows) and a representative energy dispersive spectrometer (EDS) spectrum of the surrounding mineral matrix (c).
Geosciences 08 00480 g008
Figure 9. A low-magnification BSE SEM micrograph of schwertmannite/goethite surrounding larger gypsum crystals from the upper region (a). A low-magnification BSE SEM micrograph of oval, circular, and filamentous microfossils of various sizes observed within the schwertmannite/goethite coatings. Collectively, these structures are interpreted to be a mineralized biofilm (b).
Geosciences 08 00480 g009
Figure 10. A plot of average monthly rainfall and the number of respective months with rainfall equal to or greater than the monthly average from 1901 to 2015. The environmental conditions of the wet and dry season highlight the chemical reaction that would likely be dominant. However, it is important to note that these reactions can occur contemporaneously as well as throughout the year. Data was obtained at Moonmera Station (#039067, 23.58° S 150.40° E) by The Bureau of Meteorology, Australian Government and is publicly available [34].
Geosciences 08 00480 g010
Table 1. The concentration (µg g−1) of elements from TIFs based on inductively coupled plasma–mass spectrometer (ICP-MS) analysis. See Supplemental Table S1 for detailed values for calculating average and standard deviation values.
Element (Detection Limit)Average (Standard Deviation)
B(5.0 × 10⁻²)<5.0 × 10⁻²
Na (2.0 × 10⁻¹)7.92 × 10² (± 3.97 × 10²)
Mg (1.0 × 10⁻¹)4.92 × 10³ (± 9.17 × 101)
Al (5.0 × 10⁻²)3.32 × 10⁴ (± 7.37 × 10²)
P (2.0 × 10⁻¹) 8.94 × 10² (± 6.84 × 101)
S (2.0 × 10⁻¹)7.46 × 10⁴ (± 4.08 × 10³)
K (2.0 × 10⁻¹)1.13 × 10² (± 3.12 × 101)
Ca (1.0 × 10⁻¹)3.14 × 10⁴ (± 8.14 × 10²)
Cr (5.0 × 10⁻²)6.47 × 101 (± 9.77 × 10⁻¹)
Mn (5.0 × 10⁻²)3.27 × 10² (± 5.08 × 101)
Fe (1.0 × 10⁻¹)2.78 × 10⁵ (± 3.56 × 10⁴)
Co (5.0 × 10⁻²)<5.0 × 10⁻²
Ni (5.0 × 10⁻²)<5.0 × 10⁻²
Cu (5.0 × 10⁻²)2.28 × 101 (± 2.11 × 100)
Zn (5.0 × 10⁻²)9.57 × 101 (± 7.91 × 10⁻¹)
As (5.0 × 10⁻²)1.29 × 101 (± 5.11 × 10⁻¹)
Se (5.0 × 10⁻²)<5.0 × 10⁻²
Mo (5.0 × 10⁻²)<5.0 × 10⁻²
Ag (2.0 × 10⁻¹)6.00 × 10⁻²
Cd (5.0 × 10⁻²)<5.0 × 10⁻²
Sb (1.0 × 10⁻¹)<1.0 × 10⁻¹
Au (2.0 × 10⁻¹)3.00 × 10⁻¹
Pb (1.0 × 10⁻¹)3.40 × 100 (± 3.00 × 10⁻¹)
Table 2. Calculations for determining the range of time taken for the development of one gram of schwertmannite to form a lamination within a 1 m2 area for TIF development.
Fe Oxidation Rate (ppm L−1 year−1) AFe3+ as Precipitate (ppm L−1 year−1) BFe3+ per m2 (ppm year−1) CTime (years) D
9.72 × 1051.42 × 1031.05 × 1060.25
1.07 × 1051.56 × 1021.16 × 1052.28
A Converted iron oxidation rate = (1.22 × 101 ppm L−1 h−1 or 1.11 × 10² ppm L−1 h−1) × 24 h day−1 × 365 days year−1. B Accounting for bacterially-mediated Fe3+(solid) = A × (88.6% as pseudoacicular IOM × 6.1% Fe3+ as solid precipitate) × 2.7% A. ferrooxidans abundance in TIFs. C Accounting for annual rainfall = B × 741.8 L m−2. D Time for TIF development = 2.64 × 10⁵ ppm Fe (average iron concentration in TIFs) ÷ C.

