Article

Microbial Geochemistry Reflecting Sulfur, Iron, Manganese, and Calcium Sources in the San Diego River Watershed, Southern California USA

1
Department of Geological Sciences, San Diego State University, 5500 Campanile Dr., San Diego, CA 92182-1020, USA
2
The San Diego River Park Foundation, 4891 Pacific Highway, Suite 114, San Diego, CA 92110, USA
3
City of San Diego, Storm Water Division, 9370 Chesapeake Dr. Suite 100, San Diego, CA 92123, USA
4
3826 Elkhorn Blvd., North Highlands, CA 95660, USA
*
Author to whom correspondence should be addressed.
Geosciences 2018, 8(12), 495; https://doi.org/10.3390/geosciences8120495
Submission received: 31 October 2018 / Revised: 5 December 2018 / Accepted: 14 December 2018 / Published: 17 December 2018
(This article belongs to the Special Issue Microbial Biomineralization)

Abstract

:
Microbial populations involved in forming the distinctive precipitates of S, Fe, Mn, and Ca in the San Diego River watershed reflect an interplay between the mineralogy of the rocks in the watershed, sparse rainfall, ground- and surface-water anoxia, and runoff of high sulfate, treated imported water. In the sparsely developed headwaters, the Temescal Creek tributary emerges from pyrite-bearing metamorphic rocks, and thus exhibits both an oxidized Fe and reduced S. In the middle reaches, the river moves through developed land where treated, imported high sulfate Colorado River water enters from urban runoff. Mast Park surrounded by caliche-bearing sedimentary rocks is a site where marl is precipitating. Cobbles in riffles along the river are coated black with Mn oxide. When the river encounters deep-seated volcanic bedrock, it wells up to precipitate both Fe and Mn oxides at the Old Mission Dam. Then, directly flowing through caliche-laced sedimentary rocks, Birchcreek tributary precipitates tufa. Further downstream at a site under a bridge that blocks sunlight, a sulfuretum sets up when the river is deoxygenated. Such a rich geochemistry results in activity of iron and manganese oxidizing bacteria, sulfur oxidizers and reducers, and cyanobacteria precipitating calcareous marl and tufa.

1. Introduction

In 2015, amidst the 2012–2017 drought in California, there was a significant increase in the number of complaints from the public about the smell (hydrogen sulfide, H2S) emanating from the nearby San Diego River (SDR), particularly around the Fashion Valley shopping mall (Figure 1). Whereas public complaints in the warm-temperature, low-flow months (Aug.–Dec.) were historically common, the number of calls in 2015 was unique. This led public agencies (U.S. Bureau of Reclamation, City of San Diego, CA, USA) and a non-profit organization (The San Diego River Park Foundation) to conduct investigations, convene stakeholders, and utilize existing data in an attempt to identify the sources of the H2S. Biologists from the City of San Diego, Storm Water Division conducted source-tracking investigations to determine if the water quality was being impacted by illicit discharges entering the river via the storm drain system. They concluded that the cause was likely due to natural sources such as sulfate reduction.
Tracing the pathways of sulfur, moving through the watershed monthly during San Diego River Park Foundation (SDRPF) monitoring events, resulted in coincidental observations about other distinctive biogeochemical processes in the SDR. This paper analyzes S, Fe, Mn, and Ca availability, studied monthly over a year and a half, through comparison of water and rock chemistry with microbial precipitates. Geology, water chemistry, and water treatment sources for these ions were tabulated to learn which processes dominated or interacted to create ideal conditions for the distinctive natural microbial communities.

2. Materials and Methods
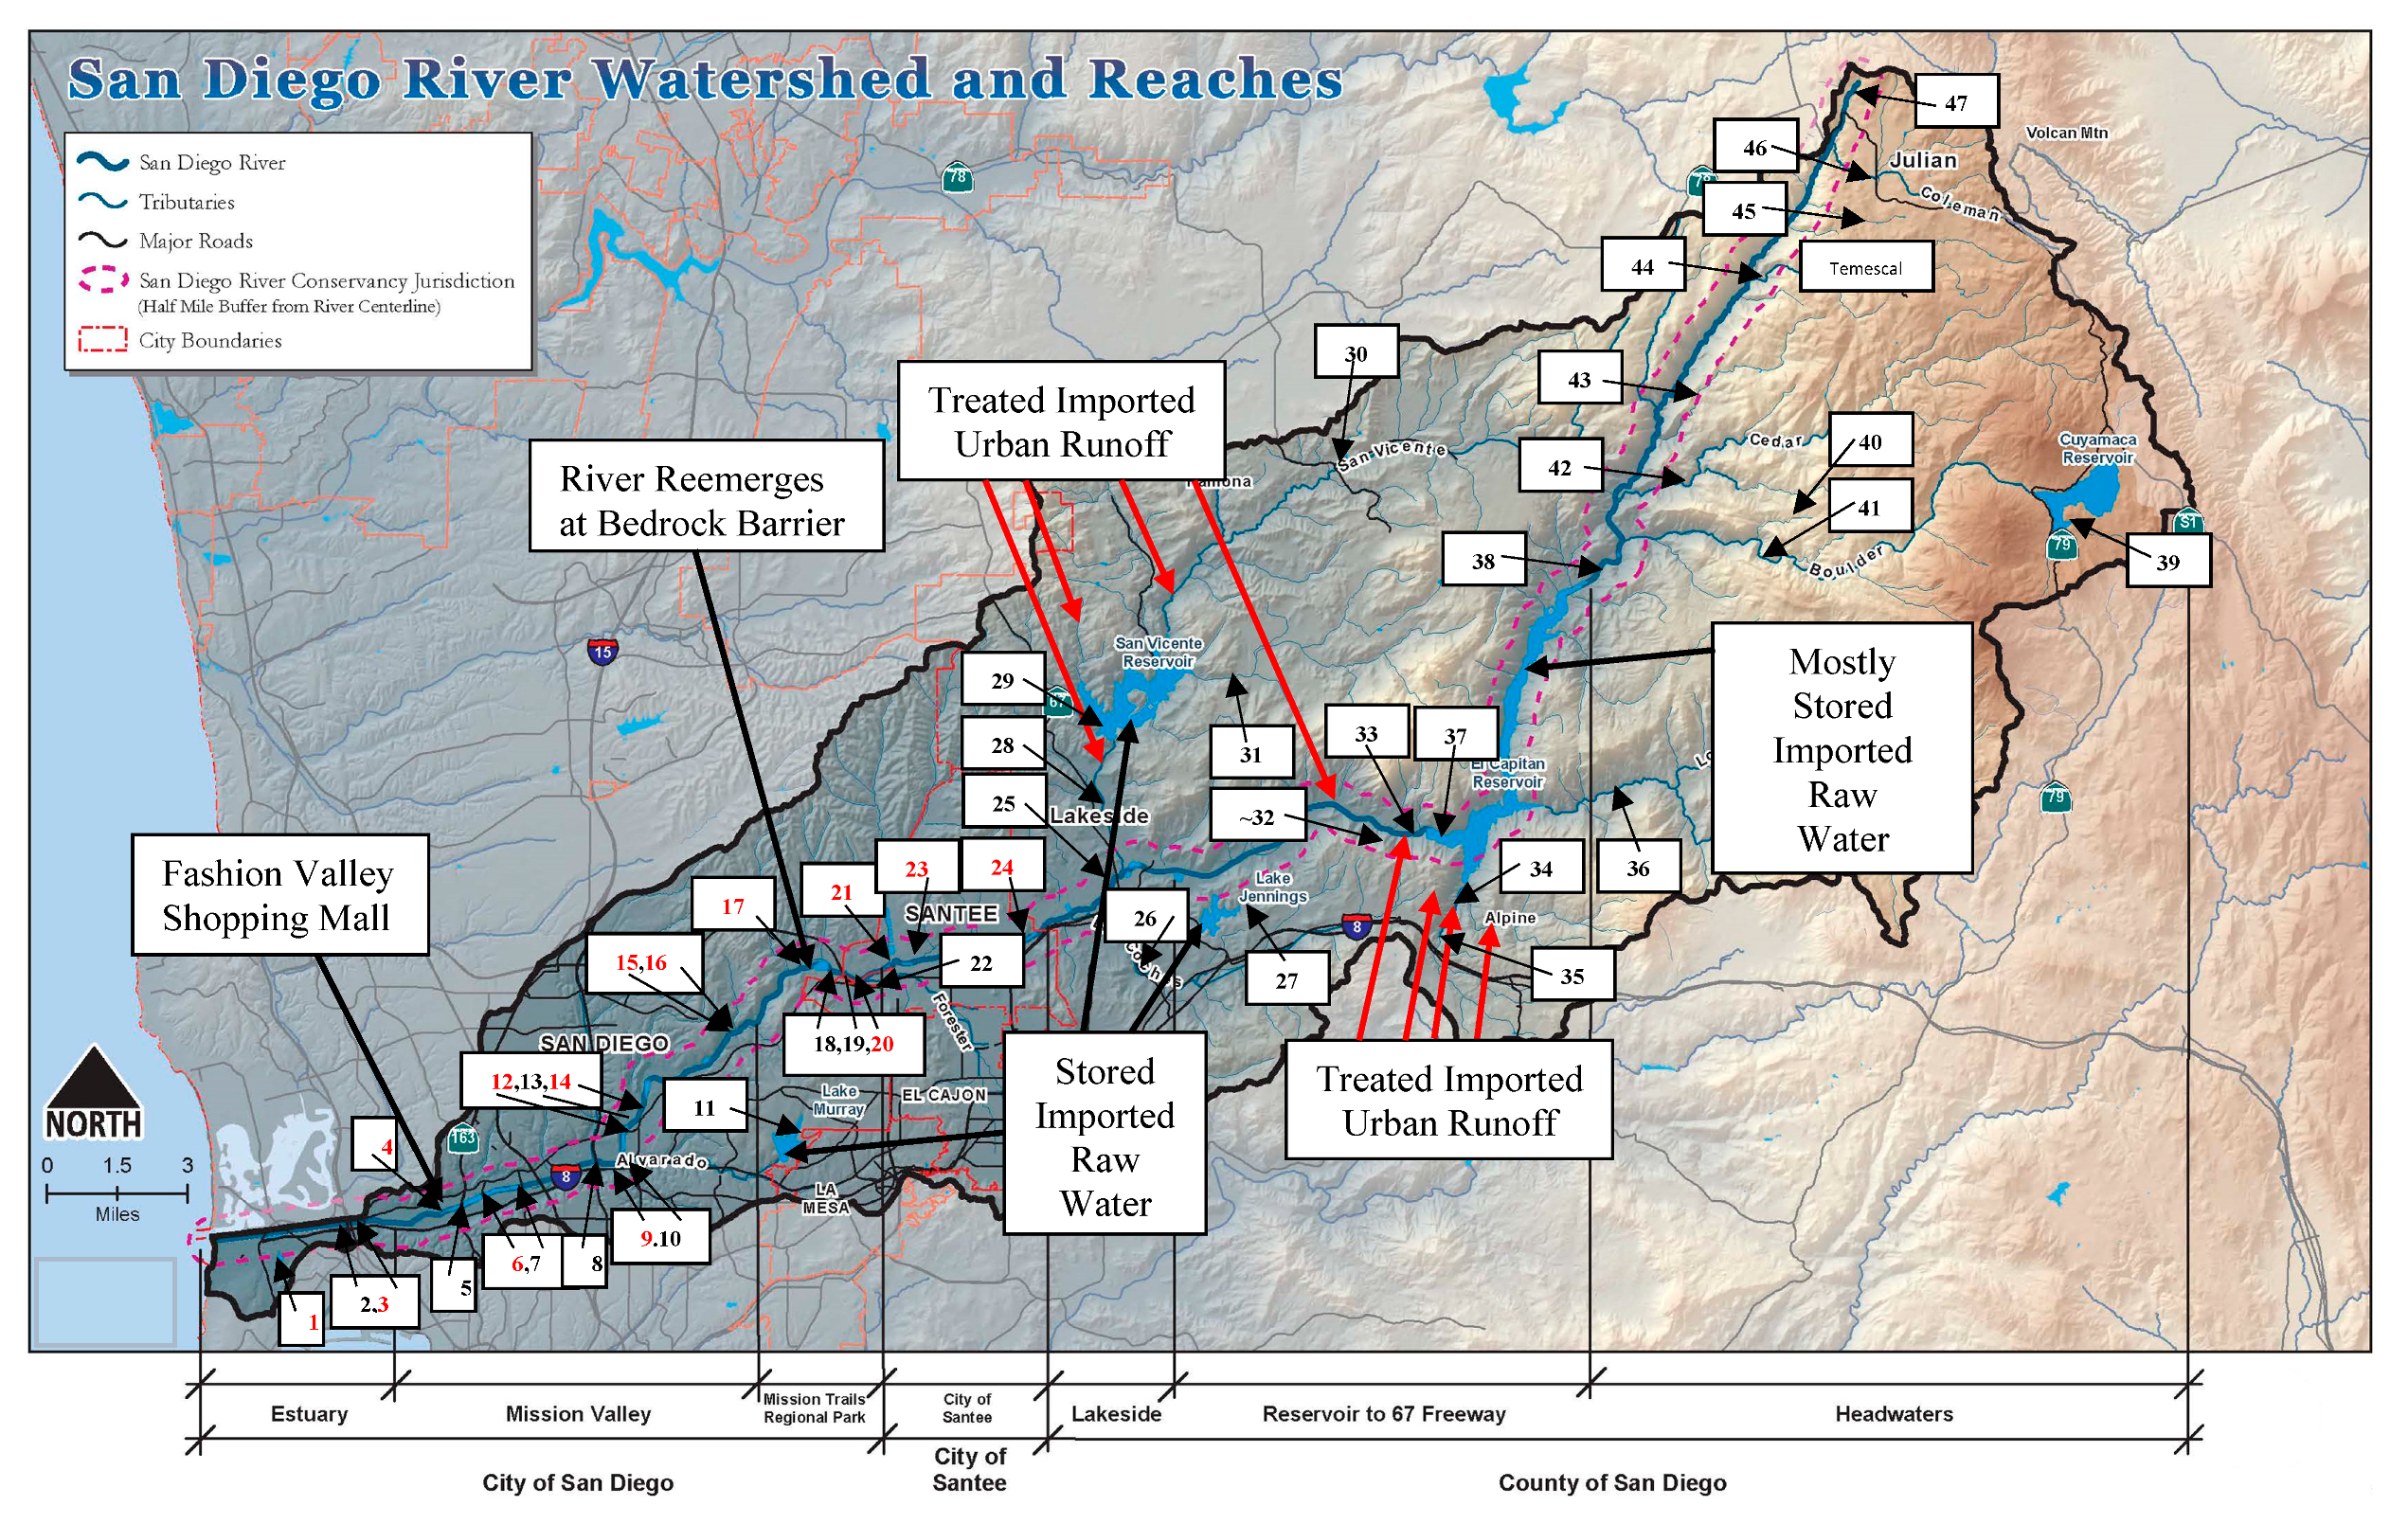
2.1. Study Area

The San Diego River (SDR) (Figure 1) is centrally located within San Diego County in southwestern California, United States. The SDR begins in the Peninsular Range Mountains, 2.35 km northeast of Santa Ysabel, California. It extends for 83.68 km and flows west to the Pacific Ocean south of Mission Bay in San Diego. The watershed is 1124 km2 and in the near-arid western United States. There are four overlapping seasons: cold (Nov. to Jan.), rainy (Dec. to Feb.), dry (Jun.–Aug.), and hot (Jul. to Oct.). Rainfall during our study interval from 2015–2016 was 61–66 cm in the upper reaches, 20–32 cm in the middle reaches, to 25–26 cm at the river’s mouth [2] (Appendix A). Because rainfall is lacking during most months, reaches that are heavily vegetated with aquatic plants slow the flow of water and help drive the shallow water column anoxic [3].
The water in the river is a complex mixture from many sources that include local, treated, and stored imported raw water. The headwater tributaries drain sulfide-bearing metamorphic rocks that weather to supply sulfate and dissolved iron. They drain into the El Capitan Reservoir whose dam is the only impoundment on the main stem of the SDR; the last time the dam overflowed was 1993 [4]. The other major water storage facility, the San Vicente Reservoir, dams a major tributary, whereas two smaller reservoir lakes (Lakes Murray and Jennings) drain minor tributaries. At the time of our study, water in the El Capitan Reservoir was considered to be an emergency supply; thus, it was only piped to the Alvarado treatment facility from Jan. to April 2016 in response to drought [5]. At the present time (2018), water in both major reservoirs is being conveyed to the Alvarado treatment plant at Lake Murray. Thus, starting in 2016, river water from the headwaters is being mixed with imported water and reentering the SDR as runoff.
The four reservoirs store imported water that is supplemented by sparse local water. The stored water in these reservoirs is treated for municipal use; but the sources vary through the years as San Diego County expands its search for reliable supplies. Treated municipal water within the watershed boundaries is supplied by the San Diego Water Authority, and the Lakeside, Padre Dam, and Ramona Municipal Water Districts [6]. During our study interval, 72% of this municipal water was introduced from the high sulfate Colorado River (100 s of mg/L sulfate), 13% from the extremely low sulfate Sacramento Bay Delta water (10 s of mg/L sulfate), and 15% local supply (100 s of mg/L sulfate in Lakeside wells) [7,8]. These water sources are blended primarily to control Colorado River water salinity to levels less than 500 mg/L total dissolved solids [9].
Variable amounts of sulfate are introduced from treated and Colorado River sources. Treated water meets the California Secondary Maximum Contaminant Level for sulfate, which is 500 mg/L [10]. However, analysis of annual water quality reports shows that sulfate values are generally below 250 mg/L, reflecting the fact that Colorado River water is generally below 250 mg/L [11,12]. Sulfate values in the eight analyses from the Colorado River below Hoover Dam for the years 2015–2016 range from 215–243, median 237 [12]. Historically, sulfate in the Lower Colorado River has been as high as 355 mg/L [13].
One additional source of our studied ions are commercial-grade chemicals used by the seven water treatment plants. Depending on the treatment plant and the year, they introduce S (alum, sulfuric acid, ferric sulfate), Fe (ferric chloride, ferric sulfate), and Mn (potassium permanganate) [10].
Figure 1 (bold red arrows) shows where this treated water potentially enters the San Diego River as runoff and discharge. Primarily flowing into storm drains that discharge into the river, the sources of this runoff include residential, commercial, and governmental landscape irrigation and cleaning; leaking pipes and water main breaks; car washing; pool emptying; agricultural runoff; and golf course irrigation.
The watercourse of the SDR also incorporates two shallow alluvial ground-water basins. These are the Santee-El Monte and the Mission Valley basins [14]. Hydraulic head measurements in the U.S. Geological Survey (USGS) San Diego Aqua Culture (SDAQ) well (Figure 2, red dot) were 3–5 m above ground surface [15] suggesting artesian flow into SDR. Thus, aquifer water may interact with the modern water chemistry, affecting all four ions. C-14 and Kr isotopic data determined that the water at 12 m depth is 540 ybp, whereas the water at 271 m is 19,100 ybp [16].

2.2. Water Quality

Water quality analysis is part of two ongoing programs; data useful for this project were incorporated here from both. The San Diego River Park Foundation (SDRPF) samples 14 sites along the lower SDR monthly (Figure 1, red sites) (Appendix A). Sampling began in 2004 and follows the SDRPF quality assurance project-plan protocol. General water quality measurements include dissolved oxygen (DO), pH, temperature, and conductivity. The measurements are collected using a Yellow Springs Instruments (YSI) Professional Plus multiparameter meter. These data and flow which is measured by propeller (ft3/sec) are published online [17]; additionally, two USGS stream gages provide discharge and peak streamflow data [12].
Storm water biologists from the City of San Diego collected bimonthly samples from the river between April 2015 and November 2016 to establish baseline water quality measurements. Four sites in the lower watershed (Figure 1, Sites 3, 4, 6, 14) were selected based on their proximity to reported complaints. These sites overlapped with SDRPF sample locations. Water quality measurements of pH, conductivity, and temperature were taken in the field using portable Hanna and Oakton multiparameter instruments and dissolved oxygen was measured with the YSI ProODO optical DO meter. Additional samples were collected bimonthly and submitted within six hours of sampling to City laboratories for chemical and bacteriological testing.

2.3. Water Chemistry

Water chemistry for S, Fe, Mn, and Ca is reported in the figures and in Appendix A from our analyses, as well as published [18,19,20], and unpublished and online sources [7,10,21,22,23,24,25,26,27,28,29]. Stable isotopes of oxygen and deuterium are reported [15] for the Mission Valley area (Figure 1).
Periodically, San Diego State University (SDSU) degree students [30] and class assignments [31,32] have reported on water chemistry including sulfate (SO4) and Ca. These data are incorporated in the figures and Appendix A.
Monitored site water chemistry is from City of San Diego, Storm Water Division and SDRPF analyses (Appendix A). Chemical analytes tested by City of San Diego, Microbiology and Wastewater Laboratory include SO4 and dissolved sulfide that are incorporated here, as well as other ions of environmental concern. In general, the analytical techniques used were SO4 by Environmental Protection Agency (EPA) 300.0 or EPA9038, S2− by EPA9034, Fe by Standard Method (SM) 3111B, Mn by EPA6010B, and Ca by SM3500-D.

2.4. Geology and Mineralogy
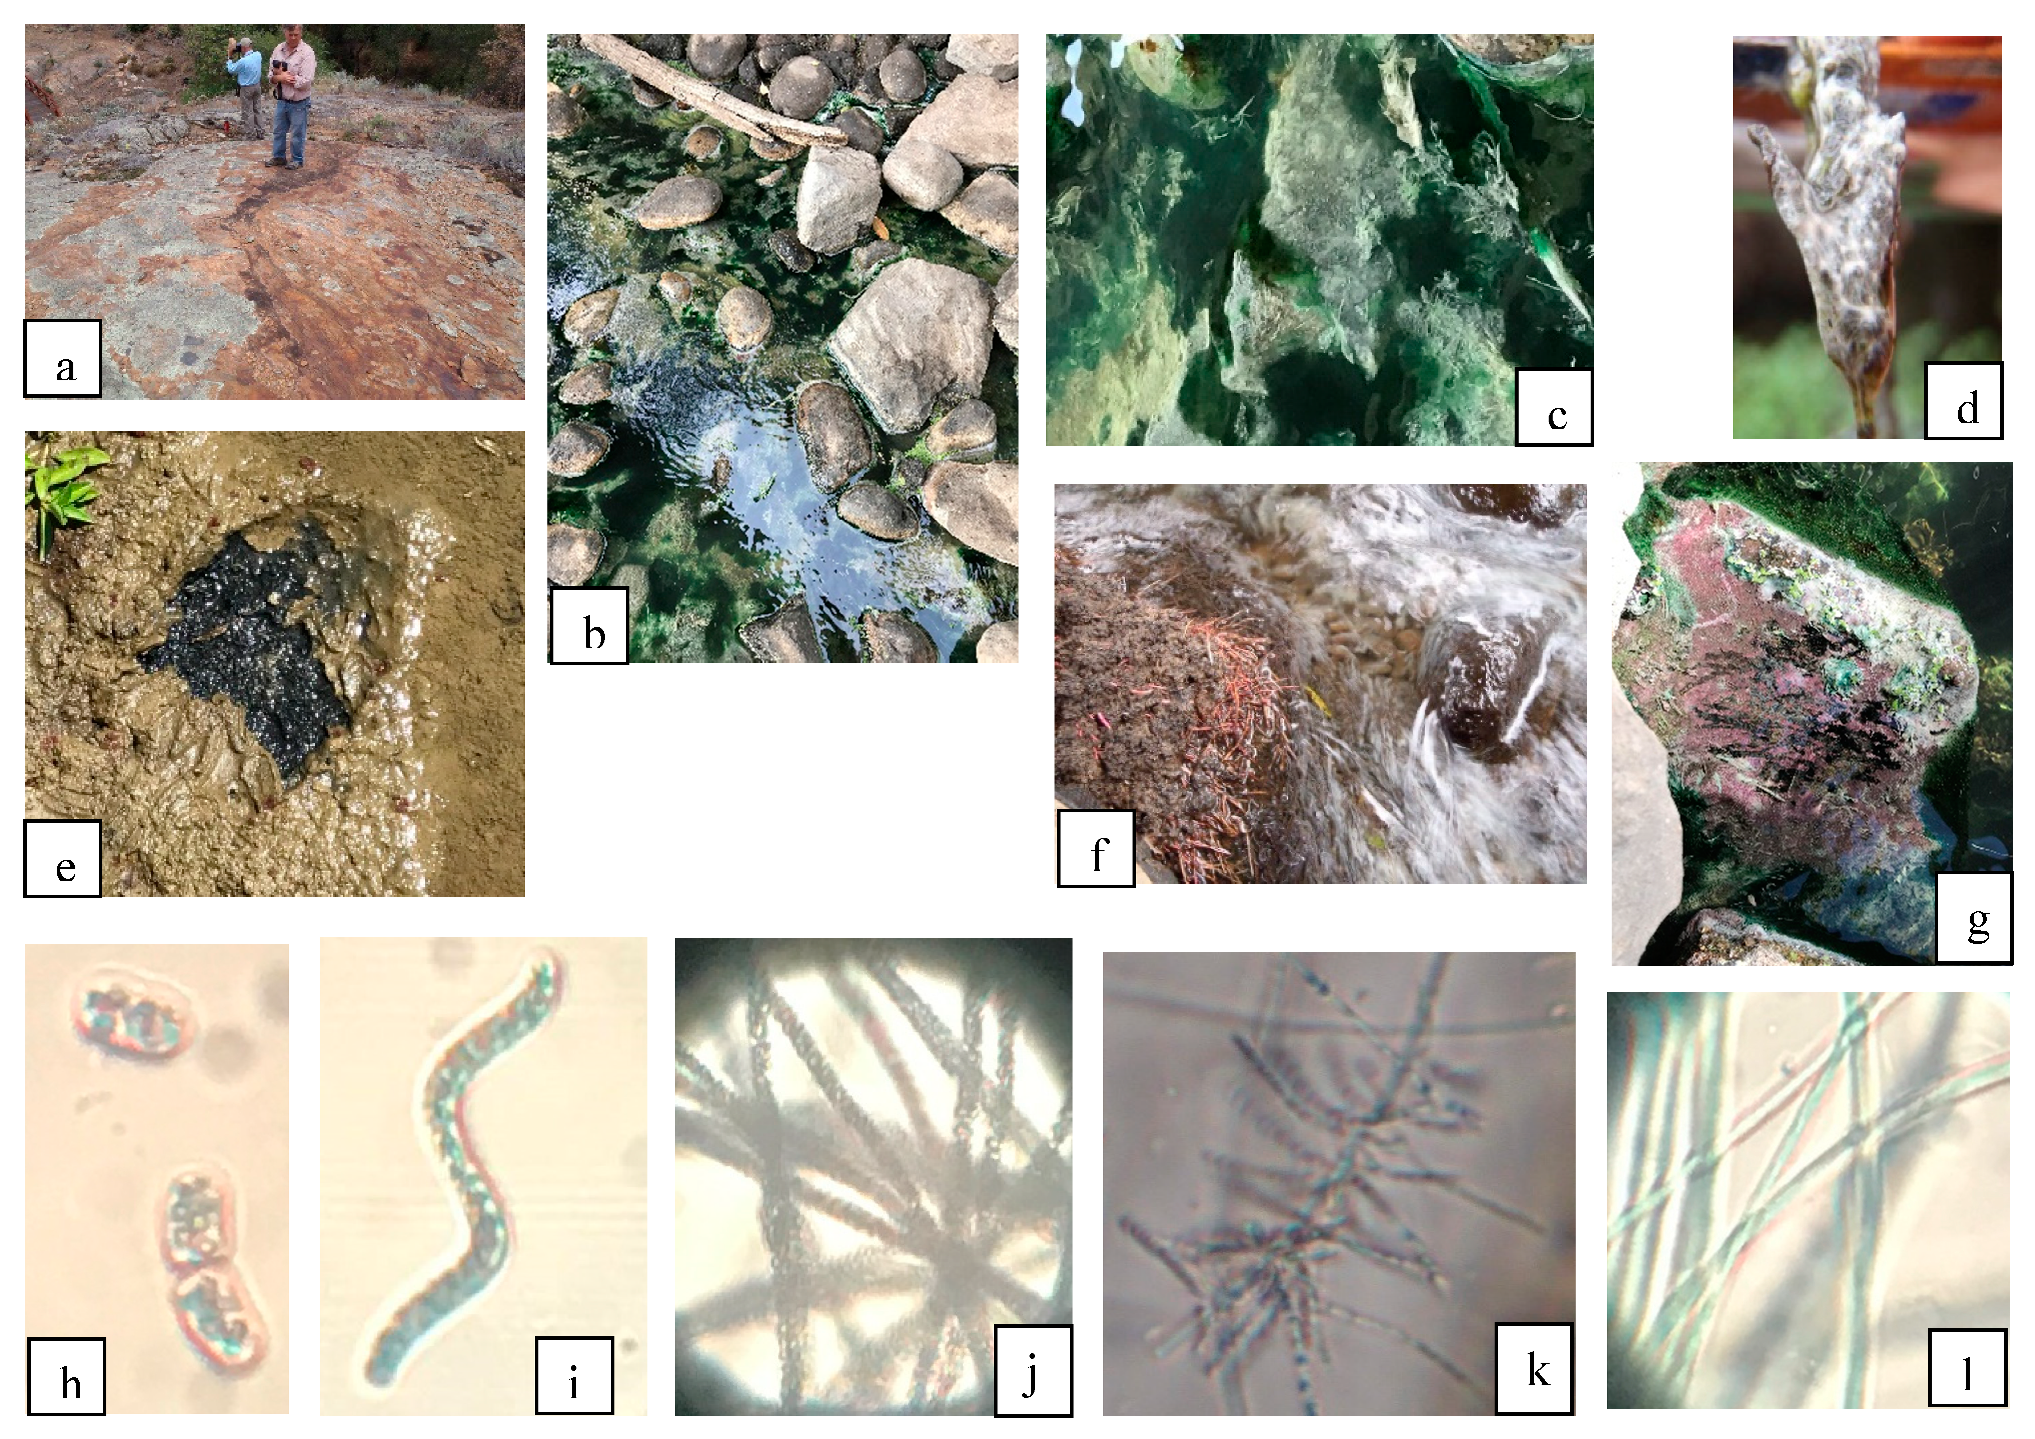
Geology was accessed from published and unpublished maps [33,34,35,36,37,38,39,40,41,42,43] (Appendix A), most of which can be accessed online [28]. Mineralogy was accessed from published sources [44,45,46,47,48].

2.5. Microbiology

For this study, microbial precipitates were noted systematically during monthly SDRPF monitoring days. They were usually sampled, but were also supplemented with adventitious sampling to assess activity through the entire watershed (Appendix A). Several sites were chosen for detailed study, particularly to elucidate interactions with S, Fe, Mn, and Ca. Qualitative analysis of bacteria and cyanobacteria resulted in identification using morphological criteria. Most are identified only to genus; species are cited only for monospecific genera or easily recognized ones.
Other microbial analyses are available for the watershed but not reported here. Storm Water Division biologists collected biweekly bacteria samples to quantify total coliform, Enterococcus, and E. coli.

3. Results

Figure 1 displays field sites, water-storage reservoirs, position where the underground river reemerges (Site 17), and locations where treated water potentially enters the river and its tributaries (bold red arrows). Data from four wells (Sites 7, 8, 19, 32) are included because of potential upward leakage where artesian pressure has been measured (Site 8). Appendix A reports the details of geology/mineralogy, water chemistry, and microbiology where analyzed for the entire river and its tributaries, beginning near the top of the watershed and ending at the ocean. Data below are discussed from the top of the watershed (Site 47) to the bottom (Site 1). The most distinctive sites or the most characteristic populations are highlighted.

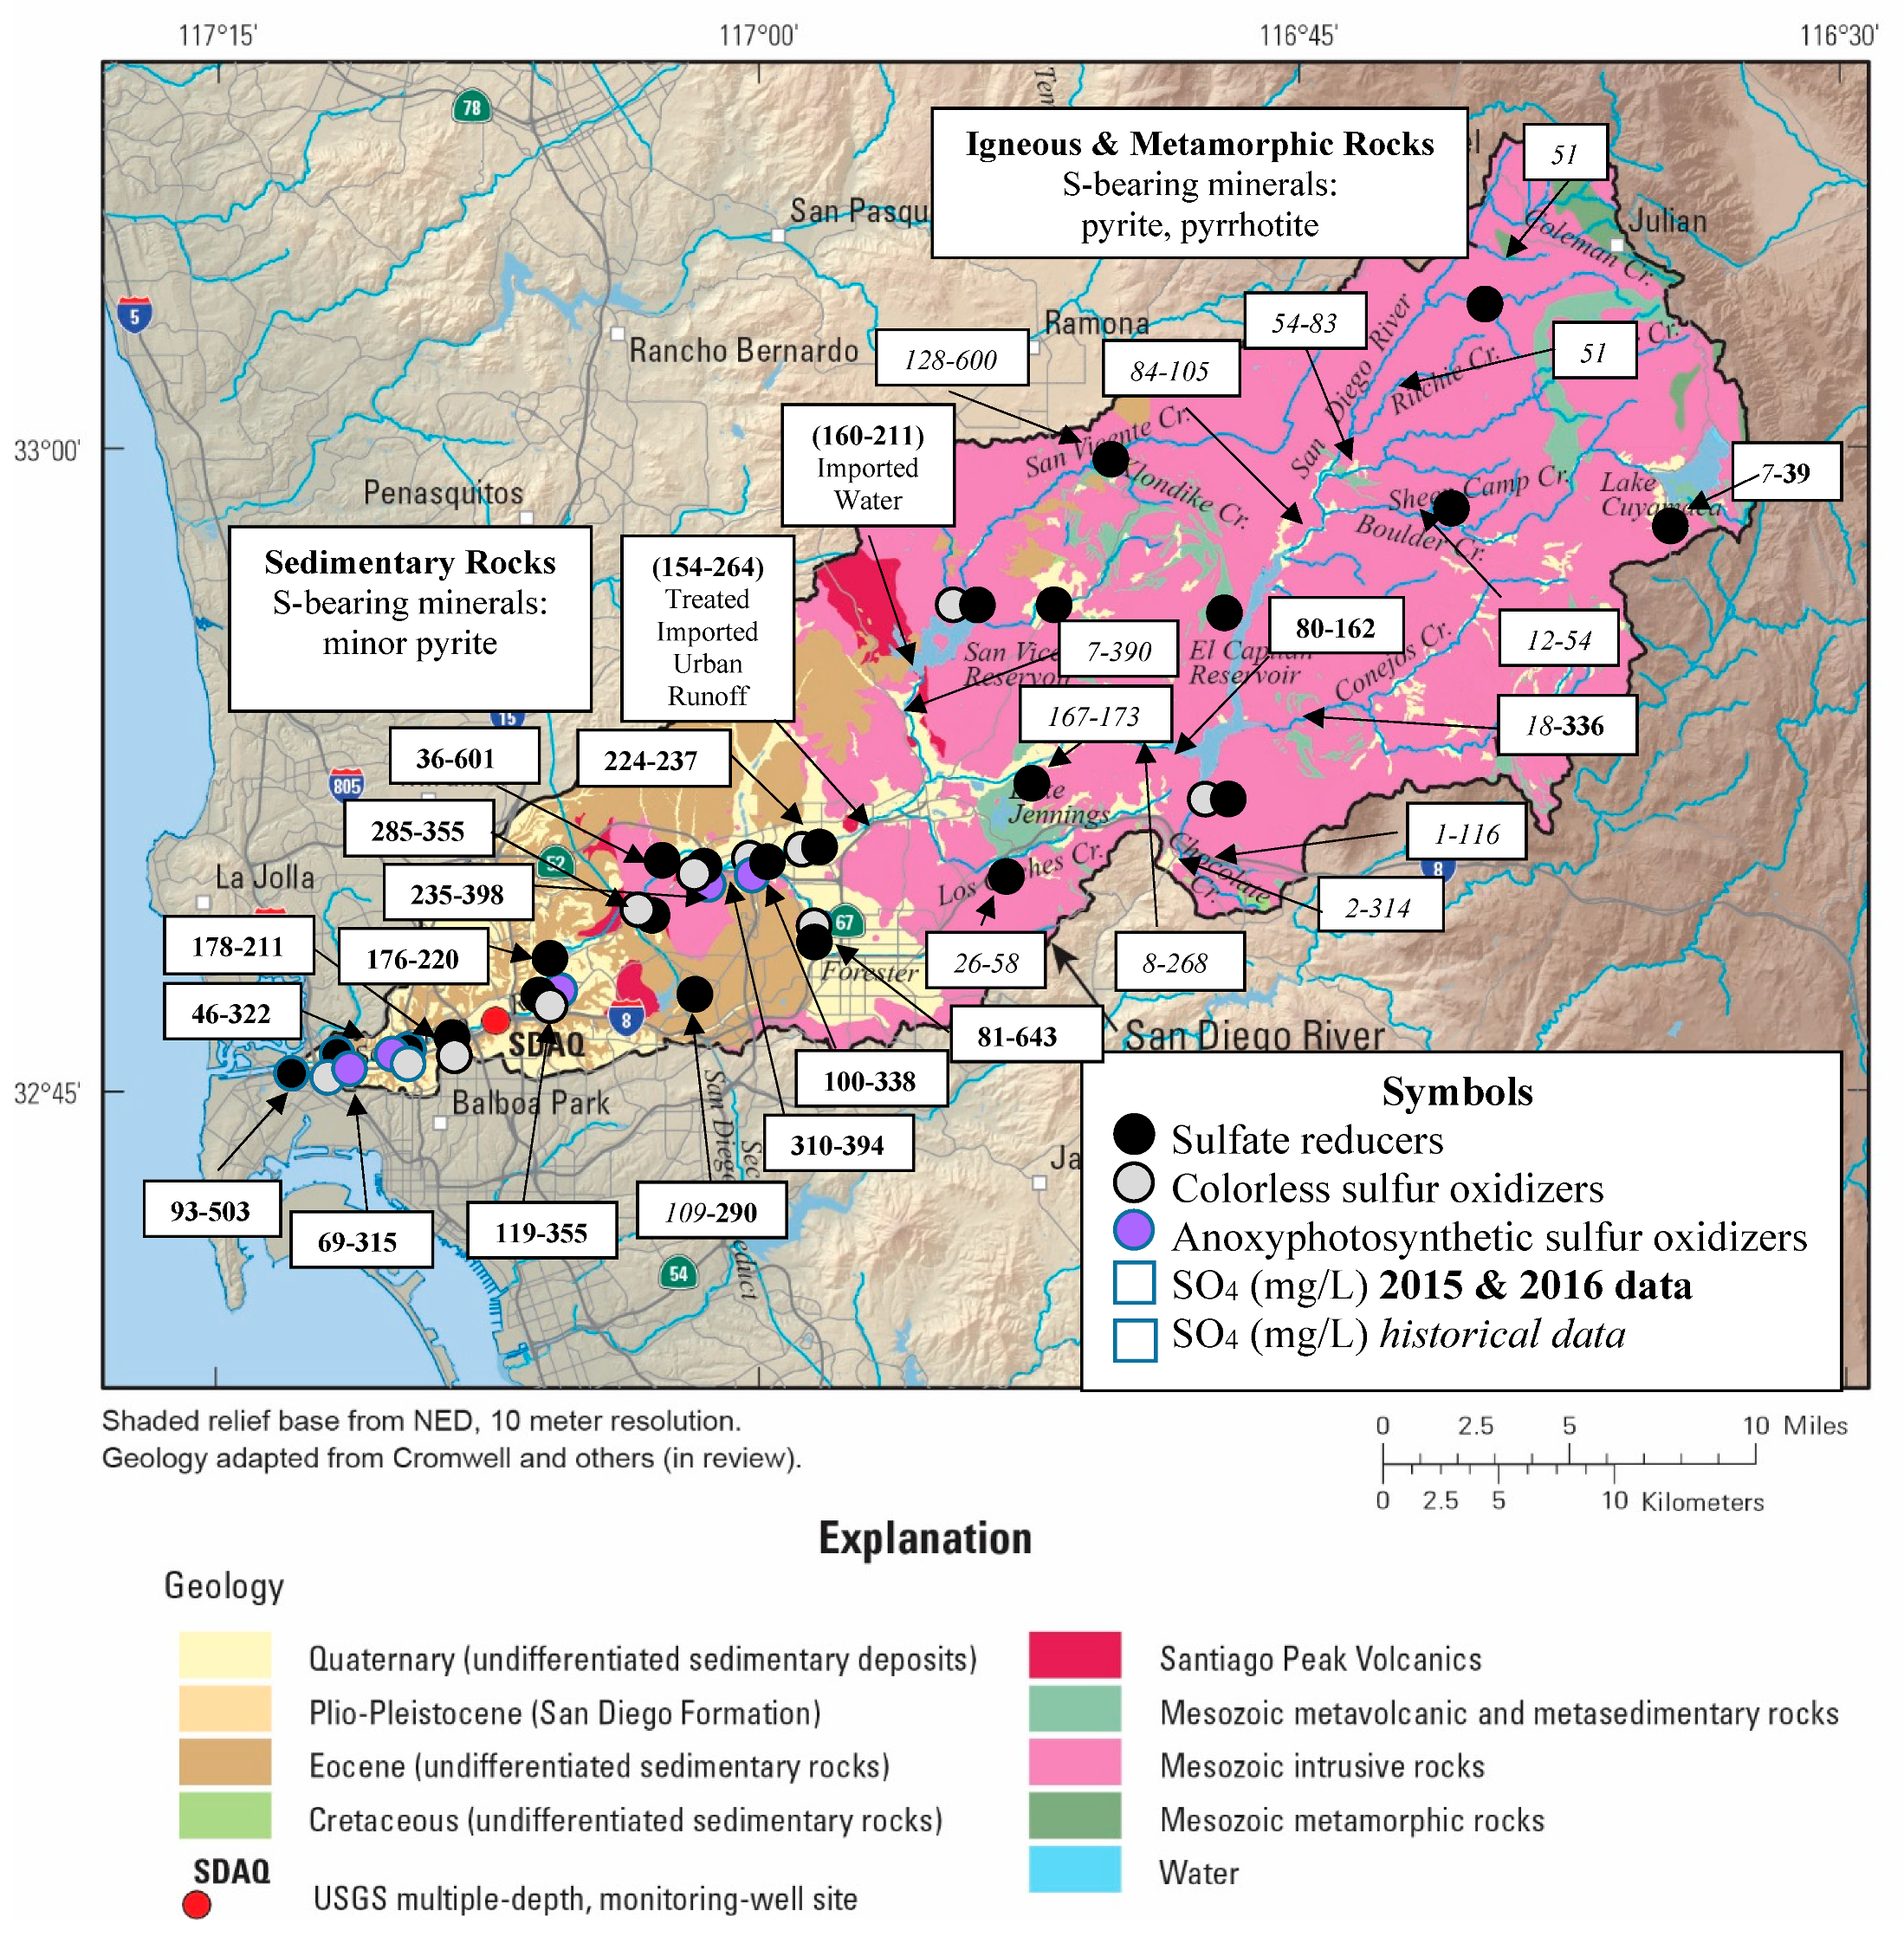
3.1. Sulfur Sources and Sinks

Geology, water chemistry, and sites where sulfur bacteria were observed are shown in Figure 2. Sulfur (S) first becomes available at the top of the watershed where pyrite-bearing Julian schist is weathering (light green in Figure 2). Where springs discharge from fractures in this rock, sulfate reduction is prominent in the sediments. Sulfate values are in the 10 s of mg/L all the way downstream until the El Capitan dam (Site 37). Below the dam, the rocks provide only minor sulfur sources such as pyrite reported around rare shell fossils [41], but the sulfate values are mostly greater than 200 mg/L. As a consequence, H2S, sulfidic mud, and sulfur oxidizing bacteria were encountered at 23 of the downstream sites.
Watershed field sites and bacteria participating in the S cycle are shown in Figure 3. Sulfate reduction (Figure 3e) is ubiquitous in the sediments along the banks; vibrios that may be Desulfovibrio sp. were present where sulfidic mud was analyzed. Where sulfate-bearing water is suboxic, colorless sulfur oxidizers are typically present when H2S is available [49]. Beggiatoa sp. was the sulfur oxidizer seen in white biofilms on quiescent water in El Capitan Reservoir (Site 37). A distinctive site is in the upper reaches of San Vicente Reservoir (Site 29) where submerged dead tree stumps were covered with Beggiatoa sp. that sat directly on black mat formed by sulfate reducers. In contrast to quiet water sites, the sulfur oxidizer Thiothrix sp. is expressed as long flowing white filaments holding on to rocks in flowing water at Ward Rd. (Site 9, Figure 3f,k) or onto the aquatic Myriophyllum sp. at Site 4 (Figure 3d).
The most unusual occurrence displaying sulfur bacteria in the SDR is a sulfuretum (Site 13, Figure 3b) established in the bed of the river in a riffle under a double-spanned bridge. Sulfuretums are typically studied in lakes, marine coastal sediments, and hot springs [50] not in river beds. Chloroflexus sp. (Figure 3c,l), Beggiatoa sp. (Figure 3j), Chromatium sp. (Figure 3g,h), Thiocystis sp., Thiospirillum sp. (Figure 3i), and the colorless sulfur oxidizer Thiothrix sp. have been collected there. Thiospirillum sp. was first noted in September. The sulfuretum was observed in July 2015, then disappeared with an intense rainfall two weeks later, but was seen again in October. At the monitored site above the sulfuretum (Site 14), DO was measured as 4.12 mg/L in July and 4.14 mg/L in October [17].
Analysis of sulfate values (Appendix A and our raw unpublished data) during the 2015–2016 study interval shows that sulfate fell as much as 100 mg/L from the station above the sulfuretum to the station below it from August–October and December in 2015 and June in 2016. Sulfate values decreased most of the other months also, but an order of magnitude less. November 2015 had a significant rainfall event (Appendix A) that strongly diluted sulfate.

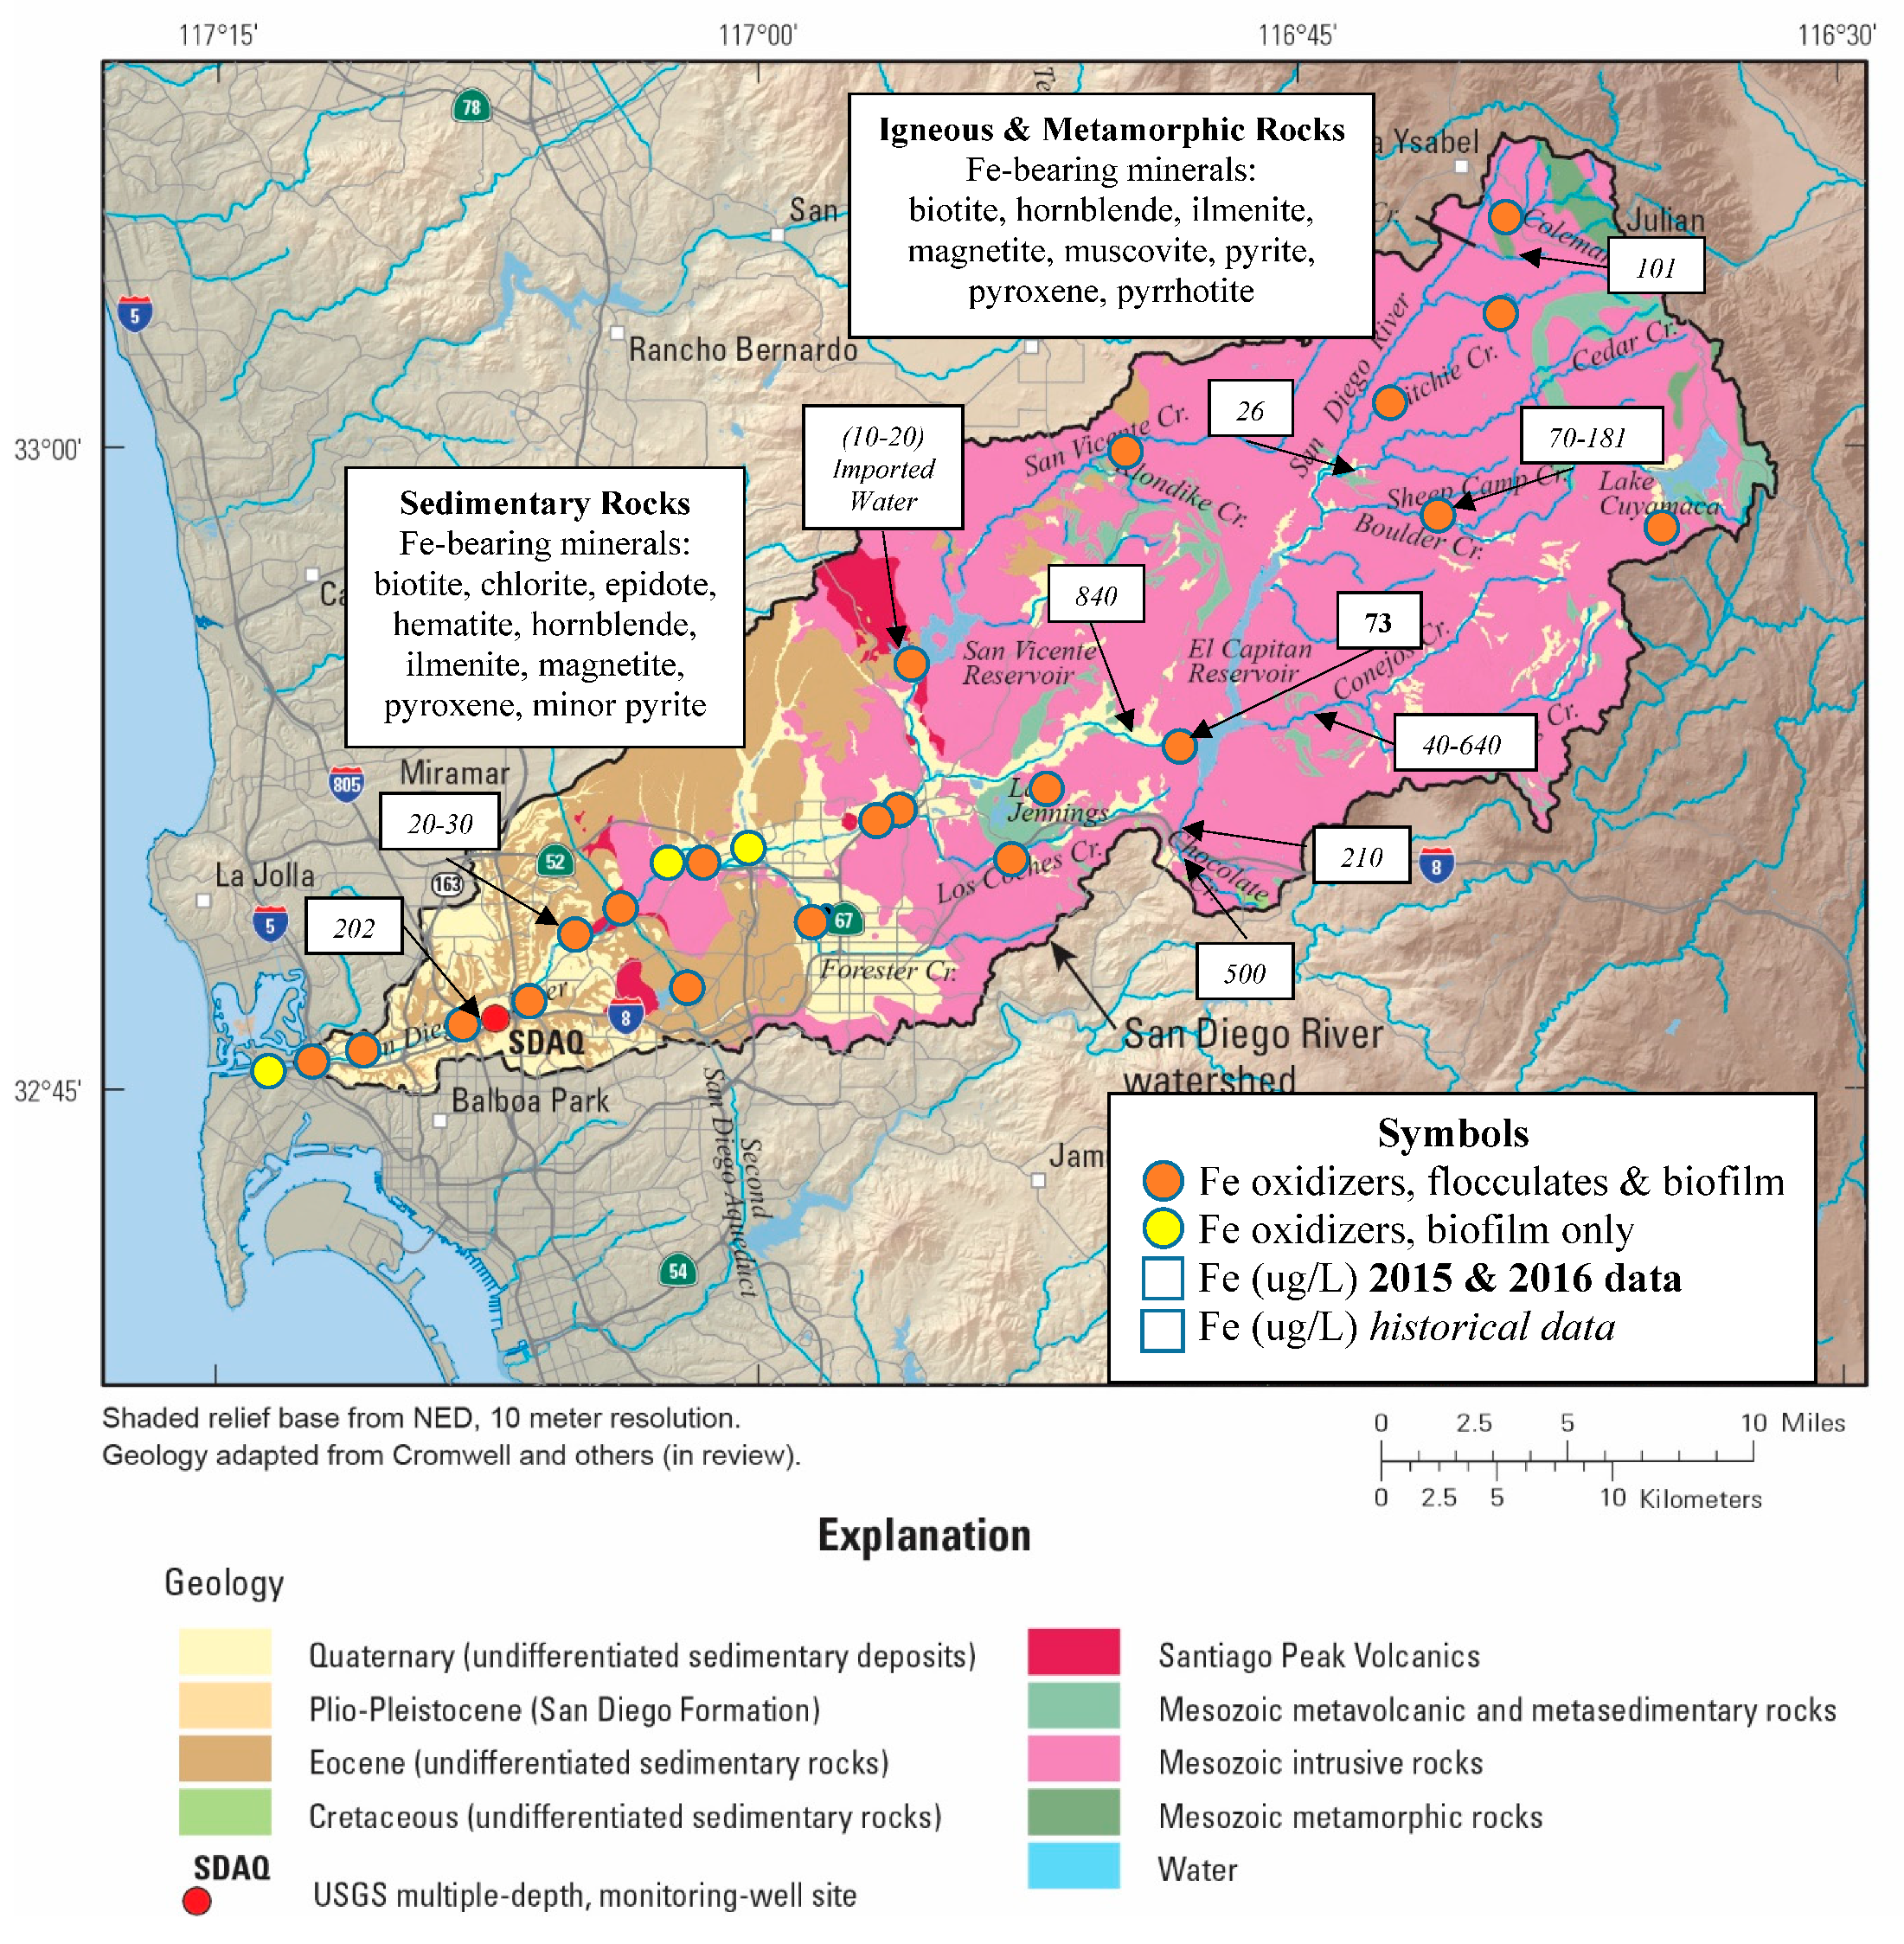
3.2. Iron Sources and Sinks

Geology, water chemistry, and sites where iron bacteria were observed are shown in Figure 4. Iron (Fe) first becomes available at the same locality as the S above. Where pyrite-bearing Julian schist is weathering (light green in Figure 4), springs discharge from the same fractures, and iron oxidation is prominent, characteristic, and can be seen even from helicopter heights. Fe-bearing minerals are present in both the upstream crystalline rocks and the downstream sedimentary rocks. A major source of iron may be from weathering of iron-bearing minerals in the surrounding S-type (sediment derived) granitic rocks [48]. Fe is not a problem in County water, so it is rarely analyzed; but there is sufficient dissolved Fe available because iron bacteria were encountered at 20 of the downstream sites.
Iron oxidation in the watershed and iron bacteria are shown in Figure 5. At the top of the watershed, oxidation of Julian schist pyrite (Figure 5m, Site 44) stains the rocks and weathering creates pools with iron flocculates and precipitates (Figure 5n). When analyzed, the iron bacteria were Leptothrix cholodnii, L. discophora, L. ochracea (Figure 5p), and Siderocapsa sp.
Iron bacteria were observed at many downstream sites. Toxothrix trichogenes was rare and only collected in El Capitan Reservoir (Site 37) where the banks at the northern end in particular were lined with iron seeps. Leptothrix ochracea (Figure 5p) and Gallionella ferruginea were collected from Lake Murray (Site 11). Biofilms formed by L. discophora (Figure 5o,q) showed where Fe-bearing anoxic ground water is discharging along the river banks [51] at 22 sites from the top to the bottom of the watershed (Appendix A).
The most distinctive Fe precipitates were exhibited around the breached, historic Old Mission Dam (Site 17) where ground water emerges from the subsurface aquifer upon encountering a meta-volcanic bedrock massif. The water must be predominantly anoxic, containing sufficient reduced iron to feed the distinctive iron-oxide populations. When the water table is elevated (February to May, September), the edges of the outcropping rocks have small pools filled with red iron flocculates/precipitates of the iron oxidizers.

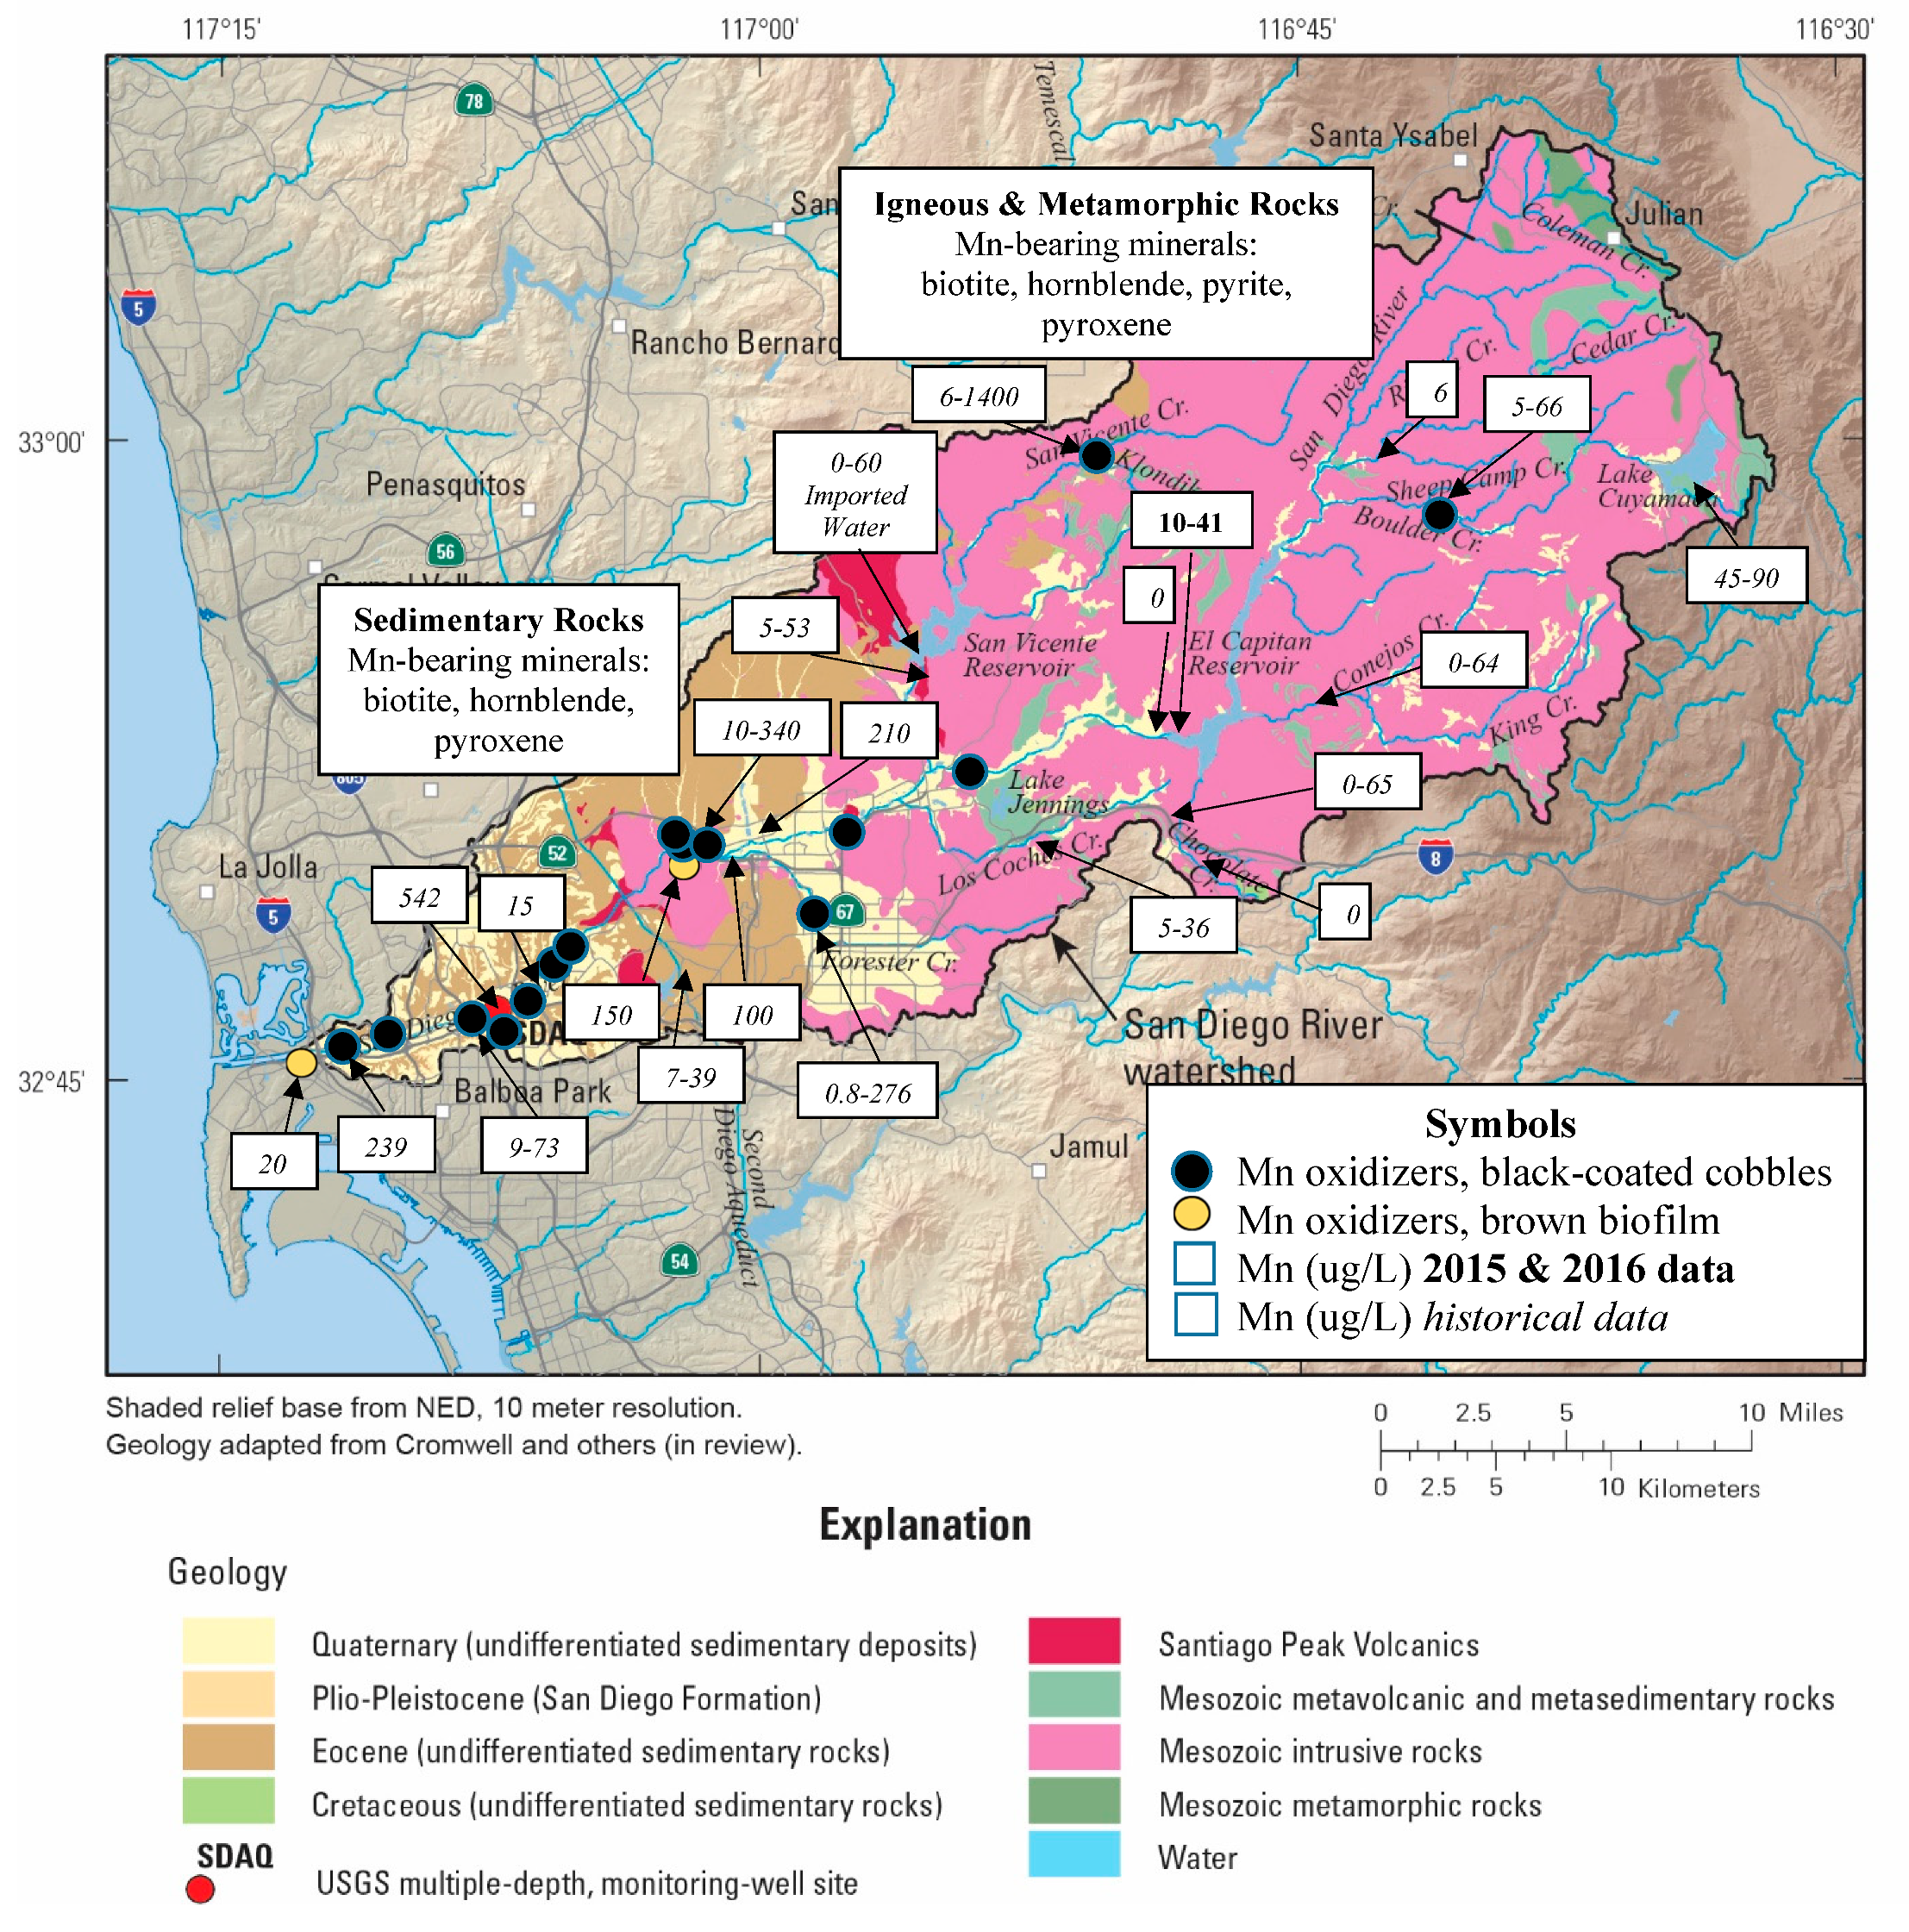
3.3. Manganese Sources and Sinks

Geology, water chemistry, and sites where manganese (Mn) oxidation was observed are shown in Figure 6. Mn becomes available above both the large reservoirs and continues downstream, where Mn-oxide-coated rocks were observed in 15 riffles from the top of the watershed (Site 41-Boulder Creek) to the bottom (Site 3-YMCA). No specific Mn-bearing minerals have been identified in the watershed, but Mn substitutes for Fe in many minerals, including pyrite, amphiboles, and pyroxenes [52]. Todd et al. [48] analyzed the presence of Mn in most of the Peninsular Range granitic rocks (pink in Figure 6). Presumably the Mn measured in Julian schist [45] was present as substitution for Fe in pyrite. Mn values exceed 200 mg/L at sites where anoxic ground water is known to discharge (Sites 8 and 17).
Manganese oxidation in the watershed and biological oxidation is shown in Figure 7. Figure 7r shows a cobble that was cracked open to expose the black rim, Figure 7t shows Leptothrix discophora that precipitates the black Mn oxide rim. Mn oxide was defined by Tebo et al. [53] as oxides, hydroxides, and oxyhydroxides. Precipitation was tested by submerging microscope slide sets in the river at a riffle at West Hills for a month (Figure 7s). Surprisingly, Mn was also seen at holdfasts of an unidentified diatom that attached to an algal filament (Figure 7u).
While Mn oxidation is easily recognized as black coatings on rocks, reduction is not so obvious. However, at the West Hills site (Site 20) where numerous cobbles are typically coated black, it was once noted that cobbles which had shifted into deoxygenated water were clean, suggesting that microbial Mn reduction had occurred.
Brown biofilm occurred at several sites (Site 20-West Hills; Site 18-Kumeyaay Lake; Site 17-Old Mission Dam; and Site 2-Estuary); when collected, L. discophora holdfasts were present (Figure 7w), suggesting that these bacteria are precipitating Mn oxide on the biofilm. Furthermore, brown staining is seen sometimes on the foam forming downstream from Old Mission Dam (Figure 7v) in June, September, and December; the idea has not been tested with a redox dye such as leucoberbelin blue, but it is hypothesized that the brown may be from Mn-oxidation by L. discophora.

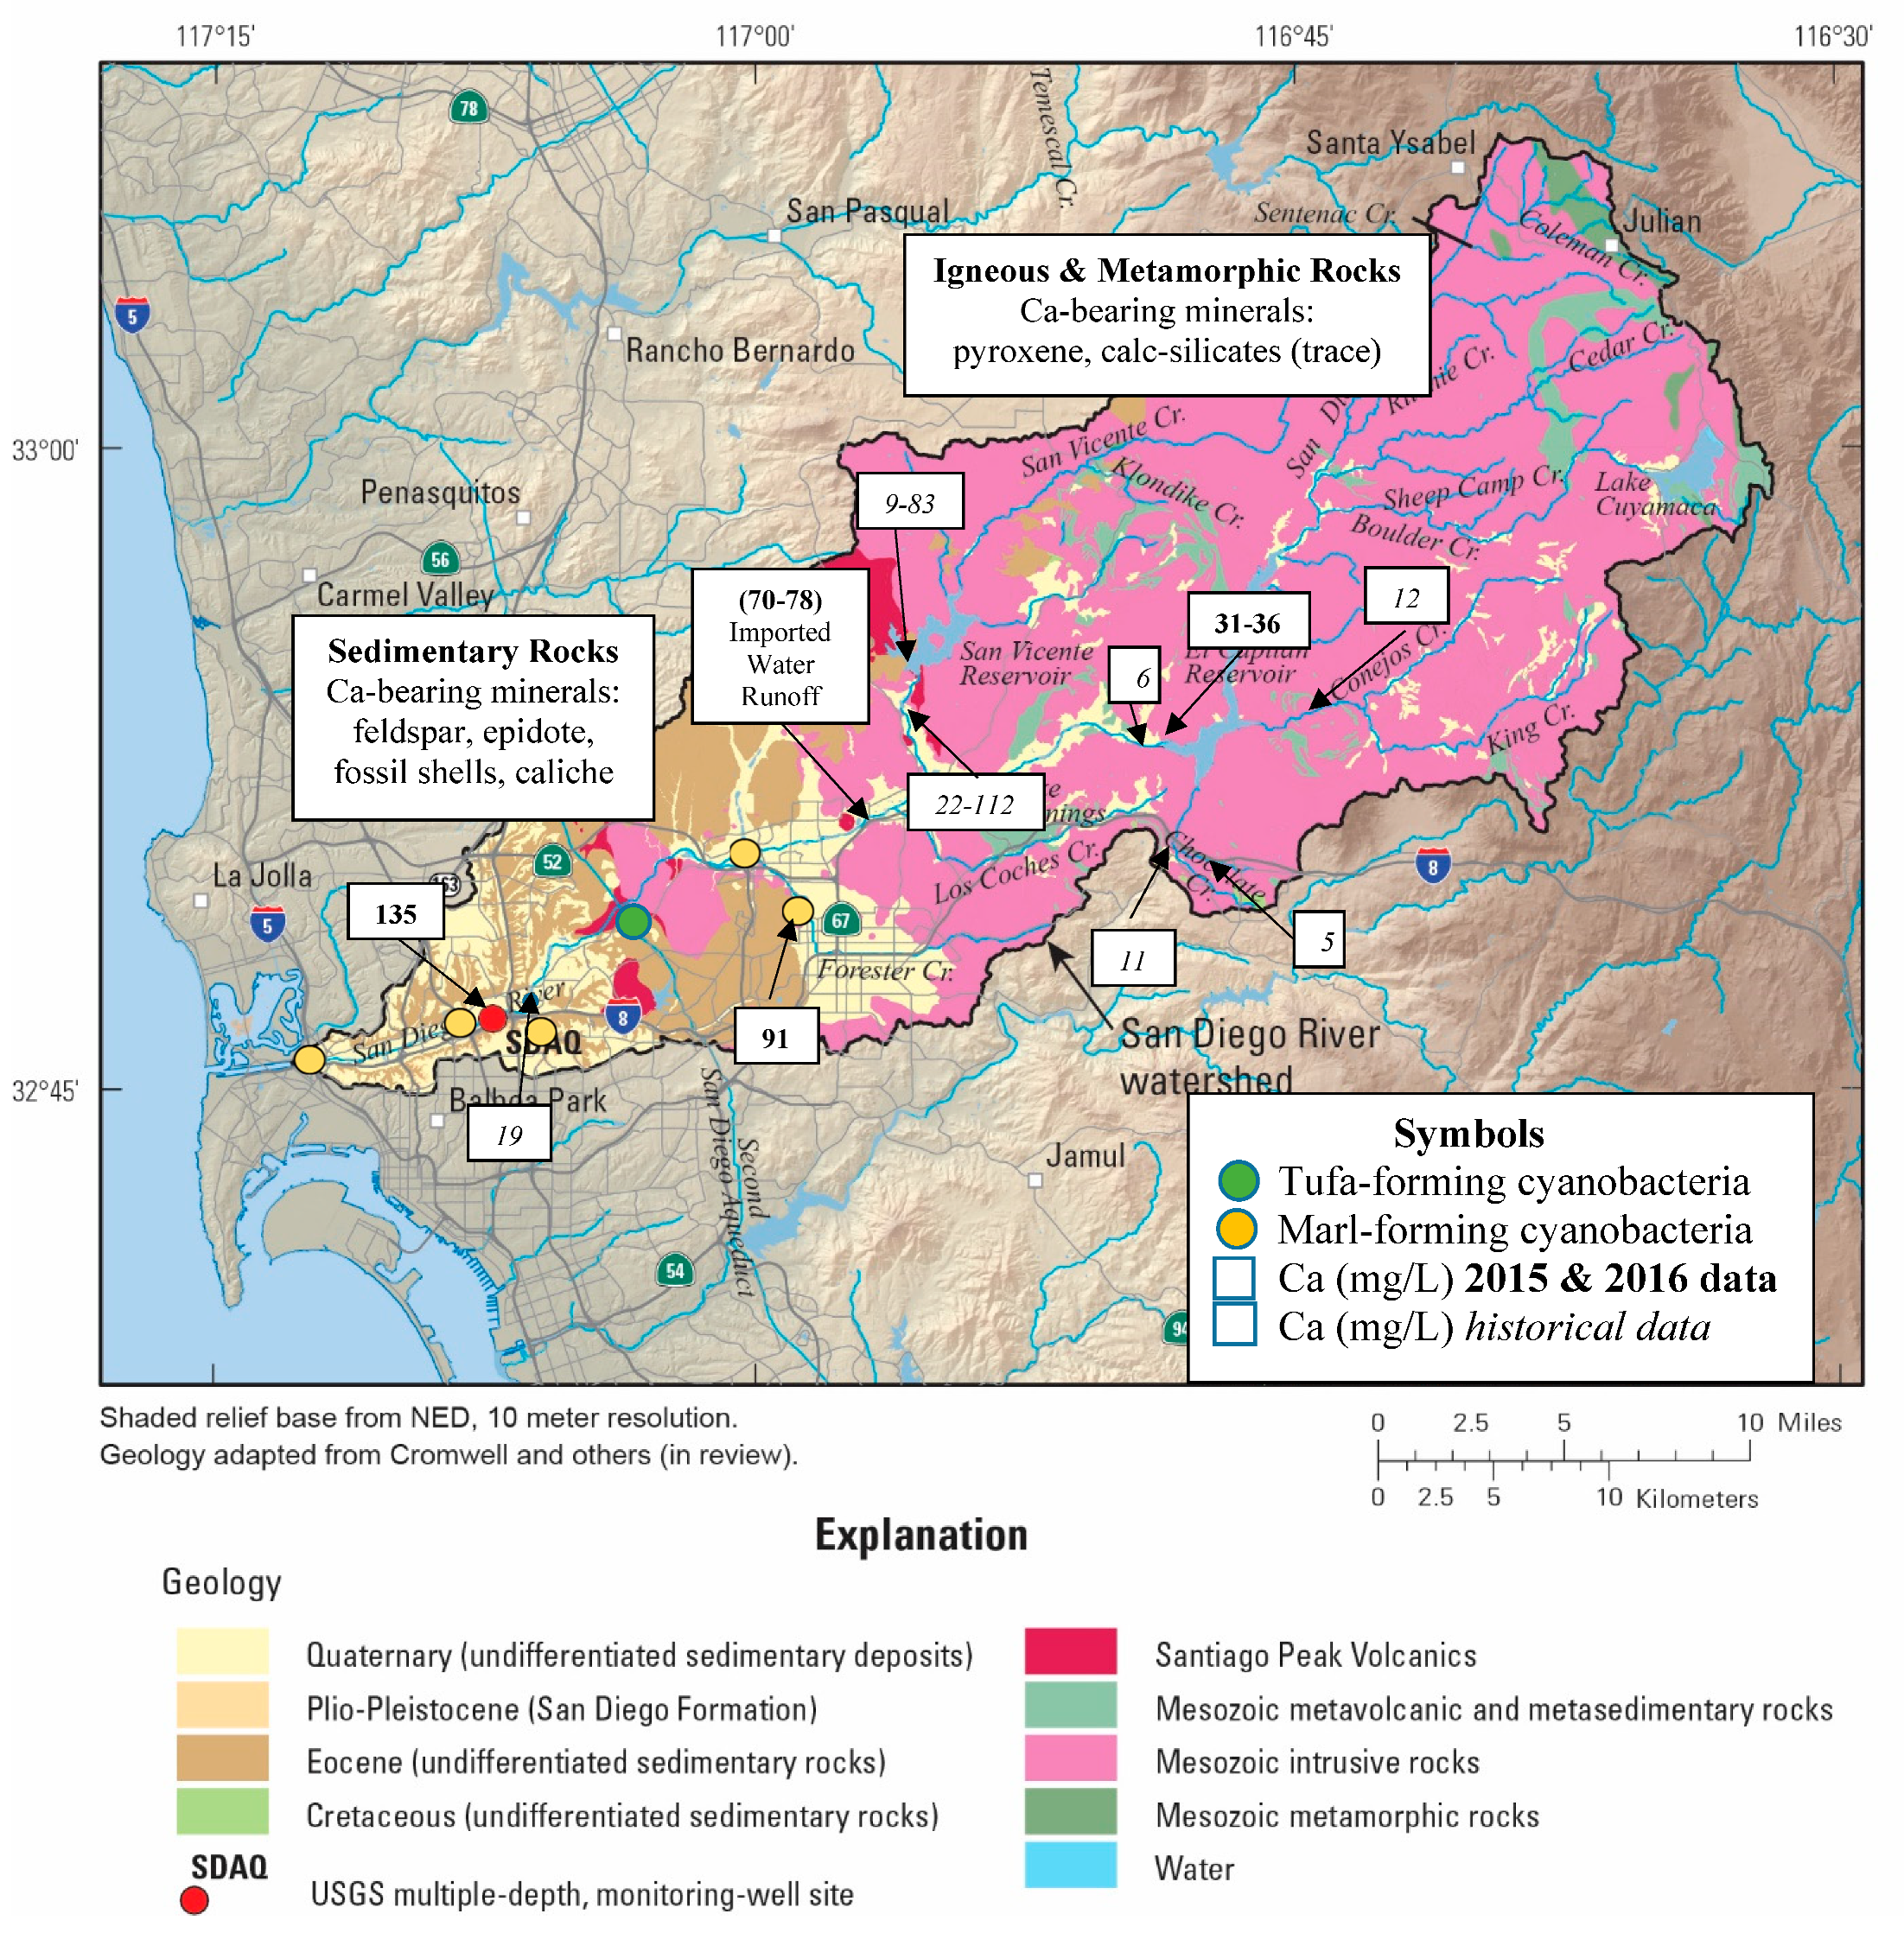
3.4. Calcium Sources and Sinks

Geology, water chemistry, and sites exhibiting microbial interactions with calcium (Ca) are shown in Figure 8. In the upper watershed, Ca is a minor constituent of Ca-bearing minerals. However, in the lower watershed, it is available in caliche-rich marine rocks, in river water, and precipitated as hard tufa and soft/gritty marl by cyanobacteria that utilize it. These CaCO3 precipitates are in water that is typically pH 8 or greater (Appendix A).
Precipitation of Ca in the watershed and cyanobacteria participating in its fixation are shown in Figure 9. Soft/gritty marl precipitates on cyanobacteria mats were collected in shallow water in a backwater area of the river at Mast Park (Site 23, Figure 9bb); Oscillatoria sp. was the most abundant cyanobacterium identified in that mat (Figure 9cc). Marl was observed at other sites in the lower watershed, but not sampled (Appendix A). Further downstream, Ca-precipitating cyanobacteria dominated at Birchcreek tributary (Site 15) in Mission Trails Regional Park. There, a breached cement culvert and the emergent creek bed are lined with a cascade of small tufa terraces or terracettes (Figure 9x) [54,55]. The largest terrace is 153 cm wide, 157 cm long, and 18 cm thick. The tufa is coated with embedded Rivularia sp. (Figure 9y,z,aa).

4. Discussion

4.1. Sulfur Dynamics

In the upper watershed, where pyrite is weathering from the Julian schist and its oxidation products are percolating into spring pools, both intense sulfate reduction and iron oxidation are exhibited. In general, microbial oxidation of pyrite has been found to be a two-step process catalyzed by different bacteria [56,57]. The sulfur moiety of the mineral is attacked first by thiobacilli and oxidized to sulfate,
FeS2 + 7/2 O2 + H2O → Fe2+ + 2 H+ + 2 SO42−.
The iron moiety is released as Fe2+ which moves out until it reaches the zone of oxidation where neutrophilic iron bacteria such as Leptothrix ochracea, L. cholodnii, and Siderocapsa sp. form red-orange flocculates and precipitates,
2 Fe2+ + ½ O2 + 2 H+→ 2 Fe3+ + H2O.
In general, the reduction of sulfate to sulfide is catalyzed in anoxic sediment by sulfate-reducing bacteria such as Desulfovibrio sp. [56]. This process occurs in one step,
SO42−+ 2 H+ + 4 H2 → H2S↑+ 4 H2O.
This is best observed in the soft sediment of the hyporheic zone below the margins of SDR. The black color of the sulfidic sediments is from the formation of metastable iron monosulfides [58].
The months that SDR carries deoxygenated water are elucidated by the presence of colorless sulfur oxidizers that require suboxic water, and anoxyphotosynthetic purple and green sulfur bacteria that require anoxic water. The Friars Road sulfuretum at Site 13 adds another aspect where a sun-blocking bridge is probably excluding oxygen-generating cyanobacteria that outcompete under more intense light saturation [50,59]. The sulfuretum disappears with intense rainfall events suggesting the introduction of oxygen. But then it sets up again when river water is deoxygenated.
Sulfur oxidizing bacteria are either colorless (white) or are the color of their dominant photosynthetic pigments (bacteriochlorophyll, carotenoids). Beggiatoa, Chromatium, Thiothrix, and Thiospirillum store elemental sulfur intracellularly for energy,
H2S + ½ O2 →S° + H2O,
and then excrete it as sulfuric acid when H2S becomes less available [60],
S° + 1.5 O2 + H2O→H2SO4.
In contrast, green sulfur bacteria, including Chloroflexus, excrete the sulfide sulfur immediately as sulfuric acid. Thus, at the Friars Road sulfuretum (Figure 1), sulfate and soluble sulfide arrive in the water, get transformed to sulfate, elemental sulfur, sulfuric acid, and H2S by the sulfur cycle microbial community, and then leave as sulfate, sulfuric acid, dissolved sulfide, and HSS↑ (Appendix A). Lacking sites to accumulate sediment, other than behind upstream dams, the river provides no intermediate storage where stable pyrite might form, and thereby might remove naturally some of the excess H2S.
The major source of sulfate in the SDR below El Capitan dam is hypothesized to be urban runoff from treated, imported high-sulfate Colorado River water. Stable isotopes of oxygen and deuterium are being studied currently by Trent Biggs and Chun-Ta Lai at SDSU to address the question of variable water sources [61].
These data allow us to approach the question as to why the smell of H2S is so intense in the lower reaches in the summer. The river carries a large load of sulfate; hopefully the isotope research will better answer the question of sulfate sources, hypothesized here as being introduced primarily from treated Colorado River water runoff. Colorado River water is the least expensive water available to the County, and so it probably will continue to be the most attractive resource into the future. In the summer, the river becomes suboxic and anoxic, thereby creating ideal conditions for sulfate reducing bacteria. As seen in Figure 2, most of the sites in the lower reaches had the full range of sulfur bacteria. The sulfur oxidizers use the H2S provided by the sulfate reducers. Thus, one might expect that the oxidizers should be lowering the sulfide concentration. Instead, analysis of sulfate values during the study interval showed 100 mg/L drop in sulfate values below the sulfuretum during the late summer (August to October in 2015). The sulfate is clearly being reduced to sulfide that is not being lowered even by intense activity of sulfur oxidizers. There are other factors that could accelerate H2S-production in the lower reaches not addressed by our research including drought impacts on anoxia, a reduction in river velocity due to ponding or an increase in invasive aquatic vegetation contributing to biological oxygen demand. Creative methods for removing or reducing gaseous sulfide, such as being tested by the wastewater community [62,63], await future research.

4.2. Iron Dynamics

As the above experiments showed, microbial oxidation of pyrite sulfide releases the (reduced) Fe during the oxidation of the sulfide. Thus, in the headwaters where pyrite is weathering from the Julian schist and springs are percolating into pools, iron bacteria oxidize the reduced iron in the pools at the air-water interface. The red orange flocculates/precipitates have been analyzed elsewhere to be the highly hydrated, metastable mineral ferrihydrite, Fe2O3. 9H2O [64]. Ferrihydrite cannot dehydrate to stable hematite without application of heat or salinity [65].
The red-orange flocculates/precipitates of the iron oxidizers, being exceptionally colorful, are perfect tracers to learn where Fe2+-bearing ground water emerged into the river [51,66]. Furthermore, where the water was barely moving, the oil-like biofilm of L. discophora spread out onto the water, initiating the precipitation of the hydrated ferric oxide that forms interference colors on the water when the biofilm plates overlap [67]. This iron bacterium also oxidizes Mn, where it precipitates black Mn oxide coatings on solid surfaces such as rocks, bottles, cans, plastic, etc.

4.3. Manganese Dynamics

Mn is typically a trace constituent of river water [68]; it probably only dominates river systems receiving acid mine drainage [69,70]. Chemically, reaction kinetics determines that Fe will drop out before Mn [71]. Biologically, many iron bacteria get energy by oxidizing the iron, so Mn stays in solution until the bulk of the iron is removed. Mn typically stays in solution in uncontaminated natural rivers until oxygen levels are raised, which is the process where oxygenated river water flows over cobbles in riffles [72]. The black Mn oxide coatings are predominantly created by mineralization of the holdfasts of Leptothrix discophora. The Mn oxidation process occurs on an exopolymer matrix [53] and is considered to be a byproduct reaction, a detoxification mechanism, or a potential protection mechanism [53,66].
Mn concentrations measured in the USGS SDAQ well (Figure 6, red dot) are in the thousands of ug/L (Appendix A). Artesian pressures were measured that would extend 3–5 m above ground surface (reported from USGS data by [15]). Therefore, leakage from the subsurface could supply in-stream Mn that then was precipitated on downstream riffles.
The mineralogy of biogenic black Mn oxide coatings is complex. The phase precipitated by Mn oxidizing bacteria is a metastable, highly hydrated mineral such as Na-bearing buserite [53]. Unlike the ferrihydrite precipitated by other iron bacteria, buserite dehydrates to stable birnessite [73]. It is suggested that the detoxification or potential protection mechanism used by the Mn oxidizers can co-precipitate other cations in the water; this process explains why the early prospectors would scrape the Mn-oxide rinds for assay of valuable elements such as Ag, Ni, and Co [see 71]. Mineralization within the SDR watershed includes Au, Cu, Mo, and U [74]; none of these coprecipitate with Mn.
Other phenomena were noted that might be part of the Mn pathway, but require further testing with a Mn assay dye for confirmation. The brown biofilm formed by L. discophora holdfasts, and the brown-stained white foam where water falls over Old Mission Dam may be Mn oxide. The foam might store sufficient oxygen to overcome the activation barrier, or the foam might be colonized by an oxidizer such as L. discophora.

4.4. Calcium Dynamics

Ca that is precipitated biologically by the microbial community appears where the caliche-bearing Friars Formation is exposed in the SDR watershed. As explained above, Ca is precipitated in two forms—soft/gritty marl and hard tufa. In both cases, cyanobacteria are implicated in the precipitation of the calcium carbonate. The formation of tufa is considered to be enzymatically precipitated using the Rubisco pathway [75], whereas marl precipitation such as at Mast Park (Site 23) is most likely the result of pH increases during photosynthesis.

5. Conclusions

Sampling the distinctive microbial populations for 18 months has created a deeper understanding of the interplay between abiotic and biotic processes in the San Diego River and its tributaries. Mineralogy of the rocks in the watershed, sparse rainfall, ground- and surface-water anoxia, and runoff of high sulfate treated imported water all appear to create conditions that are favored by bacteria interacting with S, Fe, Mn, and Ca in the water.
Furthermore, a surprising amount of geochemical information about the river was revealed by the presence of the microbial community that precipitated S, Fe, Mn, or Ca. The presence of the gradient-seeking sulfur oxidizers at the surface of the water indicated where the water was suboxic. Black sulfidic sediment produced by the sulfate reducing bacteria highlighted the near-surface location of anoxia. Purple and green sulfur oxidizing bacteria also showed the location of anoxia in the water column. Iron oxide biofilms at the surface of the water showed where anoxic ground water carrying reduced iron was discharging. Even though Fe and Mn typically travel together, Mn typically moves slightly further downstream. Mn oxide coatings on riffles suggest that iron bacteria upstream have stripped out the Fe, so that Mn was available to them. CaCO3 precipitation showed where the pH was greater than 8 and where leachable Ca was present in the watershed.
Each of these biological cycles is distinct, yet each actually relies on many linked and unlinked processes in the watershed: The S cycle is exhibited by microbial sulfate reduction, sulfur oxidation, and anoxyphotosynthesis. Pyrite in the upper watershed and runoff of high-sulfate treated Colorado River in the middle and lower watersheds drive S availability that also relies on low oxygen in the water. Fe precipitation is driven by the availability of iron-bearing minerals such as pyrite, but also requires ground water anoxia. Fe oxidizers create red flocculates/precipitates and oil-like biofilm. Mn fixation is similar to that of Fe, but it additionally requires a source of reduced Mn being carried by oxygenated water over riffles. Mn oxidizers create black coatings on rocks in riffles and perhaps on biofilm and foam.
The Ca precipitates are distinct and appear to be exhibited only where watershed sediments contain abundant caliche. Cyanobacteria precipitate CaCO3 in the form of hard tufa and soft/gritty marl. Thus, the natural microbial populations of the SDR reflect a complex dynamic system.

Author Contributions

Conceptualization, E.I.R.; Formal analysis, M.L. and J.F.; Methodology, M.L.; Visualization, S.Q.-R.; Writing—original draft, E.I.R. and S.Q.-R.; Writing—review & editing, M.L. and J.F.

Funding

This research was a volunteer activity (ER) done as part of foundation (SQ-R) or City of San Diego (ML) sampling protocol. The Department of Geological Sciences at San Diego State University funded analytical chemicals for J.F.

Acknowledgments

Thanks to Vicki Todd for unpublished maps; Lake and Reservoir Keepers (Brian Norris, Budd Murray, Butch Paddock, Gayle Havens, Heidi Couture, Malie Guerrero, Viviana Castellon); San Diego County Parks and Recreation (Patti Hayden); Field partners (Kyle Armendariz, Jon Calderon, Pat Curo, Janis Hernandez, Julie Lubjenkov, Fed Pinongeos, Vicki Todd, Wenje Lee, Kathy Thorbjornarson, Lili Landin); San Diego River Park Foundation volunteers (John Grasberger, Chandler Hood, John Kennedy, Duncan Miller, Marty Offenhauer, Gary Strawn); San Diego County Water Authority personnel (Craig Balban, Mark Umphries); U.S. Geological Survey (Wes Danskin, Kelly McPherson, Rob Anders). Appreciation is also given for microbial identification (Margarita Grabovich); for rainfall data (Charles Fisk); and for water chemistry data from City, County, and Federal agencies (Doug Campbell, Doug McPherson, Jeff Pasek, Laralyn Asato, Lori Zajac, Mark Umphries, Mike Clark, Ron Kauble, Tom Burger). We would also like to thank the reviewers who graciously shared their insights.

Conflicts of Interest

Storm water biologists from the City of San Diego primarily participated in water sample collection and provided data for this article. Other authors declare no conflict of interest.

Appendix A. Microbiology, Water Chemistry, and Geology/Mineralogy of the San Diego River Watershed

Explanation of Abbreviations and Format Details in Appendix A

(A)
Distances for tributaries are measured where they enter the San Diego River.
(B)
Geology is reported from each sample locality; the mineralogy reflects the geology of a one-kilometer radius from the upstream side of the sample locality. Mineral and rock abbreviations are as follows: bio, biotite; calc, calcareous; chl, chlorite; cong, conglomerate; epi, epidote; ferrihy, ferrihydrite; hema, hematite; hbe, hornblende; ilm, ilmenite; musco, muscovite; py, pyrite; pyrrho, pyrrhotite; pyrox, pyroxene; volc, volcanic.
(C)
For water chemistry and microbiology, the numbers from 1–12 in parentheses are months (1 = Jan., 2 = Feb., etc.).
(D)
Fe and Mn are in ug/L; other chemical constituents are reported in mg/L.
(E)
FeOx refers to observations of iron oxide flocculates/precipitates that were not sampled. SOx refers to observations of white filaments and white biofilms that were not sampled.
(F)
References in [ ]
(G)
Minimum-maximum values in samples collected in the reporting interval 2015–2016 are in regular font; values from other years are in italics.

Upper Watershed

Monthly rainfall (in.), Julian CDF Station, [lat. 33.07639, long. -116.5925], 1285 m elev. [2]
  • Year Jan Feb Mar Apr May Jun Jul Aug Sep Oct Nov Dec Ann
  • 2015 0.49 2.47 2.19 1.61 3.20 0.01 1.94 0.05 1.97 0.52 3.05 6.42 23.92
  • 2016 7.95 0.66 1.98 1.47 0.88 0.00 0.00 0.00 1.20 0.31 3.57 7.88 25.90
Site 47: SDR at Headwaters (NE of Santa Ysabel), [33.116035,-116.652667], San Diego County unincorporated. The San Diego River (SDR) begins around 1158 m elevation as a seep in the Peninsular Ranges.
Km 83.68GeologySFeMnCa
Geology/Mineralogy [39]gabbro, tonalite bio, hbe, ilm, magbio, hbe, pyroxpyrox
Site 46: Coleman Creek (Tributary of SDR), [33.087911,-116.646191], Cleveland National Forest.
Km 79.2GeologySFeMnCa
Geology/Mineralogy [39]schist, tonalitepybio, hbe, ilm, mag, musco, pybio, hbe, py, pyroxpyrox
Microbiology no H2S↑FeOx(10)
Site 45: Sentenac Creek (Tributary of SDR), [33.073579,-116.651438].
Km 76.9GeologySFeMnCa
Geology/Mineralogy [39]schist, tonalitepy, pyrrhobio, hbe, ilm, musco, py, pyrox, pyrrhobio, hbe, py, pyroxpyrox
Water Chemistry [22]pH 7.3(5)
DO 5.15 (5)
SO4 50.9(5)Fe 101(5)
Site 44: Temescal Creek (Tributary of SDR), [33.055867,-116.662263], Cleveland National Forest. The upper watershed creek flows through a series of spring pools being fed by ground water emerging from fractures in pyrite-bearing, Julian schist bedrock.
Km 74.0GeologySFeMnCa
Geology/Mineralogy [39]schist, tonalitepy, pyrrhobio, hbe, ilm, musco, py, pyrox, pyrrhobio, hbe, py, pyroxpyrox
Water ChemistrypH 6.91(3)
Microbiology H2S↑ (3,7,8,9,10)FeOx(3,7,8,9,10)
L. discophora biofilm(7,10)
L. cholodnii(11)
L. discophora(11)
L. ochracea(11)
Siderocapsa(11)
Site 43: Ritchie Creek (Tributary of SDR), [33.016086,-116.711658], San Diego County unincorporated. Iron-oxide flocculates were sampled in lined pools dug into the river to provide water for grazing cows.
Km 68.4GeologySFeMnCa
Geology/Mineralogy [39]granodiorite, tonalitepy, pyrrhobio, hbe, ilm, py, pyrox, pyrrhobio, pyroxpyrox
Water Chemistry [22] SO4 51.2(5)
Microbiology no H2S↑L. discophora biofilm(2)
FeOx(2)
L. ochracea(2)
Site 42: Cedar Creek (Tributary of SDR), [33.0022,-116.7089].
Km 66.9GeologySFeMnCa
Geology/Mineralogy [37]tonalitepy, pyrrhobio, hbe, ilm, py, pyrox, pyrrhobio, hbe, py, pyroxpyrox
Water Chemistry [22,23]pH 7.66(4)–8.43(4)
DO 7.35(4)–8.38(4)
SO4 54(3)–83.4(3)Fe 26.2(5)Mn 5.96(5)
Site 41: Boulder Creek (Tributary of SDR), [32.963674,-116.6639], Cleveland National Forest and San Diego County unincorporated.
Km 65.3GeologySFeMnCa
Geology/Mineralogy [37]granodiorite, quartz diorite, tonalitepy, pyrrhobio, hbe, ilm, py, pyrox, pyrrhobio, hbe, py, pyroxpyrox
Water Chemistry [22]pH 7.75(4)
DO 8.12(4)
SO4 12.3(4)–53.8(3)Fe 70(5)–181(5)Mn 5.14(2)–66.3(4)
Microbiology no H2S↑FeOx(7)L. discophora coatings(7)
Site 40: Sheep Camp Creek (Tributary of Boulder Creek), [32.982157,-116.673192], Cleveland National Forest. Creek was dry but the soil probe uncovered moist, black, sulfidic sediment.
Km 65.3 SFeMnCa
Geology/Mineralogy [37]tonalite, schistpybio, hbe, ilm, musco, py, pyroxbio, hbe, py, pyroxpyrox
Microbiology H2S↑ (10)
Site 39: Lake Cuyamaca (Tributary of Boulder Creek), [32.979851,-116.578715], Cleveland National Forest. A tributary entering Lake Cuyamaca was sampled at a seep.
Km 65.3GeologySFeMnCa
Geology/Mineralogy [35]schist, granodiorite, tonalite, quartz monzonitepy, pyrrhobio, ilm, mag, musco, py, pyrox, pyrrhobio, hbe, py, pyroxpyrox
Water Chemistry [19,28]pH 8.3(5)SO4 7.2(5)–39(5) Mn 45–90
Microbiology H2S↑ (2)L.cholodnii(2)
L. ochracea(2)
cf. Siderocapsa (2)
Site 38: SDR at Eagle Peak Road, [32.962593,-116.749980].
Km 60.7GeologySFeMnCa
Geology/Mineralogy [37]tonalitepy, pyrrhohbe, ilm, mag, py, pyrox, pyrrhohbe, py, pyroxpyrox
Water Chemistry [23]pH 8.22(5)
DO 7.23(3)
SO4 83.9(4)–105(3)
Site 37: SDR in El Capitan Reservoir, [32.883583,-116.803683], and [32.917314,-116.781290], San Diego County unincorporated. SDR enters the north end of the Reservoir. Iron-oxide seeps are particularly common along the northwestern edge. Seeps were also present along the east side of the dam.
Km 49.1GeologySFeMnCa
Geology/Miner-alogy [40]tonalitepy, pyrrhobio, hbe, ilm, mag, py, pyrox, pyrrhobio, hbe, py, pyroxcalc-silicate, pyrox
Water Chemistry [26]pH 7.77(1)–8.45(7)SO4 79.8(1)–162(7)Fe 72.6(4)Mn 10.4(4)–40.8(4)Ca 31.1(1)–36(4)
Microbiology H2S↑ (3,9)
Beggiatoa(9)
FeS2 framboids(3)
L. discophora biofilm(3,9)
FeOx(3,9)
L. discophora(3)
L. ochracea(9)
Siderocapsa(3)
Siderococcus(3)
Toxothrix trichogenes(3)
Site 36: Conejos Creek and its Tributary King Creek, [32.8903,-116.7631], (Tributary of El Capitan Reservoir).
Km 51.5GeologySFeMnCa
Geology/Min-eralogy [38]tonalite, quartz monzonitepy, pyrrhobio, hbe, ilm, mag, py, pyrox, pyrrhobio, hbe, py, pyroxcalc-silicate, pyrox
Water Chemistry [18,22,23]pH 7.7(11)–8.0(5)
DO 8.0(5)
SO4 1(11)–336(3)Fe 0.64(11)–39.7(5)Mn 0(11)–63.7Ca 11.6(11)
Site 35: Chocolate Creek (Tributary of El Capitan Reservoir), [32.8472,-116.8069], City of Alpine. Creek mud was probed where the creek forms a delta into the south end of El Capitan Reservoir. Although iron-oxide-rich rocks crop out along Chocolate Creek, no Fe-oxide flocculates were seen in the delta.
Km 51.0GeologySFeMnCa
Geology/Mineralogy [36]tonalite, gabbropy, pyrrhohbe, ilm, mag, py, pyrox, pyrrhohbe, py, pyroxpyrox
Water Chemistry [18,23]pH 7.21(5)–8.67(5)
DO 5.72(5)–13.81(5)
SO4 2.16(2)–314(5)Fe 0.5(11)Mn 0(11)–64.9(5)Ca 11.2(11)
Microbiology no H2S↑
Site 34: Peutz Creek (Tributary of El Capitan Reservoir), [32.854140,-116.790672].
Km 51.0GeologySFeMnCa
Geology/Miner-alogy [36]tonalitepy, pyrrhohbe, ilm, mag, py, pyrox, pyrrhohbe, py, pyroxpyrox
Water Chemistry [23]pH 7.3(11)SO4 1(11)–116(3)Fe 210(11)Mn 0(11)Ca 4.8(11)
Site 33: SDR below El Capitan Reservoir Dam, [32.883621,-116.814100].
Km 50.5GeologySFeMnCa
Water Chemistry [18,19,20]pH 7.6–8.9SO4 8(11)–268Fe 0.84(11)Mn 0(11)Ca 6(11)
Site 32: Helix Water District Well 101.
Location not publishedGeologySFeMnCa
Water Chemistry [27] SO4 178Fe 140Mn 3000

Middle Watershed

Monthly rainfall (in.), El Cajon Station (32.81389, -116.975, 123 m elev.) [2]
  • Year Jan Feb Mar Apr May Jun Jul Aug Sep Oct Nov Dec Ann
  • 2015 0.62 0.42 1.05 0.15 1.13 0.20 0.57 0.01 0.42 0.75 0.98 1.45 7.75
  • 2016 4.81 0.12 0.96 0.69 0.67 0.00 0.00 0.00 0.49 0.15 1.03 3.76 12.68
Site 31: Featherstone Creek (Tributary of Padre Barona Creek into San Vicente Reservoir), [32.941147,-116.85681], Barona Indian Reservation. Creek is typically dry, but cobbles in the riffles are coated.
Km 44.9GeologySFeMnCa
Geology/Mineralogy [38]granite, gabbro, monzogranite hbe, ilm, mag, pyroxhbe, pyroxpyrox
Microbiology H2S↑ (4) L. discophora coatings(6)
Site 30: San Vicente Creek above San Vicente Reservoir (Tributary of SDR), [32.9934,-116.8498], San Diego County unincorporated.
Km 44.9GeologySFeMnCa
Geology/Miner-alogy [38]tonalite, congpybio, hbe, ilm, mag, pybio, hbe, py
Water Chemistry [22]pH 7.92(3)–8.44(5)
DO 2.53(9)–11.19(5)
SO4 128(3)–600(9) Mn 6.16(5)–1400(6)
Microbiology H2S↑ (9)L. discophora biofilm(9)
FeOx(9)
Site 29: San Vicente Reservoir (Tributary of San Vicente Creek), [32.937880,-116.90896], San Diego County unincorporated. Four major tributaries enter the San Vicente Reservoir. S oxidation and reduction is intense along the drowned tributaries, especially along the east side where a forest was drowned.
Km 44.9GeologySFeMnCa
Geology/Mineralogy [40]tonalite, granodiorite hbe, ilm, mag, pyroxhbe, pyrox
Water Chemistry [18,23,26,28]pH 8.3(3,11)SO4 160(3)–336(11)Fe 0.1(3)–0.2(11)Mn 0(3,11)–60Ca 9.2(3)–83.2(11)
Microbiology H2S↑ (2)
Beggiatoa(2)
L. discophora biofilm(2)
FeOx(2)
Site 28: San Vicente Creek below San Vicente Reservoir, [32.910012,-116.924743].
Km 44.9GeologySFeMnCa
Geology/Miner-alogy [40]tonalite, granodiorite hbe, ilm, mag, pyroxhbe, pyrox
Water Chemistry [21,22]pH 7.1–9.1SO4 7–390 Mn 4.7–52.7Ca 22–112
Site 27: Lake Jennings Reservoir (Tributary of unnamed creek), [32.861092,-116.878203], City of Lakeside. This reservoir stores imported raw water. Seeps with Fe-oxide flocculates are prominent along the south and east sides of the lake.
Km 37.5GeologySFeMnCa
Geology/Miner-alogy [40]monzogranite, tonalite, meta-andesitepy framboids-2bio, hbe, ilm, mag, musco, pyroxbio, hbe, pyrox
Water Chemistry [22] SO4 167(8)–173(8)
Microbiology H2S↑ (2)L. discophora biofilm(2)
FeOx(2)
red rods(2)
L. ochracea(2)
Treated imported water data. Treated imported water from Municipal Water Treatment facilities first enters the watershed as urban runoff here. The sulfate signature is dominated by that of the high-sulfate Colorado River.
Km 37.5GeologySFeMnCa
Water Chemistry [10]pH 7.1–8.7SO4 154–264 Fe not detected at ppbMn not measuredCa 70–78
Site 26: Los Coches Creek (Tributary of SDR) (Flinn Springs County Park), [32.8491,-116.8591], City of Lakeside. The park has an extensive iron spring.
Km 37.5GeologySFeMnCa
Geology/Mineralogy [36]tonalite, granite, schistpybio, hbe, ilm, mag, musco, pybio, hbe, py, pyroxpyrox
Water Chemistry [22]pH 7.81(5)–8.23(11)
DO 5.4(5)–12.17(4)
SO4 26(4)–58.1(12) Mn 5.49(9)–35.9(5)
Microbiology H2S↑ (11)L. discophora biofilm(11)
FeOx(11)
Site 25: SDR below Riverford Road bridge and Lakeside Park, [32.856443,-116.946952], City of Lakeside. Sampled where the river enters the former gravel pit pond.
Km 33.9GeologySFeMnCa
Geology/Mineralogy [40]tonalite, granodiorite bio, hbe, ilm, mag, pyroxbio, hbe, pyrox
Microbiology H2S↑ (8)L. discophora biofilm(3,8)
FeOx(3)
Site 24: SDR at Chubb Lane “Cottonwood Ave. extension” (RCP gravel stockpile facility), [32.84696,-116.9734], City of Santee. Iron bacteria sampled at seeps along the peripheries of the river and S bacteria in backwater areas. Sampled monthly.
Km 31.2GeologySFeMnCa
Geology/Miner-alogy [40]Quaternary river sediment
Water Chemistry [30]pH 7.14(3)–8.37(2)
DO 0.97(6)–5.88(10)
SO4 224(9)–237(8)
Microbiology H2S↑ (2,3,5,9,11)
Thiothrix(10)
L. discophora biofilm(2,10)
FeOx(2,3)
L. ochracea(3,10)
L. discophora coatings(5,6)
Site 23: SDR below Mast Park pedestrian bridge and backwater sites, [32.844080,-116.989653], City of Santee. SDR at the Mast Park site flows through gravel pit ponds, one of which displays Ca precipitation in a backwater location that is slightly protected from the mainstream by cattails. The water is around 5 cm deep. The rock source of Ca is not particularly obvious; the river flows in Holocene alluvium, although the caliche-rich Friars Formation crops out both north and south of the river there. The cyanobacterial mats in the backwater are coated with soft marl and get exposed by duck activity. Young mat-forming Oscillatoria float in the shallow water but are not coated with marl. The larger, presumably older trichomes are coated. Sulfur bacteria are distinct at a nearby backwater. Sampled monthly.
Km 29.4GeologySFeMnCa
Geology/Min-eralogy [40,41]sandstone, claystone, Quaternary river sedimentminor pybio, hbe, hema, pyrox, minor pybio, hbe, pyroxcaliche, marl(6,8,9,10)
Water Chemistry [29,30]pH 7.03(4)–8.87(11)
DO 0.08(11)–4.72(6)
SO4 100(9)–338(5) Mn 100(12)
Microbiology H2S↑ (1,2,5,6,9,10,11,12)
SOx(3,11)
Beggiatoa(7,8,10,11)
Thiothrix(11)
Chromatium(8,9)
L. discophora biofilm(9) Oscillatoria(7)
cf. Pseud-anaebaena(6)
Site 22: Upper Forester Creek below Prospect Avenue bridge (Tributary of SDR), [32.83179621, -116.986214], City of Santee. The creek changes from an upstream concrete channel to a natural river at the bridge. The creek is particularly polluted, flowing through industrial compounds [20]. Sulfate values are so high that it is suggested that sulfuric acid is periodically being released at a yet undiscovered locality. Sampled monthly.
Km 28.8GeologySFeMnCa
Geology/Min-eralogy [34,40,41]sandstone, cong, tonalite, granodioriteminor py bio, hbe, ilm, mag, pyrox, minor pybio, hbe, pyroxmarl(10), concrete channel
Water Chemistry [19,22,30]pH 7.50(8)–8.82(5)
DO 5.91(10)–17.4(6)
SO4 81(3)–643(7) Mn 0.84(6)–276(7)Ca 91(10)
Microbiology H2S↑ (1,10,12)
Beggiatoa (10,11,12)
Thiothrix(12)
vibrios(2)
FeOx(10)
L. discophora biofilm(12)
L. discophora(11,12)
red rods(2)
L. discophora coatings(6,10)
Site 21: Sycamore Creek (Tributary of SDR) (Carleton Oaks, Santee Lakes), [32.84431,-117.0064], City of Santee. Creek receives runoff from Santee Lakes that are discharge ponds created by the Padre Dam Pure Water wastewater treatment facility. Sampled monthly.
Km 28.3GeologySFeMnCa
Geology/Mineralogy [34]monzogranite, granodiorite, Quaternary river sediment bio, hbe, ilm, mag, pyroxbio, hbe, pyrox
Water Chemistry [29,30]pH 7.68(6)–8.54(2)
DO 5.16(11)–10.93(5)
SO4 310(6)–394(7) Mn 210(12)
Microbiology H2S↑ (1,2,3,4)L. discophora biofilm(1,3)
Site 20: SDR below West Hills Parkway, [32.839405,-117.024589], City of Santee. USGS stream gage 11022480 (Mast Road). Sampled monthly.
Km 26.2GeologySFeMnCa
Geology/Min-eralogy [34,41]sandstone, claystone, monzogranite, volc cobblesminor pybio, hbe. hema, pyrox, minor pybio, hbe, pyroxcaliche, feldspar
Water Chemistry [30]pH 6.97(1)–8.73(12)
DO 2.88(8)–11.48(5)
SO4 235(5)–398(8)
Microbiology H2S↑
(2,3,4,5,6,9,10,11,12)
SOx(10)
Beggiatoa(9,10)
Chromatium(5)
L. discophora biofilm(2,3,5,6,9,10)
FeOx(5,6)
L. discophora coatings
(3,6,7,8,9,10,11,12); gone (12)
EPS induced oxide along filaments (6)
Brown biofilm(9)
Site 19: Wells drilled into alluvial aquifer due east of Mission Gorge.
Km not publishedGeologySFeMnCa
Water Chemistry [20]pH 7.1(5,12)–7.9(12)SO4 120(6)–200(5,12)Fe 20(12)–50(12)Mn 8(5)–210(6)Ca 42(5)–390(5,12)
Site 18: SDR at Kumeyaay Lake (Mission Trails Regional Park), [32.841648,-117.034033]. The lake was a gravel pit in SDR alluvium.
Km 24.9GeologySFeMnCa
Geology/Miner-alogy [33,34,41]sandstone, claystone, monzogranite, meta-andesiteminor pybio, chl, hbe, hema, pyrox, minor pybio, hbe, pyroxcaliche, feldspar
Water Chemistry [29]pH 8.5(7)
DO 2(7)
Mn 150(12)
Microbiology L. discophora biofilm(9)L. discophora coatings(9)
Brown biofilm(9)
Km 24.8, SDR reemerges upon encountering volcanic bedrock [32.843288,-117.035317]
Site 17: SDR at Old Mission Dam (Mission Trails Regional Park), [32.83977,-117.0433]. The river flows over the breached Old Mission Dam, often forming extensive white foam directly downstream. Sampled monthly.
24.1 kmGeologySFeMnCa
Geology/Min-eralogy [33,34,41]sandstone, claystone, monzogranite, meta-andesiteminor pybio, chl, hbe, hema, pyrox, minor pybio, hbe, pyroxcaliche, feldspar
Water Chemistry [19,29,30]pH 7.33(4)–8.56(11)
DO 2.29(9)–9.43(11)
SO4 36(9)–601(3)Fe 20(3,12)–30(6)Mn 10(6)–340(12)
Microbiology H2S↑
(1,2,3,4,5,6,10,11,12)
L. discophora biofilm(1,2,3,5,9,10,11)
FeOx(1,2,9,10)
L. discophora(10)
L. ochracea(10)
Siderocapsa(2,3,5,6,10)
L. discophora coatings(3,9)
brown biofilm (8,9)
Site 16: SDR at Jackson Road extension (Mission Trails Regional Park), [32.82124,-117.0621]. The river runs across rock outcrops and the cement barrier of the Second San Diego Aqueduct at Jackson Road extension. Sampled monthly.
Km 21.2GeologySFeMnCa
Geology/Mineralogy [33,34,41]sandstone, claystone, cong, meta-andesite, monzogranite, volc cobblesminor pybio, chl, hbe, hema, pyrox, minor pybio, hbe, pyroxcaliche
Water Chemistry [30]pH 7.04(7)–8.31(5)
DO 0.36(8)–11.74(5)
SO4 155(9)–349(4)
Microbiology H2S↑ (2,3,4,5,9,10.12)
Beggiatoa(3)
L. discophora biofilm(2,3,4,11)
FeOx(3,4)
L. discophora coatings(10,11)
Site 15: Birchcreek (Tributary of SDR) along Jackson Road extension (Mission Trails Regional Park), [32.818942,-117.060987]. Emerging from the calcareous Friars Formation, Birchcreek begins as a spring under Mission Gorge Road. Sampled monthly.
Km 21.2GeologySFeMnCa
Geology/Mineralogy [34,41]sandstone, claystone, cong, meta-andesite, volc cobblesminor pybio, chl, hbe, hema, pyrox, minor pybio, hbe, pyroxcalichetufa(1,2,3,6,9,10,12)
Water Chemistry [30] pH 7.38(8)–8.20(2)
DO 7.19(10)–13.55(6)
SO4 285(5)–355(6)
Microbiology H2S↑ (3,10)
Beggiatoa (7)
Thiothrix (7)
L. ochracea(9)L. discophora coatings(10)cf. Gloeocapsa (1,9,12)
Rivularia(6,7,9)

Lower Watershed

Monthly rainfall (in.), San Diego WSO (32.73361, -117.18306, 11 m elev.) [2]
  • Year Jan Feb Mar Apr May Jun Jul Aug Sep Oct Nov Dec Ann
  • 2015 0.42 0.28 0.93 0.02 2.39 0.04 1.71 0.01 1.24 0.43 1.54 0.88 9.89
  • 2016 3.21 0.05 0.76 0.55 0.44 0.00 0.00 0.00 0.32 0.07 0.61 4.22 10.23
  • Site 14: SDR at southern end of Admiral Baker Golf Course, Zion Rd. [32.79304,-117.0998]. Sampled bimonthly.
Km 15.4GeologySFeMnCa
Geology/Miner-alogy [34]sandstone, claystone, cong, volc cobbles bio, hbe, hema, pyroxbio, hbe, pyroxcaliche, calc cement
Water Chemistry [30]pH 7.12(9)–8.43(12)
DO 0.99(10)–11.14(5)
SO4 119(5)–355(7)
S2− not detected (1,3,4,6,7,12)–0.97(8)
Microbiology H2S↑ (6,10)
Beggiatoa(6,10)
Thiocystis(6)
L. discophora biofilm(9)L. discophora coatings(6,9,10)
Site 13: SDR sulfuretum under Friars Road bridge, [32.790280, -17.102561] No obvious rock source of sulfide or sulfate is present in the surrounding rocks and sediments. The sulfuretum disappeared following intense rainfall events and then set up afterwards.
Km 15.2GeologySFeMnCa
Geology/Mineralogy [34,41]sandstone, claystone, cong, volc cobblesminor pybio, hbe, hema, pyrox, minor pybio, hbe, pyroxcaliche, calc cement
Water ChemistrypH 7.17(9)–7.3(7)
DO 0.42(9)
Microbiology H2S↑ (1,2,4,6,7,8,9,10)
SOx(5,10)
Beggiatoa(6,9,10)
Thiothrix(6,7,9)
Chromatium(10)
Thiocystis (6,7)
Thiospirillum (9,10)
Chloroflexus(6,9,10)
vibrios(1,6)
L. discophora biofilm(5,6,9,10)
FeOx(1,9)
Magnetotactics? (10)
L. discophora coatings(4,10,12)
Site 12: SDR at Kaiser Ponds (San Diego Mission Road), [32.783509,-117.104174]. The ponds are small lakes formed were river alluvium gravel was extracted. Sampled monthly.
Km 14.7GeologySFeMnCa
Geology/Min-eralogy [34,41]sandstone, claystone, mudstone, cong, volc cobblesminor pybio, hbe, hema, pyrox, minor pybio, hbe, pyroxcaliche, mollusk fossils, calc cement
Water Chemistry [30]pH 7.02(3)–8.12(12)
DO 0.08(7)–6.02(1)
SO4 176(8)–220(7)Fe 202(1)Mn 14.6(1)Ca 18.6(1)
Microbiology H2S↑ (1,2,9,10,12)
vibrios(1)
Site 11: Lake Murray Reservoir (Tributary of Alvarado Creek), [32.787782,-117.035660]. The reservoir was sampled along the Padre Bay embayment at the NE side of the lake.
Km 14.5GeologySFeMnCa
Geology/Mineralogy [34,42]sandstone, cong, mudstone, meta-andesiteminor pybio, chl, minor pybiocaliche, calc cement, mollusk fossils
Water Chemistry [19,22] SO4 109(12)–290(8) Mn 7.11(9)–38.9(9)
Microbiology H2S↑ (2)FeOx(2)
L. discophora biofilm(2)
Gallionella ferruginea(2)
L. ochracea(2)
Siderocapsa(2)
Site 10: Alvarado Creek (Tributary of SDR), [32.779964,-117.071517]. Sampled at the San Diego State University access site along the rocks and upstream where ground water discharged into sandy sediment near the railroad tracks.
Km 14.5GeologySFeMnCa
Geology/Mineralogy [34,42]sandstone, cong, mudstone, meta-andesite, volc cobblesminor pybio, chl, ferrihy, hema, minor pybiocaliche, marl(10), mollusk fossils, calc cement
Water Chemistry [22]pH 7.84(10)–8.02(10)
DO 6.66(10)–9.5(10)
SO4 257(10)–377(2) Mn 9.25(5)–72.9(2)
Microbiology Beggiatoa(10)FeOx(10)
L. discophora biofilm(12)
L. discophora coatings(10)
The Mission Valley aquifer underlies all the remaining sites. The aquifer is in a buried channel created during the Last Glacial Maximum of the Pleistocene Epoch [15].
Site 9: SDR below Ward Road bridge, [32.78024,-117.11003]. Sampled monthly.
Km 13.8GeologySFeMnCa
Geology/Mineralogy [34,41,42]sandstone, cong, mudstone, claystone, marl, Quaternary river sediment, volc cobblesminor pybio, epi, ferrihy, hbe, hema, ilm, mag, pyrox, minor pybio, hbe, pyroxcaliche, marl, epi, mollusk fossils, calc cement
Water Chemistry [30]pH 7.04(4)- 8.18(11)
DO 0.38(10)–7.75(1)
SO4 178(7)–211(8) Mn 542(4)Ca 135(10)
Microbiology H2S↑ (1,2,4,6,9,12)
Beggiatoa(9,10)
Thiothrix(9,10)
SOx(9,10)
vibrios(1)
L. discophora biofilm(1,2)
FeOx(2)
L. ochracea(9)
L. discophora coatings(2,10)
Site 8: USGS Well SDAQ (Screen elevation 20 ft. a.m.s.l.), [32.778067,-117.120910]. Hydraulic head measurements in the well were 3–5 m above ground surface suggesting the possibility of artesian flow into SDR [16].
Km 12.7GeologySFeMnCa
Water Chemistry [15]pH 7.0(8)–7.1(5)
DO 0.5(5)–2.1(8)
SO4 224(8)–237(5)Fe 524(8)–920(5)Mn 2790(8)–3050(5)Ca 219(5)–221(8)
Site 7: City of San Diego DB Monitoring Wells.
Km 12.2GeologySFeMnCa
Water Chemistry [15]pH 7.0(6)–7.1(4)SO4 203(4)–212(6)Fe 4.11(4)–7.83(6)Mn 1660(4)–2610(6)Ca 160(4)–172(6)
Km ~11.1, Tidal Limit, [32.776899,-117.127259].
Site 6: SDR at Qualcomm Way (First San Diego River Improvement Project, FSDRIP), [32.76986,-117.1548]. The river was sampled on the upstream side of a pond in a former gravel excavation where the river flows under the road. Sampled bimonthly.
Km 9.3GeologySFeMnCa
Geology/Mineralogy [34,42]sandstone, mudstone, cong, marlminor pybio, ferrihy, hbe, hema, ilm, mag, minor pybio, hbecaliche, marl. mollusk fossils, calc cement
Water Chemistry [30]pH 7.12(3)–8.23(5)
DO 0.57(10)–11.51(4)
SO4 46(11)–322(9)
S2− not detected (1–7,9–12)–1.36(12)
Microbiology H2S↑ (1,6,7,9,10)
Beggiatoa(7,8,9,10)
Thiothrix(8)
Chromatium(7)
vibrios(1)
L. discophora coatings(10,12)
Site 5: SDR below California State Route 163 bridge, [32.767190,-117.161806]. Sampling took place in the river under the bridge. S oxidation and reduction was strong and Thiothrix sp. rosettes covered the underwater parts of invasive Ludwigia sp. (Evening Primrose).
Km 8.6GeologySFeMnCa
Geology/Mineral-ogy [34,42]sandstone, claystone, cong, volc cobblesminor pybio, epi, ferrihy, hema, hbe, ilm, mag, minor pybio, hbecaliche, calc mollusks, calc cement, epi
Microbiology H2S↑ (1,8)
Thiothrix(8)
Site 4: SDR under Fashion Valley Mall (Town and Country) bridge, [32.76517,-117.1687]. USGS stream gage 110123000 (Fashion Valley). Sampling took place in the river due south of Fashion Valley Mall under the Town and Country bridge and at the west side of Fashion Valley Road. Sampled bimonthly.
Km 7.9GeologySFeMnCa
Geology/Mineralogy [34,42]sandstone, claystone, cong, volc cobblesminor pybio, ferrihy, hema, minor pybiocaliche, calc mollusks, calc cement, epi
Water Chemistry [30]pH 7.12(3)–8.17(11)
DO 0.18(9)–7.93(4)
SO4 69(7)–315(9)
S2− not detected (1–7,9–12)–0.88(5)
Microbiology H2S↑ (1,2,4,6,8,9,10,12)
Beggiatoa(1–7,8–12)
Chromatium(8)
SOx(4,10)
vibrios(1)
FeOx(1)
Site 3: SDR at YMCA (River Gardens), [32.76230,-117.1944]. The river flows at the south end of the YMCA complex through an area being developed by SDRPF as River Gardens. Sampled bimonthly.
Km 5.4GeologySFeMnCa
Geology/Miner-alogy [34,42]artificial fill, sandstone, siltstone, claystone, congminor pybio, ferrihy, hema, minor pybiomollusk & ostracod fossils, caliche, calc cement
Water Chemistry [22,30]pH 7.12(3)–8.54(11)
DO 0.62(10)–9.28(4)
SO4 82(9)
–409(9)S2− not detected (1,3,4,6,7,9–12)–1.07(5)
Mn 239
Microbiology H2S↑ (1,2,4,6,7,8,9,10,12)
Beggiatoa(6,8,9,10)
Thiothrix(6,7,8,10)
Chromatium(9)
vibrios(1)
L. discophora biofilm(6)
FeOx(6)
L. discophora coatings(6,8)
Site 2: SDR at Estuary (east end), [32.76131,-117.2037]. Sampling of the river took place on the west side of Pacific Highway, west of the sewer line crossing the river. Sulfate reduction was common in the muddy sediment around the peripheries of the river. Iron oxidizing biofilms and possible Mn oxide coated biofilms were collected along pools in the floodplain. Sampled monthly.
Km 4.6GeologySFeMnCa
Geology/Mineralogy [34]artificial fill, sandstone mollusk & ostracod fossils, marl(12)
Water Chemistry [29,30]pH 7.40(4)–8.42(11)
DO 1.85(7)–10.57(5)
SO4 93(9)–503(8) Mn 20(12)
Microbiology H2S↑ (1,2,9,12)
vibrios(1)
L. discophora biofilm(10)brown biofilm (10)
Site 1: Famosa Slough (Tributary of SDR), [32.755377,-117.228585]. Famosa Slough is a protected wetland surrounding a tributary that flows from the south into the river. Brackish water periodically floods the wetland.
Km 2.2GeologySFeMnCa
Geology/Mineralogy [34]artificial fill, sandstone mollusk & ostracod fossils
Microbiology H2S↑ (8)
SDR Mouth (south end of Mission Bay, San Diego), [32.756068,-117.252714].
Km 0.0GeologySFeMnCa
Geology/Mineralogy [34]artificial fill

References

  1. San Diego River Conservancy, Environmental Initial Study 2009. Available online: sdrc.ca.gov/docs/SDRC_Initial_Study_MASTER_7.8.09_-_final.pdf (accessed on 13 October 2018).
  2. Western Regional Climate Center. Available online: https://wrcc.dri.edu/ (accessed on 13 October 2018).
  3. Kennedy, J.C.; (San Diego River Park Foundation, San Diego, CA, USA). Written communication, 2015.
  4. San Diego County, Groundwater Evaluation Technical Memorandum. Available online: https://www.sandiegocounty.gov/content/dam/sdc/pds/ProjectPlanning/El-Monte-Sand-Mining-And-Nature-Preserve/SDEIRPublicReview/Appendices/Appendix%20J6%20-%20Reclamation_Plan.pdf (accessed on 13 October 2018).
  5. Eidson, J.B.; (City of San Diego, Public Utilities Department, San Diego, CA, USA). El Capitan Reservoir Water Distribution, Water Systems Operations Memo. Written communication, 2018. [Google Scholar]
  6. San Diego County Water Authority b, Member Agency Map. Available online: https://www.sdcwa.org/annualreport/2014/member-agency-map (accessed on 13 October 2018).
  7. Lakeside Water District, 2016 and 2017, Newsletters. Available online: https://lakesidewater.org/2017%20Newsletter.pdf (accessed on 13 October 2018).
  8. San Diego County Water Authority a, Imported Supplies. Available online: https://www.sdcwa.org/imported-supplies (accessed on 13 October 2018).
  9. San Diego County Water Authority 2015 Urban Water Management Plan. Available online: https://www.sdcwa.org/sites/default/files/UWMP2015.pdf (accessed on 13 October 2018).
  10. City of San Diego, Annual Drinking Water Quality Reports. Available online: www.sandiego.gov/water/quality/reports/index.shtml (accessed on 13 October 2018).
  11. San Diego County Water Authority d, Annual Report 2008. Available online: https://www.sdcwa.org/sites/default/files/files/publications/annual_2008.pdf (accessed on 13 October 2018).
  12. U.S. Geological Survey National Water Information System. Available online: https://nwis.waterdata.usgs.gov/ (accessed on 13 October 2018).
  13. Irelan, B. Salinity of Surface Water in the Lower Colorado River—Salton Sea Area; Professional Paper 486-E; U.S. Geological Survey: Washington, DC, USA, 1971; 46p, ISBN 13:97812866781214032.
  14. Flint, L.E.; Flint, A.L.; Stolp, B.J.; Danskin, W.R. A basin-scale approach for assessing water resources in a semiarid environment: San Diego region, California and Mexico. Hydrol. Earth Syst. Sci. 2012, 16, 3817–3833. [Google Scholar] [CrossRef]
  15. Sengebush, R.M.; Heagle, D.J.; Jackson, R.E. The Late Quaternary history and groundwater quality of a coastal aquifer, San Diego, California. Envrion. Eng. Geosci. 2015, 21, 249–275. [Google Scholar] [CrossRef]
  16. Danskin, W.R. U.S. Geological Survey San Diego Hydrogeology Project. Available online: http://ca.water.usgs.gov/sandiego (accessed on 13 October 2018).
  17. San Diego River Park Foundation. Available online: http://sandiegoriver.org/online_info_center.html (accessed on 16 December 2018).
  18. Fast, A.W. Artificial Destratification of El Capitan Reservoir by Aeration, Part 1, Effects of Chemical and Physical Parameters; Fish Bulletin 141; California Dept. Fish and Game: Sacramento, CA, USA, 1968; 97p.
  19. Department of Water Resources, State of California. Vol. 5 Southern California. Bull. 130-71; Department Water Resources, State of California: Sacramento, CA, USA, 1972; 525p.
  20. Izbicki, J.A. Evaluation of the Mission, Santee, and Tijuana Hydrologic Subareas for Reclaimed-Water Use, San Diego County, California; Water-Resources Inv. Rpt. 85-4032; U.S. Geological Survey: Washington, DC, USA, 1985; 106p.
  21. California Environmental Data Exchange Network. Available online: www.ceden.org (accessed on 13 October 2018).
  22. Surface Water Ambient Monitoring Program (SWAMP), California Water Boards. Available online: https://www.waterboards.ca.gov/sandiego/water_issues/programs/swamp/docs/907sandiegorpt.pdf (accessed on 13 October 2018).
  23. City of San Diego, Public Utilities Department. Available online: https://www.sandiego.gov/public-utilities (accessed on 13 October 2018).
  24. Padre Dam Municipal Water District, Annual Water Quality Report. Available online: https://www.padredam.org/DocumentCenter/View/2351/PadreDamWQR2015?bidId= (accessed on 13 October 2018).
  25. Ramona Municipal Water District, Annual Water Quality Report. Available online: http://www.rmwd.org/images/Files/CCR-2016.pdf (accessed on 13 October 2018).
  26. Burger, T.B.; (Public Utilities Department, San Diego, CA, USA). Water Chemistry of El Capitan and San Vicente Reservoirs. Written communication, 2018. [Google Scholar]
  27. Smith, T.; Rasmus, J. Indirect Reuse with Multiple Benefits—The El Monte Valley Mining, Reclamation, and Groundwater Recharge Project. Managed Aquifer Recharge Symposium, Irvine, CA. 2011. Available online: http://www.nwri-usa.org/pdfs/SmithPresentationfinal.pdf (accessed on 13 October 2018).
  28. City of San Diego Water Department 2005 Watershed Sanitary Survey. Available online: https://www.sandiego.gov/sites/default/files/legacy/water/operations/environment/pdf/05wsfull.pdf (accessed on 21 November 2018).
  29. California Regional Water Quality Control Board San Diego. Available online: https://www.waterboards.ca.gov/water_issues/programs/tmdl/records/region_9/2003/ref1558.pdf (accessed on 21 November 2018).
  30. Fried, J. Analysis of Anionic Contributions to Total Dissolved Solids in the Lower San Diego River. Bachelor’s Thesis, San Diego State University, San Diego, CA, USA, 2015; 42p. [Google Scholar]
  31. Thorbjarnarson, K.W.; McCarlson, A.; Wood, A.; Durand, K.; Kauffman, L.; El-Najjar, N.; Hopper, G.; Daniels, S.; Wirster, C.; (San Diego State University, San Diego, CA, USA). Water quality investigation of Alvarado Creek, San Diego River Watershed, Geochemistry Class Poster. Written communication, 2015. [Google Scholar]
  32. Thorbjarnarson, K.W.; McManus, H.; Rice, J.; Carty, K.; Gonzales, J.; Garcia, B.; Hill, K.; Bartholomew, W.; Baigent, B.; Faye, A.; (San Diego State University, San Diego, CA, USA). Water quality investigation of Forester Creek, San Diego River Watershed, SDSU Geochemistry Class Poster. Written communication, 2015. [Google Scholar]
  33. Abbott, P.L. Geology Mission Trails Park; Mission Trails Regional Park Foundation: San Diego, CA, USA, 2017; 76p, ISBN 978-0-692-97712-5. [Google Scholar]
  34. Kennedy, M.P.; Peterson, G.L. Geology of the San Diego Metropolitan Area, California; Bulletin 200; California Division Mines Geology: Sacramento, CA, USA, 2001; 56p.
  35. Todd, V.R. Geologic Map of the Cuyamaca Peak 7.5’ Quadrangle, San Diego County, California; Open File Rept. OF-77-405; Map Scale 1:24,000; U.S. Geological Survey: Reston, VA, USA, 1977.
  36. Todd, V.R. Geologic Map of the Alpine 7.5’ Quadrangle, San Diego County, California; Open File Rept. OF-83-781; Map Scale 1:24,000; U.S. Geological Survey: Reston, VA, USA, 1980.
  37. Todd, V.R. Geologic Map of the Tule Springs 7.5’ Quadrangle, San Diego County, California; Open File Rept. OF-82-221; Map Scale 1:24,000; U.S. Geological Survey: Reston, VA, USA, 1982.
  38. Todd, V.R. Geologic Map of the El Cajon Mountain 7.5’ Quadrangle, San Diego County, California; Open File Rept. OF-83-781; Map Scale 1:24,000; U.S. Geological Survey: Reston, VA, USA, 1983.
  39. Todd, V.R. Geologic Map of the Santa Ysabel 7.5’ Quadrangle, San Diego County, California; Open File Rept.; Map Scale 1:24,000; U.S. Geological Survey: Reston, VA, USA, 2007.
  40. Todd, V.R.; Alvarez, R.M.; TechniGraphic Systems, Inc. Preliminary Geologic Map of the El Cajon 30’ × 60’ Quadrangle, Southern California; Open-File Rept. OF-2004-1361; Map Scale 1:100,000; U.S. Geological Survey: Reston, VA, USA, 2004.
  41. Fink, K.A. Petrology of the Eocene Friars Formation, El Cajon, Grossmont, and Tierrasanta Areas, Southwestern San Diego County, California. Bachelor’s Thesis, San Diego State University, San Diego, CA, USA, 1976. [Google Scholar]
  42. Kern, J.P. Paleoenvironment of new trace fossils from the Eocene Mission Valley Formation, California. J. Paleontol. 1978, 52, 188–194. [Google Scholar]
  43. National Geologic Map Database, U.S. Geological Survey. Available online: https://ngmdb.usgs.gov/mapview/ (accessed on 13 October 2018).
  44. Gastil, G.; Higley, R. Guide to San Diego Area Stratigraphy; San Diego State University: San Diego, CA, USA, 1977; 62p. [Google Scholar]
  45. Germinario, M.P. Depositional and Tectonic Environments of the Julian Schist, Julian, California. Master’s Thesis, San Diego State University, San Diego, CA, USA, 1982. [Google Scholar]
  46. Hertlein, L.G.; Grant, U.S., IV. The Geology and Paleontology of the Marine Pliocene of San Diego, California; Pt. 1, Geology. Memoir Volume 2; San Diego Society Natural History: San Diego, CA, USA, 1944; 72p. [Google Scholar]
  47. Schmidt, T.M.; Arieli, B.; Cohen, Y.; Padan, E.; Strohl, W.R. Sulfur metabolism in Beggiatoa alba. J. Bacteriol. 1987, 169, 5466–5472. [Google Scholar] [CrossRef] [PubMed]
  48. Todd, V.R.; Shaw, S.E.; Langenheim, V.E. Mineralogy and physical properties of plutonic and metamorphic rocks of the Peninsular Ranges batholith, San Diego County, California. In Peninsular Ranges Batholith, Baja California and Southern California; Morton, D.M., Miller, F.K., Eds.; Memoir 211; Geological Society America: Boulder, CO, USA, 2014; pp. 537–582. ISBN 9780813712116. [Google Scholar]
  49. Todd, V.R.; Hernandez, J.L.; Busch, L.L. The zoned Ramona plutonic complex: An Early Cretaceous mid-to upper-crustal intrusive sequence, Peninsular Ranges batholith, southern California. In Peninsular Ranges Batholith, Baja California and Southern California; Morton, D.M., Miller, F.K., Eds.; Memoir 211; Geological Society America: Boulder, CO, USA, 2014; pp. 583–608. ISBN 9780813712116. [Google Scholar]
  50. Van Gemerden, H.; Mas, J. Ecology of phototrophic sulfur bacteria. In Anoxygenic Photosynthetic Bacteria; Blankenship, R.E., Madigan, M.T., Bauer, C.E., Eds.; Kluwer: Dordrecht, The Netherlands, 1995; pp. 49–85. ISBN 13:9780792336815. [Google Scholar]
  51. Robbins, E.I.; LaBaugh, J.W.; Merk, D.A.; Parkhurst, R.S.; Puckett, L.J.; Rosenberry, D.O.; Schuster, P.F.; Shelito, P.A. Bacterial indicators of ground-water discharge—Iron seeps in the Shingobee River and Crow Wing watersheds, Northern Minnesota. In Hydrological and Biogeochemical Research in the Shingobee River Headwaters Area, North-Central Minnesota; Winter, T.C., Ed.; Water-Res. Inv. Rept. WRI 96-4215; U.S. Geological Survey: Denver, CO, USA, 1997; pp. 177–185. [Google Scholar]
  52. Fleischer, M. Glossary of Mineral Species; Mineral Record, Inc.: Bowie, MD, USA, 1975; 145p. [Google Scholar]
  53. Tebo, B.M.; Bargar, J.R.; Clement, B.B.; Dick, G.J.; Murray, K.J.; Parker, D.; Verity, R.; Webb, S.M. Biogenic manganese oxides, Properties and mechanisms of formation. Ann. Rev. Earth Planet. Sci. 2004, 32, 287–338. [Google Scholar] [CrossRef]
  54. Scheidegger, A.E. River Action. In Systematic Geomorphology; Springer: Vienna, AT, USA, 1987; Chapter 6; pp. 131–177. ISBN 13:9780387820019. [Google Scholar]
  55. Ford, T.D.; Pedley, H.M. A review of tufa and travertine deposits of the world. Earth-Sci. Rev. 1996, 41, 117–175. [Google Scholar] [CrossRef]
  56. Nordstrom, D.K.; Southam, G. Geomicrobiology of sulfide mineral oxidation, Chapter 11. In Geomicrobiology: Interactions between Microbes and Minerals; Banfield, J.F., Nelson, K.H., Eds.; V. 35, Reviews in Mineralogy; Mineralogical Society of America: Washington, DC, USA, 1997; pp. 361–390. ISBN 0-939950-45-6. [Google Scholar]
  57. Mielke, R.E.; Pace, D.L.; Porter, T.; Southam, G. A critical stage in the formation of acid mine drainage: Colonization of pyrite by Acidithiobacillus ferrooxidans under pH-neutral conditions. Geobiology 2003, 1, 81–90. [Google Scholar] [CrossRef]
  58. Rickard, D.; Luther, G.W., III. Chemistry of iron sulfides. Chem. Rev. 2007, 107, 514–562. [Google Scholar] [CrossRef] [PubMed]
  59. Sanchez, O.; Van Gemerden, H.; Mas, J. Acclimation of the photosynthetic response of Chromatium vinosum to light-limiting conditions. Arch. Microbiol. 1998, 170, 405–410. [Google Scholar] [CrossRef] [PubMed]
  60. Ghosh, W.; Dam, B. Biochemistry and molecular biology of lithotrophic sulfur oxidation by taxonomically and ecologically diverse bacteria and archaea. FEMS Microbiol. Rev. 2009, 33, 999–1043. [Google Scholar] [CrossRef] [PubMed] [Green Version]
  61. Biggs, T.W.; Lai, C.-T.; (San Diego State University, San Diego, CA, USA). Personal communication, 2018.
  62. Kantachote, D.; Charernjiratrakul, W.; Noparatnaraporn, N.; Oda, K. Selection of sulfur oxidizing bacterium for sulfide removal in sulfate rich wastewater to enhance biogas production. Electron. J. Biotechnol. 2008, 11, 107–118. [Google Scholar] [CrossRef]
  63. Kobayashi, H.A.; Stenstrom, M.; Mah, R.A. Use of photosynthetic bacteria for hydrogen sulfide removal from anaerobic waste treatment effluent. Water Res. 1983, 17, 579–587. [Google Scholar] [CrossRef]
  64. Robbins, E.I.; Anderson, J.E.; Podwysocki, M.H.; Nord, G.L., Jr. Seasonal variations in spectral reflectance of microbial flocculates, precipitates, and oil-like films associated with neutral and acidic mine drainage. In Environmental Monitoring and Biodiagnostics of Hazardous Contaminants; Healy, M., Wise, D.L., Moo-Young, M., Eds.; Kluwer Academic Publishers: Boston, MA, USA, 2001; pp. 243–266. [Google Scholar]
  65. Chukrov, F.V.; Zvyagin, B.B.; Gorshkov, A.I.; Yermilova, L.P.; Balachova, V.V. Ferrihydrite. Int. Geol. Rev. 1974, 16, 1131–1143. [Google Scholar] [CrossRef]
  66. Ghiorse, W.C. Biology of iron-and manganese-depositing bacteria. Ann. Rev. Microbiol. 1984, 38, 515–550. [Google Scholar] [CrossRef] [PubMed]
  67. Grashoff, L. They Breathe Iron, Artistic and Scientific Encounters with an Ancient Life Form; Science & Art Press: Oberlin, OH, USA, 2014; 137p, ISBN 978-0-692-20586-0. [Google Scholar]
  68. Hem, J.D. Study and Interpretations of the Chemical Characteristics of Natural Water; Water-Supply Paper 2254; U.S. Geological Survey: Washington, DC, USA, 1989; 263p, ISBN 13:9789990638479.
  69. Robbins, E.I.; Corley, T.L. Microdynamics and seasonal changes in manganese oxide epiprecipitations in Pinal Creek, Arizona. Hydrobiologia 2005, 534, 165–180. [Google Scholar] [CrossRef]
  70. Robbins, E.I.; Brant, D.L.; Ziemkiewicz, P.F. Microbial, algal, and fungal strategies for manganese oxidation at a Shade Township Coal Mine, Somerset County, Penna. In Proceedings of the 16th Annual Meeting, American Society of Surface Mining and Reclamation, Scotsdale, AZ, USA, 13–19 August 1999; Volume 2, pp. 634–640. [Google Scholar]
  71. Sato, M.; Robbins, E.I. Recovery/Removal of Metallic Elements from Waste Water Using Ozone. U.S. Patent No. US 6,485,696 B1, 2003. [Google Scholar]
  72. Robbins, E.I.; D’Agostino, J.P.; Fanning, D.S.; Carter, V.; Van Hoven, R. Manganese nodules and microbial oxidation of manganese in the Huntley Meadows wetland, Virginia, USA. Catena Suppl. (Dutch Soils J.) 1992, 21, 1–23. [Google Scholar]
  73. Mindat.org. Buserite. Available online: https://www.mindat.org/min-9779.html (accessed on 13 October 2018).
  74. Weber, F.H. Geology and Mineral Resources of San Diego County, California; Map Scale 1:750,000; California Division of Mines & Geology: Sacramento, CA, USA, 1959.
  75. Kamennaya, N.A.; Ajo-Franklin, C.M.; Northen, T.; Jansson, C. Cyanobacteria as biocatalysts for carbonate mineralization. Minerals 2012, 2, 338–364. [Google Scholar] [CrossRef]
Figure 1. San Diego River watershed, sampling sites (1–47), and additional sources of water. Red numbers are monitored sites. (Map adapted from San Diego River Conservancy [1]).
Geosciences 08 00495 g001
Figure 2. Sources and Sinks of Sulfur in the San Diego River Watershed.
Geosciences 08 00495 g002
Figure 3. Images and photomicrographs reflecting S availability in the San Diego River watershed. (a) Rusty red-orange weathering rind from oxidation of pyrite (FeS2) in Julian schist (Site 44-Temescal Ck). (b) Sulfuretum in riffle (Site 13-SDR under Friars Rd bridge). (c) Chloroflexus sp. (green) coated with Beggiatoa sp. (white) (Site 13-sulfuretum in SDR under Friars Rd bridge). (d) Thiothrix sp. colonizing Myriophyllum sp. (Site 4-SDR under highway 163 bridge in Fashion Valley). (e) Black sulfidic mud under footprint (Site 23-SDR at backwater at Mast Park). (f) Thiothrix sp. filaments in flowing river (Site 9-SDR at Ward Rd). (g) Chromatium sp. on submerged boulder (Site 13-sulfuretum in SDR under Friars Rd bridge). (h) Chromatium sp. (Site 13-sulfuretum in SDR under Friars Rd bridge, 450×). (i) Thiospirillum sp. (Site 13-sulfuretum in SDR under Friars Rd bridge, 450×). (j) Beggiatoa sp. (Site 13-sulfuretum in SDR under Friars Rd bridge, 450×). (k) Thiothrix sp. (Site 9-SDR at Ward Rd., 450×). (l) Chloroflexus sp. (Site 13-sulfuretum in SDR under Friars Rd bridge, 450×).
Geosciences 08 00495 g003
Figure 4. Sources and Sinks of Iron in the San Diego River Watershed.
Geosciences 08 00495 g004
Figure 5. Images and photomicrographs reflecting Fe availability in the San Diego River watershed. (m) Rusty red-orange weathering rind from oxidation of pyrite (FeS2) in Julian schist (Site 44-Temescal Ck). (n) Iron spring (Site 44-Temescal Ck). (o) Oil-like Leptothrix discophora biofilm floating on water (Site 10-Alvarado Ck). (p) Leptothrix ochracea (Site 11-Lake Murray, 450×). (q) Leptothrix discophora holdfasts and short rods of oil-like biofilm (Site 24-SDR at Cottonwood Ave, 450×).
Geosciences 08 00495 g005
Figure 6. Sources and Sinks of Manganese in the San Diego River Watershed.
Geosciences 08 00495 g006
Figure 7. Images and photomicrographs reflecting Mn availability in the San Diego River watershed. (r) Mn-oxide coated cobble (Site 17-SDR at Old Mission Dam). (s) Mn-oxide coated microscope slide set suspended one month in river (Site 20-SDR at West Hills). (t) Leptothrix discophora holdfasts on microscope slide (Site 20-SDR at West Hills, 450×). (u) Unidentified epilithic diatoms precipitating Mn oxide at their holdfasts (Site 3-SDR at River Gardens, 100×). (v) Brown-stained foam (Site 17-SDR at Old Mission Dam). (w) Leptothrix discophora holdfasts from brownish biofilm (Site 2-along Estuary, 450×).
Geosciences 08 00495 g007
Figure 8. Sources and Sinks of Calcium in the San Diego River Watershed.
Geosciences 08 00495 g008
Figure 9. Images and photomicrographs reflecting Ca availability in the San Diego River watershed. (x) Cascade of hard tufa terracettes (Site 15-Birchcreek). (y) Surface of tufa terracette coated by embedded Rivularia sp. (Site 15-Birchcreek). (z) Rivularia sp. attached to tufa (Site 15-Birchcreek, 450×). (aa) Rivularia sp. attached to tufa (Site 15-Birchcreek, 450×). (bb) Cream-colored gritty marl and floating, dislodged Oscillatoria sp. (Site 23-backwater of SDR at Mast Park). (cc) Calcite-coated Oscillatoria sp. hormogonia from marl (Site 23-backwater of SDR at Mast Park, 450×).
Geosciences 08 00495 g009

