Article

The Application of Freely-Available Satellite Imagery for Informing and Complementing Archaeological Fieldwork in the “Black Desert” of North-Eastern Jordan

by
Stefan L. Smith
1,* and
Marie-Laure Chambrade
2
1
Department of Archaeology, University of Gent, Campus Ufo, Sint-Pietersnieuwstraat 35, 9000 Gent, Belgium
2
University of Lyon, CNRS, Archéorient UMR 5133, Maison de l’Orient et de la Méditerranée, 5/7 rue Raulin, CEDEX 07, 69365 Lyon, France
*
Author to whom correspondence should be addressed.
Geosciences 2018, 8(12), 491; https://doi.org/10.3390/geosciences8120491
Submission received: 30 November 2018 / Revised: 11 December 2018 / Accepted: 12 December 2018 / Published: 15 December 2018

Abstract

:
Recent developments in the availability of very high-resolution satellite imagery through platforms like GoogleEarth (Google, Santa Clara County, CA, USA) and Bing Maps (Microsoft, Redmond, WA, USA) have greatly opened up the possibilities of their use by researchers. This paper focusses on the exclusive use of free remote sensing data by the Western Harra Survey (WHS), an archaeological project investigating the arid “Black Desert” of north-eastern Jordan, a largely impenetrable landscape densely strewn with basalt blocks. The systematic analysis of such data by conducting a holistic satellite survey prior to the commencement of fieldwork allowed for the precise planning of ground surveys, with advanced knowledge of which sites were vehicle-accessible and how to efficiently visit a stratified sample of different site types. By subsequently correlating the obtained ground data with this analysis, it was possible to create a typological seriation of the site forms known as “wheels”, determine that at least two-thirds of sites are within 500 m of valleys or mudflats (highlighting these features’ roles as access routes and resource clusters) and identify numerous anthropogenic paths cleared through the basalt for site access and long-distance travel. These results offer new insights into this underrepresented region and allow for supra-regional comparisons with better investigated areas by a method that is rapid and cost-effective.

1. Introduction

The “Black Desert” of north-eastern Jordan, known locally as the Harra, has been subject to varied but intermittent research over the last century. Though the first use of aerial photography for archaeological research commenced in the 1920s, identifying a dense distribution of prehistoric stone structures, ground investigations did not occur until the 1970s, mainly due to the extreme inaccessibility of the terrain. Meanwhile, large-scale analyses of satellite imagery to enable a holistic coverage of the region have only been possible for the last few years, and with the recent release of very high-resolution imagery through platforms like GoogleEarth and Bing Maps, this has become freely available to all projects. This has not only greatly aided the archaeology of this region, as indeed similar developments in the last decade have all over the world, but has actually enabled the commencement of holistic studies of the type that already exist in more accessible parts of Mesopotamia and the Levant, such as the Jazira in northern Syria and the Shamiya in central Syria. While the capacity of free satellite imagery to enable the recognition of sites in this region by remote sensing has been investigated by other authors, e.g., Reference [1], it is by the integration with ground survey data that its full potential is unlocked. This paper examines this process in the context of its benefit to the Western Harra Survey (WHS), an archaeological, geographical and geological investigation of a section of this region (see Figure 1 and Figure 2).
The Harra is part of the Harra’t al-Sham, the largest (50,000 km²) of a succession of basaltic plateaus from Syria in the north to Yemen in the south (Figure 1). The Jordanian Harra covers 11,400 km². It features volcanoes with lava flows dating from the Oligocene to the Quaternary (most recently ca. 400 ka) and is covered with a silty, carbonate-and-quartz-containing loess, on top of which a paving of basalt blocks partly protects the sediment from erosion and deflation [1]. The process of “stone heaving”, which brings these blocks to the surface, is still poorly understood [2]. The basalt blocks are of variable dimensions but have always made traversing this region extremely difficult, often being impossible except along seasonal rainfall valleys or mudflats (Figure 3). Since the lowest stone course of every prehistoric structure visited in the WHS corresponds to the present-day ground level, it can be stated with confidence that at no time was the loess cover significantly higher so as to ease human travel.
In the area under study, the altitude of the plateau varies between ca. 500 and 800 m a.s.l. The hydrographic system is endorheic, and the relatively dense hydrographic networks are composed of valleys with temporary or sporadic flow during rainy seasons. Pluvial and thermal regimes have been Mediterranean since the beginning of the Holocene [3], with hot, dry summers and cold, wet winters. The current mean annual precipitation in north-eastern Jordan is between less than 100 mm and 300 mm [4], resulting in arid bioclimatic conditions. Pans or mudflats, locally called qe’an (singular: qa’a), of different sizes and types collect water flows and sediments. Together with the seasonal rainfall valleys (called awdiya; singular: wadi), qa’a edges seem to be the main areas suitable for the development of substantial vegetation. During the rainy season, qe’an can fill with water, thus forming an ephemeral lake ecosystem (Figure 4).
The existence of countless structures built from the local basalt stone has been known to the Bedu nomads of the region for centuries, who termed them the “Works of the Old Men” [5,6]. Their academic study properly commenced in the 1970s with excavations at the site of Jawa and surveys in its vicinity by Svend Helms [7], followed in the succeeding decade by Alison Betts’ “Black Desert Survey” east of the WHS area and excavations at the site of Dhuweila [8]. Since then, a handful of surveys and limited excavations have slowly brought to light, necessarily in a keyhole fashion, evidence for widespread prehistoric occupation of the area (see Figure 2). While there is as yet no consensus on whether the majority of structures represent settlements of permanent occupation, e.g., Reference [9], or seasonal camps, e.g., Reference [10], evidence based on lithic material and, more recently, Optically-Stimulated Luminescence (OSL) [11] and Accelerator Mass Spectrometry (AMS) [12,13] dating indicates a long-term occupation chronology lasting from at least the Epipalaeolithic (Late Natufian) period onwards (ca. 12,650 cal BC at Shubayqa [13]; ca. 9000 BC at Dhuweila [14]). Human presence in the Harra is subsequently attested to for all periods up to and including the Early Bronze Age (early 3rd millennium BC), but is particularly well-represented between the 7th and 4th millennium BC [9,10,15,16]. This data does not necessarily indicate permanent occupation, but it speaks against any prolonged period of abandonment.
The WHS [17,18] is a multidisciplinary project co-directed by the authors in collaboration with their respective institutions, the Institut Français du Proche-Orient (IFPO) and the Department of Antiquities of the Hashemite Kingdom of Jordan. Its primary goals are to explore and study the edges and interior of the Jordanian Harra, with a focus on the geography, geology and prehistoric human occupation (emphasising the 7th to early 3rd millennium BC), using a 36 by 32 km survey area located in the western portion of the basalt region as a proxy [19,20,21]. Commencing in 2015, it has thus far comprised two fieldwork seasons and one artefact study season. The survey area was selected for both its location between previously and currently investigated areas (e.g., Jebel Qurma, Dhuweila, Jawa (see Figure 2)) as well as its representation of all types of landscapes typical of the region (Figure 5).
Furthermore, this area is at least partially accessible by a combination of asphalt roads, the so-called “TAP line”, a road constructed in the 1940s to follow the course of the Trans-Arabian oil pipeline (see Figure 6), and bulldozed tracks constructed for quarry vehicles and oil prospection routes from the 1980s. Though none but the first of these access routes are easily traversed, compared to the complete vehicle inaccessibility of much of the Harra, they provide vital links to its largely unexplored interior. This region therefore represents a good compromise between a desire to penetrate deep into the “Black Desert” and the practicalities of access and time constraints.

2. Materials and Methods

Aerial flights across the “Black Desert” commenced with the establishment of the Airmail route from Cairo to Baghdad in the early 1920s, and it was not long before pilots noted the structures visible in this landscape and began taking photographs of them [5,22]. These were, however, focused on individual features and thus are very localised; meanwhile, subsequent more widespread aerial photography in Jordan during and after the Second World War was limited to the western part of the country [23]. The Harra was first holistically covered by US military CORONA satellite imagery (now declassified) during the 1960s and 1970s. However, it was with the commencement of flights for explicit archaeological purposes by the Aerial Photographic Archive for Archaeology in the Middle East (APAAME) [24] in 1997 that the region began to be systematically photographed from the air at a resolution that could be used for accurate interpretations of its archaeology. Their database, consisting of tens of thousands of images, allowed projects working in the Harra and elsewhere to gain an unprecedented view of the regional contexts of their keyhole ground investigations, paving the way for the use of high-resolution satellite imagery from the 2010s onwards.
When the WHS project began in early 2015, free very high-resolution remote sensing data was only available for individual pockets of this region, with the GoogleEarth platform releasing small sections of GeoEye imagery for the Harra in 2013, up to a resolution of ca. 0.5 m/pixel [1]. Therefore, a preliminary remote sensing analysis was first carried out using CORONA imagery. These have been used to great effect in parts of Syria and northern Iraq to identify sites, especially as they were mostly taken before the commencement of modern urban expansion and widespread mechanised agricultural practices [25,26]. Due to the relatively small nature of sites in the Harra, however, with most features comprising individual structures no more than 70 m in diameter (and often much smaller), this proved to be an insufficiently precise dataset, with many structures appearing unclearly or not at all. This however changed when full very high-resolution GoogleEarth coverage was released in 2017, with further GeoEye (Herndon, VA, USA) followed by CNES/Airbus (Paris, France) satellite imagery becoming available, as well as DigitalGlobe (Westminster, CO, USA) products appearing in Bing Maps, fundamentally altering the possibilities for remote sensing analyses and by extension, ground investigations in this region.
With all but the smallest structures (see Section 3.1.2) clearly visible and definable on this imagery, it could be used to conduct a remote sensing survey. The area in question was thus systematically analysed, latitudinal line by latitudinal line, at an “eye altitude” of 1 km in the GoogleEarth platform, and all likely features of archaeological interest were recorded in a GIS database. This process took 4 months, gradually compiling a KML-file that was then converted into an ArcGIS (ESRI, Redlands, CA, USA) shapefile before being integrated into a geodatabase for further analysis within the ArcMap program. This process allowed for the identification of nearly 3000 individual sites or features of all morphologies, assigned numbers in the order in which they were recorded; this then became their site number in the field also. Each feature was also given a preliminary site type definition (see Section 3.1.2) and a clarity rating of “definite” (almost certainly a site), “probable” (potential site with a greater than 50% chance of actually being one) and “tentative” (potential site with a lesser than 50% chance of actually being one). This survey of the satellite imagery allowed for both direct analyses of the archaeological landscape to be conducted and for the subsequent fieldwork to be efficiently planned. Methodologies similar to this have been used by numerous contemporary archaeological projects, as recently illustrated by Ansart et al. [27]. To locate and map features in the field, the database was loaded onto both a tablet computer and a handheld GPS device. The former was used to locate sites in the field using the tablet’s built-in GPS function, with the points shapefile overlaid on pre-downloaded offline imagery from both GoogleEarth and Bing Maps. The latter was used to record the form of specific structures and parts of structures with more precise locational positioning.

3. Results

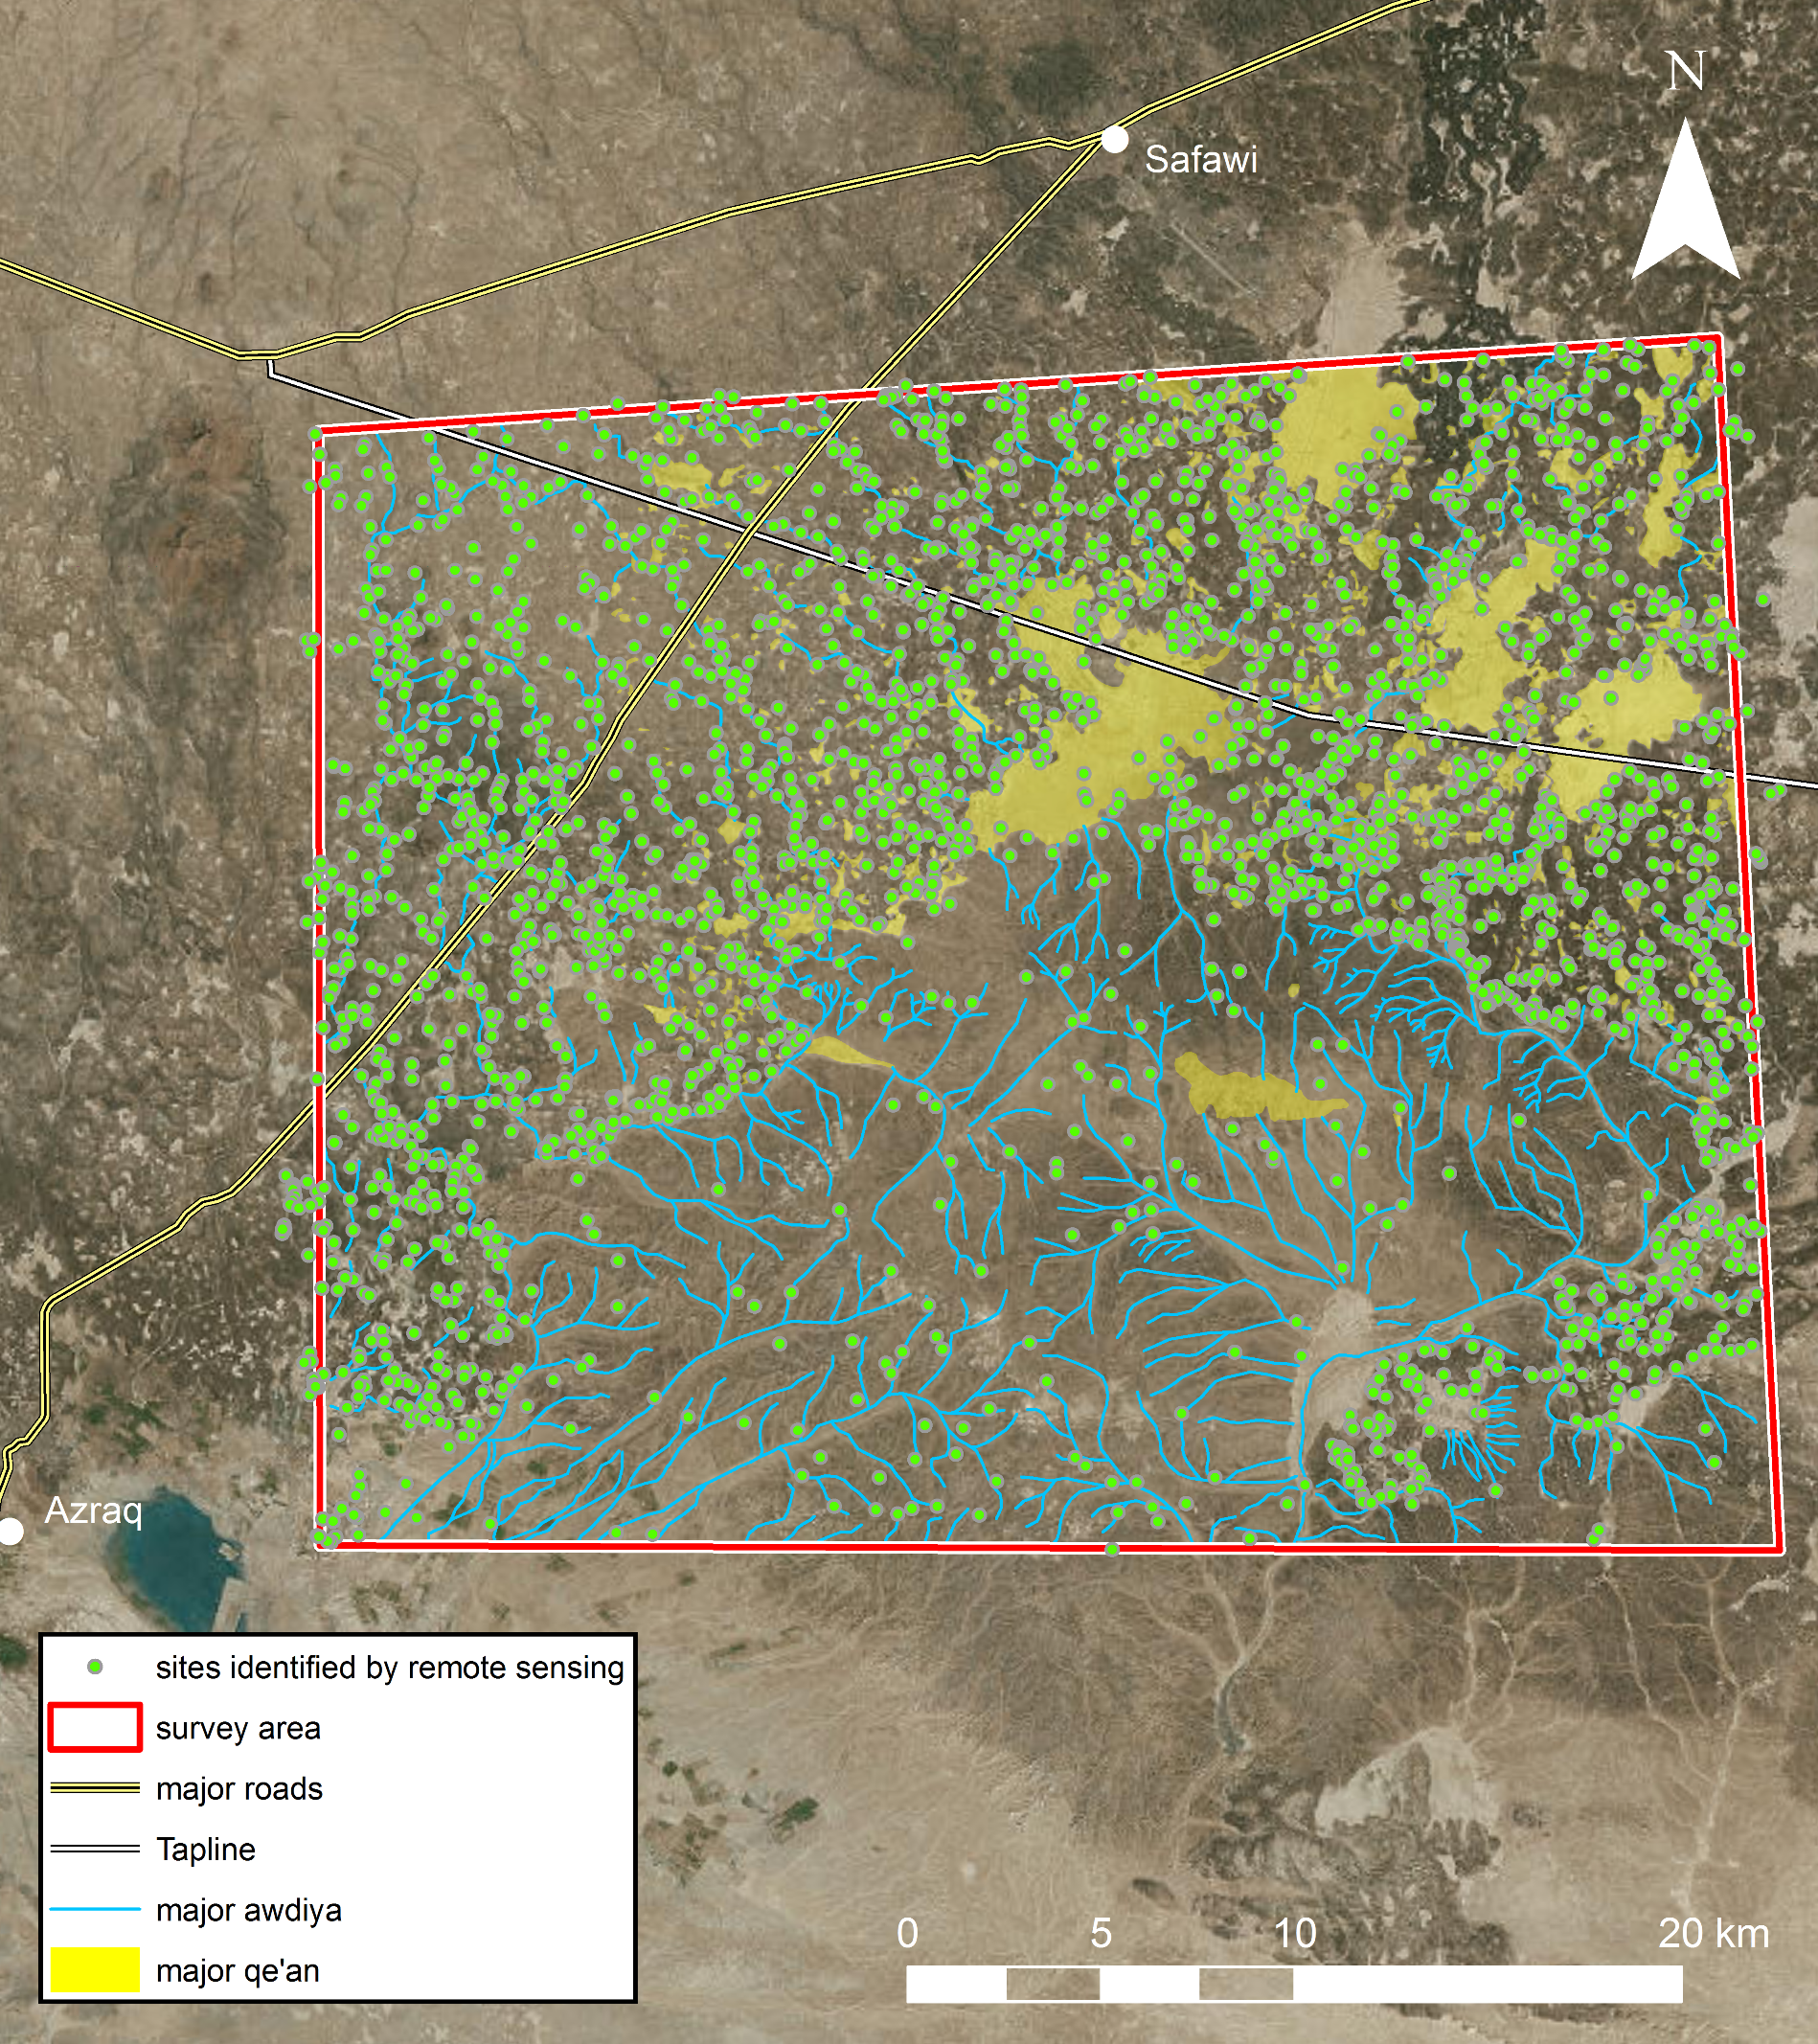
3.1. Individual Archaeological Sites

3.1.1. Site Locations and their Relationships to Natural Features

The satellite imagery survey allowed for numerous results to be obtained directly from the remote sensing analysis, independent of fieldwork data. Most simply, the relative locations of each archaeological feature allowed for their distributions, densities, areas of concentration and spatial relationships to natural features to be determined (Figure 6). In total, 2770 individual features were identified within the WHS area. This wealth of data already led to some interesting results that impacted upon later interpretations.
Most visible archaeological features appear to be located by areas of relatively dense basalt. This is an expected correlation given the fact that it is anthropogenic basalt structures that are the easiest to identify in this region on satellite imagery, and that for any structures not located within or near basalt raw material, a less prominently visible material is likely to have been used. However, a further noticeable pattern is that there is a concentration of features along the edges of basalt fields and qe’an or awdiya. A number of factors could be involved here, including areas of easiest accessibility in the Harra, access to collection of seasonal rainfall and access to the best areas for vegetation for herd grazing. Furthermore, the practicalities of erecting buildings are easier in these border regions, where basalt stones are available for construction, but areas do not have to be first cleared of basalt to create habitable space for humans and livestock.
However, the satellite survey also revealed a large number of features located deep within dense basalt fields. These would have been extremely difficult to access but for human modification of the landscape (see Section 3.2.2), and at some distance away from necessary natural resources. The effort entailed in such endeavours, which does not appear strictly necessary from a geographical viewpoint, indicates that significant advantages must have existed for settlements thus located. While a selection of all site types were visited in the field, this study focussed on “wheels”, and their identified subdivisions and associations, which forms the basis of the following discussions.

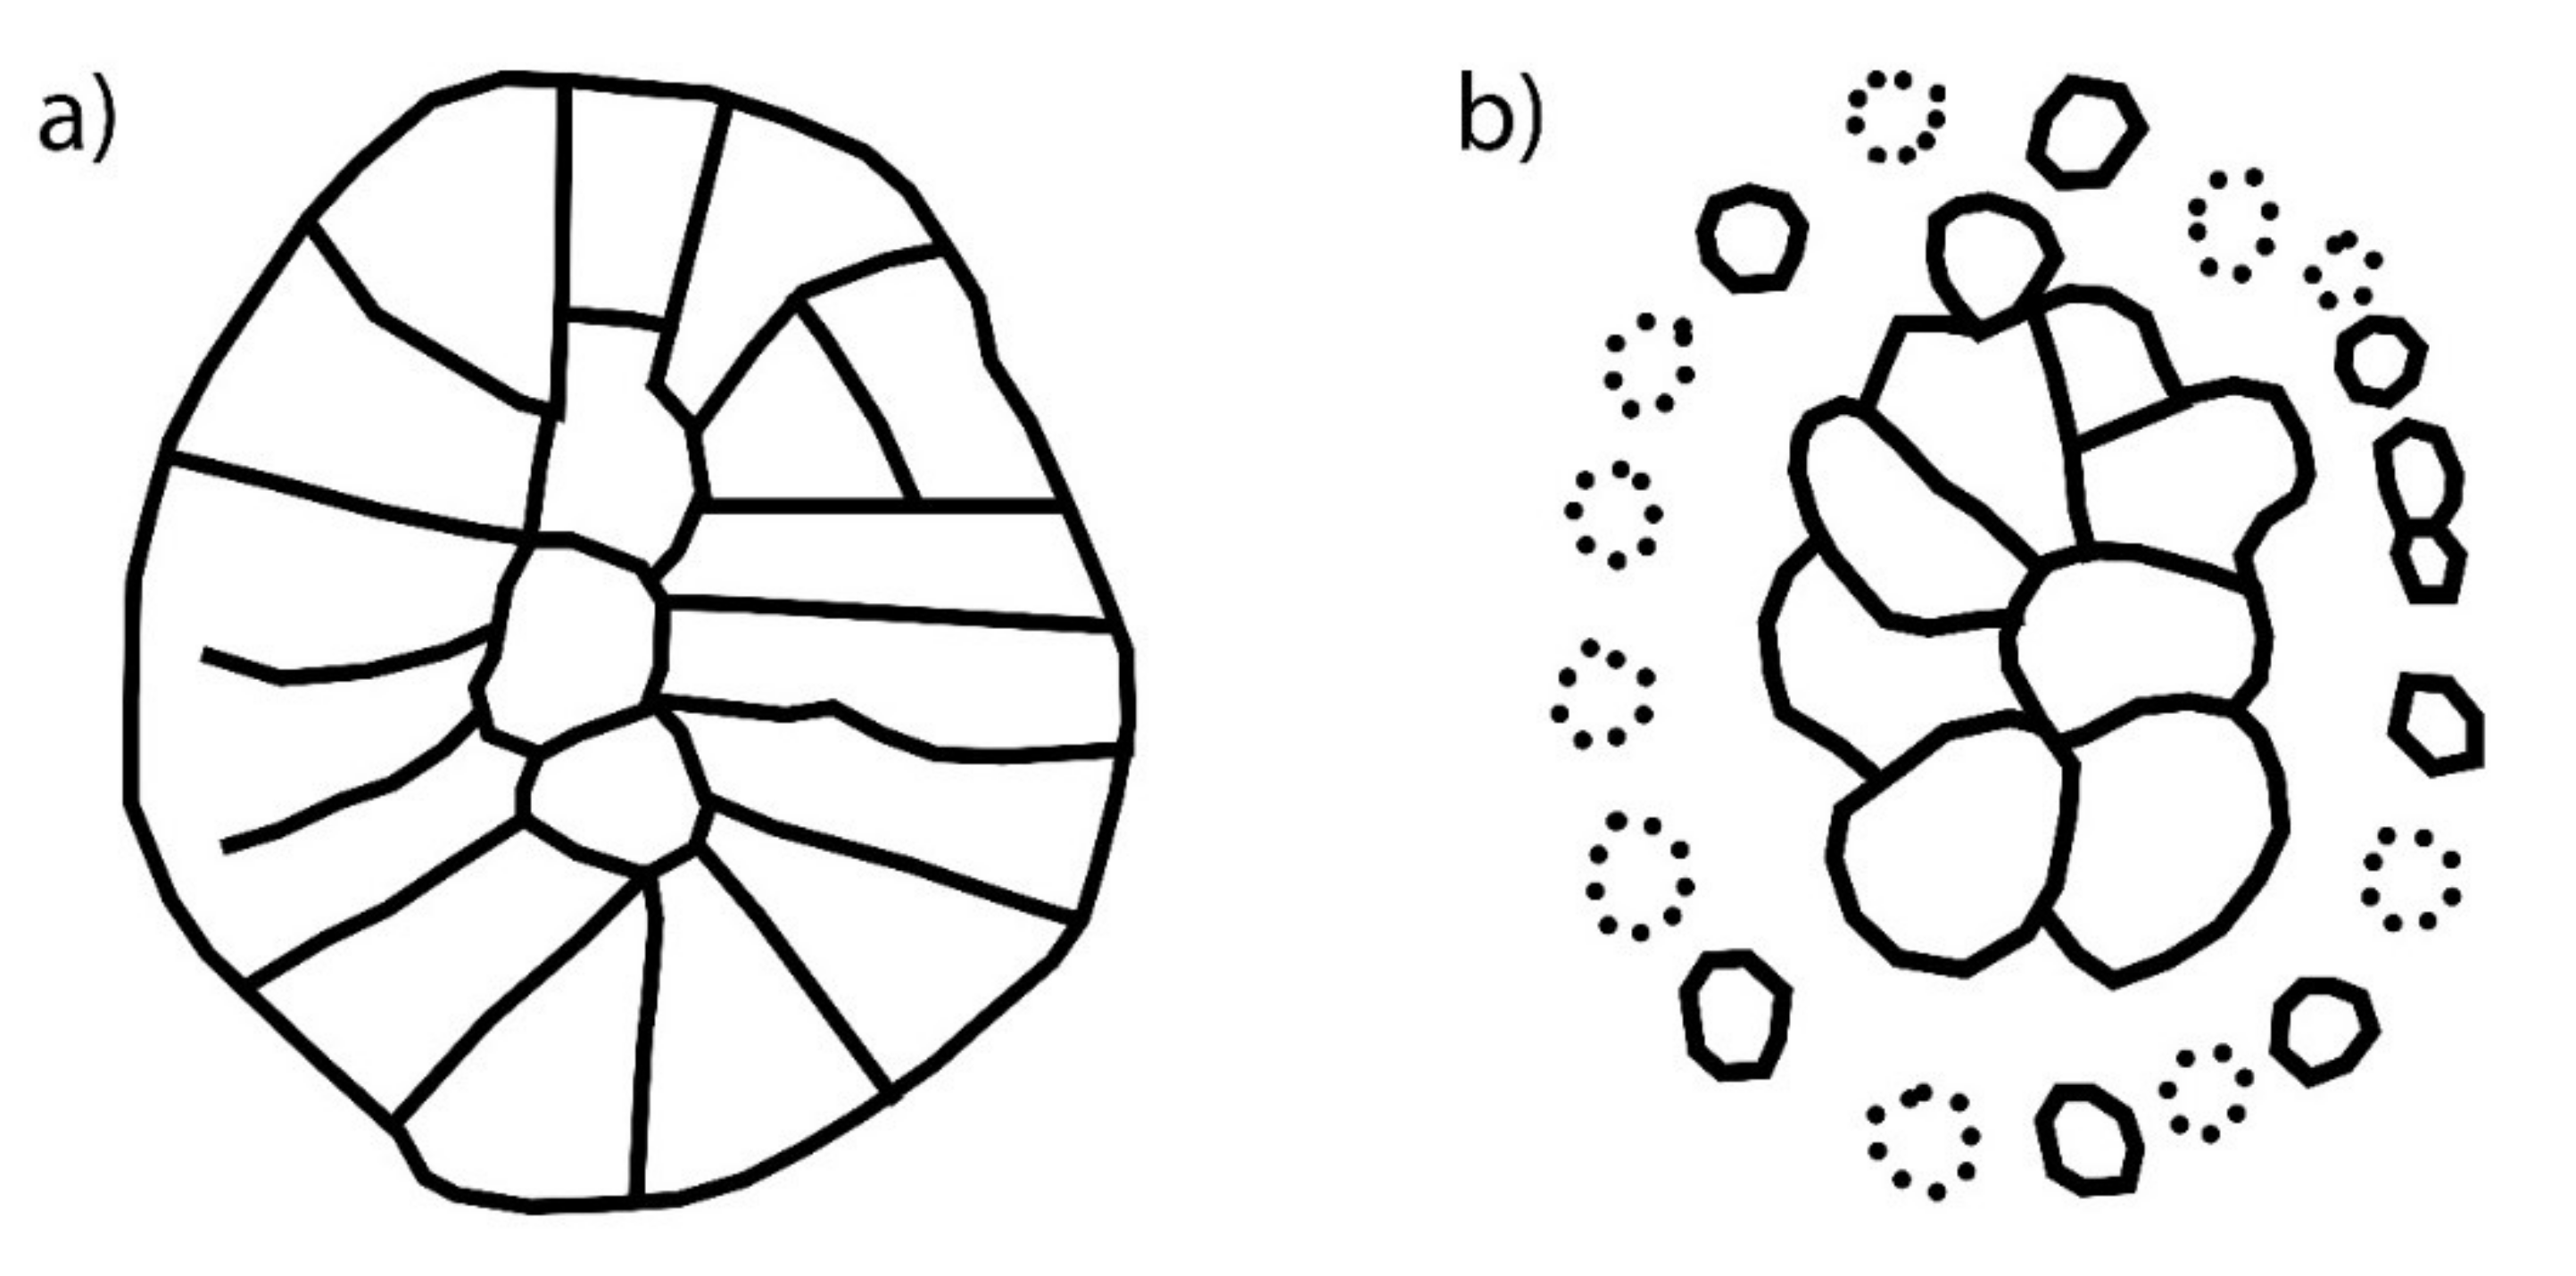
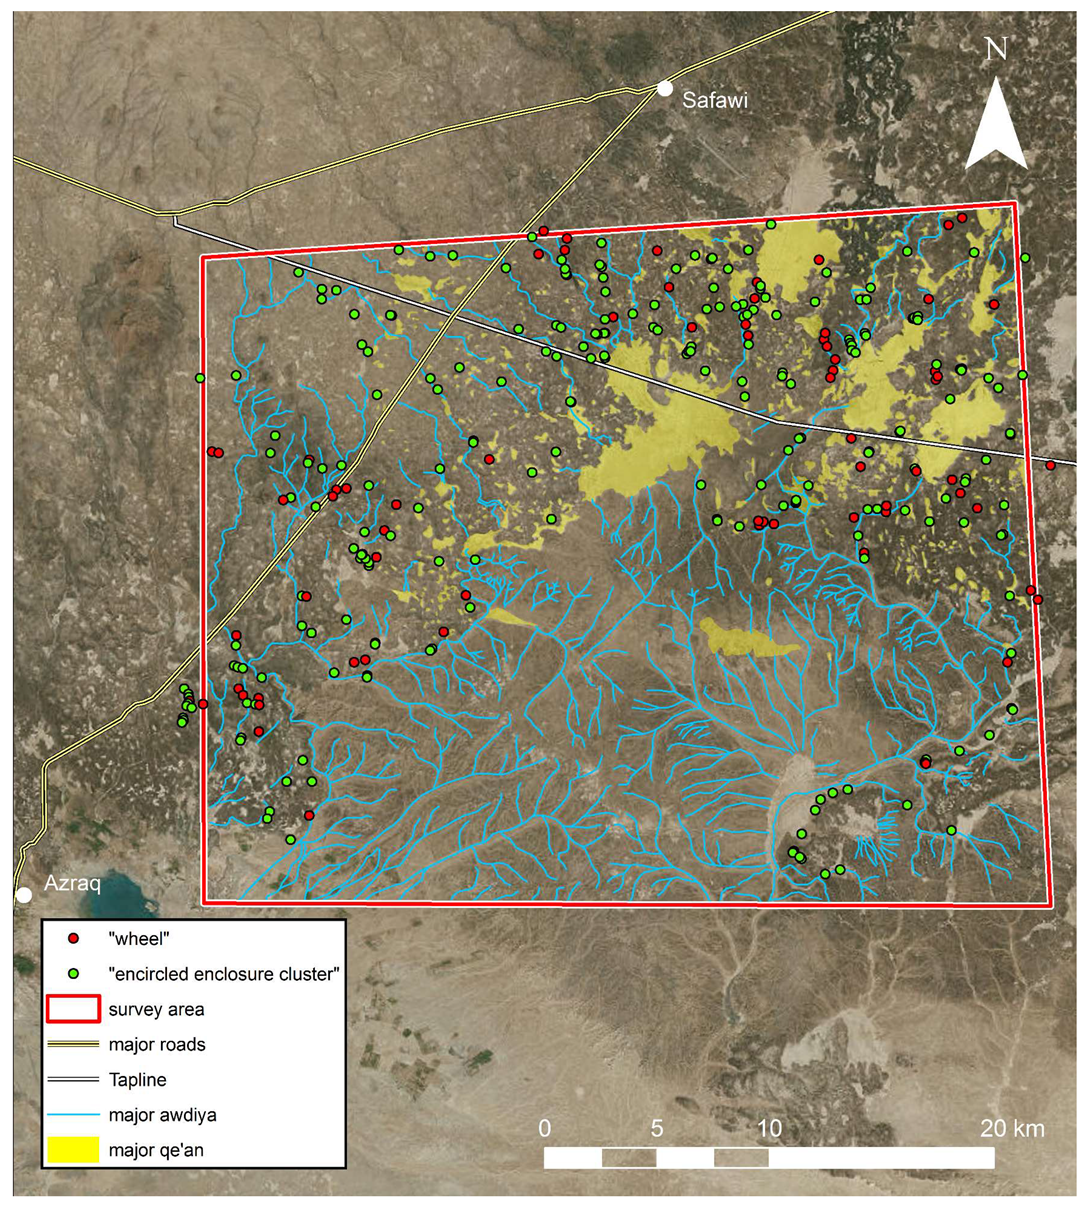
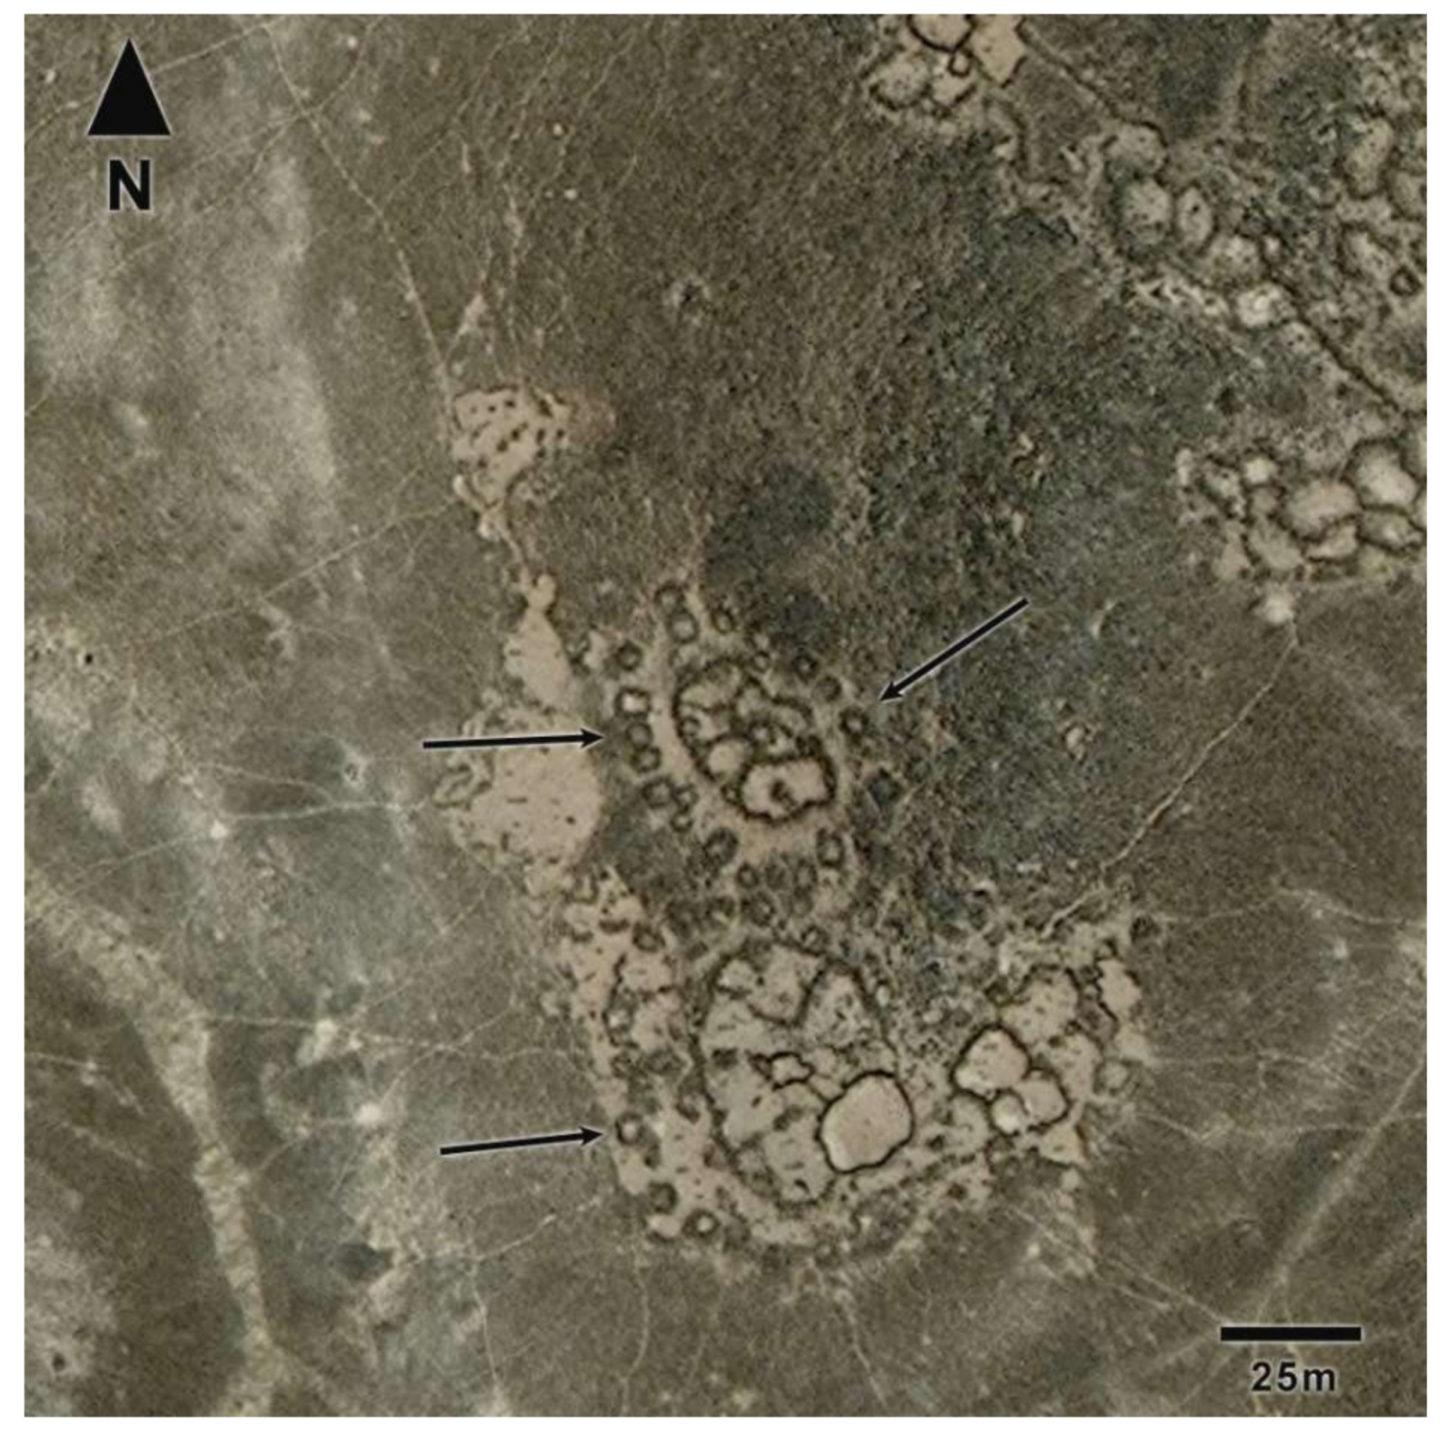
3.1.2. “Wheels” and “Encircled Enclosure Clusters”

It has long been recognised by explorers and researchers in the Harra that its prehistoric structures can be divided into several distinct types based on their morphologies as viewed from above [5,6,28]. Using the higher-resolution free satellite imagery now available, structural differences can be defined with greater clarity, allowing for improved large-scale mapping of distinct forms that can be investigated on the ground (Figure 7). For previously known and identified site types such as enclosures, “wheels”, “pendants”, “kites” and meandering walls, this simply meant that they could be identified with a greater degree of certainty than previously possible. However, for certain features, the higher quality satellite imagery actually allowed for the discerning of discrete site types that have previously been grouped together. Most notably, it became clear that the sites known as “wheels” or “jellyfish” [6,28] require a typological seriation, something that has been recognised before by Rollefson et al. [16]. In the WHS area, two distinct forms could be morphologically defined by remote sensing data, which during the course of the later fieldwork were found to have impacts on their frequency and material remains.
The first form is, true to its name, indeed “wheel-like” in shape (Figure 8a). Its main features comprise a roughly circular or elliptical outline, inside which enclosures are divided by mostly straight walls, arranged like the spokes of a wheel. Though these “spokes” sometimes come to a central point, they often converge around one to three sub-circular central enclosures, from which the other arc-shaped enclosures emanate. Occasionally, such sites are encircled by a series of very small enclosures, no more than 2 m across. In the survey area, 70 of these true “wheels” were identified with a certainty of “definite” or “probable”, 77% of which are located on the outskirts of the basalt terrain; within 1 km of the edge of the Harra, a qa’a, or a major wadi (Figure 9).
The second form, which the authors have termed “encircled enclosure clusters” are each comprised of a randomly clustered set of at least four sub-circular or sub-elliptical enclosures (Figure 8b). This creates an irregular external outline, sometimes with one or two additional protruding enclosures. Few, if any, of the internal walls are straight, and there is no clear central enclosure. As their name suggests, they are always encircled by a series of very small enclosures, which vary in clarity on remote sensing and on the ground. Over three times as many “encircled enclosure clusters” as “wheels” were identified in the survey area; a total of 226 sites (“definite” or “probable”). Almost the same proportion of these sites (80%) is located on the edge of the basalt desert (Figure 9).
This definition of the distinctions between “wheels” and “encircled enclosure clusters” also highlights an example of the bidirectional relationship between remote sensing surveys and ground-based fieldwork. The very small encircling enclosures that are occasionally present at “wheels” and always present at “encircled enclosure clusters” initially appeared as black “dots” on satellite imagery, indicating possible basalt cairns. However, in some regions with particularly good structure preservation and high contrast between the basalt and the underlying silt they appeared more as enclosures, with a small amount of light-coloured loess in their centres (Figure 10). Investigating these features on the ground revealed that these are in fact square structures with right-angled corners, and thus are unique compared to other enclosures in the region (Figure 11). This fieldwork-derived data can now be fed back into the satellite imagery survey, helping us to interpret what we see in remote sensing more accurately for future investigations.

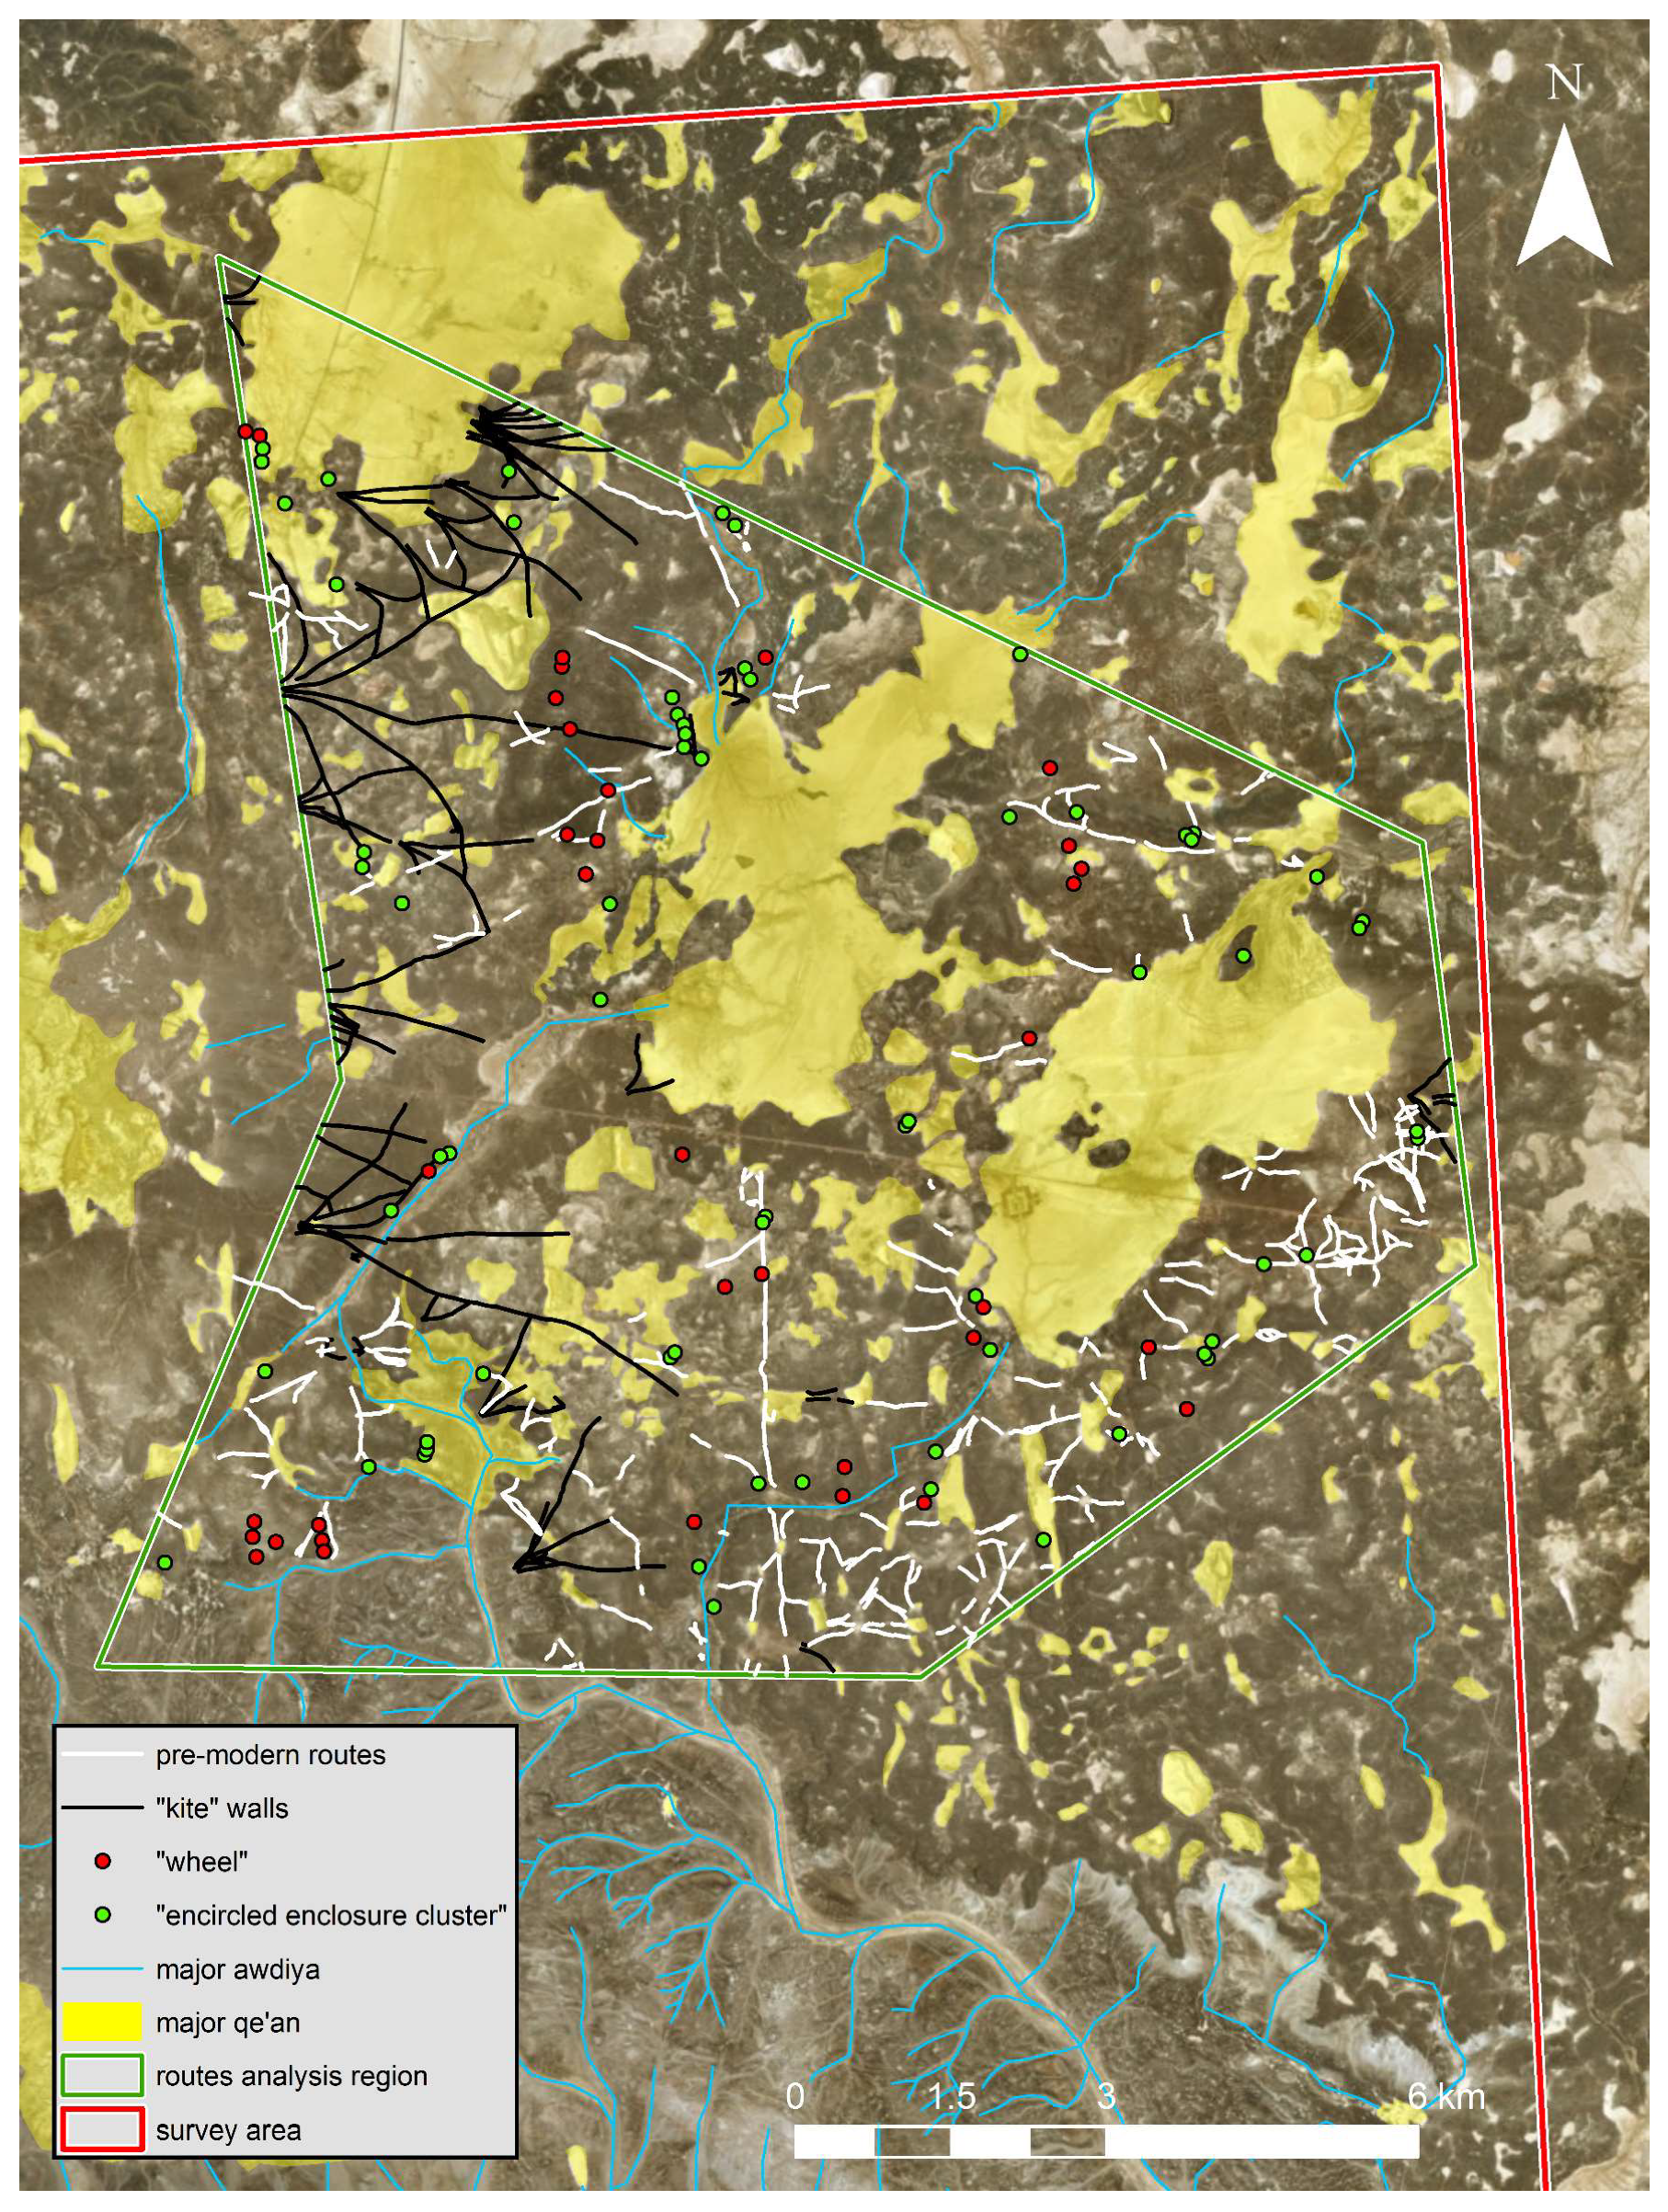
3.2. Regional Human Circulation

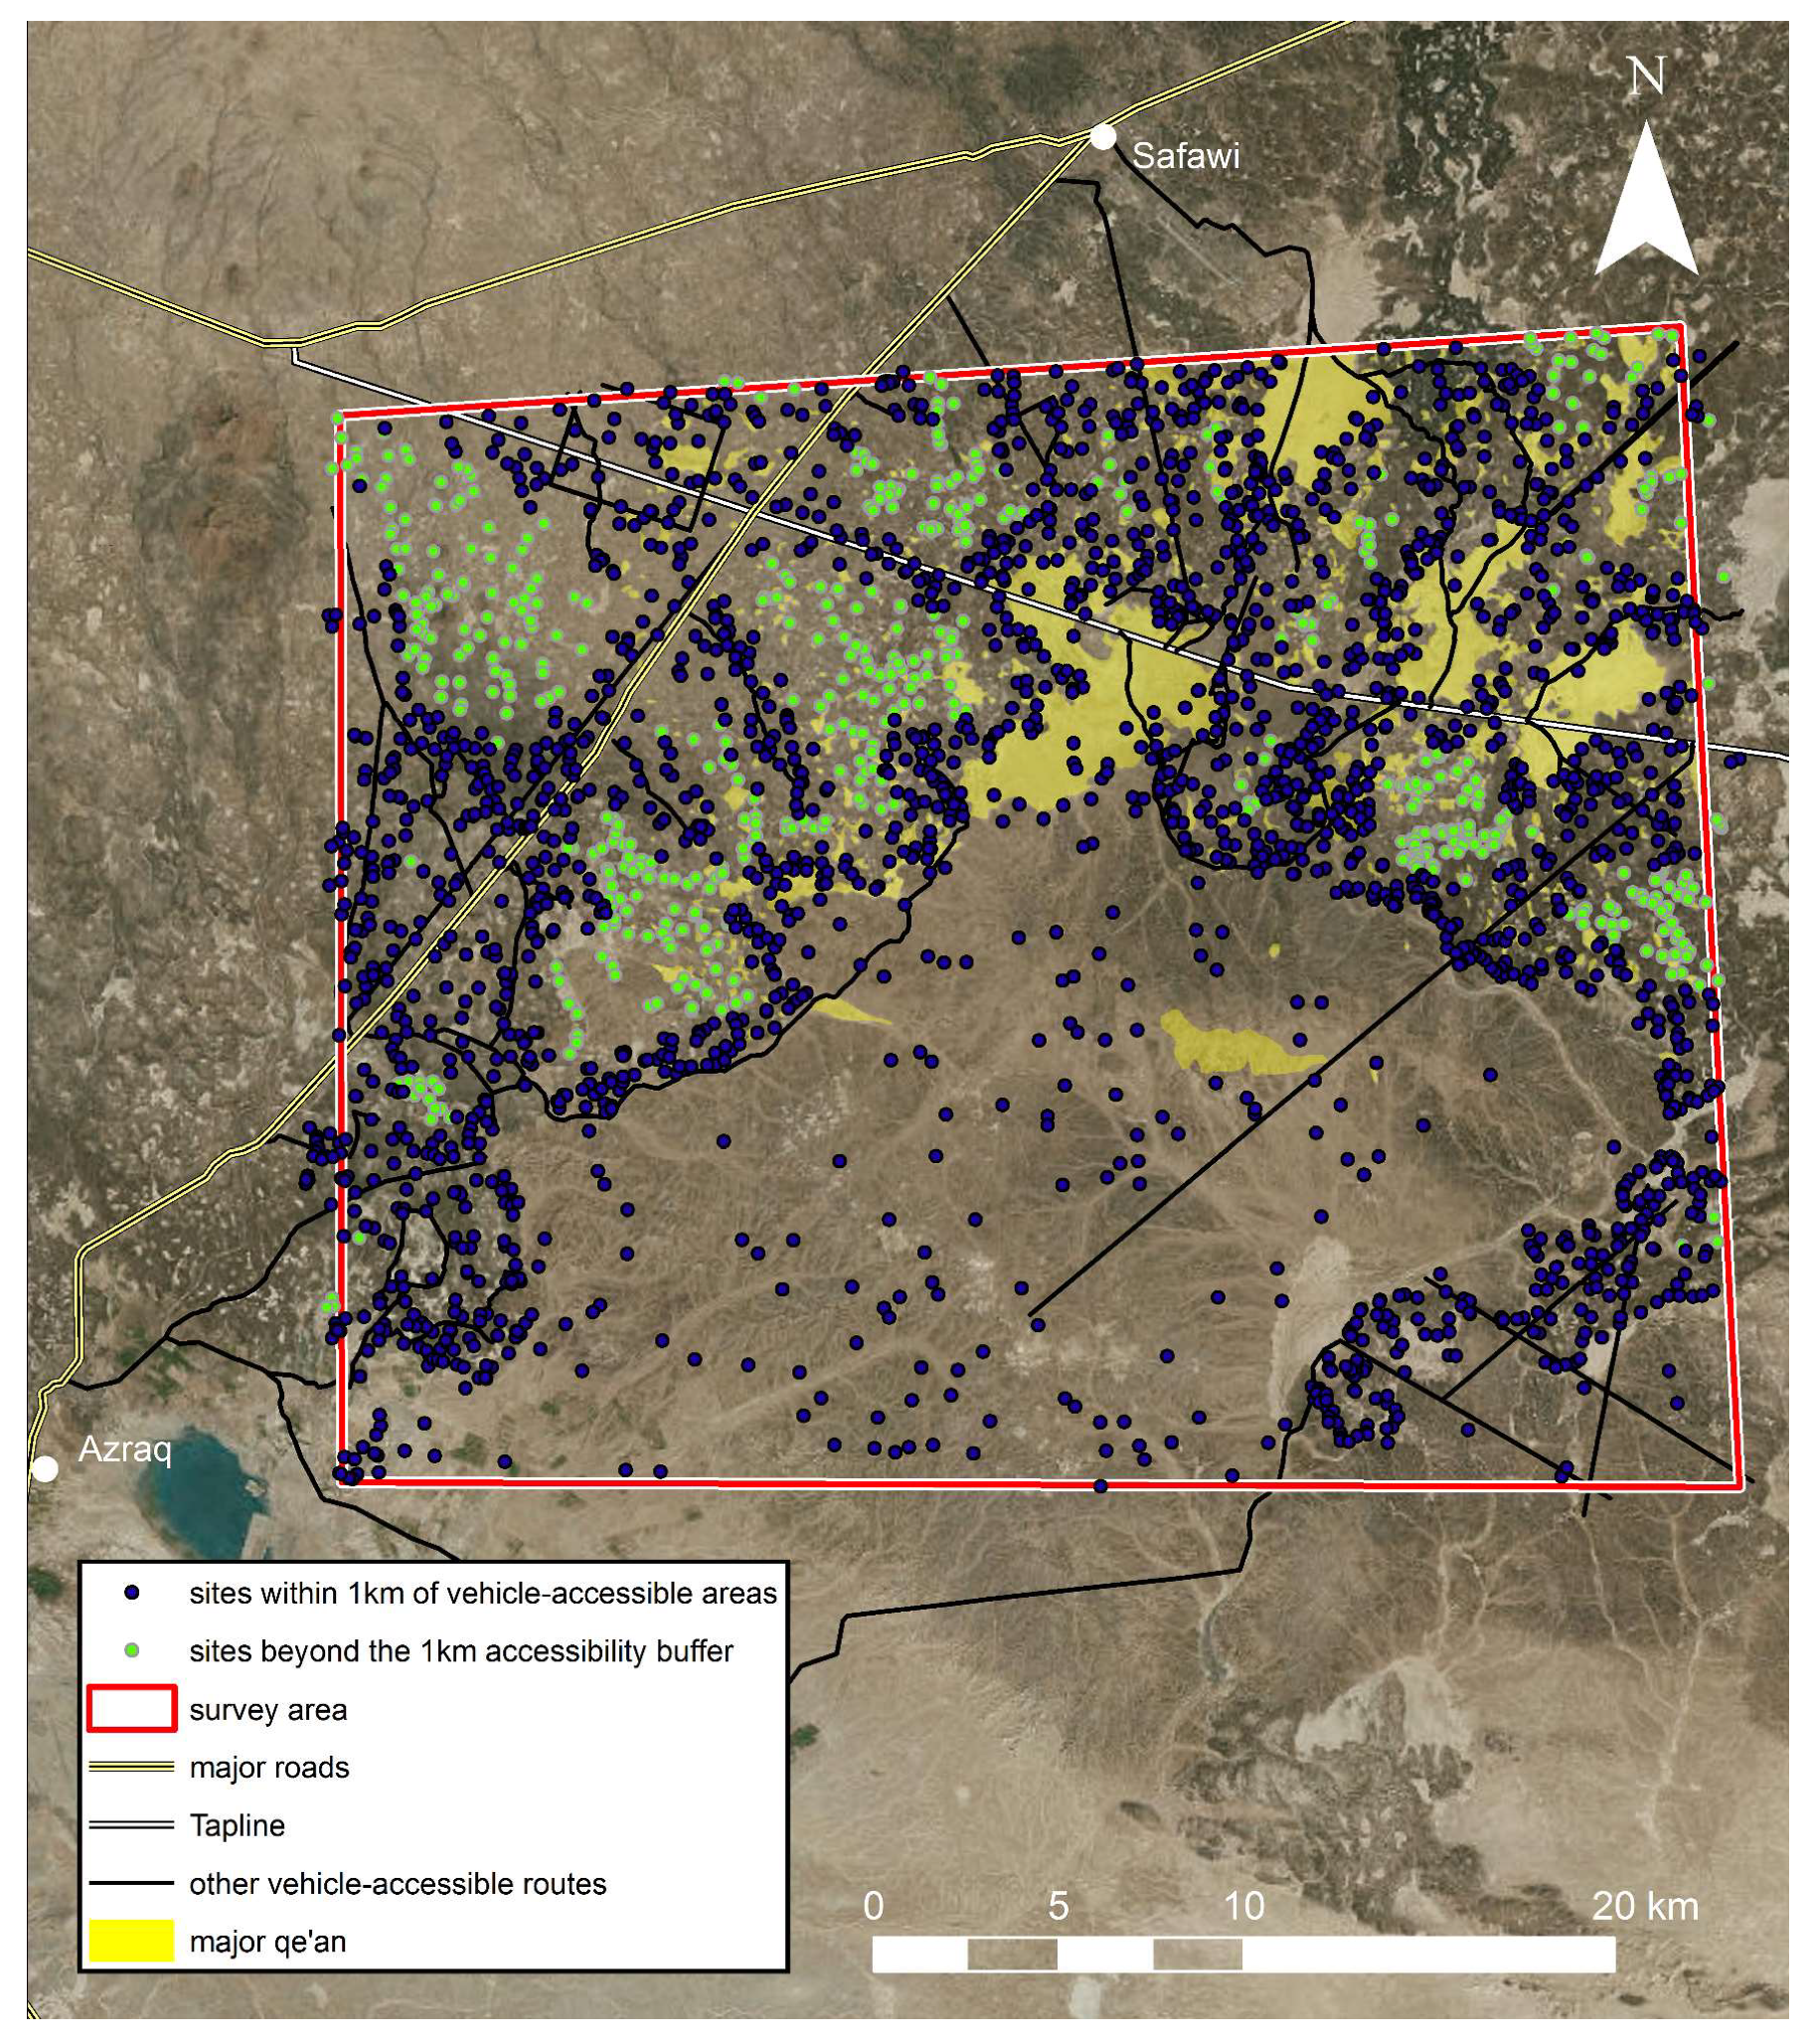
3.2.1. Access via Natural Features

Travelling in this region has always been difficult, whether on foot or by wheeled vehicle, due to the dense cover of basalt boulders. Yet the resilience of subsistence in this region depends on access within it, even in the present day. Two solutions exist to allow for easy and speedy travel, and thus for communication, trade and the exploitation of resources. Awdiya, as natural corridors, and qe’an, as wide open spaces, offer natural routes since they can be followed or crossed easily. As detailed above regarding “wheels” and “encircled enclosure clusters”, the majority of all sites are in fact in close proximity to or within these natural access features. However, even though only ca. 20% of all sites are located in the deep basalt (over 1 km from a qa’a, wadi, or the edge of the Harra), this still accounts for 559 individual features. Moreover, even just 1 km is a long distance to traverse on a regular basis across the Harra. Decreasing the distance from the nearest natural access point to a more manageable 500 m also significantly increases the number of basalt-located sites to 33%, or 926 individual features.

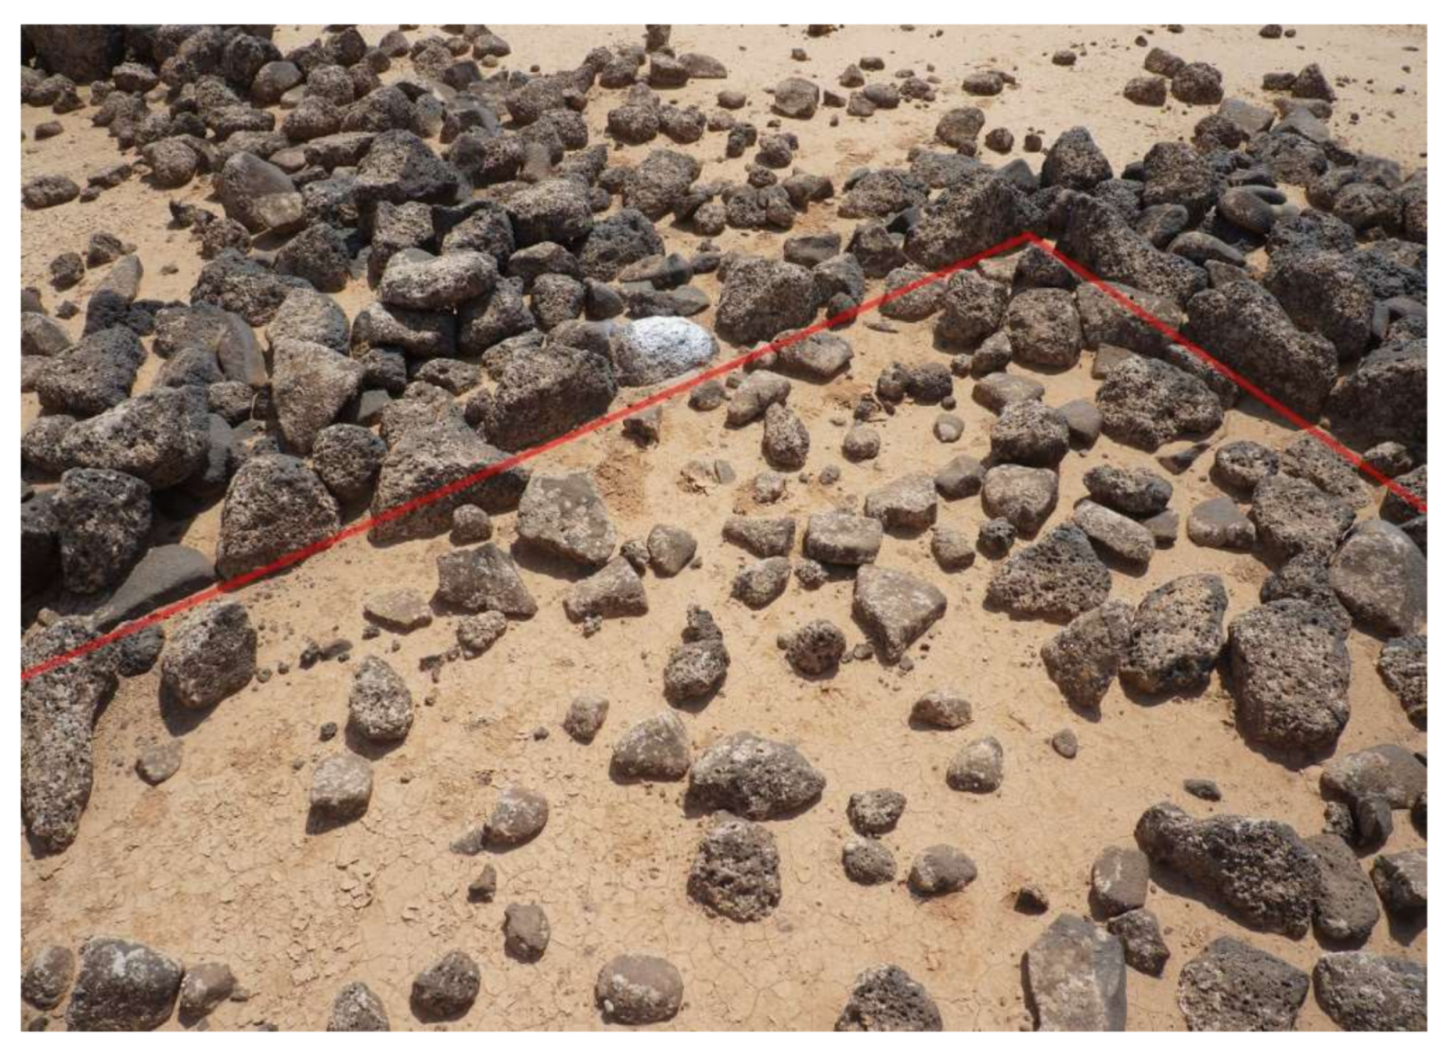
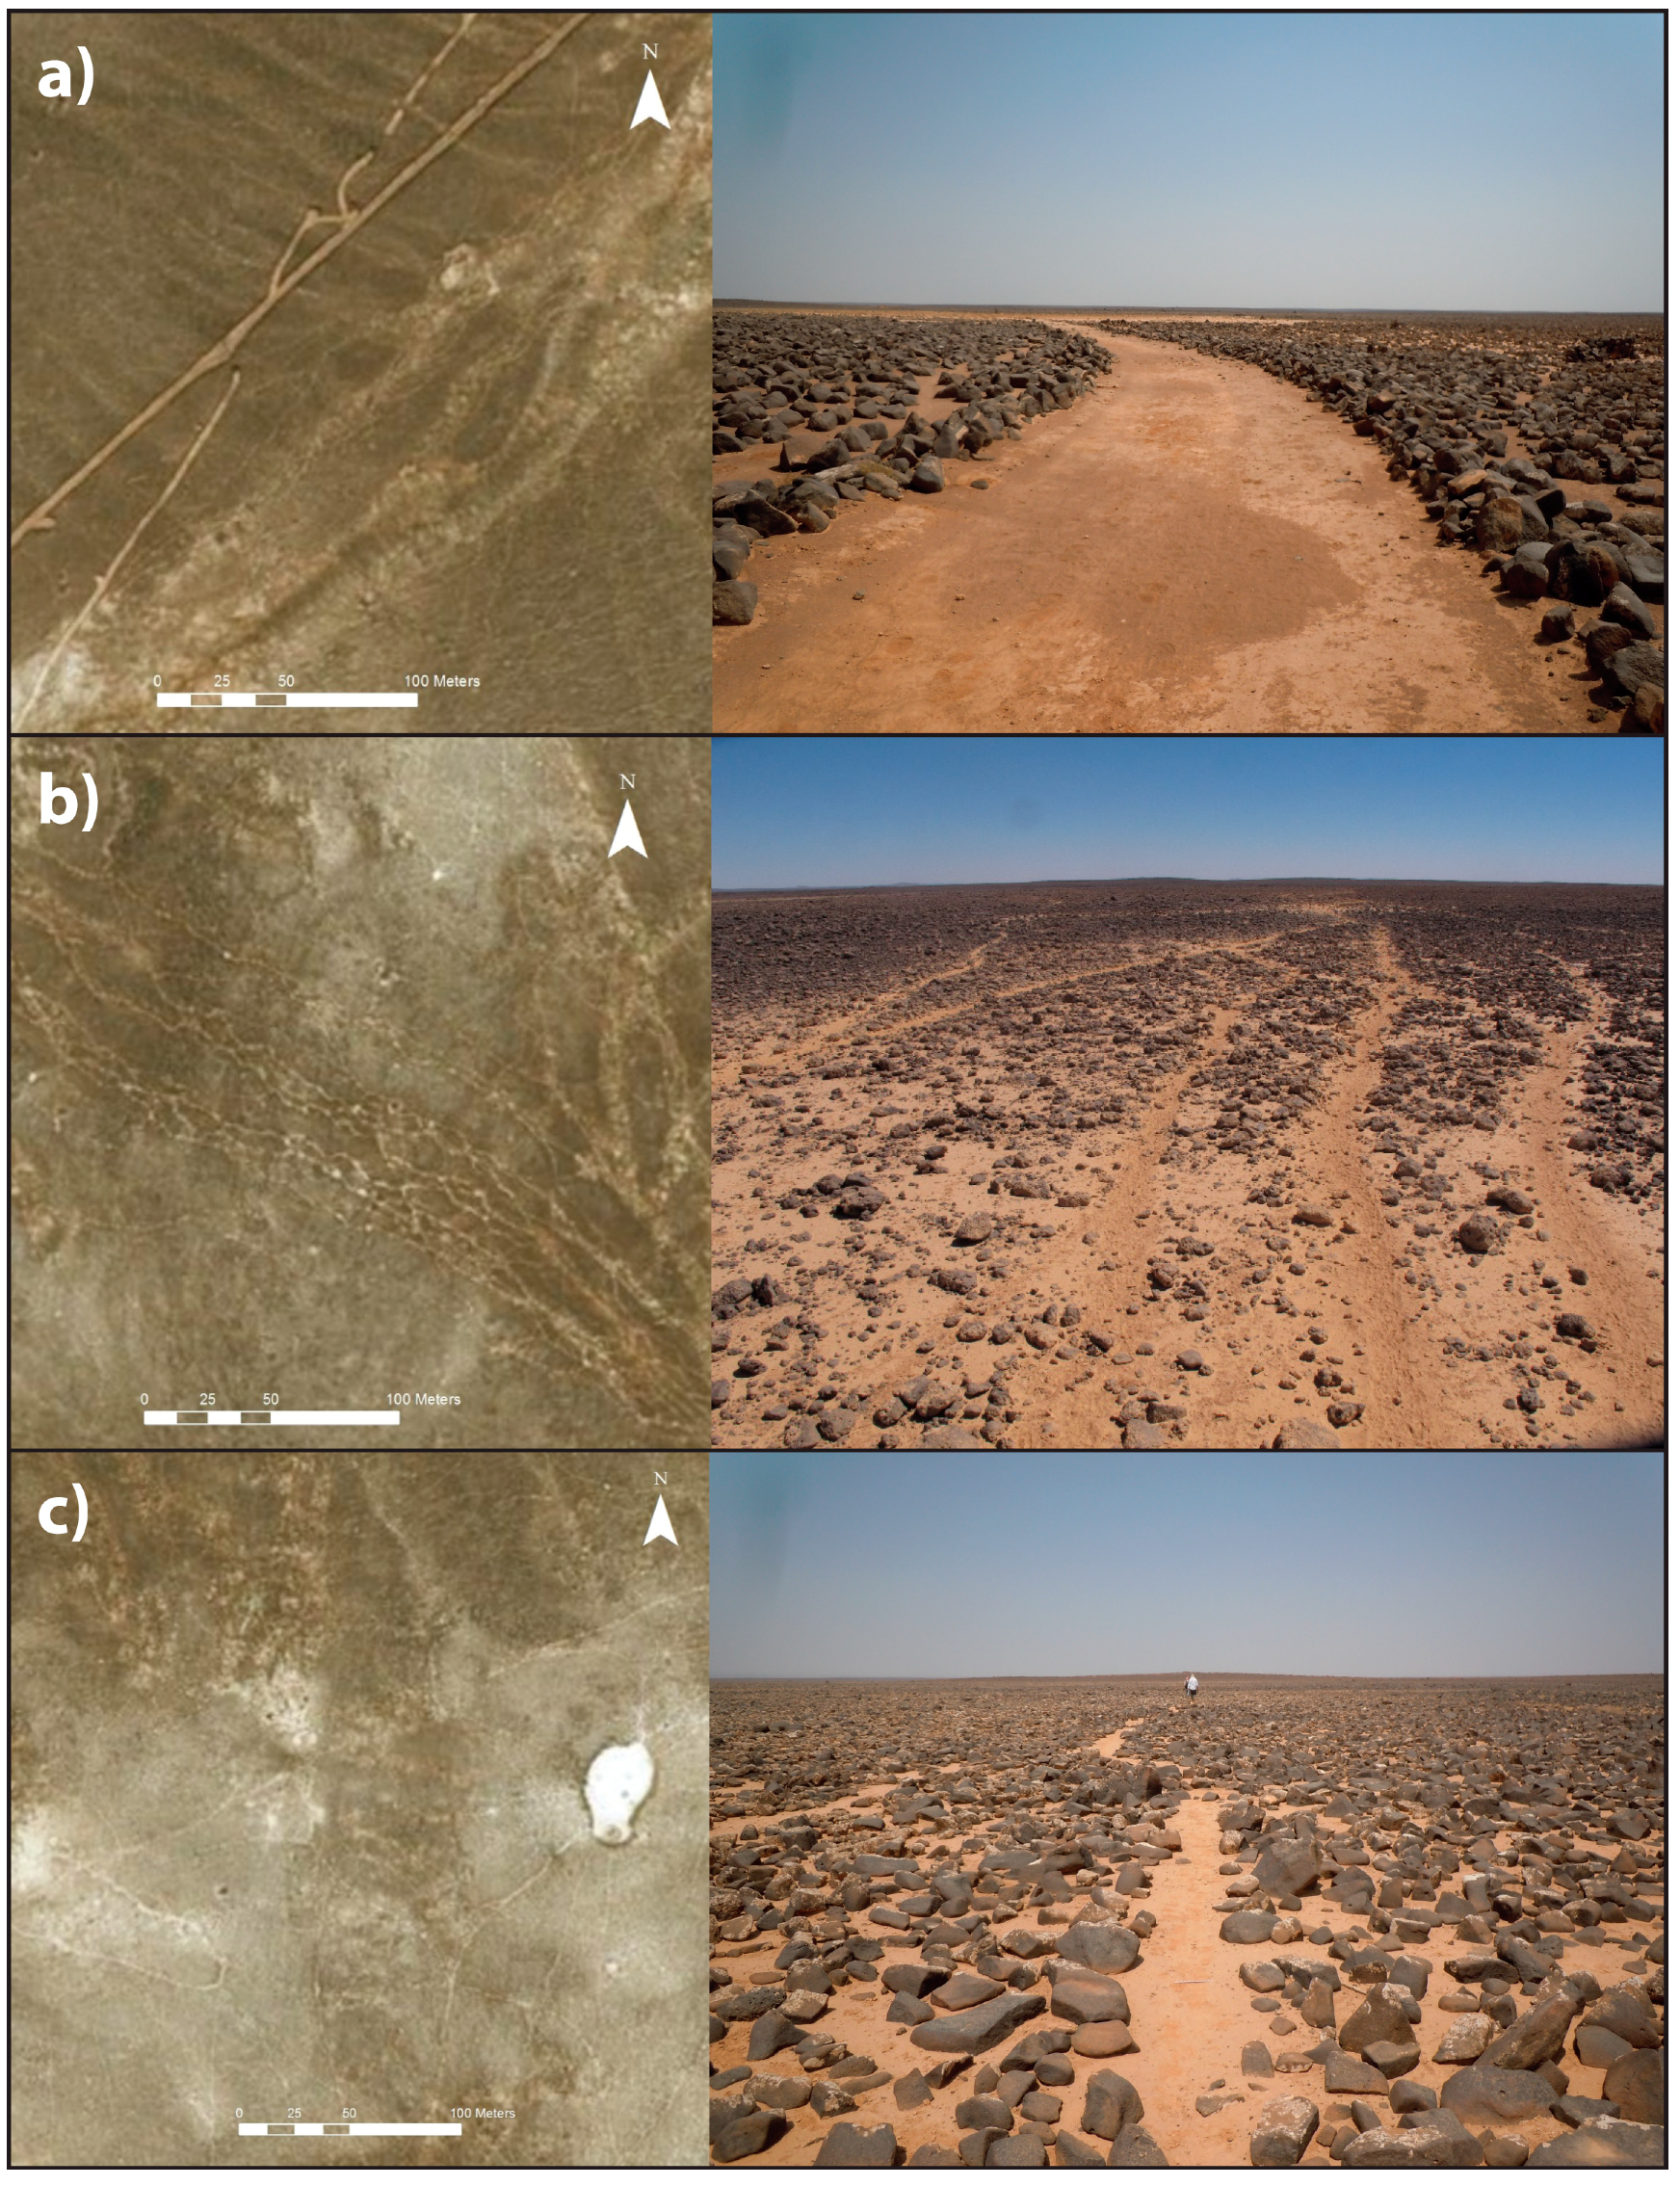
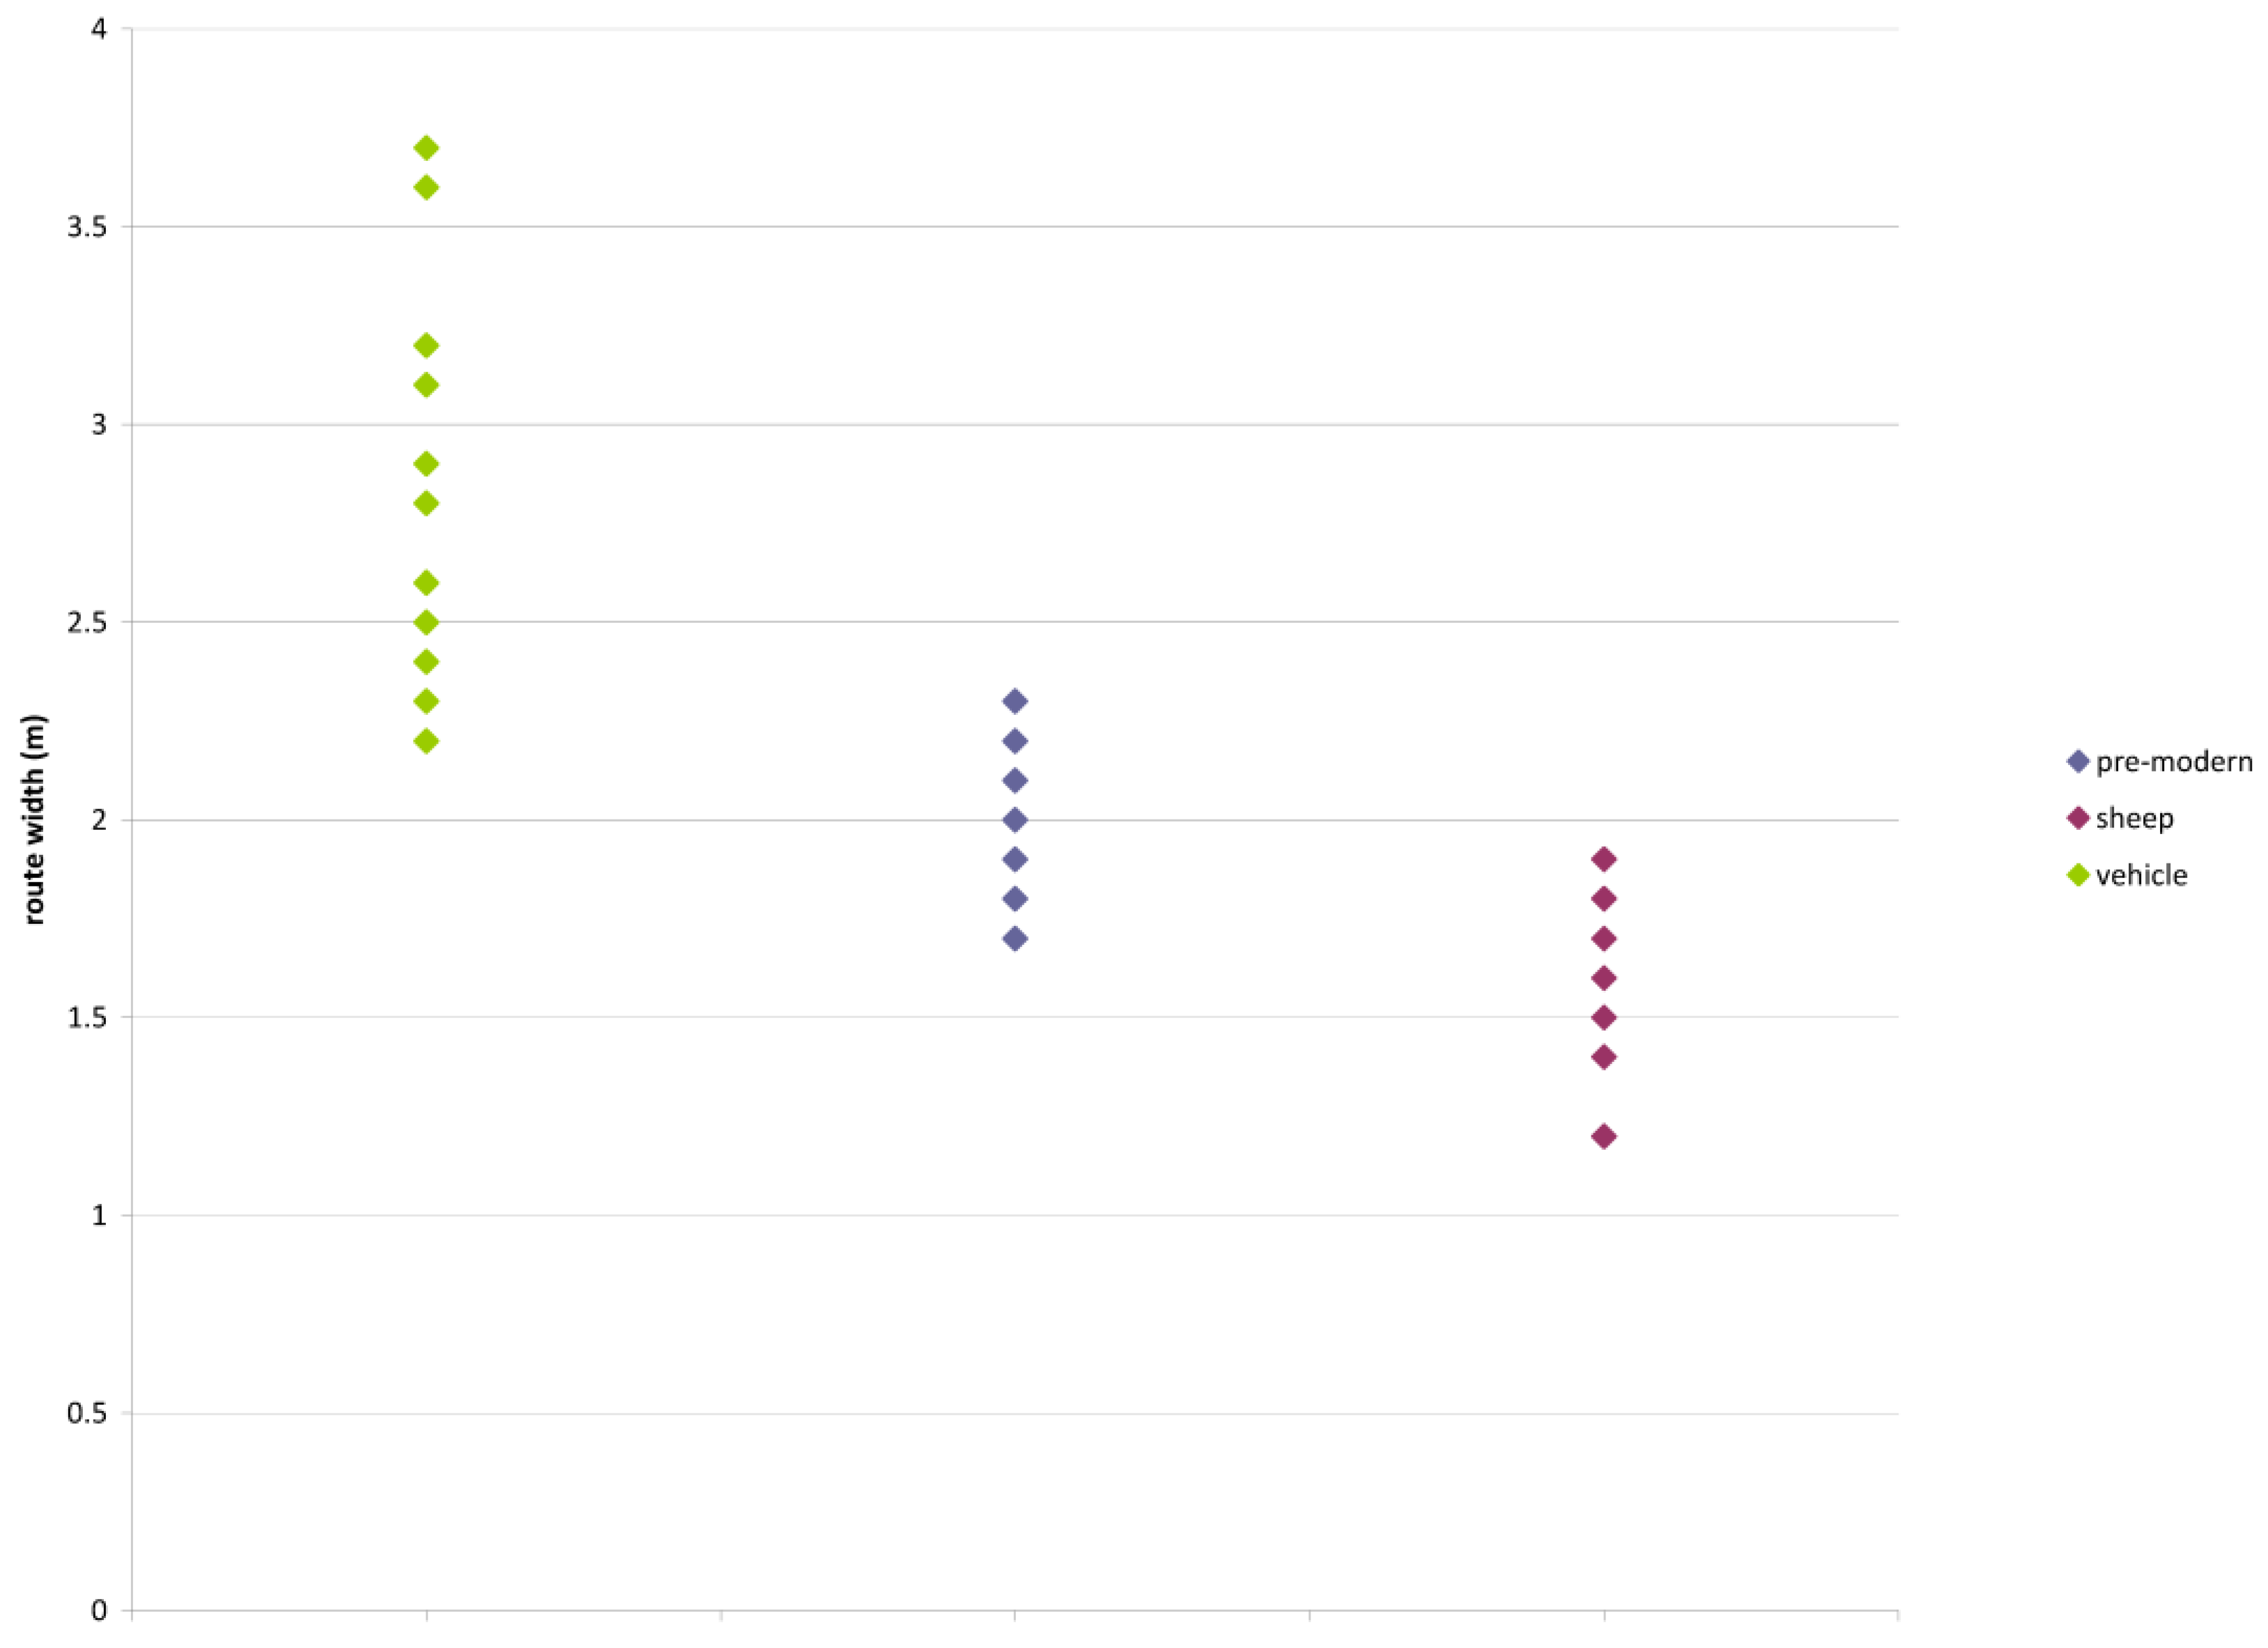
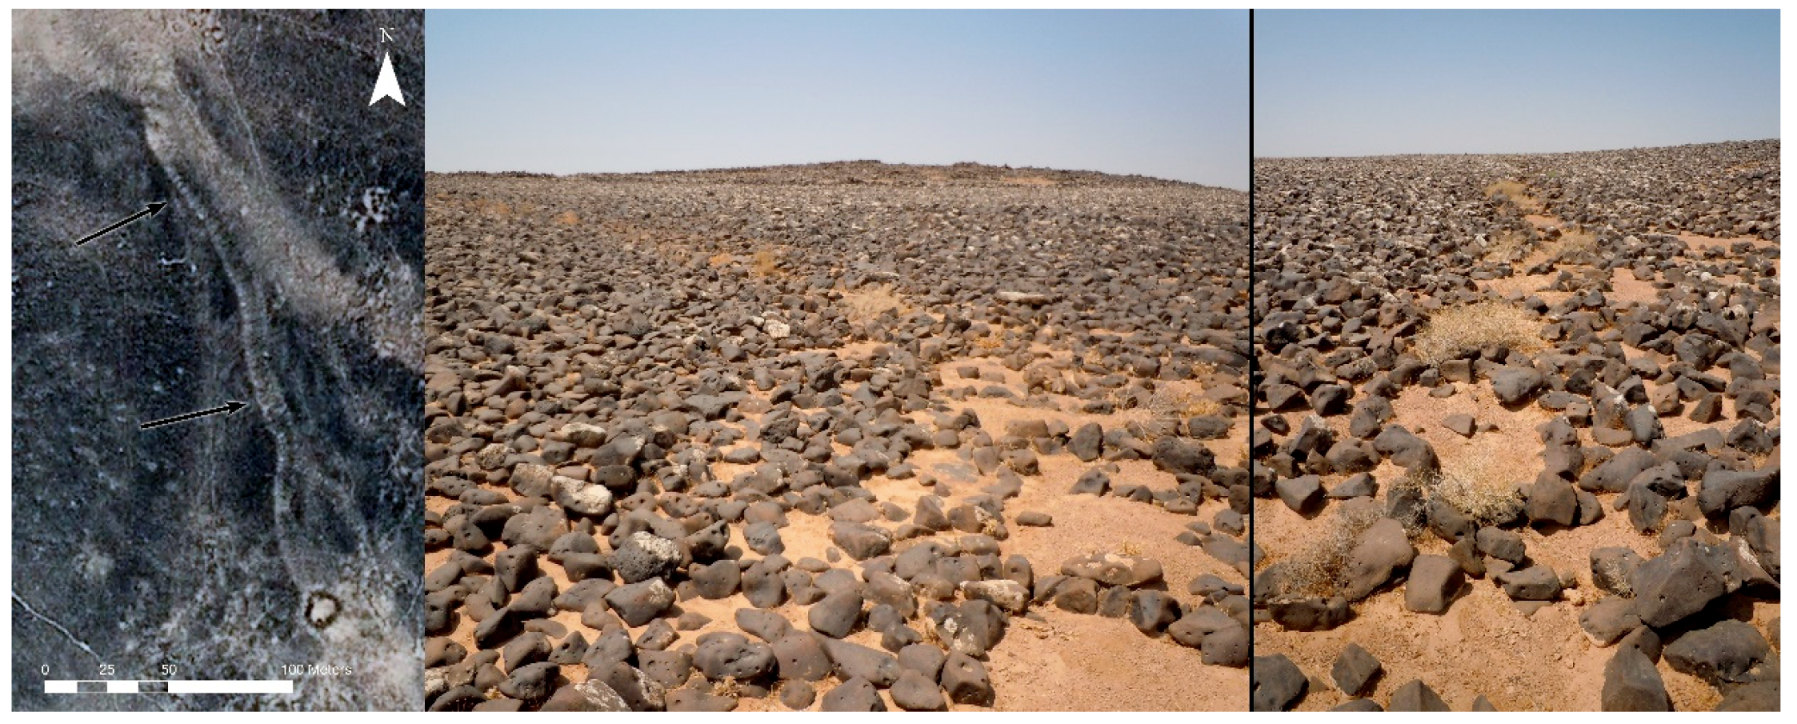
3.2.2. Anthropogenic Pre-Modern Paths

For these sites, the creation of access paths is practically a requirement. Such routes, found in association with prehistoric sites and clearly deliberately arranged by the clearing of a path through the basalt boulders, were first identified on the ground; this was then confirmed by their visibility on satellite imagery. Their existence and association with prehistoric time periods have also been noted by several other researchers in the region [10,29], however, they have not yet been the focus of systematic analyses across a large area. Furthermore, there are several other types of access routes that are visible in remote sensing throughout the Harra, complicating identification. Apart from the asphalt road, the “TAP line” and the tracks opened by bulldozers mentioned earlier, many narrow “sheep tracks” crisscross the region, which are created by stones shifting naturally by the continued kicking of sheep and goat feet as they take the same routes on a regular basis in single file.
It thus becomes necessary to define these different routes based on their appearances in satellite imagery. While the asphalt roads and the cobbled “TAP line” are self-evident, all other routes are simply variations of paths cleared by moving basalt rocks. However, several clear distinctions between these route types can be made from their forms, arrangements and widths (Figure 12). Modern tracks are very straight and wide, while sheep tracks form a random network of narrow paths. Pre-modern routes, on the other hand, are unconnected to vehicle tracks but are clearly linked with ancient sites, and frequently have ancient remains located along the way. Distinctions between recent and ancient routes are also quantifiable from their widths, which, despite some overlap, vary greatly from sheep tracks to the bulldozed roads (Figure 13).
Incorporating ground observations with remote sensing investigations to test the validity of the latter allowed for confident mapping of ancient routes from satellite images alone. For this, we chose a selected region in the northeast of the survey area to conduct a preliminary mapping analysis (Figure 14). This found that 38% of these routes identified connect a qa’a or wadi to other such natural features, while a similar number (36%) connect such features to a site. By contrast, only 16% of routes connect a site to one or more other sites. From this, it could be concluded that pre-modern routes were arranged for two main purposes: (1) Connecting multiple natural access features to provide possibilities of long-distance movement by using these as “stepping stones” across the basalt desert; and (2) connecting sites to their natural approaches for immediate access and to their local resources such as ephemeral water in awdiya and qe’an. This explains the noticeable hierarchy of route networks, ranging from paths several kilometres long to ones leading merely a few tens of meters from a site to a wadi. The most notable examples within the latter variety are path arrangements on slopes with anthropogenically constructed horizontal stone breaks to create stair treads. This leads to the artificial creation of suitable areas for natural vegetation to grow, leading in turn to their easy identification on the ground (Figure 15). By correlating such ground observations with remote sensing, we can now confidently identify these very localised and short-length features on the imagery also.

4. Discussion

4.1. Impacts on Ground Fieldwork Practicalities

The results obtained by the satellite imagery survey, combined with ground-based research, had numerous impacts upon the fieldwork itself. From a standpoint of pure practicality, the ability to pinpoint specific sites for ground investigation that have a good chance of being particularly beneficial to analysis is extremely useful. Our surface survey could thus target representative selections of sites of, for example, specific morphological types, various states of preservation, isolated or grouped locations and varied geographic/geological associations (e.g., close/far from a wadi or qa’a). It was therefore possible to investigate a stratified sample of archaeological remains from the outset of the first fieldwork season, something that would have been otherwise impossible.
A second practical use of the satellite imagery was the ability to determine the accessibility of features we wished to investigate. By mapping visibly cleared routes wide enough to allow the passage of vehicles (see above), a network of “roads” could be superimposed on the desired sites to be visited, and clusters of archaeological features within a reasonable walking distance (maximum ca. 1 km) of these were earmarked for targeting (Figure 16). The formerly unfeasible investigation of sites deep within the basalt was therefore in specific instances made possible.
Both of these advantages, as well as other practicalities in the field, were greatly enhanced by the use of offline imagery on tablet computers. Doing so enabled direct comparisons between the remote sensing data and ground observations to be made, allowing for some immediate confirmations or denials of hypothesised features or their properties based on the satellite imagery survey. Crucially, this was achieved without the need to wait for an opportunity to access the Internet, which might not occur until the end of the season. Furthermore, any beneficial modifications to the fieldwork plan based on in situ findings, such as visiting extra locations and sites, could be made ad-hoc.
Overall, these practical advantages of freely available very high-resolution satellite imagery analyses significantly increase the efficiency of the ground fieldwork, enabling precise data collection from the outset with a much smaller initial outlay, both in terms of time and expense, than would be necessary otherwise. Given the well-known time and budget constraints of many projects within the discipline of archaeology, this provides a particularly meaningful advantage.

4.2. Impacts on Regional Analyses

The advantages of the satellite imagery upon regional analyses are even further reaching. Firstly, in an area such as the Harra, ground investigations are inevitably of a keyhole nature, with only a small percentage of the landscape being feasibly accessible. By incorporating these with the analysis of satellite imagery, however, they can be turned into holistic datasets, enabling regionwide studies that in turn can be correlated with other, more accessible areas with more intensive surface surveys such as the Greater Western Jazira, e.g., Reference [30], and Shamiya, e.g., Reference [31], regions of north-eastern and central Syria, respectively. This can be achieved by the analysis and extrapolation of data pertaining to both individual sites and inter-site features such as routes.
The ability to identify and quantify site types, and be able to precisely determine these with great accuracy is key to ascertaining their spread across a wide landscape. By correlating the visual appearance of these sites on satellite imagery with their known forms from ground investigations, they can be rapidly mapped across a large area. By relying on the surface studies to inform what can be seen on the imagery, even features which cannot be clearly seen on the latter can still be integrated into the holistic mapping once a comparative recognition link has been established. For example, once we have determined that features which look like cairns around “encircled enclosure clusters” are in fact square structures at all examples visited on the ground, it can be said with a high degree of certainty that they will also be square structures at other sites not visited in the field.
Furthermore, with the inclusion of data from fieldwork such as statistically-significant correlations between certain site types and certain human activities or occupation periods, even more detailed interpretations can be made about the landscape as a whole. In the WHS, the former has been investigated by analysing the ratio of different lithic tool varieties present at different site types. Certain tools can indicate certain specific uses for different spaces. For example, lithic scrapers are associated with the processing of animal hides, e.g., Reference [32], while a preponderance of debitage (offcut flakes or chips) might indicate a tool production site. One tentative correlation that was already identified from the first two fieldwork seasons is that “wheel” sites contain on average more scrapers and significantly more lithic cores than “encircled enclosure clusters”, while flakes were found to be proportionally more numerous at the latter site type. If a simultaneous use of both site types is assumed, this could indicate complementary site functions of settlement, processing or storage of tools and/or livestock. If this hypothesis were upheld by further investigation, it would allow the mapping of aspects of socio-economic organisation across the entire landscape by satellite survey.
However, it is also quite possible that these different site types are the result of chronological variations, which ties into another important correlation that the WHS is attempting to determine: That between site form and occupation dates. In the 2017 fieldwork season, the collection of soil samples for dating by OSL, using a method detailed by Athanassas et al. [11], was commenced. Though the results of this analysis are not yet available, and more sites need to be sampled to provide a comprehensive dataset, it is hoped that in time we will be able to rapidly map the spread of human occupation across the Harra over the longue durée. This methodology has previously been used to great effect by the Fragile Crescent Project of Durham University, UK, in the holistic mapping of sites across Northern Mesopotamia [33,34].
Difficulties of circulation in the Harra due to the basaltic pavement, which preserve parts of this region from long-term (and especially modern) human impact, allow in turn for the recognition of ancient routes. This is a good opportunity for studying past circulation from archaeological remains, especially from pre- and protohistoric periods; a relatively rare phenomenon, though other such examples do exist in the Middle East, see e.g., References [35,36]. While pathways can be identified and studied on the ground, the contrast between linear cleared features and the surrounding basalt boulders is particularly recognisable in very high-resolution satellite images. Beyond analysing the interpreted local and daily exploitation of resources, this allows for a more comprehensive regional analysis through systematic mapping, enabling for example the posing of questions surrounding the territorial and economic impact of these routes. Circulation in the region was undoubtedly a critical issue in the past, especially during the peak of occupation between the 7th and the 4th millennium BC. It is now possible to investigate and even quantify issues of spatiality in regional and interregional trade and socio-economic networks that have been suggested for prehistoric north-eastern Jordan [37].
Together, these methods allow us to interpret the distribution of human practices and of human settlement at various time periods across a vast region much quicker than would be possible from decades of fieldwork, with the inclusion of areas that are practically inaccessible on the ground. For this process to be accurate, the quality of remote sensing data is obviously a deciding factor. It is therefore significant that, in the Harra at least, the resolution and clarity of freely-available satellite imagery is now at a level where it can be used for this methodology. Thus, while such analyses are in no way as reliable as ground truth data, they can significantly develop at least a broad understanding of the archaeology of a region by a method that is rapid, cost-effective and encompasses a large scale. Although some factors of its success pertain specifically to the Harra (such as the particularly high contrast and sharp definitions of black basalt structures atop light brown loess), the methodology of the WHS is a comprehensive example of what can be achieved through the use of freely available satellite imagery in general, and illustrates that, as long as its known limitations are kept in mind, this democratisation of remote sensing data yields significant rewards for all academic research.

Author Contributions

Conceptualization, S.L.S. and M.-L.C.; Methodology, S.L.S.; Formal Analysis, S.L.S.; Investigation, S.L.S. and M.-L.C.; Resources, S.L.S. and M.-L.C.; Writing—Original Draft Preparation, S.L.S. and M.-L.C.; Writing—Review & Editing, S.L.S. and M.-L.C.; Visualization, S.L.S. and M.-L.C.; Project Administration, S.L.S. and M.-L.C.; Funding Acquisition, S.L.S. and M.-L.C.

Funding

The Western Harra Survey fieldwork has been made possible by funding from the Council for British Research in the Levant (CBRL) (2015 season), the National Geographic Society (2015 season), the Curtiss T. Brennan & Mary G. Brennan Foundation (2017 season) and Archéorient—UMR 5133 CNRS (2017 & 2018 seasons). The 2017 and 2018 seasons as well as the project in general has received funding from the Research Foundation—Flanders (FWO) and the European Union’s Horizon 2020 research and innovation programme under the Marie Skłodowska-Curie grant agreement No. 665501.

Acknowledgments

The Western Harra Survey is a co-directed project by both authors. Thank you to all additional team members: Anne Binder, Lanah Haddad, S. Nina Mann (2015 season); David Burke (2017 season); Imad Alhussain (2017 & 2018 seasons). Thanks also go to the Department of Antiquities of the Hashemite Kingdom of Jordan, in particular HE Monther Jamhawi, Aktham Oweidi, Ahmad Lash and Aisar Radaydeh. We are also grateful to IFPO and CBRL for facilitating our fieldwork and study season in numerous ways.

Conflicts of Interest

The authors declare no conflict of interest. The funding sponsors had no role in the design, execution, interpretation, or writing of the study.

References

  1. Kempe, S.; Al-Malabeh, A. Hunting kites (‘desert kites’) and associated structures along the eastern rim of the Jordanian Harrat: A geo-archaeological Google Earth images survey. Z. Orient-Archäol. 2010, 3, 46–86. [Google Scholar]
  2. Kempe, S.; Al-Malabeh, A. Desert kites in Jordan and Saudi Arabia: Structure, statistics and function, a Google Earth study. Quat. Int. 2013, 297, 126–146. [Google Scholar] [CrossRef]
  3. Issar, A.S.; Zohar, M. Climate Change—Environment and History of the Near East; Springer: Berlin, Germany, 2007. [Google Scholar]
  4. Traboulsi, M. Les précipitations au Proche-Orient: Variabilité Spatio-Temporelle et Relations avec la dynamique de l’atmosphère (1960–61/1989–90). Ph.D. Thesis, University of Bourgogne, Dijon, France, 2004. [Google Scholar]
  5. Maitland, P. The ‘Works of the old Men’ in Arabia. Antiquity 1927, 1, 197–203. [Google Scholar] [CrossRef]
  6. Kennedy, D. The “Works of the Old Men” in Arabia: Remote sensing in interior Arabia. J. Archaeol. Sci. 2011, 38, 3185–3203. [Google Scholar] [CrossRef]
  7. Betts, A.V.G. (Ed.) Excavations at Jawa 1972–1986; Edinburgh University Press: Edinburgh, UK, 1991. [Google Scholar]
  8. Betts, A.V.G. (Ed.) The Harra and the Hamad: Excavations and Survey in Eastern Jordan; Sheffield Archaeological Monographs 9; Sheffield Academic Press: Sheffield, UK, 1998. [Google Scholar]
  9. Müller-Neuhof, B. A ‘marginal’ region with many options: The diversity of Chalcolithic/Early Bronze Age socio-economic activities in the hinterland of Jawa. Levant 2014, 46, 230–248. [Google Scholar] [CrossRef]
  10. Akkermans, P.M.M.G.; Huigens, H.O.; Brüning, M.L. A landscape of preservation: Late prehistoric settlement and sequence in the Jebel Qurma region, north-eastern Jordan. Levant 2014, 46, 186–205. [Google Scholar] [CrossRef]
  11. Athanassas, C.D.; Rollefson, G.O.; Kadereit, A.; Kennedy, D.; Theodorakopoulou, K.; Rowan, Y.M.; Wasse, A. Optically stimulated luminescence (OSL) dating and spatial analysis of geometric lines in the Northern Arabian Desert. J. Archaeol. Sci. 2015, 64, 1–11. [Google Scholar] [CrossRef]
  12. Müller-Neuhof, B.; Abu-Azizeh, W. Milestones for a tentative chronological framework for the late prehistoric colonization of the basalt desert (north-eastern Jordan). Levant 2016, 48, 220–235. [Google Scholar] [CrossRef]
  13. Richter, T.; Arranz-Otaegui, A.; Yeomans, L.; Boaretto, E. High Resolution AMS Dates from Shubayqa 1, northeast Jordan Reveal Complex Origins of Late Epipalaeolithic Natufian in the Levant. Sci. Rep. 2017, 7. [Google Scholar] [CrossRef] [PubMed]
  14. Betts, A.V.G. The Epipalaeolithic Periods. In The Harra and the Hamad: Excavations and Survey in Eastern Jordan; Sheffield Archaeological Monographs 9; Betts, A.V.G., Ed.; Sheffield Academic Press: Sheffield, UK, 1998; pp. 11–35. [Google Scholar]
  15. Rollefson, G.; Rowan, Y.; Wasse, A. The Late Neolithic colonization of the Eastern Badia of Jordan. Levant 2014, 46, 285–301. [Google Scholar] [CrossRef]
  16. Rollefson, G.O.; Athanassas, C.D.; Rowan, Y.M.; Wasse, A. First chronometric results for ‘works of the old men’: Late prehistoric ‘wheels’ near Wisad Pools, Black Desert, Jordan. Antiquity 2016, 90, 939–952. [Google Scholar] [CrossRef]
  17. Western Harra Survey—Home. Available online: http://bit.ly/WHS_Facebook (accessed on 7 December 2018).
  18. Western Harra Survey—YouTube. Available online: http://bit.ly/WHS_YouTube (accessed on 7 December 2018).
  19. Smith, S.L. The Late Chalcolithic and Early Bronze Age of the Badia and Beyond: Implications of the Results of the First Season of the Western Harra Survey. In Landscapes of Survival, Proceedings of the International Conference on the Archaeology and Epigraphy of Jordan’s North-Eastern Desert, Leiden University, Leiden, The Netherlands, 17–18 March 2017; Akkermans, P.M.M.G., Ed.; Sidestone Press: Leiden, Netherlands, in press.
  20. Smith, S.L. Surveying the Black Desert: Investigating Prehistoric Human Occupation in North-Eastern Jordan. ArchéOrient—Le Blog 2017. Available online: http://archeorient.hypotheses.org/7882 (accessed on 27 November 2018).
  21. Chambrade, M.-L.; Smith, S.L. Western Harra Survey Project. Archaeol. Jordan Newsl. 2018, 7–8. Available online: http://www.acorjordan.org/archaeology-jordan-aij (accessed on 28 November 2018).
  22. Kennedy, D.L. Pioneers above Jordan: Revealing a prehistoric landscape. Antiquity 2012, 86, 474–491. [Google Scholar] [CrossRef]
  23. Kennedy, D.; Bewley, R. Aerial archaeology in Jordan. Antiquity 2009, 83, 69–81. [Google Scholar] [CrossRef]
  24. APAAME—Finding the Past Frame by Frame. Available online: http://www.apaame.org (accessed on 27 November 2018).
  25. Philip, G.; Donoghue, D.; Beck, A.; Galiatsatos, N. CORONA satellite photography: An archaeological application from the Middle East. Antiquity 2002, 76, 109–118. [Google Scholar] [CrossRef]
  26. Ur, J.A. CORONA Satellite Photography and Ancient Road Networks: A Northern Mesopotamian Case Study. Antiquity 2003, 77, 102–115. [Google Scholar] [CrossRef] [Green Version]
  27. Ansart, A.; Braemer, F.; Davtian, G. Preparing an archaeological field survey: Remote sensing interpretation for herding structures in the Southern Levant. J. Field Archaeol. 2016, 41, 699–712. [Google Scholar] [CrossRef]
  28. Betts, A.V.G. “Jellyfish”: Prehistoric desert rockshelters. ADAJ 1982, 26, 183–188. [Google Scholar]
  29. Huigens, H.O. The identification of pathways on harra surfaces in north-eastern Jordan and their relation to ancient human mobility. J. Arid Environ. 2018, 155, 73–78. [Google Scholar] [CrossRef]
  30. Smith, S.L. The View from the Steppe. Using Remote Sensing to Investigate the Landscape of “Kranzhügel” in Its Regional Context. In Studies in Honor of Tony J. Wilkinson. New Agendas in Remote Sensing and Landscape Archaeology in the Near East; Oriental Institute Publications; Lawrence, D., Altaweel, M., Philip, G., Eds.; University of Chicago Press: Chicago, IL, USA, in press.
  31. Geyer, B.; Chambrade, M.-L.; Coqueugniot, E. Water quest and subsistence strategies during the Neolithic in the arid margins of Northern Syria. In Settlement Dynamics and Human-Landscape Interaction in the Dry Steppes of Syria; Studia Chaburensia 4; Morandi Bonacossi, D., Ed.; Harrassowitz Verlag: Wiesbaden, Germany, 2014; pp. 1–31. [Google Scholar]
  32. Yerkes, R.; Barkai, R.; Gopher, A.; Zutovski, K. The use of fan scrapers: Microwear evidence from Late Pottery Neolithic and Early Bronze Age, Ein Zippori, Israel. J. Lithic Stud. 2016, 3, 185–205. [Google Scholar] [CrossRef]
  33. Galiatsatos, N.; Wilkinson, T.J.; Donoghue, D.; Philip, G. The Fragile Crescent Project (FCP): Analysis of Settlement Landscapes using Satellite Imagery. In Proceedings of the Computer Applications to Archaeology 2009 Conference, Williamsburg, VA, USA, 22–26 March 2009; Available online: http://dro.dur.ac.uk/6909 (accessed on 27 November 2018).
  34. Lawrence, D.; Bradbury, J.; Dunford, R. Chronology, Uncertainty and GIS: A Methodology for Characterising and Understanding Landscapes of the Ancient near East. In Proceedings of the 2nd International Landscape Archaeology Conference, Berlin, Germany, 6–8 June 2012; Bebermeier, W., Hebenstreit, R., Kaiser, E., Krause, J., Eds.; Excellence Cluster Topoi: Berlin, Germany, 2012; Volume 3, pp. 353–359. [Google Scholar]
  35. Wilkinson, T.J.; French, C.; Ur, J.A.; Semple, M. The Geoarchaeology of Route Systems in Northern Syria. Geoarchaology 2010, 25, 745–771. [Google Scholar] [CrossRef]
  36. Zboray, A. Prehistoric trails in the environs of Karkur Talh, Jebel Uweinat. In Desert Road Archaeology in Ancient Egypt and Beyond; Africa Praehistorica, 27, Förster, F., Reimer, H., Eds.; Heinrich-Barth-Institut: Köln, Germany, 2013; pp. 381–389. [Google Scholar]
  37. Müller-Neuhof, B. Chalcolithic/Early Bronze Age Flint Mines in the Northern Badia. Syria 2013, 90, 177–188. [Google Scholar] [CrossRef]
Figure 1. Map of the location of the Western Harra Survey (WHS) and the extent of the Harra’t al-Sham, based on Reference [2] (32°0’ N, 37°6’ E). Sources: Esri, DigitalGlobe, GeoEye, i-cubed, USDA FSA, USGS, AEX, Getmapping, Aerogrid, IGN, IGP, swisstopo and the GIS User Community.
Geosciences 08 00491 g001
Figure 2. Map of the WHS in the context of other past and present archaeological fieldwork projects in the Harra, with the modern towns of Azraq and Safawi indicated (32°0′ N, 37°24′ E). CORONA satellite data available from the US Geological Survey.
Geosciences 08 00491 g002
Figure 3. A view of the typical landscape of dense basalt blocks that makes up the majority of the Harra.
Geosciences 08 00491 g003
Figure 4. Photograph taken after seasonal rainfall in late October 2015, showing how qe’an fills with water to become temporary lakes.
Geosciences 08 00491 g004
Figure 5. Photographs illustrating the four typical landscapes of the Harra, all of which are represented in the WHS area: (A) Undulating steppe carpeted by a dense layer of basalt blocks, extremely difficult to traverse; (B) large traversable wadi systems surrounded by pockets of dense to medium-dense basalt outcrops; (C) large qe’an, often adjoining each other over many tens of kilometres, providing access into areas otherwise similar to A; (D) hilly areas crossed by small awdiya that are not easy to travel along, with medium-dense basalt coverage right up to the wadi edges.
Geosciences 08 00491 g005
Figure 6. Map showing all sites within the WHS identified by the satellite imagery survey, with main roads and natural features highlighted (32°0′ N, 37°7′ E). Sources: Esri, DigitalGlobe, GeoEye, i-cubed, USDA FSA, USGS, AEX, Getmapping, Aerogrid, IGN, IGP, swisstopo and the GIS User Community.
Geosciences 08 00491 g006
Figure 7. Representative satellite images of the main previously-identified prehistoric site forms found in the Harra. Microsoft product screen shots reprinted with permission from Microsoft Corporation.
Geosciences 08 00491 g007
Figure 8. Representative line drawings highlighting the differences between (a) “wheels” and (b) “encircled enclosure clusters”.
Geosciences 08 00491 g008
Figure 9. Map showing the distribution of “wheels” and “encircled enclosure clusters” in the WHS, with natural features highlighted (32°0′ N, 37°7′ E). Sources: Esri, DigitalGlobe, GeoEye, i-cubed, USDA FSA, USGS, AEX, Getmapping, Aerogrid, IGN, IGP, swisstopo and the GIS User Community.
Geosciences 08 00491 g009
Figure 10. Satellite image showing a particularly distinct view of two “encircled enclosure clusters”, with clear examples of the associated small square structures indicated by arrows. Microsoft product screen shot(s) reprinted with permission from Microsoft Corporation.
Geosciences 08 00491 g010
Figure 11. Ground view of one of the small square structures that surround “encircled enclosure clusters”, with an overlaid red line drawn to indicate its inner edge.
Geosciences 08 00491 g011
Figure 12. Complementary satellite and ground views of representative examples of (a) modern vehicle tracks, (b) “sheep tracks” and (c) probable pre-modern routes. Sources: Esri, DigitalGlobe, GeoEye, i-cubed, USDA FSA, USGS, AEX, Getmapping, Aerogrid, IGN, IGP, swisstopo and the GIS User Community.
Geosciences 08 00491 g012
Figure 13. Graph showing the widths of paths in the analyzed area corresponding to the three types of routes present in the region.
Geosciences 08 00491 g013
Figure 14. Map showing all probable pre-modern routes identified in the analysis area, with “wheels” and “encircled enclosure clusters” marked for locational comparison (32°0′ N, 37°7′ E). Also highlighted are natural features and “kite” walls, which can additionally be used for human circulation (the latter due to the ubiquitous linear clearings of removed construction stones adjacent to the walls). Sources: Esri, DigitalGlobe, GeoEye, i-cubed, USDA FSA, USGS, AEX, Getmapping, Aerogrid, IGN, IGP, swisstopo and the GIS User Community.
Geosciences 08 00491 g014
Figure 15. Complementary satellite and ground views of representative examples of pre-modern paths with “steps” built into them, indicated by arrows in the left-hand image. Sources: Esri, DigitalGlobe, GeoEye, i-cubed, USDA FSA, USGS, AEX, Getmapping, Aerogrid, IGN, IGP, swisstopo and the GIS User Community.
Geosciences 08 00491 g015
Figure 16. Map showing all routes traversable by vehicle in the WHS area (including vehicle-accessible qe’an), with sites within 1 km of such routes highlighted (32°0′ N, 37°7′ E). Sources: Esri, DigitalGlobe, GeoEye, i-cubed, USDA FSA, USGS, AEX, Getmapping, Aerogrid, IGN, IGP, swisstopo and the GIS User Community.
Geosciences 08 00491 g016

