Article

A Comparative Study of the AHP and TOPSIS Techniques for Dam Site Selection Using GIS: A Case Study of Sistan and Baluchestan Province, Iran

1
Department of Civil Engineering, University of Texas at Arlington, P.O. Box 19019, Arlington, TX 76019, USA
2
M. E. Rinker, Sr. School of Construction Management, University of Florida, P.O. Box 115703, Gainesville, FL 32611, USA
3
Department of Civil Engineering, Ferdowsi University of Mashhad, Mashhad 9177948974, Iran
4
College of Architecture and Planning, University of Colorado Denver, P.O. Box 173364, Denver, CO 80217, USA
5
Department of Civil and Architectural Engineering and Mechanics, University of Arizona, P.O. Box 210072, Tucson, AZ 85721, USA
*
Author to whom correspondence should be addressed.
Geosciences 2018, 8(12), 494; https://doi.org/10.3390/geosciences8120494
Submission received: 31 October 2018 / Revised: 11 December 2018 / Accepted: 12 December 2018 / Published: 17 December 2018
(This article belongs to the Special Issue Geodesy and Geomatics Engineering)

Abstract

:
The application of multiple criteria decision-making (MCDM) techniques in real-life problems has increased in recent years. The need to build advanced decision models with higher capabilities that can support decision-making in a broad spectrum of applications, promotes the integration of MCDM techniques with applicable systems, including artificial intelligence, and Geographic Information Systems (GIS). The Analytic Hierarchy Process (AHP) and Technique for Order of Preference by Similarity to Ideal Solution (TOPSIS) are among the most widely adopted MCDM techniques capable of resolving water resources challenges. A critical problem associated with water resource management is dam site selection. This paper presents a comparative analysis of TOPSIS and AHP in the context of decision-making using GIS for dam site selection. The comparison was made based on geographic and water quality criteria. The geographical criteria are geology, land use, sediment, erosion, slope, groundwater, and discharge. The water quality criteria include Soluble Sodium Percentage, Total Dissolved Solid, Potential of Hydrogen, and Electrical Conductivity of water. A ratio estimation procedure was used to determine the weights of these criteria. Both methods were applied for selection of optimal sites for dams in the Sistan and Baluchestan province, Iran. The results show that the TOPSIS method is better suited to the problem of dam site selection for this study area. Actual locations of dams constructed in the area were used to verify the results of both methods.

1. Introduction

The economic merits of dams outweigh the detriments and costs, thus providing a good reason for construction of dams around the world. Selection of the best location for construction a dam is one of the most complex and controversial decisions in water supply management [1]. Just as an optimal site selection can enhance the security of the reservoir in a region and groundwater regeneration, a bad site selection can undermine them. A well-selected site will not only provide direct benefits, but its careful design can also provide the additional benefit of a recreational area surrounding the reservoir. Conversely, a poorly selected site could cause detrimental influences such as negative biophysical, socio-economic, and geopolitical impacts, often through the loss of ecosystem services provided by fully functioning aquatic systems [2,3,4,5]. Thus, for selection of dam sites, it is necessary to conduct a precise study over the interest area considering factors affecting this selection. However, this procedure is costly and time consuming. With advances in computing and information technologies, determining competitive solutions in terms of cost, time, and a variety of other objective variables is greatly facilitated.
A powerful tool that plays a noticeable role in this process is the Geographical Information System (GIS) and its applications in hydrology. GIS, which can integrate large layers of data, is a computer-based system handling the attribute data as well as spatial data where geographical information is a key characteristic [6,7,8]. The use of such technology as GIS in this sector compared to buildings and other infrastructure is still behind and this has still remained as a challenge in the lifecycle management of dams. In addition to GIS, Multiple Criteria Decision-making (MCDM) helps decision-makers select between alternative solutions, in this case sites for construction of dams, where there are many criteria [9]. Two of the most widely used MCDM techniques are known as Analytic Hierarchy Process (AHP) [10] and Technique for Order of Preference by Similarity to Ideal Solution (TOPSIS) [11,12,13,14]. The integration of MCDM and other data analysis tools such as GIS have been commonly used by past researchers, particularly in dam site selection studies [15,16,17,18]. It should be noted that GIS is powerfully used in dam site selection [19,20,21]; however, its ability in a certain region may differ from other locations. The AHP approach is an effective tool for system analysis and solves decision problems by reducing complex decisions to a series of pairwise comparisons. AHP is an effective multiple criteria decision-making technique that has been used to solve decision problems in a variety of fields [22,23]. Furthermore, AHP includes an effective technique for checking the consistency of the decision-maker’s evaluations, thus decreasing the bias in the decision-making process [24]. The TOPSIS method is based on the idea that the best alternative has the shortest distance from the ideal solution and the farthest distance from the negative ideal solution. The ideal solution is assumed to be an alternative that has the best values for all considered criteria whereas the negative ideal solution is identified with a hypothetical alternative that has the worst criteria values [11]. Many papers have been published in the field of dam site selection using MCDM techniques for choosing a feasible location for building a dam. However, the authors are not aware of any comparative study between the TOPSIS and AHP techniques for solving dam site selection problems.
A wide range of studies have been conducted regarding risk or performance analysis on multiple watersheds, dams or tunnels all around the world with a diverse hydro-climatological regimes [25,26,27,28,29,30,31,32,33]. Anane et al. (2012) carried out a study to prioritize the best locations for irrigation with treated wastewater (TWW) in Tunisia [34]. Potential feasible locations were identified based on resources conflicts, cost effectiveness, land suitability, social acceptance and environment factor. Several researchers have applied fuzzy systems on decision-making methods [35,36,37,38,39]. Using fuzzy AHP combined with GIS, they were able to map and prioritize the appropriate sites for different purposes. Reliable data and advanced technologies are two necessary elements for efficient management of transportation networks and their transit corridors [40,41,42]. Soil properties and groundwater level should be investigated in design phase of the road transportation network to have a high-quality subgrade. As such, there have been a significant progress in development of the standards for data transfer between different software packages and technologies [43]. Choudhary and Shankar (2012) considered location selection for thermal power plants as a multi-criteria decision problem and applied a STEEP-fuzzy AHP-TOPSIS framework to rank the alternative locations and select the most suitable for a thermal power plant in India [44]. Their study considered five major criteria, including social, technical, economic, environmental, and political. The weight of qualitative and quantitative criteria that impact the location selection process was determined by the fuzzy AHP. The alternative locations were ranked based on their overall performance using the TOPSIS technique. Kim et al. (2012) used the TOPSIS method in a fuzzy environment to rank the best out of ten sites for treated wastewater (TWW) in a South Korean urban watershed [35]. They considered four main criteria, including technical, social, economic and environmental criteria. The uncertainty of weighting values and input data were considered using triangular fuzzy numbers, and data were collected using individual interviews. The results showed that the fuzzy TOPSIS approach provided different rankings of the best sites for TWW compared to a traditional MCDM technique, highlighting the need for fuzzy-based MCDM. In 2012, a study was conducted by Minatour et al. in the western part of Iran using the AHP technique to help choose an appropriate location for an earth dam [45]. In this study, nine categories of criteria and eleven sub criteria were considered based on their ranked importance for locating the earth dam site. The criteria used were: topographic conditions, economic development, health of dam site, river flow regime, annual yield, volume of reservoir, annual volume of sediment, probable maximum flood, average annual evaporation, access to materials and facilities, overall cost, water quality, dam body and reservoir, probable dam break, environmental, social, and political. According to the criteria in the dam site selection, using the experiences and opinions of experts, and existing information and data, four feasible alternatives were proposed and prioritized using the AHP technique. The most optimal site was selected and then approved by the experts involved in the project [45]. In another study, Sengül et al. (2014) developed a model using the Fuzzy TOPSIS method to rank renewable energy supply systems in Turkey [36]. The Interval Shannon’s Entropy methodology was used to determine weight values for the criteria. Criteria data were obtained from the literature and from official sites in Turkey. The results of this research offer energy policymakers and decision-makers optimal alternative solutions for resource allocation in Turkey.
Zyoud et al. (2016) used AHP and TOPSIS methods within a fuzzy environment to create a framework for water loss management in developing countries [37]. They proposed a hierarchical structure of the decision problem that consisted of four levels: overall objective; main criteria; evaluation criteria; and options. In this study, the weightings of criteria were determined by fuzzy AHP, and fuzzy TOPSIS was also used to rank options in terms of their potential to meet the overall objective based on the evaluations and preferences of decision-makers. It was assumed that the most important option was a pressure management and control strategy. Additionally, employing advanced techniques and establishment of district metered areas were determined to be the second and third most important, respectively. Moreover, based on sensitivity analysis results, the strongest and weakest options were less sensitive to changes in the weights of the evaluation criteria. Özcan et al. (2017) applied the AHP and TOPSIS methods for maintenance strategy selection in hydroelectric power plants in Turkey [46]. In their study, a combined AHP-TOPSIS methodology was used for choosing the most critical equipment. Nine items of equipment of critical importance for hydroelectric power plants were determined. A Goal Programming (GP) model was proposed to obtain maintenance strategy combinations for the equipment. The results showed that there was an improvement of 77.1% in failure frequency of the power plant resulting from employing the wrong maintenance strategy on critical equipment compared to the period when the model was not used. Esavi et al. (2012) compared the AHP and Fuzzy-AHP methods for underground dam site selection in a hydrologic catchment in Iran [47]. They concluded that the Fuzzy-AHP shows higher capability and more flexibility in selecting the appropriate underground dam location. An intercomparison between AHP and TOPSIS techniques was carried out by Önüt and Soner (2018) to select an optimal transshipment site in Istanbul, Turkey [48]. They used fuzzy sets to account for uncertainties in different criteria and they derived criteria weights based on a pair-wise comparison using the AHP method. Mulliner et al. (2016) conducted a comprehensive analysis of five different MCDM techniques, including TOPSIS and AHP, to assess sustainable housing affordability using different economic, social and environmental criteria in Liverpool, UK [49]. Their results show that overall ranking of alternatives varies from method to method, and there is no perfect technique for this problem. Hence, where possible, applying a selection of different methods to the same problem is ideal. Balioti et al. (2018) applied the AHP and TOPSIS methods with fuzzy logic to select the optimal type of spillway in a dam in Northern Greece [50]. They concluded that these tools are required to account for additional parameters beyond technical and construction costs. Table 1 shows a quick review of recent research study on dam site selection using AHP and TOPSIS techniques.
This paper presents a study based on the selection of suitable dam sites in southern parts of the Sistan and Baluchestan province, Iran. Therefore, a comparative study of two MCDM models (TOPSIS and AHP) is applied in the GIS environment to determine the proposed locations for dam construction. For this purpose, based on the literature and similar research experiences, several criteria were used in the selection procedure. Therefore, the main objectives of the present study are as follows:
  • To propose several factors affecting the selection of dam site in Sistan and Balouchestan Province, Iran, based on previous experiences around the world.
  • To integrate MCDM and GIS in the study area for the purpose of dam site selection.
  • To consider topographical and morphological conditions in dam site selection.
  • To compare the outputs of TOPSIS and AHP applications in dam site selection.
  • To help the decision-makers in the construction of new dams in the interest area.
This paper is organized as follows. At first, the area of the available dam sites is introduced. Then, the data and methods for choosing the best locations for construction of dams is thoroughly explained. Afterwards, results of implementing the TOPSIS and AHP techniques are discussed. Finally, the conclusions and recommendations for the future researches is provided.

2. Methodology

2.1. Study Area

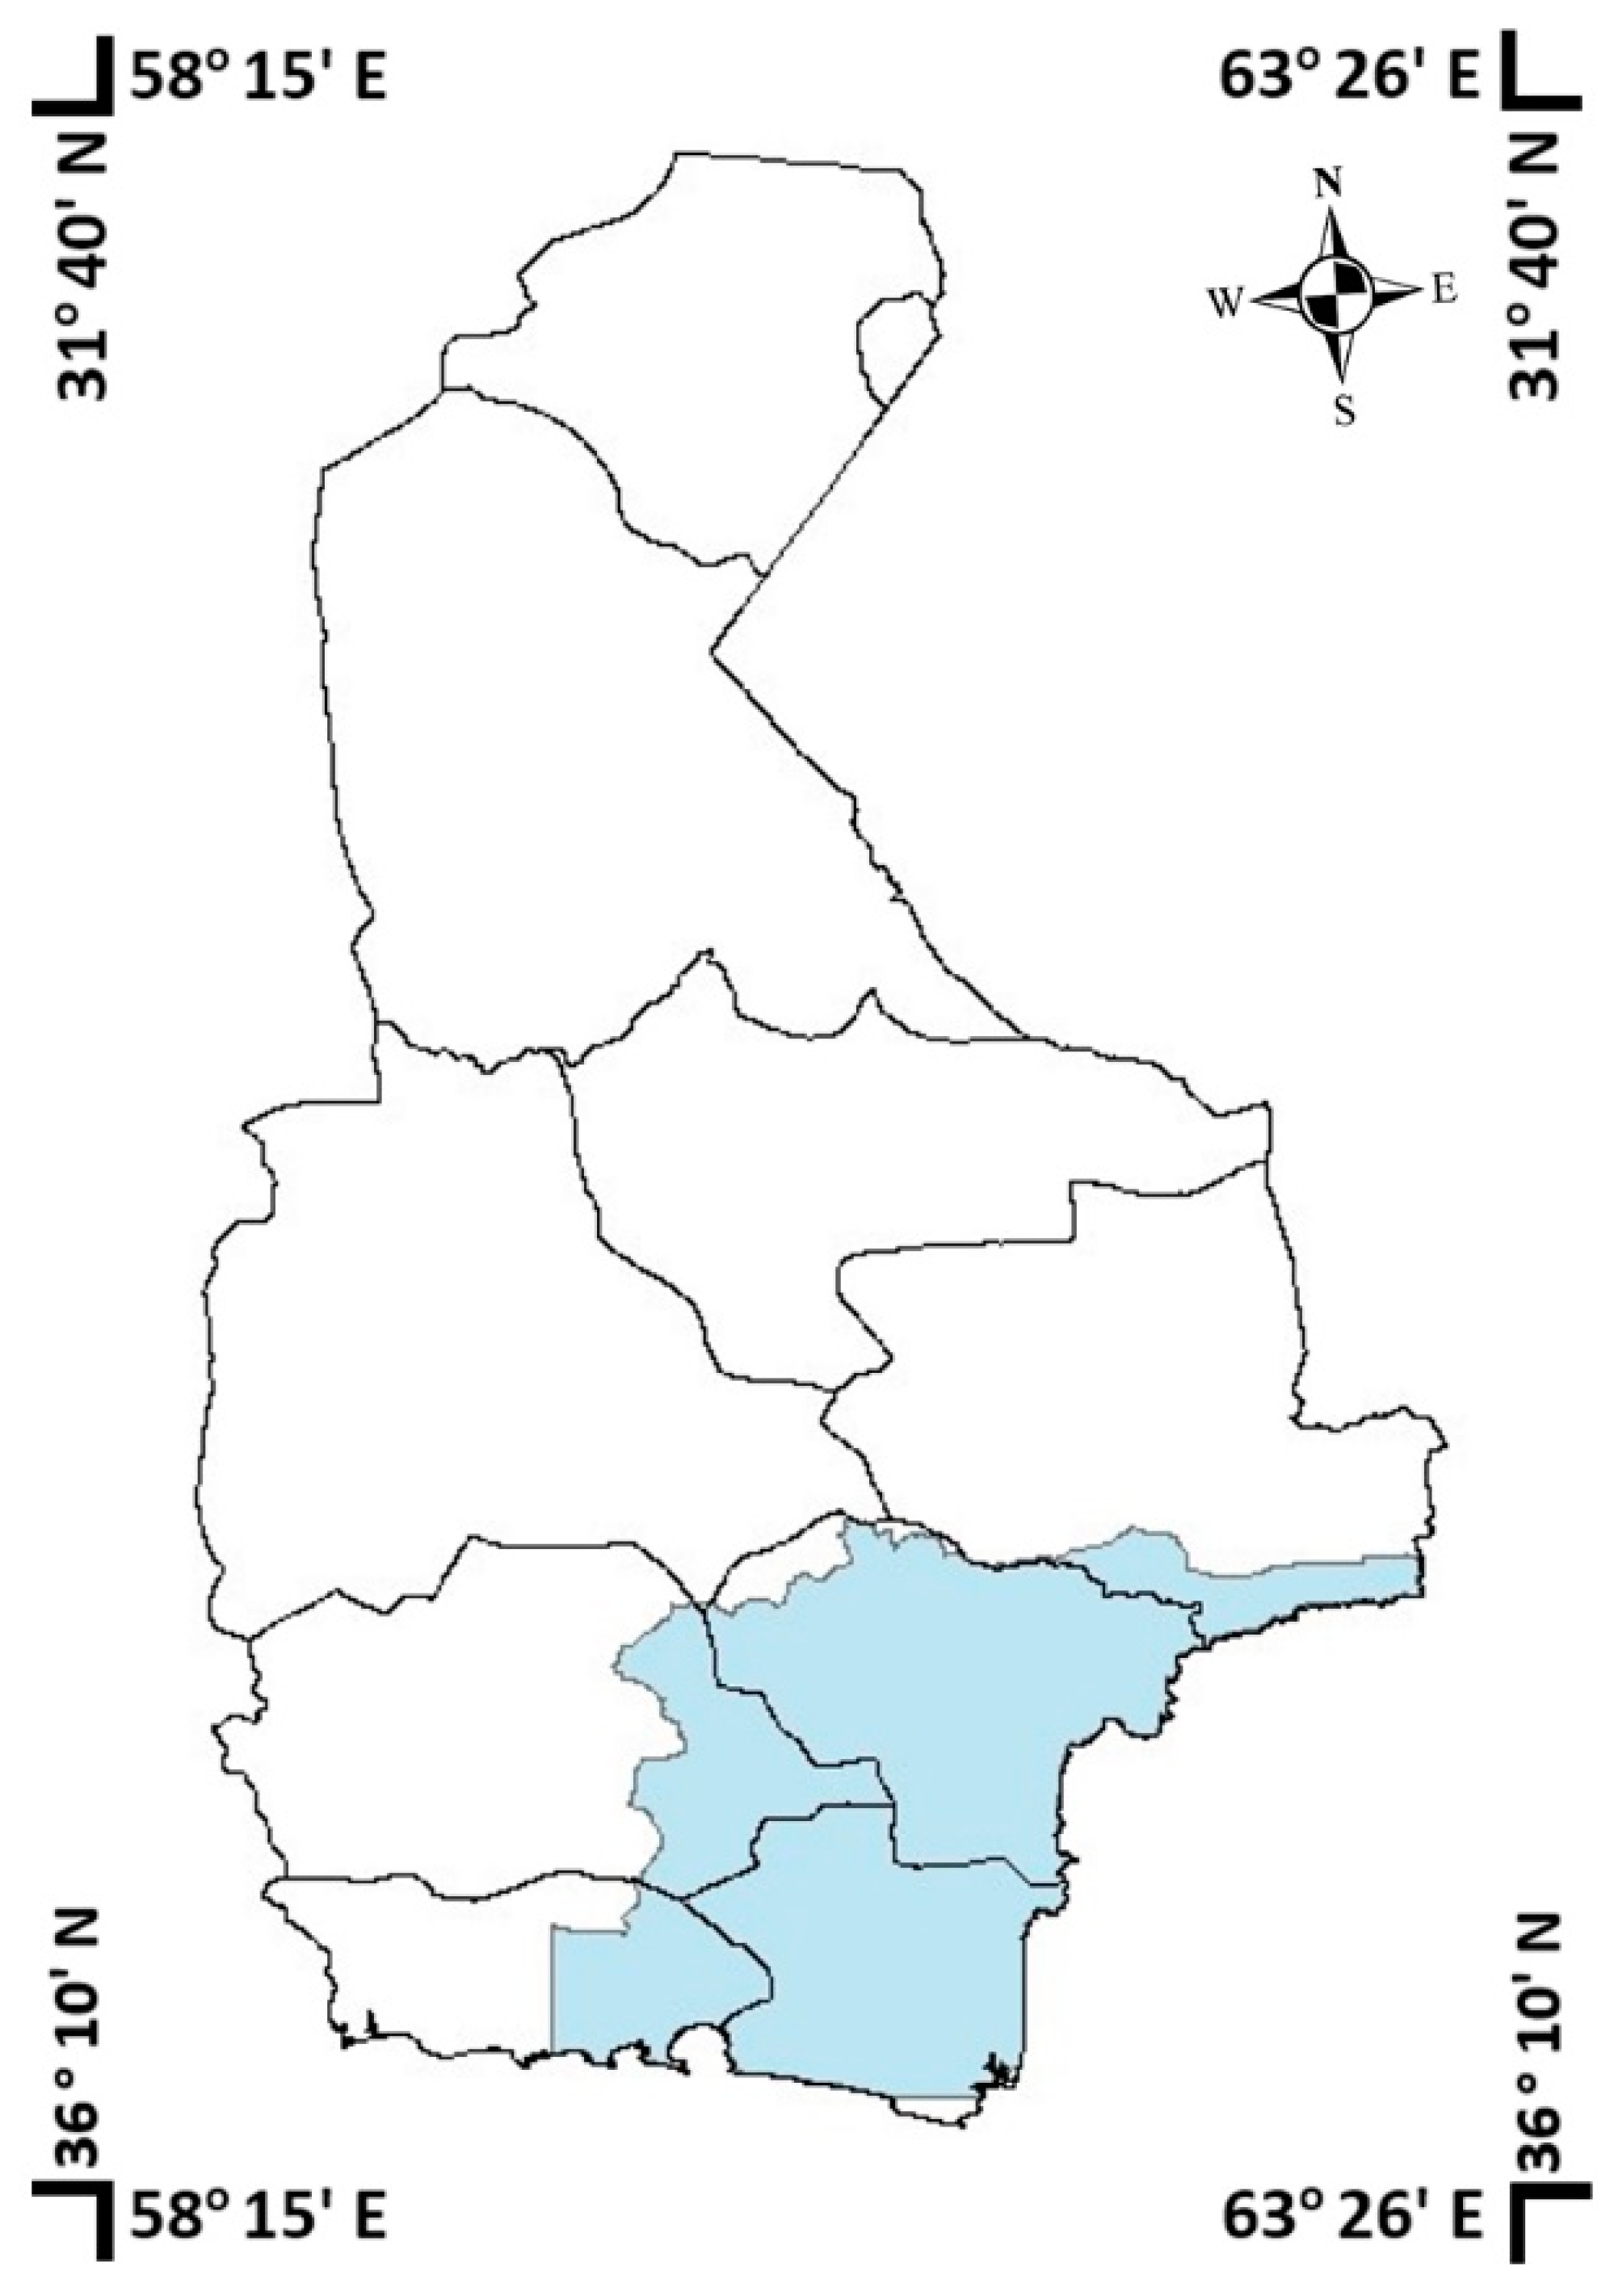
Sistan and Baluchestan Province covers an area of 181,785 km² and, with a population of 2.5 million, is the second-largest province of Iran. Nonetheless, it is one of the most thinly populated provinces in the country. Sistan and Baluchestan Province includes a desert and semi-desert climate and the average annual precipitation in this province is about 110 mm and its average temperature is from 22 to 37 °C. This region is variable in terms of areas and heights. Also, because of the proximity of the province to the Lut desert (Dasht-e-Lut), the province has a warm and arid climate with relatively moderate winter. Temperature variations overnight, as well as high annual fluctuations and low relative humidity, and annual rainfall are much less than the average rainfall in the country [58].
As shown in Figure 1, the study area is located in southern part of the province, covered an area around 32,000 km2, and bounded by Pakistan and Makran Sea. It includes four cities namely Chabahar, Sarbaz, Konarak, and Nikshahr. There are four perennial rivers, Sarbaz with an average flow rate of 7 m3/s, Kajoo with average flow rate 5 m3/s, Shi Kalak with average flow rate 0.3 m3/s and Kahir with average flow rate 5.5 m3/s. The study area also contains five large existing dams, Kahir Dam (reservoir capacity: 314 × 106 m3), Zirdan Dam (reservoir capacity: 207 × 106 m3), Shi Kalak Dam (reservoir capacity: 10.5 × 10⁶ m3), Land Dam (reservoir capacity: 10 × 106 m3) and Pishin Dam (reservoir capacity: 167 × 106 m3). In terms of climate, Sistan and Balouchestan province can be considered a desert. There is virtually no rainfall all year long in Sistan and Baluchestan. These regions are arid and semi-arid and continuity of multi-year droughts and low level of precipitation during recent years has caused water shortages. Köppen and Geiger have classified this location as BWh [59].

2.2. Data Description

Based on the literature and the experts’ opinions, we considered the following criteria: Soluble Sodium Percentage (SSP), Total Dissolved Solid (TDS), Potential of Hydrogen (PH), Electrical Conductivity (EC) of water, Geology, Land use, Sediment, Erosion, Groundwater and Discharge.
The presence of suitable geological conditions at the dam site is one of the most important parameters for locating the dams. For this reason, it is necessary to exclude sites that are ineligible in terms of geology. To do this, we can use assign the least possible weight to areas that are suffer from inappropriate geological conditions for dam construction. In addition, the rapid increase of population and the related constructions, and deforestations have caused severe erosion of soil in most of the interest watersheds. The corresponding erosion in the rivers exacerbates the accumulation of sediment in water reservoirs. Therefore, it is necessary to remove the sites that are inappropriate in term of erosion before the analysis steps are performed. For this purpose, areas with very low erosion are selected as the best regions, and the worst area is allocated to the worst erosion rate.
The purpose of this research is to find the best places to construct a dam for drinking and irrigation of agricultural areas. For this reason, water quality data should be weighed for this purpose and weighed. In terms of agriculture, the most important qualitative criteria in agriculture classification are salinity and the amount of sodium. Because these two do not only affect the growth of the plant, it also determines the degree of water eligibility for irrigation and its effect on soil permeability. The salinity is measured using the standard of electrical conductivity and sodium with the standard solution of sodium solution. Therefore, we collected the following data: SSP, TDS, PH, and EC of water in the interest area.

2.3. Choosing Appropriate Sites Based on Topography and Valley Shape

A dam is naturally connected to an environment. Accordingly, the morphology of the river valley plays a crucial role in the choice of a dam site. If we ignore the use of reservoirs for recreational purposes, the main criterion influencing the dam location is reservoir capacity; thus, the best site will be a narrow site where the valley widens upstream of the proposed dam. The objective is to find sites which are located in a narrow valley and have a suitable volume of water available for irrigation and drinking-water supply.

2.4. Creating a Prediction Surface for Datasets

Visiting every location in a study area to evaluate the height, size, or concentration of a phenomenon is not usually practicable. Instead, scattered sample input point locations can be selected, and a value can be predicted and assigned to all other locations. Creating an elevation surface from a set of sample measurements in which each point represents a location where the elevation has been measured is a typical use for point interpolation. There are many different methods which can be used to interpolate values from a set of data points. All methods rely on the similarity of nearby sample points to create the surface [60]. In this section, a comparative study is made between the three most common spatial interpolation techniques including Inverse Distance Weighted (IDW), Spline, and Kriging. These techniques are applied for each set of data points, including sediment, groundwater, PH, SSP, TDS, EC and discharge. Then, the errors of all aforementioned techniques are analyzed, and the best method is chosen based on the minimum Mean Absolute Deviation (MAD). The mean absolute deviation is the average of all absolute errors and is given by:
M A D = n 1 i 1 n | y i y ^ i |
where y ^ i denotes predicted value, y i is observed value, n is the number of data points [61]. After calculating the MAD for all seven datasets, the best interpolation method is chosen based on the minimum MAD and then a raster surface is created from each dataset. Interventionary studies involving animals or humans, and other studies require ethical approval must list the authority that provided approval and the corresponding ethical approval code.
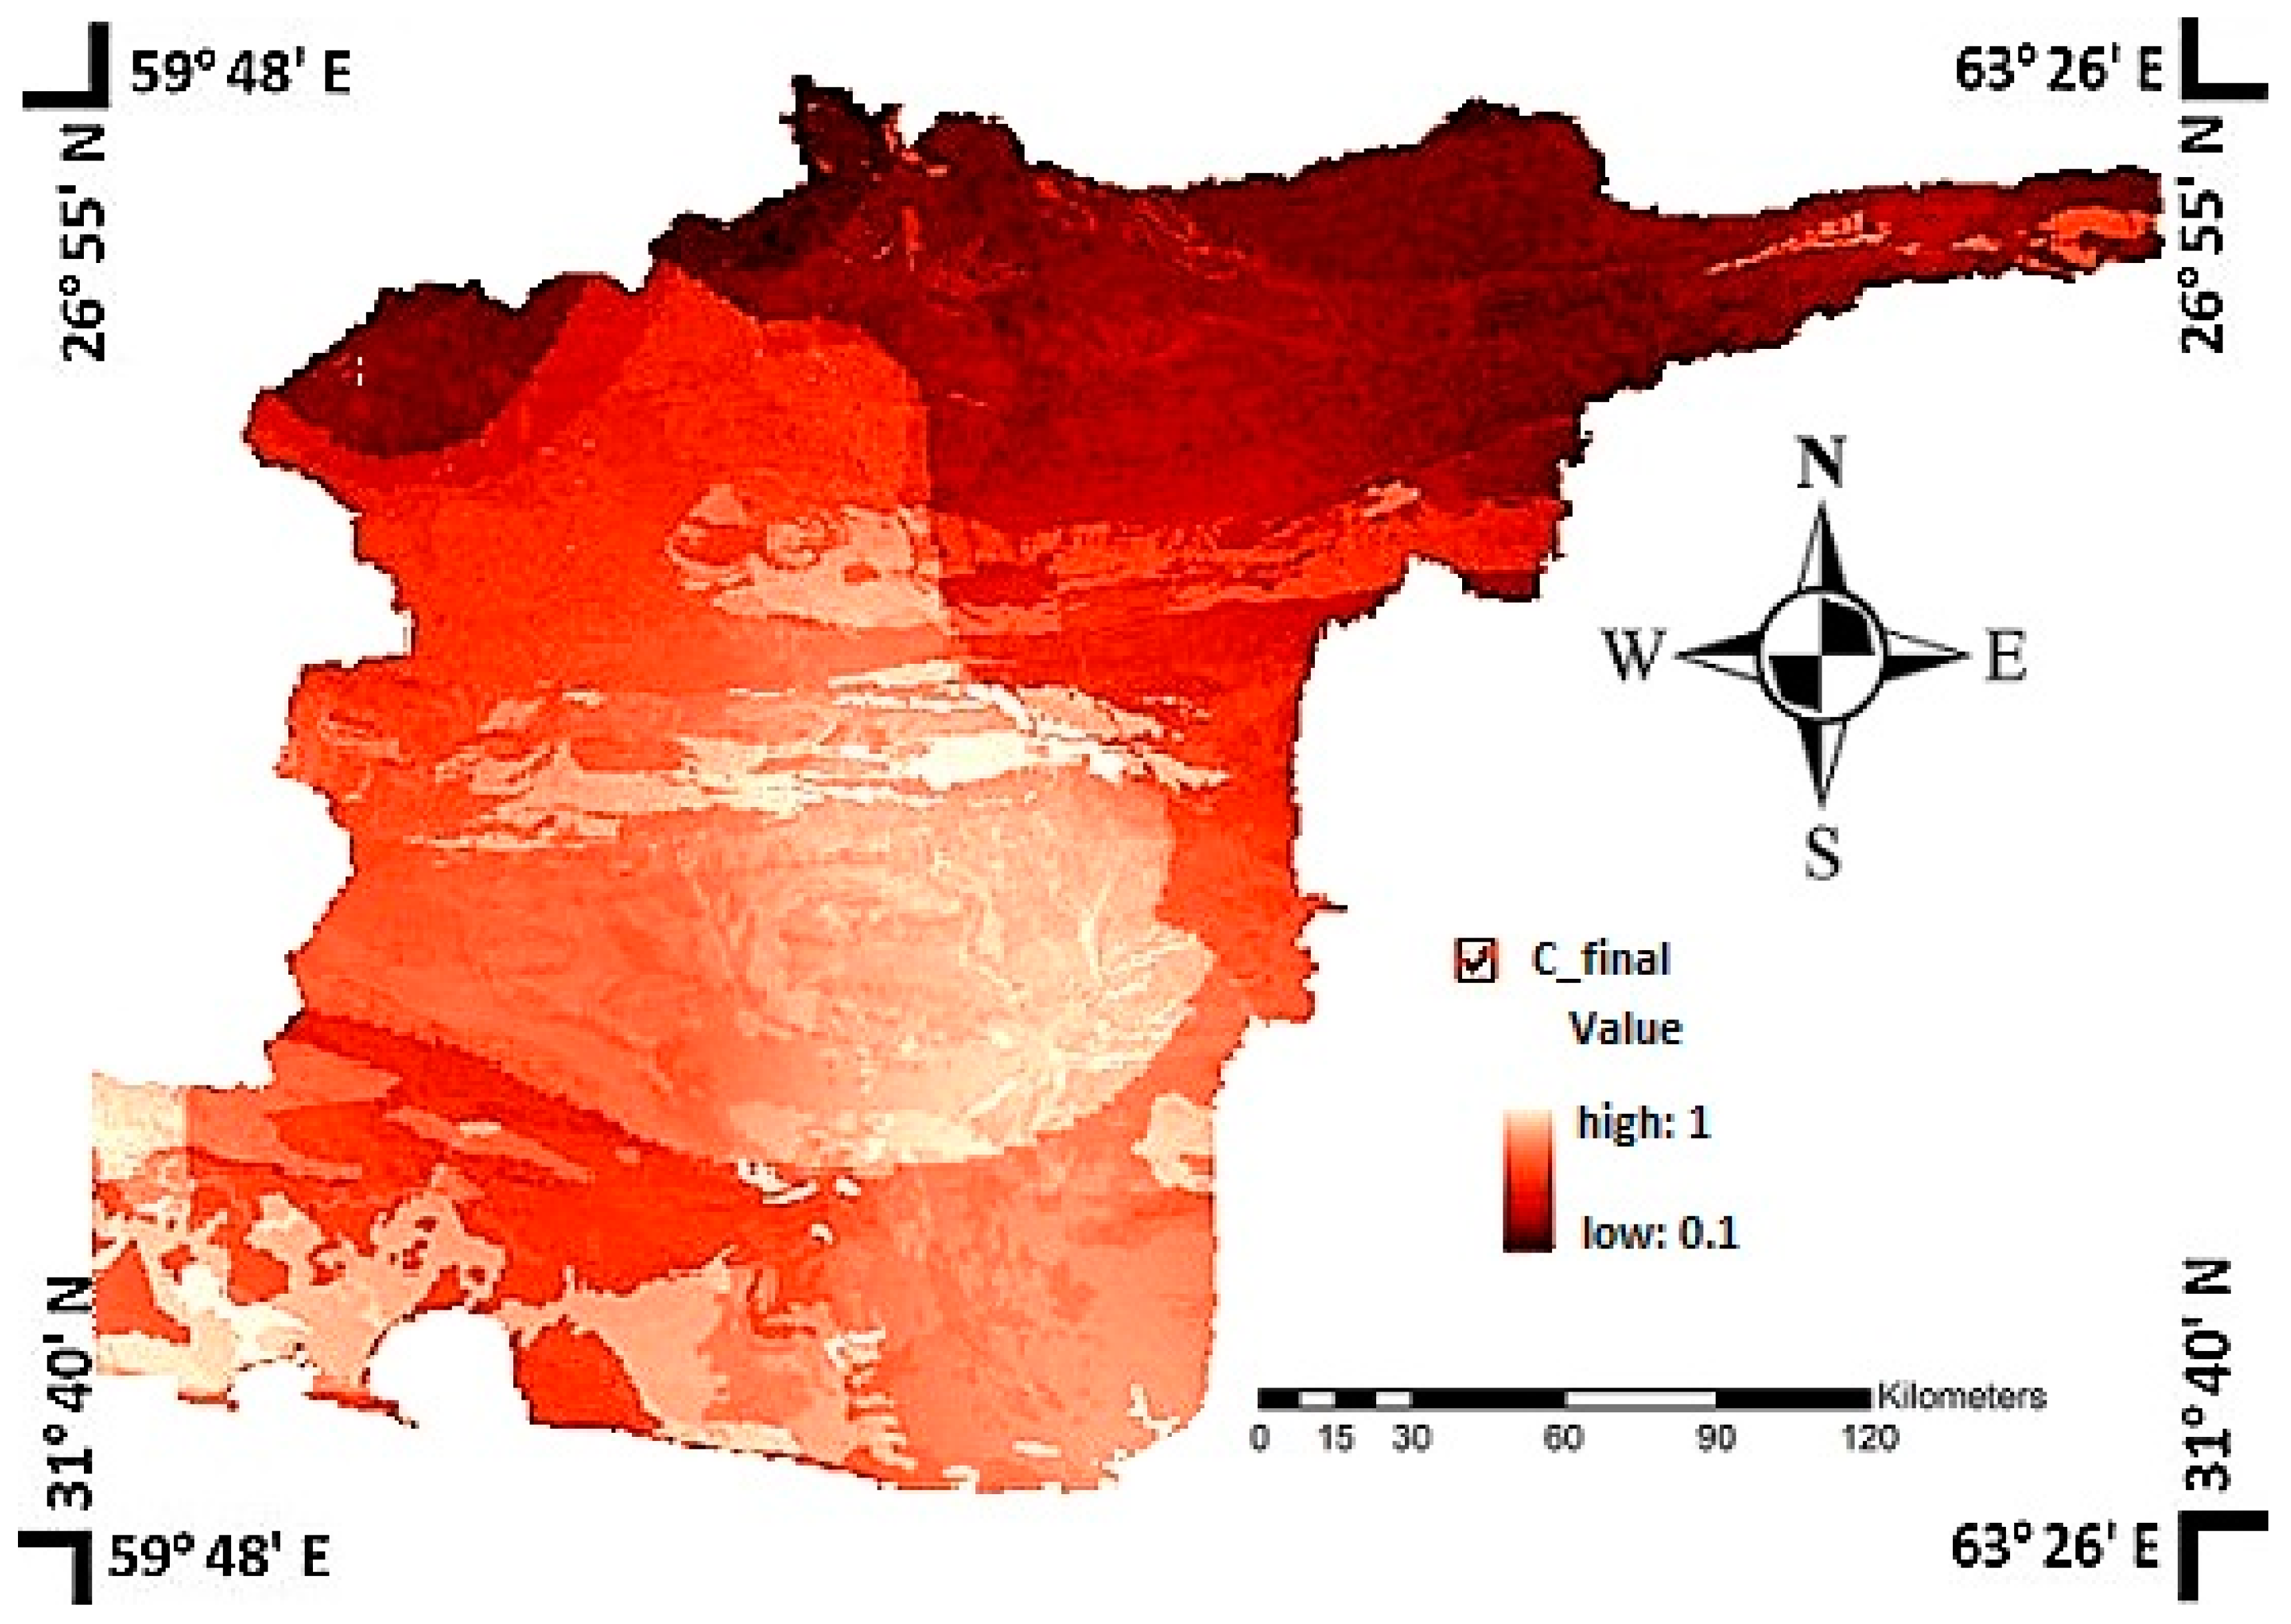
2.5. TOPSIS

The TOPSIS technique was developed by Hwang and Yoon in 1981, and it is a pragmatic method for dealing with real life MCDM problems [11]. It helps decision-makers and engineers compare and rank a set of alternative decisions. In this method, ranking of alternatives is based on the shortest distance from the ideal solution and the farthest from the negative ideal solution. The TOPSIS procedure comprises the following steps [62]:
• Step 1: Determination of the weight of criteria and construction of the decision matrix
The first and foremost step in the TOPSIS algorithm is creating a decision matrix and determining the weight of criteria. Weighting the criteria, all of which in this study have been determined in GIS layers, is one of the most important and complicated steps of the MCDM methods [63]. In this step, relative weights must be assigned not only to each criterion but to its quantitative and qualitative values based on their importance. Since weighting the criteria is the main step in the decision-making process, a high precision is required to determine weights for each criterion and its values. There are a variety of methods which have been proposed to determine weights in MCDM methods. Tzeng et al. (1998) classified weighting approaches into subjective or objective [64]. The weights in the subjective methods are determined based on preference information of criteria, subjective opinions and decision-maker’s knowledge. However, the objective approaches select the weights of criteria based on a mathematical calculation. In this study, the Ratio Estimation procedure, which is a subjective method, is adopted to decide the relative importance of weights of attributes and criteria based on the opinion of experts. In this method, an arbitrary highest weight is assigned to the most important criterion. Correspondingly, smaller weights are assigned to the remaining 8 criteria with lower order until a score is assigned to the least important criterion. The ratio is calculated by dividing each weight to the lowest weight. The ratio, therefore, is equal to wj/w*, where w* is the lowest score assigned to the least important criterion and wj is the score for the jth criterion. Finally, the weights are normalized by dividing each one by the total [65]. In the next step, a decision matrix X = (xij) is constructed using GIS and the ratio estimation procedure, where x i j .
• Step 2: Calculation of the normalized decision matrix
Generally, there are benefit attributes and cost attributes in an MCDM problem. To transform various attribute dimensions into non-dimensional units and facilitate inter-attribute comparisons, several known standardized equations are introduced to normalize each attribute value xij in decision matrix X = ( x i j ) m × n . The following equation is the most frequently used method of calculating the normalized value rij [66]:
R = ( r i j ) m × n = A 1 A 2 A m u 1 u 2 u n ( r 11 r 12 r 1 n r 21 r 22 r 2 n r m 1 r m 2 r m n )
where
r i j = x i j / i = 1 m ( x i j ) 2
For benefit attribute x i j , i M , j N
r i j = 1 ( x i j / i = 1 m ( x i j ) 2 )
For cost attribute x i j , i M , j N .
All criteria, which have been introduced in the GIS layers, including Soluble Sodium Percentage (SSP), Total Dissolved Solid (TDS), Potential of Hydrogen (PH), Electrical Conductivity (EC) of Water, Geology, Land Use, Sediment, Erosion, Slope, Groundwater and Discharge, are transformed to non-dimensional attributes using Equations (3) and (4).
• Step 3: Calculation of the weighted normalized decision matrix
In the third step the weighted normalized value vij is calculated by multiplying the normalized decision matrix by the normalized weights of criteria:
v i j = w j × r i j
where i = 1, …, m; j = 1, …, n, m is the number of attribute value in each criterion, n is the number of criteria, and wj is the normalized weight of the jth criterion, w j = W j j = 1 n W j so that j = 1 n w j = 1 , Wj is the original weight assigned to each criterion.
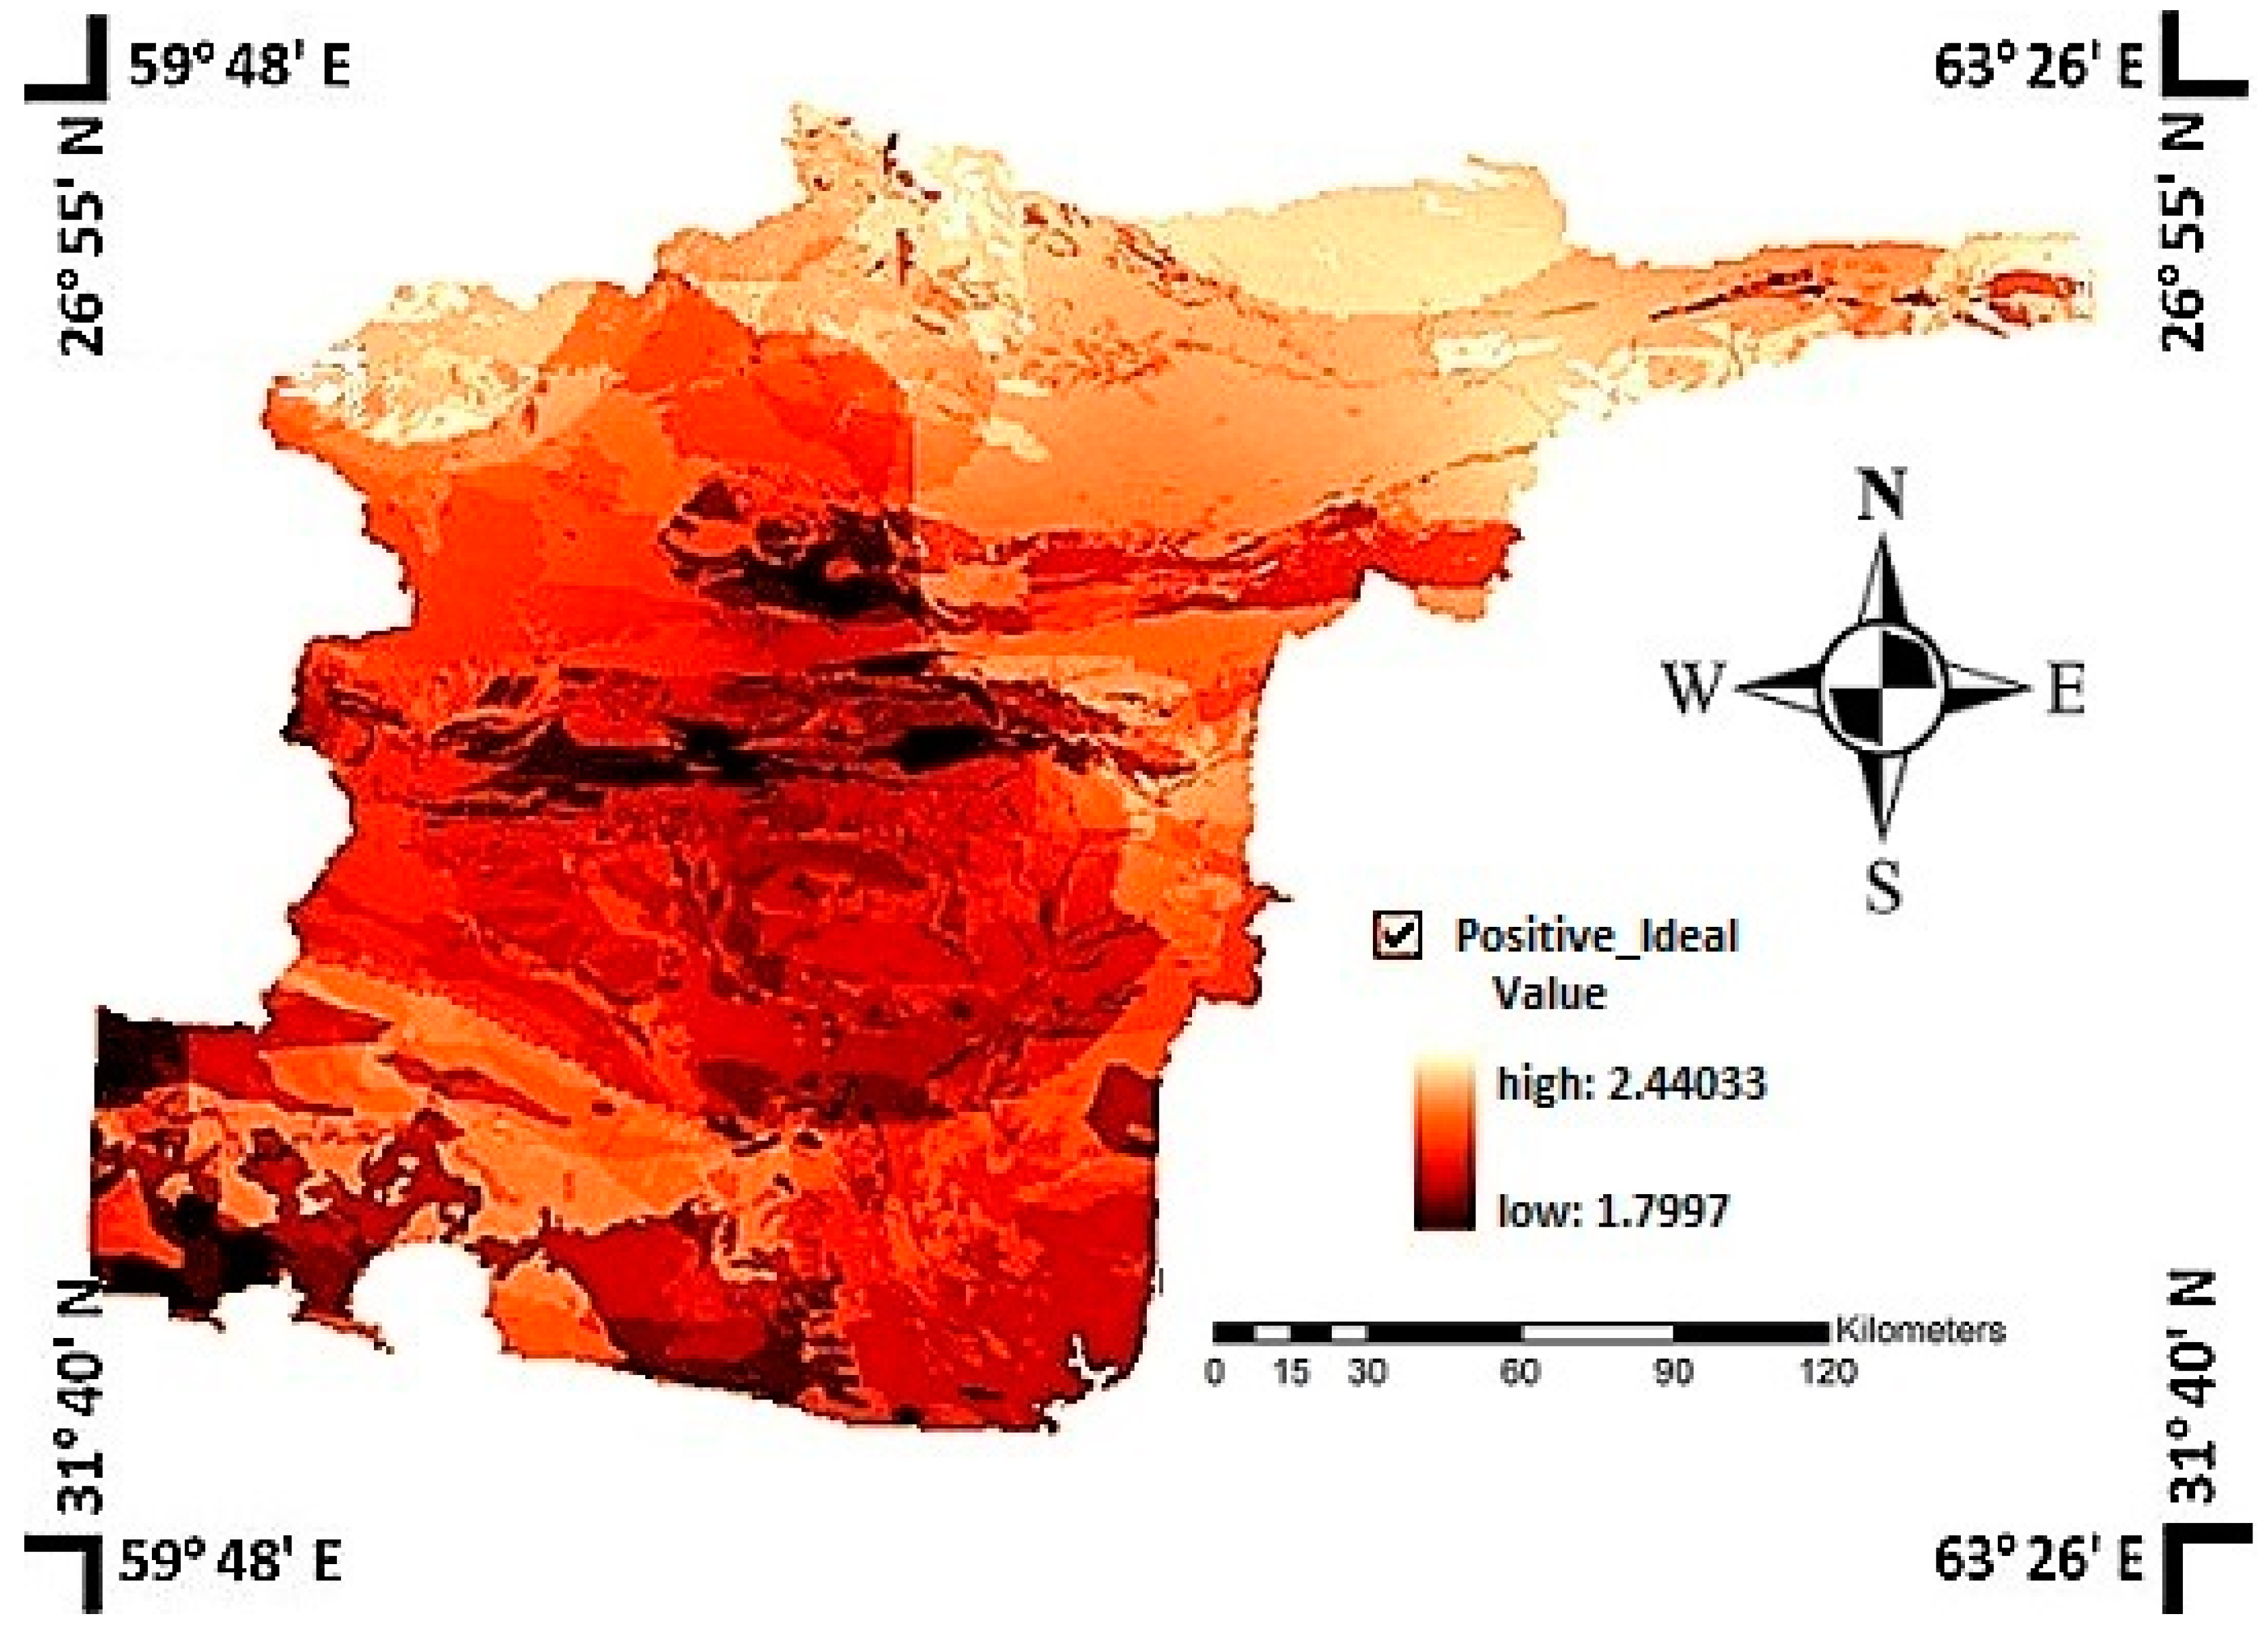
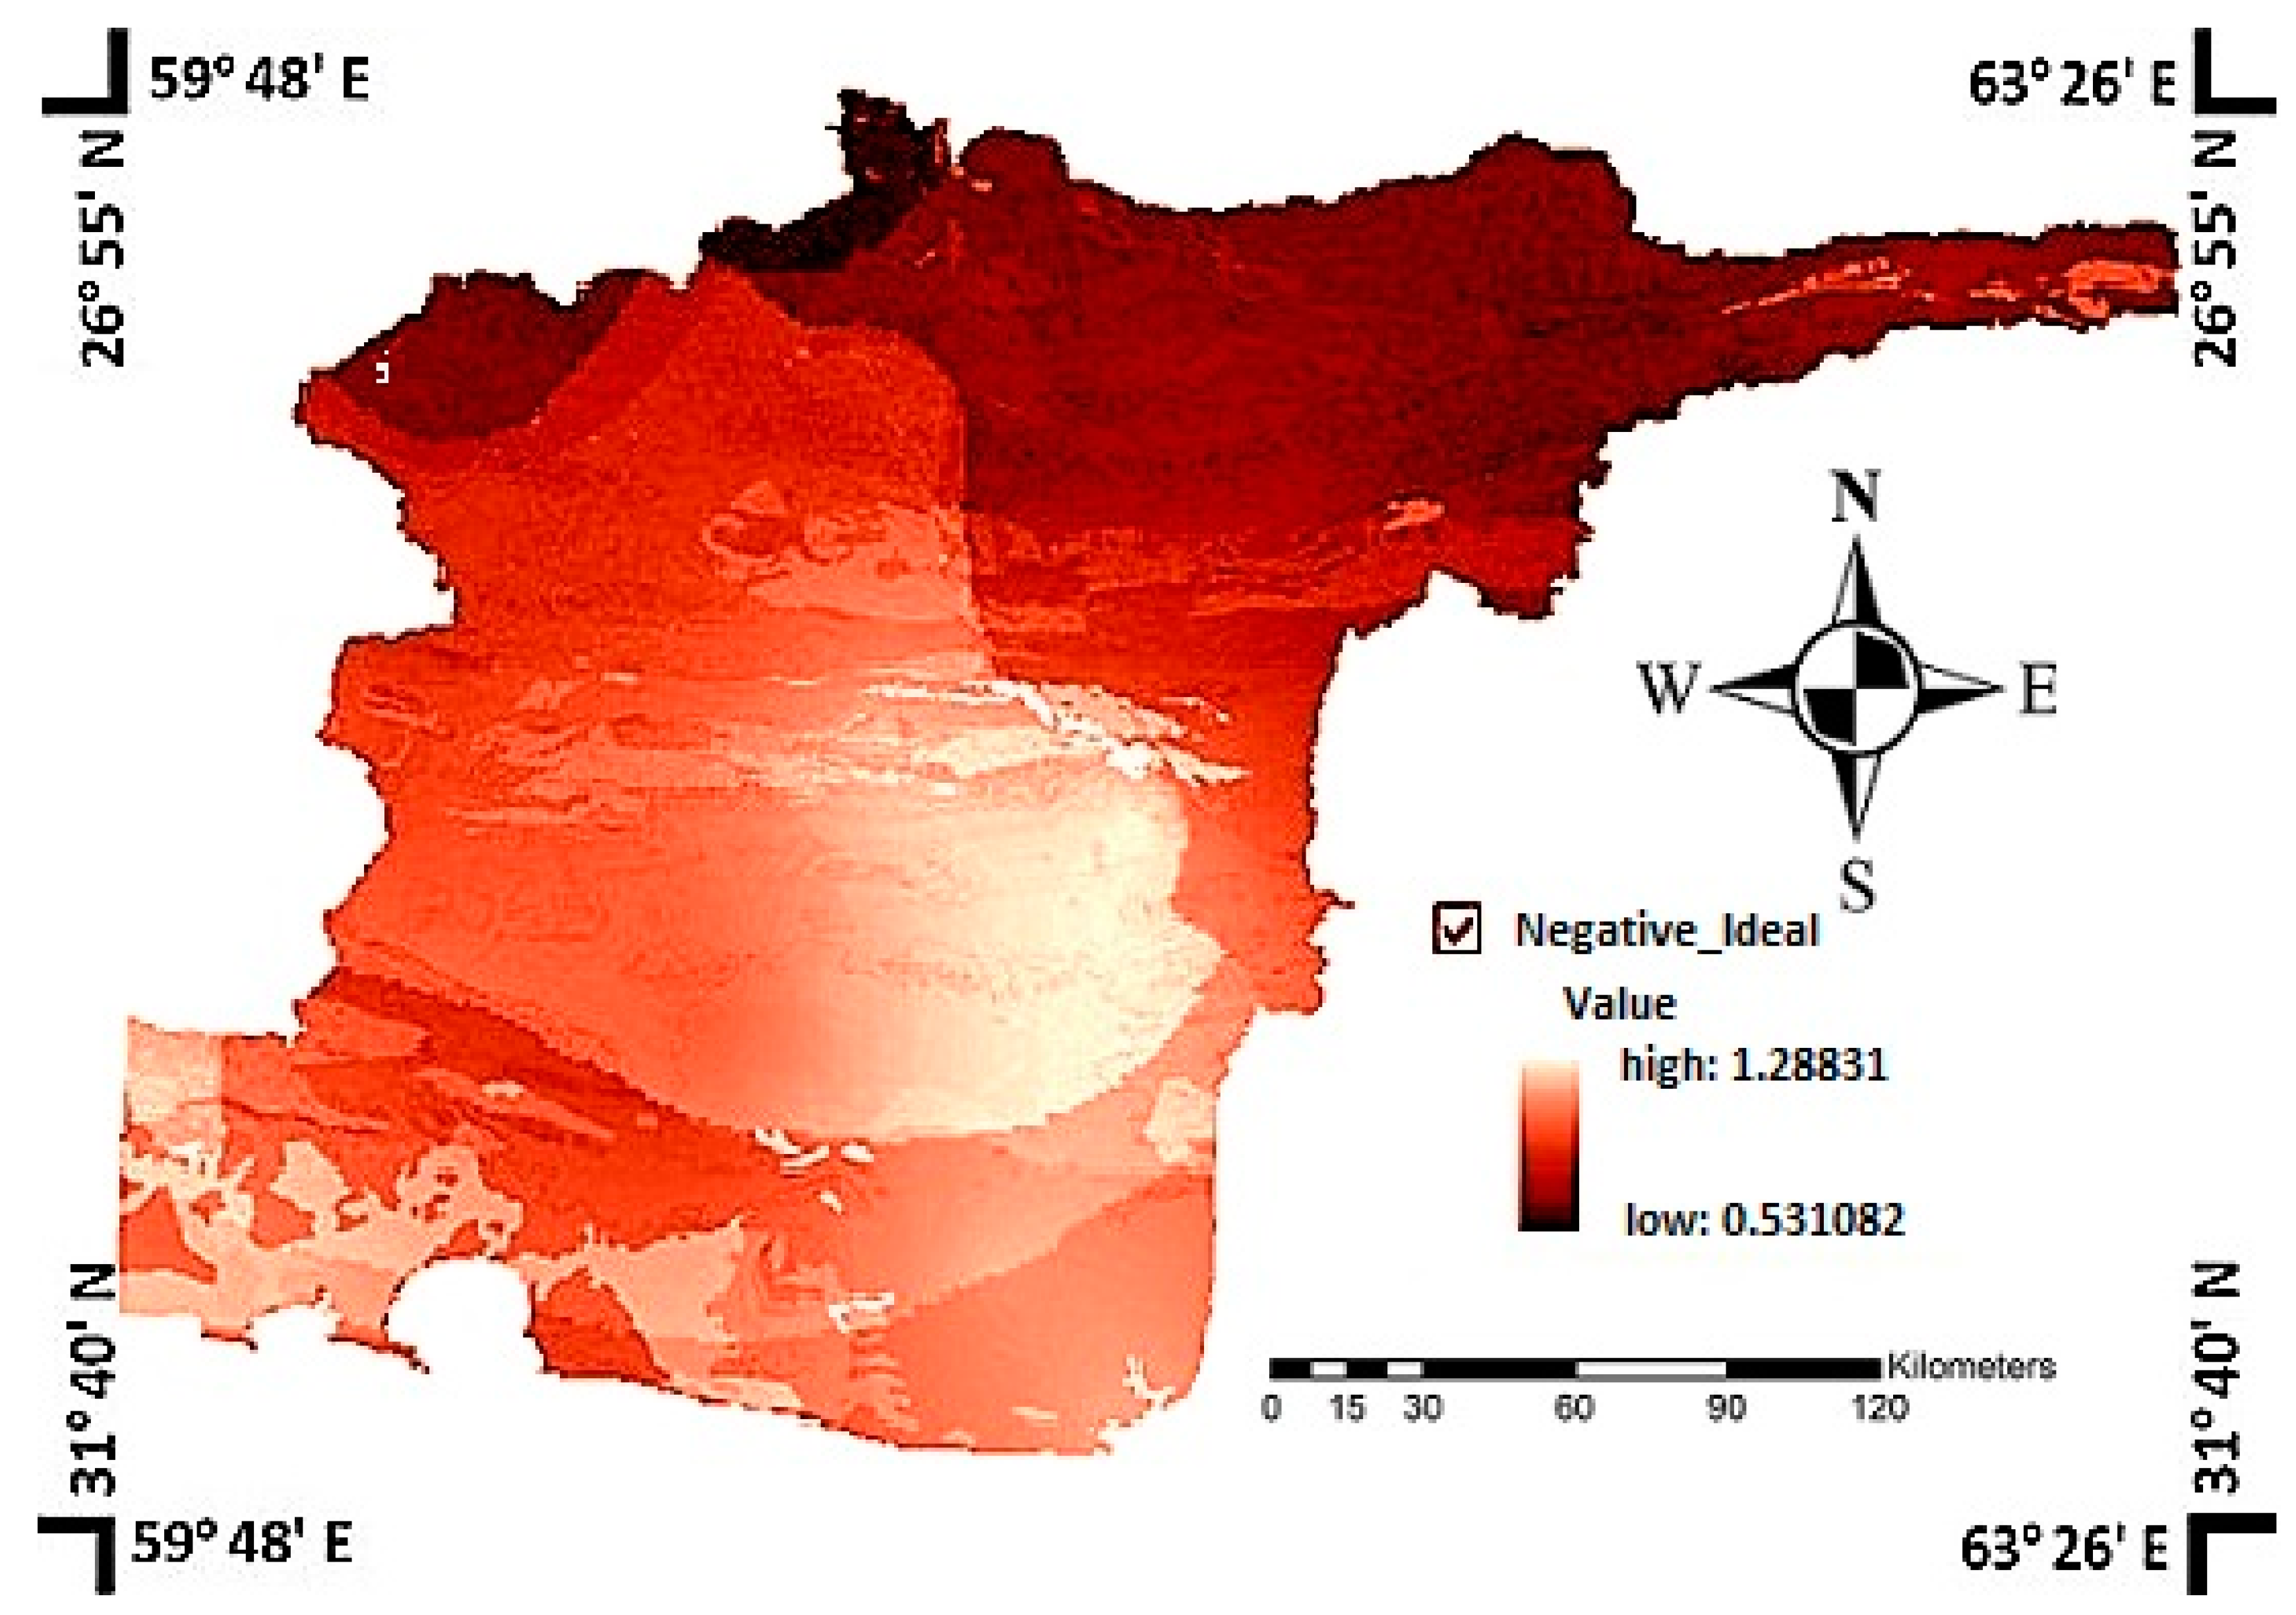
• Step 4: Determination of the positive ideal solutions and negative ideal solutions
The positive ideal solution minimizes the cost criteria and maximizes the benefit criteria; on the contrary, the negative ideal solution maximizes the cost criteria and minimizes the benefit criteria. The equations are as follows:
A + = [ v 1 + , , v j + , , v n + ]
A = [ v 1 , , v j , , v n ]
where A + denotes the positive ideal solution and A denotes the negative ideal solution and
{ v j + = max i { v i j } i = 1 , 2 , , m v j = min i { v i j } i = 1 , 2 , , m if   the   j th   criterion   is   a   beneficial   criterion
{ v j + = min i { v i j } i = 1 , 2 , , m v j = max i { v i j } i = 1 , 2 , , m if   the   j th   criterion   is   a   cos t   criterion
where v i j denotes the attribute values of each cell for the jth layer.
• Step 5: Calculation of the separation of each alternative from the positive ideal solution and the negative ideal solution
In this step, the separation of each alternative from the positive ideal solution and the negative ideal solution is calculated and then two different GIS layers S i + and S i are created. The equations are as follows.
The separation from the positive ideal solution for each alternative is given as:
S i + = j = 1 n | v i j v j + | = j = 1 n D i j +
The separation from the negative ideal solution for each alternative is given as:
S i = j = 1 n | v i j v j | = j = 1 n D i j
• Step 6: Calculation of the relative closeness to the positive ideal solution
The relative closeness of the i-th alternative Aj with respect to the positive ideal solution can be calculated as:
C i + = ( S i ) / ( S i + + S i )
where 0 C i + 1 , i = 1, 2, …, m.
• Step 7: Determination of the rank of the alternatives according to the relative closeness
In last step, the values of “the relative closeness to the positive ideal solution” layer created in step 6 are determined for sites selected based on topographical conditions. A set of sites can now be ranked by the descending order of the value of C i + . The best sites are those that have higher values of C i + and since they are closer to the positive ideal solution, they are preferable and must be chosen [67].

2.6. Analytic Hierarchy Process

The Analytic Hierarchy Process (AHP), developed by Thomas Saaty [10], is an effective method for dealing with complex decision-making. This method helps decision-makers set priorities between alternatives, sub-criteria and criteria in the decision-making process and also helps them to make the best decision [48]. The following are the main steps of the AHP methodology [10]:
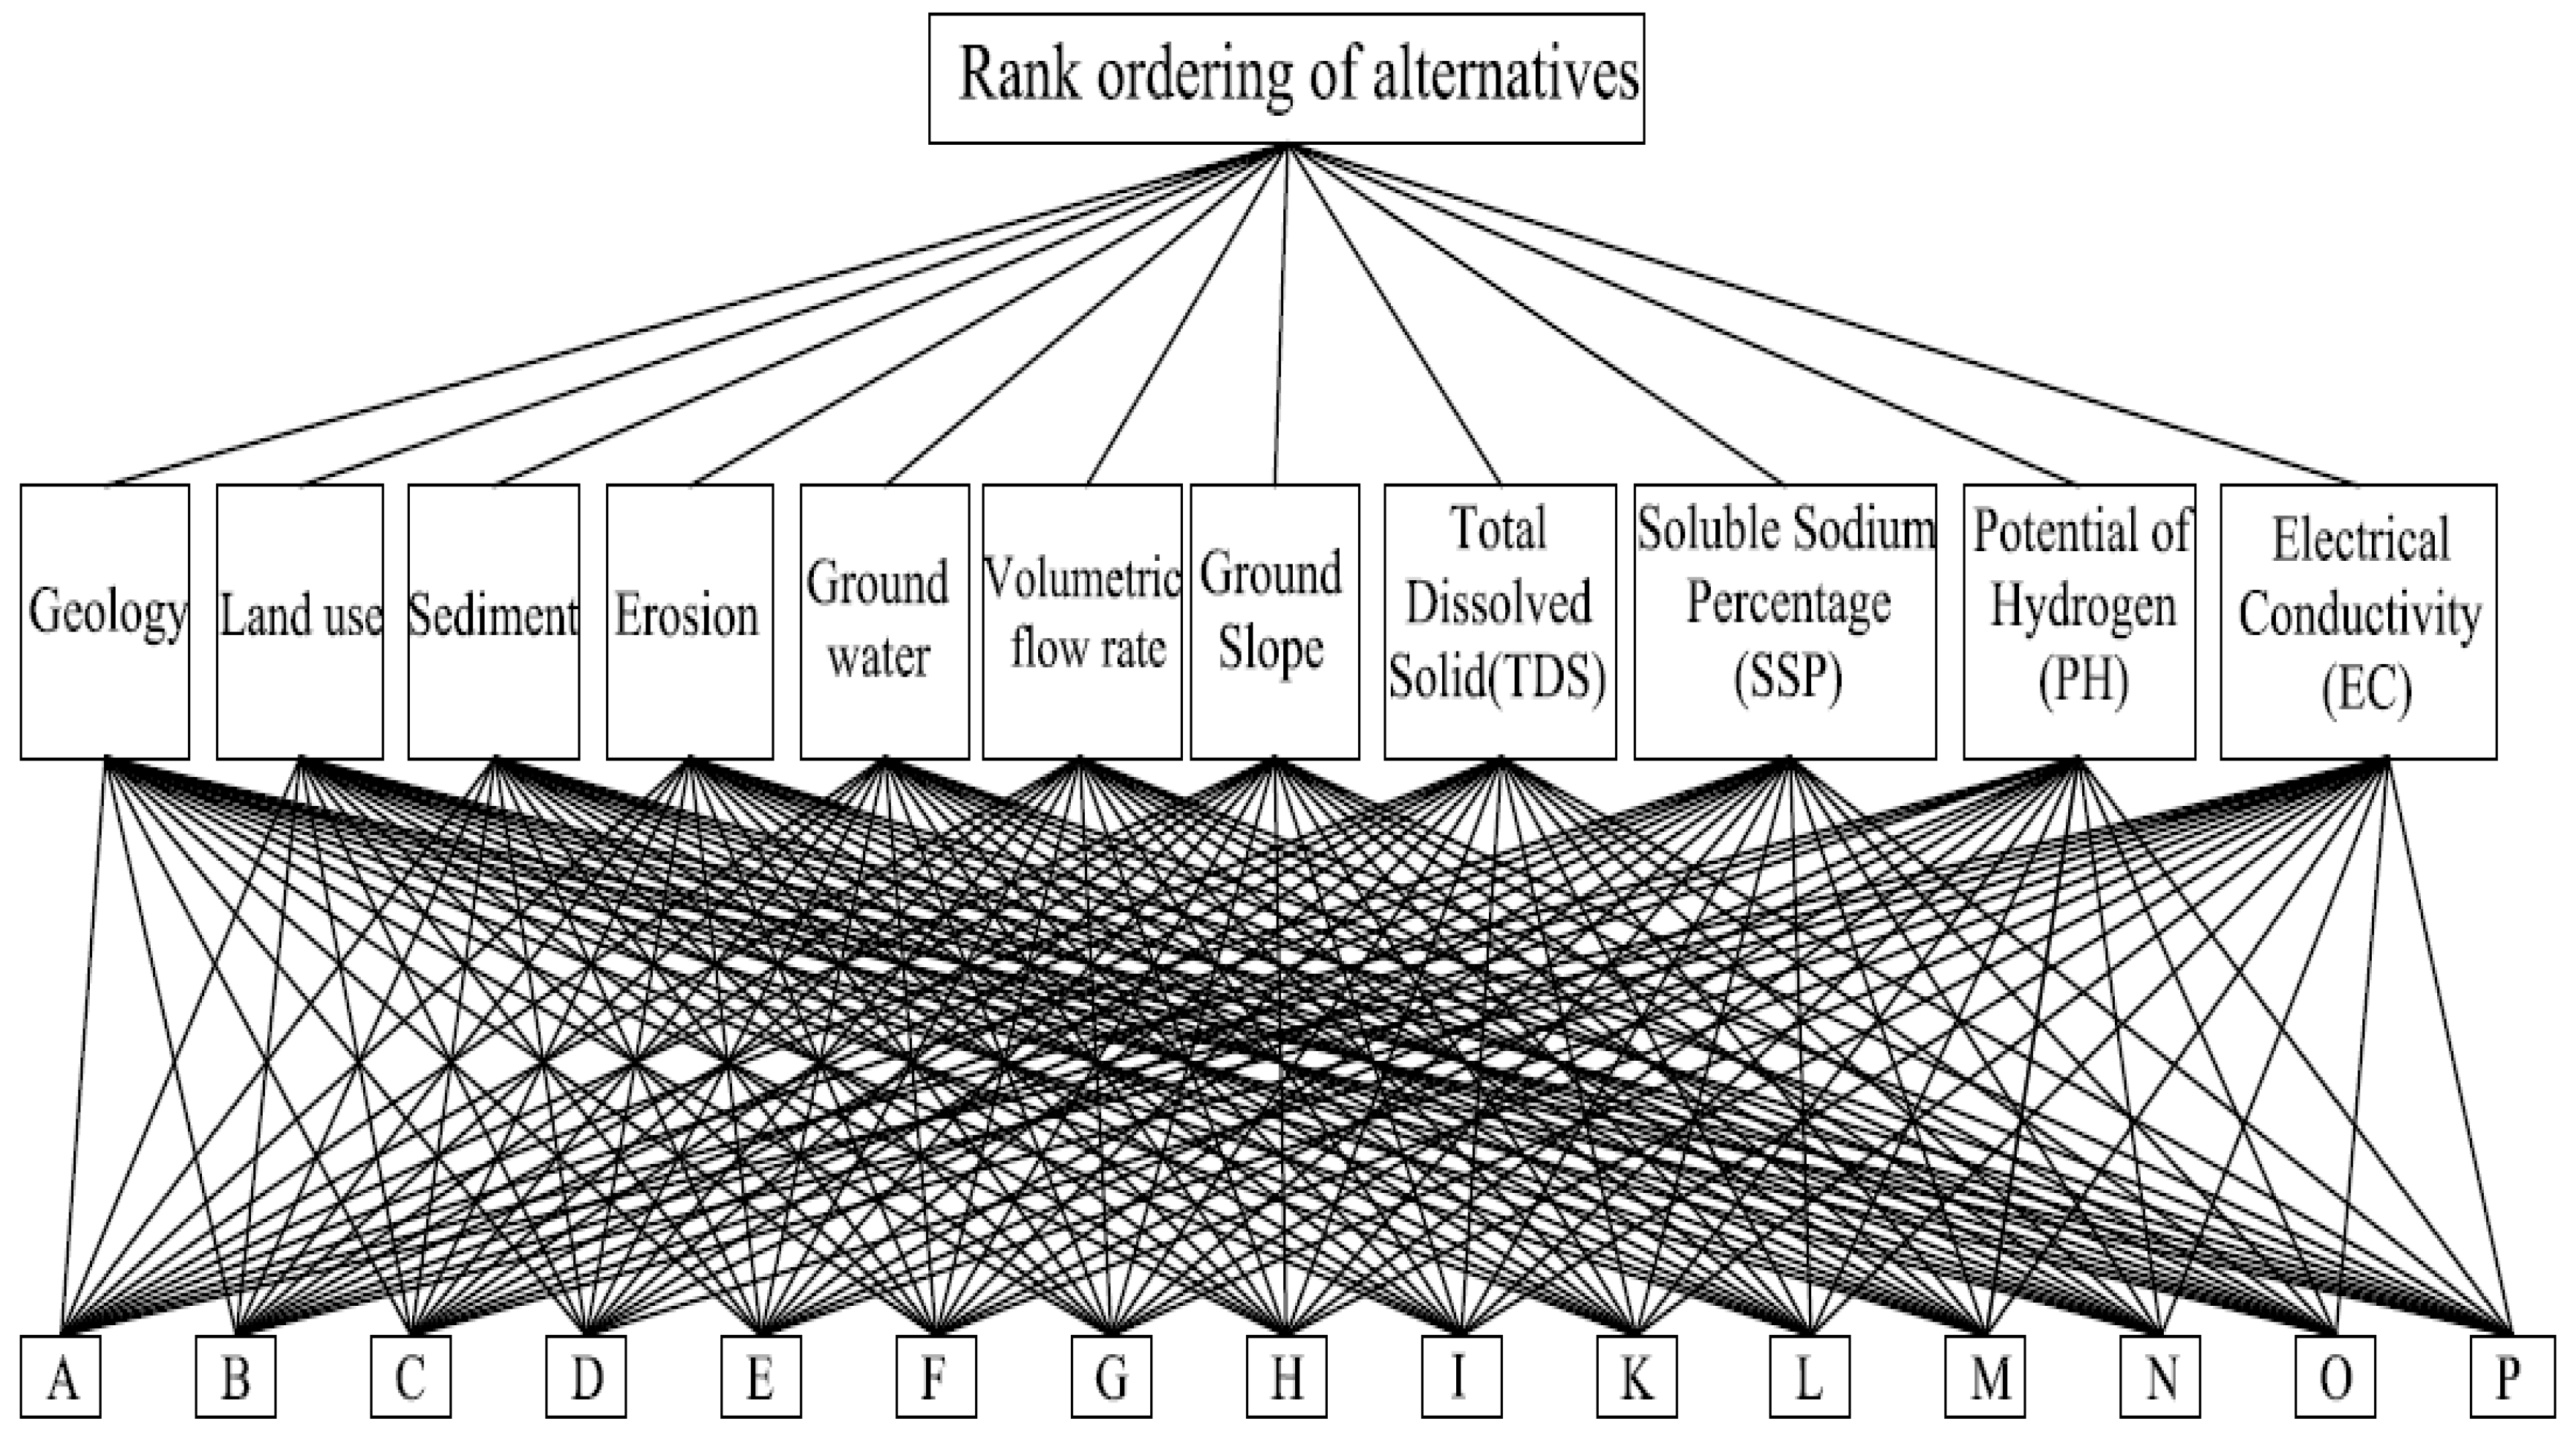
• Step 1: Determination of the objective, main-criteria, sub-criteria, alternatives and structure of the hierarchy
This is the main part of the decision-making process, since structuring the decision problem as a hierarchy is fundamental to the process of the AHP. The aim of this study is the rank-ordering of selected sites, based on the mentioned criteria. Figure 2 shows the hierarchy structure for this process.
• Step 2: The pairwise comparison of the criteria with respect to the goal
To calculate the weights for various criteria, the AHP method creates a pairwise comparison matrix A (an m × m real matrix) as follows:
A = ( a 11 a 12 a 1 k a 1 m a 21 a 22 a 2 k a 2 m a j 1 a j 2 a j k a j m a m 1 a m 2 a m k a m m )
where ajk represents the importance of the j-th criterion relative to the k-th criterion. The j-th criterion is less important than the k-th criterion provided that a j k < 1 . In contrast, the j-th criterion is more important than the k-th criterion if a j k > 1 . As long as two criteria have the same importance, the entry ajk is 1. The pairwise comparison is based on the advice of experts based on questions concerning which criterion is more important with regard to the decision goal, and the relative importance between two criteria is measured according to a numerical scale from 1 to 9 as generated by Saaty (1980) [10]. Once the matrix A is built, the normalization process is implemented simply by (i) calculating the geometric mean of the i-th row, and (ii) normalizing the geometric means of rows in the comparison matrix. This can be represented as:
GM i = [ j = 1 n a i j ] 1 / n i = 1 , , m j = 1 , , n
w i = ( G M i ) / ( i = 1 m G M i ) i = 1 , , m
Finally, the criteria weight vector w is built.
• Step 3: The pairwise comparison of the alternatives with respect to the criteria
The pairwise comparisons of the alternatives provide matrix S (an n × m real matrix), where m is the number of criteria and n is the number of alternatives or sites.
S = ( s 11 s 12 s 1 j s 1 m s 21 s 22 s 2 j s 2 m s i 1 s i 2 s i j s i m s n 1 s n 2 s n j s n m )
where sij represents the value of the i-th alternative with respect to the j-th criterion, n is the number of alternatives, m is the number of criteria. To construct matrix S, first, a pairwise comparison matrix is built for each of the m criteria, called B ( j ) , which is an n × n real matrix. Each entry b i k ( j ) of the matrix B ( j ) represents the evaluation of i-th alternative in comparison to the k-th alternative with respect to the j-th criterion. Once the matrix B ( j ) is built, the same two-step procedure described for the pairwise comparison matrix A are conducted for the normalization process. Finally, the pairwise comparisons of the alternative matrix S is built.
• Step 4: Calculation of priority vectors
A vector v of global values is created by multiplying S and w, where S is the pairwise comparisons of the alternatives matrix and w is the criteria weight vector.
v = S × w
• Step 5: Calculation of the consistency ratio (CR)
In the AHP approach, the pairwise comparisons in a judgment matrix are considered to be adequately consistent if the corresponding CR is less than 10% [10]. To calculate the CR coefficient, a Consistency Index (CI) is defined which is computed as follows:
( C I ) = ( λ max n ) / ( n 1 )
where λmax is the maximum eigenvalue of the pairwise comparison matrix.
According to Saaty’s theorem, for a given positive matrix A, the only positive vector x and only positive constant c that satisfy Ax = cx, is a vector x that is a positive multiple of the Perron vector (principal eigenvector) of A, and the only such c is the Perron value [68] (principal eigenvalue) of A [69]. Saaty calculates λmax by adding the columns of matrix A and then multiplying the resulting vector with the vector x. The CR coefficient is calculated by dividing the CI value by the Random Consistency Index (RCI) as given in (Table 2).
C R = C I / R C I If   CR < 10 % ,   achieved   data   is   consistent    If   CR 10 % ,   achieved   data   is   inconsistent
• Step 6: Analysis of the AHP scores
If the model is consistent, the best alternative will be chosen based on the matrix calculated in Step 4.

3. Results

3.1. TOPSIS Outputs

To implement TOPSIS in our study, the first task consists of checking the routes of streams using a Digital Elevation Model (DEM) layer and finding locations that are suitable for constructing a dam based on the valley shape. At this step, 16 points (A to P) that meet the aforementioned conditions are chosen. Then, the volume of water that can be stored in the basin is calculated for each selected location based on the crest length. Also, the minimum storage volume and maximum crest length are assumed to be 10 × 106 m3 and 1.5 km, respectively. Table 3 shows the crest length and storage volume based on the maximum possible height of the dam. Among the introduced points, J does not satisfy the above condition in terms of storage volume. Therefore, we do not consider this point as a potential site for constructing a dam. Figure 3 displays the location of the remaining 15 points in the study area.
Then, the Mean Absolute Deviation (MAD) for the three interpolation methods is calculated. The results for the sediment dataset are shown in Table 4, and it can be found that the exponential kriging provides the lowest MAD and hence can be considered the best interpolation method for the dataset. The applied methods for each criterion are shown in Table 5. All datasets show the lowest MAD in the kriging method, which shows its superiority over the IDW and Spline methods. The weight for each criterion is determined using the TOPSIS algorithm based on expert opinions. Table 6 shows the weights for all the available criteria. As can be seen, volume flow rate and groundwater level are considered the most and least important criteria, respectively.
According to the equations applied in step 4 in TOPSIS algorithm, the positive ideal solution ( A + ) and negative ideal solution ( A ) are calculated for all criteria, and then a layer is created for each v j + and v j . The positive ideal solution and negative ideal solution for each criterion are presented in Table 7. The separation of each alternative from the positive ideal solution layer and the separation of each alternative from the negative ideal solution layer are calculated based on Equations (8) and (9), respectively. Figure 4 and Figure 5 show these two separation layers.
According to Equation (10), a new layer which indicates the relative closeness to the positive ideal solution is created, as shown in Figure 6. The value of each pixel in this figure indicates how suitable the location is for constructing a dam site. The maximum value shows the best location for the construction, while the minimum value is an indication of the worst location to build a dam. The left-hand side area, which is shown as a brighter color, is a preferable location for dam construction compared to the northern part of the study area.
As mentioned earlier, constructing a dam requires a narrow valley. Therefore, only the 15 points selected are considered as potential dam site locations, and they are ranked based on the C i + value. Table 8 shows the C i + value and ranking of these points.
According to the Ci values calculated by the TOPSIS method, the ranking of five existing dams from the most preferable to the least preferable was Kahir, Shi Kalak, Land, Zirdan and Pishin. If the single best location were to be selected, then Kahir Dam must be chosen, since it has the highest Ci value. As shown in Table 8, four actual dams—Kahir, Shi Kalak, Land and Zirdan—are among the top five locations in the study area. The B location is fourth in this ranking; however, it is not the best site for construction of a dam on the Kahir river, since compared to B, the A location, which represents Kahir Dam, has a higher value of Ci. Analysis results by the TOPSIS method indicate that the Pishin Dam, represented by N in this study, is 11th among the 15 selected alternatives; hence, it can be concluded that this dam does not satisfy the criteria mentioned in this study. However, there are no other options fulfilling the topographical and morphological conditions on that river that can be selected.

3.2. AHP Outputs

The pairwise comparison matrix of criteria (Matrix A) is created using the AHP method to calculate the weights for each criterion. As can be seen in Table 9, discharge, slope and geology are the most important criteria, as they have the highest weights, and groundwater is the least important one, among others. The pairwise comparisons of the alternatives (Matrix S) are built based on selected sites and criteria (see step 3 in AHP algorithm for more details). Table 10 shows the S matrix. By multiplying the alternative matrix (Table 10) and weight vector (Table 9), the priority vector v, which assigns values to each site based on AHP method, is created, as shown in Table 11.
Using Equation (16) and Table 12, CI and RCI values for each matrix are obtained, respectively. Finally, using Equation (17), CR values are calculated, as shown in Table 13. CR values are less than 10%, an indication of the consistency of all pairwise comparison matrices (see step 5 in AHP algorithm for more details).
Ranking of the dams according to the calculations based on the AHP technique are as follows: Land Dam, Shi Kalak Dam, Kahir Dam, Zirdan Dam and Pishin Dam. The best actual dam based on the AHP method is the Land Dam, as presented in Table 13. Since there are two other alternatives, B and C, on the Kahir river that have a higher score than Kahir Dam, A, it can be inferred that the results achieved from the AHP technique, unlike TOPSIS, are not sufficiently accurate, but nevertheless, results from the AHP method show that the Pishin Dam is 11th among the 15 selected alternatives.

4. Discussion

In the academic literature, there is limited discussion of the dam site selection problem, despite the fact that it represents a very important strategic decision. Generally, dam site selection is performed by traditional methods of decision-making or on the basis of political interests. Cost and resource availability are two important factors in the traditional decision-making approach; accordingly, a location near to a mine or water source may be selected without making a holistic and systematic analysis. In this context, within the scope of the study, a comparative study of the TOPSIS and AHP models using GIS is proposed to determine the most appropriate locations for constructing dams in Sistan and Baluchestan Province, Iran.
The approach considers topographical conditions in addition the factors Soluble Sodium Percentage (SSP), Total Dissolved Solid (TDS), Potential of Hydrogen (PH), Electrical Conductivity (EC) of water, Geology, Land use, Sediment, Erosion, Groundwater and Discharge. Accordingly, the proposed model for the dam site selection problem consists of four basic steps: (1) selecting possible locations based on topographical and morphological conditions; (2) application of the TOPSIS technique using GIS and prioritizing the sites selected in the previous step; (3) application of the AHP method and ranking the sites selected in the first step; and (4) comparing the results of the TOPSIS and AHP models.
It should be noted that dam site selection requires detailed studies and tests; so, to evaluate and compare the outputs, we assumed that the location of existing dams are the best ones. It was used to compare TOPSIS and AHP, as an initial calculation, for the future dam site selections, particularly in the study area. In other words, actual locations of constructed dams in the area were used to verify the results of both methods.
Table 14 compares the outputs of TOPSIS and AHP and shows the same results for the following choices: D, E, G, K, N, O, and P (7 from 15 locations or around 47% similarity). According to the results of the TOPSIS method, four actual dams—Kahir, Shi Kalak, Land and Zirdan, respectively—are the best sites for building a dam in the region. There are three selected sites, A, B and C, on the Kahir river, with the Kahir Dam (A) being the best location among them. The most suitable location among the five sites selected based on the introduced criteria, E, F, G, H and D, is the Zirdan Dam, which is shown by the H character. However, there are no options for the Land Dam, Shi Kalak Dam and Pishin Dam on their rivers. According to the AHP method, the best location in the region for constructing a dam is C, which is located on the Kahir River. In this ranking, four actual dams are not among the top three sites, whereas in the ranking based on the TOPSIS technique, four dams constructed in the area are the best selection. Therefore, it can be concluded that the TOPSIS method may be a more powerful technique compared to the AHP method in the selection of dam sites.
The difference between the results of TOPSIS and AHP in site selection depends on their strengths and weaknesses, which are thoroughly described in the literature [70,71,72,73,74,75,76,77]. For example, the main advantages of AHP over TOPSIS are its flexibility, its intuitive appeal to decision-makers, and its ability to check inconsistencies. Also, users find the pair wise comparison form of data input convenient and straightforward. However, applying AHP leads to the decision problem being decomposed into several subsystems, and so a substantial number of pair wise comparisons need to be filled. In the case of TOPSIS, the non-linear relations between one-dimensional scores and distance ratios results in the consideration of both negative and positive ideal solutions. In addition, in the TOPSIS framework, we can use variables with different units of measurement. However, TOPSIS in its standard and original form is deterministic and does not include uncertainty in the calculations related to final weightings.

5. Conclusions

This study presents the application of TOPSIS and AHP techniques, integrating GIS, in dam site selection in Sistan and Baluchestan Province, Iran. Based on the review of recent studies on dam site selection using MCDM, it can be found that previous researchers have mostly used AHP and TOPSIS in the application of dam site selection. Therefore, we implemented both methods in a study area in Iran to evaluate their capability for dam site selection in a new local context and to compare the results of both methods. Based on previous experience and the literature, we introduced several factors, including geology, land use, sediment erosion, slope, groundwater, discharge, soluble sodium percentage, total dissolved solid, potential of hydrogen, and electrical conductivity of water. After implementing the techniques in the GIS environment, we found relatively suitable sites for dam construction in the area of interest. Finally, as dam site selection requires detailed studies and tests, to evaluate and compare the outputs, we assumed that the locations of existing dams were the best ones. These were used to compare TOPSIS and AHP, as an initial calculation, for the future dam site selections, particularly in the study area. In other words, actual locations of constructed dams in the area were used to verify the results of both methods.
The main conclusions of the present study can be drawn as follows:
  • The results show that the TOPSIS method is better suited to the problem of dam site selection for this study area.
  • Using MCDM could provide an overall view for initial calculations to reduce the expenses and to reach a comprehensive study of dam site selection; however, it is necessary to collect accurate in situ data to provide a comprehensive framework. Dam site selection requires detailed studies and tests; therefore, to evaluate and compare the outputs, we assumed that the location of existing dams were the best ones. These were used to compare TOPSIS and AHP, as an initial calculation, for the future dam site selections, particularly in the study area.
  • In the AHP ranking, four actual dams were not among the top three sites, whereas in the ranking based on the TOPSIS technique, four dams constructed in the area were the best selections. Thus, the TOPSIS method may be a more appropriate technique than the AHP method for locating dams based on the criteria mentioned in this study.
Recommendations for future research:
  • Comparing the sensitivity of TOPSIS and AHP to different types of dams (e.g., embankment dams, concrete dams).
  • Comparing the results of implementing fuzzy TOPSIS and fuzzy AHP with TOPSIS and AHP.
  • Collecting more accurate reports of dam site selection to improve and update the criteria and sub-criteria.
  • Comparing the sensitivity of TOPSIS and AHP to such factors as the complexity in geological characteristics as one of the main keys in dam site selection study.
  • Considering more comprehensive criteria may lead to more accurate results.

Author Contributions

The authors have contributed to this paper at different levels. As the lead author, A.J. conceived and designed the methodology. A.J. along with B.A., M.H. and M.K. contributed equally to manuscript writing and revision. I.F. reviewed the paper and provided helpful comments on improving its quality in all aspects. A.J., B.A., M.H. and E.G.T. contributed equally to analyzing the results of this paper. In addition, finally, N.K., B.A., M.H. and A.J. contributed to the literature review for this paper.

Funding

This research received no external funding.

Conflicts of Interest

The authors declare no conflict of interest.

References

  1. Noori, A.; Bonakdari, H.; Morovati, K.; Gharabaghi, B. The optimal dam site selection using a group decision-making method through fuzzy TOPSIS model. Environ. Syst. Decis. 2018, 38, 471–488. [Google Scholar] [CrossRef]
  2. Beck, M.W.; Claassen, A.H.; Hundt, P.J. Environmental and livelihood impacts of dams: Common lessons across development gradients that challenge sustainability. Int. J. River Basin Manag. 2012, 10, 73–92. [Google Scholar] [CrossRef]
  3. Fearnside, P.M. Environmental and social impacts of hydroelectric dams in Brazilian Amazonia: Implications for the aluminum industry. World Dev. 2016, 77, 48–65. [Google Scholar] [CrossRef]
  4. Shafieardekani, M.; Hatami, M. Forecasting Land Use Change in suburb by using Time series and Spatial Approach; Evidence from Intermediate Cities of Iran. Eur. J. Sci. Res. 2013, 116, 199–208. [Google Scholar]
  5. Mulatu, C.; Crosato, A.; Moges, M.; Langendoen, E.; McClain, M. Morphodynamic Trends of the Ribb River, Ethiopia, Prior to Dam Construction. Geosciences 2018, 8, 255. [Google Scholar] [CrossRef]
  6. Shad, R.; Khorrami, M.; Ghaemi, M. Developing an Iranian green building assessment tool using decision making methods and geographical information system: Case study in Mashhad city. Renew. Sustain. Energy Rev. 2017, 67, 324–340. [Google Scholar] [CrossRef]
  7. Goodchild, M.F.; Parks, B.O.; Steyaert, L.T. (Eds.) The State of GIS for Environmental Problem-Solving; Environmental modeling with GIS; Oxford University Press: New York, NY, USA, 1993; pp. 8–15. [Google Scholar]
  8. Goodchild, M.F. Reimagining the history of GIS. Ann. GIS 2018, 24, 1–8. [Google Scholar] [CrossRef]
  9. Belton, V.; Stewart, T. Multiple Criteria Decision Analysis: An Integrated Approach; Springer Science & Business Media: Berlin, Germany, 2002. [Google Scholar]
  10. Saaty, T. The Analytic Process: Planning, Priority Setting, Resources Allocation; Mcgraw: New York, NY, USA, 1980. [Google Scholar]
  11. Hwang, C.-L.; Yoon, K. Methods for multiple attribute decision making. In Multiple Attribute Decision Making; Springer: Berlin, Germany, 1981; pp. 58–191. [Google Scholar] [CrossRef]
  12. Τsolaki-Fiaka, S.; Bathrellos, G.D.; Skilodimou, H.D. Multi-Criteria Decision Analysis for an Abandoned Quarry in the Evros Region (NE Greece). Land 2018, 7, 43. [Google Scholar] [CrossRef]
  13. Rahman, M.A.; Jaumann, L.; Lerche, N.; Renatus, F.; Buchs, A.K.; Gade, R.; Geldermann, J.; Sauter, M. Selection of the best inland waterway structure: A multicriteria decision analysis approach. Water Resour. Manag. 2015, 29, 2733–2749. [Google Scholar] [CrossRef]
  14. Afshari, A.R.; Vatanparast, M.; Ćoćkalo, D. Application of multi criteria decision making to urban planning: A review. J. Eng. Manag. Compet. 2016, 6, 46–53. [Google Scholar] [CrossRef] [Green Version]
  15. Mollalo, A.; Alimohammadi, A.; Shirzadi, M.; Malek, M. Geographic information system-based analysis of the spatial and spatio-temporal distribution of zoonotic cutaneous leishmaniasis in Golestan Province, north-east of Iran. Zoonoses Public Health 2015, 62, 18–28. [Google Scholar] [CrossRef] [PubMed]
  16. Mollalo, A.; Sadeghian, A.; Israel, G.D.; Rashidi, P.; Sofizadeh, A.; Glass, G.E. Machine learning approaches in GIS-based ecological modeling of the sand fly Phlebotomus papatasi, a vector of zoonotic cutaneous leishmaniasis in Golestan province, Iran. Acta Trop. 2018, 188, 187–194. [Google Scholar] [CrossRef] [PubMed]
  17. Theilen-Willige, B.; Aher, S.P.; Gawali, P.B.; Venkata, L.B. Seismic hazard analysis along Koyna Dam area, western Maharashtra, India: A contribution of remote sensing and GIS. Geosciences 2016, 6, 20. [Google Scholar] [CrossRef]
  18. Nsanziyera, A.; Rhinane, H.; Oujaa, A.; Mubea, K. GIS and Remote-Sensing Application in Archaeological Site Mapping in the Awsard Area (Morocco). Geosciences 2018, 8, 207. [Google Scholar] [CrossRef]
  19. Koohbanani, H.; Barati, R.; Yazdani, M.; Sakhdari, S.; Jomemanzari, R. Groundwater recharge by selection of suitable sites for underground dams using a GIS-based fuzzy approach in semi-arid regions. In Progress in River Engineering & Hydraulic Structures; International Energy and Environment Foundation: Najaf, Iraq, 2018; pp. 11–32. [Google Scholar]
  20. Jamali, A.A.; Randhir, T.O.; Nosrati, J. Site Suitability Analysis for Subsurface Dams Using Boolean and Fuzzy Logic in Arid Watersheds. J. Water Resour. Plan. Manag. 2018, 144, 04018047. [Google Scholar] [CrossRef]
  21. Dai, X. Dam Site Selection Using an Integrated Method of AHP and GIS for Decision Making Support in Bortala, Northwest China. Master’s Thesis, Lund University, Lund, Sweden, 2016. [Google Scholar]
  22. Tung, S.; Tang, S. A comparison of the Saaty’s AHP and modified AHP for right and left eigenvector inconsistency. Eur. J. Oper. Res. 1998, 106, 123–128. [Google Scholar] [CrossRef]
  23. Khorrami, M. Weighting Energy Efficiency Criteria for a Green Building, Using AHP method, Case study: Green Office Building in Iran. In Proceedings of the 1st National Conference on Green Building, Mashhad, Iran, 14 May 2014. [Google Scholar]
  24. Abdullah, T.; Ali, S.; Al-Ansari, N.; Knutsson, S. Possibility of Groundwater Pollution in Halabja Saidsadiq Hydrogeological Basin, Iraq Using Modified DRASTIC Model Based on AHP and Tritium Isotopes. Geosciences 2018, 8, 236. [Google Scholar] [CrossRef]
  25. Kaushal, V.; Guleria, S. Geotechnical Investigation of Black Cotton Soils. Available online: https://www.researchgate.net/profile/Vinayak_Kaushal/publication/279192640_Geotechnical_Investigation_of_Black_Cotton_Soils/links/558d959608ae47a3490bcedc.pdf (accessed on 31 October 2018).
  26. Hassani, A.N.; Katibeh, H.; Farhadian, H. Numerical analysis of steady-state groundwater inflow into Tabriz line 2 metro tunnel, northwestern Iran, with special consideration of model dimensions. Bull. Eng. Geol. Environ. 2016, 75, 1617–1627. [Google Scholar] [CrossRef]
  27. Hassani, A.N.; Farhadian, H.; Katibeh, H. A comparative study on evaluation of steady-state groundwater inflow into a circular shallow tunnel. Tunn. Undergr. Space Technol. 2018, 73, 15–25. [Google Scholar] [CrossRef]
  28. Sadooghi, A.; Kibert, C.; Sadeghi, F.M.; Jafari, S. Thermal performance analysis of a traditional passive cooling system in Dezful, Iran. Tunn. Undergr. Space Technol. 2019, 83, 291–302. [Google Scholar] [CrossRef]
  29. Piadeh, F.; Moghaddam, M.R.A.; Mardan, S. Present situation of wastewater treatment in the Iranian industrial estates: Recycle and reuse as a solution for achieving goals of eco-industrial parks. Resour. Conserv. Recycl. 2014, 92, 172–178. [Google Scholar] [CrossRef]
  30. Piadeh, F.; Alavi-Moghaddam, M.R.; Mardan, S. Assessment of sustainability of a hybrid of advanced treatment technologies for recycling industrial wastewater in developing countries: Case study of Iranian industrial parks. J. Clean. Prod. 2018, 170, 1136–1150. [Google Scholar] [CrossRef]
  31. Moud, H.I.; Shojaei, A.; Flood, I.; Zhang, X.; Hatami, M. Qualitative and Quantitative Risk Analysis of Unmanned Aerial Vehicle Flights over Construction Job Sites. In Proceedings of the Eighth International Conference on Advanced Communications and Computation (INFOCOMP 2018), Barcelona, Spain, 22–26 July 2018; pp. 22–26. [Google Scholar]
  32. Hatami, M.; Shafieardekani, M. The Effect of Industrialization on Land Use Changes; Evidence from Intermediate Cities of Iran. Int. J. Curr. Life Sci. 2014, 4, 11899–11902. [Google Scholar]
  33. Rincón, D.; Khan, U.; Armenakis, C. Flood Risk Mapping Using GIS and Multi-Criteria Analysis: A Greater Toronto Area Case Study. Geosciences 2018, 8, 275. [Google Scholar] [CrossRef]
  34. Anane, M.; Bouziri, L.; Limam, A.; Jellali, S. Ranking suitable sites for irrigation with reclaimed water in the Nabeul-Hammamet region (Tunisia) using GIS and AHP-multicriteria decision analysis. Resour. Conserv. Recycl. 2012, 65, 36–46. [Google Scholar] [CrossRef]
  35. Kim, Y.; Chung, E.-S.; Jun, S.-M.; Kim, S.U. Prioritizing the best sites for treated wastewater instream use in an urban watershed using fuzzy TOPSIS. Resour. Conserv. Recycl. 2013, 73, 23–32. [Google Scholar] [CrossRef]
  36. Şengül, Ü.; Eren, M.; Shiraz, S.E.; Gezder, V.; Şengül, A.B. Fuzzy TOPSIS method for ranking renewable energy supply systems in Turkey. Renew. Energy 2015, 75, 617–625. [Google Scholar] [CrossRef]
  37. Zyoud, S.H.; Kaufmann, L.G.; Shaheen, H.; Samhan, S.; Fuchs-Hanusch, D. A framework for water loss management in developing countries under fuzzy environment: Integration of Fuzzy AHP with Fuzzy TOPSIS. Expert Syst. Appl. 2016, 61, 86–105. [Google Scholar] [CrossRef]
  38. Lahijanian, B.; Zarandi, M.F.; Farahani, F.V. Proposing a model for operating room scheduling based on fuzzy surgical duration. In Proceedings of the 2016 Annual Conference of the North American Fuzzy Information Processing Society (NAFIPS), El Paso, TX, USA, 31 October–4 November 2016; pp. 1–5. [Google Scholar]
  39. Lahijanian, B.; Zarandi, M.F.; Farahani, F.V. Double coverage ambulance location modeling using fuzzy traveling time. In Proceedings of the 2016 Annual Conference of the North American Fuzzy Information Processing Society (NAFIPS), El Paso, TX, USA, 31 October–4 November 2016; pp. 1–6. [Google Scholar]
  40. Adibfar, A.; Costin, A. Next Generation of Transportation Infrastructure Management: Fusion of Intelligent Transportation Systems (ITS) and Bridge Information Modeling (BrIM). In Advances in Informatics and Computing in Civil and Construction Engineering; Springer: Berlin/Heidelberg, Germany, 2019; pp. 43–50. [Google Scholar] [CrossRef]
  41. Khorrami, M.; Alizadeh, B. Weighting parameters for selecting the appropriate urban public transportation system, using Analytical Hierarchy Process (AHP) method. In Proceedings of the 2nd International Congress On Structure, Architecture & Urban Development, Tabriz, Iran, 16–18 December 2014. [Google Scholar]
  42. Riding, K.A.; Peterman, R.J.; Guthrie, S.; Brueseke, M.; Mosavi, H.; Daily, K.; Risovi-Hendrickson, W. Environmental and Track Factors That Contribute to Abrasion Damage. In Proceedings of the 2018 Joint Rail Conference, Pittsburgh, PA, USA, 18–20 April 2018; p. V001T001A009. [Google Scholar]
  43. Costin, A.; Adibfar, A.; Hu, H.; Chen, S.S. Building Information Modeling (BIM) for transportation infrastructure—Literature review, applications, challenges, and recommendations. Autom. Constr. 2018, 94, 257–281. [Google Scholar] [CrossRef]
  44. Choudhary, D.; Shankar, R. An STEEP-fuzzy AHP-TOPSIS framework for evaluation and selection of thermal power plant location: A case study from India. Energy 2012, 42, 510–521. [Google Scholar] [CrossRef]
  45. Yasser, M.; Jahangir, K.; Mohmmad, A. Earth dam site selection using the analytic hierarchy process (AHP): A case study in the west of Iran. Arab. J. Geosci. 2013, 6, 3417–3426. [Google Scholar] [CrossRef]
  46. Özcan, E.C.; Ünlüsoy, S.; Eren, T. A combined goal programming—AHP approach supported with TOPSIS for maintenance strategy selection in hydroelectric power plants. Renew. Sustain. Energy Rev. 2017, 78, 1410–1423. [Google Scholar] [CrossRef]
  47. Esavi, V.; Karami, J.; Alimohammadi, A.; Niknezhad, S. Comparison the AHP and FUZZY-AHP Decision Making Methods in Underground Dam Site Selection in Taleghan Basin. Geosciences 2012, 22, 27–35. (In Persian) [Google Scholar]
  48. Önüt, S.; Soner, S. Transshipment site selection using the AHP and TOPSIS approaches under fuzzy environment. Waste Manag. 2008, 28, 1552–1559. [Google Scholar] [CrossRef]
  49. Mulliner, E.; Malys, N.; Maliene, V. Comparative analysis of MCDM methods for the assessment of sustainable housing affordability. Omega 2016, 59, 146–156. [Google Scholar] [CrossRef] [Green Version]
  50. Balioti, V.; Tzimopoulos, C.; Evangelides, C. Multi-Criteria Decision Making Using TOPSIS Method Under Fuzzy Environment. Application in Spillway Selection. Multidiscip. Digit. Publ. Inst. Proc. 2018, 2, 11. [Google Scholar] [CrossRef]
  51. Tzimopoulos, C.; Balioti, V.; Evangelides, C. Fuzzy multi-criteria decision making method for dam selection. In Proceedings of the 13th International Conference on Environmental Science and Technology, Athens, Greece, 5–7 September 2013. [Google Scholar]
  52. Rezaei, P.; Rezaie, K.; Nazari-Shirkouhi, S.; Tajabadi, M.R.J. Application of fuzzy multi-criteria decision making analysis for evaluating and selecting the best location for construction of underground dam. Acta Polytech. Hung. 2013, 10, 187–205. [Google Scholar]
  53. Jamali, I.A.; Mörtberg, U.; Olofsson, B.; Shafique, M. A spatial multi-criteria analysis approach for locating suitable sites for construction of subsurface dams in Northern Pakistan. Water Resour. Manag. 2014, 28, 5157–5174. [Google Scholar] [CrossRef]
  54. Barkhordari, J. The pre-selection of suitable sites for small underground dams in arid areas using GIS (A case study in Yazd_Ardakan watershed). Int. Geoinformat. Res. Dev. J. 2015, 6, 18–27. [Google Scholar]
  55. Minatour, Y.; Khazaie, J.; Ataei, M.; Javadi, A. An integrated decision support system for dam site selection. Sci. Iran. Trans. A Civ. Eng. 2015, 22, 319. [Google Scholar]
  56. Choo, T.H.; Ahn, S.H.; Yang, D.U.; Yun, G.S. A Study on the Estimating Dam Suitable Site based on Geographic Information using AHP. In Proceedings of the 6th International Conference on Developments in Engineering and Technology (ICDET-2017), Bangkok, Thailand, 6–7 February 2017. [Google Scholar]
  57. Njiru, F.M. Site Selection for an Earth Dam in Mbeere North, Embu County—Kenya. J. Geosci. Environ. Prot. 2018, 6, 113. [Google Scholar] [CrossRef]
  58. Biranvandzadeh, M.; Sorkhkamal, K. Assessment of Development Level of Sistan and Baluchistan Province Compared to other Iran’s Provinces. Int. J. Archit. Urban Dev. 2015, 5, 69–76. [Google Scholar]
  59. Kottek, M.; Grieser, J.; Beck, C.; Rudolf, B.; Rubel, F. World map of the Köppen-Geiger climate classification updated. Meteorol. Z. 2006, 15, 259–263. [Google Scholar] [CrossRef]
  60. Johnston, K.; Ver Hoef, J.M.; Krivoruchko, K.; Lucas, N. Using ArcGIS Geostatistical Analyst; Esri: Redlands, CA, USA, 2001; Volume 380. [Google Scholar]
  61. Willmott, C.J.; Matsuura, K.; Robeson, S.M. Ambiguities inherent in sums-of-squares-based error statistics. Atmos. Environ. 2009, 43, 749–752. [Google Scholar] [CrossRef]
  62. Roszkowska, E. Multi-criteria decision making models by applying the TOPSIS method to crisp and interval data. Mult. Criteria Decis. Mak. Univ. Econ. Katow. 2011, 6, 200–230. [Google Scholar]
  63. Hyde, K.; Maier, H.; Colby, C. A distance-based uncertainty analysis approach to multi-criteria decision analysis for water resource decision making. J. Environ. Manag. 2005, 77, 278–290. [Google Scholar] [CrossRef]
  64. Tzeng, G.-H.; Chen, T.-Y.; Wang, J.-C. A weight-assessing method with habitual domains. Eur. J. Oper. Res. 1998, 110, 342–367. [Google Scholar] [CrossRef]
  65. Malczewski, J. GIS and Multicriteria Decision Analysis; John Wiley & Sons: Hoboken, NJ, USA, 1999. [Google Scholar]
  66. Yue, Z. A method for group decision-making based on determining weights of decision makers using TOPSIS. Appl. Math. Model. 2011, 35, 1926–1936. [Google Scholar] [CrossRef]
  67. Krohling, R.A.; Campanharo, V.C. Fuzzy TOPSIS for group decision making: A case study for accidents with oil spill in the sea. Expert Syst. Appl. 2011, 38, 4190–4197. [Google Scholar] [CrossRef]
  68. Saaty, T.L.; Tran, L.T. On the invalidity of fuzzifying numerical judgments in the Analytic Hierarchy Process. Math. Comput. Model. 2007, 46, 962–975. [Google Scholar] [CrossRef]
  69. Saaty, T.L. Decision-making with the AHP: Why is the principal eigenvector necessary. Eur. J. Oper. Res. 2003, 145, 85–91. [Google Scholar] [CrossRef]
  70. Gavade, R.K. Multi-Criteria Decision Making: An overview of different selection problems and methods. Int. J. Comput. Sci. Inf. Technol. 2014, 5, 5643–5646. [Google Scholar]
  71. Zardari, N.H.; Ahmed, K.; Shirazi, S.M.; Yusop, Z.B. Literature review. In Weighting Methods and Their Effects on Multi-Criteria Decision Making Model Outcomes in Water Resources Management; Springer: Berlin/Heidelberg, Germany, 2015; pp. 7–67. [Google Scholar] [CrossRef]
  72. Tscheikner-Gratl, F.; Egger, P.; Rauch, W.; Kleidorfer, M. Comparison of multi-criteria decision support methods for integrated rehabilitation prioritization. Water 2017, 9, 68. [Google Scholar] [CrossRef]
  73. Caterino, N.; Iervolino, I.; Manfredi, G.; Cosenza, E. A comparative analysis of decision making methods for the seismic retrofit of RC buildings. In Proceedings of the 14th world Conference on Earthquake Engineering, Beijing, China, 12–17 October 2008; pp. 12–17. [Google Scholar]
  74. Ballı, S.; Korukoğlu, S. Operating system selection using fuzzy AHP and TOPSIS methods. Math. Comput. Appl. 2009, 14, 119–130. [Google Scholar] [CrossRef]
  75. Jia, P.; Govindan, K.; Choi, T.-M.; Rajendran, S. Supplier selection problems in fashion business operations with sustainability considerations. Sustainability 2015, 7, 1603–1619. [Google Scholar] [CrossRef]
  76. Dinmohammadi, A.; Shafiee, M. Determination of the most suitable technology transfer strategy for wind turbines using an integrated AHP-TOPSIS decision model. Energies 2017, 10, 642. [Google Scholar] [CrossRef]
  77. Neisani Samani, Z.; Karimi, M.; Alesheikh, A.A. A Novel Approach to Site Selection: Collaborative Multi-Criteria Decision Making through Geo-Social Network (Case Study: Public Parking). ISPRS Int. J. Geo-Inf. 2018, 7, 82. [Google Scholar] [CrossRef]
Figure 1. The location of the study area (blue area).
Geosciences 08 00494 g001
Figure 2. Hierarchy structure for dam site selection.
Geosciences 08 00494 g002
Figure 3. The location of potential sites (points A to P) for dam construction in the study area.
Geosciences 08 00494 g003
Figure 4. Separation of each alternative from the positive ideal solution.
Geosciences 08 00494 g004
Figure 5. Separation of each alternative from the negative ideal solution.
Geosciences 08 00494 g005
Figure 6. Relative closeness to positive ideal solution.
Geosciences 08 00494 g006
Table 1. A review on recent researches on dam site selection using AHP and TOPSIS.
ReferenceYearSite Selection forApplied Method
[47]2012Underground DamAHP
[45]2013DamAHP
[51]2013DamTOPSIS
[52]2013Underground damAHP
[53]2014Subsurface damsAHP
[54]2015Small underground damsAHP
[55]2015DamAHP
[21]2016DamAHP
[56]2017DamAHP
[57]2018DamAHP
[1]2018DamTOPSIS
Table 2. RCI values for different values of n.
n12345678
RCI0.000.000.520.891.111.251.351.40
n9101112131415
RCI1.451.491.521.541.561.581.59
Table 3. The selected locations based on topographical and morphological conditions.
Location NameReservoir Area (km2)Storage Volume (m3 × 106)Maximum Height of Dam (m)Crest Length (m)
A 14.88285.5350365.0
B3.00214.5790781.3
C3.3924.1690766.1
D12.09150.931001462.4
E1.2437.19401335.9
F1.4247.0660791.2
G10.50919.931901302.4
H 23.39186.2860328.8
I1.8749.59301479.8
J0.365.2430212.3
K5.24266.631501118.3
L 33.94225.9680876.7
M 40.9110.9120140.8
N 57.5017.2160396.8
O2.53147.58901488.3
P35.12186.03701341.9
1 Kahir Dam. 2 Zirdan Dam. 3 Land Dam. 4 Shi Kalak Dam. 5 Pishin Dam.
Table 4. Mean Absolute Deviation (MAD) for three spatial interpolation techniques for sediment dataset.
MethodsMAD
IDW0.53
SplineRegularized0.51
Tension0.49
KrigingCircular0.37
Spherical0.38
Exponential0.30
Gaussian0.41
Table 5. Different interpolation methods applied for each dataset.
Applied MethodCriterion
Exponential KrigingDischarge
Circular KrigingGroundwater
Exponential KrigingSediment
Exponential KrigingPH
Exponential KrigingSSP
Exponential KrigingTDS
Exponential KrigingEC
Table 6. Weight of criteria based on expert opinion.
CriterionStraight RankRatio ScaleOriginal WeightNormalized Weight
Discharge1990.155
Groundwater6110.017
Slope2880.138
Sediment4550.086
Land use5330.052
TDS4550.086
SSP4550.086
PH4550.086
EC4550.086
Geology3770.121
Erosion4550.086
Sum 58
Table 7. The positive ideal solution and negative ideal solution for each criterion.
CriterionPositive Ideal SolutionNegative Ideal Solution
Discharge1.00.1
Groundwater1.00.1
Slope1.00.1
Sediment1.00.1
Land use1.00.1
TDS1.00.1
SSP0.50.1
PH1.00.7
EC0.70.1
Geology1.00.1
Erosion1.00.1
Table 8. Results of the rank for 15 selected sites based on the TOPSIS technique.
SiteValue of C i + RankingSiteValue of C i + Ranking
A0.85571F0.64799
M0.83222I0.639010
L0.80873N0.623811
B0.78624E0.604812
H0.74675D0.500013
C0.74616O0.498214
K0.67527P0.473715
G0.65408
Table 9. The criteria weight vector w.
CriteriaQ 1GW 2SlopeSedimentLand UseTDSSSPPHECGeo 3Erosionw
Q1.0091.131.83.001.81.81.81.81.291.80.155
GW0.1110.130.20.330.20.20.20.20.140.20.017
Slope0.8981.001.62.671.61.61.61.61.141.60.138
Sediment0.5650.631.01.671.01.01.01.00.711.00.086
Land use0.3330.380.61.000.60.60.60.60.430.60.052
TDS0.5650.631.01.671.01.01.01.00.711.00.086
SSP0.5650.631.01.671.01.01.01.00.711.00.086
PH0.5650.631.01.671.01.01.01.00.711.00.086
EC0.5650.631.01.671.01.01.01.00.711.00.086
Geo0.7870.881.42.331.41.41.41.41.001.40.121
Erosion0.5650.631.01.671.01.01.01.00.711.00.086
1 Discharge. 2 Groundwater. 3 Geology.
Table 10. The pairwise comparisons of the alternative matrix S.
AlternativesDischargeGround WaterSlopeSedimentLand UseTDSSSPPHECGeologyErosion
A0.1060.0560.0640.0610.0290.0930.0530.0670.0780.0340.085
B0.1050.0510.0660.0620.0290.0090.0530.0670.0780.2070.074
C0.1000.0500.0670.0640.0570.0470.0530.0670.0440.2070.074
D0.0320.0250.0660.0720.0860.0470.0530.0670.0440.0340.083
E0.0530.0700.0670.0700.0570.0090.0530.0670.0780.0340.070
F0.0470.0680.0670.0700.0860.0930.0530.0670.0780.0340.068
G0.0550.0540.0670.0690.0860.0930.0530.0670.0780.0340.068
H0.0770.0570.0670.0680.0570.0930.0530.0670.0780.0340.042
I0.0160.1200.0670.0750.0860.0930.2630.0670.0780.0340.090
K0.0460.0880.0670.0760.0860.0930.0530.0670.0780.0340.091
L0.0900.1040.0670.0660.0570.0930.0530.0670.0780.1030.083
M0.0950.0640.0670.0640.0860.0930.0530.0670.0780.1030.053
N0.1120.0610.0670.0370.0290.0470.0530.0670.0440.0340.091
O0.0350.0670.0660.0720.0860.0470.0530.0670.0440.0340.019
P0.0310.0640.0660.0720.0860.0470.0530.0670.0440.0340.010
Table 11. Values of priority vector.
AlternativeValue
A0.06954
B0.08232
C0.08352
D0.05462
E0.05568
F0.06320
G0.06418
H0.06383
I0.07982
K0.06595
L0.07843
M0.07728
N0.06253
O0.05018
P0.04893
Table 12. The consistency ratio (CR).
MATRIX λ max CIRCICR
A 111.008500.000851.520.00056
S1 2 15.001000.000071.590.00004
S215.000300.000021.590.00001
S315.000200.000011.590.00001
S415.000100.000011.590.00000
S514.99950−0.000041.59−0.00002
S615.000000.000001.590.00000
S715.000000.000001.590.00000
S814.93300−0.004791.59−0.00301
S914.99750−0.000181.59−0.00011
S1015.001500.000111.590.00007
S1114.99920−0.000061.59−0.00004
1 Pairwise comparison of the criteria with respect to the goal; 2 Pairwise comparison matrix of the alternatives with respect to the first criterion
Table 13. Results of the ranking for 15 selected sites according to the AHP technique.
AlternativeAHP ScoreRankAlternativeAHP ScoreRank
C0.08351H0.06389
B0.08232F0.063210
I0.07983N0.062511
L0.07844E0.055712
M0.07735D0.054613
A0.06956O0.050214
K0.06597P0.048915
G0.06428
Table 14. Comparison between TOPSIS and AHP outputs.
AlternativeTOPSIS RankAHP RankDifference in Rank
A165
B422
C615
D13130
E12120
F9101
G880
H594
I1037
K770
L341
M253
N11110
O14140
P15150

