Regional Scale Sea Cliff Hazard Assessment at Sintra and Cascais Counties, Western Coast of Portugal


Departamento de Geologia and Instituto Dom Luiz, Faculdade de Ciências, Universidade de Lisboa, 1749-016 Lisboa, Portugal
Geosciences 2018, 8(3), 80; https://doi.org/10.3390/geosciences8030080
Submission received: 15 December 2017
/
Revised: 14 February 2018
/
Accepted: 21 February 2018
/
Published: 26 February 2018
(This article belongs to the Special Issue Natural Hazards and Risks Assessment)
Abstract
:Mass movements of different types and sizes are the main processes of sea cliff evolution, being a considerable natural hazard, the assessment of which is a relevant issue in terms of human loss prevention and land use regulations. To predict the occurrence of future failures affecting the cliff top in slow retreating cliffs, a study was made using the logistic regression statistical method, a set of predisposing factors mainly related with geology (lithology, structure, faults), geomorphology (maximum, mean and standard variation of slope angle, height, aspect, curvatures, toe protection) and near offshore mean annual wave power, which were correlated with an aerial photo interpretation based inventory of cliff failures occurred in a 63 years period (1947–2010). The susceptibility model was validated against the inventory data using standard Receiver Operator Curves, which provided area under the curve (AUC) values higher than 0.8. In spite of the room for improvement of cliff failure inventories and predisposing factors to be used in these types of studies, namely those related to the rock mass strength and wave power nearshore, the results obtained indicate that the proposed approach is an effective contribution for objective and quantitative hazard assessment.
1. Introduction
Sea cliff evolution is dominated by the occurrence of slope mass movements, encompassing rock falls, topples and different types of landslides [1,2], all of which can be considered as a natural hazard and a major threat to human activities and safe land use in cliff dominated coastal areas [3]. The social and economic relevance of this issue is high and will likely grow in the future, due to the increasing use of coastal areas and the extent of cliff and rocky shorelines that correspond to circa 80% of the world coastlines [4,5], and circa 50% of the Portugal coast [6]. As a result, the economic value of land in coastal areas tends to be very high, as a result of increasing demand for exceptional location building areas, with locations over the cliffs being no exception. There are also issues related to the presence, near the cliff top, of consolidated urban areas [7], and the conservation of archaeological and historical heritage (e.g., [8,9]), and also a considerable number of injuries and casualties caused by cliff failures [10].
Sea cliff and rock coasts have received much lower research efforts than the fast evolution sandy shorelines [11], with soft cliff being the most commonly studied, and the lower retreat rate and strong and intermediate strength cliffs receiving much less attention [12]. This is probably due to a combination of factors which include the difficulties in monitoring an episodic, comparatively low space and time frequency event-based process, located mostly in highly irregular and frequently inaccessible locations, which is poorly represented in aerial photos and maps.
In this context, it is assumed that a separation between soft cliffs, with mean cliff retreat rates typically higher than 0.1 m/year, and hard cliffs, with mean retreat rates lower than 0.1 m/year [12,13,14,15], mainly composed by rock masses where wave attack is not directly related or followed by cliff failure, and the toe protecting role of sand or shingle beaches, or abrasion platforms, may only be effective at intermediate or large time scales. In the latter, the cliff top line remains essentially unchanged at time scales in excess of half a century in aerial photographs based evolution monitoring, being only affected by localized cliff failures.
The published work on cliffs hazards is scarce and includes expert based classification of indicative features of near future instability (e.g., [16]), attempts to characterize the role of instability conditioning factors, weighted and combined according local experience or expert opinion [17,18] and use of Bayesian probabilistic models to predict cliff evolution based on past retreat data and expert opinion on a limited number of conditioning factors [19,20], with limited assessment of the relative importance of the selected conditioning factors or indicators of future instability.
Physically-based slope stability methods have also been applied, in spite of the difficulties involved in the acquisition of geotechnical data of the cliffs rock masses (e.g., [7,21,22]), for cliffs mainly composed of clays [23], or cliffs made of fairly homogeneous and weak rock masses as chalk [24]. However, in spite of the amount of work and diversity of data acquisition techniques used in these studies, there is limited or absent validation of their results with actual cliff failures inventories.
Recent cliff evolution monitoring, such as airborne LiDAR (e.g., [25,26,27,28]), digital photogrammetry, terrestrial laser scanner (e.g., [29,30] and unmanned aerial vehicle (UAV) imagery processing (e.g., [31,32]) are providing new and detailed data on cliff evolution and process involved (e.g., [15]) at local [33] and regional [26] scales. However, these monitoring techniques are quite recent and can only provide monitoring results for limited periods of time, at the maximum of the order of one decade, which is a considerable limitation for the monitoring of a discontinuous and low time frequency event based process.
Aerial photography was, until recently, a major source of cliff retreat data, and in spite of being able to provide much less precise and accurate data than the newer techniques, has the advantage of enabling monitoring periods in excess of half a century, which can provide a more significant sampling of the larger but less frequent cliff failures [14,34,35].
Cliff failures may affect areas located near the cliff top, the cliff face and near the cliff toe, with the cliff top retreat being the result of retrogression due to cliff failures, the area near the toe being mainly affected by failure debris, and the cliff faces being affected by combinations of the two processes [25]. While the hazards induced in cliff faces and near the toe are very important for beach and shoreline structures, accesses and people, but are restricted to the areas where these elements are present, the cliff top failures may affect different types of structures and constructions, therefore being a concern for land use regulations and planning, both at the regional and local scale, and applied to the whole extension of cliffs in a given region.
Considering that regional scale hazard studies made to support land use planning and hazard prevention are still scarce, mostly qualitative and not validated using objective procedures, the difficulties or even non-feasibility of geotechnical characterization of hard cliffs at the regional scale for application of physically-based susceptibility assessment methods, a statistically based approach emerges as the more feasible approach to the problem.
In statistically based landslide hazard assessment and mapping [36], the landslide hazard corresponds to the probability of occurrence of a landslide in a given area (spatial component), in a given time period (time component) and with a given magnitude.
In this context, the assessment of the spatial component of sea cliff failure hazard of low retreat rate cliffs, i.e., the susceptibility of a given sector of cliff being affected by failures which cause cliff top retreat, based on the spatial predisposing factors and without implications on magnitude or time of occurrence, was performed by a statistically based study, following previous work on this topic [12,37], and applied to cliffs cut in rock masses with less contrasting strength, with the inclusion of more morphometric predisposing factors (profile curvature and standard variation of slope angle) and the mean annual wave power at the near offshore of the cliffs. In this context it is assumed that cliff evolution in the long term is the parallel retreat of the cliff face, implying that the cliff top failure is a stage of the cycle of its evolution [1,2].
The study was based on an aerial photo interpretation-based inventory of cliff retreat events occurred in a 63-year period (1947 to 2010), which was correlated with a set of cliff failure conditioning factors which are possible to map at regional scale of analysis, using the multi-variate logistic regression statistical method. We studied all the sea cliff sections of the whole extension of the coastline of two neighboring counties, Sintra and Cascais, located about 30 km to W and WNW of Lisbon, Portugal. The sea cliff sections, which amount to a total length of circa 41 km, was divided in cell units which include 25 m of cliff top length for the application of the statistical model. The model results were validated with the inventory data using standard success rate receiver operating characteristic (ROC) curves, which enable an objective assessment of the adequacy of the susceptibility models computed. Due to the large extension of coast studied, maps of predisposing factors lithology, cliff toe protection and mean annual wave power are presented as supplementary material to the paper, together with sea cliff and cliff failure photographs.
2. Setting
The 41 km long Sintra–Cascais cliff-dominated coast is located in the western coast of Portugal, approximately 30 km westwards Lisbon, including, from North to South, a westward facing section with sub-sections with general orientation NNE-SSW to NW-SE, and two SSW facing sections, with the eastern one being more sheltered from the North Atlantic ocean waves and storms (Figure 1).
The study area has temperate climate with a mild summer, with mean annual rainfall around 700 mm northwards of Sintra massif, and around 630 mm southwards, but with substantially lower values around Cabo da Roca (520 mm) and Cabo Raso. The tide regime is semidiurnal mesotidal with mean amplitude of 2.1 m [38], with the western coast being acted upon dominant waves from NW (mean Hs of 1.7 m), with storms with the same direction and less frequently from SW (maximum Hs of 6.7 m), and in the south facing coast, waves (mean Hs of 0.7 m) and storms from SW (maximum Hs of 4.8 m) [39]. Beaches are usually small and restricted to small bays that correspond to indentations of the cliff plan contour. From the western end of Cascais and extending eastwards, there are several coastal sections which are stabilized by engineering works build up in different dates and with locally variable extent, with the former sea cliffs evolving without direct action of the sea.
The geology setting [40,41,42,43] of the coastal section studied is dominated by the presence of the late Mesozoic igneous granitic rocks Sintra massif, which corresponds to an annular structure composed of a granitic core, surrounded by syenite and gabbro outer shells with variable outcropping extent (Figure 1). The emplacement and emergence of the igneous rocks assumed a northwards thrusting character, causing folding and northwards thrust faults affecting upper Jurassic, lower and middle Cretaceous and Oligocene rocks. The southern border is characterized by a more gradual transition to the surrounding rocks, including contact metamorphic marbles and upper Jurassic schists. To northwards and southwards of this igneous structure and surrounding metamorphosed and tectonically disturbed rocks, there are predominantly tabular structures composed of lower and upper Cretaceous near horizontal units (Figure 1) affected by large curvature radius folding, and cut by numerous near vertical faults and two generation dykes, the first mainly contemporary of Sintra massif installation and the latter related with the late Mesozoic Lisbon volcanic complex, which affected the whole study area.
- (a)
- The Sintra massif rocks. These include granites with usually reddish orthoclase, which form the major part of the cliffs.
- (b)
- Southwards of Sintra massif, the sea cliffs are composed of a Jurassic series which includes compact limestones affected by contact metamorphism (Upper Oxfordian), carbonate schists with layers of marls and conglomerates (Upper Oxfordian–Lower Kimmeridgian), marly limestones, marls and limestones (Kimmeridgian–Portlandian), and nodular and compact limestones with some marl layers (Portlandian). These formations show a high (60° to 65°) dip to South and are cut by NW-SE wrench faults and numerous igneous dykes mostly trending NNW-SSE, N-S and E-W. The Portlandian formations contact by fault with Lower Cretaceous (Hauterivian-Lower Barremian) limestones and dolomitic limestones. These Mesozoic formations form the northern limb of a syncline which center is occupied by alternating marly limestones and marls (Albian-Middle Cenomanian) and is located southwards of Praia do Guincho. To South and East the cliffs are mainly composed by Cretaceous rocks, included in the following formations: Marly limestones and marls (Lower Hauterivian) limestones, dolomitic limestones and marls (Hauterivian-Lower Barremian), sandstones, marls and dolomite (Upper Barremian), limestones and marls (Lower Aptian), sandstones and clays (Upper Aptian) and alternating marly limestones and marls (Albian-Lower and Middle Cenomanian). The southwest and south coastal formations are cut by a large number of igneous dykes trending NNW-SSE to NNE-SSW, which outcrop at the cliffs, with variable weathering state. At the SW area, over the raised platforms that limit the top of the cliffs, there are deposits of Pleistocene raised beaches, Holocene cemented dunes and also Holocene mobile sand dunes, which do not form cliffs.
- (c)
- Northwards of Sintra massif, the sea cliffs are cut in a steeply northwards dipping beds sequence exposed along approximately 3.8 km of cliffs, which includes Jurassic marly limestones, marls and limestones (Kimmeridgian-Portlandian) compact and nodular limestones with marly interbedded layers (Portlandian), and Cretaceous limestones and marls (Berriasian), limestones and sandstones (Valanginian), marls and marly limestones (Lower Hauterivian), limestones (Hauterivian and Lower Barremian), sandstones with interbedded clays (Upper Barremian), which contacts by a thrust fault with sandstones and conglomerate with marly or clayey matrix, with interbedded clays (Oligocene).
Northwards of the Oligocene outcrops, the cliffs are mainly composed by marly limestones or limestones alternating with marls, in varied proportions (Albian-Lower and Middle Cenomanian) with minor sections made of Upper Cretaceous basalts and Upper Aptian sandstones. Bedding is mostly near horizontal and the formations are cut by NNW-SSE and NW-SE faults and a few mainly E-W igneous dykes.
Northwards of the Sintra massif, the cliffs cut a littoral undulated platform with more frequent elevations between 40 m and 60 m, with the cliff top elevations varying more sharply between 6 m and 86 m. At the western border of the Sintra massif, the cliff top elevations are much more variable, with the lower values at the suspended mouths of deeply incised creeks, from 20 m to 30 m, with the more frequent values between 50 m and 100 m, but reaching maximum elevation values up to 140 m. Southwards of the Sintra Massif, the cliffs area much lower, with more frequent cliff top elevation between 6 m and 20 m, reaching the higher elevations of 34 m at 1.5 km westwards of Cascais.
Cliff morphology is quite variable and, as usual, mainly reflects the geological structure and the contrasts in erosion resistance of the different formations. Cliff cross profiles are generally steep, with the more frequent mean slope angle values between 35° and 60°, with lower values corresponding to step like cliff profiles where there are erosion resistant beds at the toe. In the supplementary file to this paper there are oblique aerial photographs which provide examples of the varied cliff morphology in the study area.
3. Methods
To predict the possibility of occurrence of future failures affecting areas located along the top of the sea cliffs of Sintra and Cascais counties coast, a cliff instability hazard assessment was performed, based on the application of the landslide hazard proven multivariate statistical method of logistic regression (e.g., [36] and references therein), to a set of predisposing factors related with geology, geomorphology and wave power, which were correlated with an inventory of past cliff failures.
The predisposing factors were selected considering the need to provide a more complete possible description of geological and geomorphological characteristics which are usually considered as relevant for the occurrence of sea cliff failures and, simultaneously, could be obtained with an acceptable level of work at a regional scale of analysis.
In line with these conditions, the predisposing factors selected included geological and geomorphological aspects (major lithological units; geological structure, i.e., bedding dip in relation with the cliff faces; presence of faults; presence and type of cliff toe protection) and morphometric aspects derived from a 2 m grid DTM produced by processing of the 1:2000 scale topographic map with source data of 2002 (cliff height; mean cliff slope angle; maximum cliff slope angle; standard variation of cliff slope angle; aspect, plan curvature; profile curvature).
3.1. Logistic Regression
Considering previous results obtained in this type of studies [12,37] which indicated that the logistic regression provided better models than bi variate statistical methods, the sea cliff failure inventory relations with the conditioning factors selected were assessed using this multi-variate statistical method [44], which consists of the regression of a dichotomic dependent variable (0 without instabilities, 1 with instabilities) with a set of explanatory independent variables which may be continuous, categorical or dichotomic. The relation between instability occurrence in a given terrain unit and the set of explanatory variables is:
where S (from 0 to 1) is the probability of a given terrain being in the group of the units affected by instabilities. Ψ is the logit, which is linearly related with the independent variables:
where β0, β1, …, βm are the unknown parameters of the Logistic Regression, ν0, ν1, … νm are the independent variables (classes of each factor) in each terrain unit and ε is the error associated to model fitting.
The logistic regression modeling was performed using IBM SPSS Statistics v25 which performed the regression of the input data and returned the β and ε values for several trials of model building. Of all the results obtained, two model results are presented, one using the complete set of cliff instability predisposing factors, and another using the forward conditional approach. In the latter, after the regression computation, the factors (with all variables) are added to the model, one by one, in decreasing order of relevance for model building defined in the regression stage, until reaching a state where the introduction of the remaining factors becomes irrelevant.
3.2. Data Acquisition
3.1.1. Terrain Units
The cartographic units used for the mapping and analysis of factors and inventory followed previous studies [12,37] and was made using terrain units (TU) defined along 25 m long sections of the cliff top line, smoothed with a 25 m radius of tolerance line. This size covers the majority of the values of length of cliff top affected by cliff failures, and is a good balance between the mapping detail of the predisposing factors and their use for planning purposes. In each TU the predisposing factors class (variable) assumes a constant value, to enable the application of the statistical correlation with the cliff failure inventory.
At the ends of each 25 m smoothed cliff top line segment, the lateral limits of terrain units were drawn in directions approximately perpendicular to the cliff contour lines, crossing thus the manually digitized lines of the cliff top and toe. To enable a complete sampling of the morphometric properties of each terrain unit, 1 m buffers were created along the cliff top and toe lines, i.e., one half of the DTM grid cell used, and these buffer areas were added to the cliff terrain units. The study cliffs were then divided in 1658 terrain units containing approximately 25 m long sections of cliff top line, which correspond to approximately 41.45 km of cliff top length.
3.1.2. Inventory of Cliff Failures
Inventories of past cliff failures are a critical piece of information for application of statistically based methods. In this study were used simplified procedures to compile an inventory of cliff failures, using the principles described in [45], but adapted to the current status of aerial photo supply. In fact, the classical silver based photographic prints procedure enabled the observation of aerial photo contact prints under a mirror stereoscope with magnification eyepieces of up to 8× (e.g., Wild mirror stereoscopes), which were absolutely necessary to enable an effective detection of cliff failures, while the present day digital based printer processes do not enable an effective observation of photo pairs with even a small magnification due to the low resolution of the prints.
To overcome these problems, the inventory of cliff failures was compiled using aerial photo comparisons by simultaneous stereoscopic observation of photo pairs, of the older and the more recent aerial surveys, in a computer screen using a mirror stereoscope. The two pairs were simultaneously laid in the screen using four separate windows of a photo editing software (Adobe Photoshop Elements, v3). When changes are visually detected at the cliff top, the area lost is digitized in ArcGIS software 10.1 (Esri, Redlands, CA, USA), using locally georeferenced crops of the two sets of photos, selected in a way to minimize the negative effects of aerial photo relief displacement by conical projection [43]. With this procedure it is estimated that most of the cliff failures that implied cliff top retreat larger than 2 m could be identified, and as a result, the compiled inventory must be regarded as incomplete for the smaller cliff failures which tend to be the more frequent than the larger ones [10,14].
The simplified cliff failure aerial photo based inventory methods [45] has been extensively used in studies made in the coast of Portugal [14,46,47,48,49,50,51,52], and particularly, the data set produced for the southern coast of Algarve [53] was subject to extensive use and validation by the regional authority for water resources [10,34] and other independent research teams [9,18,54].
In this study were used the 1947, 1:30,000 scale, RAF aerial photo survey of Portugal (Centro de Informação Geoespacial do Exército—CIGeoE), and the digital 2010 aerial survey by Municipia, S:A., with a nadir terrain pixel of 30 cm, which enabled the detection and characterization of 128 cliff failures (with 3 examples depicted in the supplementary file) that occurred between 1947 and 2010 along the 41.45 km long cliffs, causing the loss of 14,170 m2 of horizontal area at the cliffs top. In the photointerpretation work, the 1947 photos, observation doubts were cleared using the nearly contemporaneous SPLAL survey (CIGeoE) with more favorable scale (1:17,000) but with a poor constrain of the date of acquisition, which occurred possibly between 1941 and 1944 in several flight dates [55]. It was not possible to assign a definitive type to most of the cliff failures identified, with those which caused cliff top retreat generally lower than 4 m to 6 m being possibly rockfalls, topples or planar failures with steep rupture planes, and the larger movements identified were of the planar type with generally steep failure plane. The large landslide occurred between 1996 and 1999 in the northern end of the study area that caused a cliff top retreat of 70 m, is of the translational type and developed along clayey bedding planes which locally dip 15° to 20° towards the sea (NW), which is a particular dip direction condition that only exists at this site and had a major effect on the landslide occurrence.
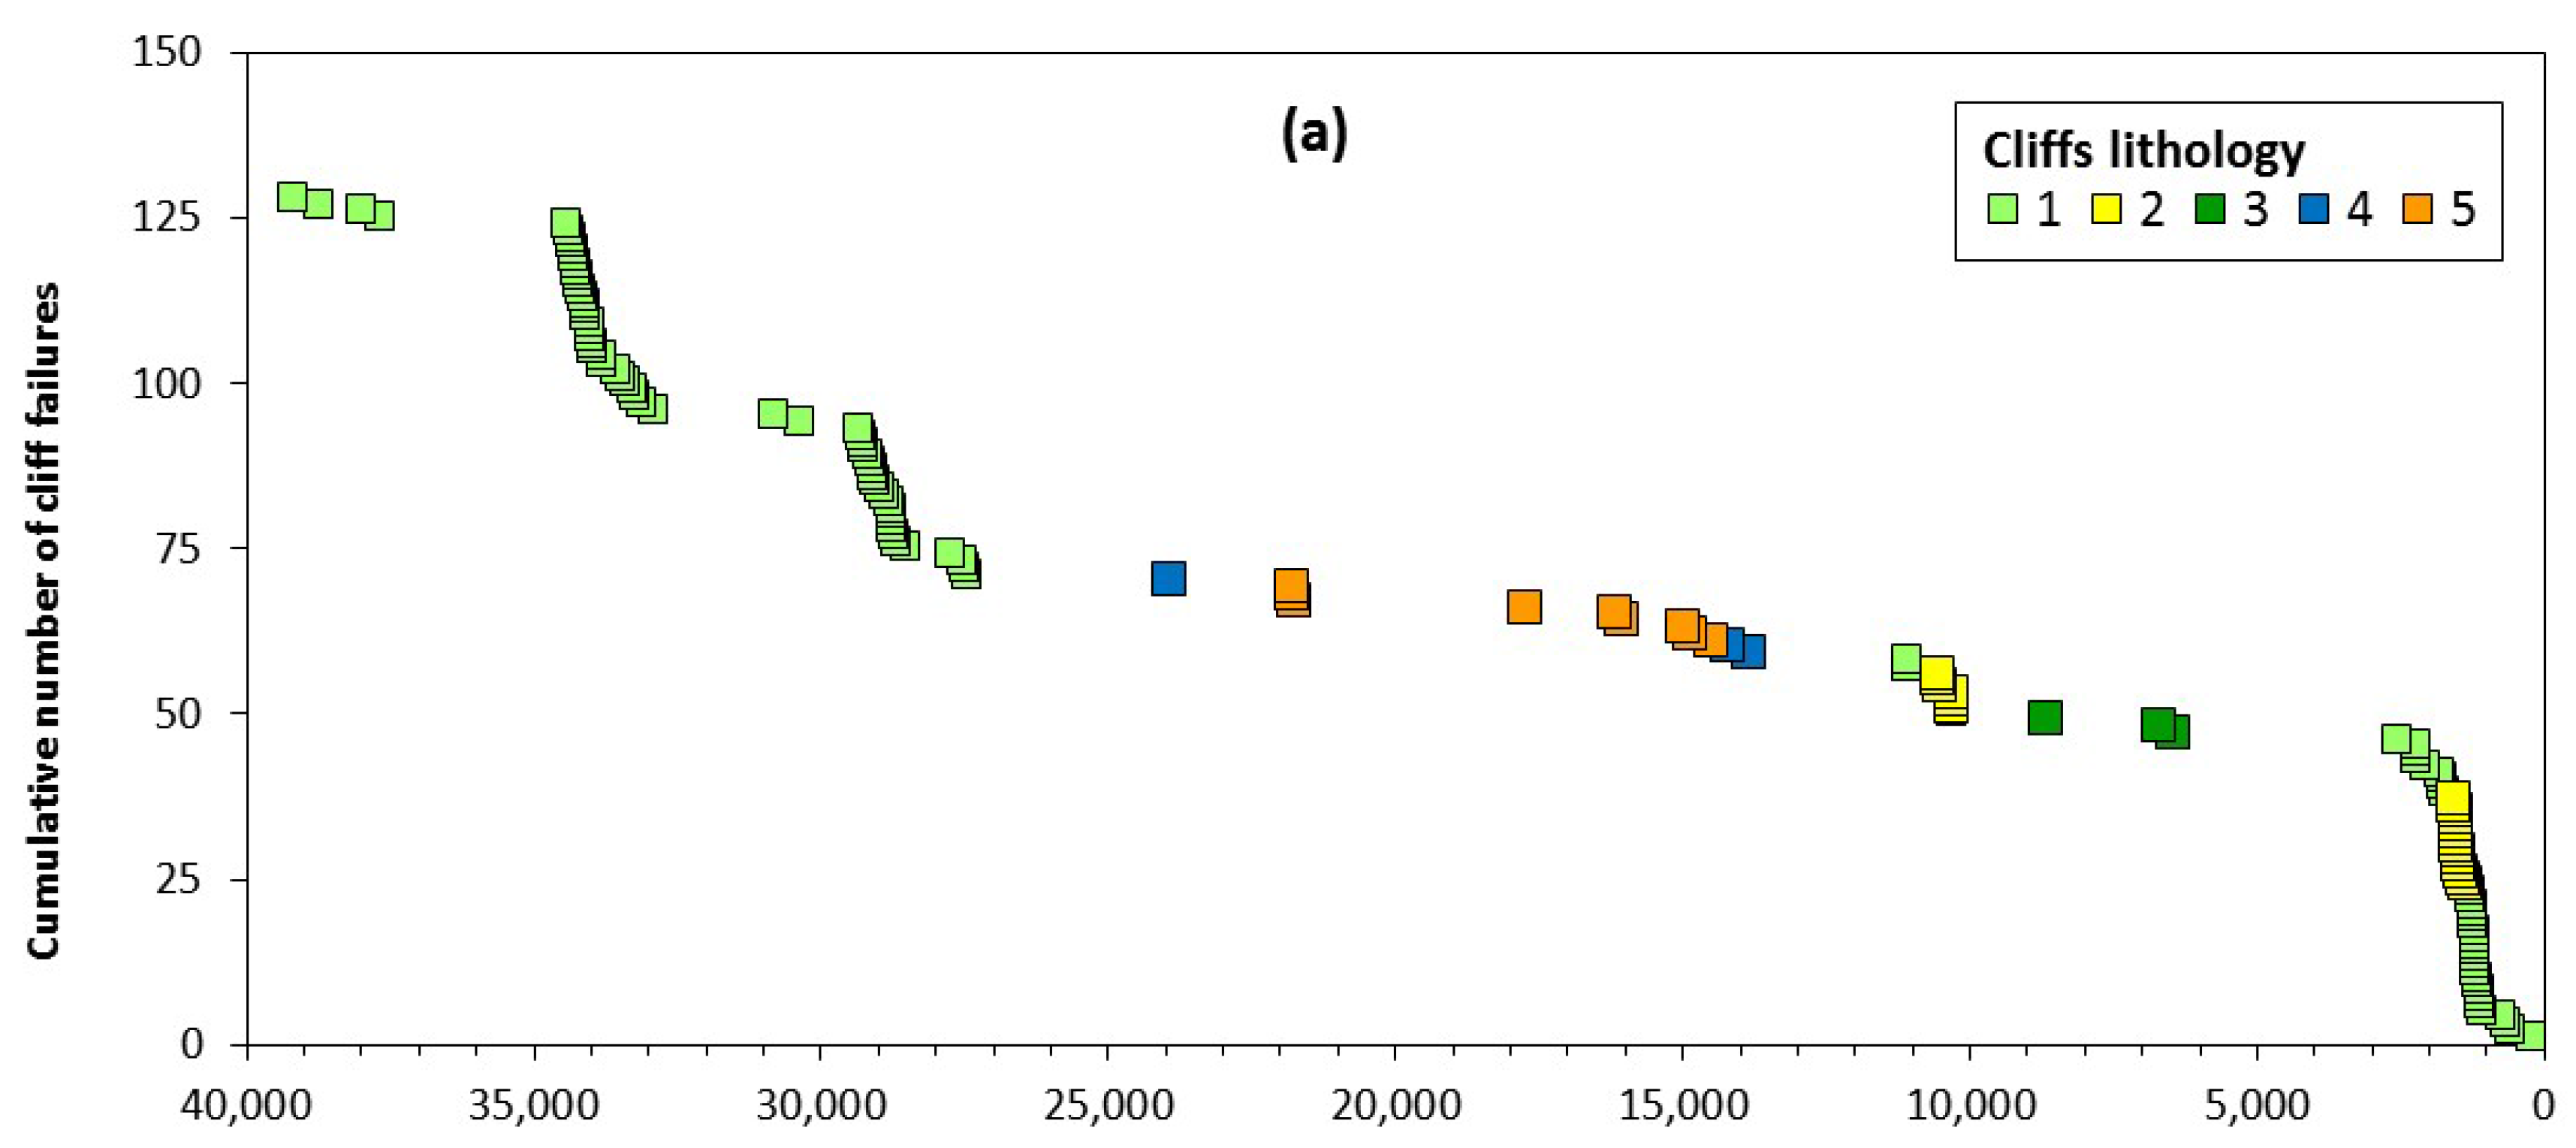
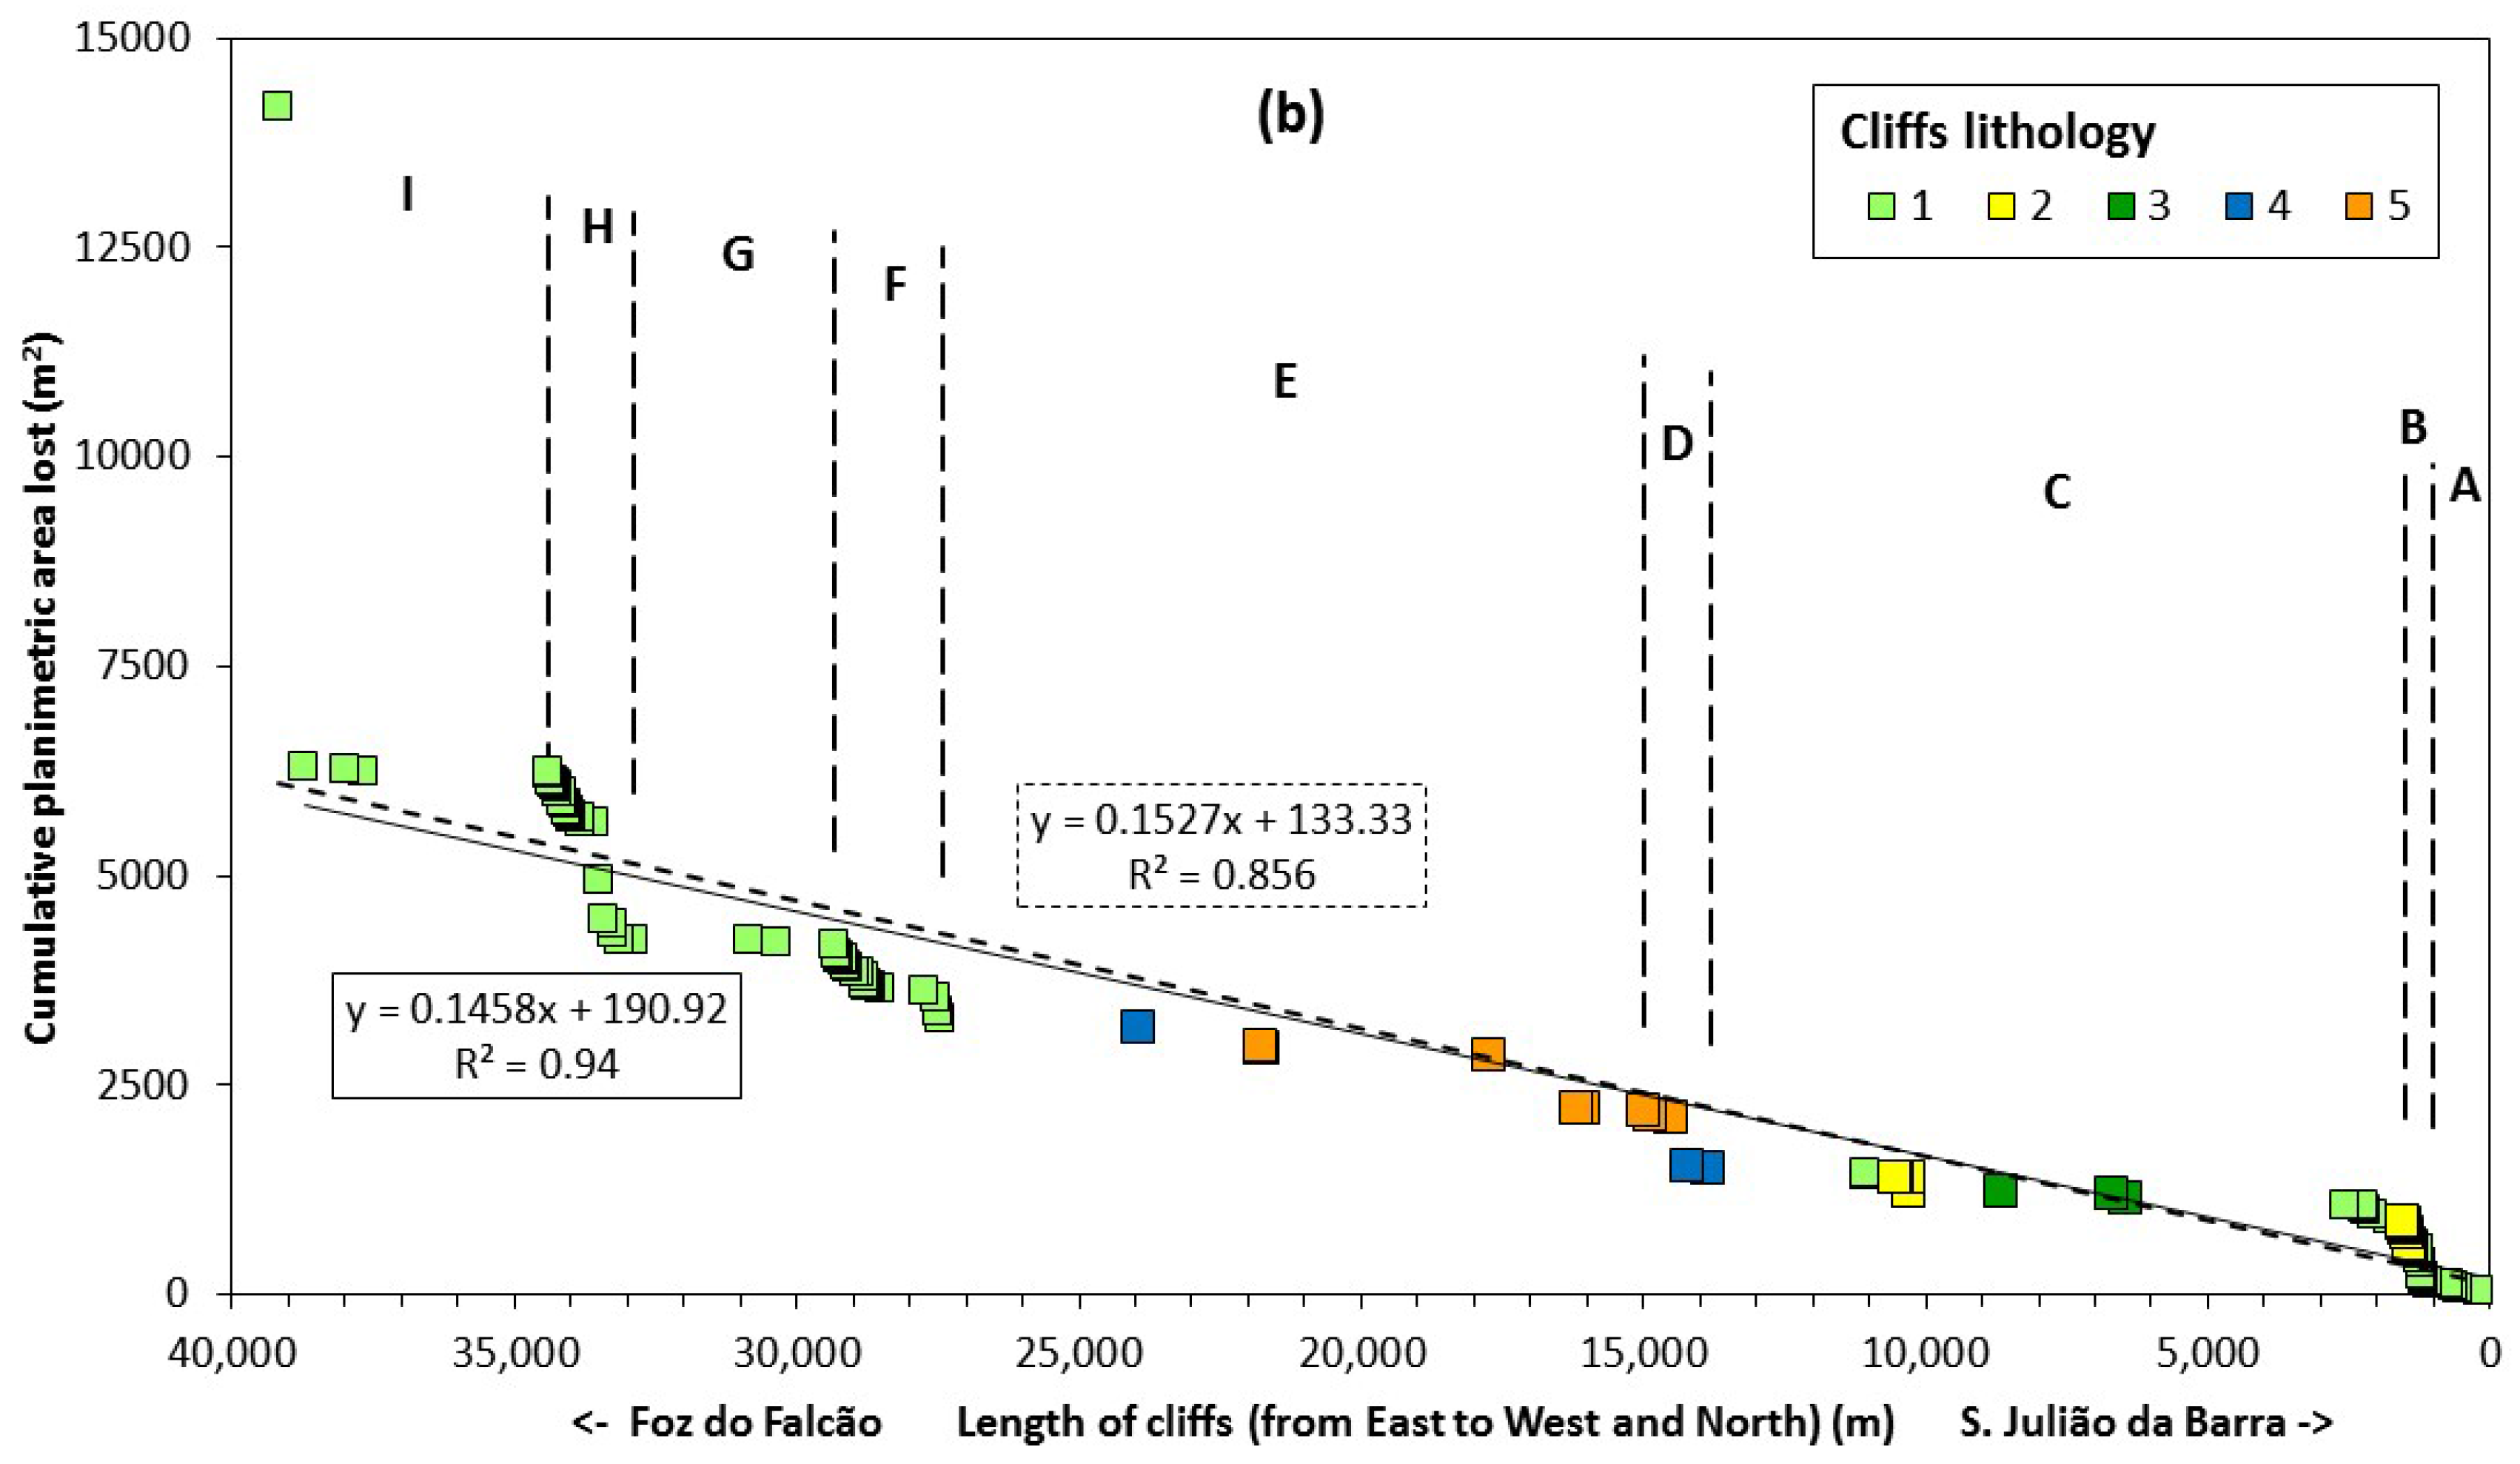
The space distribution of cliff failures is quite irregular along the studied coast, with the cumulative plot of horizontal area lost at the cliff top against cliffs length (Figure 2) enabling the computing of a global cliff retreat rate of 2.3 × 10⁻³ m/year, which corresponds to the slope of the linear regression of the cumulative plot divided by the number of years of monitoring (63 years). This value should be faced as a lower bound estimate due to the impossibility of detection of the smaller failures. The Figure 2 plot also enables the objective separation of sub sections with homogeneous retreat behavior, for which were computed mean retreat rates varying within two orders of magnitude from 2.7 × 10⁻² m/year in sandstones with interbedded marls, to 7.8 × 10⁻⁴ m/year in lower Cretaceous dolomitic limestones, and 1.7 × 10⁻⁴ m/year in strong limestones included in the Albian-Cenomanian unit (Table 1).
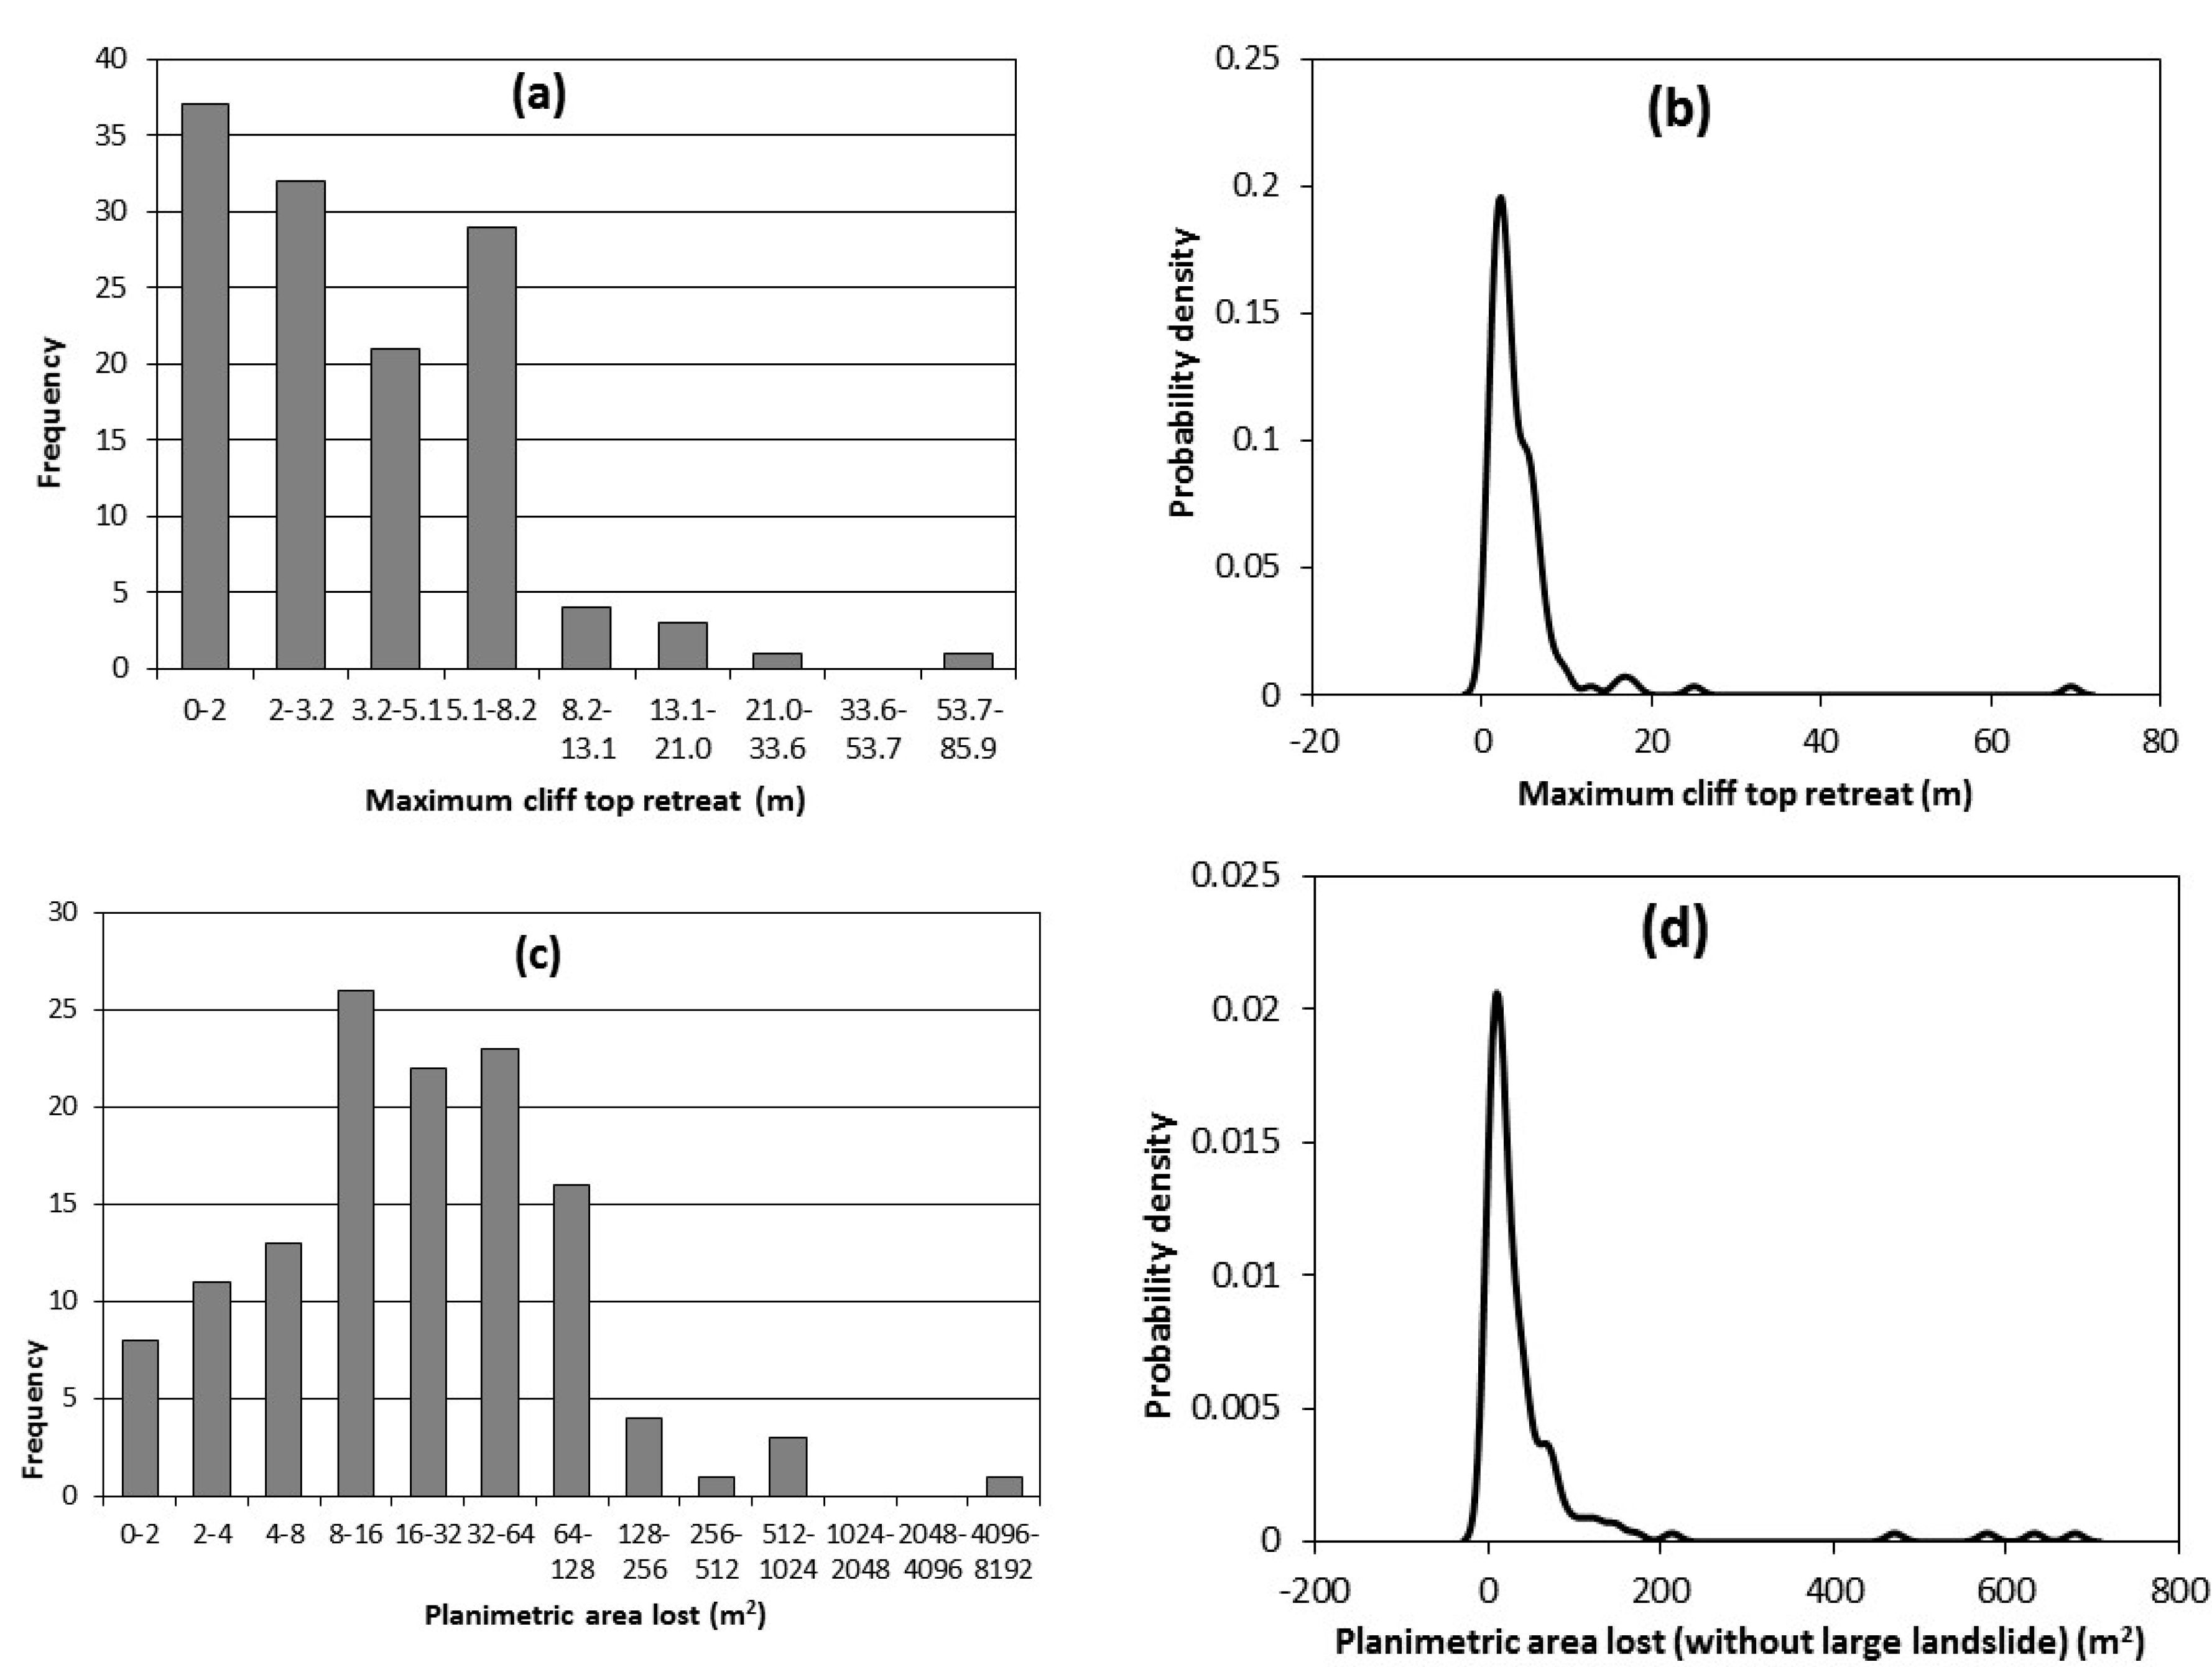
The maximum recorded local retreat of the cliff top was 70 m, caused by the exceptional translational slide occurred in the northern end of the study area, with the more frequent values in the range of 1 m to 8 m (Figure 3 and Figure 4). It was not found any significant relation between cliff height and maximum cliff top retreat (Figure 3), with all cliff failures except the large translational landslide causing retreat lower than the cliff height. The length of cliff top affected by the failures varied within a large range (Figure 4), from less than 4 m to approximately 150 m, with the values lower than 30 m corresponding to circa 89% of the inventoried cases. The total amount of cliff top affected by failures was 1931 m, which corresponds to circa 4.7% of the total length of cliffs in the study area.
Considering that the majority of the cliff failures cross section correspond to relatively thin slabs of rocks separated by steeply dipping failure surfaces, a certain convergence of causes, mechanisms and triggering factors are assumed, and, as a result, the susceptibility analysis carried out includes all inventory data. The cliff failure inventory was transposed to the terrain units used in this study, considering that the unit contains failures if more than 5% of its cliff top line was affected.
3.1.3. Susceptibility Predisposing Factors
The susceptibility predisposing factors considered included those which could be related with cliff failures and which could be mapped at a regional scale of analysis. The geological and geomorphological factors considered were mapped at 1:2000 scale over the existing topographical map using field surveys and vertical and oblique aerial photograph interpretation, and included (Table 2):
- (1)
- Major lithological units, including 10 classes: Basalt; Dolomitic limestones; Granitic rocks; Limestone, marls, basalt; Limestones; Limestones, marls; Marls, limestones; Marls, sandstones, limestones; Sandstones; Sandstones, limestones, marls.
- (2)
- Geological structure, i.e., bedding dip relation with the cliff face, including 6 classes: Bedding dip lower than 10° (Horizontal); Bedding dip directed towards the slope face (Against slope); Beds dip direction pointing outwards of the cliff face but dip lower than cliff face slope angle (Inferior to slope); Igneous rock masses with no visible structure (Massive); Beds dip direction roughly parallel to the cliff face with dip higher than 10° (Parallel to slope). Beds dip direction pointing seawards but with dip angle higher than the cliff face slope angle (Superior to slope).
- (3)
- Presence of faults (1) or without faults (0);
- (4)
- Presence and type of cliff toe protection in 8 classes: plunging cliffs with no protection; cliff toe protection by fallen blocks; wave cut platform; fallen blocks and platform; sandy or boulder beaches; beach and platform; beach and blocks; beach, blocks and platform.
The factors related with the cliffs morphometry were based on the processing of DTMs obtained from the 1:2000 aero photogrammetric survey carried out by the national water authority (INAG), with source data (aerial photographs) obtained between 2001 and 2003. The factors produced from the 2 m DTM included:
- (5)
- Cliff height classified in a near quantile basis in 9 classes with height limits of 4, 12, 18, 26, 37, 48, 60, 72, 96 and 142 m.
- (6)
- Maximum cliff slope angle also in 9 quantile based classes with limits of 30, 52, 58, 62, 66, 69, 72, 75, 78 and 86°.
- (7)
- Mean cliff slope angle in 9 quantile based classes limits of 12, 26, 34, 40, 45, 49, 53, 58, 64 and 76°.
- (8)
- Standard variation of cliff slope angle in 7 quantile based classes with limits of 2.48, 6.8, 8.3, 9.7, 11.1, 12.6, 14.1 and 23.0°.
- (9)
- Aspect (direction of cliff face exposure) in the usual 8 classes: N, NE, E, SE, S, SW, W and NW.
For the curvature mapping, a 10 m DTM was used to capture the general characteristics of the cliff faces and included:
- (10)
- Mean plan curvature of the cliff faces in 5 classes: highly concave, slightly concave, planar, slightly convex and highly convex.
- (11)
- Mean cross profile curvature of the cliff faces in 5 classes: highly concave, slightly concave, planar, slightly convex and highly convex.
The computed curvature values within each terrain unit was classified in five classes separated by curvature values of −12.0, −4.0, 4.0, 12.0 in order to avoid the heavy influence of cells with very low (negative) or high positive curvatures which would have biased the mean values computed for each cell. The mean values of the reclassified curvature values in each terrain unit were then computed and classified in 5 terms. The results were object of a systematic checking to detect eventual errors of aspect and curvature assessment.
- (12)
- The mean annual wave power data was computed from calibrated offshore wave hindcast modeling data for the period 1953–2009 [56] transposed near shore to the 10 m bathymetric line using the SWAN (version 40.72) wave model and existing bathymetry interpolated using a Triangulated Irregular Network (TIN), exported to a grid file using a linear interpolation. Model domain includes one regional grid, with a cell size of 1 km × 1 km, and another nested grid with finer mesh grid (cell size of 100 m × 100 m).
The predisposing factors, their classification and number of occurrences in each class together with number of terrain units affected by cliff failures is in Table 2.
4. Results, Validation and Discussion
The logistic regression was applied to build a model including all factors and also a model in forward conditional mode, with the values of the exponent β and ε obtained included in Table 2. The logistic regression was also applied separately to each predisposing factor, in order to get a better perspective on their capacity to represent the actual cliff failures inventoried. The results obtained are expressed in terms of the area under the curve (AUC) of the receiver operating characteristics (ROC) curves (Table 3) and indicate that the factors that showed better correlation with the cliff failures of the inventory were, by decreasing order of importance, the lithology, toe protection, cliff height, mean annual wave power and geological structure.
The remaining factors provided lower correlations with the inventory, with the presence of faults providing a neutral performance towards the cliff failures, which is somewhat surprising, but in line with what was obtained in the Algarve cliffs [12,37]. It is noteworthy that these results are quite close to those obtained in the Algarve cliffs [12,37], where the three more important factors were also lithology, toe protection, cliff height, followed but not by the same order by mean slope, plan curvature and aspect.
It was expected that lithology would be the more important factor, because it is a direct proxy of the strength of the rock masses that compose the cliffs, in spite of not including information on discontinuities, which is a major control of rock mass strength (e.g., [57]). Toe protection relevance bears also expectable relations with the processes involved in the cliff evolution, namely the presence of debris of former failures, which are due to be removed by wave action to enable the cliff toe erosion, while other features as abrasion platforms or beaches may serve to moderate the direct marine action at the cliff toe.
In the studied cases, cliff height was also an important factor, but its relation with the actual processes are not easy to understand, and this possibly due to statistical correlation without physical correspondence. In fact, no significant relations were found between cliff height and the size of the failures in this study and in Algarve cliffs [12,37].
Other factors may have relation with the cliff evolution processes, as plan curvature, where concave cliff faces are more prone to concentrate superficial and groundwater flows which would provide less stable conditions than in convex sections but, simultaneously, locally more sheltered locations towards marine actions.
Mean annual wave power, in spite of its obvious shortcomings, which are related with the fact that it was computed based on model data and extrapolated to the bathymetric line of 10 m, not taking into account the nearshore bathymetry, provided a positive relation with the occurrence of failures, but not a direct relation, with the higher energy values, located along the SW cliffs, southwards of Guincho, and at the W and NW border of the Sintra massif cliffs, near Cabo da Roca (Figure 1) having no correspondence with the higher cliff retreat activity.
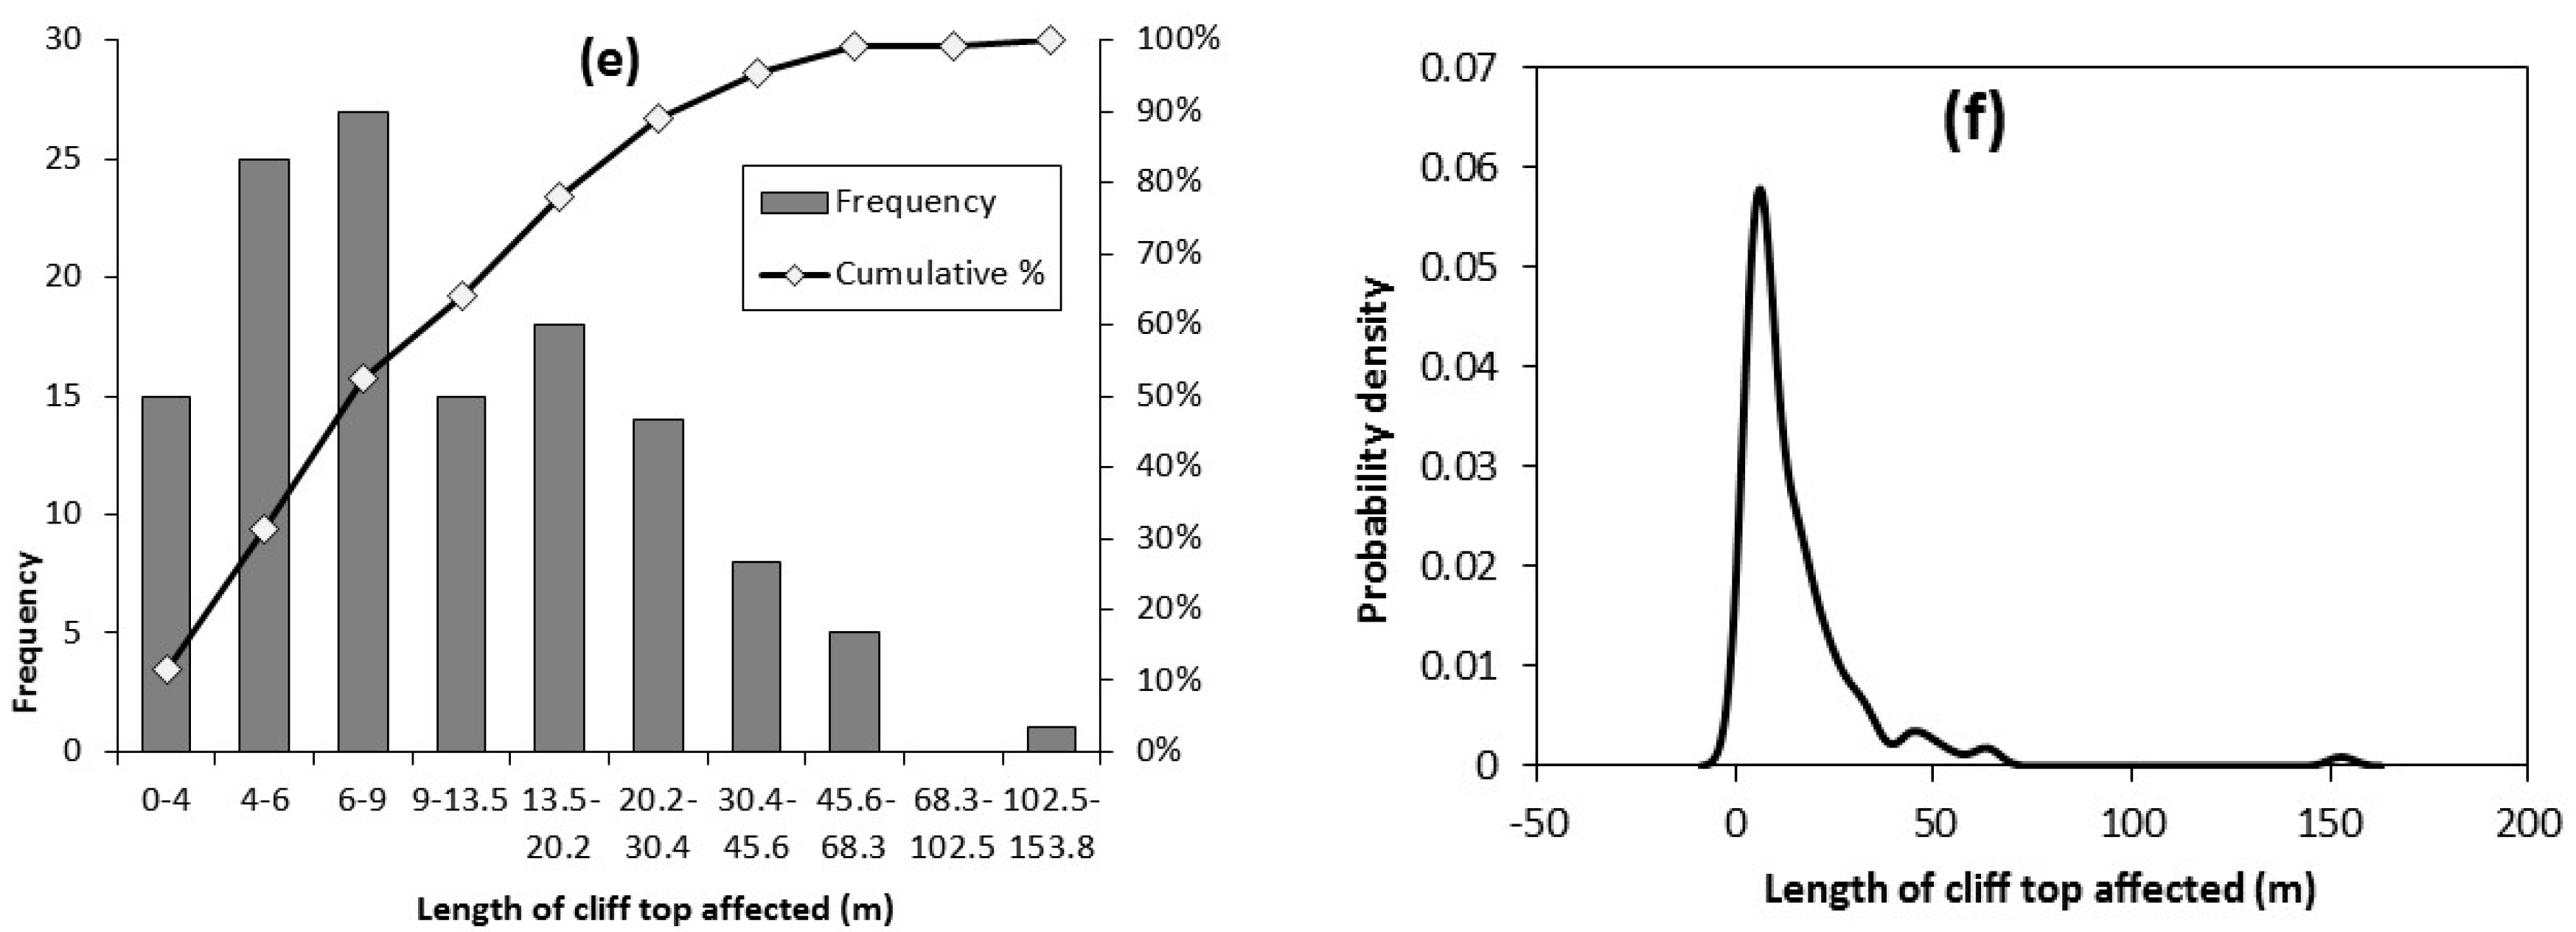
The model which considered all the factors mapped in this study provided results that show good adjustment with the cliff failures inventory, as illustrated by the ROC curve (Figure 5) and an AUC value of 0.857. The model using only the more relevant factors for the model, using the forward conditional approach provided slightly worse results (Figure 5) and an AUC of 0.836, but with the two values within the error margin of both models.
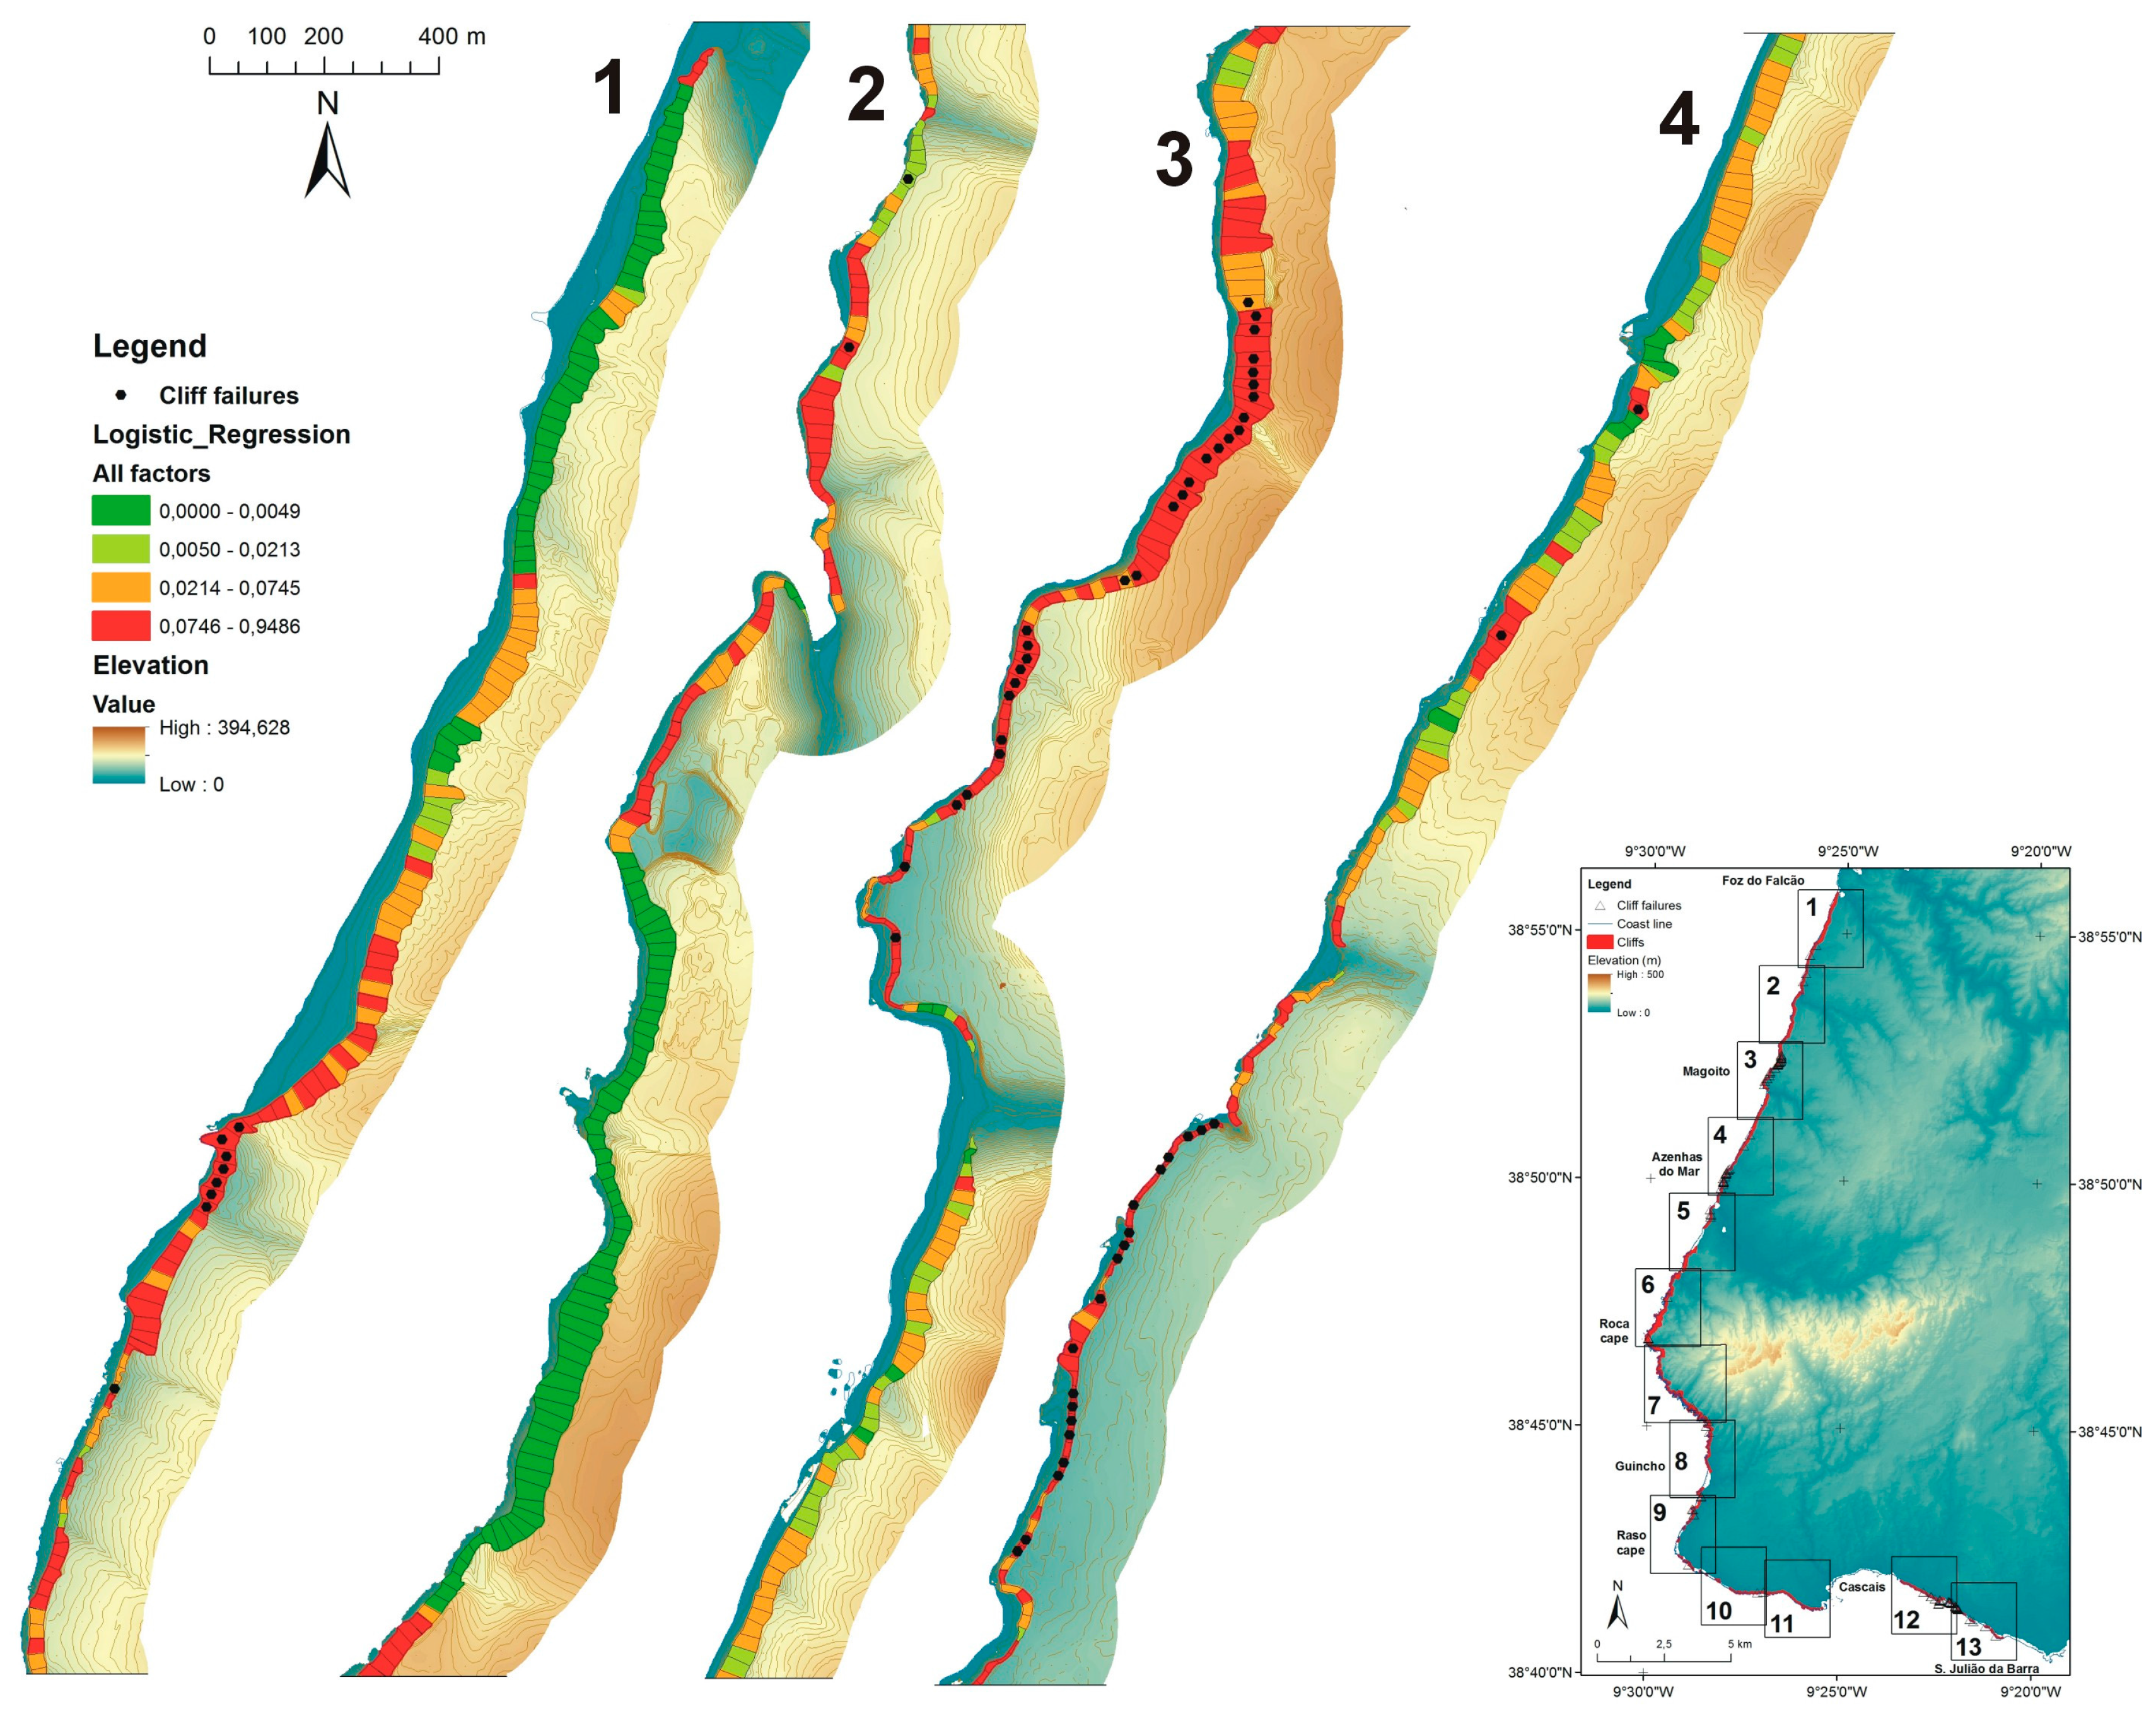
In Figure 6, Figure 7, Figure 8 and Figure 9 there are the maps which express the adequacy of the all factors model results to adjust to the cliff failures inventory, with the model probabilities classified in four classes with quantile defined limits, which enable a visual confirmation of the numerical results obtained. Due to space constrains, in the supplementary file there are more detailed maps which contain, for all the studied cliff sections, the predisposing factors lithology, toe protection and mean annual wave power together with the logistic regression model considering the contribution of all the predisposing factors used in this study.
5. Conclusions
The statistical approach using the logistic regression method, which was applied in this study provided models which enabled an objective assessment of the relations between a set of predisposing factors related with cliffs geology, geomorphology, and mean annual wave power at the near offshore, and the occurrence of failures which caused cliff top retreat, in cliffs that are mainly composed of intermediate strength to strong rock masses and in quite varied environmental conditions. The models’ performance was assessed using ROC curves, which provided AUC values higher than 0.85, which indicated that the models have a good adjustment to the input data. These results also indicate that the approach used in this study is adequate for describing the location of the major part of the cliff failures that occurred in a 63-year period.
The predisposing factors of sea cliff failure used had different contributions to the models’ performance, with lithology always being the most relevant factor, suggesting that the improvement of this factor mapping, by considering finer and more homogeneous lithological units with more close relation with cliffs rock mass strength and erosion resistance, which may have a significant contribution for the susceptibility models’ quality.
Cliff toe protection and cliff height were also important factors, confirming results obtained in previous studies, with the geological structure also contributing significantly. It was found that the inclusion of the predisposing factors profile curvature and standard variation of slope angle did not provide improvements of the susceptibility models produced, suggesting that their relevance for this type of study is low. In this study, the mean annual wave power was included as a predisposing factor computed for the bathimetric contour line of 10 m, as a first approximation of the marine actions acting upon the cliffs. This factor had a significant contribution for the models’ success; however, no direct relations were found between wave power and the density of cliff failures, suggesting that, although this factor is relevant, other factors, mainly related to rock mass strength, may play a more important conditioning role in sea cliff failure occurrence. Considering the limitations involved in the computing of this factor in this study and, notwithstanding, its significant contribution to the susceptibility models produced, the wave action upon the cliffs clearly requires further improvement, namely, in the modeling of the cliffs near shore bathimetry effects on the marine actions involved in cliff evolution. It is also found that, while they did not have a very significant contribution for the susceptibility models produced in this case study, the morphometric factors which are derived from the base DTM do not require a disproportionate mapping effort and, as a result, its inclusion in this type of studies is advisable.
The terrain units used for statistical modeling, based on 25 m long segments of cliff top line were effective, although there is much room for testing other terrain unit sizes, including different lengths of cliff top line included in each TU, and also other TU definition approaches based on the homogeneity of geological or geomorphological attributes.
The predictive capacity of the approach used in this study could not be tested due to inventory data limitations. However, the results obtained in this study, with the inclusion of the predisposing factor mean annual wave power, and in the previous one in Algarve cliffs, in different geological, geomorphological and environmental conditions, suggest that these methods have a good potential for the assessment of the susceptibility of sea cliff failures and a step towards an objective sea cliff hazard assessment.
Supplementary Materials
The following are available online at https://www.mdpi.com/2076-3263/8/3/80/s1.
Acknowledgments
This publication is supported by FCT-project UID/GEO/50019/2013—IDL. Acknowledgements are due to Rui Taborda for the provision of wave power data, to the Portuguese Environment Agency (APA, IP) for the provision of the topography maps, and also for the oblique aerial photos taken by Eng. A. Mota Lopes, and to the two anonymous reviewers which helped to improve the manuscript.
Conflicts of Interest
The author declares no conflict of interest. The founding sponsors had no role in the design of the study; in the collection, analyses, or interpretation of data; in the writing of the manuscript, and in the decision to publish the results.
References
- Trenhaile, A.S. Geomorphology of Rock Coasts; Clarendon Press: Oxford, UK, 1987; 384p. [Google Scholar]
- Sunamura, T. Geomorphology of Rocky Coasts; Wiley: New York, NY, USA, 1992; 302p. [Google Scholar]
- Moore, L.J.; Griggs, G.B. Long-term cliff retreat and erosion hotspots along the central shores of the Monterey Bay National Marine Sanctuary. Mar. Geol. 2002, 181, 265–283. [Google Scholar] [CrossRef]
- Emery, K.O.; Kuhn, G.G. Sea cliffs: Their processes, profiles and classification. Geol. Soc. Am. Bull. 1982, 93, 644–654. [Google Scholar] [CrossRef]
- Bird, E. Coastal Geomorphology: An Introduction; John Wiley and Sons: Chichester, UK, 2008; 436p. [Google Scholar]
- Marques, F.M.S.F. Sea cliff instability hazard prevention and planning: Examples of practice in Portugal. J. Coast. Res. 2009, 56, 856–860. [Google Scholar]
- Budetta, P.; De Luca, C. Wedge failure hazard assessment by means of a probabilistic approach for an unstable sea-cliff. Nat. Hazards 2015, 76, 1219–1239. [Google Scholar] [CrossRef]
- Bromhead, E.; Ibsen, M.-L. A review of landsliding and coastal erosion damage to historic fortifications in South East England. Landslides 2006, 3, 341–347. [Google Scholar] [CrossRef]
- Carrasco, A.R.; Ferreira, Ó.; Matias, A.; Dias, J.A. Historic monuments threatened by coastal hazards at Boca do Rio, Algarve, Portugal. Coast. Manag. 2007, 35, 163–179. [Google Scholar] [CrossRef]
- Teixeira, S.B. Coastal hazards from slope mass movements: Analysis and management approach on the Barlavento Coast, Algarve, Portugal. Ocean Coast. Manag. 2014, 102, 285–293. [Google Scholar] [CrossRef]
- Naylor, L.A.; Stephenson, W.J.; Trenhaile, A.S. Rock coast geomorphology: Recent advances and future research directions. Geomorphology 2010, 114, 3–11. [Google Scholar] [CrossRef]
- Marques, F.M.S.F.; Matildes, R.; Redweik, P. Sea cliff instability susceptibility at regional scale: A statistically based assessment in the southern Algarve, Portugal. Nat. Hazards Earth Syst. Sci. 2013, 13, 3185–3203. [Google Scholar] [CrossRef]
- Dong, P.; Guzzetti, F. Frequency-size statistics of coastal soft-cliff erosion. J. Waterw. Port Coast. Ocean Eng. 2005, 131, 37–42. [Google Scholar] [CrossRef]
- Marques, F.M.S.F. Magnitude-frequency of sea cliff instabilities. Nat. Hazards Earth Syst. Sci. 2008, 8, 1161–1171. [Google Scholar] [CrossRef]
- Lim, M.; Rosser, N.J.; Allison, R.J.; Petley, D.N. Erosional processes in the hard rock coastal cliffs at Staithes, North Yorkshire. Geomorphology 2010, 114, 12–21. [Google Scholar] [CrossRef]
- De Pippo, T.; Donadio, C.; Pennetta, M.; Petrosino, C.; Terlizzi, F.; Valente, A. Coastal hazard assessment and mapping in Northern Campania, Italy. Geomorphology 2008, 97, 451–466. [Google Scholar] [CrossRef]
- Del Río, L.; Gracia, F.J. Erosion risk assessment of active coastal cliffs in temperate environments. Geomorphology 2008, 112, 82–95. [Google Scholar] [CrossRef]
- Nunes, M.; Ferreira, Ó.; Schaefer, M.; Clifton, J.; Baily, B.; Moura, D.; Loureiro, C. Hazard assessment in rock cliffs at Central Algarve (Portugal): A tool for coastal management. Ocean Coast. Manag. 2009, 52, 506–515. [Google Scholar] [CrossRef]
- Milheiro-Oliveira, P. Bayesian statistical methods for modeling and prediction of major landslides in coastal areas. Coast. Eng. J. 2007, 49, 45–61. [Google Scholar] [CrossRef]
- Hapke, C.; Plant, N. Predicting coastal cliff erosion using a Bayesian probabilistic model. Mar. Geol. 2010, 278, 140–149. [Google Scholar] [CrossRef]
- Fall, M.; Azzam, R.; Noubactep, C. A multi-method approach to study the stability of natural slopes and landslide susceptibility mapping. Eng. Geol. 2006, 82, 241–263. [Google Scholar] [CrossRef]
- Martino, S.; Mazzanti, P. Integrating geomechanical surveys and remote sensing for sea cliff slope stability analysis: The Mt. Pucci case study (Italy). Nat. Hazards Earth Syst. Sci. 2014, 14, 831–848. [Google Scholar] [CrossRef]
- Castedo, R.; Fernández, M.; Trenhaile, A.S.; Paredes, C. Modelling cyclic recession of cohesive clay coasts: Effects of wave erosion and bluff stability. Mar. Geol. 2013, 335, 162–176. [Google Scholar] [CrossRef]
- Günther, A.; Thiel, C. Combined rock slope stability and shallow landslide susceptibility assessment of the Jasmund cliff area (Rügen Island, Germany). Nat. Hazards Earth Syst. Sci. 2009, 9, 687–698. [Google Scholar] [CrossRef]
- Young, A.P.; Flick, R.E.; Gutierrez, R.; Guza, R.T. Comparison of short-term seacliff retreat measurement methods in Del Mar, California. Geomorphology 2009, 112, 318–323. [Google Scholar] [CrossRef]
- Young, A.P.; Guza, R.T.; O’Reilly, W.C.; Flick, R.E.; Gutierrez, R. Short-term retreat statistics of a slowly eroding coastal cliff. Nat. Hazards Earth Syst. Sci. 2011, 11, 205–217. [Google Scholar] [CrossRef]
- Young, A.P. Recent deep-seated coastal landsliding at San Onofre State Beach, California. Geomorphology 2015, 228, 200–212. [Google Scholar] [CrossRef]
- Earlie, C.S.; Masselink, G.; Russell, P.; Shail, R. Application of airborne LiDAR to investigate rates of recession in rocky coast environments. J. Coast. Conserv. 2015, 19, 831–845. [Google Scholar] [CrossRef]
- Rosser, N.; Lim, M.; Petley, D.; Dunning, S.; Allison, R. Patterns of precursory rockfall prior to slope failure. J. Geophys. Res. 2007, 112. [Google Scholar] [CrossRef] [Green Version]
- Dewez, T.J.B.; Rohmer, J.; Regard, V.; Cnudde, C. Probabilistic coastal cliff collapse hazard from repeated terrestrial laser surveys: Case study from Mesnil Val (Normandy, northern France). J. Coast. Res. 2013, SI 65, 702–707. [Google Scholar] [CrossRef]
- Mancini, F.; Castagnetti, C.; Rossi, P.; Dubbini, M.; Fazio, N.L.; Perrotti, M.; Lollino, P. An Integrated Procedure to Assess the Stability of Coastal Rocky Cliffs: From UAV Close-Range Photogrammetry to Geomechanical Finite Element Modeling. Remote Sens. 2017, 9. [Google Scholar] [CrossRef]
- Barlow, J.; Gilham, J.; Cofrã, I.I. Kinematic analysis of sea cliff stability using UAV photogrammetry. Int. J. Remote Sens. 2017, 38. [Google Scholar] [CrossRef]
- Katz, O.; Mushkin, A. Characteristics of sea-cliff erosion induced by a strong winter storm in the eastern Mediterranean. Quat. Res. 2013, 80, 20–32. [Google Scholar] [CrossRef]
- Teixeira, S.B. Slope mass movements on rocky sea-cliffs: A power-law distributed natural hazard on the Barlavento Coast, Algarve, Portugal. Cont. Shelf. Res. 2006, 26, 1077–1091. [Google Scholar] [CrossRef]
- Barlow, J.; Lim, M.; Rosser, N.; Petley, D.; Brain, M.; Norman, E.; Geer, M. Modelling cliff erosion using negative power law scaling of rock falls. Geomorphology 2012, 139, 416–424. [Google Scholar] [CrossRef]
- Guzzetti, F.; Reichenbach, P.; Cardinali, M.; Galli, M.; Ardizzone, F. Probabilistic landslide hazard assessment at the basin scale. Geomorphology 2005, 72, 272–299. [Google Scholar] [CrossRef]
- Marques, F.M.S.F.; Matildes, R.; Redweik, P. Statistically based sea cliff instability hazard assessment of Burgau-Lagos coastal section (Algarve, Portugal). J. Coast. Res 2011, SI 64, 927–931. [Google Scholar]
- Antunes, C. Characterization of the Tide Regime. Deliverable 1.1.3.a. Project CISML, Portuguese Environment Agency (APA)—Faculty of Sciences, Univ. Lisbon, 2013. Available online: https://sniambgeoviewer.apambiente.pt/Geodocs/geoportaldocs/Politicas/Agua/Ordenamento/SistemasMonitorizacaoLitoral/E_1.1.3.a_Regime_mares.pdf (accessed on 14 October 2017).
- Silveira, T.M.; Taborda, R.; Andrade, C.F.; Silva, A.N.; Carapuço, A.M. Characterization of the Wave Regime near the coast. Deliverable 1.1.7.b. Project CISML, Portuguese Environment Agency (APA)–Faculty of Sciences, Univ. Lisbon, 2013. Available online: https://sniambgeoviewer.apambiente.pt/Geodocs/geoportaldocs/Politicas/Agua/Ordenamento/SistemasMonitorizacaoLitoral/E_1.1.7.b_Clima_agitao_costa.pdf (accessed on 14 October 2017).
- Kulberg, M.C.; Manuppella, G.; Rey, J.; Berthou, P.Y. Carta Geológica de Portugal, na Escala de 1:50 000, Folha 34-A (Sintra); LNEG: Lisbon, Portugal, 1991. [Google Scholar]
- Ramalho, M.M.; Pais, J.; Rey, J.; Berthou, P.Y.; Alves, C.A.M.; Palácios, T.; Leal, N.; Kullberg, M.C. Notícia Explicativa da Carta Geológica de Portugal, na Escala de 1:50 000, Folha 34-A (Sintra); LNEG: Lisbon, Portugal, 1993. [Google Scholar]
- Ramalho, M.M.; Ribeiro, M.L.; Serralheiro, A.; Almeida, F.M. Carta Geológica de Portugal, na Escala de 1:50 000, Folha 34-C (Cascais); LNEG: Lisbon, Portugal, 1999. [Google Scholar]
- Ramalho, M.M.; Rey, J.; Zbyszewski, G.; Alves, C.A.M.; Palácios, T.F.; Almeida, F.M.; Costa, C.; Kullberg, M.C. Notícia Explicativa da Carta Geológica de Portugal, na Escala de 1:50 000, Folha 34-C (Cascais); LNEG: Lisbon, Portugal, 2001. [Google Scholar]
- Hosmer, D.; Lemeshow, S. Applied Logistic Regression; Wiley: New York, NY, USA, 2000. [Google Scholar]
- Marques, F.M.S.F. A simple method for the measurement of cliff retreat from aerial photographs. Z. Geomorphol. 2006, 144, 39–59. [Google Scholar]
- Marques, F.M.S.F. Sea cliff evolution and related hazards in Miocene terranes of Algarve (Portugal). In Proceedings of the 7th International Congress of the International Association of Engineering Geology, Lisbon, Portugal, 5–9 September 1994; pp. 3109–3118. [Google Scholar]
- Marques, F.M.S.F. Sea cliff retreat in Portugal: Overview of existing quantitative data. In Proceedings of the 5th Congresso Nacional de Geologia, Lisbon, Portugal, 18–20 November 1998. [Google Scholar]
- Marques, F.M.S.F. Landslide activity in Upper Paleozoic shale sea cliffs: A case study along the western coast of the Algarve (Portugal). Bull. Eng. Geol. Environ. 2003, 62, 299–313. [Google Scholar] [CrossRef]
- Marques, F.M.S.F. Rates, patterns, timing and magnitude-frequency of cliff retreat phenomena. A case study on the west coast of Portugal. Z. Geomorphol. 2006, 144, 231–257. [Google Scholar]
- Marques, F.M.S.F.; Andrade, C. Discussion of: Dias, J.M.A. and Neal, W.J. Sea cliff retreat in southern Portugal: Profiles, processes, and problems. J. Coast. Res. 1993, 9, 1129–1135. [Google Scholar]
- Sobreira, F.G.; Marques, F.M.S.F. The relevance of sea cliff retreat assessment in hazard estimation: An example in the western coast of Portugal. In Proceedings of the International Congress of the International Association of Engineering Geology, Lisbon, Portugal, 5–9 September 1994; pp. 3119–3123. [Google Scholar]
- Borges, P.; Andrade, C.; Freitas, M.C. Dune, Bluff and Beach Erosion due to Exhaustive Sand Mining—The Case of Santa Barbara Beach, São Miguel (Azores, Portugal). J. Coast. Res. 2002, SI 36, 89–95. [Google Scholar]
- Marques, F.M.S.F. The Sea Cliffs of the Coast of Algarve. Dynamics, Processes and Mechanisms. Ph.D. Thesis, University of Lisbon, Lisbon, Portugal, 1997. [Google Scholar]
- Bezerra, M.M.; Moura, D.; Ferreira, Ó.; Taborda, R. Influence of Wave Action and Lithology on Sea Cliff Mass Movements in Central Algarve Coast, Portugal. J. Coast. Res. 2011, 27, 162–171. [Google Scholar] [CrossRef]
- Redweik, P.; Roque, D.; Marques, A.; Matildes, R.; Marques, F. Triangulating the past: Recovering Portugal aerial images repository. Photogramm. Eng. Remote Sens. 2010, 76, 1007–1018. [Google Scholar] [CrossRef]
- Dodet, G.; Bertin, X.; Taborda, R. Wave climate variability in the North-East Atlantic Ocean over the last six decades. Ocean Model. 2010, 31, 120–131. [Google Scholar] [CrossRef]
- Hoek, E. Practical Rock Engineering (2007 Edition). Available online: https://www.rocscience.com/learning/hoek-s-corner/books (accessed on 10 October 2017).
Figure 1.
Localization and setting of the Sintra and Cascais coast areas. Small inset with general localization. (Left) geological map with localization of cliff failures occurred between 1947 and 2010; 1—Beach sands; 2—Dunes; 3—Alluvium; 4—Pleistocene; 5—Miocene; 6—Paleogene; 7—Lisbon volcanic complex; 8—Upper Cretaceous; 9—Lower Cretaceous; 10—Upper Jurassic; 11—Igneous dikes; 12—Gabro and diorite; 13—Sienite; 14—Granite (description in text). (Right) Cliff extent (red line) and cliff failures over digital terrain model (DTM) with cliff sectors considered for cliff retreat computing (A to I).
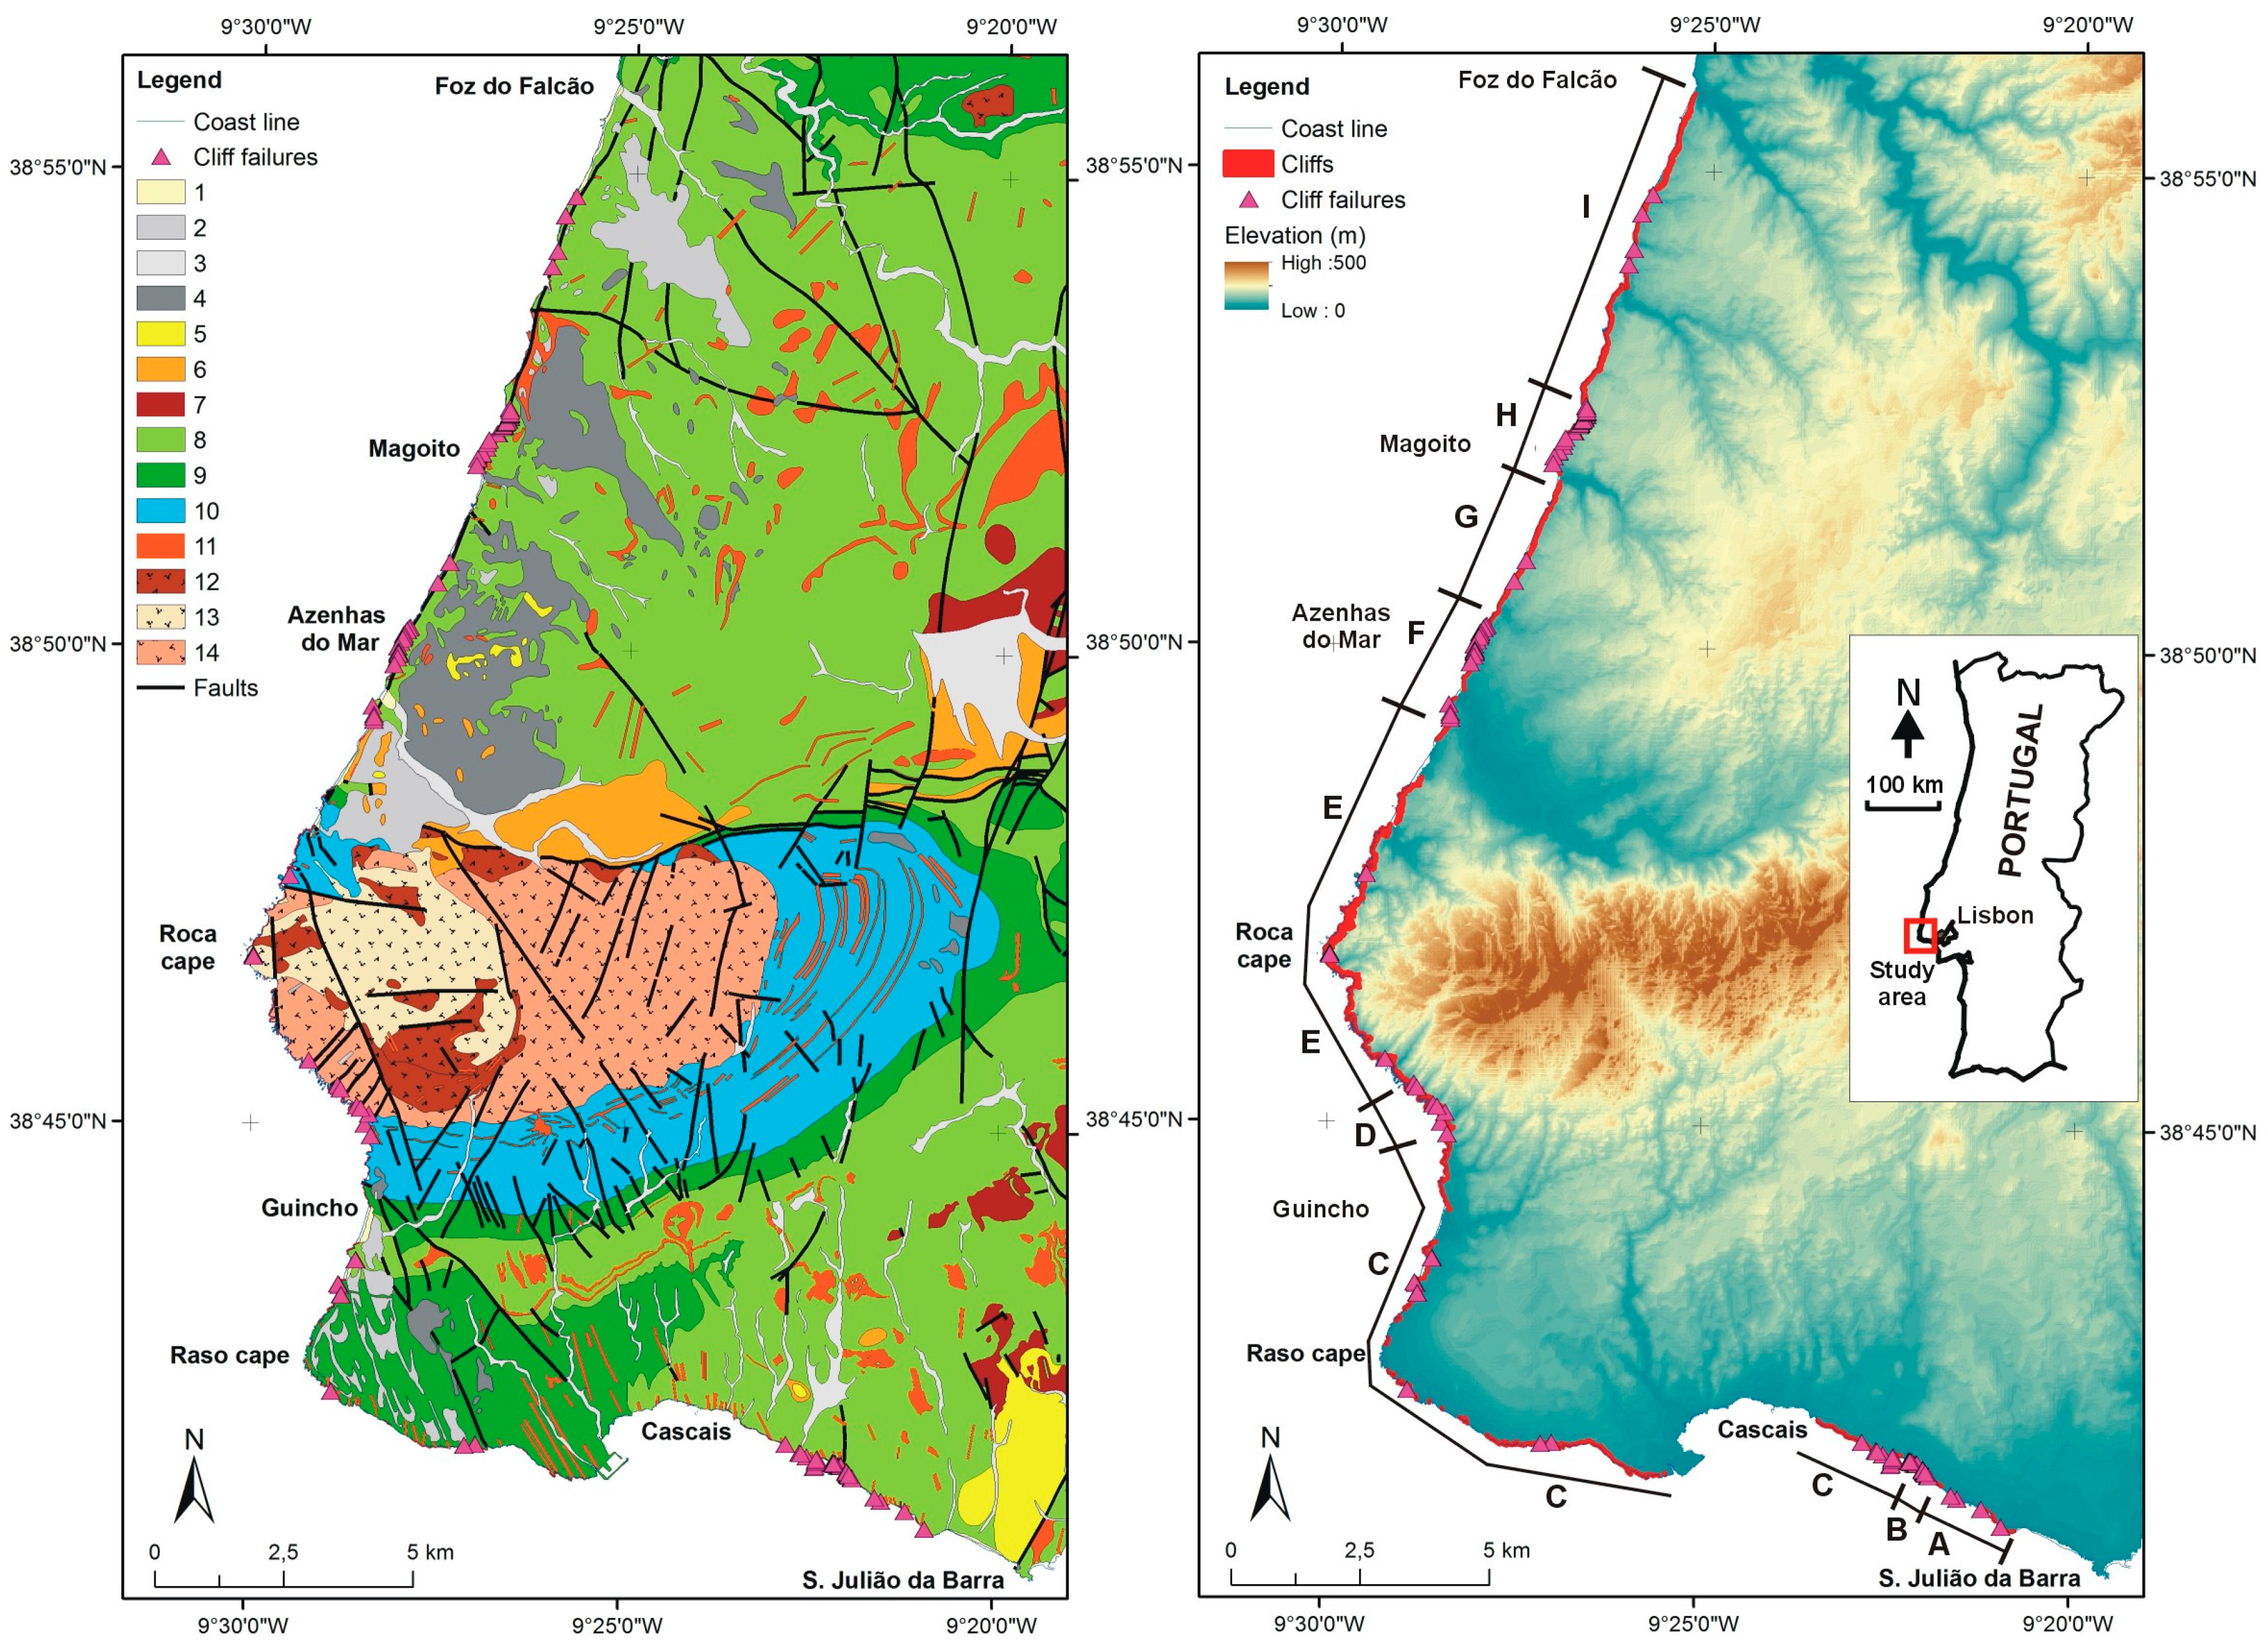
Figure 2.
(a) Space distribution of number of cliff failures along cliff length, from the SE end of the study area (left) to the northern end (right) with colors indicating cliff failures lithology. (b) Space distribution of cumulative planimetric area lost at the cliff top caused by failures, along cliff length, with the limits of cliff sectors considered for cliff retreat computing (A to I, see text and Table 1). Regression lines and the equations slopes are measures of global cliff retreat rate, considering all failures (doted lines) and not considering the large translational failure at the northern end of the study area (plain lines). Main lithology of cliff failures: 1—Marls and limestones; 2—Sandstones and marls; 3—Limestones; 4—Limestones and marls; 5—Plutonic rocks (Sintra massif).


Figure 3.
Maximum cliff top retreat caused by failures against cliff height. Square indicates the large translational slide occurred in the northern end of the study area.
Figure 3.
Maximum cliff top retreat caused by failures against cliff height. Square indicates the large translational slide occurred in the northern end of the study area.
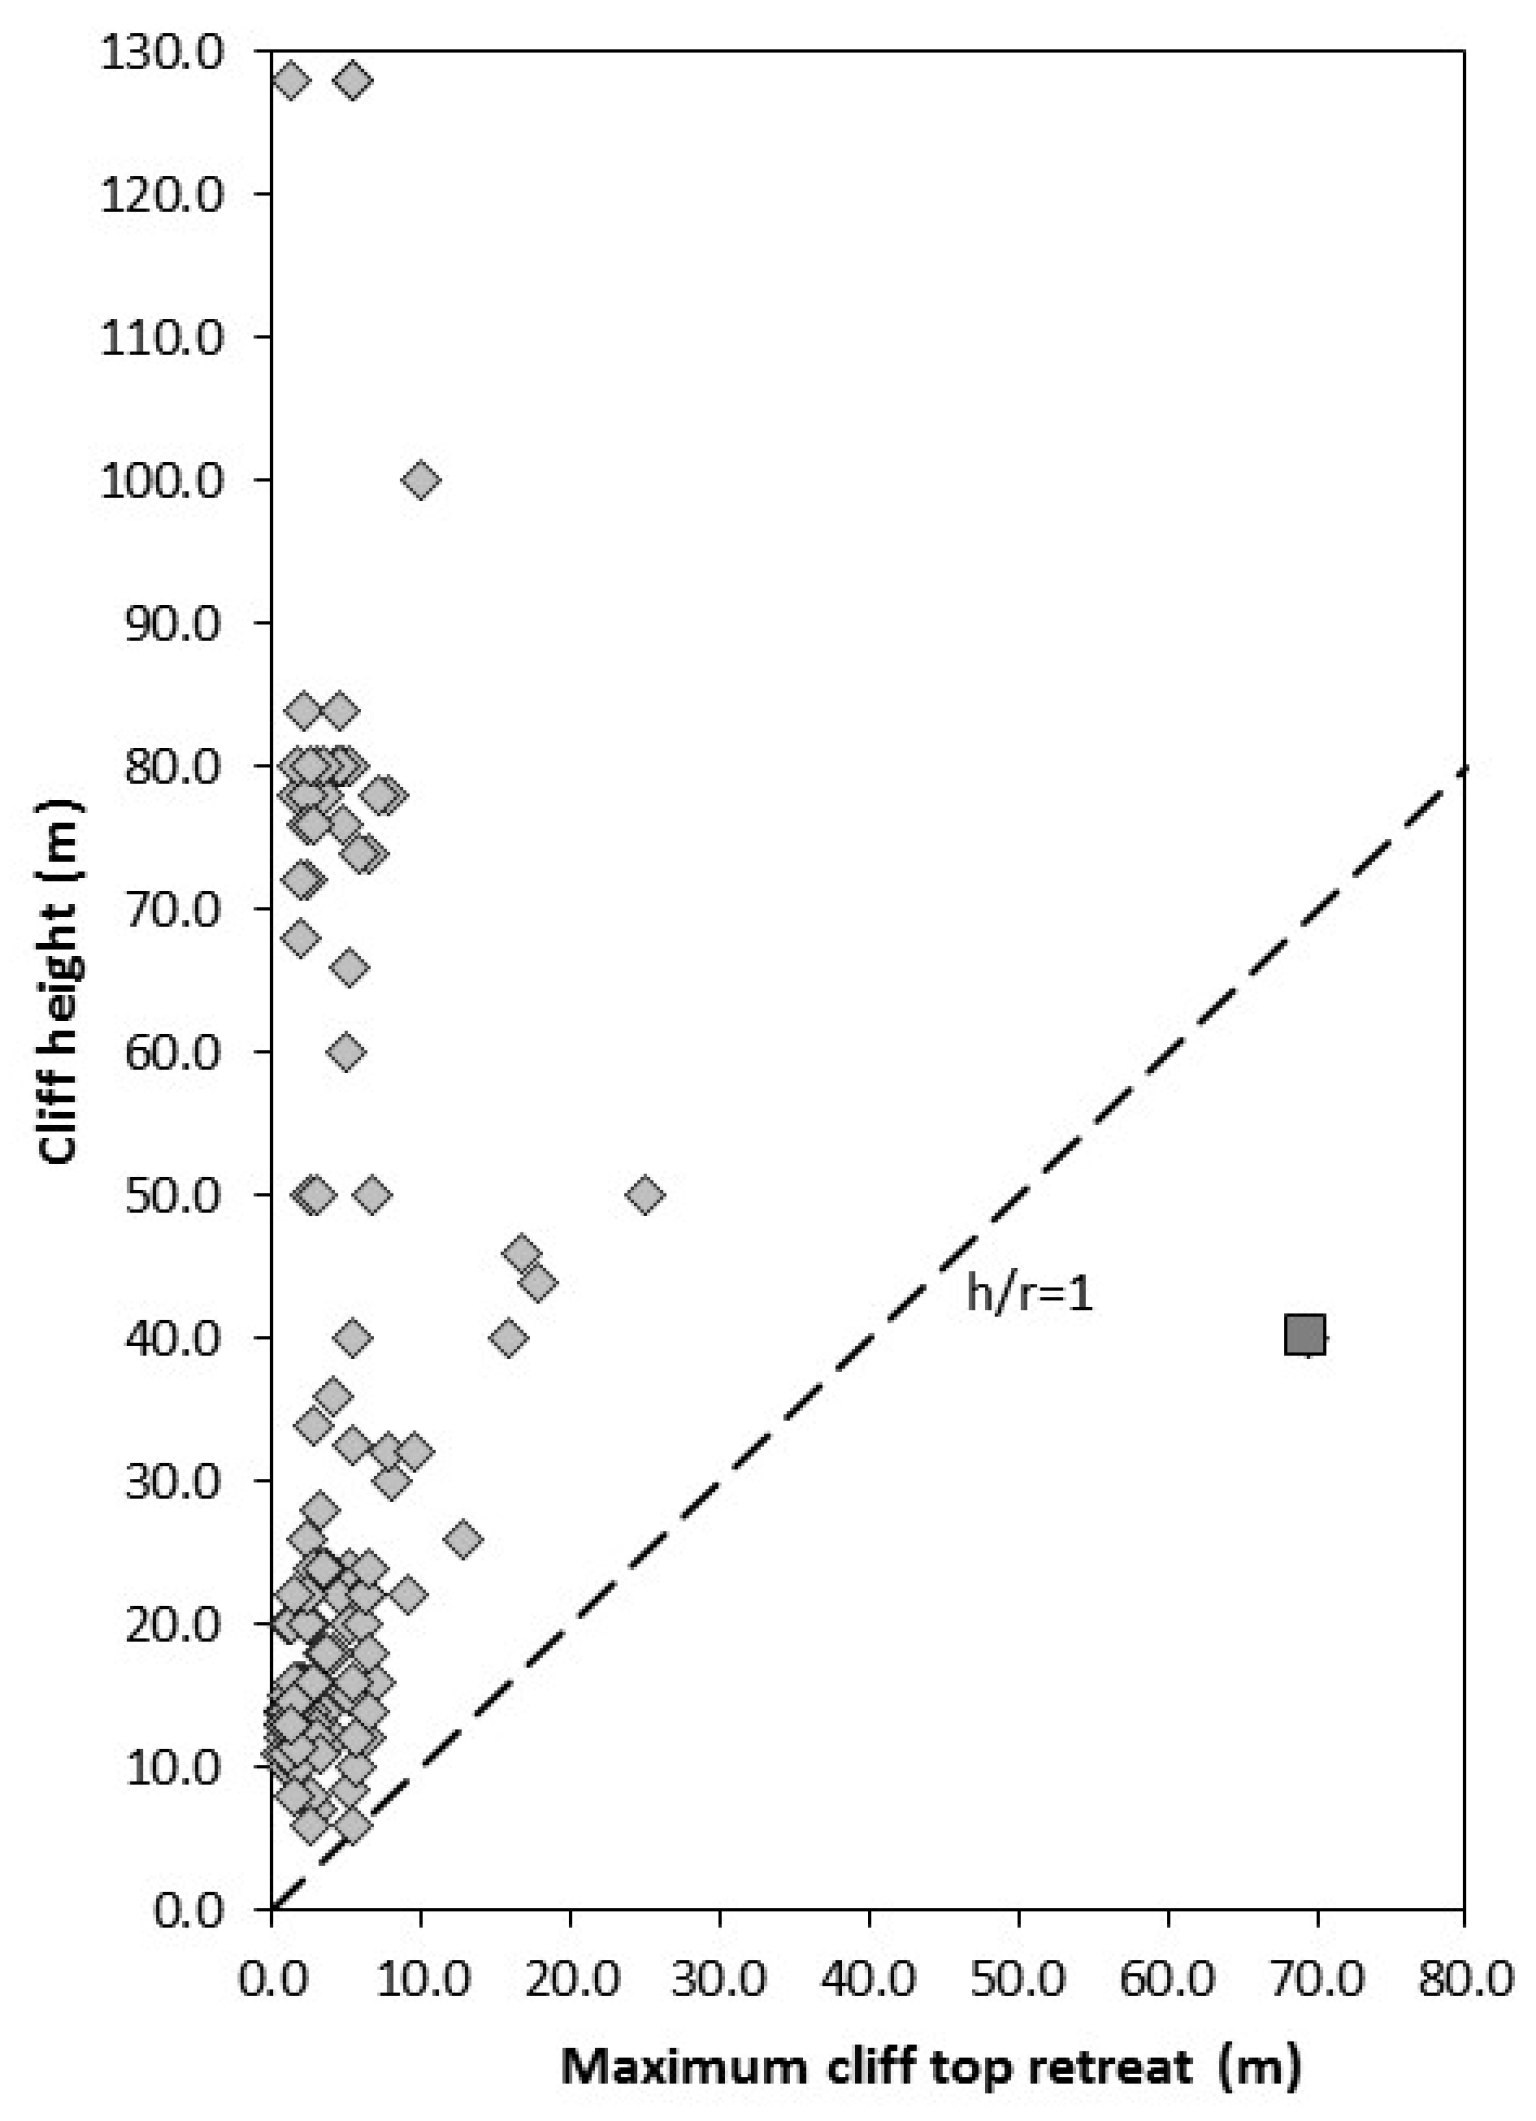
Figure 4.
Maximum cliff top retreat (a) and kernel density estimation (KDE) (b). Planimetric area lost at the cliff top (c) and KDE without the large translational slide occurred in the northern end of the study area (d). Length of cliff affected (e) and KDE (f). Histograms with log based bins.
Figure 4.
Maximum cliff top retreat (a) and kernel density estimation (KDE) (b). Planimetric area lost at the cliff top (c) and KDE without the large translational slide occurred in the northern end of the study area (d). Length of cliff affected (e) and KDE (f). Histograms with log based bins.


Figure 5.
ROC curves of the models produced with the corresponding areas under the curves (AUC). Legend: LR all—Logistic regression with all factors; LR fc—Logistic regression forward conditional.
Figure 5.
ROC curves of the models produced with the corresponding areas under the curves (AUC). Legend: LR all—Logistic regression with all factors; LR fc—Logistic regression forward conditional.
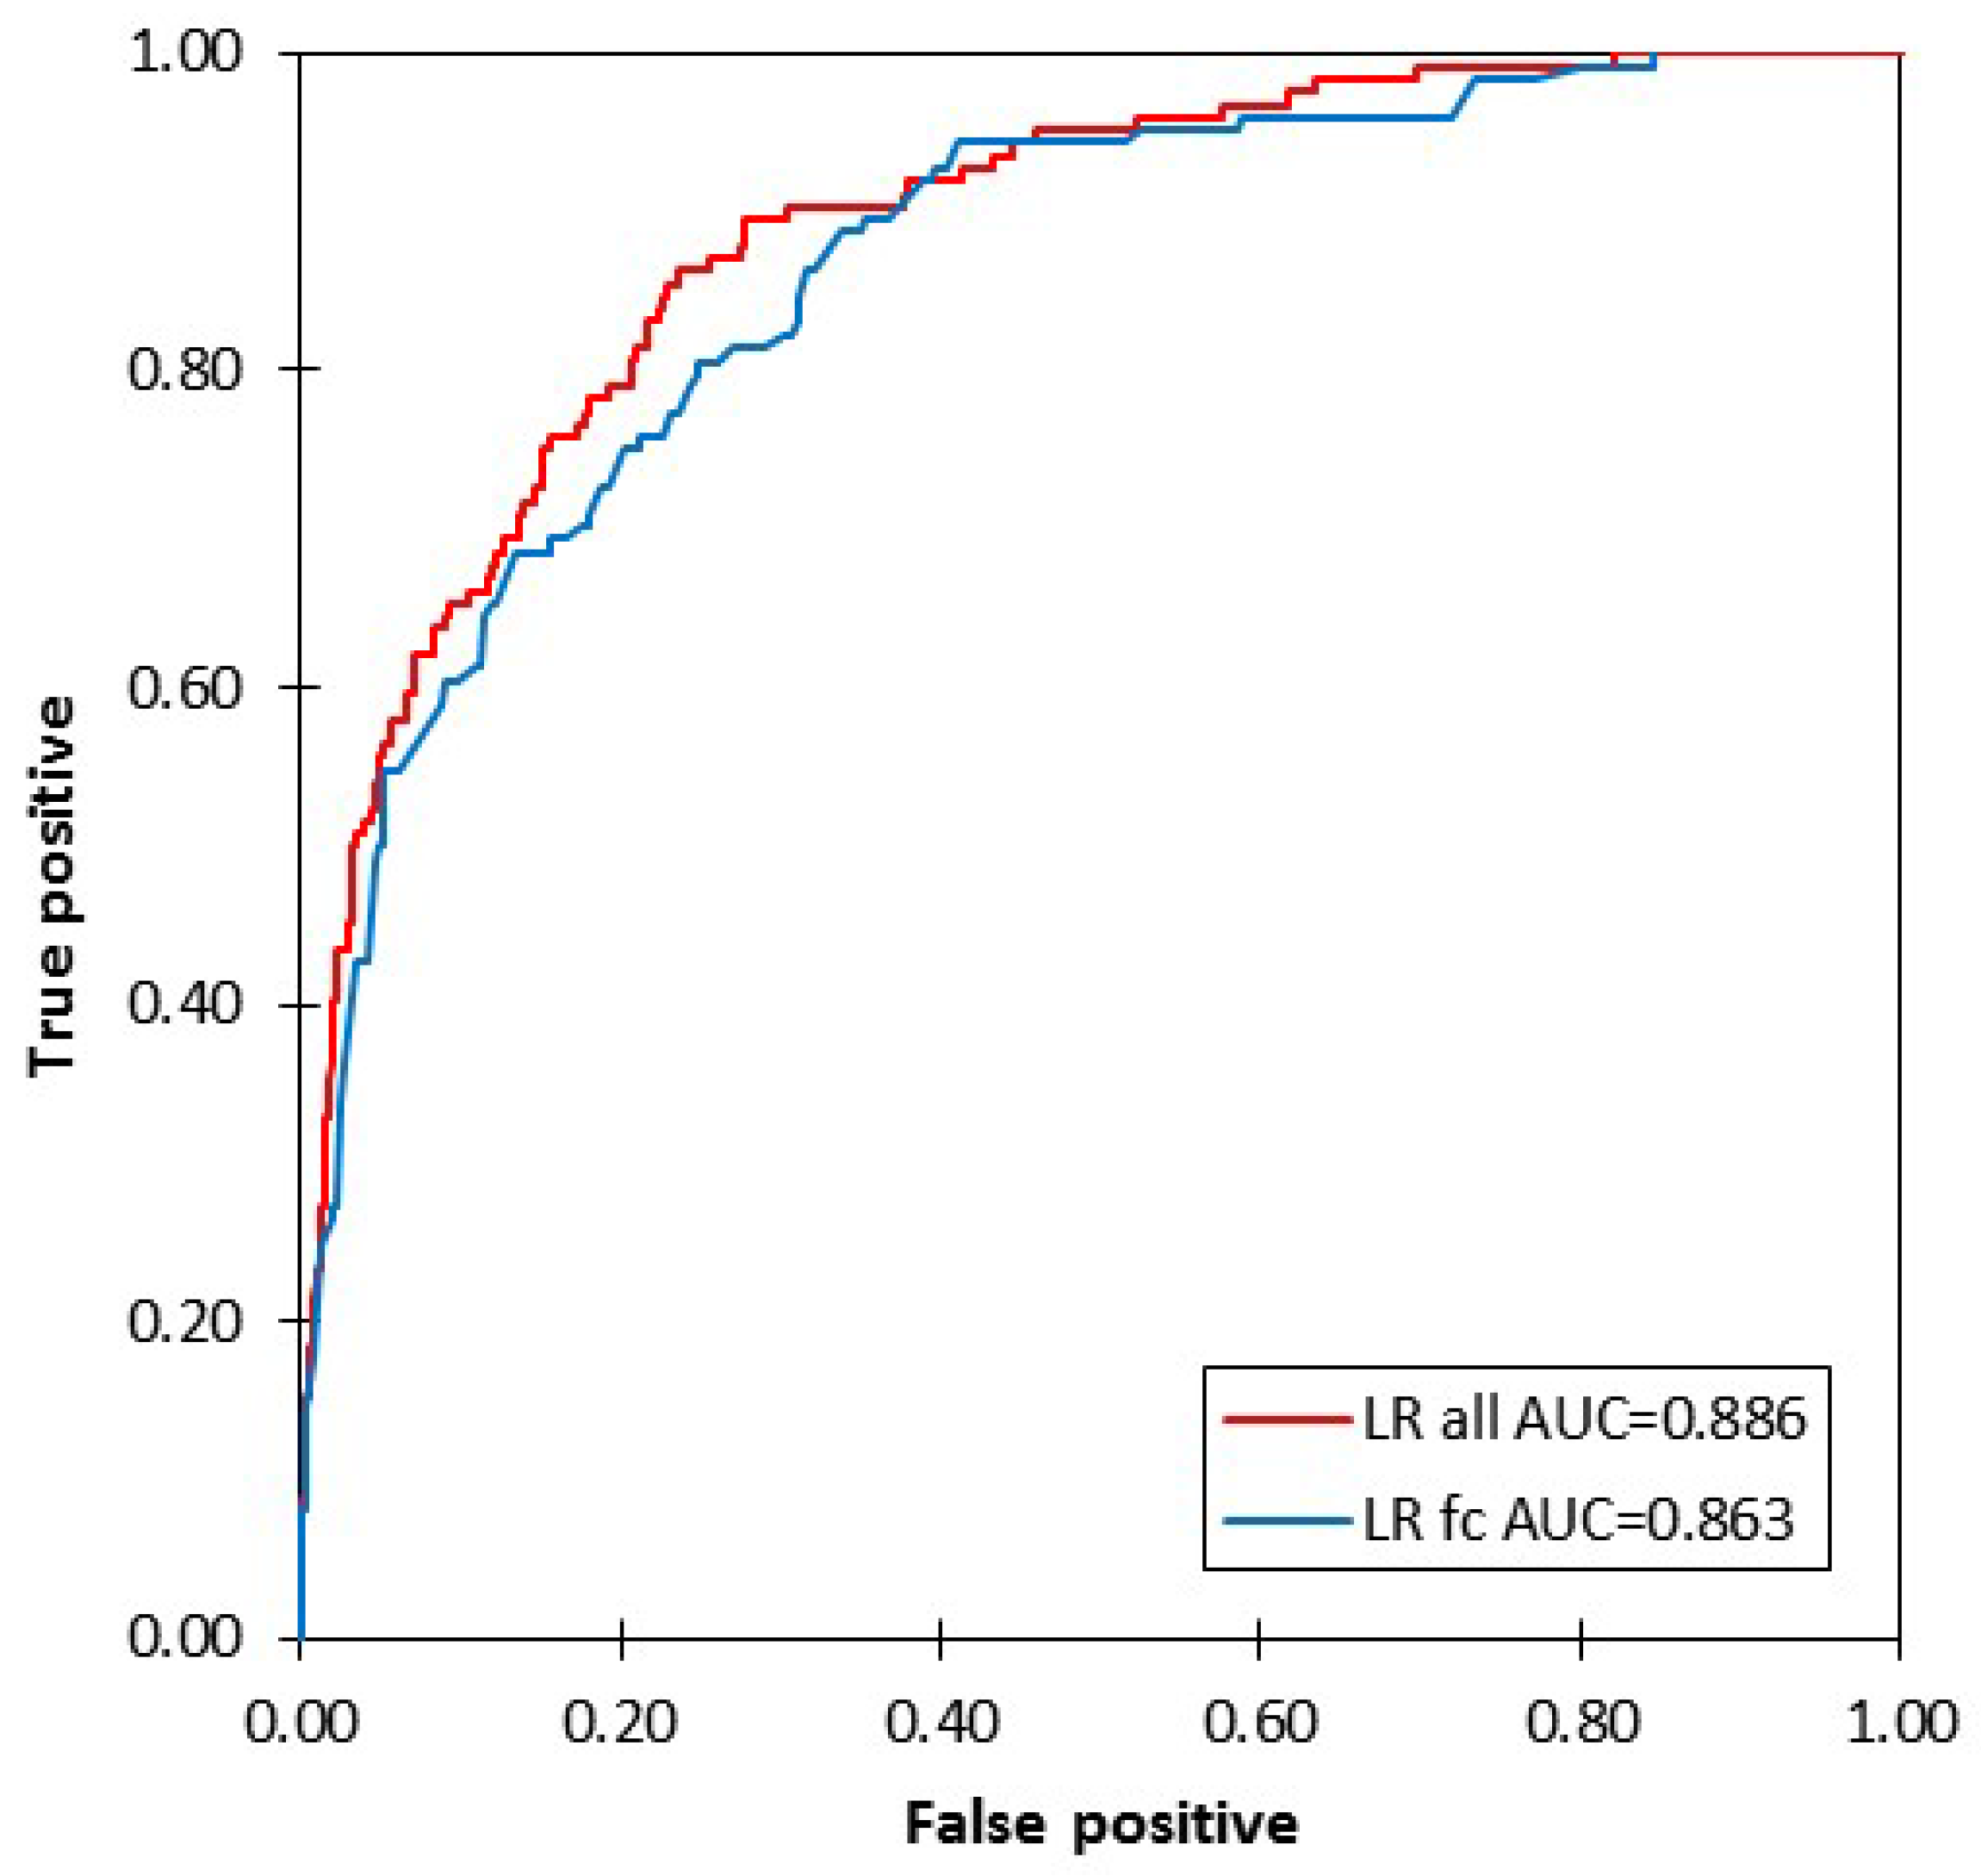
Figure 6.
Susceptibility mapping (1/4) based on the logistic regression model with all factors, with indication (dot) of the terrain units with cliff failures, for cliff sections 1 to 4, with general legend and localization map with numbered boxes indicating the extent of the cliff sections. Classification of logistic regression probability values in quantile-based classes. Contour line interval is 2 m.

Figure 7.
Susceptibility mapping (2/4) based on the logistic regression model with all factors, with indication (dot) of the terrain units with cliff failures, for cliff sections 5 and 6, with general legend and localization map with numbered boxes indicating the extent of the cliff sections. Classification of logistic regression probability values in quantile-based classes. Contour line interval is 2 m.
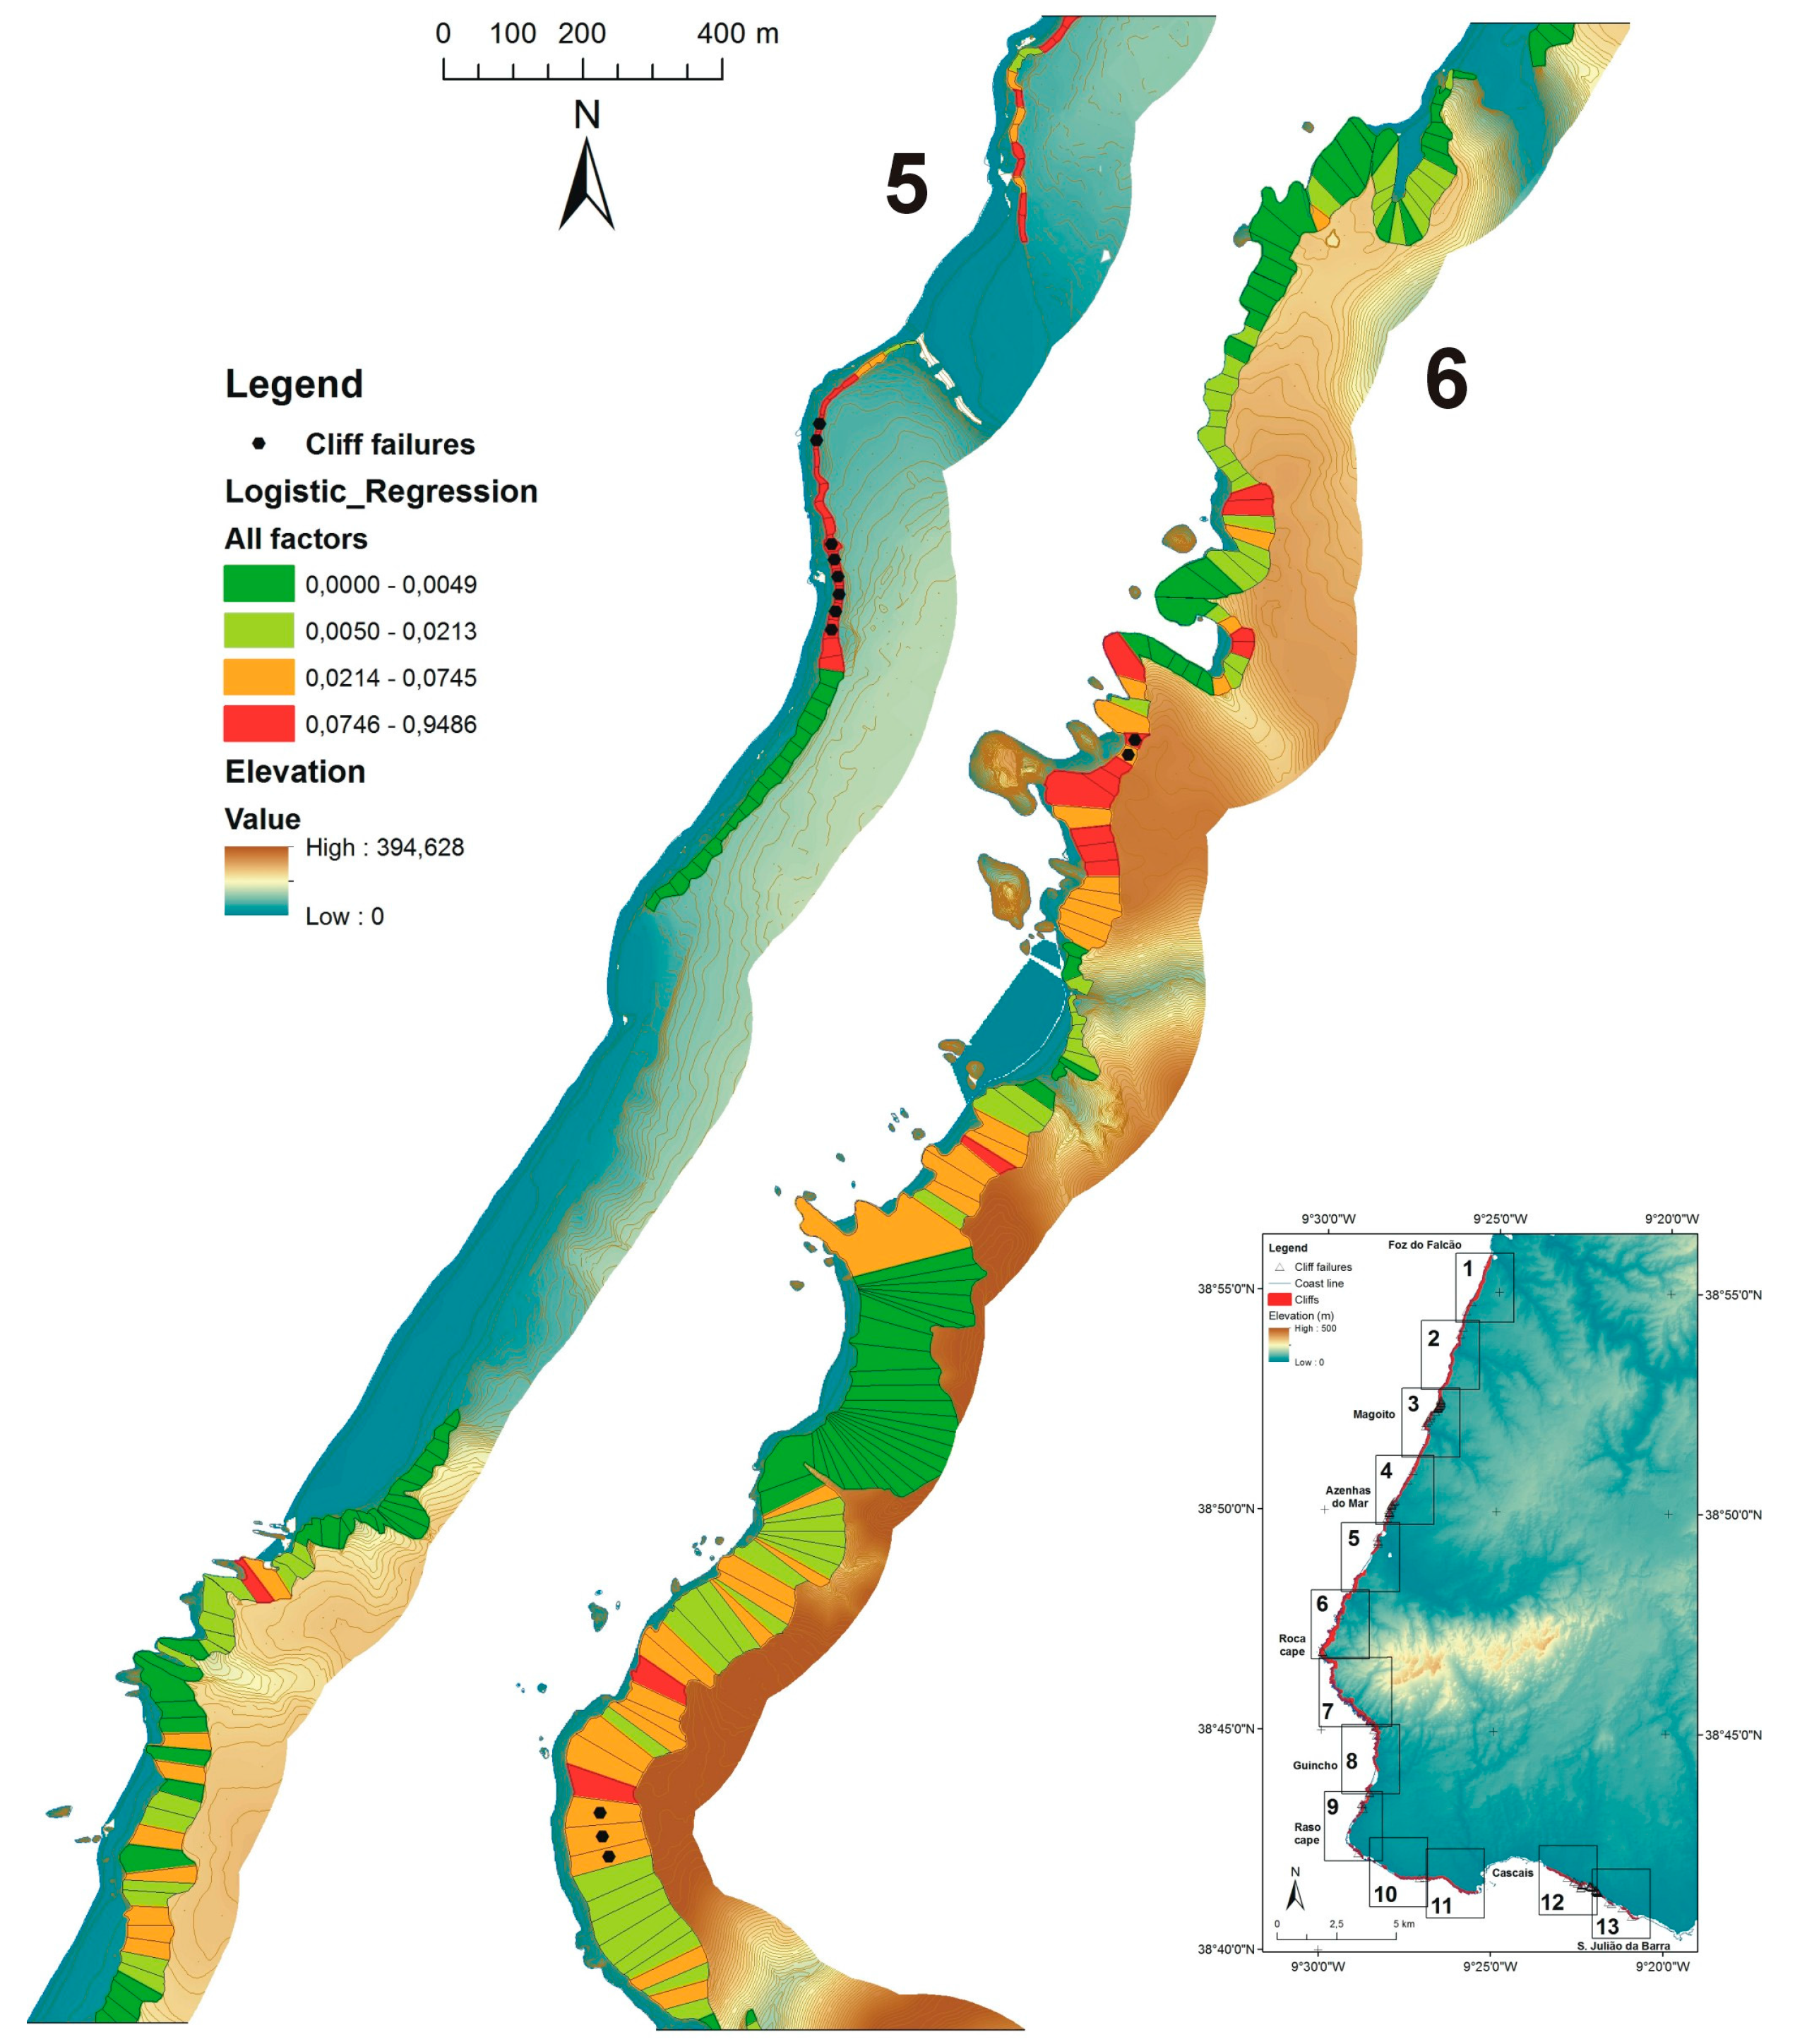
Figure 8.
Susceptibility mapping (3/4) for cliff sections 7 to 9 (legend as Figure 7).
Figure 8.
Susceptibility mapping (3/4) for cliff sections 7 to 9 (legend as Figure 7).
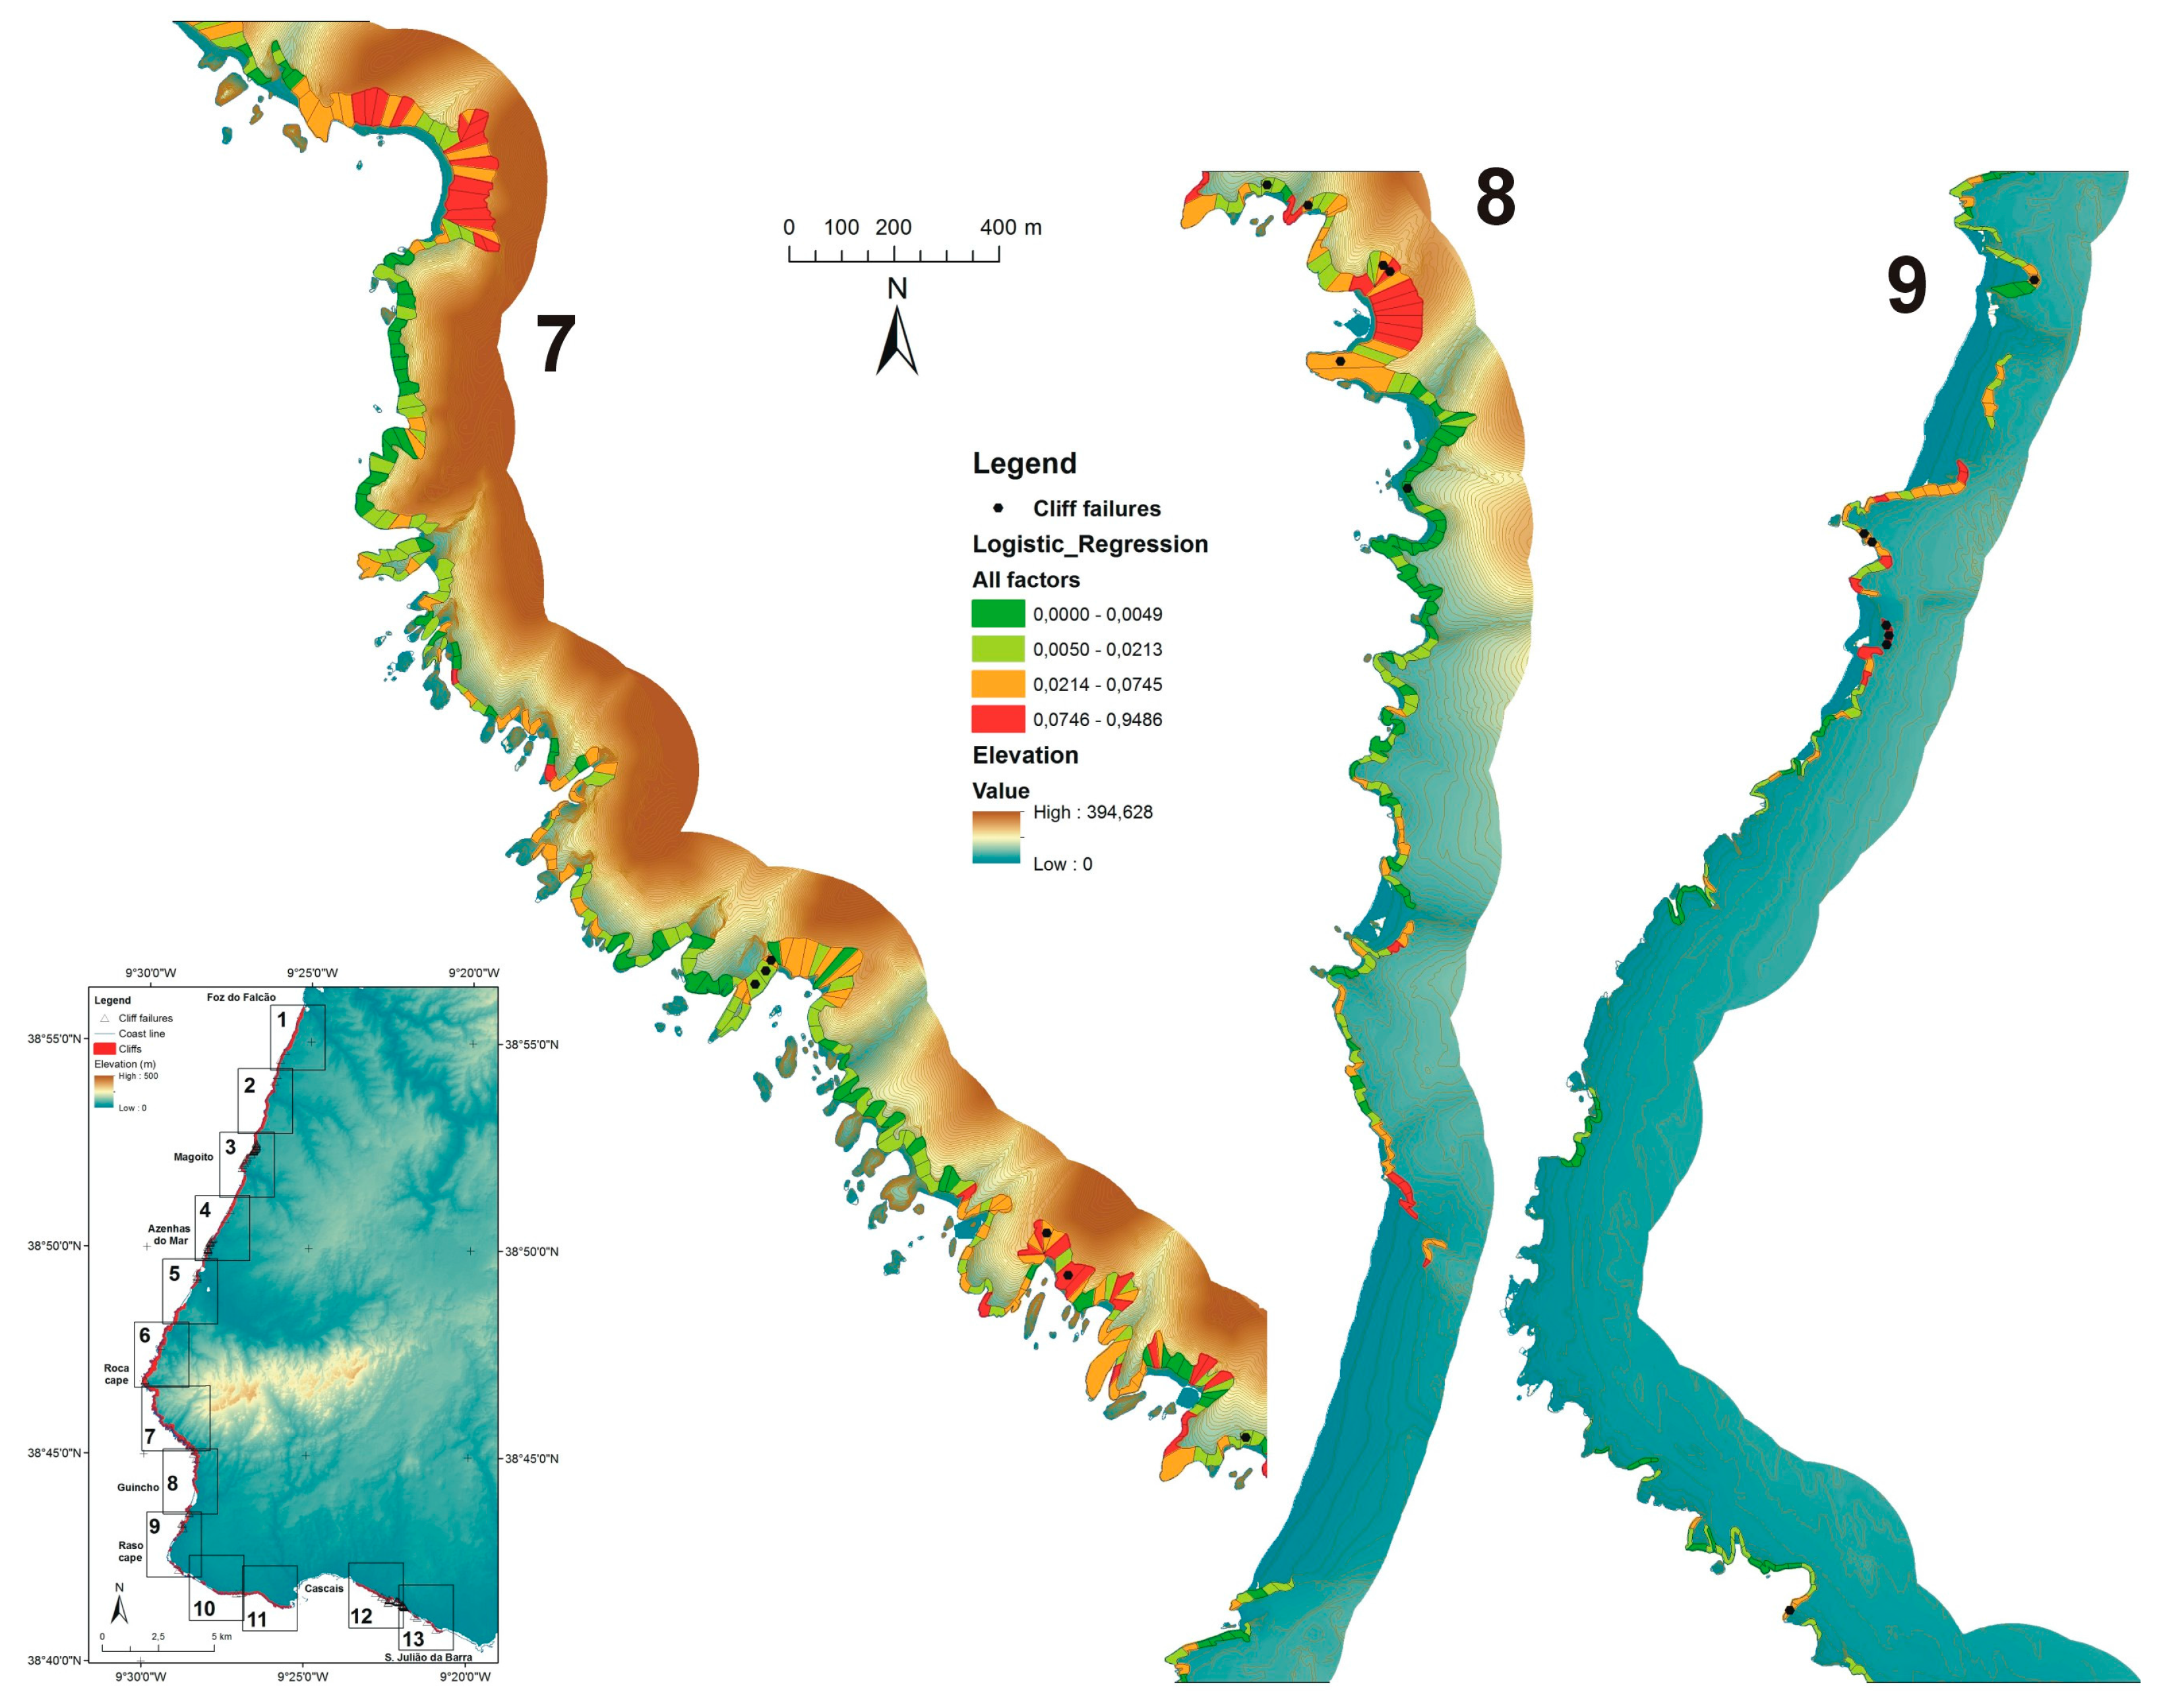
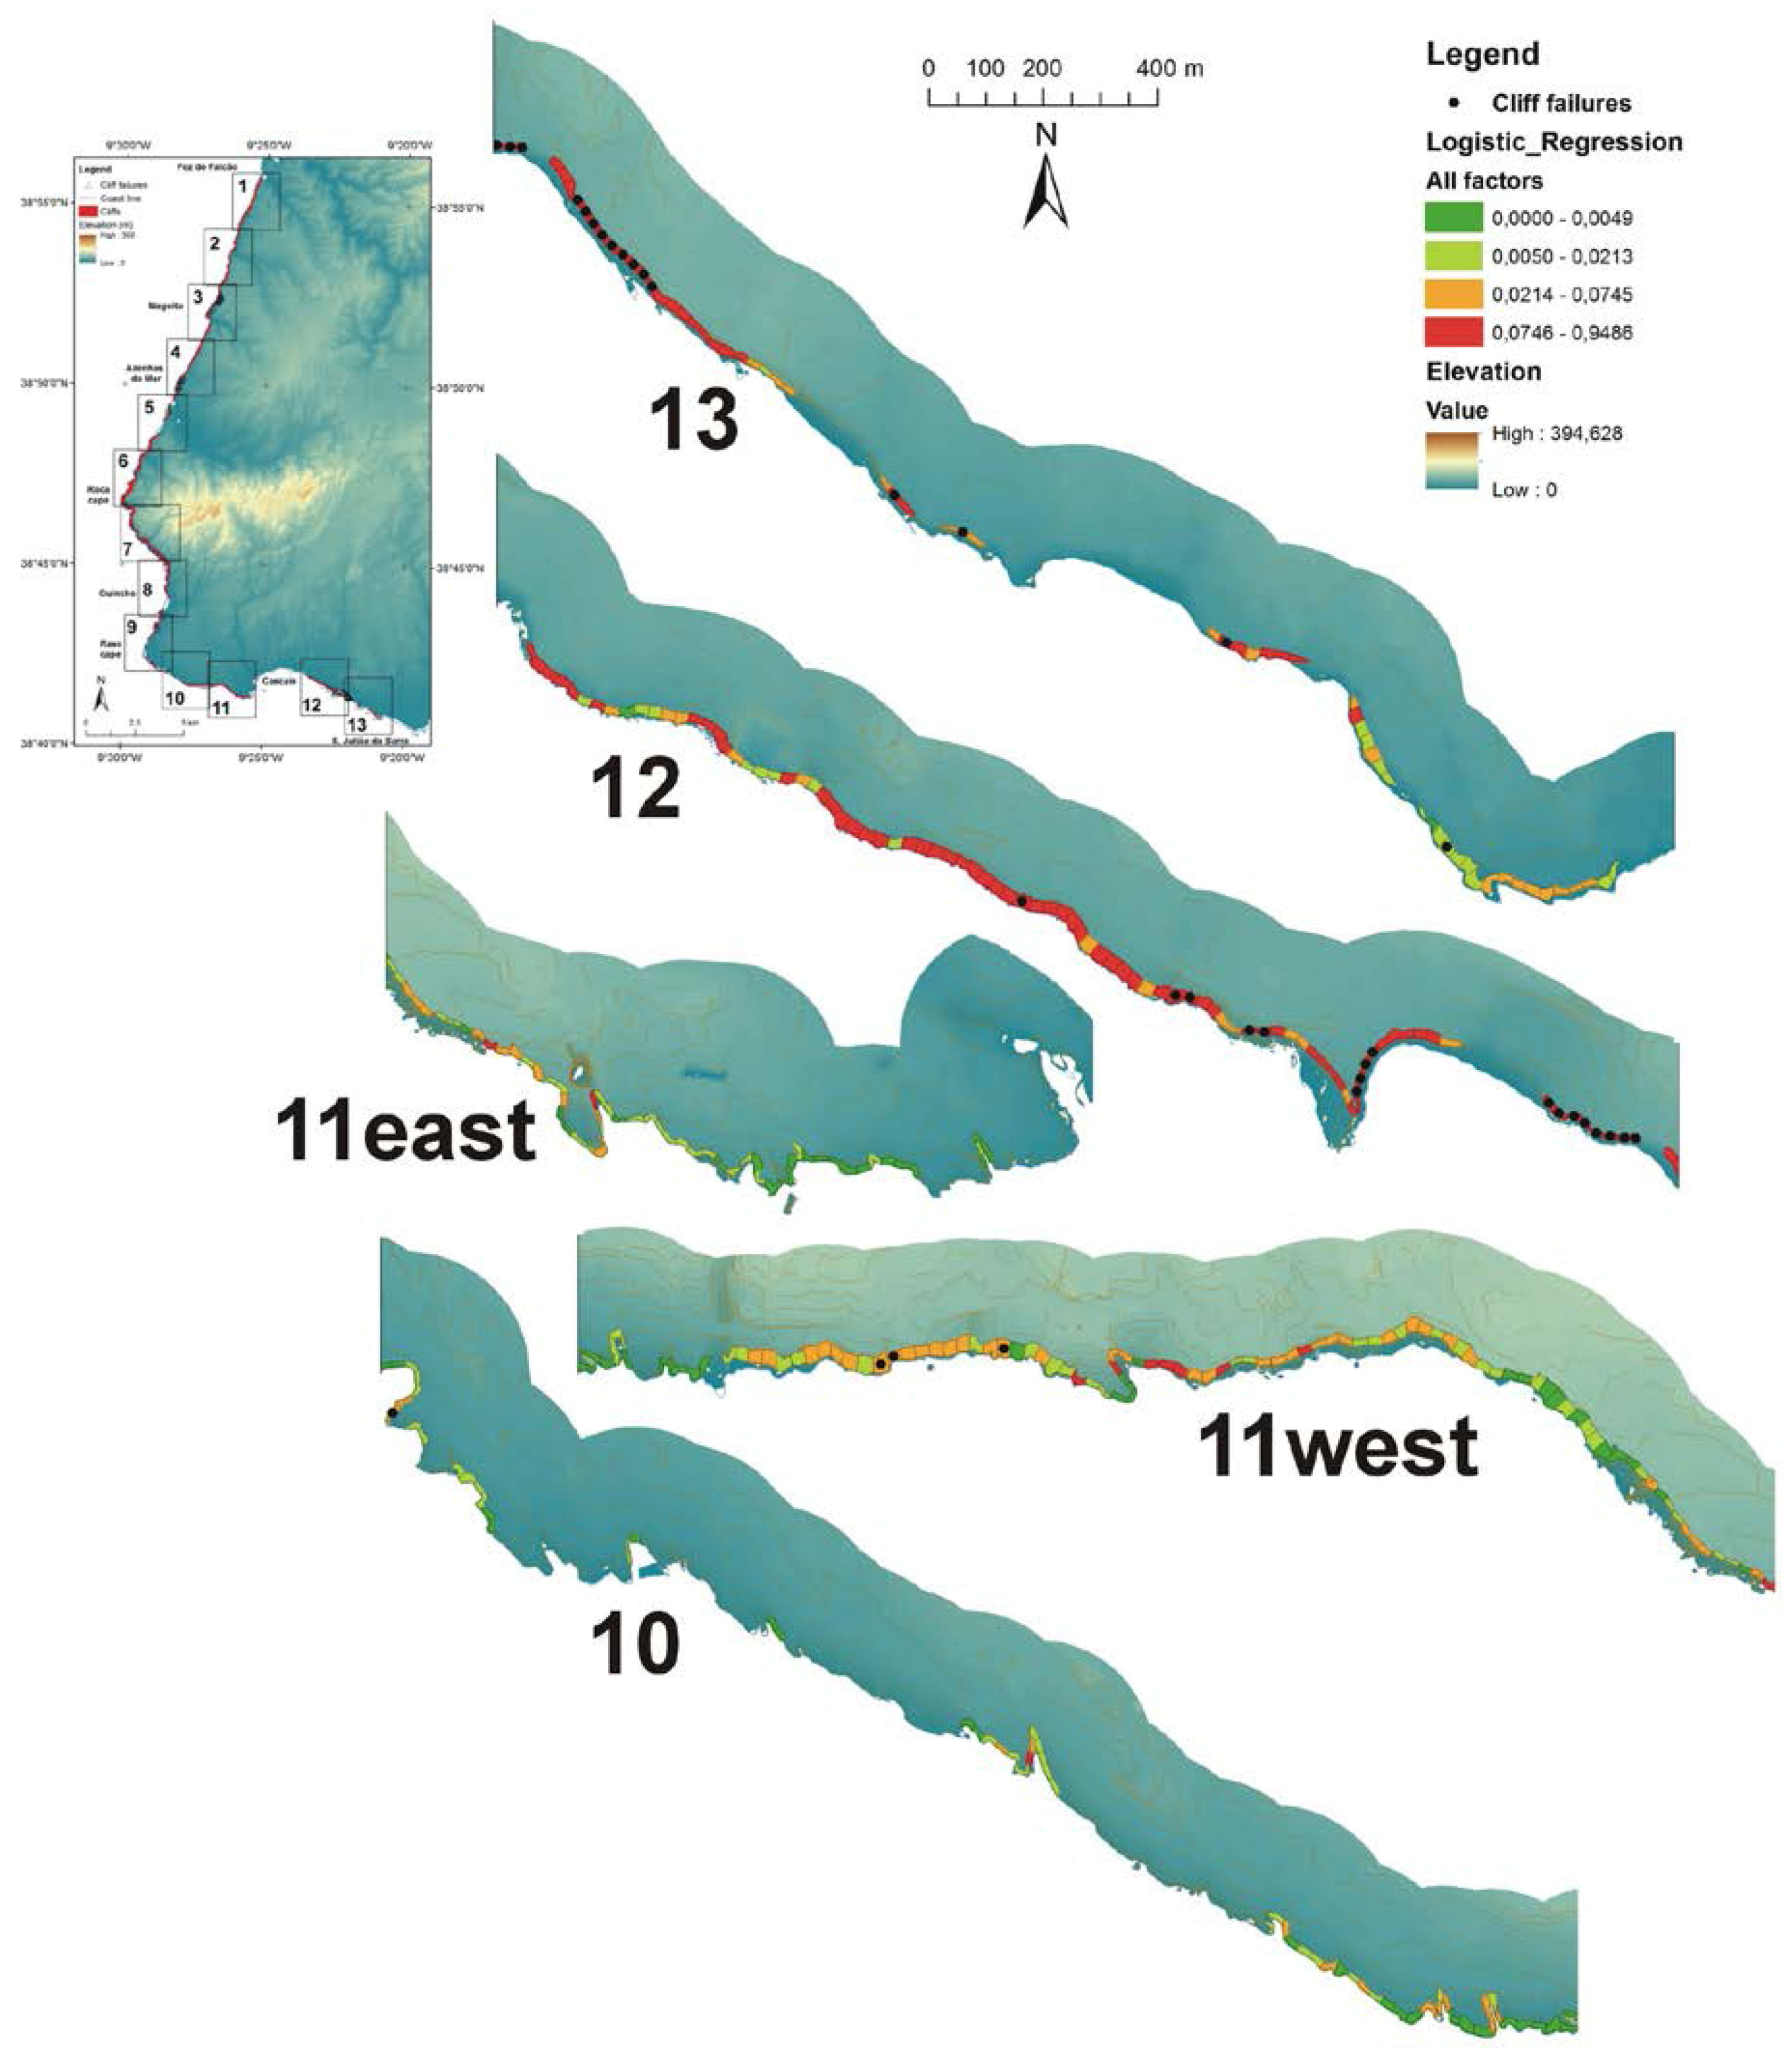
Figure 9.
Susceptibility mapping (4/4) for cliff sections 10 to 13 (legend as Figure 7).
Figure 9.
Susceptibility mapping (4/4) for cliff sections 10 to 13 (legend as Figure 7).

Table 1.
Mean annual cliff retreat rates computed from linear regression of the space distribution of planimetric area lost at the cliffs top. Sector extension in Figure 1 and Figure 2b, and lithology in Figure 2b.
| Cliff Sectors | Linear Regression Slope | Retreat Rate (m/year) | Cliff Section Lenght (km) | |
|---|---|---|---|---|
| Beginning | End | |||
| Global | 0.1527 | 0.0024 | 0.00 | 41.45 |
| Without large landslide | 0.1458 | 0.0023 | 0.00 | 38.71 |
| Sector A | 0.106 | 0.0017 | 0.00 | 1.07 |
| Sector B | 1.7064 | 0.0271 | 1.07 | 1.50 |
| Sector C | 0.0493 | 0.0008 | 1.50 | 13.81 |
| Sector D | 0.6023 | 0.0096 | 13.81 | 14.97 |
| Sector E | 0.096 | 0.0015 | 14.97 | 27.42 |
| Sector F | 0.3349 | 0.0053 | 27.42 | 29.32 |
| Sector G | 0.0164 | 0.0003 | 29.32 | 32.89 |
| Sector H | 1.4859 | 0.0236 | 32.89 | 34.38 |
| Sector I | 0.0108 | 0.0002 | 34.38 | 38.71 |
Table 2.
Variable classification of factors with number of terrain units (TU), terrain units with cliff failures and Logistic Regression constant ε and β values.
Table 2.
Variable classification of factors with number of terrain units (TU), terrain units with cliff failures and Logistic Regression constant ε and β values.
| Factor | Variable | TUs | TUs with Cliff Failures | LR All Factors β | LR fw. Cond. β |
|---|---|---|---|---|---|
| Lithology | Sandstones, limestones, marls | 16 | 0 | - | - |
| Basalt | 22 | 0 | −2.299 | −2.615 | |
| Dolomitic limestones | 238 | 4 | 16.027 | 16.372 | |
| Granitic rocks | 369 | 12 | 15.156 | 15.386 | |
| Limestone, marls, basalt | 39 | 0 | −2.776 | −2.988 | |
| Limestones | 174 | 4 | 17.042 | 16.803 | |
| Limestones, marls | 463 | 62 | 17.610 | 17.549 | |
| Marls, limestones | 307 | 34 | 16.721 | 16.630 | |
| Marls, sandstones, limestones | 13 | 0 | 16.617 | 16.833 | |
| Sandstones | 17 | 8 | 19.954 | 19.572 | |
| Toe | None (plunging cliffs) | 558 | 14 | - | - |
| protection | Platform | 80 | 20 | 2.463 | 2.267 |
| Blocks | 588 | 60 | 1.168 | 1.033 | |
| Blocks, Platform | 83 | 15 | 0.938 | 1.049 | |
| Beach | 281 | 15 | 0.479 | 0.420 | |
| Beach, Platform | 6 | 0 | −16.958 | −17.134 | |
| Beach, Blocks | 57 | 0 | −17.036 | −17.534 | |
| Beach, Blocks, Platform | 5 | 0 | −17.830 | −17.331 | |
| Cliff height | 96–142 | 97 | 5 | - | - |
| 4–12 | 229 | 5 | −2.384 | −3.200 | |
| 12–18 | 198 | 25 | −1.658 | −1.512 | |
| 18–26 | 212 | 40 | −0.657 | −0.600 | |
| 26–37 | 174 | 8 | −2.268 | −2.411 | |
| 37–48 | 143 | 14 | −1.738 | −1.623 | |
| 48–60 | 225 | 5 | −2.433 | −2.584 | |
| 60–72 | 153 | 5 | −1.944 | −1.869 | |
| 72–96 | 227 | 17 | −0.305 | −0.343 | |
| Wave Power | 23,000–26,300 | 301 | 16 | - | - |
| 3200–6500 | 171 | 30 | 1.320 | 1.113 | |
| 6500–9800 | 123 | 3 | 0.172 | −0.130 | |
| 9800–13,100 | 143 | 7 | 2.303 | 2.480 | |
| 13,100–16,400 | 208 | 4 | 0.985 | 0.934 | |
| 16,400–19,700 | 323 | 33 | 1.993 | 1.805 | |
| 19,700–23,000 | 389 | 31 | 1.287 | 1.096 | |
| Structure | Superior to slope | 219 | 3 | - | - |
| Against slope | 26 | 6 | 2.029 | 2.641 | |
| Horizontal | 990 | 95 | 1.661 | 1.983 | |
| Inferior to slope | 7 | 6 | 5.959 | 5.696 | |
| Massive | 398 | 14 | 2.464 | 2.051 | |
| Parallel to slope | 18 | 0 | −16.742 | −16.282 | |
| Slope max. | 78–86 | 161 | 7 | - | - |
| 30–52 | 192 | 12 | 0.838 | - | |
| 52–58 | 176 | 13 | 1.002 | - | |
| 58–62 | 178 | 20 | 1.290 | - | |
| 62–66 | 203 | 19 | 1.026 | - | |
| 66–69 | 149 | 11 | 0.624 | - | |
| 69–72 | 190 | 4 | −0.620 | - | |
| 72–75 | 224 | 22 | 0.841 | - | |
| Slope max. | 75–78 | 185 | 16 | 0.605 | - |
| Aspect | NW | 462 | 33 | - | - |
| N | 79 | 2 | −0.799 | - | |
| NE | 16 | 0 | −17.887 | - | |
| E | 19 | 1 | 0.120 | - | |
| SE | 66 | 6 | 0.457 | - | |
| S | 190 | 10 | −0.229 | - | |
| SW | 329 | 25 | −0.092 | - | |
| W | 497 | 47 | 0.394 | - | |
| Plan | Highly convex | 78 | 10 | - | - |
| Curvature | Highly concave | 97 | 10 | −0.215 | - |
| Slightly concave | 231 | 14 | −0.852 | - | |
| Planar | 945 | 76 | −0.671 | - | |
| Slightly convex | 307 | 14 | −1.297 | - | |
| Profile | Highly convex | 89 | 12 | - | - |
| curvature | Highly concave | 251 | 26 | −0.776 | - |
| Slightly concave | 323 | 24 | −0.663 | - | |
| Planar | 783 | 48 | −0.828 | - | |
| Slightly convex | 212 | 14 | −0.787 | - | |
| Slope mean | 64–76 | 68 | 6 | - | - |
| 12–26 | 67 | 1 | −2.050 | - | |
| 26–34 | 163 | 16 | −0.373 | - | |
| 34–40 | 206 | 13 | −0.798 | - | |
| 40–45 | 222 | 14 | −0.856 | - | |
| 45–49 | 226 | 20 | −0.225 | - | |
| 49–53 | 265 | 21 | −0.196 | - | |
| 53–58 | 241 | 20 | −0.043 | - | |
| 58–64 | 200 | 13 | −0.852 | - | |
| Slope Stdv | 14.1–23.0 | 234 | 16 | - | - |
| 2.48–6.8 | 238 | 15 | −1.320 | - | |
| 6.8–8.3 | 234 | 13 | −0.970 | - | |
| 8.3–9.7 | 251 | 21 | −0.684 | - | |
| 9.7–11.1 | 230 | 15 | −0.623 | - | |
| 11.1–12.6 | 235 | 23 | −0.430 | - | |
| 12.6–14.1 | 236 | 21 | −0.179 | - | |
| Faults | Fault | 196 | 11 | 0.474 | - |
| Constant | ε | - | - | −20.553 | −21.706 |
Table 3.
Receiver operating characteristics (ROC) curves and area under the curve (AUC) of Logistic Regression model for each independent predisposing factor.
Table 3.
Receiver operating characteristics (ROC) curves and area under the curve (AUC) of Logistic Regression model for each independent predisposing factor.
| Factor | AUC | Lower LimitInt. Conf. 95% | Upper LimitInt. Conf. 95% |
|---|---|---|---|
| Lithology | 0.728 | 0.688 | 0.768 |
| Toe protection | 0.716 | 0.671 | 0.76 |
| Cliff height | 0.715 | 0.67 | 0.76 |
| Wave Power | 0.669 | 0.622 | 0.717 |
| Structure | 0.662 | 0.617 | 0.707 |
| Slope max | 0.608 | 0.56 | 0.656 |
| Aspect | 0.571 | 0.521 | 0.621 |
| Plan curvature | 0.571 | 0.52 | 0.623 |
| Profile curvature | 0.569 | 0.514 | 0.623 |
| Slope mean | 0.562 | 0.511 | 0.613 |
| Slope STD | 0.558 | 0.506 | 0.611 |
| Faults | 0.516 | 0.464 | 0.586 |
© 2018 by the author. Licensee MDPI, Basel, Switzerland. This article is an open access article distributed under the terms and conditions of the Creative Commons Attribution (CC BY) license (http://creativecommons.org/licenses/by/4.0/).
Share and Cite
MDPI and ACS Style
Marques, F. Regional Scale Sea Cliff Hazard Assessment at Sintra and Cascais Counties, Western Coast of Portugal. Geosciences 2018, 8, 80. https://doi.org/10.3390/geosciences8030080
AMA Style
Marques F. Regional Scale Sea Cliff Hazard Assessment at Sintra and Cascais Counties, Western Coast of Portugal. Geosciences. 2018; 8(3):80. https://doi.org/10.3390/geosciences8030080
Chicago/Turabian StyleMarques, Fernando. 2018. "Regional Scale Sea Cliff Hazard Assessment at Sintra and Cascais Counties, Western Coast of Portugal" Geosciences 8, no. 3: 80. https://doi.org/10.3390/geosciences8030080
Note that from the first issue of 2016, this journal uses article numbers instead of page numbers. See further details here.