Article

A Basin Approach to a Hydrological Service Delivery System in the Amur River Basin

by
Sergei Borsch
1,
Andrei Khristoforov
1,
Vladimir Krovotyntsev
2,
Ekaterina Leontieva
1,
Yuri Simonov
1,* and
Victoria Zatyagalova
2,*
1
Hydrometcentre of Russia, Moscow 123242, Russia
2
State Research Centre “Planeta”, Moscow 123242, Russia
*
Authors to whom correspondence should be addressed.
Geosciences 2018, 8(3), 93; https://doi.org/10.3390/geosciences8030093
Submission received: 30 November 2017 / Revised: 12 February 2018 / Accepted: 28 February 2018 / Published: 9 March 2018
(This article belongs to the Special Issue Hydrological and Hydrogeological Risks)

Abstract

:
This paper presents the basin approach to the design, development, and operation of a hydrological forecasting and early warning system in a large transboundary river basin of high flood potential, where accurate, reliable, and timely available daily water-level and reservoir-inflow forecasts are essential for water-related economic and social activities (the Amur River basin case study). Key aspects of basin-scale system planning and implementation are considered, from choosing efficient forecast models and techniques, to developing and operating data-management procedures, to disseminating operational forecasts using web-GIS. The latter, making the relevant forecast data available in real time (via Internet), visual, and well interpretable, serves as a good tool for raising awareness of possible floods in a large region with transport and industrial hubs located alongside the Amur River (Khabarovsk, Komsomolsk-on-Amur).

1. Introduction

Nowadays, early warning systems in flood forecasting have become an important feature of any national hydrological service that faces the threat of flooding [1,2,3]. There are many highly developed and developing national flood warning systems that serve end users on a national scale [4]. Such systems contribute to a high extent to hydrological service delivery systems, as in the result of such warning systems’ operations there are many products generated: from flood alerts to more comprehensive hydrological conditions products, e.g., flood extent calculation. The power of such systems is that they cover a wide range of actions—from data collection and processing to hydrological modeling, analysis, and dissemination to clients.
Due to large areas and very different climatic and natural conditions and thus flood formation processes, there is no single early warning system in flood forecasting; thus, river basin approaches are taken. This paper describes such an approach for a selected river basin in the Far East of Russia, the Amur River, which is the main river of that area and one of the largest rivers in the world. It is 2800 km long (from the confluence of the Shilka and Argun rivers, Russia) and has a catchment area of 1.85 million km2. The average annual water discharge of the Amur River at Khabarovsk is 8300 m³/s and at Komsomolsk-on-Amur is 9600 m³/s. The Amur River is a transboundary river. Its basin is located in three states: Russia (995,000 km2, about 54% of the catchment area), China (44% of the catchment area), and Mongolia (2% of the catchment area). The Amur River is the longest transboundary river in Russia. The Argun, Amur, and Ussuri rivers form the state border between Russia and China, which is more than 3500 km long. Hydrologic regime features in brief are as follows: spring flood (20–30 days), intensive summer flood due to monsoon circulation, and low flow during winter.
In July–September 2013, catastrophic flooding occurred in the Amur River basin, affecting vast areas of Far East Russia and Northern China due to extreme sums of precipitations [5]. It had become one of the largest natural disasters of recent decades in terms of duration, extent, and economic losses. According to the Ministry of Emergency Situations of Russia (EMERCOM, Moscow, Russia), the consequences of the 2013 flooding in the Amur River basin were as follows: Over 200 settlements with populations of about 80,000 people and about 600,000 ha of agricultural land were flooded, and about 1500 km of roads and about 1000 km of power transmission lines were damaged. Large cities (Khabarovsk and Komsomolsk-on-Amur, Russia) suffered major flooding. Thousands of houses were flooded—many of them beyond repair. Tens of thousands of people were evacuated; many of them lost their homes and property. Fortunately, there was no loss of life in the 2013 flooding in Russia. Unfortunately, loss of life was reported in China. It was calculated that peak flow of the flood was as high as 464,00 m3/s with an estimated 200–250-year recurrence interval generated near the major city of Khabarovsk, in the Far East of Russia [6].
At the time of this catastrophic flood, an old flood forecast system was in operation and included partially manual data processing and thus had forecast issuance routines, an absence of qualitative and quantitative forecasts, and analytical products (first of all in format of maps) to serve end users in the region. Main user requirements in the Amur River basin are flood warnings on the Amur River and its main tributary (the Zeya River, Russia), calculation and short-term forecast of the Zeya reservoir inflow, flood inundation maps (real-time), and real-time data of different hydrometeorological elements in map, graph, and table format. This information should be available online. It was apparent that, to fill this gap, a new early warning system needed to be developed in the basin. A basin approach was developed to serve all major water-related users in a large river system, the Amur River basin. The main goal of the study was to develop the infrastructure for fully automated flood forecasting and a warning service in a large river system—beginning from data processing and finishing with forecasting product visualization and their further dissemination using GIS web technologies. The latter has become a popular practice all over the world [7,8,9,10,11,12,13]. Emphasis was put on water-level and reservoir-inflow forecasting, as the river is well known for its flood potential. The whole flood forecasting and early warning system design was developed based on the principle that an incorporated database management subsystem, hydrologic modeling and forecasting components, and web-GIS dissemination procedures provide end-users with better and more efficient access to observations, forecast products, and services.

2. Materials and Methods

Flood forecasting in the Amur River system must include forecasts of the water level along the main river reach and its main tributary—the Zeya River, as there are a number of large cities located right on the river banks, including Khabarovsk (the capital of the Far Eastern Federal District of the Russian Federation), and Komsomolsk-on-Amur (second largest city with a number of heavy industrial areas). Thus, water level forecasts on the Amur River are of great value and importance. The second largest issue is forecasting of the water inflow into the Zeya reservoir. This reservoir is located in the mountainous area of the Amur River basin and has a relatively harsh regime of its tributaries, especially during the monsoon period (late summer-autumn). The Zeya reservoir was constructed as a flood reduction measure in the region, as the most tremendous floods come from the Zeya River.
Water level forecasting was planned for 20 forecasting points along the river system. These points cover the most important cities and towns along the river reach and its main tributary. The forecasting technique selection was limited to the fact that only long-term water level data were available for these points, as the border between the Russian Federation and the People’s Republic of China goes along the river and no discharge calculations were historically available. With such limited data availability, a simple approach, based on the gauge-to-gauge correlation using different lead times that depend on flood wave height, was taken [14,15,16]. The Amur River is a large river with slow-developing processes, so such a simplified technique appeared to be sufficient to estimate flood wave transformation and thus reasonable in terms of forecast quality. The view of the forecast techniques is reflected with the following formula:
H L ( t   +   τ )   =   a 0   +   a 1 · H U ( t )   + a 2 · H L ( t )
where HL and HU are the water stages (cm) of the gauges in the lower and upper reach of the river, respectively; t is the day of the forecast issue, τ is the lead time of the forecast (days); a0, a1, a2 are the coefficients computed with least squares method. To make the technique operational, only actual water level data from the upstream gauges are required. The lead time of the technique reached up to 6 days with the daily time step.
Operational water level forecast quality was estimated for 2015–2017 warm periods (May–September) for 1- to 6-day lead times and 20 forecast points (Table 1). Standard deviation, root mean squared error, and Nash–Sutcliffe efficiency for each forecast gauge are shown in the table to give an idea of forecast quality, which proved to be good for the majority of lead times and forecast points, especially for lead times of 1–4 days.
The Zeya reservoir daily inflow estimation (calculation) and forecasting were one of the most important issues within the overall task. The water balance method was used to calculate daily inflow into the reservoir before, which is much more appropriate for water inflow amounts of at least 10 days or even monthly values. The method is very sensitive to mean water level estimation, and for reservoirs of such shape and volume curve even a small error in the water level estimation can lead to significant volume errors [17]. For this reason, a hydrometric technique of the water inflow estimation was used [16], which is commonly represented by the following formula:
Q i n   =   Q i   ( t ) · K i
where Qin is the daily water inflow into a water river reservoir, Qi(t) is the daily discharge (m3/s) from the i-th subbasin, and Ki is the adjustment factor for ungauged area of the i-th subbasin, which is calculated according to following equation:
K i   =   F i · ( F G i ) 1
where Fi is the area of i-th subbasin (km2), and FGi is the gauged area of the 
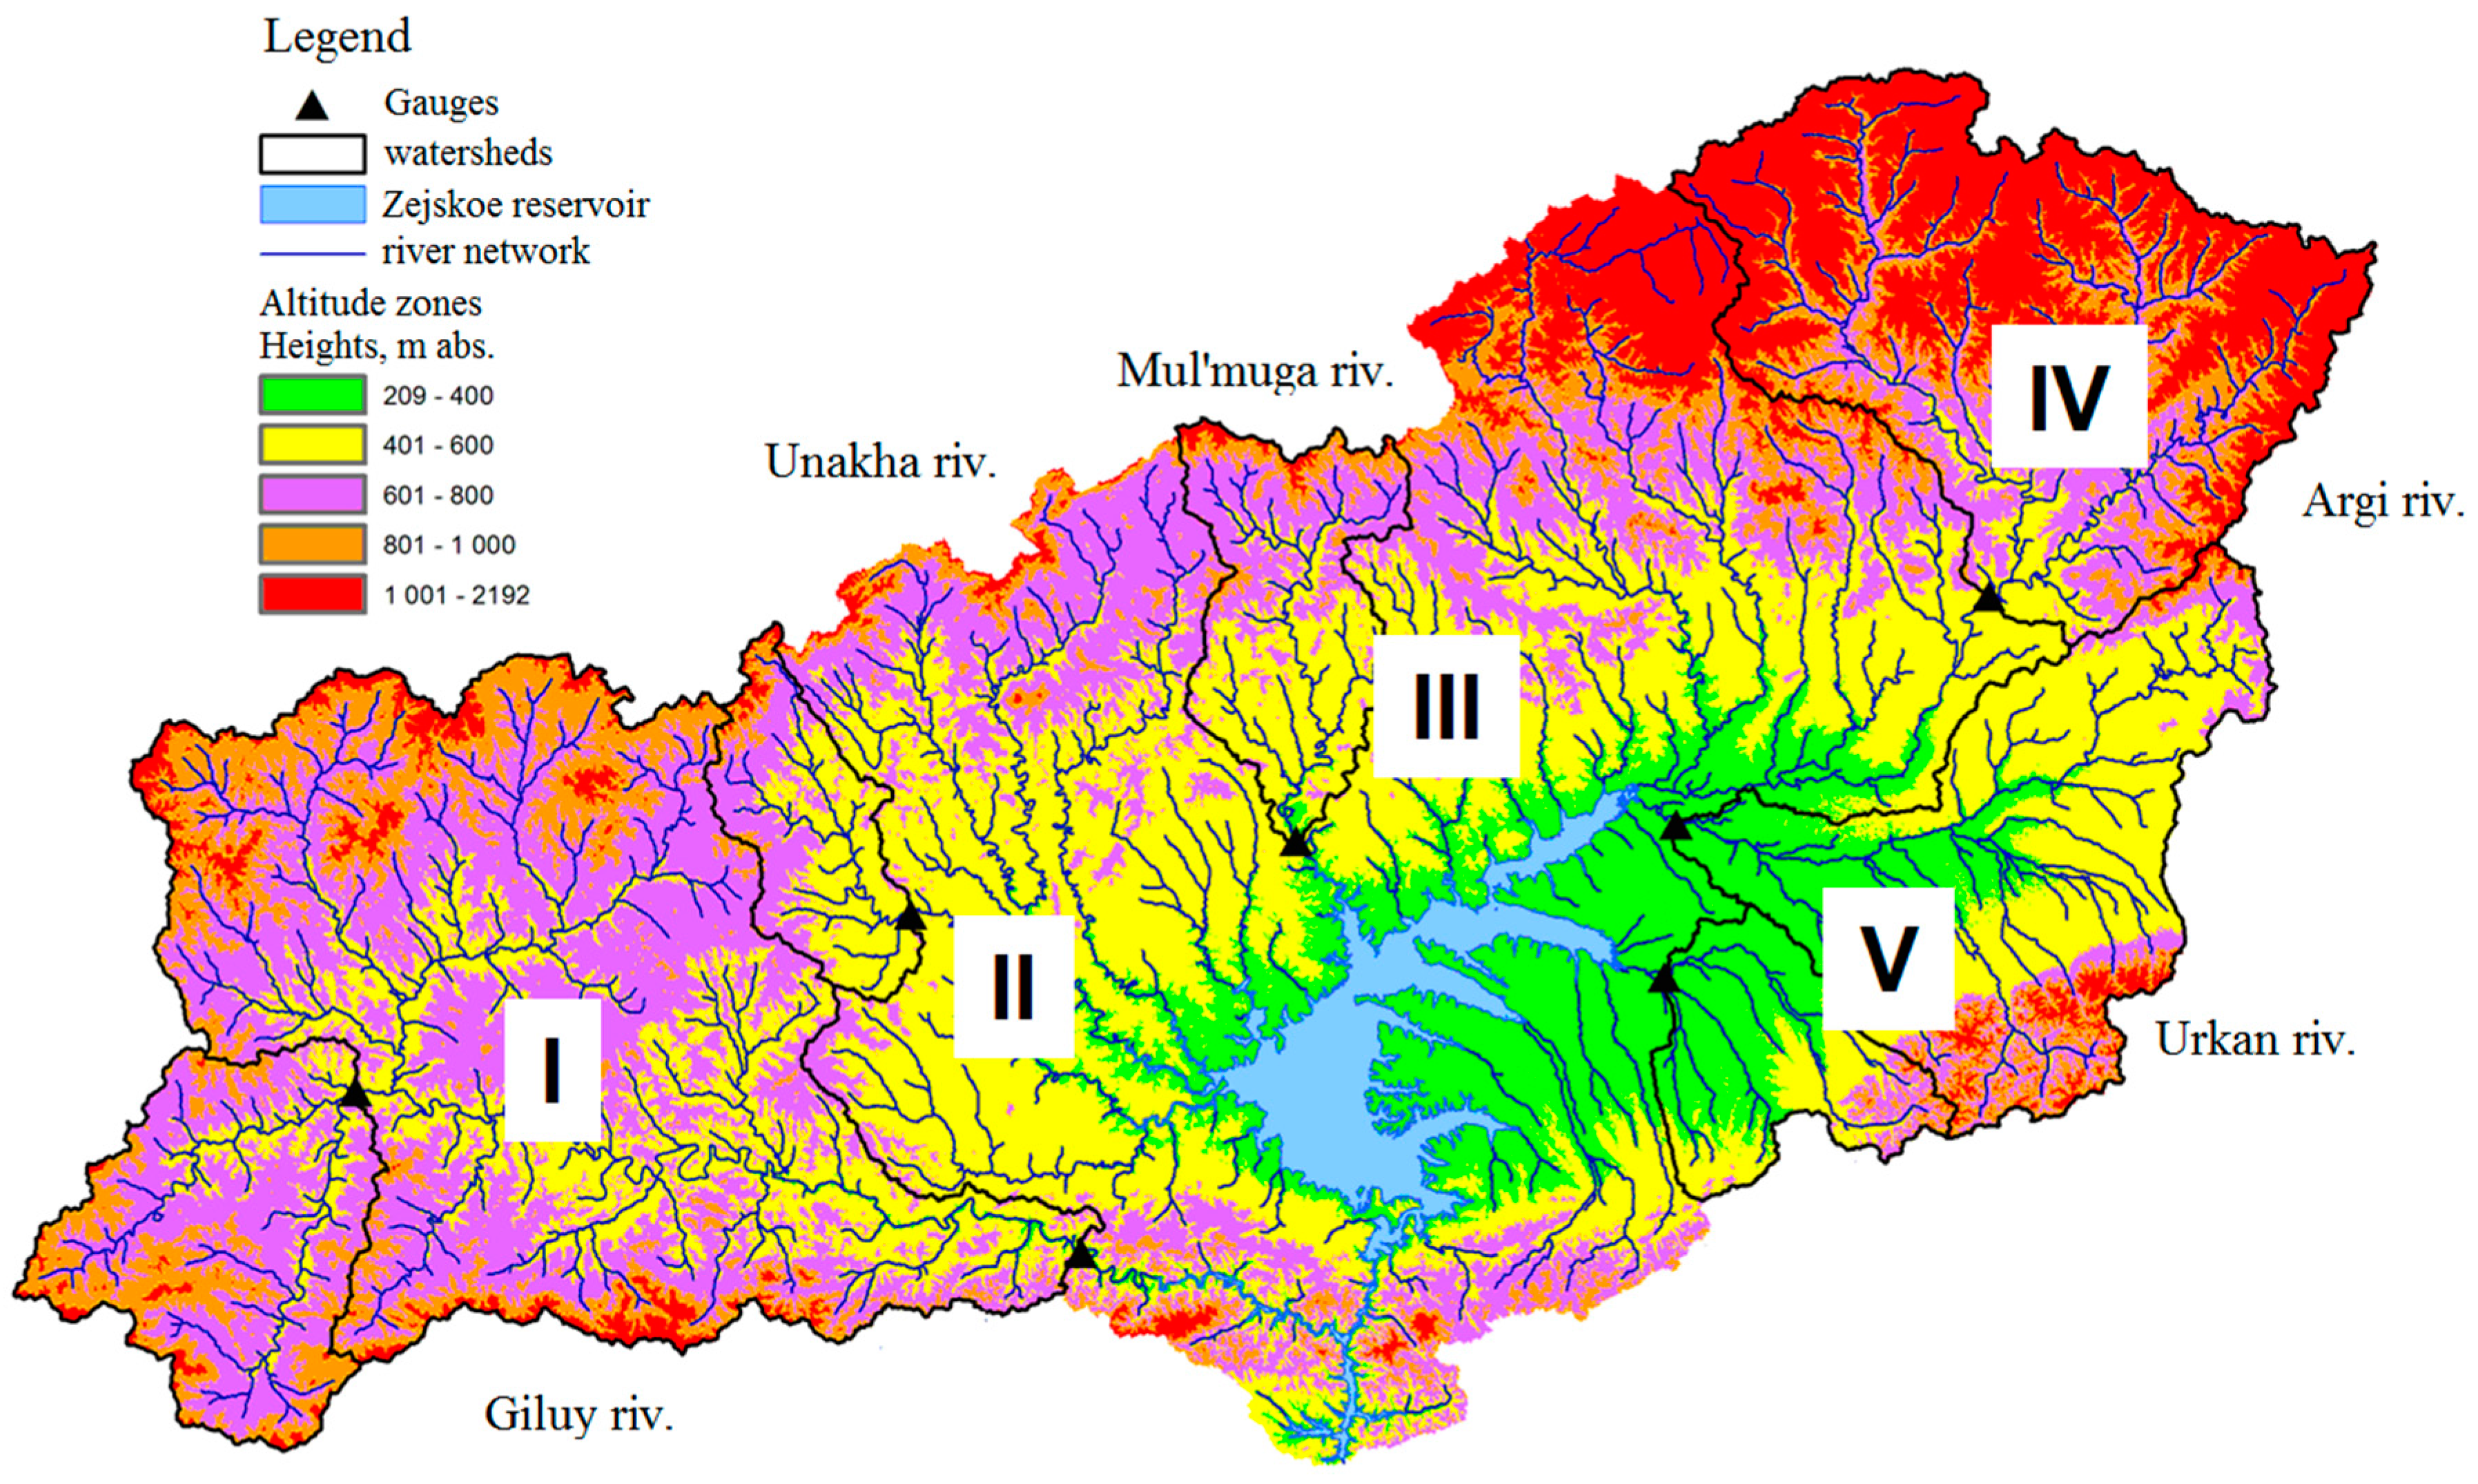
i-th subbasin. The whole Zeya reservoir basin was divided into 5 subbasins (Figure 1, Roman numerals). Each subbasin has gauged (there are five significant rivers with hydrometric gauges at their outlets—Figure 1) and ungauged areas, so adjustment factor Ki was calculated for each subbasin. Equation (2) was adjusted accounting for the lag time of the discharge from the outlet gauge of each of the five subbasins to the reservoir. Charts of the river network (channel) travel time were used to estimate the temporal adjustments. As a result, the following formula was produced to estimate the inflow into the reservoir:
Q i n ( t ) =   3.08 · Q I V ( t ) +   4.12 · Q V ( t ) +   3.37 · Q I I I ( t ) +   2.25 · Q I I I ( t 1 ) +   3.43 · Q I I ( t ) +   3.43 · Q I I ( t 1 ) + 0.54 · Q I   ( t )   +   0.54 · Q I ( t 1 )
where QI, …, QV are the discharges (m3/s) at the river hydrometric gauges of each of the five subbasins. To derive coefficients of the equation, the size of the river watersheds, their configuration, and the river channel lag time were taken into account. Evaluation of such technique was done via comparison with the water-balance inflow technique based on the 10-day time scale. The results of the comparison showed that the derived technique was reliable.
Forecasting of the inflow into the Zeya reservoir is based on the use of the conceptual model of the reservoir basin. Forecast of the water river discharge in the gauges is the basis for the inflow forecast estimation in the reservoir. The conceptual model used for this purpose is widely used in Russia for different catchments [18]. The model description is comprehensively presented in [18,19]; major concepts of the model are presented below. The model is based on a parametric description of the main runoff formation processes.
The structure of the model of the homogeneous landscape-hydrologic region includes a description of the following processes:
  • snow accumulation;
  • snow melt and snow cover;
  • melt and rain water yield of the basin with account for water infiltration and retention;
  • dynamic water supply on the slopes and watershed routing;
  • river channel routing.
In addition to regionalization (5 regions were delineated), elevations were divided into zones. All calculations were performed for each elevation zone of each region. The model consists of submodels that define the above-listed processes of the runoff formation for every elevation zone of each of the regions. Model input data include water level observations on 7 stream gauges as well as precipitation and temperature averaged for the calculation area (the elevation zones of the regions).
Calculations of the total melt water yield during the melt period are done according to the following equation, which takes into account capacity of soil infiltration and empty storage:
Y i ( t )   =   ( 1 w i ) · [ H i ( t )     P 0 · t h ( H i ( t )   · ( P 0 ) 1 ) ]
where Yi is the melt water yield (mm) from the i-th elevation zone, wi is a portion of permanent impervious area (a fraction of 1) of the i-th elevation zone; P0 is the water retention capacity (mm) of the watershed under conditions of minimal autumn soil moistening; th is the hyperbolic tangent; Hi(t) is the integral layer of water (mm) from the beginning of the snowmelt period t0 until time t (days), which is computed according to the following scheme:
H i ( t ) =   U i   +   ( h c i   + x i   z i     I ) j
where Ui is the state of the watershed water retention capacity (mm); hci, xi, zi are the layers of melt water, rain water, and evaporation (all in mm) for time j (days) in the i-th elevation zone; I is the water (mm) that infiltrated the deeper soil layers (outside of the soil retention capacity). Detailed description of the members of these formulas is given in [18]. Equation (5) is used in the model to compute water yield from each elevation zone; ui(t), e.g., is the runoff that is generated on slopes during the calculation time step (1 day):
u i   =   Y i ( t )     Y i ( t 1 ) .
Runoff from slopes into the river channel qi(t) (mm) is determined based on its connections with gravitational water supply on slopes Wi (mm):
W i ( t )   =   W i ( t 1 )   +   u i ( t ) q i ( t ) ,
q i ( t )   =   a i ( t )   · [ ( W i ( t 1 )   +   W i ( t ) ) / 2 ] 2
where ai(t) is the coefficient related to hydraulic properties of the runoff from slopes. By continuously solving Equation (8), it is possible to perform continuous calculations of the water that flows into the river network during the snowmelt period.
Total slope runoff into the river network qi(t) (mm/day) is computed separately for each elevation zone. Further calculation of the average basin inflow is performed according to the following equation:
q ( t )   =   q i ( t ) · φ i
where φi is the fraction of the i-th elevation zone within the river basin (fraction of 1), and n is the number of elevation zones. River discharge forecast is calculated according to the superposing principle using the following formula:
Q ( t   +   Δ t )   =   0 t + Δ t q ( t + Δ t τ ) · f h ( τ ) · d τ +   Q w ( t   +   Δ t )   +   Q m i n
where Q(t + ∆t) is the discharge in the river basin outlet (m3/s); t is the forecast issue date; ∆t is the forecast lead time (days); fn(τ) is the slope runoff travel time curve (unitless); Qw(t + ∆t) is the component of the river discharge (m3/s), induced by the recession of the initial (by the time t) water storage in the river network; Qmin is the base flow (m3/s). Detailed description of the derivation of the each member of Equation (10) is given in [18].
With a forecast of the discharges at the forecast points (outlets of the reservoir tributaries), it is possible to use the data as input in the inflow-calculation Equation (2) and thus have inflow into reservoir forecast. Such a technique allows for a forecast lead time of up to 7 days [20]. However, in operational forecasting, only a 5-day lead time is used as a maximal lead time, taking into account the reliability of meteorological forecasts in complex terrain areas. An ensemble prediction system has not been developed yet for this region. Thus, several meteorological inputs of temperature and precipitation from four numerical weather prediction models are used for daily operational reservoir inflow forecasting: COSMO (Hydrometcentre of Moscow, Russia [21]), UKMO (U.K. MetOffice, Exeter, UK), NCEP (U.S. National Center for Environmental Prediction, College Park, MD, USA), and JMA (Japan Meteorological Agency, Tokyo, Japan). These 4 inputs allow a hydrological forecaster to some extent to take any uncertainty in a meteorological forecast into account until an ensemble prediction system is developed and implemented for the area.
The efficiency of the developed technique of reservoir inflow forecasting was estimated using long-term data [20].
Operational reservoir inflow forecast quality was estimated for 2015–2017 warm periods (May –September) for 1- to 3-day lead times and 4 numerical weather prediction inputs (
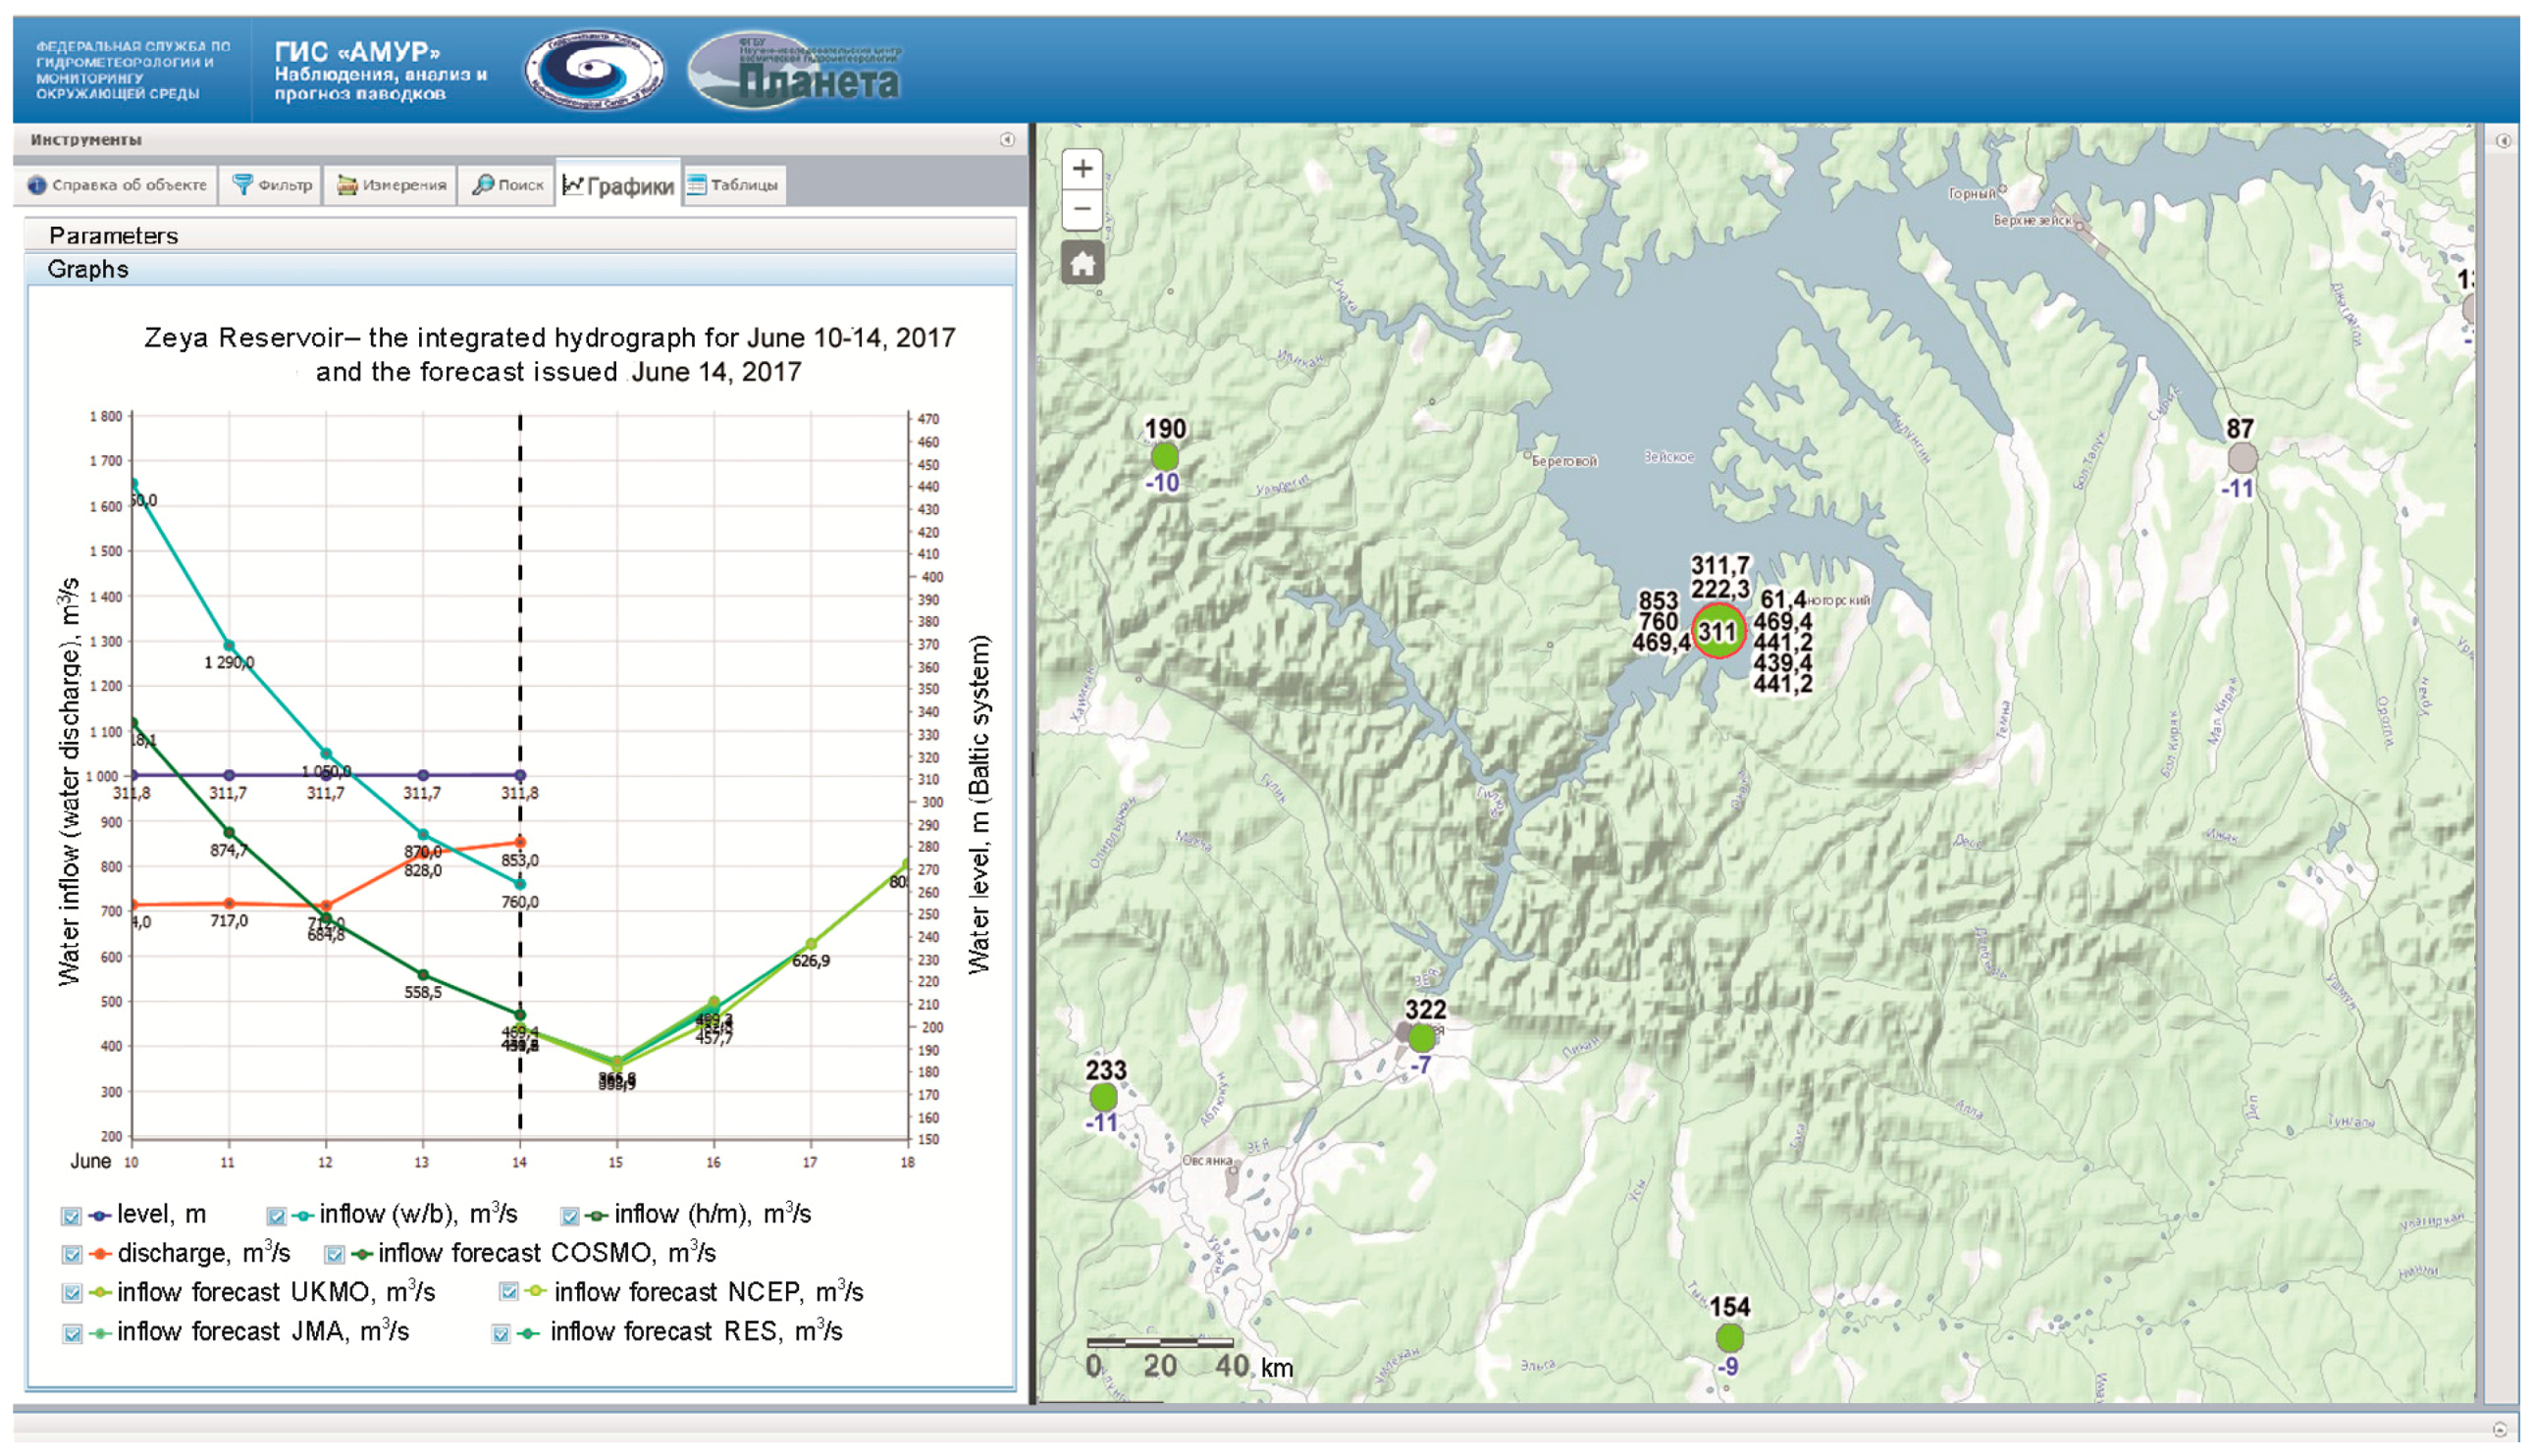
Table 2). The Nash–Sutcliffe (NS) efficiency criterion was used. Generally, the forecasts prove to be quite good, as the values of NS are higher than 0.65 for presented lead times. Visualization and dissemination of the inflow forecast information is presented in 
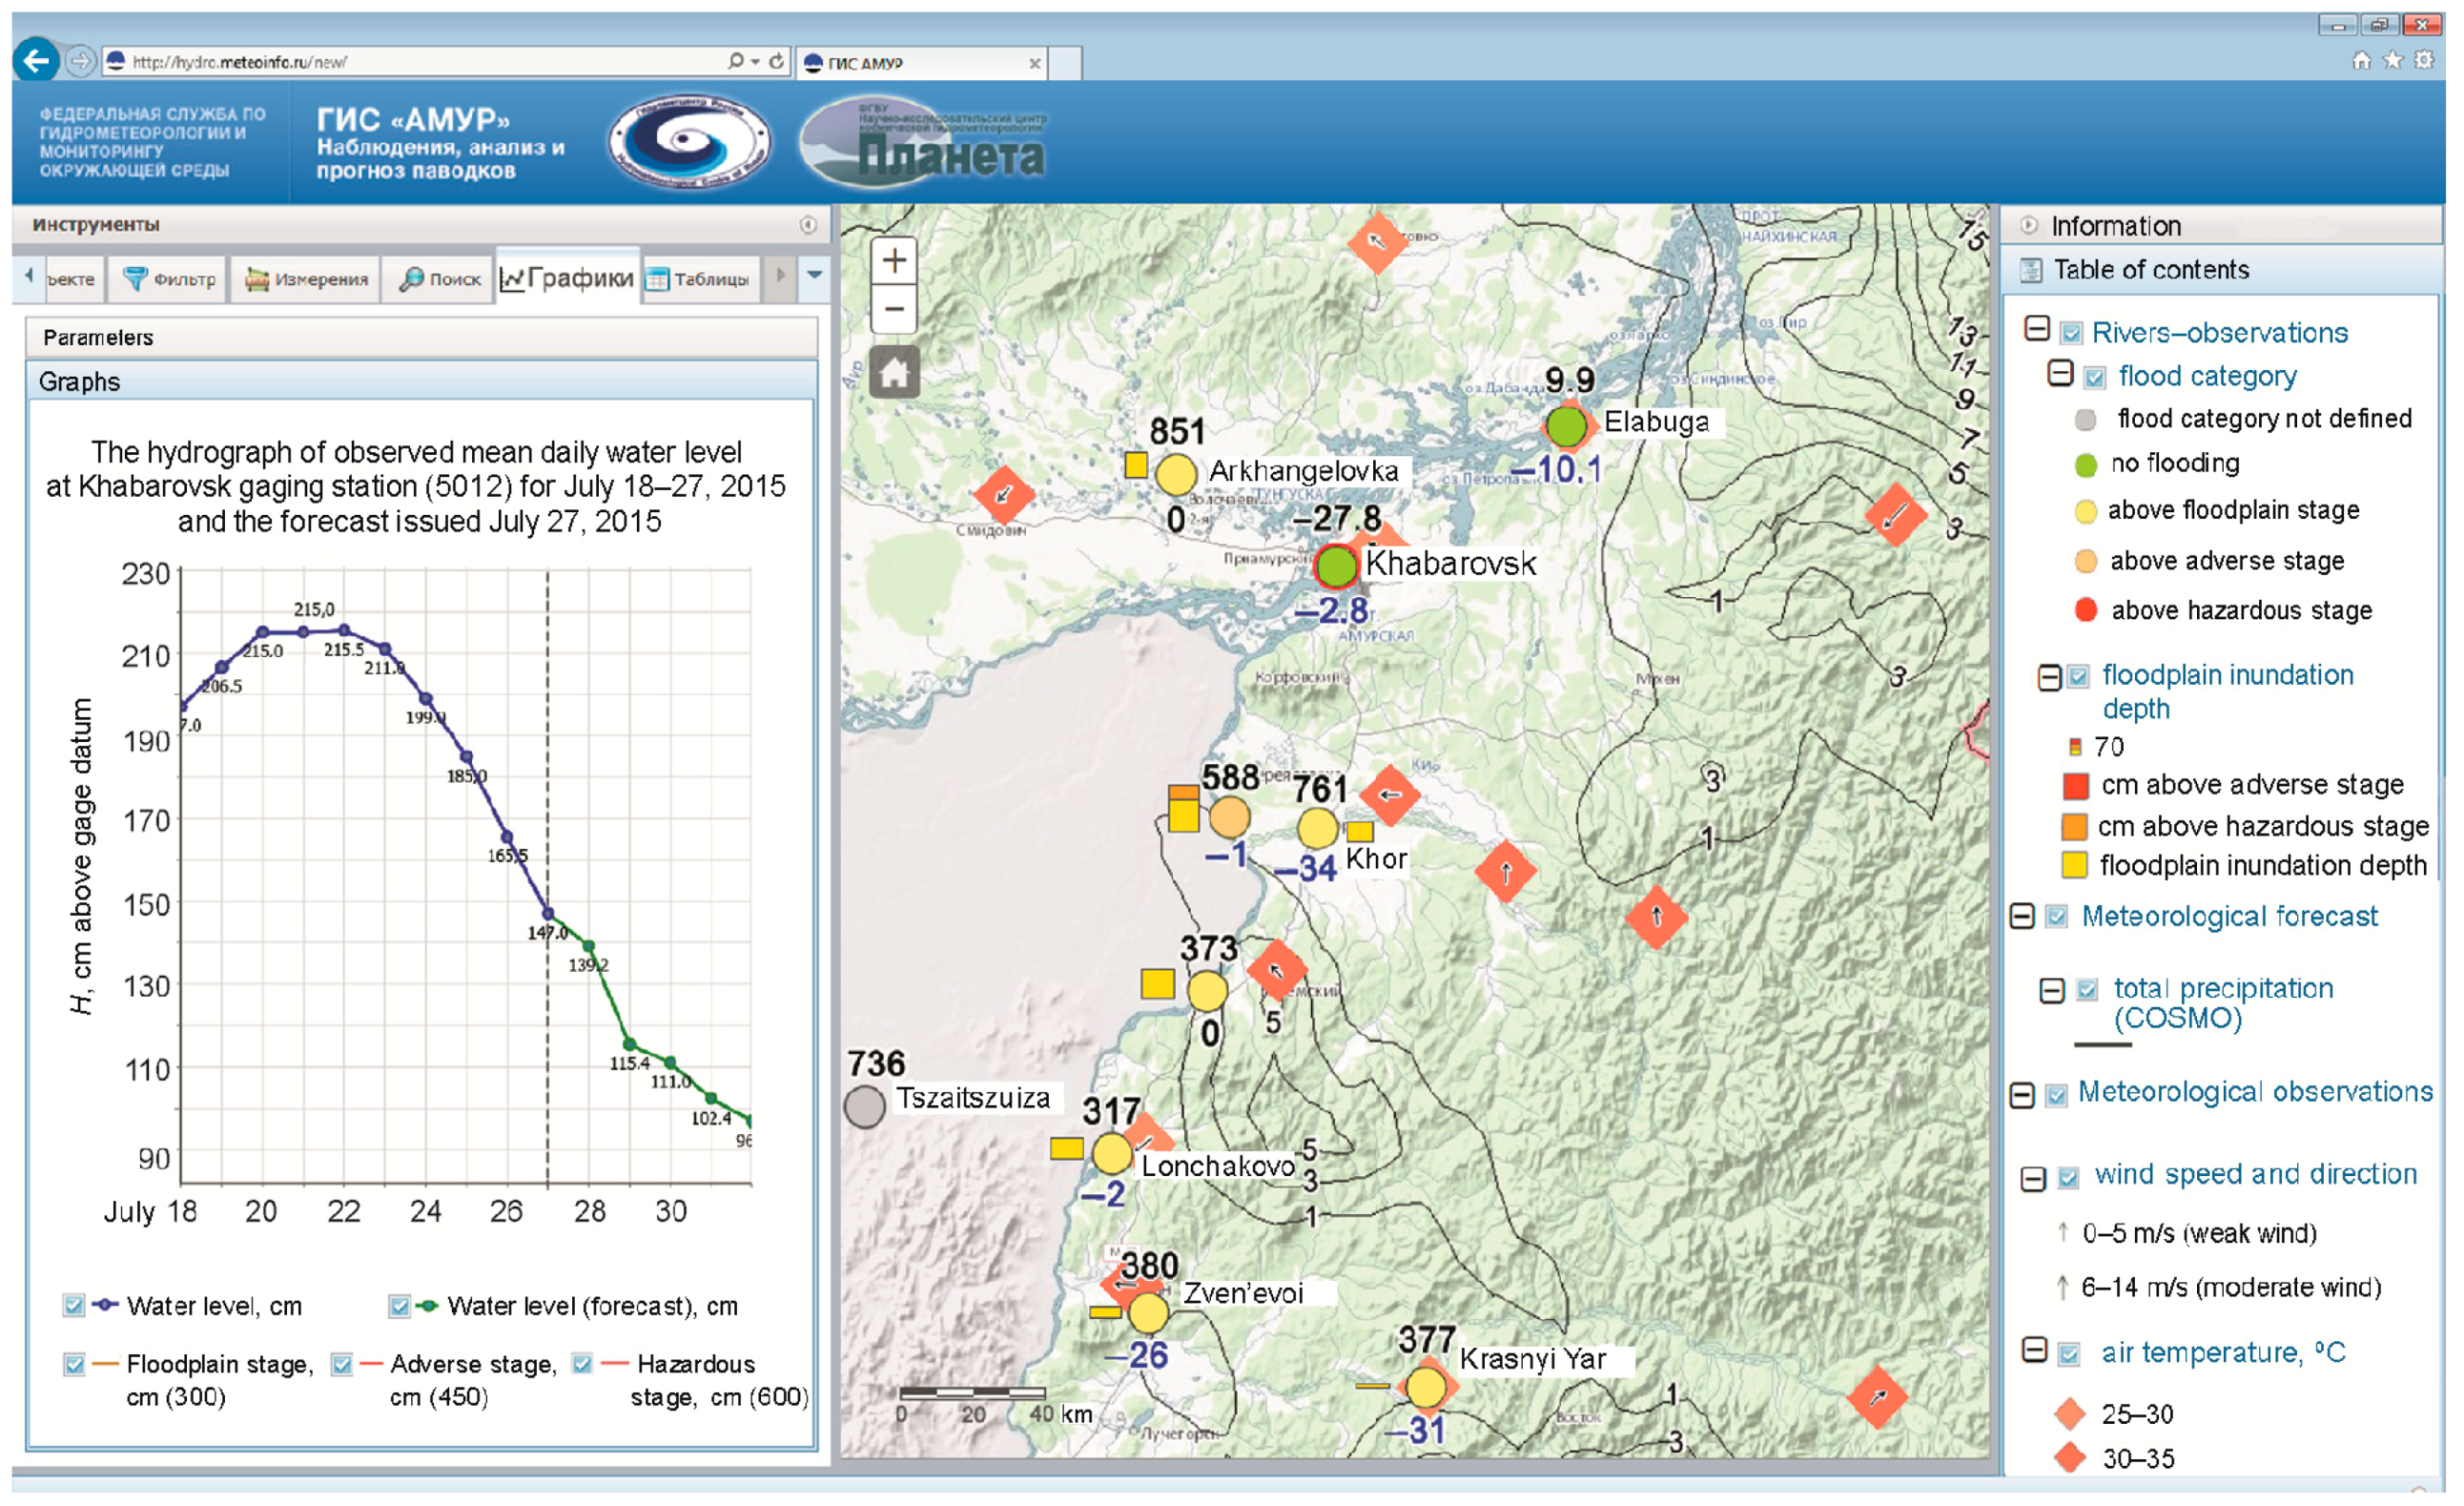
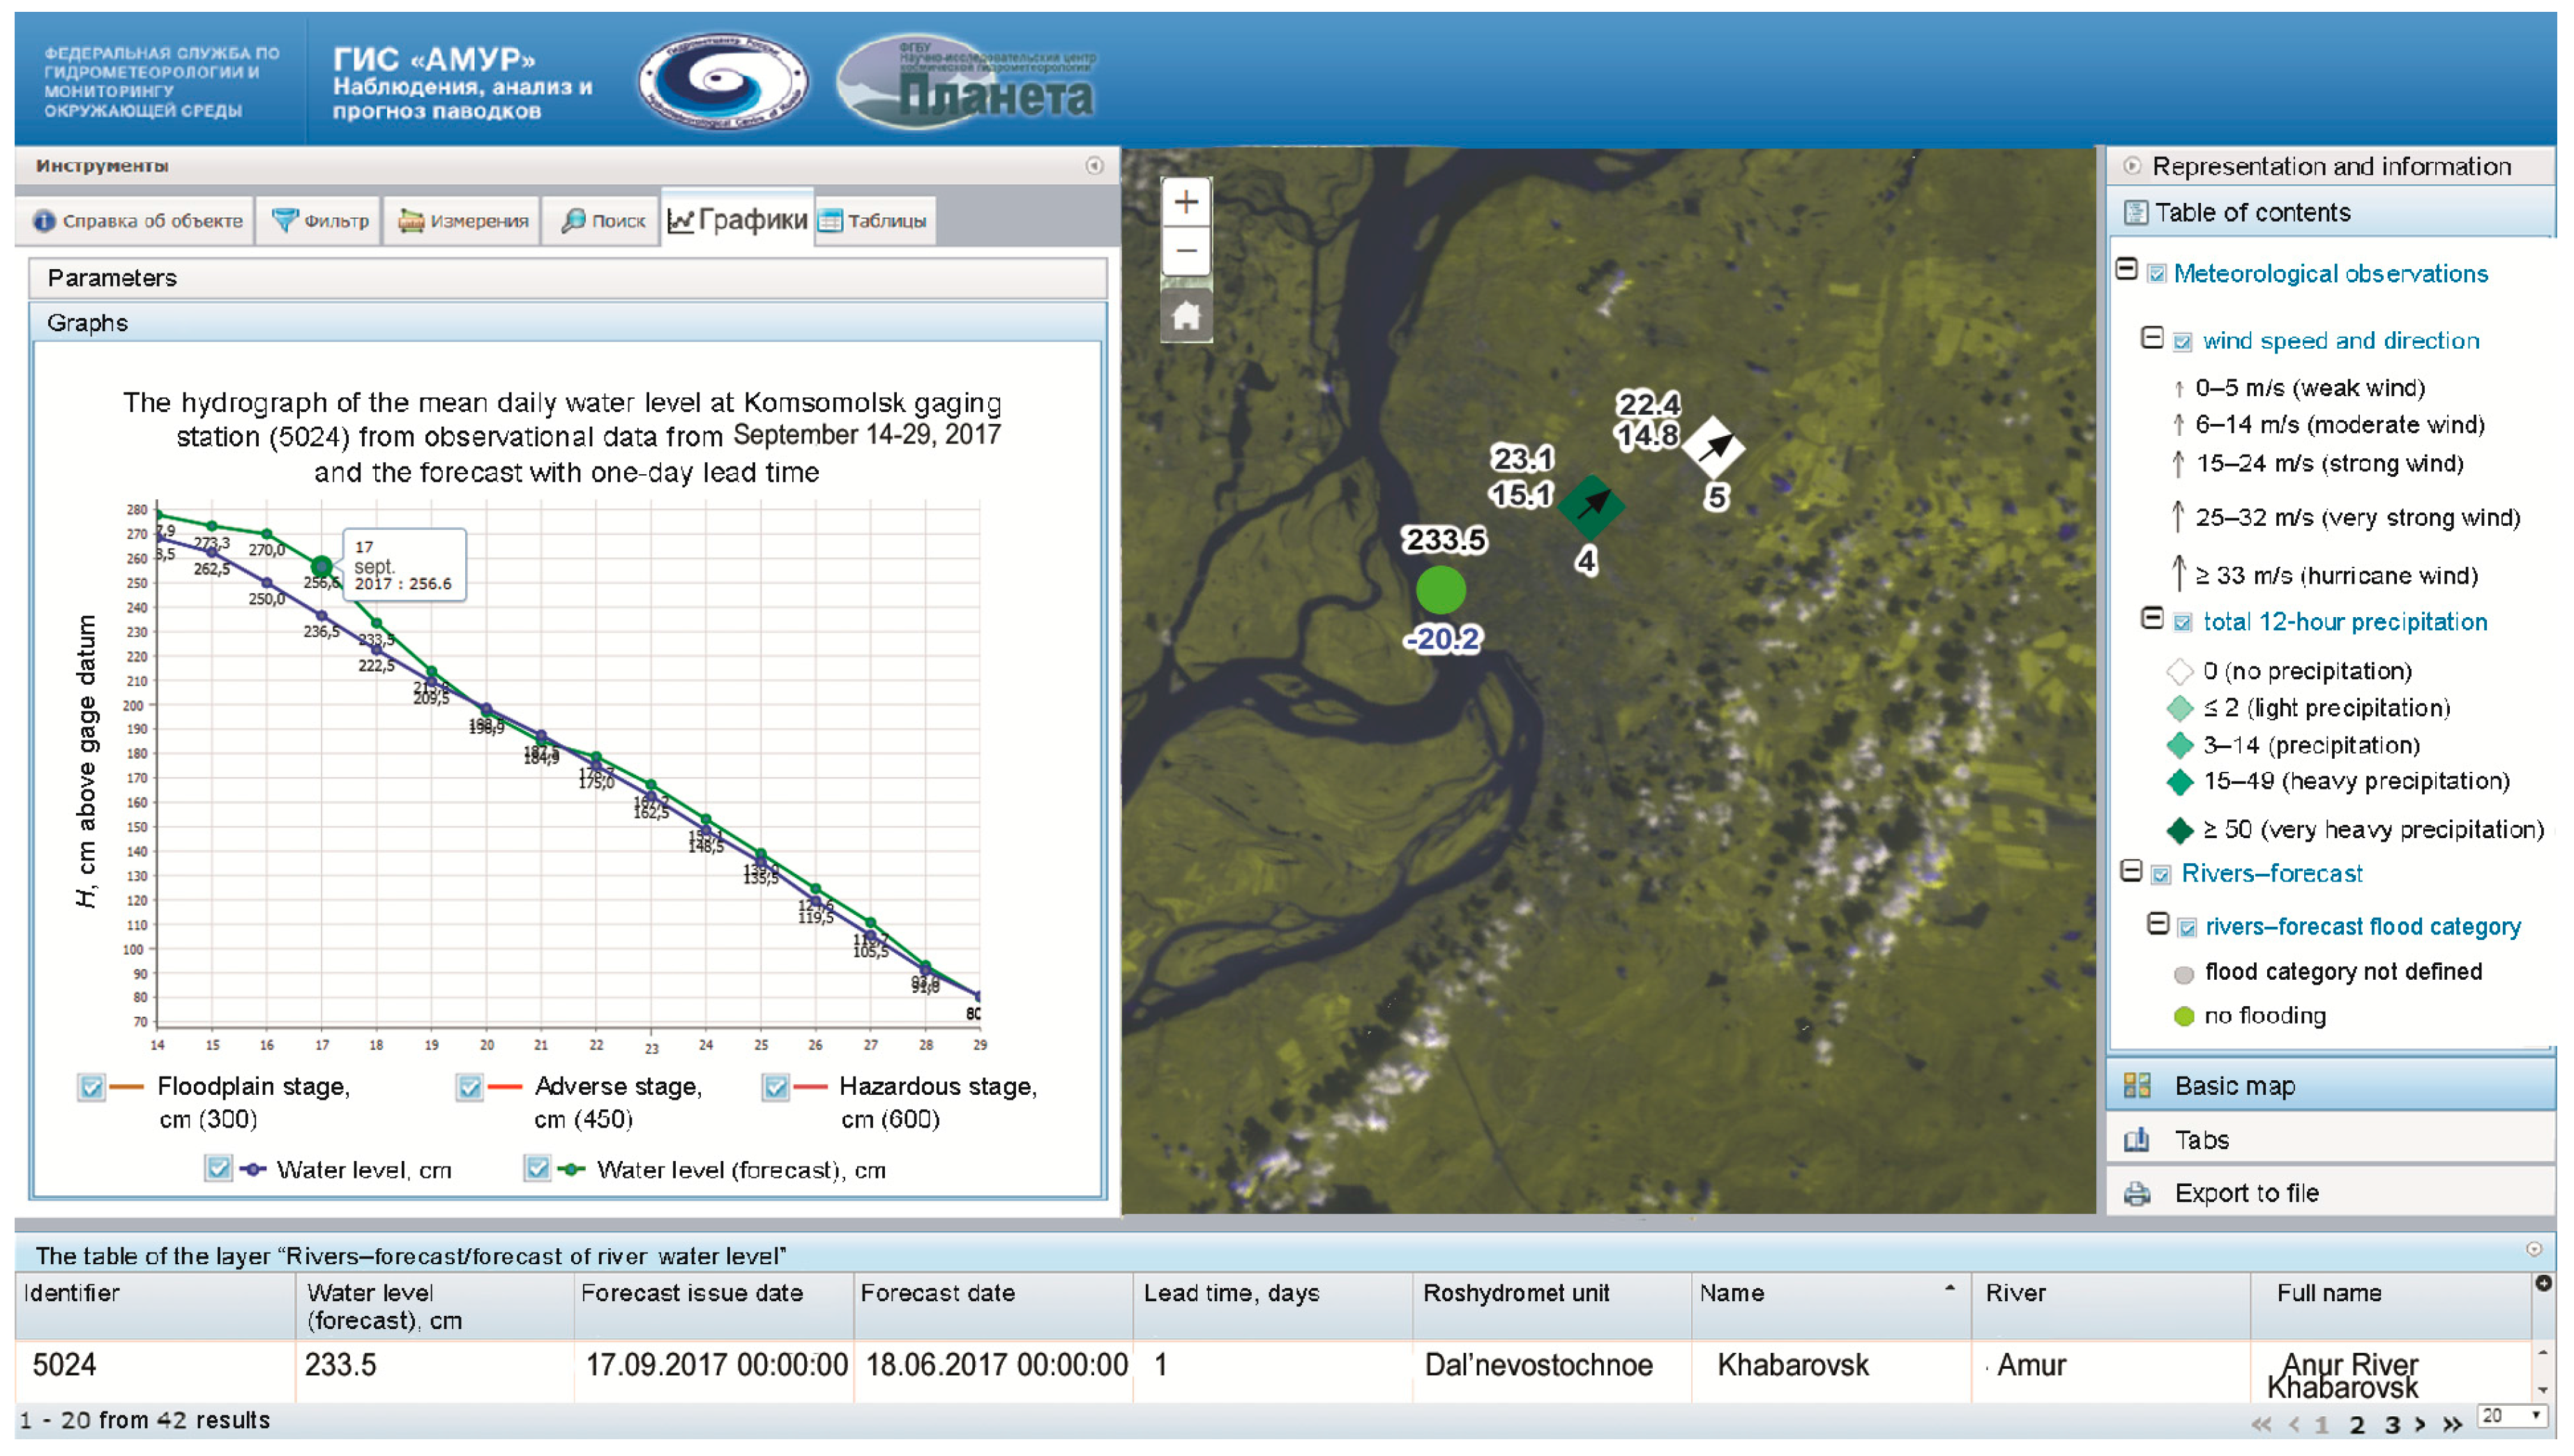
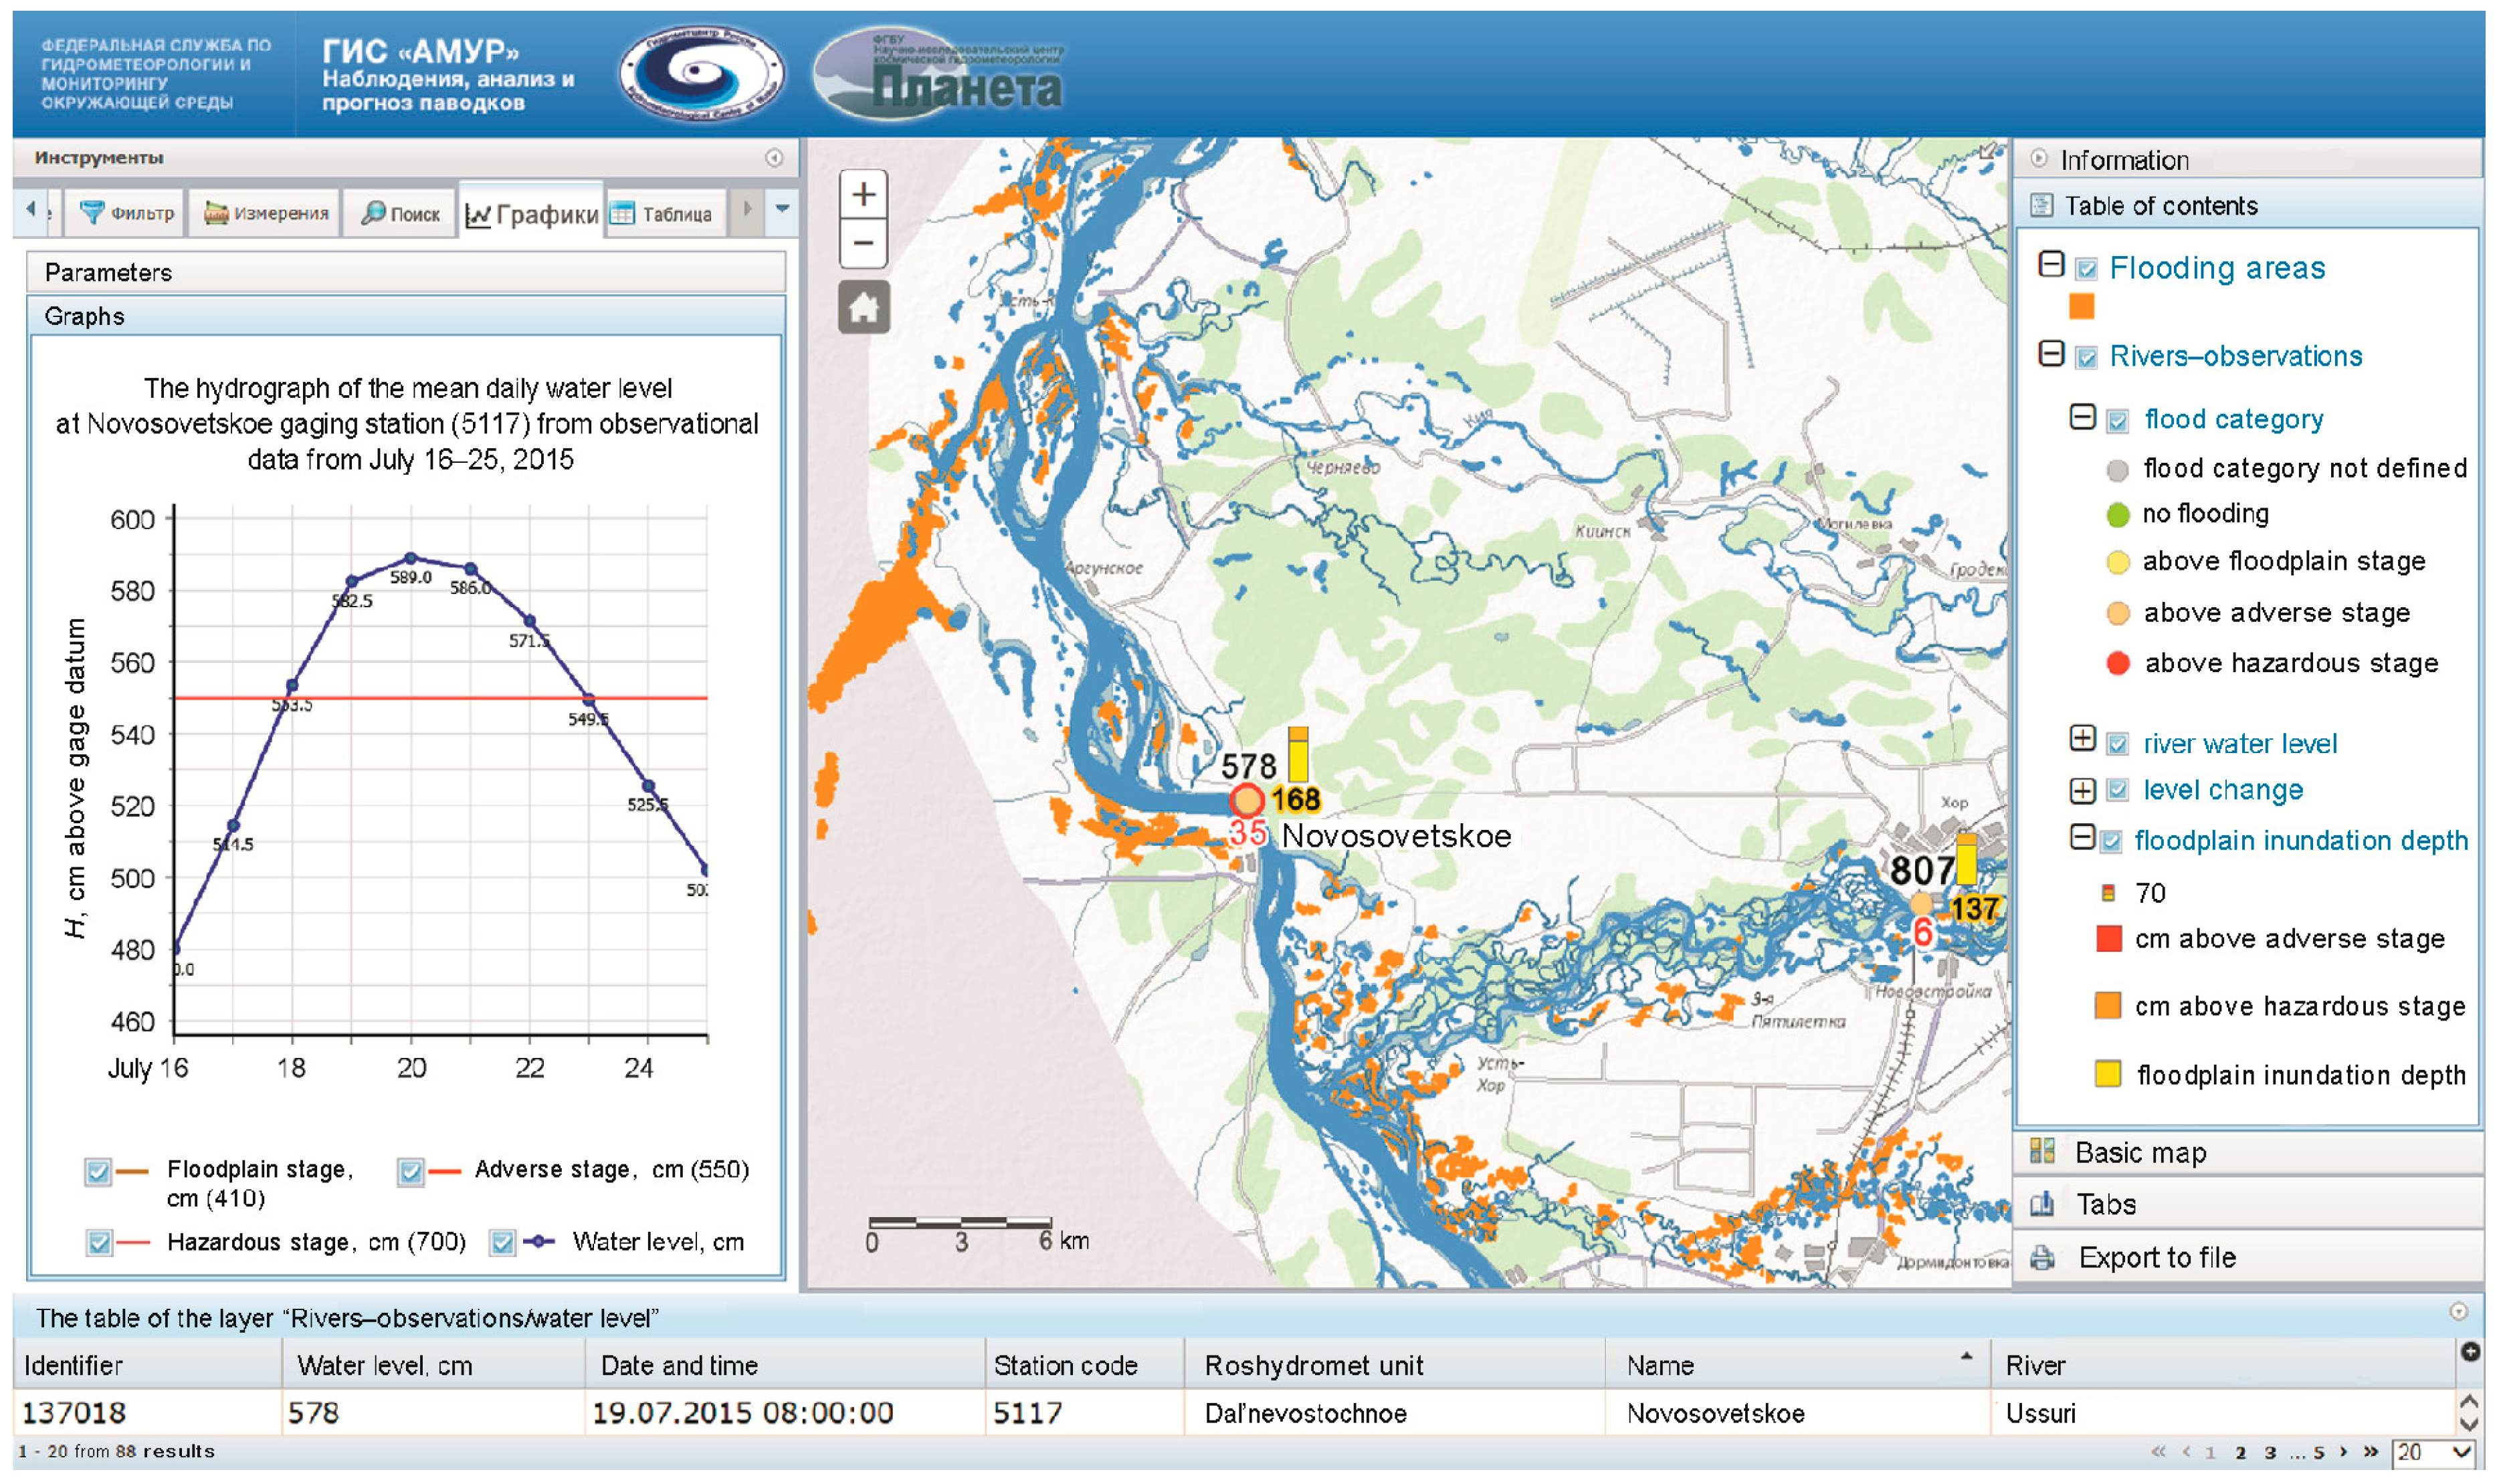
Figure 2. Main end-users can observe the forecast in graphical format (the left side of Figure 2) and in map format (the right side of Figure 2).
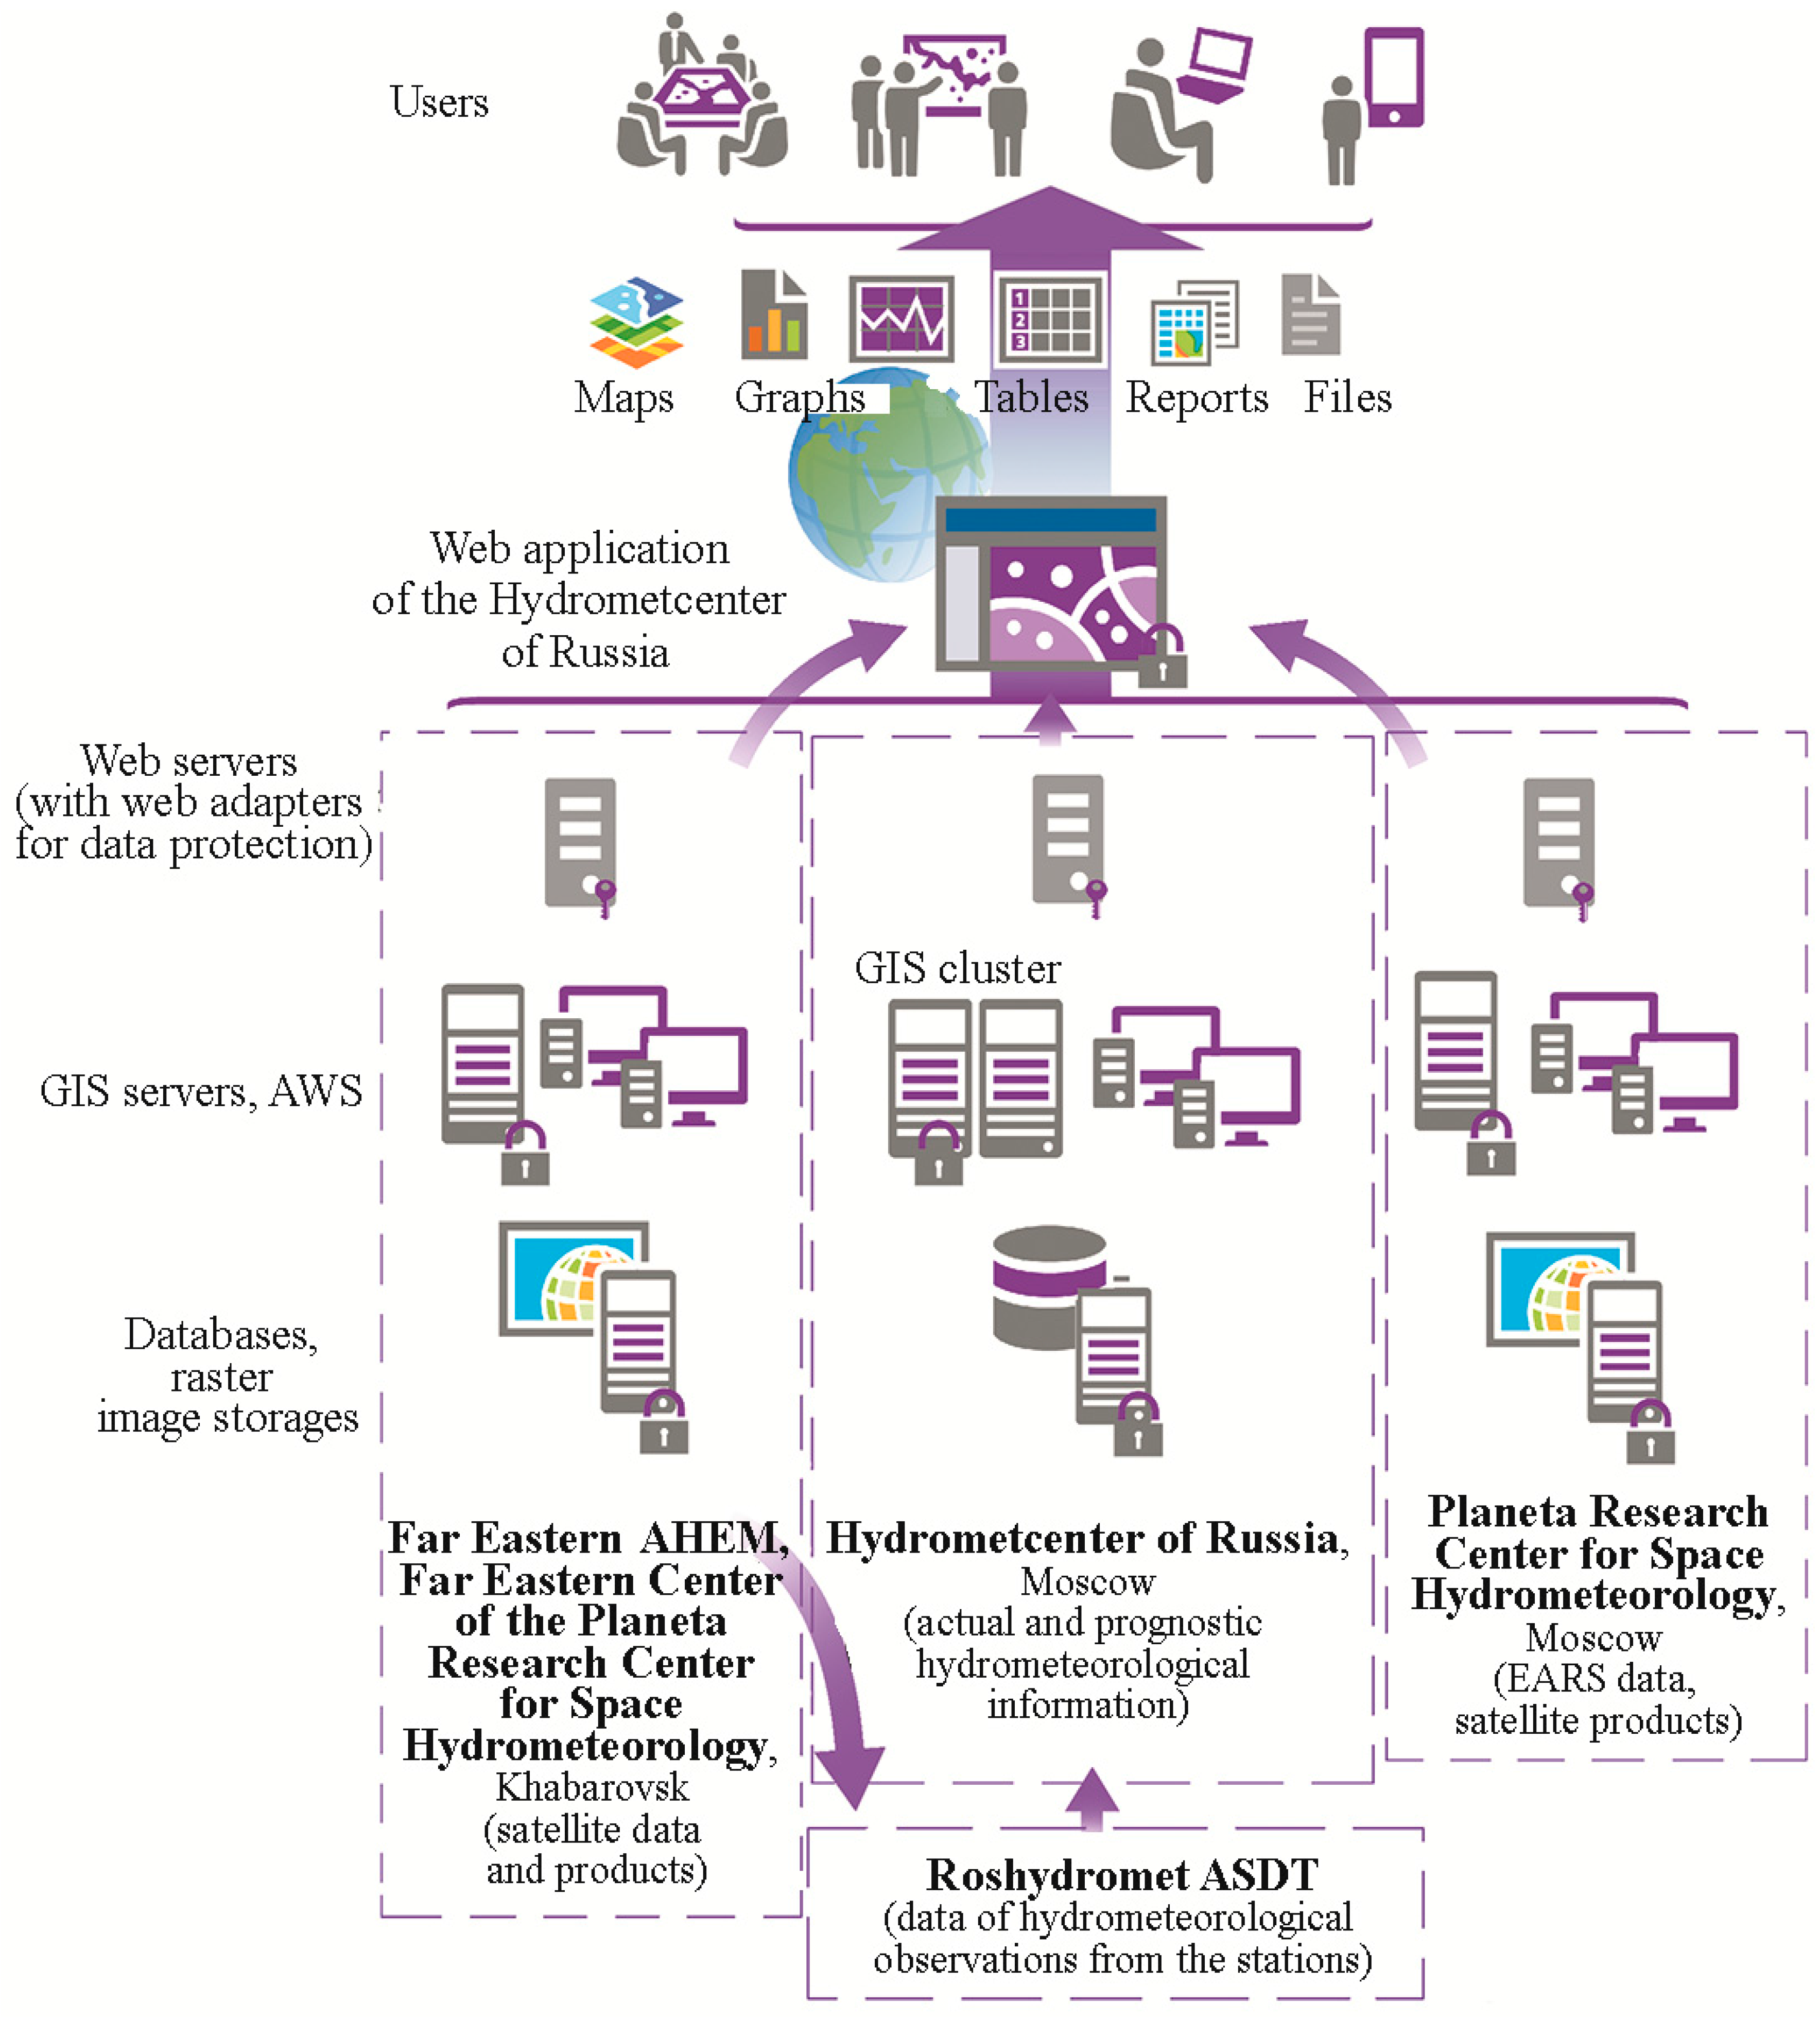
To support all processes within the flood forecasting system and to specifically provide the dissemination subsystem with data, a database (DB) subsystem was developed. The DB subsystem contains three databases: the main database with the operational hydrometeorological information from the observational network and with meteorological forecasts as well as two DBs with satellite data. Enterprise DBMS MS SQL Server-2012 software was used as the database management system (DBMS). This DBMS model was chosen due to its broad potential of operation with the large size of information in GIS and web systems based on the ArcGIS platform. One of these three databases (the main database) is located in the Hydrometcentre of Russia and includes the following operationally updated information: the observational data from gauging stations (water level, water temperature, air temperature, and the amount of precipitation measured twice a day); observational data from weather stations (basic meteorological parameters measured at standard synoptic time steps); observations and calculations of the Zeya hydropower plant (HPP) reservoir parameters; the water level forecast at gauging stations; reservoir inflow forecast; weather forecasts; reference information on gauging and weather stations, rivers, reservoirs, and subbasins of the Amur River basin. This database also contains observational data from the gauging station network in the Amur River basin including observational data on the water levels of the Songhua River that comes from China within the framework of the Roshydromet—Ministry of the Water Recourses of the People’s Republic of China. Two other databases contain satellite data, and they are located in the Far Eastern and European centers of the SRC “Planeta.” The DBs in these centers include the satellite data received by its own receivers in the radio acquisition range. They include the data of “Meteor-M No. 1,” “Meteor-M No. 2,” “Kanopus-V No. 1,” “Resurs-P” Nos. 1 and 2, “Landsat 8,” and “Terra/Aqua” as well as flood extent maps and snow cover maps of the Amur River basin. The DB of the European SRC “Planeta” includes DEM as well as satellite data received from the “Sentinel 1” radar sounding space vehicle and the satellite products received via the EARS system of international exchange: maps of relative soil humidity and surface wind plotted from the ASCAT/MetOp data. The separate file storage was created in the DB subsystem for the satellite data. This storage contains the raster format data. The DB contains only metadata and links to information. The abovementioned DBs are updated automatically. For this purpose, the Python-based software was developed and implemented. The overall subsystem scheme is presented in Figure 3.
Satellite data and products are used in the system for monitoring the current hydrological conditions, obtaining the areal characteristics of the zones of flooding, and tracking the spatial-temporal changes. The effectiveness of satellite data for the solution of these tasks is well known and has been shown in several papers [22,23,24,25].
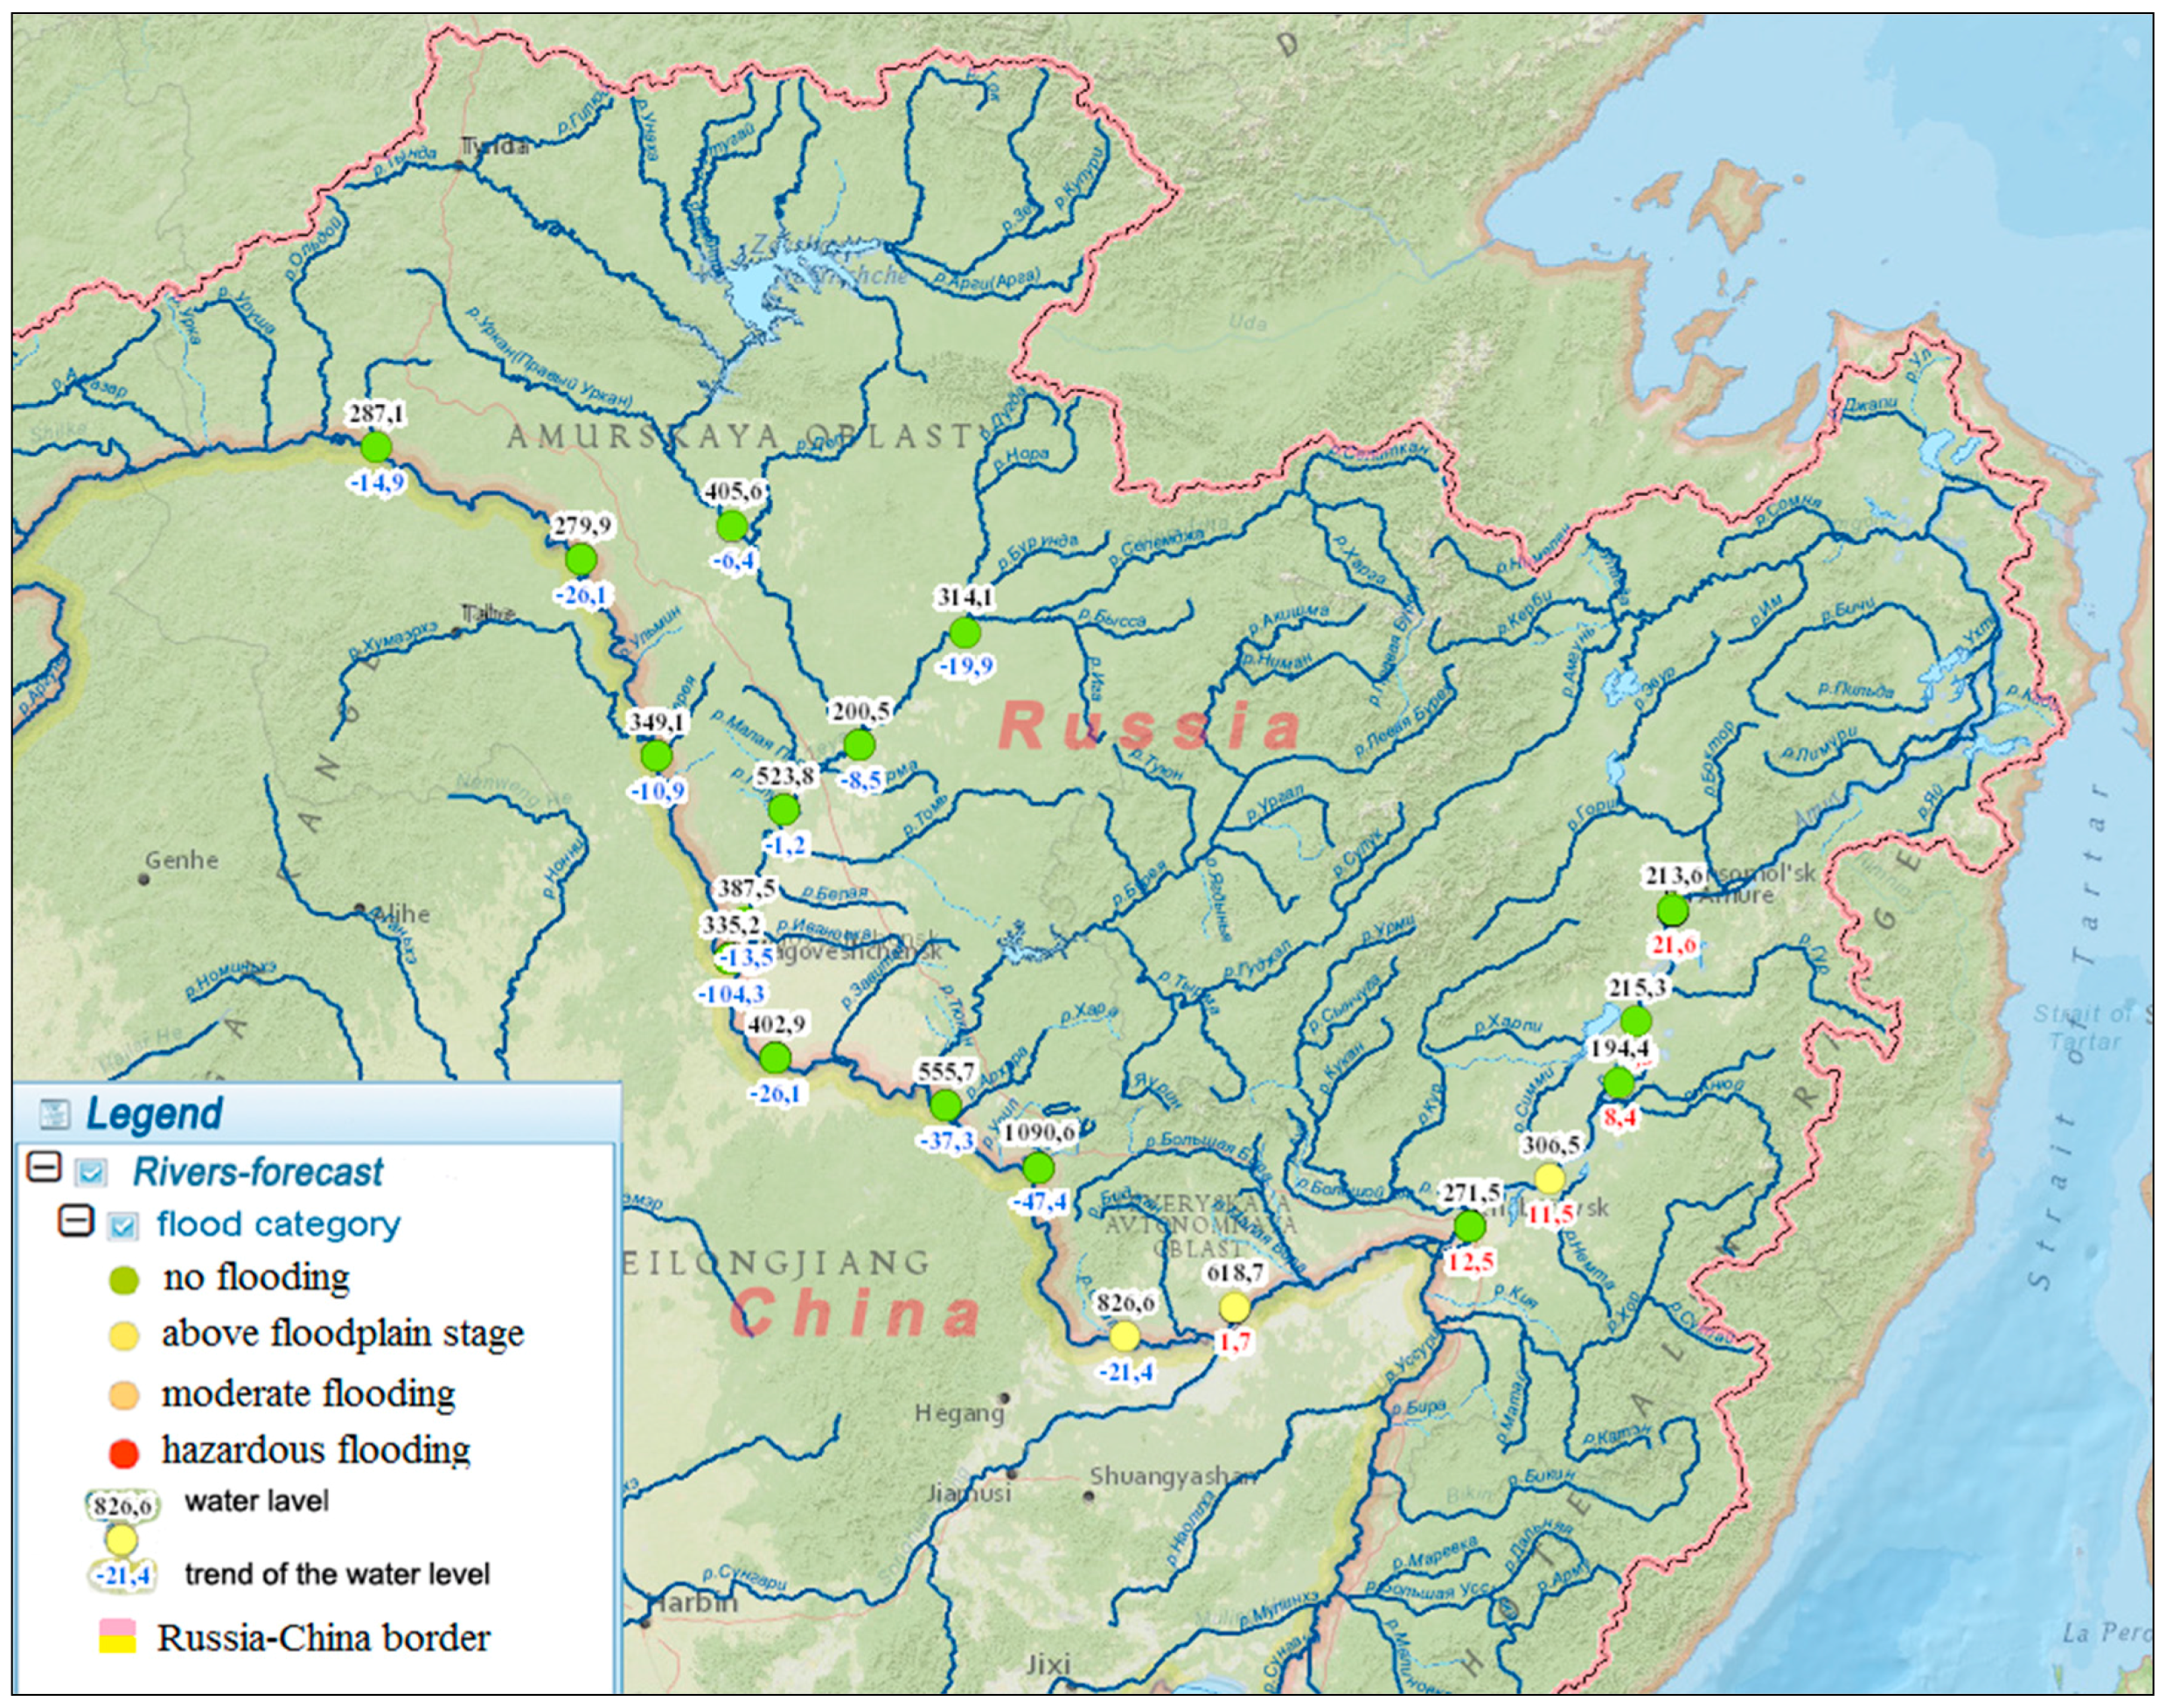
In order to disseminate operational forecast information to end users (e.g., Emergency Agency, regional administration, water transport industry), the subsystem of visualization, analysis, and dissemination of the abovementioned forecasts in the Amur River basin was developed. The subsystem is closely connected with the DB subsystem (see above), which serves as the informational basis for dissemination. Hydrological and meteorological observations, satellite data, and topographic features of the basin are also included in the subsystem together with hydrological forecasts to form a comprehensive understanding of the hydrometeorological conditions of the basin. The use of web GIS technologies enables visualizing and integrating geographic, hydrological, meteorological, synoptic, and satellite geospatial data in the uniform environment (Internet). The developed subsystem (the permanent operation site is the Roshydromet Main Computing Center) is spatially distributed. The preparation of hydrometeorological products including computations and forecasts is carried out at the Hydrometcentre of Russia. The reception and processing of satellite data are carried out at the SRC “Planeta” (described in the section above). The acquisition and processing of satellite data received from EARS (EUMETSAT Advanced Retransmission Service) are conducted in the European Center of the Planeta Research Center for Space Hydrometeorology [26].
The subsystem of preparation and delivery of output products to the end users has broad operational potential in the systematization of information product types, in the automatic support of electronic database catalogs, in the metadata maintenance with the detailed description of catalogs, etc. It has a high degree of safety implemented at three levels (passwording at the levels of the database, web services, and web applications). The additional data protection is provided through the web server adapter. The subsystem includes two basic components: a GIS component for the management of GIS servers and automated workstations (AWSs), intended for computing and forecasting hydrometeorological parameters and for preparing the actual and forecast information (server and corporate GIS), and a web component for interaction with users (the web server with web application).
The GIS component of the management of GIS servers and automated workstations is implemented on the ArcGIS 10.5 (ESRI, Redlands, CA, USA) Enterprise platform for desktops and servers. The GIS component of hydrometeorological data consists of two GIS servers and three automated workstations (AWS) for a hydrologist. The hydrologist’s AWSs are intended for the development and maintenance of DBs with actual data on the water level and water discharge at gauging stations and for preliminary computations and forecasts of the water level at gauging stations. The hydrologist’s AWSs are equipped with ArcGIS for Desktop Advanced (ArcInfo) software and with the following supplementary modules, among others: Spatial Analyst, Geostatistical Analyst, and 3DAnalyst. They are united into the corporate network and are controlled from the GIS server. The main function of the GIS server is the creation of web services of observed and forecasted hydrological, meteorological, and synoptic information based on the data stored in DB as well as the optimization and management of these services. Moreover, GIS servers provide differentiated access to the data among the hydrologists who are responsible for different zones. GIS servers are equipped with ArcGIS for Server Advanced software. GIS servers were united into the cluster in order to provide the uniform load distribution among GIS servers in the case of multiple simultaneous user queries and to maintain the uninterrupted operation of the subsystem in case of server failure.
To optimize the subsystem and to increase its operation speed, an unusual solution was used. The precreated vector layers containing the objects of the observed area were recorded to the DB (e.g., for the ground-based data, the location and symbolic presentation of gauging and weather stations as well as the attributive information containing general information about an object; for the satellite data, the symbolic presentation of parameters in the regular grid points bound to the map). The vector layers of objects are related to the tables containing constantly updated information on observed and forecasted hydrological and other parameters. Such a DB structure allowed for the indication of the ready-made objects of the vector layer and the needed actual or forecasted information, so that the time taken for the creation and tuning of object representation is spared. The objects situated outside the limits of the screen are not involved. The proposed solution considerably reduces the time of data visualization on the display in case of fragment size or map scale changes.
GIS components of satellite data are located in the Far Eastern and European centers of the SRC “Planeta.” Each of these centers contains one GIS server and automated workstations. These GIS components provide ready-made satellite web-mapping services for the subsystem. It is noteworthy that ArcGIS technologies almost instantly visualize large-size satellite images (more than 500 Mb for one image) organized in the form of services; this is because the information’s image, rather than the information itself, is displayed. These services support Open Geospatial Consortium standards (WMS, WFS, etc.) and, if needed, can be connected to any web information system via Internet and to any desktop GIS system via the corporate network.

3. Results and Discussion

Data, models, and forecast techniques, dissemination instruments (GIS) were all brought together for the selected river basin to produce final products, which are disseminated to end-users in real-time mode via web application. Its main goal is to unite the services produced by different Roshydromet institutions (Hydrometcentre of Russia, Far Eastern and European centers of the SRC “Planeta,” and Far Eastern Administration for Hydrometeorology and Environmental Monitoring) based on the graphical interface. This section provides information on results of the study specifically for its three main achievements: water level forecasts, reservoir inflow forecasts, and web-GIS application of the services and final product dissemination. This section represents basic final products, which were able to incorporate within the application, and outlines its possible future development and comparison to undermined studies.

3.1. River State Products

River state products, e.g., the current value of stage, its tendency, its relation to critical levels (flood plain, adverse and dangerous levels), and short- and medium-term forecasts, are one of the key end-user products. All these data were combined in the DB and later routed to the web-GIS application to be represented for end users. In Figure 4, the combined hydrological state of the Amur river, including the hydrological state itself (the so-called “traffic light” format, where green means calm, yellow means that a floodplain level was reached, purple and red mean that adverse and dangerous levels were reached, respectively), the absolute stage values, the tendencies, and the columns, represents the degree of hazard. Some weather data can be also represented on the screen. Hydrographs at selected stream gauges can be represented on the left side of the screen, which show the observed and forecasted stages (see Figure 4).
However, there are many ways of representing river forecasts within the application, e.g., via the table format, the graphical format (represented above), and the map format, where forecasted information is shown in color code and as absolute values of stream gauges and tendencies (Figure 2).
When the floodplain stage is reached (yellow labels), pre-warning messages are issued to the responsible end users (emergency ministry, city administration, etc.) via automatic messaging via e-mail and fax. At the same time, end-users can observe the situation in real-time mode within the web application window (Figure 2), where they have access to information in table, graphical, and text format. Levels representing adverse (orange) and hazardous (red) events are set for each city by the emergency ministry, according to the consequences they cause: an adverse level or an orange state means that the city suburbs with secondary bridges and roads have been flooded, while a hazardous level or a red state means that part of a city or town has been flooded. Based on such color-scale warning information, emergency agencies work to minimize the consequences of the flood.
Forecast quality issues were addressed in the above section—the reliability of the forecasts and warnings are within the required limits of the Roshydromet regulations. However, a user can always look at the operational forecast quality by drawing observed and forecasted (with a defined lead time) stages—see the left graph of Figure 5. Visualization of forecasted information is done using the traditional so-called “traffic light” approach, together with graphical and table formats, as in many operational flood early warning systems, e.g., US National Weather Service Advanced Hydrologic Prediction System (AHPS) [27].
While selecting forecast techniques for operational forecasting and warning systems one should be guided by several principles, including one of the most important—the robustness of the technique under current data availability and quality [16]. Perhaps there will be sacrificing of models complexity, but the main issue is to have improved forecast quality, which is not necessarily correlated with its complexity. In this paper, simple techniques were applied, but applying them in practice provided good and reliable results. The study showed that existing data availability allowed for the implementation of a simple but stable and effective forecast technique. It was not possible to use more sophisticated forecasting tools (e.g., hydraulic models and watershed distributed physically based models) due to the low availability of operational data.
When taking a basin approach, the transboundary issue (if there is one) is also very important. In this case, it is necessary to work together with border colleagues along the way on the data exchange in terms of observations and forecasts. Without the information from upstream or significant tributaries, it is not possible to build a reliable operational system of monitoring and forecasting. Another question pertains to what platform should be used to build such a collaboration—it can be river basin commission, or a bilateral program, that includes data sharing. A partner’s monitoring and forecasting data (without commercial interest) must be employed so as to smoothen the data exchange process.

3.2. Inflow Forecasts into the Reservoir

Inflow forecasts into the Zeya reservoir are presented within the web application in graphical format—each of the four forecasts (using four different meteorological inputs) is shown separately (Figure 6, left side). Besides forecasts, different observed and calculated data that is related to the reservoir allow the end-user (reservoir operator) to be more oriented in the regime of the reservoir and its possible future state. Besides the graphical format, an end user has access to the data in table format and in a raw digital format.
With four ways of determining future inflow into the reservoir (according to the forecasting technique using four numerical weather prediction inputs), a user can be informed of possible weather forecast uncertainty. Unfortunately, an ensemble prediction system has not been developed yet for this region. In the near future, more weather forecast inputs will be added, and certain forecasts will be post-processed and disseminated to reservoir and dam operators.
In addition to inflow forecasts, an end user has access to observed and calculated information, such as the calculated inflow (based on two methods—the so-called “water-balance” and “hydrometric” methods, developed during this study), the average water level of the reservoir, and the discharge from the dam and other variables, which helps the user become quickly oriented with the operational situation. The data can be presented and visualized in various formats.

3.3. Web-GIS Application

For better interpretation of operational hydrometeorological information, the web-GIS application provides a variety of data visualization formats, i.e., maps, graphs, and text tables for further export and analysis using external software. The application provides various criteria for selection and visualization of hydrometeorological information: time (date, observation time, or forecast issue time), location (gauging or weather station), area (river basin, administrative entity, etc.), forecast lead time, etc. By default, the most recent hydrometeorological data are displayed at first web app launch, generally for the current date (time). The block of graphic analysis of information is presented in the interface. In particular, reservoir inflow and water level changes can be analyzed from combined observation and used to forecast plots (Figure 5 and Figure 6). The graphical interface also allows a user to combine satellite data (e.g., flood maps) with ground-based hydrological data (Figure 7). The application allows the user to adjust map layer transparency and contrast for vector and raster data integration. For better display of data, the web application provides a variety of basemaps, allowing the user to choose any of the following, among others: ArcGIS Online basemaps; the multi-scale map of the Federal Service for State Registration, Cadastre and Cartography (Rosreestr); Bing Maps. To build the web application within the Amur flood forecasting and early warning system, the ArcGIS Application Programming Interface (API) for JavaScript was used, allowing the user to run the app from any device enabling Internet access (e.g., computer, tablet, or smartphone) without any additional software installation. Application code was developed using open-source technologies (Esri JavaScript Viewer for ArcGIS, Hard Cider). The web application runs in all basic Internet browsers, including Internet Explorer (version 6 and higher), Mozilla Firefox, Google Chrome, Yandex, Opera, and Safari.
There are a number of tools available in the web-GIS software that allow the user to make different selections of data (based on temporal and spatial principles), to build graphics and diagrams, and to create tables with output data. One goal for the future is to develop and implement a process of spatial and temporal averaging of observed and forecasted data, where different graphics can be constructed by selecting different hydrological stations and gauges, where different hydrometeorological elements can be used for analysis, and where hydrological techniques can be launched with different forcing data.
Using the web-GIS approach allows for effective and efficient dissemination of the required hydrometeorological information, products, and services to an end-user. According to the World Meteorological Organization (WMO) report on GIS application in operational hydrology, there are a significant number of hydrological and meteorological services that employ GIS on a daily basis for different purposes, including final product visualization [28]. There are options in terms of whether commercial software or free (open) software is used. The first case allows for economy in human resources, as GIS software in this case is more developed and less demanding in terms of add-on developments. One of the issues (weak point) in this case, however, is the price of the software (purchase and technical support). This study used well known commercial GIS software due to the lack of IT personnel (software developers, GIS specialists, and administrators), which meant that the individuals involved became aware of all targets.

4. Conclusions

The hydrological service delivery system was developed for the entire basin of the Amur River, which is one of the biggest rivers in Russia. Modern techniques were used in order to set up each of the system’s components, including a database management subsystem, hydrological forecasting, and data dissemination. Operational testing of the system showed its quality, sustainability, and reliability; the system proved as well to be easy-to-use for hydrological product end users.
Installation of the system helped to dramatically improve hydrological service quality in the described basin, i.e., many users of hydrological products (heavy industry, agriculture, regional administrations, etc.) now have access to operational data from the project web page.
Possible further developments of the system include improving the hydrological description of the watersheds within the hydrological conceptual model scheme and using ensemble forecasts as meteorological inputs in the hydrological models.
The system presented in this paper is used within the Operational Flood Forecast System of the Federal Service for Hydrometeorology and Environmental Monitoring (Roshydromet) [4] and is an exemplar for other Russian river systems; e.g., a modernization plan for Volga River basin hydrological services implies an adaptation of the described system for the Volga River basin.

Acknowledgments

The system was implemented and published in this article with the financial support of Roshydromet project "Restoration, modernization and development of the hydrometeorological observation network and hydrological forecasting system in the Amur river basin".

Author Contributions

For research articles with several authors, a short paragraph specifying their individual contributions must be provided. Sergei Borsch—lead of hydrological department; Andrei Khristoforov—hydrological techniques development; Vladimir Krovotyntsev—lead of satellite data processing department; Ekaterina Leontieva—data base creation and management; Yuri Simonov—hydrological techniques development and implementing; Victoria Zatyagalova—WEB-GIS- techniques development and implementing.

Conflicts of Interest

The authors declare no conflict of interest.

References

  1. World Meteorological Organization. Manual on Flood Forecasting and Warning; WMO-No. 1072; World Meteorological Organization: Geneva, Switzerland, 2011; ISBN 978-92-63-11072-5. [Google Scholar]
  2. Arduino, G.; Reggiani, P.; Todini, E. (Eds.) Advances in Flood Forecasting. Hydrol. Earth Sci. Syst. 2005, 9, 279. [Google Scholar] [CrossRef]
  3. World Meteorological Organization. Institutional Partnerships in Multi-Hazard Early Warning Systems. A Compilation of Seven National Good Practices and Guiding Principles; Golnaraghi, M., Ed.; Springer: Berlin/Heidelberg, Germany, 2012; ISBN 978-3-642-25372-0. [Google Scholar]
  4. Borsch, S.V.; Simonov, Y.A. Operational Hydrologic Forecast System in Russia. In Flood Forecasting. A Global Perspective; Adams, T., Pagano, T., Eds.; Elsevier: Amsterdam, The Netherlands, 2016; pp. 169–181. [Google Scholar]
  5. Semenov, E.K.; Sokolikhina, N.N.; Tatarinovich, E.V. Monsoon Circulation over the Amur River Basin during the Catastrophic Flood and Extreme Drought in Summer. Russ. Meteorol. Hydrol. 2017, 42, 141–149. [Google Scholar] [CrossRef]
  6. Verbitskaya, E.M.; Ageeva, S.V.; Dugina, I.O.; Dunaeva, I.M.; Efremova, N.F.; Romanskii, S.O.; Tarasyuk, V.V. Catastrophic flood on the Amur River in summer 2013: Features and causes. Russ. Meteorol. Hydrol. 2015, 40, 683–690. [Google Scholar] [CrossRef]
  7. Opolot, E. Application of remote sensing and geographical information systems in flood management: A review. Res. J. Appl. Sci. Eng. Technol. 2013, 6, 1884–1894. [Google Scholar] [CrossRef]
  8. Glas, H.; Jonckheere, M.; Mandal, A.; James-Williamson, S.; De Maeyer, P.; Deruyter, G. A GIS-based tool for flood damage assessment and delineation of a methodology for future risk assessment: Case study for Annotto Bay, Jamaica. Nat. Hazard. 2017, 88, 1867–1891. [Google Scholar] [CrossRef]
  9. Van Ackere, S.; Glas, H.; Beullens, J.; Deruyter, G.; De Wulf, A.; De Maeyer, P. Development of a 3D dynamic flood Web GIS visualisation tool. Int. J. Saf. Secur. Eng. 2016, 6, 560–569. [Google Scholar] [CrossRef]
  10. Glas, H.; Van Ackere, S.; Deruyter, G. Flood damage assessment in a GIS: Case study for Annotto Bay, Jamaica. Int. J. Saf. Secur. Eng. 2016, 6, 508–517. [Google Scholar] [CrossRef]
  11. Kourgialas, N.N.; Karatzas, G.P. Flood management and a GIS modelling method to assess flood-hazard areas—A case study. Hydrol. Sci. J. 2011, 56, 212–225. [Google Scholar] [CrossRef]
  12. Rahman, T.; Rhaman, K.R.; Afrin, S. Real-Time Web-Based GIS and Remote Sensing for Flood Management. J. Perenc. Wil. Kota 2005, 16, 21–38. [Google Scholar]
  13. Saha, A.; Praneeth, D.V.S. Flood vulnerability assessment by remote sensing and GIS based applications in West Bengal: A review. IRJET 2016, 3, 1654–1657. [Google Scholar]
  14. Borsch, S.V.; Simonov, Y.A.; Khristoforov, A.V.; Yumina, N.M. Short-range Forecast of Water Levels in the Amur River. Trudy Gidromettsentra Rossii 2015, 353, 26–45. (In Russian) [Google Scholar]
  15. Frolov, A.V.; Asmus, V.V.; Borshch, S.V.; Vil’fand, R.M.; Zhabina, I.I.; Zatyagalova, V.V.; Krovotyntsev, V.A.; Kudryavtseva, O.I.; Leont’eva, E.A.; Simonov, Y.A.; et al. GIS-Amur System of Flood Monitoring, Forecasting, and Early Warning. Russ. Meteorol. Hydrol. 2016, 41, 157–169. [Google Scholar] [CrossRef]
  16. Guide to Hydrological Practices. Volume II, Management of Water Resources and Application of Hydrological Practices, 6th ed.; WMO-No. 168; World Meteorological Organization: Geneva, Switzerland, 2009; ISBN 978-92-63-10168-6.
  17. Nezhihovskii, R.A. Hydrological Computations and Forecasts in Exploitation of Reservoirs and Lakes; Gidrometeoizdat: St. Petersburg, Russia, 1961; 295p. (In Russian) [Google Scholar]
  18. Burakov, D.A.; Karepova, E.D.; Shaydurov, V.V. Mathematical modeling of water flow: Theoretical foundations, current status and prospects. Vest. Krasgu 2006, 4, 3–19. (In Russian) [Google Scholar]
  19. Burakov, D.A.; Gordeev, I.N.; Romas’ko, V.Y. Using satellite data for snow cover dynamics estimation in mathematical model of spring runoff (case study of Sayano-Shushenskoe reservoir basin). Sovrem. Probl. Distantsionnogo Zondirovaniya Zemli Kosmosa 2010, 7, 113–121. (In Russian) [Google Scholar]
  20. Borsch, S.V.; Burakov, D.A.; Simonov, Yu.A. A Method of Operational Computation and Forecasting of Daily Water Inflow to the Zeya HPP Reservoir. Trudy Gidromettsentra Rossii 2016, 359, 106–127. (In Russian) [Google Scholar]
  21. Rivin, G.S.; Rozinkina, I.A.; Blinov, D.V. The Technological Line of the Short-term Mesoscale Operational Weather Forecast System COSMO-RU with the 7 km Grid Step. Trudy Gidromettsentra Rossii 2012. (In Russian). Available online: http://method.meteorf.ru/publ/tr/tr347/rivin.pdf (accessed on 30 November 2017).
  22. Karaev, V.; Panfilova, M.; Titchenko, Y.; Meshkov, E.; Balandina, G.; Andreeva, Z. First view on the flood detection by the dual-frequency precipitation radar. In Proceedings of the 2017 IEEE International Geoscience and Remote Sensing Symposium (IGARSS’2017), Fort Worth, TX, USA, 23–28 July 2017; pp. 6235–6238. [Google Scholar]
  23. Giustarini, L.; Vernieuwe, H.; Verwaeren, J.; Chini, M.; Hostache, R.; Matgen, P.; Verhoest, N.E.C.; De Baets, B. Accounting for image uncertainty in SAR-based flood mapping. Int. J. Appl. Earth Obs. Geoinf. 2015, 34, 70–77. [Google Scholar] [CrossRef]
  24. Gobeyn, S.; Van Wesemael, A.; Neal, J.; Lievens, H.; Van Eerdenbrugh, K.; De Vleeschouwer, N.; Vernieuwe, H.; Schumann, G.J.-P.; Di Baldassarre, G.; De Baets, B.; et al. Impact of the timing of a SAR image acquisition on the calibration of a flood inundation model. Adv. Water Resour. 2017, 100, 126–138. [Google Scholar] [CrossRef]
  25. McCabe, M.F.; Rodell, M.; Alsdorf, D.E.; Miralles, D.G.; Uijlenhoet, R.; Wagner, W.; Lucieer, A.; Houborg, R.; Verhoest, N.E.C.; Franz, T.E.; et al. The future of Earth observation in hydrology. Hydrol. Earth Syst. Sci. 2017, 21, 3879–3914. [Google Scholar] [CrossRef]
  26. Asmus, V.V.; Bedritskii, A.I.; Stasenko, V.N.; Tasenko, S.V.; Uspenskii, A.B. Development of the Space Observation System and Geophysical Monitoring System in Roshydromet. Russ. Meteorol. Hydrol. 2017, 42, 442–451. [Google Scholar] [CrossRef]
  27. Schaake, J.; Demargne, J.; Hartman, R.; Mullusky, M.; Welles, E.; Wu, L.; Herr, H.; Fan, X.; Seo, D.-J. Hydologic Applications of Short and Medium Range Ensemble Forecasts in the NWS Advanced Hydrologic Prediction Services (AHPS). In Proceedings of the 20th Conference on Weather Analysis and Forecasting/16th Conference on Numerical Weather Prediction, Seattle, WA, USA, 10–15 January 2004. [Google Scholar]
  28. WMO Report: GIS Application in Operational Hydrology. Available online: http://www.wmo.int/pages/prog/hwrp/documents/RAVI/GIS%20Applications_FINAL.pdf (accessed on 30 November 2017).
Figure 1. Landscape-hydrologic regionalization and elevation zoning of the Zeya reservoir watershed (numbers indicate the 5 subbasins, used as analogue river basins).
Geosciences 08 00093 g001
Figure 2. Hydrological forecasts and warnings of the hydrological state at the main cities of the Amur River.
Geosciences 08 00093 g002
Figure 3. Architecture of the subsystem of preparation and delivery of flood forecasting and warning system output products to the end users (ASDT is automated system of data transmission).
Geosciences 08 00093 g003
Figure 4. Presentation of hydrometeorological information in the flood forecasting and warning system web application: the observed (blue solid line) and forecast (green solid line) water levels at Khabarovsk (on the left); the observed and forecast hydrometeorological data (on the right).
Geosciences 08 00093 g004
Figure 5. Example of hydrometeorological analysis within the web application (hydrological observations and forecasts and meteorological observations) available for an end-user.
Geosciences 08 00093 g005
Figure 6. Format of dissemination of the inflow forecast to the Zeya reservoir to main end-users.
Geosciences 08 00093 g006
Figure 7. Web-GIS presentation of the July 2015 Ussuri River flood situation: observed water level dynamics at Novosovetskoe (on the left); satellite-based flood map (on the right).
Geosciences 08 00093 g007
Table 1. Operational water level forecasts performance during 2015–2017 warm periods (May–September): water level standard deviation (SD, cm), root mean squared error (S, cm), and Nash–Sutcliffe efficiency (NS).
Gauge CodeForecast PointSDLead Time, Days
123456
SNSSNSSNSSNSSNSSNS
6005Amur—Dzhalinda76300.85
6010Amur—Chernyaevo83150.96400.79
6016Amur—Kumara83250.91470.69
6022Amur-Blagoveschensk83180.94380.85390.84520.74650.64790.43
6024Amur-Konstantinovka89140.98330.90330.90330.90
6027Amur—Innokentyevka118140.99310.94
6030Amur—Pashkovo151160.99390.95390.95
5002Amur—Nagibovo122100.99
5004Amur—Leninsk11670.99200.97
5012Amur—Khabarovsk96280.94280.94310.92370.89410.87
5016Amur—Elabuga9040.998
5019Amur—Troitskoe7240.995
zs5020Amur—Malmyzh8740.995
5024Amur—Komsomolsk10170.9490.95130.94190.91
6280Zeya—Polyakovskii59190.90
6286Zeya—Mazanovo78150.96300.87
6291Zeya—Malaya Sazanka10490.99360.90
6295Zeya—Belogorye84120.98150.96
6364Selemdzha—Stoiba77310.75
6369Selemdzha—Norsk110290.94
Table 2. Nash–Sutcliffe efficiency for operational inflow forecasts into the Zeya reservoir during 2015–2017 warm periods (May–September).
NWP InputLead Time, Days
123
COSMO0.920.810.71
UKMO0.940.770.66
NCEP0.920.790.69
JMA0.940.790.69

