Article

Multicamera, Multimethod Measurements for Hydromorphologic Laboratory Experiments

Department of Civil and Environmental Engineering, Politecnico di Milano, Milan 20133, Italy
*
Author to whom correspondence should be addressed.
Geosciences 2018, 8(5), 172; https://doi.org/10.3390/geosciences8050172
Submission received: 13 April 2018 / Revised: 2 May 2018 / Accepted: 2 May 2018 / Published: 10 May 2018
(This article belongs to the Special Issue Laboratory Geosciences: Modelling Surface Processes)

Abstract

:
The realization of hydromorphologic laboratory experiments on the propagation of aggrading or degrading sediment fronts requires simultaneous measurements of the sediment feeding rate, the profile of the free surface, and the flume bed elevation. In this study, five action cameras and different image-processing techniques were employed to measure all the needed quantities automatically and with adequate temporal resolution. The measurement of the sediment feeding rate was determined by particle image velocimetry as a surrogate, correlated quantity: the surface velocity of the sediment flow along a vibrating channel was used as an upstream feeder. The profile of the free surface was measured by shooting an array of piezometers connected to the flume. Each piezometer pipe contained a buoyant black sphere that could be recognized by using tools for particle identification, thus determining the elevation of the free surface above the piezometric probe. Finally, the bed profile along the flume was measured at any instant by edge detection, locating the transition from a water layer to a sediment layer in images taken from the side of the flume. The paper describes the instrumentation and the methods, finally presenting the results obtained from a prototypal experiment. Potentialities and limitations of the proposed methods are discussed, together with some prospects on future use in systematic experimental campaigns.

1. Introduction

Field observation of river morphodynamics reveals a number of fascinating processes (see, for example, [1,2,3,4,5,6,7]), but doing so is a challenge for researchers because it requires a great amount of human effort. Hydromorphologic laboratory experiments are thus often performed to reproduce reach-scale processes mimicking those typically occurring in reality. In this paper, a specific focus is given to experiments for bed aggradation/degradation in straight flumes. Such experiments can furnish insights into the mechanisms governing the observed phenomena (e.g., [8,9,10,11,12,13,14,15]) and are also instrumental for the validation of numerical models (e.g., [16,17,18,19,20]) that are nowadays mostly used for predictions and for interpretations of past events (as, for example, in [21,22,23,24,25]).
In the literature, hydromorphologic experiments have been performed using a variety of instruments. Manual point gauges were used to measure bed elevation in pioneering studies (e.g., [8,9]). A bed-follower probe and an electronic point gauge were used by [11] to measure bed and water elevations, with both instruments mounted on a moving carriage. Wall-attached rulers and a crew of seven people were employed by [12]. Carriage-movable instruments (digital point gauges, echo sounders, and acoustic probes) were also used by [13,14,19] to measure bed and water surface elevations. Sediment transport rates were frequently measured by samplers (e.g., [11,12,13,14,19]). A sediment feeding rate was controlled by [19] using an Archimede’s screw with a controlled rotation velocity. Bed textures were in general observed by sampling or by photographs as done, for example, by [12,13]. In general, manual measurements may suffer from shortcomings due to the manpower needed during the experiment and user dependence on the returned values. At least for laboratory work, that can be performed in more controlled conditions than in the field. These drawbacks have motivated, for example, equipping sediment samplers or traps with scales or even alternative measurement techniques to achieve an automatic measurement of transport rates (e.g., [26,27]). Furthermore, movable instruments may reduce measuring frequency due to the time needed to move the probe from one location to another. However, fortunately, progress in experimental devices and methods is continuously enhancing the capability of detailed observation. The field of image acquisition and processing is particularly vital because these techniques enable refined studies to be performed. At the same time, increasing use is made of instruments borrowed from everyday life, which maintain affordable costs. For the particular case of bed-load sediment transport, for example, much has been achieved thanks to image-based studies of sediment mechanics (see, for example, [28,29,30,31,32,33], where different image-analysis methods have been used to investigate the temporal fluctuations of the bed-load sediment transport rate, the properties of individual grain motion by particle tracking, the statistical distributions of bed-load particle velocity, or the scaling properties of sediment diffusion). The scientific literature has also demonstrated a wide use of image-based techniques in hydromorphologic experiments at a variety of scales (e.g., [34,35,36,37], who considered, respectively: the propagation of dam-break waves on erodible beds; the creep process on planar sand beds; the coevolution of the flow and bed surfaces at a very fine scale; and the spatial distribution of the sediment transport rate in channels with a complex self-formed geometry).
The realization of a hydromorphologic experiment requires the simultaneous control and/or measurement of a number of quantities: for example, the water discharge, a sediment feeding rate, the profile of the water surface, the profile of the sediment bed, the sediment transport rate, the granulometric distribution of the sediment material, the thickness of the active layer, among others. The number of quantities to be measured and the desired accuracy and precision depend, obviously, on the purpose of the study. An obvious question is: Can one design a comprehensive system to measure the relevant quantities automatically, thus reducing the manual effort needed to run and control the experiments? This paper presents an integrated measurement method that has been set up to be employed in laboratory experiments with the migration of a sediment front along a straight channel in nonequilibrium conditions (i.e., subject to an upstream sediment feeding that is different from the transport capacity of the flow). These experiments mimic the behavior of natural channels subject to an external sediment supply (for example, from the upstream part of a catchment or by a shallow landslide). Apart from the flow rate, all the measured quantities (sediment feeding rate, profiles of the water surface and sediment bed) are obtained from movies taken during the experiments with several action cameras. Data collection is thus automatized and does not require instrumentation pieces to be moved during the runs. In this way, the measurement methods presented in the paper contribute to minimizing the abovementioned shortcomings and the human effort related to performing hydromorphologic experiments in the laboratory. The image-processing procedures are first described; second, the application to a hydromorphologic experiment with downstream migration of an aggrading sediment front is documented; finally, potentialities and limitations of the experimental method are discussed.

2. Laboratory Facility and Measurement Methods

The measurement methods presented here are, in principle, sufficiently general to be used in a variety of setups. However, since they were specifically developed with the intent of realizing experiments in an available flume, an essential description of the laboratory installation is provided first. It is confirmed that the described protocols can be exported to other facilities with (if any) small amendments.

2.1. Facility

The sample hydromorphologic experiment presented in this work was performed in a tilting flume with a rectangular cross section, located at the Mountain Hydraulics Lab of the Politecnico di Milano. The flume was 5.2 m long, 0.3 m wide, and 0.45 m high. A 15-cm layer of loose sediment was placed on the channel bottom. The sediment was made of Polyvinyl Chloride (PVC) cylindrical particles with size = 3.8 mm, geometric standard deviation of the grain size distribution = 1.04, and density = 1443 kg/m³. Water was discharged by a submerged pump and the flow rate was measured by an electromagnetic flowmeter. The flume was equipped with a tailgate regulation to set a desired downstream flow depth. Nine piezometric probes were present along the bottom of the channel at mid-width and were connected with piezometers attached to the wall by means of an appropriate panel. Finally, at the flume inlet, a sediment feeder was present, which was a compound of a vibrating channel with a hopper above. More details about the experimental facility are given by [15].
Experimental tests were run by: (i) setting a slope; (ii) carefully scraping the sediment layer to obtain an even bed; (iii) spraying the bed with water to avoid particle buoyancy due to surface tension at water arrival; (iv) filling the flume with water at a very low rate and with the tailgate regulation inducing a high backwater; (v) removing air bubbles from the piezometer pipes; (vi) achieving a quasi-uniform flow with prescribed discharge and depth; (vii) switching the sediment feeder on; (viii) letting a channel morphology develop, with the downstream propagation of an aggrading or degrading sediment front (only one proof-of-concept experiment with bed aggradation is described in the paper); (ix) periodically refilling the sediment hopper; and (x) after some time, inverting the order of the operations (reduce discharge, induce backwater, switch the vibrating channel off) to stop the experiment. This brief outline did not include the image-based measurements, which are described in detail in the following sections.

2.2. Measurement of the Profile of the Free Surface

The panel with the piezometers was filmed for the entire duration of the experiment with an action camera (MEDIACOM SportCam XPRO 215 HD Wi-Fi, made by MediaCom, London, UK), at a resolution of 1920 × 1080 pixels and a rate of 30 frames per second. The camera placement is shown in Figure 1. This was similar to what was done in [15], where water profiles had to be extracted manually (and with high time consumption) by a user watching the movies after each experiment. In the present case, instead, black plastic spheres were present in the piezometer pipes, as is visible in Figure 1. These spheres enabled an automatic measurement to be performed of the profile of the free surface by a suitable image-processing code.

2.2.1. Removal of Lens Distortion, Region Choice, and Image Calibration

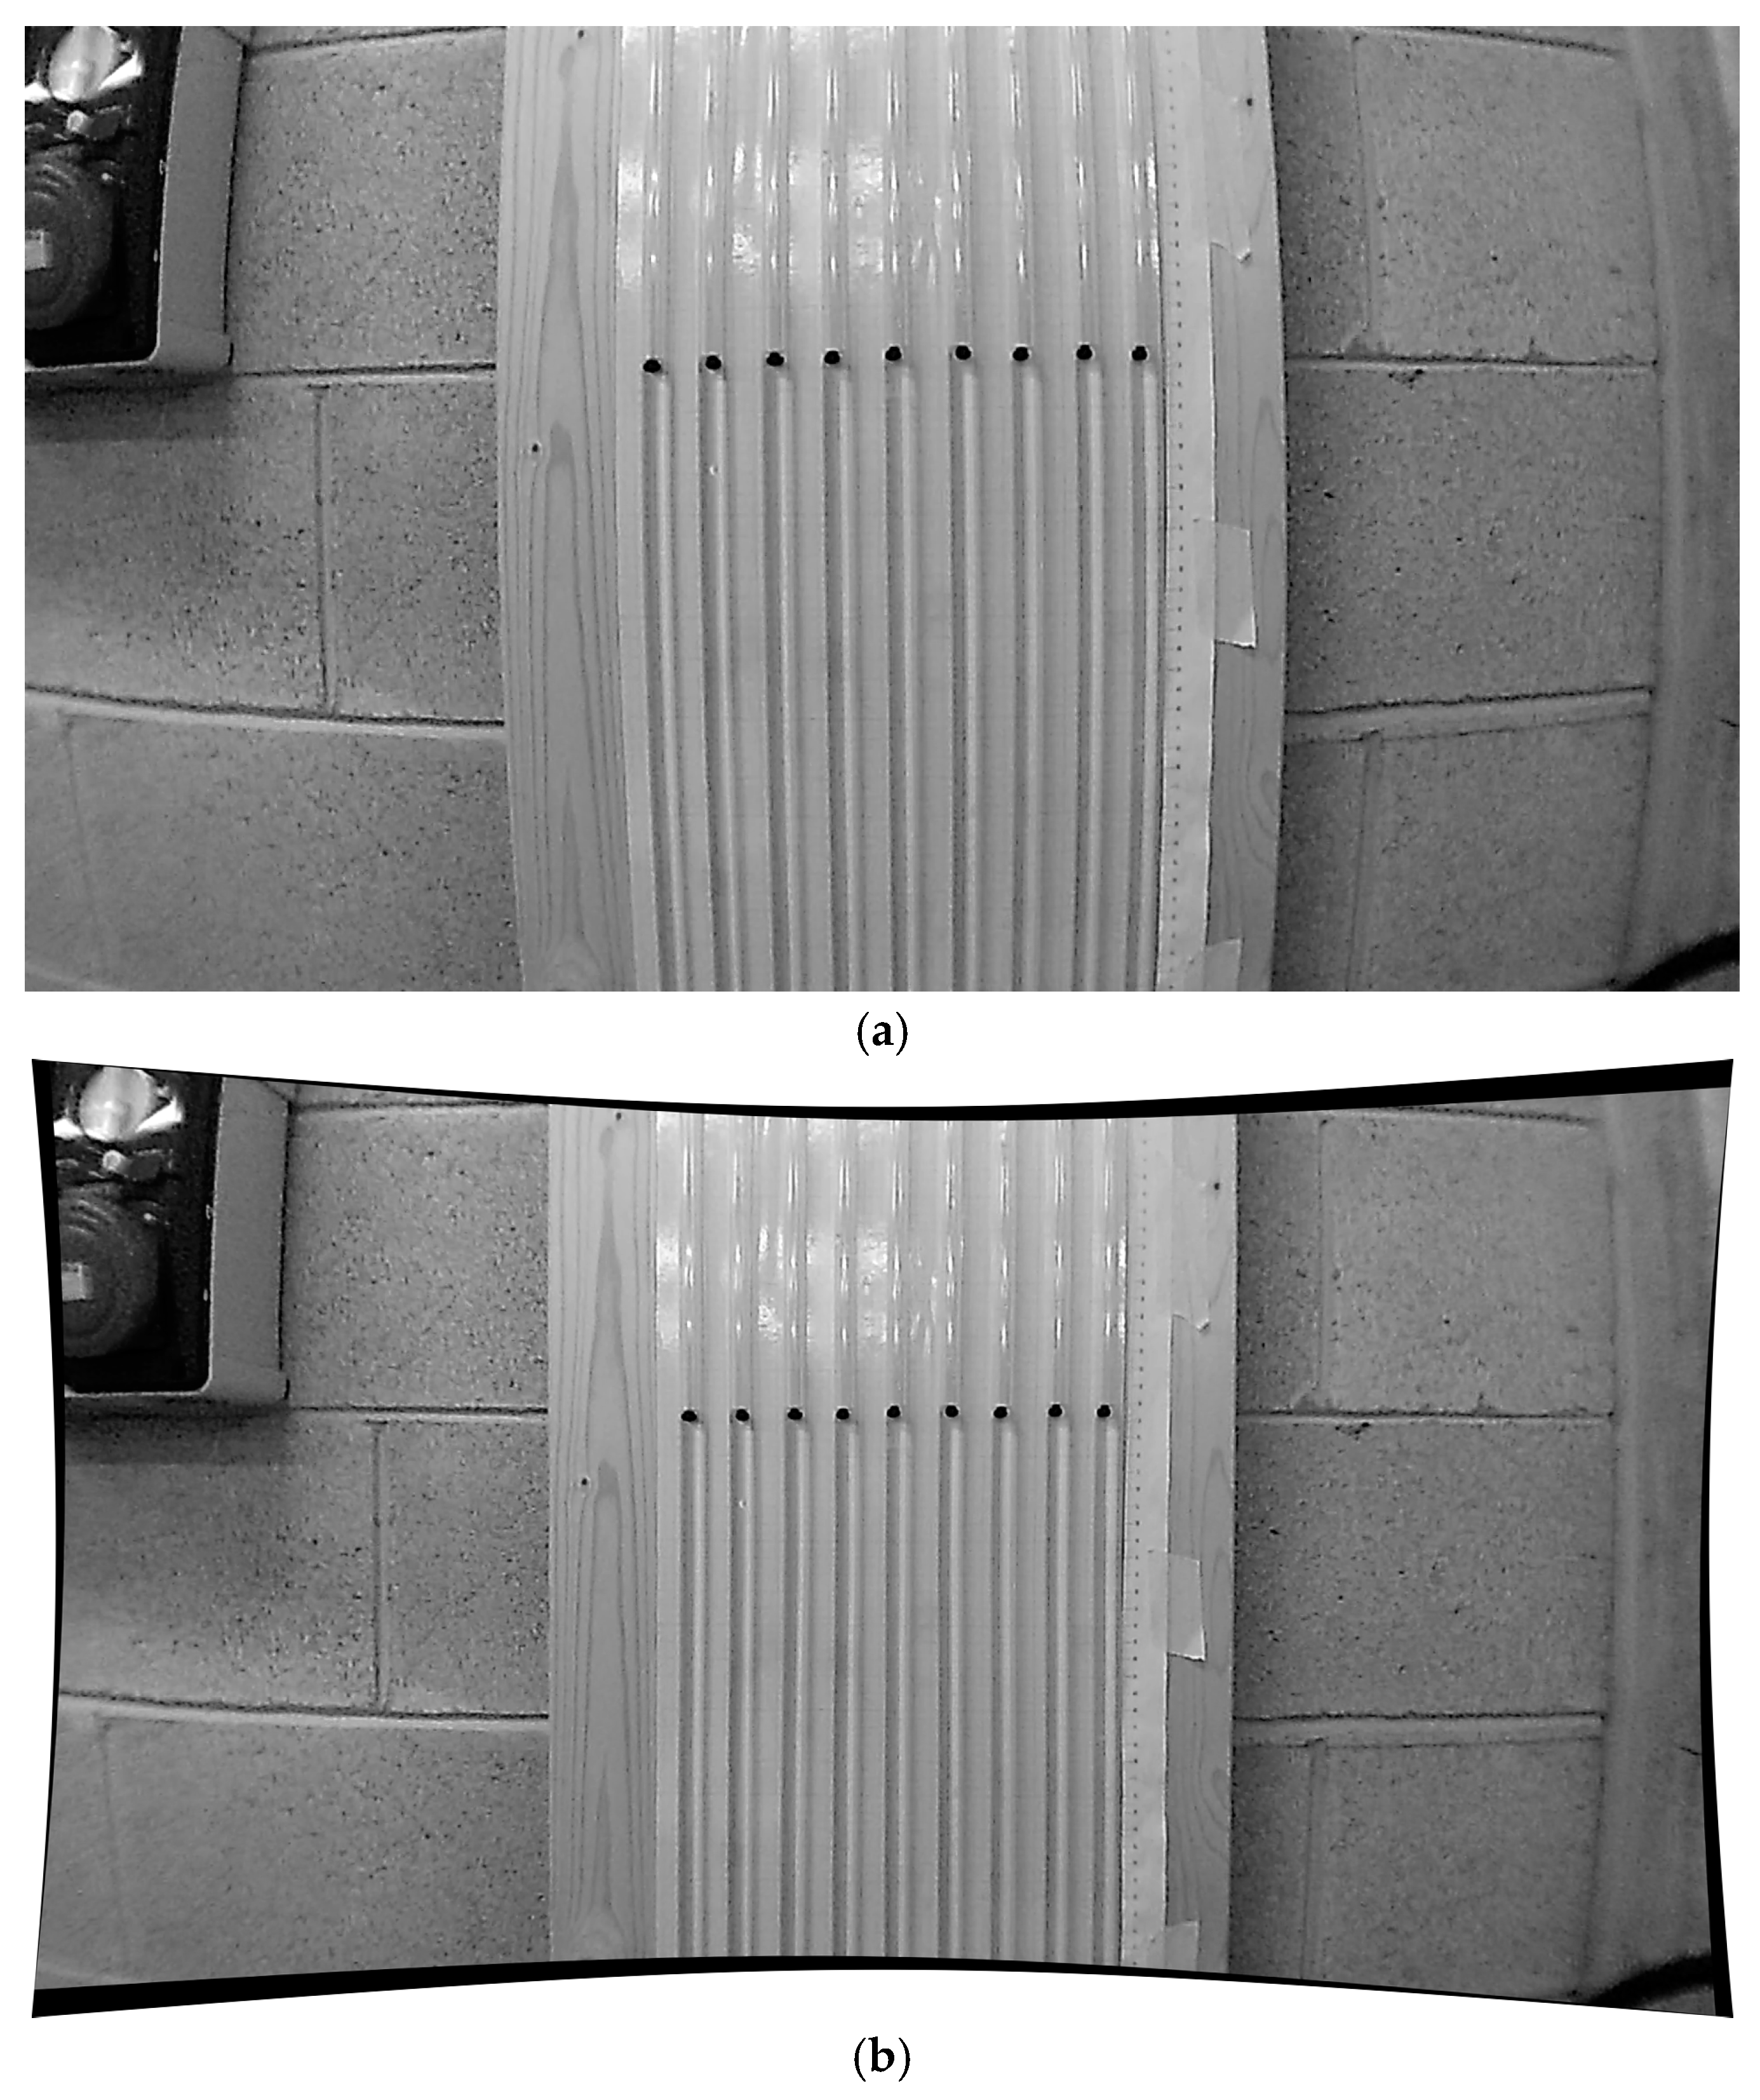
The acquired images were highly distorted by a short lens mounted on the camera (Figure 2a). Therefore, image distortion had to be removed by applying a radial transformation to the coordinates of the pixels in the image, as described by [38]. Pixel radial coordinates r were transformed into new ones rt as follows: rt = r/(1 + k × r), where k is a scalar parameter that must be determined by the user on the basis of a sample image imposing that curved lines become rectilinear (for a visual demonstration, see a recent video article by [39]). It is better to repeat this operation after each experiment, even though, if the camera is always placed in the same position, the required image transformation will be always the same. Figure 2b presents the result of the image transformation (where the image was also rotated by 0.9° in the clockwise direction and a value of k = 0.22 was used). The removal of distortion was successful in the center of the image, while some residual distortion may have remained in the peripheral parts. However, a working region was chosen to be used for the following operations as demonstrated in Figure 2c. In this way, most of the image was not used. A closer position of the camera would reduce the image portion that must be discarded, but also dramatically increase the image distortion due to the lens. Therefore, the distance of the camera from the target must be chosen seeking a compromise between a good resolution and a manageable image distortion. For the example in Figure 2, the distance of the camera from the target was approximately 40 cm.
An image calibration must be determined in terms of a conversion factor between the pixel coordinates in the image and corresponding real elevations. To this purpose, the piezometers were placed on a sheet of graph paper and a vertical ruler was also attached to the panel (visible in Figure 1 and Figure 2). Pixel coordinates and corresponding graph paper values must be known for at least two points in the image. Based on that, real coordinates may be obtained from pixel ones for any point in the image.
The above procedures were also required for all the measurements described in Section 2.3 and Section 2.4, but a similar description is not repeated as the methods are always the same (key changes in the reference for calibration will only be mentioned). Furthermore, additional operations may be required for specific measurements. For the profile of the free surface, a correspondence between the values on the graph paper and the actual water depths must be determined during ad hoc preliminary tests.

2.2.2. Measurement of the Water Elevation in the Piezometer Pipes

The measurement was based on identifying the position of a black sphere. The operations were similar to those performed for the identification of a blob centroid in particle tracking. First, an image like that in Figure 2c was divided in vertical slices, each of which corresponded to one piezometer (Figure 3a). The image was then converted into its corresponding negative one (Figure 3b), where the plastic sphere is white. Finally, the negative image was converted into a binary one based on an intensity threshold. The binary image (Figure 3c) is almost completely black, with a white spot corresponding to the sphere. The vertical pixel coordinate of the centroid was determined as the mean value of all the vertical coordinates for white pixels. This coordinate was finally converted into an elevation value on the graph paper thanks to the image calibration procedure of Section 2.2.1.
The elevation of the center of a plastic sphere does not correspond to the water elevation that one would read looking at a water surface within the piezometer pipe. Therefore, the difference between these two elevations must be determined by ad hoc preliminary tests, to be later applied to the automatic measurements. In this work, this difference was found to be around 3 mm (consider that the inner diameter of the piezometer pipe was 8 mm and the diameter of a sphere was 6 mm). The uncertainty of the measurement can be quantified as large as ±2 mm.
The measurement depends on only one user-defined parameter, that is, the intensity threshold required to convert a negative image into a binary one. Low values of the threshold do not enable a clear identification of the sphere (Figure 4); on the other hand, high values may split the sphere into several white spots, negatively affecting the determination of the blob centroid or even making the sphere no longer visible. For the piezometer pipe of Figure 3, a threshold of 0.77 times the intensity of white (equal to 255) was used (third-last panel of Figure 4 that is the same picture as in Figure 3c), that was an appropriate intermediate value returning a good shape of white blobs in the binary images. In general, this parameter must be tuned by the user and may change, depending mostly on the ambient light conditions.

2.3. Measurement of the Sediment Feeding Rate

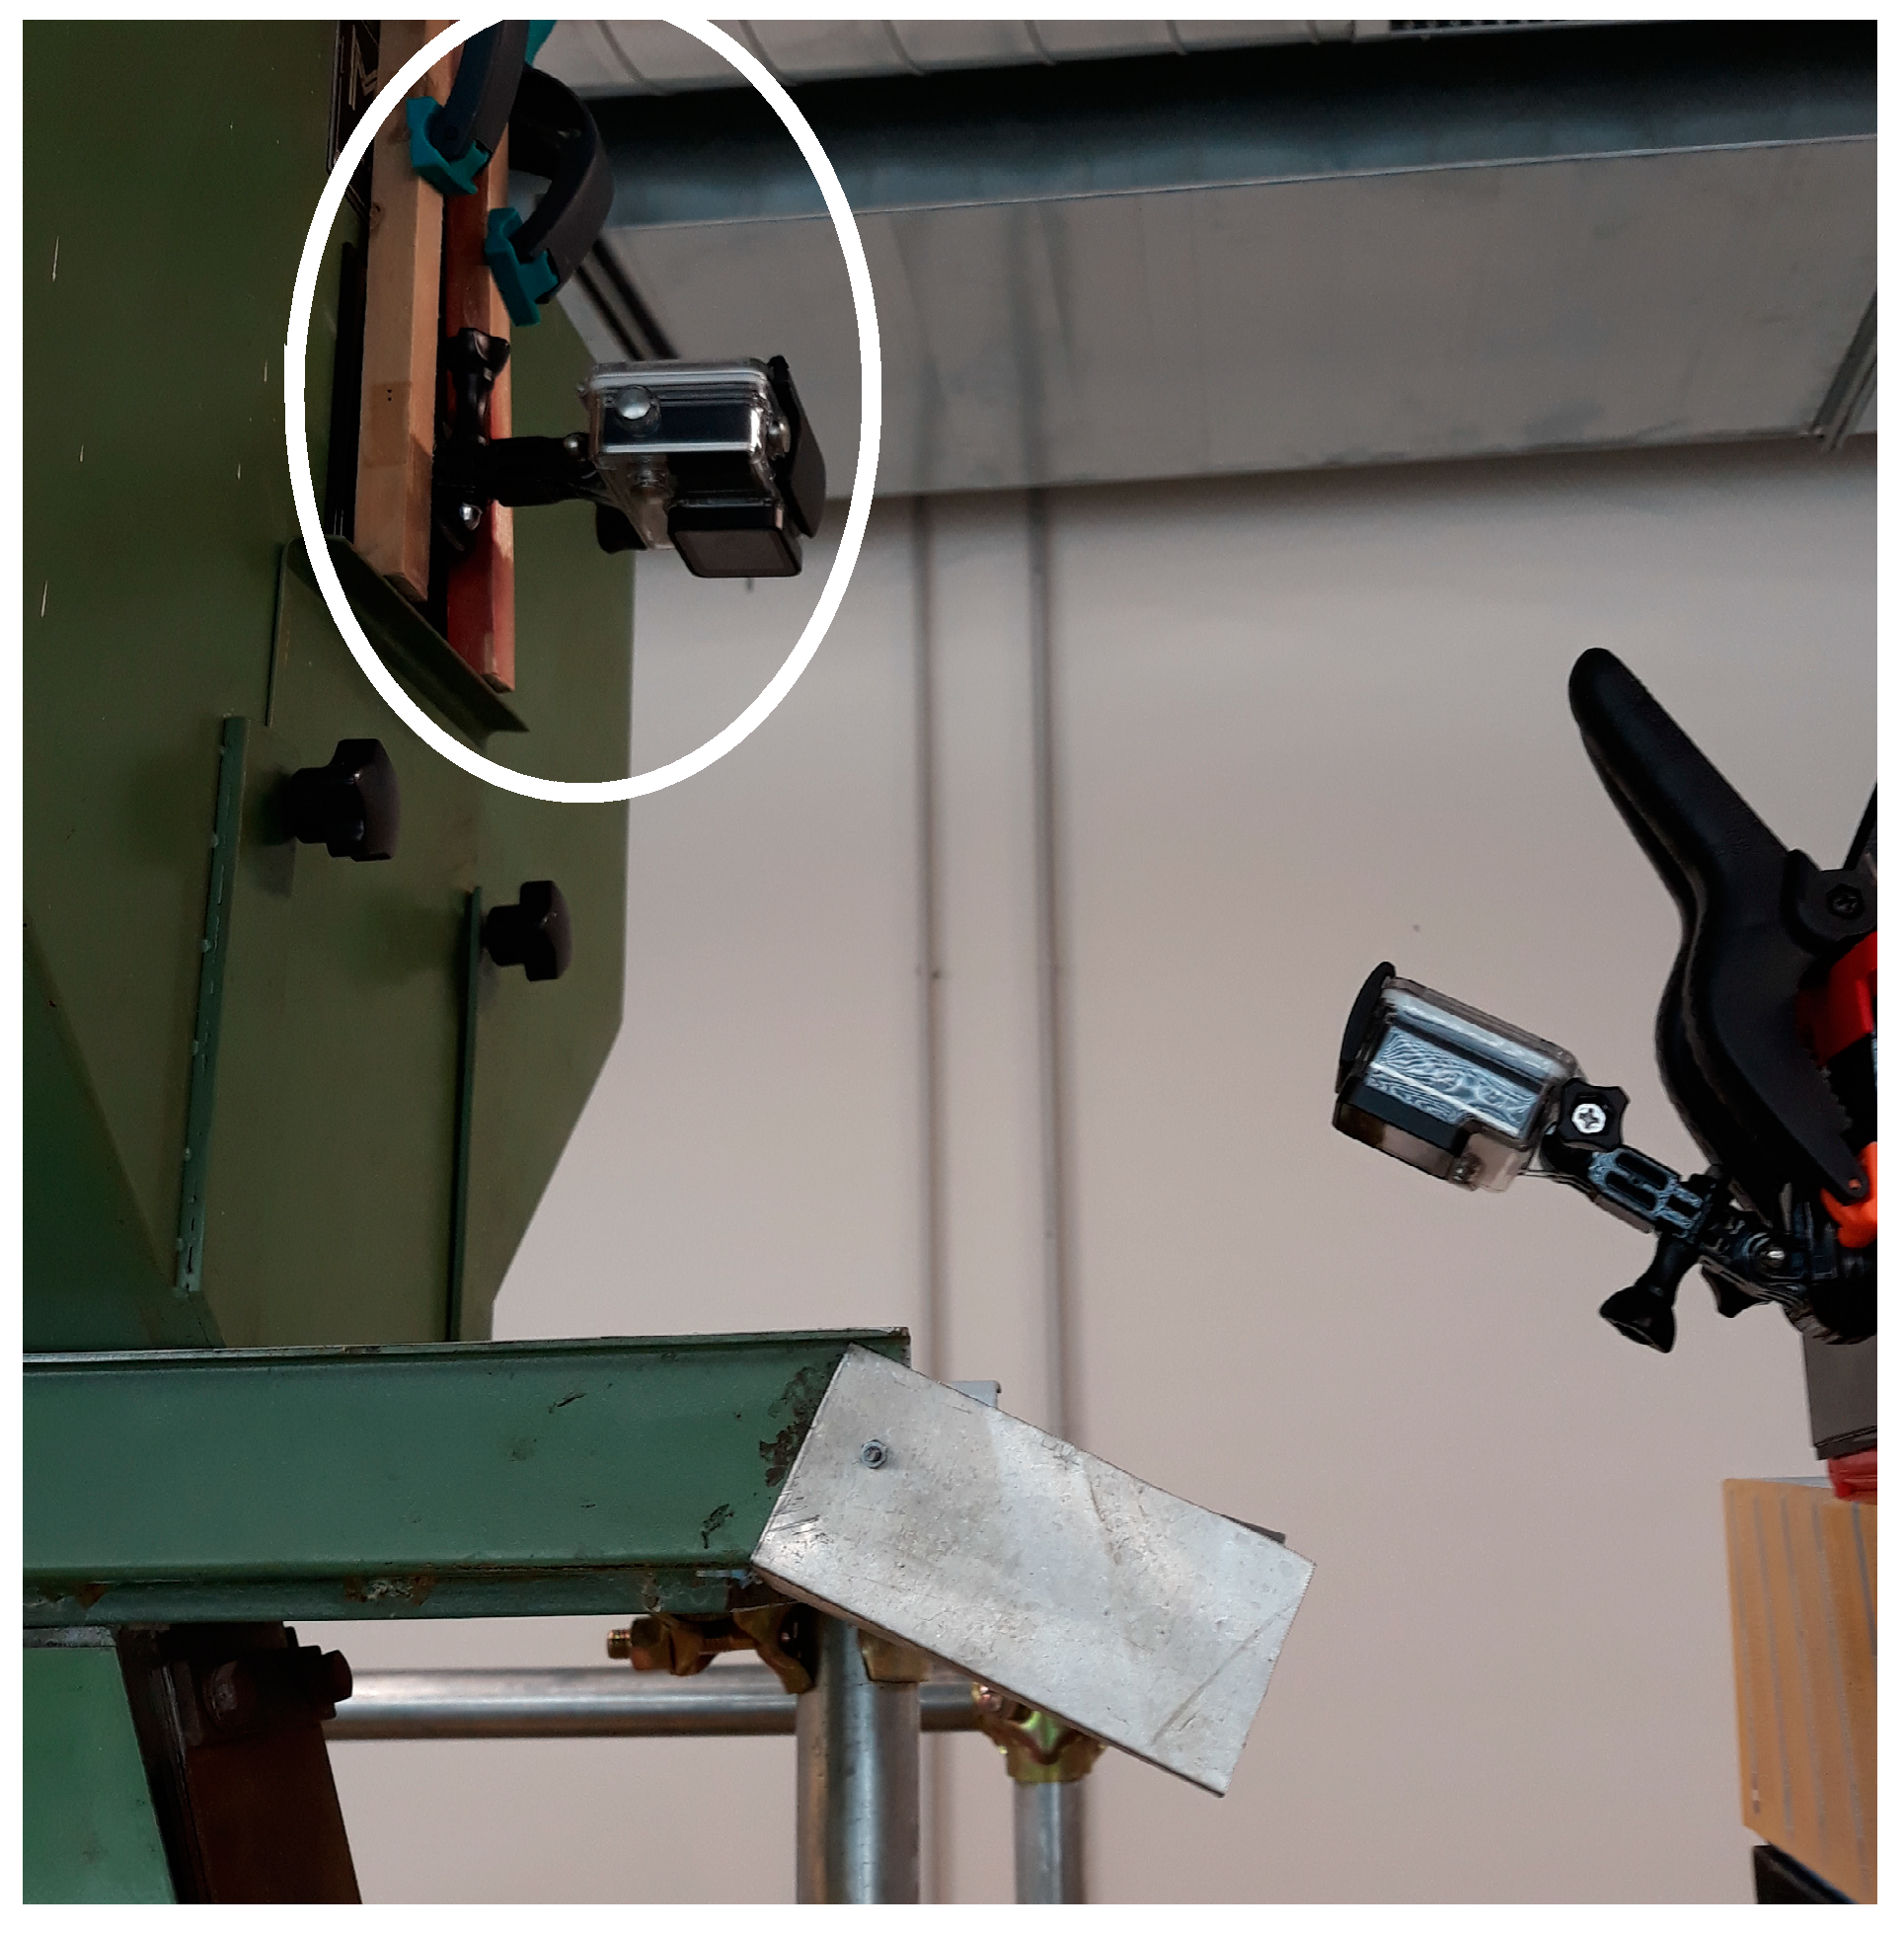
The sediment feeding rate can be controlled by setting the opening of a sluice gate between the hopper and the vibrating channel, as well as the intensity of vibration. Preliminary experiments of [15] returned a correspondence between the above settings and the obtained sediment feeding rate. However, it is also useful to continuously measure the feeding rate during the hydromorphologic experiments to ensure that a correct value is accounted for in the following data analysis. To this aim, the vibrating channel was filmed from the top (Figure 5). An action camera (GoPro Hero 4 Black Edition, made by GoPro, San Mateo County, CA, USA) was used for the purpose, with a resolution of 1920 × 1080 pixels and operating at 30 frames per second.
When the sediment was fed into the flume, a layer of particles moved along the vibrating channel of the feeder. The motion of these particles was visibly regular, thus suggesting the use of the surface velocity of the sediment flow as an indicator of the feeding rate. The surface velocity was measured from the movies collected by the upper camera in Figure 5. Typical movie frames were like the one shown in Figure 6 (that was converted to grayscale). One should remember that original frames for the camera must then undergo a rotation, removal of lens distortion, calibration, and choice of a working region. Compared to the description of Section 2.2, for the present images, the calibration was performed based on the known width of the vibrating channel that ideally worked as the graph paper above.
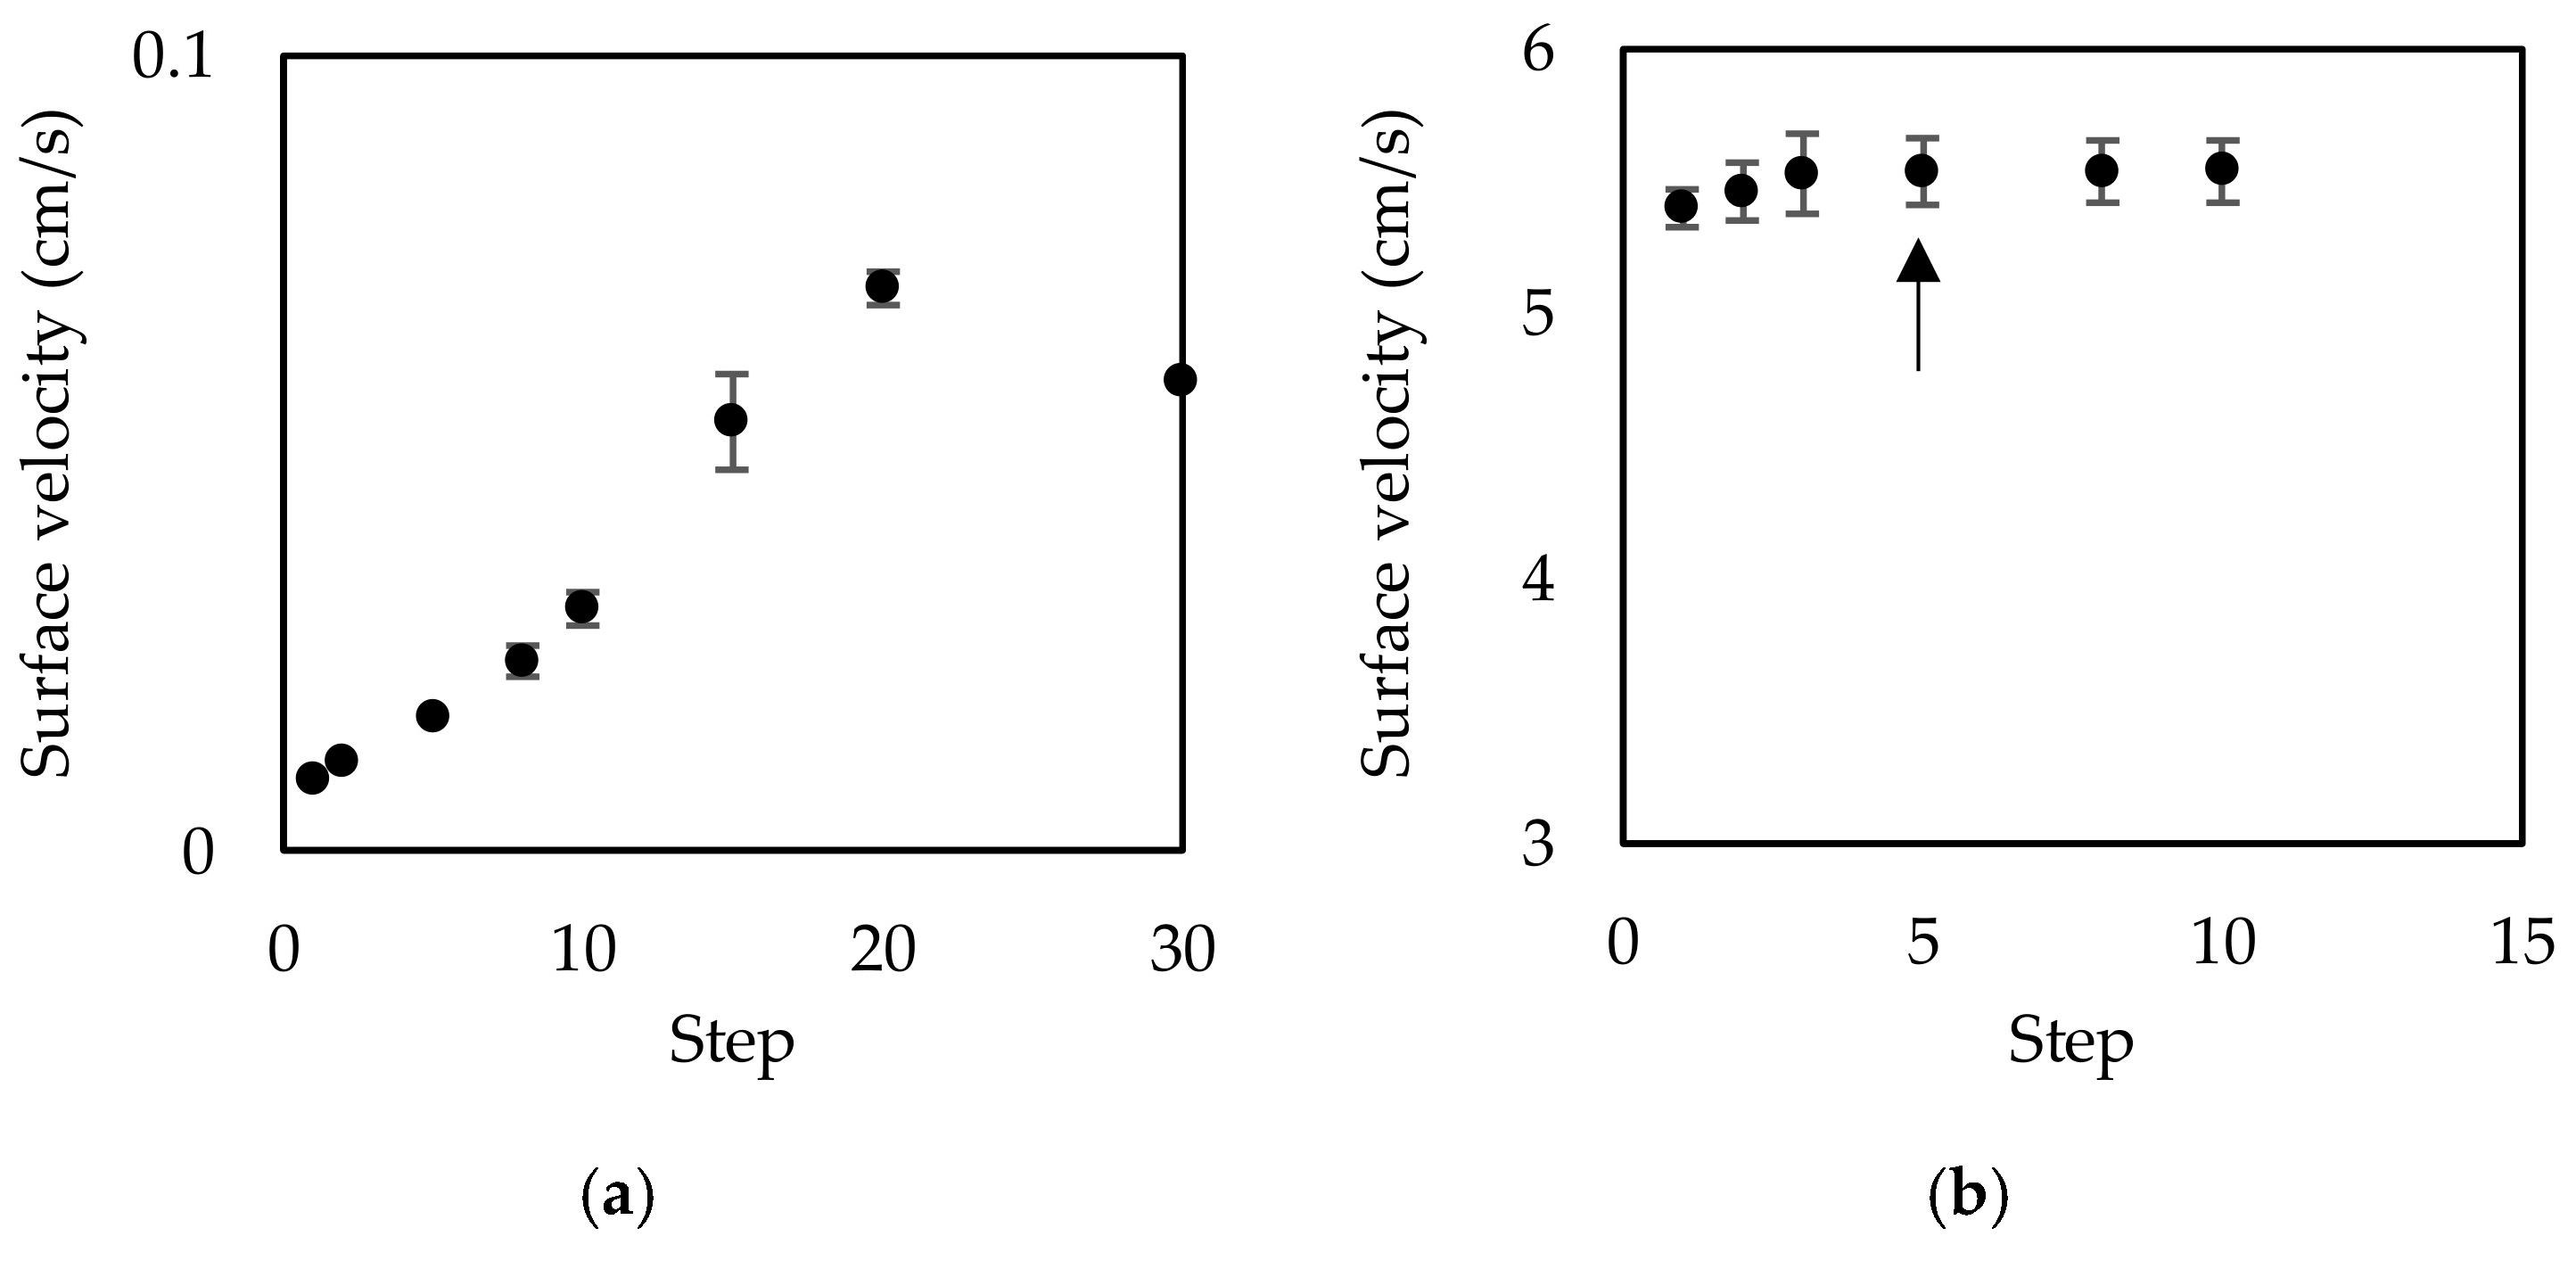
The sediment velocity was measured using a particle image velocimetry (PIV) tool built upon the one originally proposed by [40]. The original method was developed to measure the velocity of grains in weak bed-load transport. In those conditions, only some of the sediment particles moved and needed to be highlighted for their velocity to be measured. Therefore, in [40], the PIV algorithm was applied to images obtained as differences between couples of the movie frames (it was also discussed, among others, by [41] that still particles are filtered out by image subtraction while only the moving ones are visible in the difference images). The algorithm was extensively used for analysis of weak bed-load transport and sediment motion in local scour processes (e.g., [42,43,44,45]) and also for discharge measurements in a small creek by large-scale PIV [46]. In the present case, the sediment flow along the vibrating channel involved all the surface grains, thus the algorithm was applied directly to the movie frames without computing any difference. The PIV tool requires an Eulerian grid of measuring cells (for one velocity vector to be determined for each cell), and the maximum values of the velocity components to be measured. For the present situation, only one measuring cell was used that corresponds to almost the entire surface area of the sediment flow. Additional parameters to be provided are the “step” (the distance between two frames for a velocity measurement, that are frame j and frame j + step) and the “jump” (if a velocity measurement is performed using images j and j + step, the next one is performed with images j + jump and j + step + jump). For the present experiments, the jump was always equal to 1 to maximize the number of velocity measurements and thus the size of the samples, while the step was varied. In fact, for an intense feeding rate, the step can be maintained at a value of 1 because the sediment velocity is appreciable and the sediment motion between two consecutive images is large enough for a reliable velocity measurement. By contrast, for a low sediment feeding rate, the sediment velocity is small, implying negligible difference between consecutive movie frames. In these conditions, the performance of the PIV tool may be poor and larger steps have to be used to increase the goodness of the velocity measurement. As a good practice, the velocity measurement was performed several times with variable steps to assess the sensitivity of the time-mean sediment velocity to the step value that was used, while trying to achieve an independency of the time-mean surface velocity on the step. Figure 7 presents an example of velocity values obtained by changing the step. Uncertainty bars for the mean surface velocity were computed as follows. Given a succession of measured velocity values (see Figure 8a), the corresponding autocorrelation function was computed as A(τ) = [V’(i) × V’(I + τ)]av2, where τ is a lag expressed in terms of a number of values, V′ is a deviation of an instantaneous velocity from the mean one, i is a value counter, subscript ‘av’ denotes averaging, and σ is the standard deviation of the sample (see Figure 8b). The 95% confidence limit for the mean value was determined as equal to 2σ/(N/λ)0.5, where N is the number of measured velocity values and λ is the integral scale of correlation (corresponding to a lag of 85 in Figure 8b).
The correspondence between the time-mean surface sediment velocity and sediment feeding rate (that was determined, also in this case, during preliminary experiments by weighing the sediment fed in a prescribed time) is depicted in Figure 9. The uncertainty bars for mean sediment velocity values were determined as described above. Uncertainty bounds for the sediment feeding rate depended on the precision of the scale and stopwatch used in the preliminary tests, but were always negligibly small. A transfer function was determined, based on which the mean sediment feeding rate (in m3/s) is equal to 7.50 × 10⁻⁷ × V2 + 7.00 × 10⁻⁶ × V, where V is the mean sediment surface velocity. The uncertainty in the estimation of the sediment feeding rate from the surface velocity was quantified based on the rms deviation of the trend line in Figure 9 from the measured values, and was equal to ±4.32 × 10⁻⁷ m3/s.

2.4. Measurement of the Bed Profile

For this measurement, three MEDIACOM SportCam XPRO 215 HD Wi-Fi action cameras were placed besides the flume shooting the lateral wall (Figure 10). Each camera was mounted on a support and captured a 1.3-m portion of the total length of the channel. Therefore, the instantaneous profile of the near-wall bed elevation was measured along 3.9 m of the flume. A sample image is given in Figure 11a. This picture was obtained as described above for other images, the only difference being again in the image calibration. The latter was determined based on vertical rulers attached to the wall and the known length (1.3 m) of each flanged flume reach. Since the sediment bed seemed easily distinguishable from the water layer in the obtained images, an edge-detection method was used to identify the profile of the sediment bed. Similar techniques have been employed in a variety of applications (e.g., [47,48]). A Sobel edge-detection routine (built-in in MatLab) was applied to the frames, obtaining binary images that were white or black where an edge was found or not, respectively, based on the image intensity gradients. The expectation was that the water–sediment interface presents a large contrast and can be unambiguously identified [34]. This was indeed the case, but unfortunately, the contours of the individual sediment particles were as evident as the edges identifying the sediment bed, as shown by Figure 11b. Therefore, additional image analysis was performed as follows.
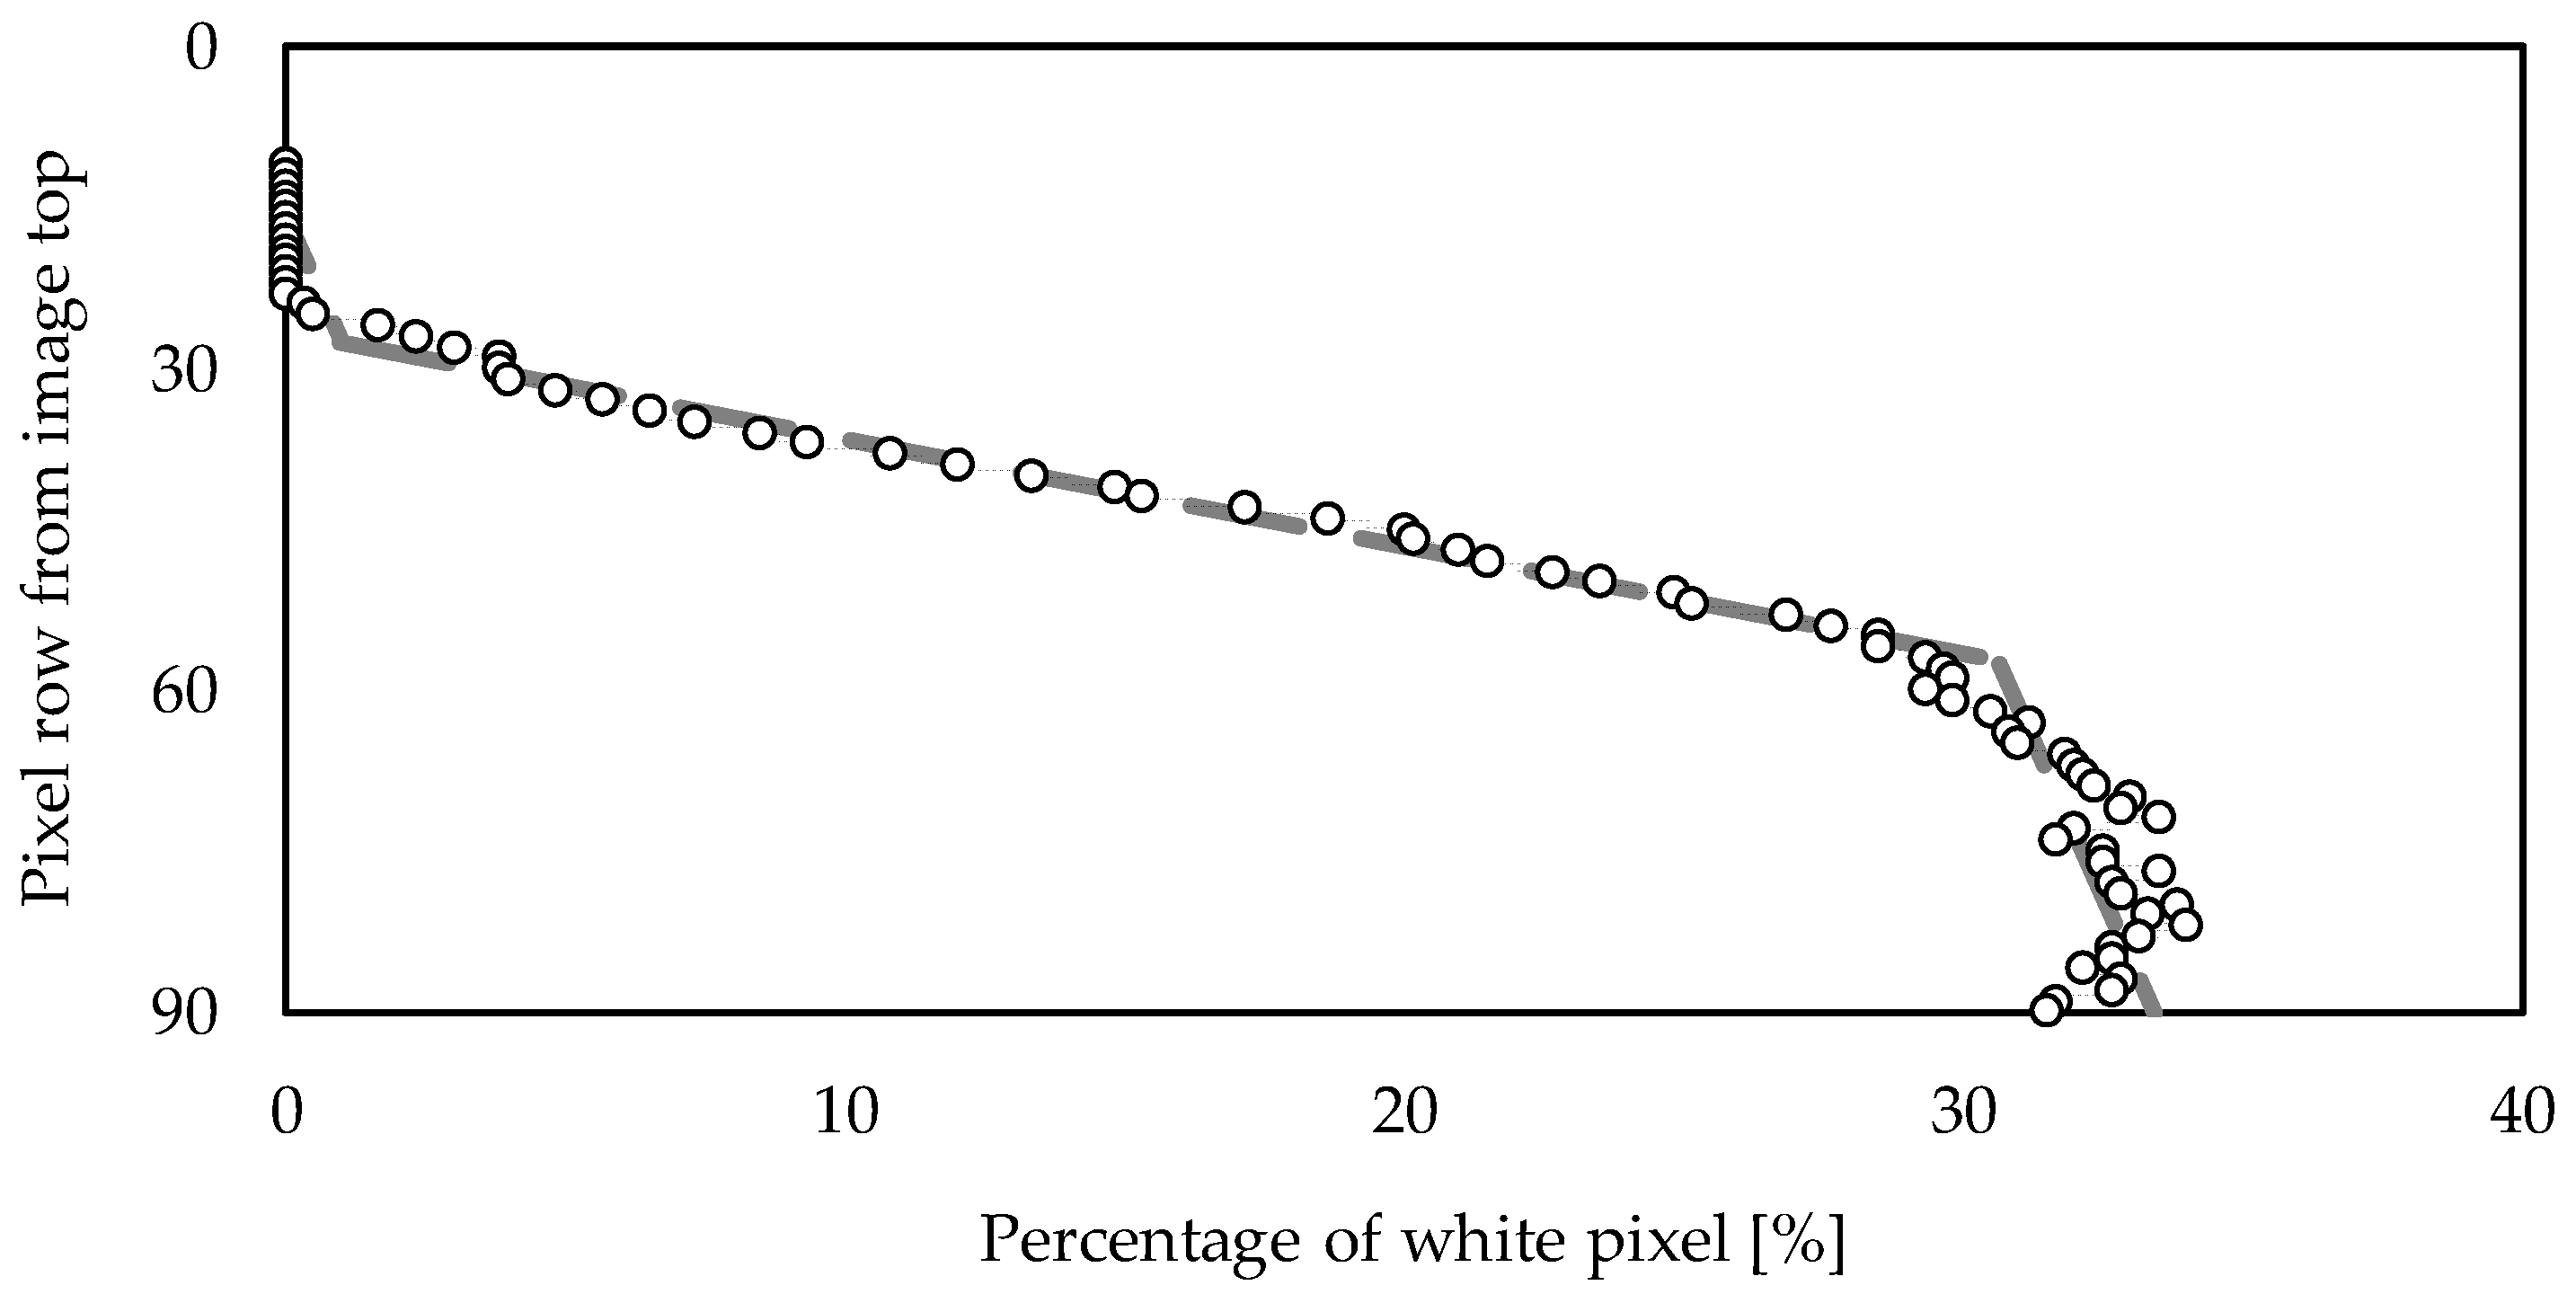
The measurement relates the interface between water and sediment to a transition from a negligible to a significant percentage of white pixels in an interrogation area of binary images like the one in Figure 11b. If one uses an interrogation area like the white rectangle in the image, the percentage of white pixels in the area will be zero or negligible. Now, shifting progressively the rectangle downwards, the percentage of white pixels will initially remain low, then increase when the sediment bed is encountered, and finally reach some plateau assuming a uniform concentration of white pixels in the sediment layer. A sample vertical profile of the percentage of white pixels is shown in Figure 12. Two criteria have been tested to recognize the bed elevation based on vertical profiles like the presented one. The first criterion was related with finding the first big change in the percentage as the vertical profile travelled from the top to the bottom of the image. The second one was instead related with splitting the percentage profile into different reaches with similar slope and locating the slope change towards a much lower slope value. The division of the profile into reaches with similar slope can be performed using the MatLab built-in command findchangepts. The second method worked better and was thus preferred. An example of profile splitting is also depicted in Figure 13. The bed elevation was identified with the change of slope (at a vertical coordinate of 57 pixels from the top of the image) minus half of the height of the search area. Once the job was completed for one vertical profile, the interrogation area was moved back to the top and shifted horizontally for a new vertical profile of percentage to be determined. The process was stopped when the entire image had been explored. The bed profile obtained from the picture in Figure 11 is depicted in Figure 13. After the bed profile had been obtained for each camera, the three pieces of information were linked to each other to determine the profile along 3.9 m of channel.
The parameters for this method were the threshold for application of the Sobel edge-detection method, the size of interrogation areas like the one in Figure 11b, the vertical and horizontal shifts of the search rectangle, and the threshold for application of findchangepts to split the percentage profile into reaches. Used values for the example in Figure 11, Figure 12 and Figure 13 were: 0.09 for the threshold of the Sobel edge-detection method; 30 × 20 pixels for the size of the interrogation area; 1 and 5 pixels for the vertical and horizontal shifts of the search rectangle, respectively; and 0.008 for the threshold for application of the findchangepts function. The measurement uncertainty was quantified as equal to ±5 mm.

3. Application to an Experiment

This section briefly presents the results for an experiment with a channel slope of 0.004, flow rate of 0.01 m3/s, and water depth of 0.065 m. A corresponding equilibrium sediment transport capacity of 2.9 × 10⁻⁵ m3/s was determined after the experiment by collecting the sediment discharged through the channel outlet into a downstream storage tank.
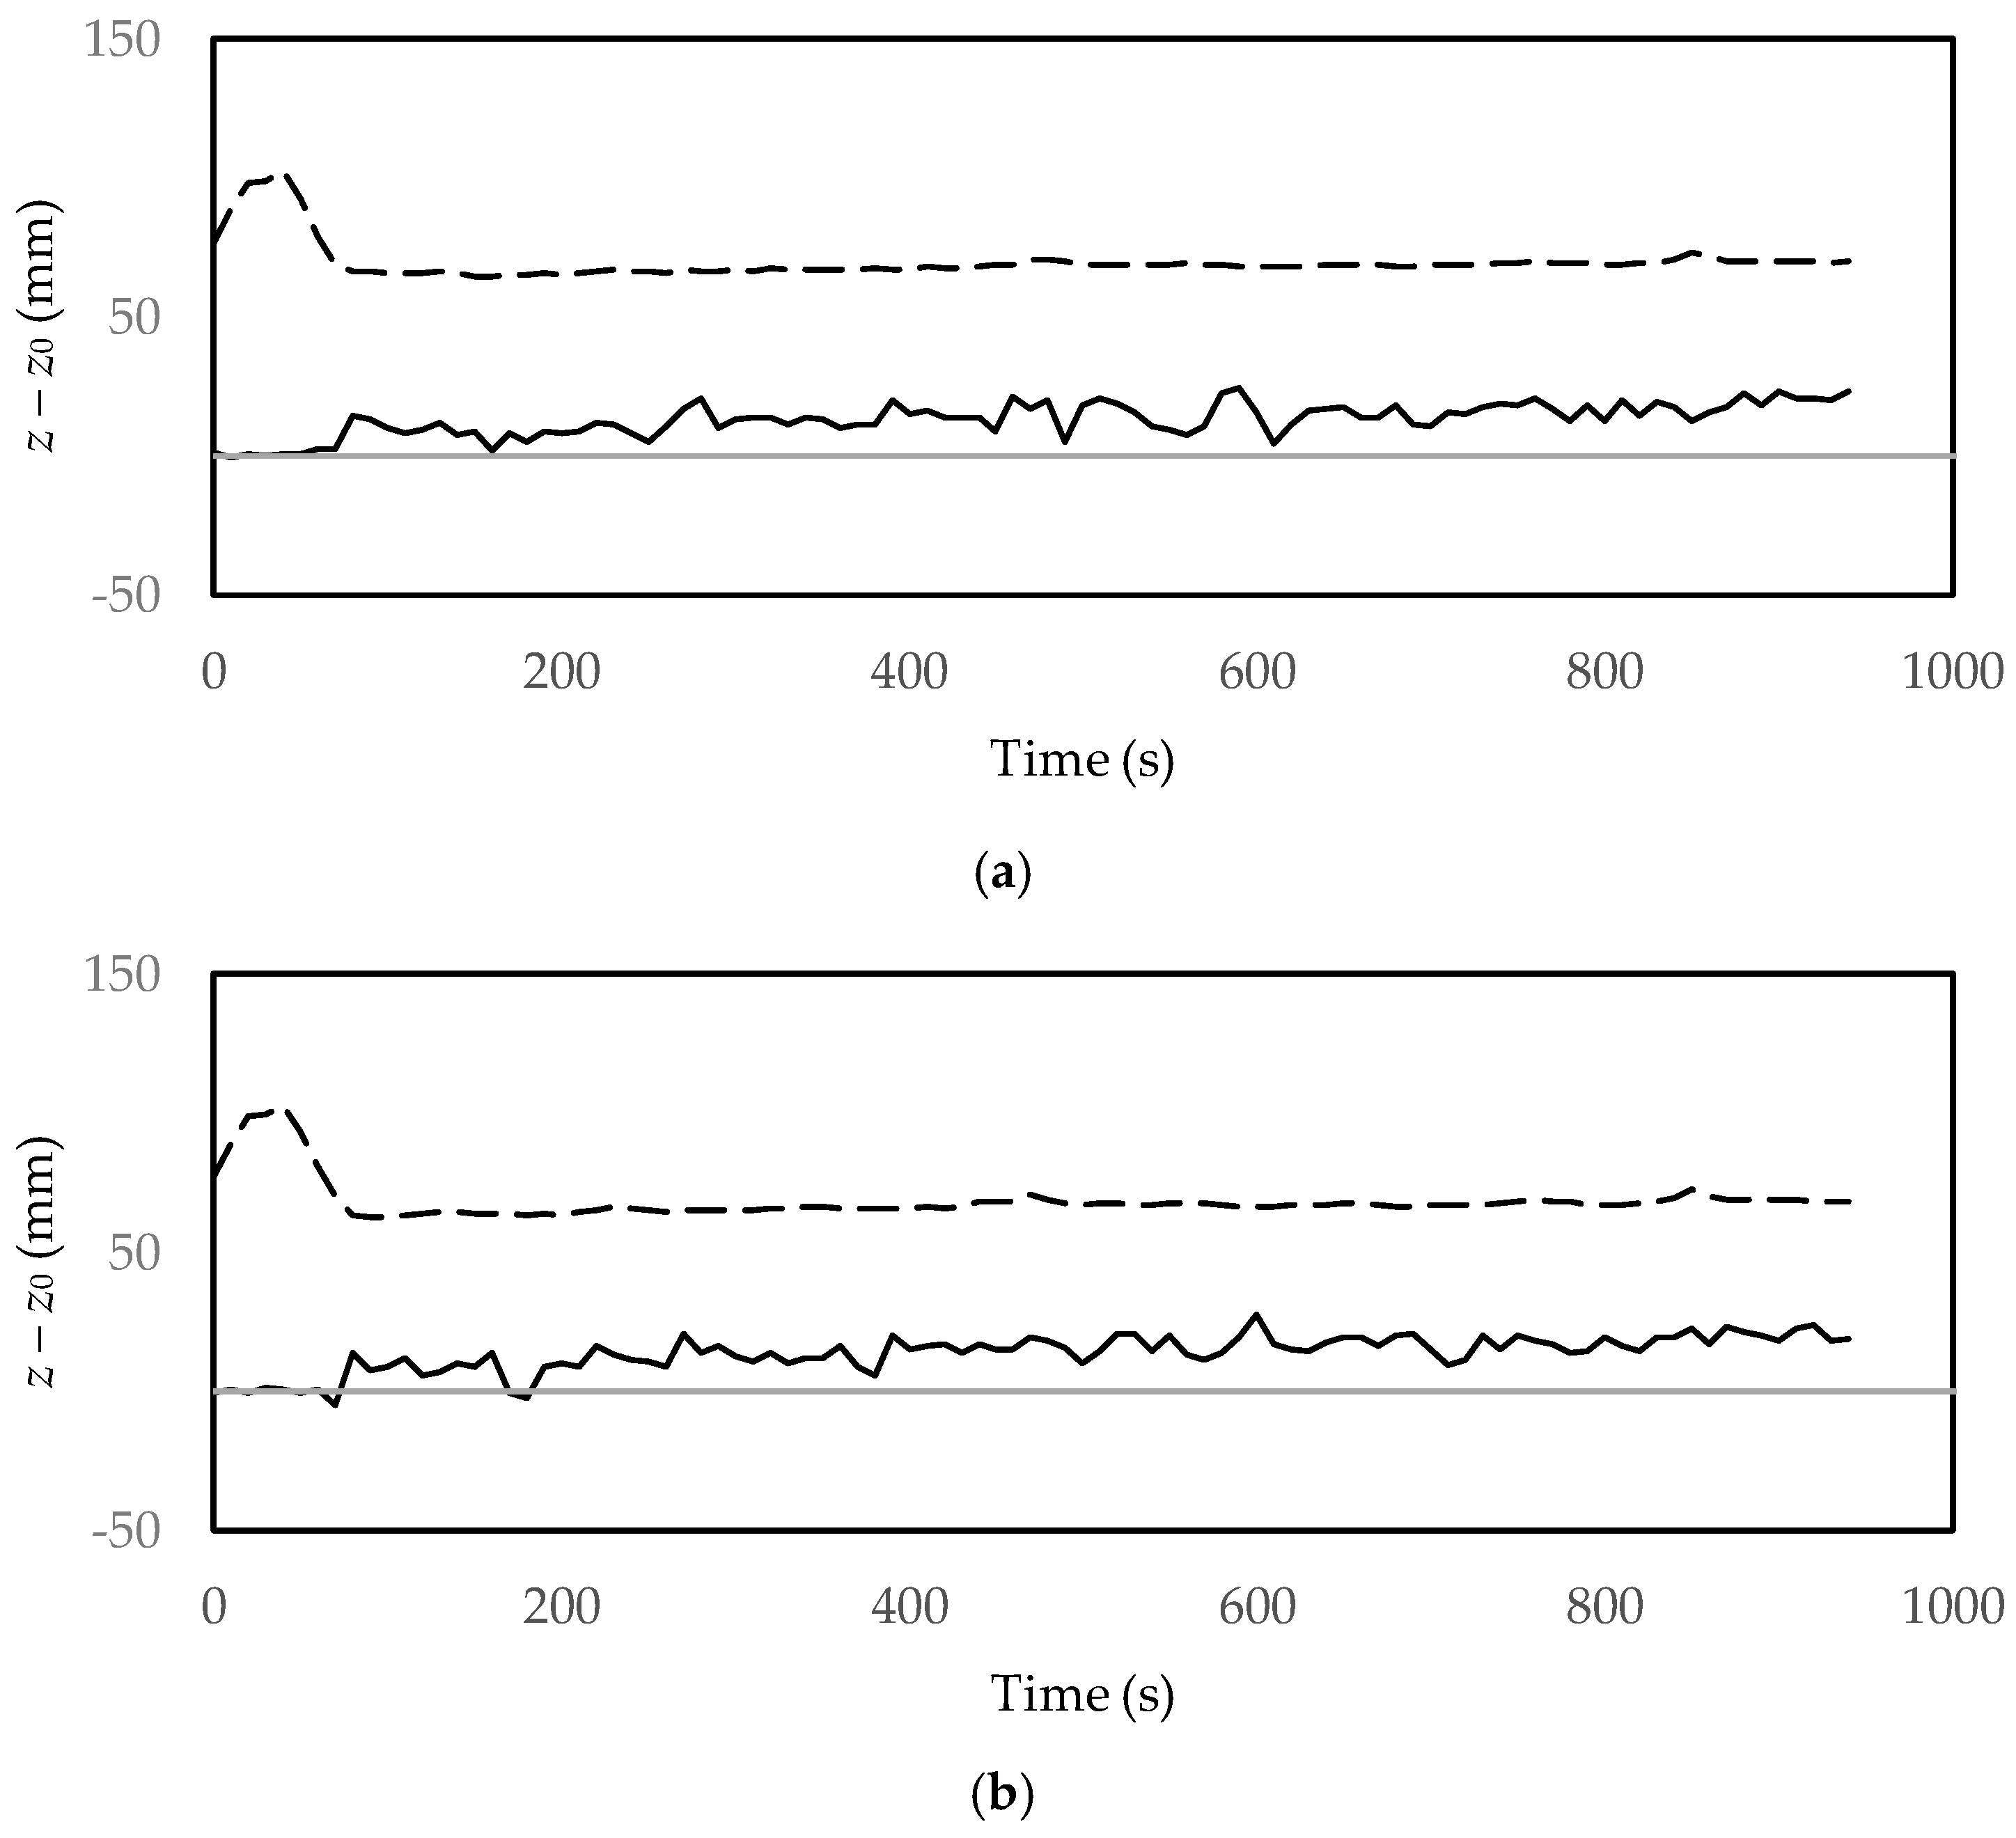
Figure 14 depicts the temporal evolution of the sediment surface velocity measured as described in Section 2.3. The mean velocity value was 4.1 cm/s, that could be converted into a sediment feeding rate of 4.1 × 10⁻⁵ m3/s thanks to the transfer function found from Figure 9. The sediment feeding rate was thus 40% larger than the sediment transport capacity of the flow and able to induce a mild aggradation of the bed.
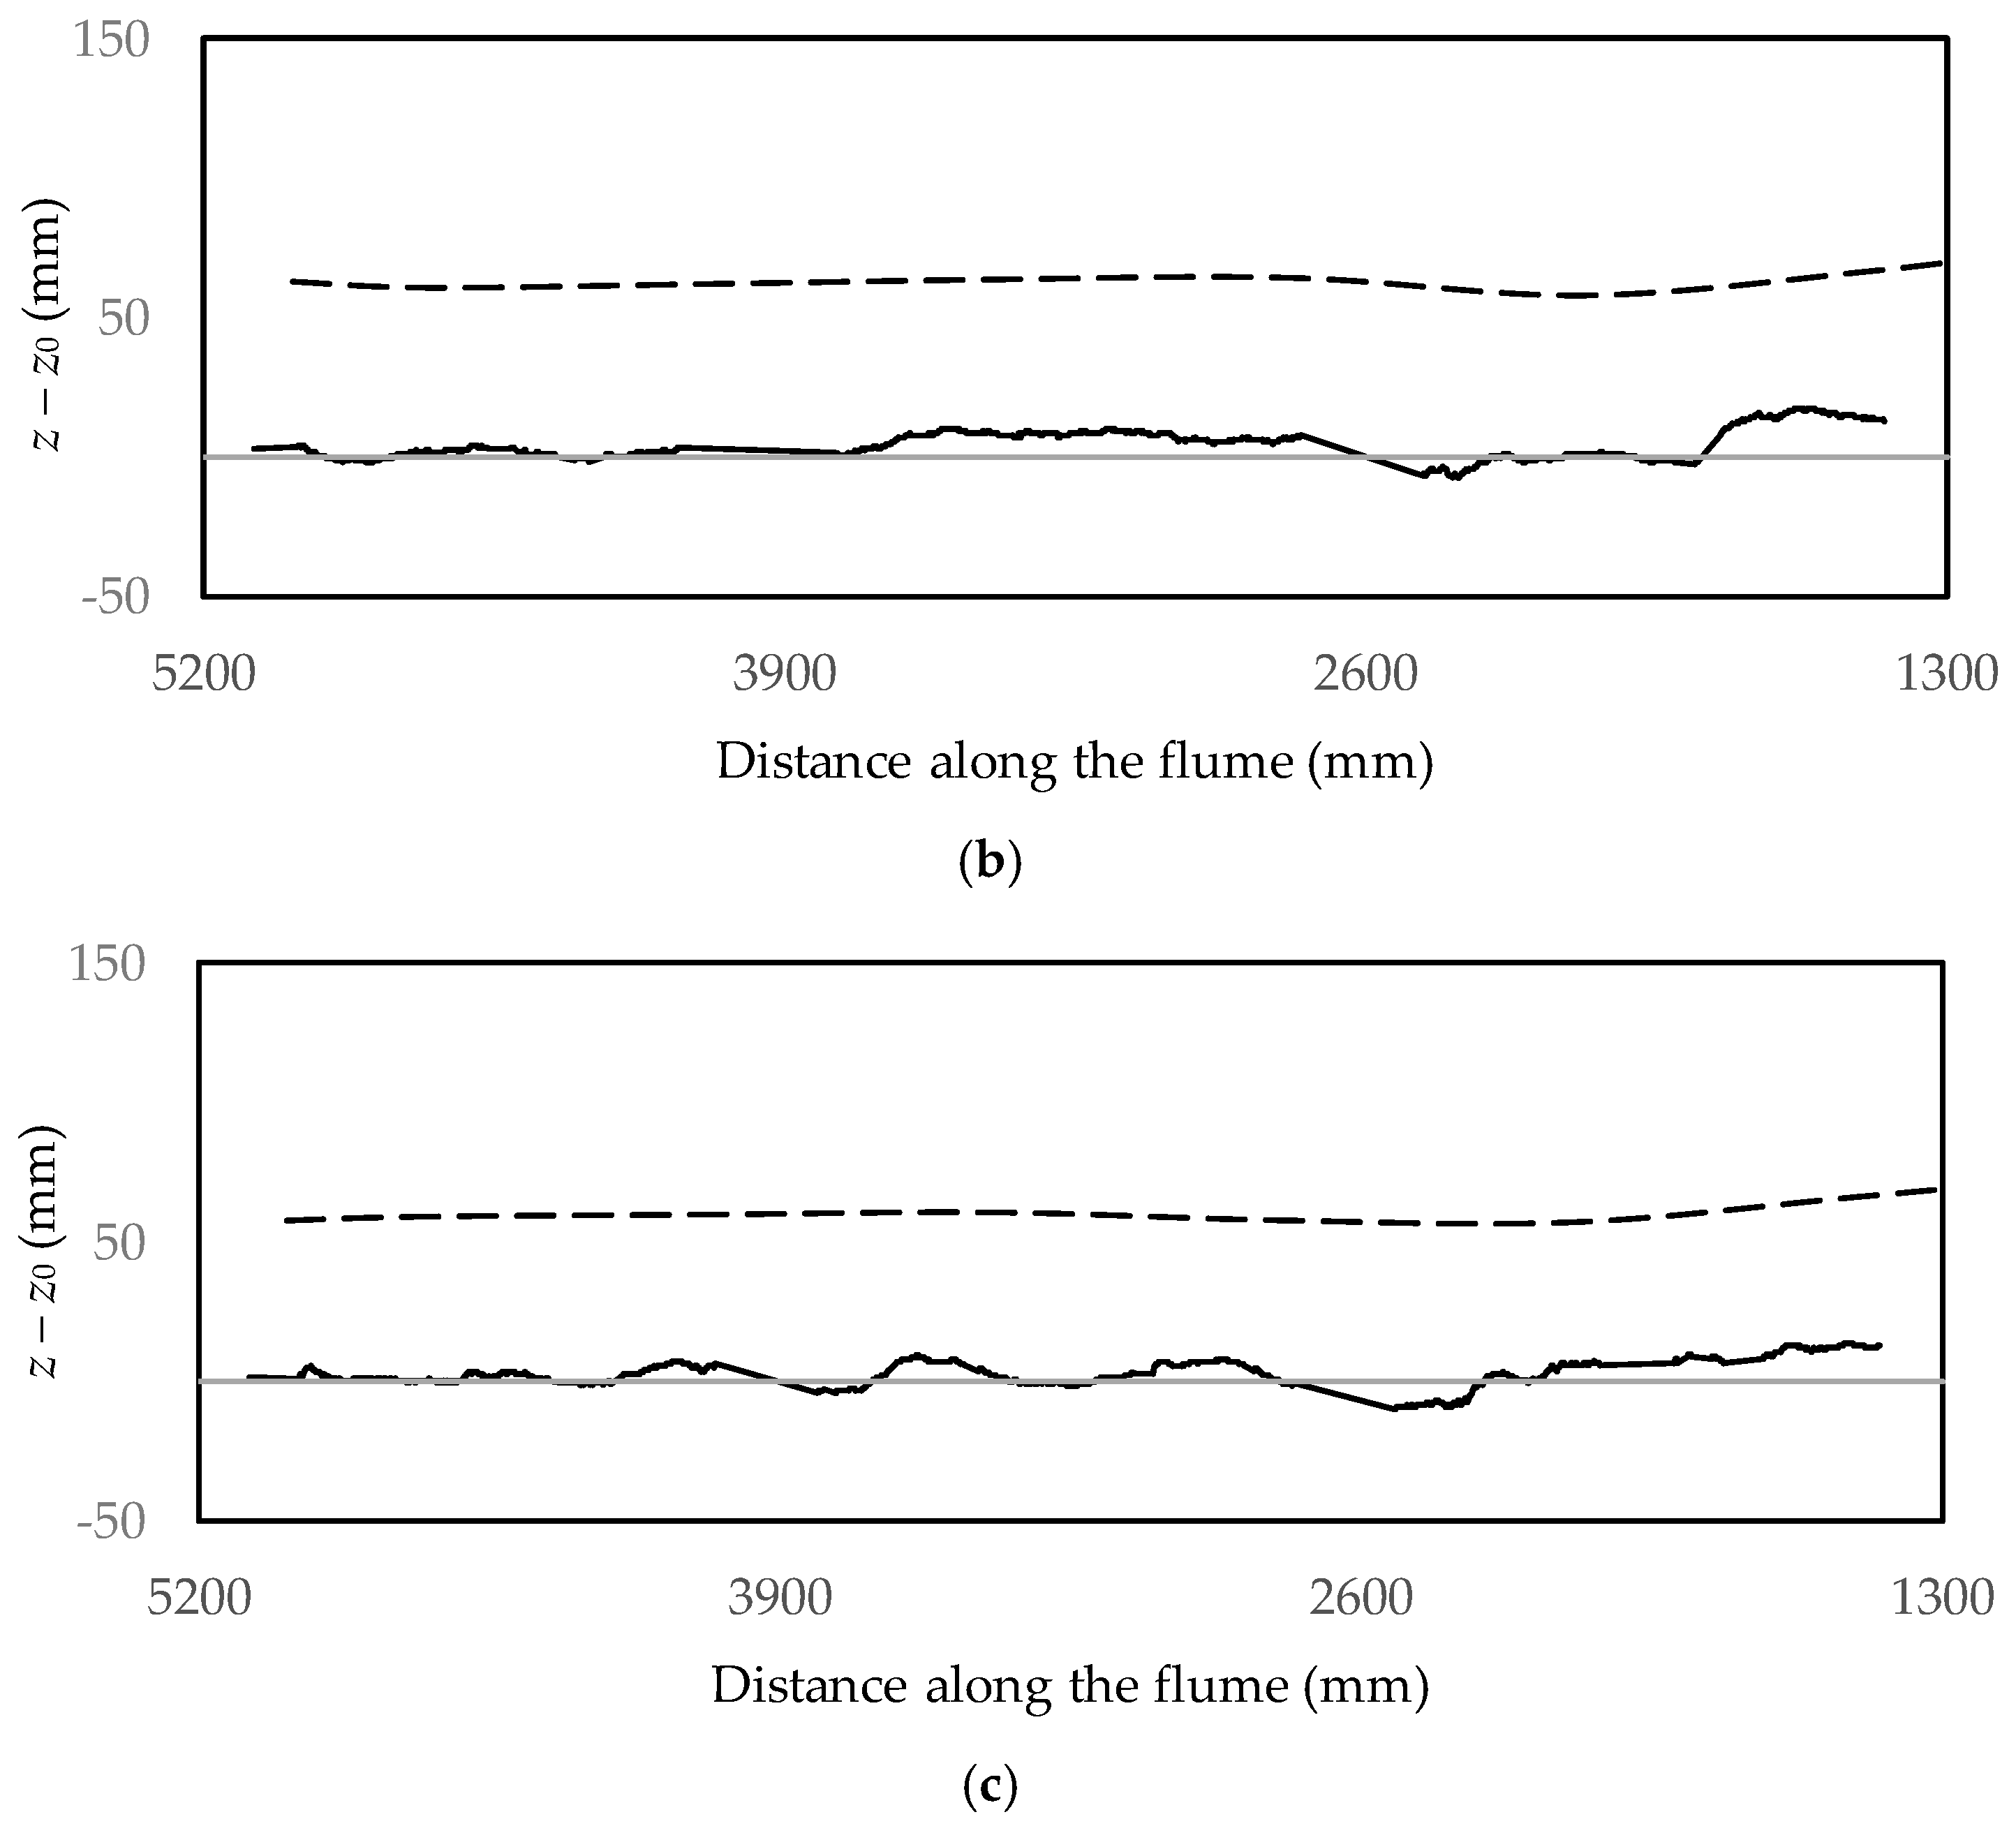
The morphologic evolution of the channel was surveyed for 17 min, after which the experiment was stopped due to limited availability of sediment to be fed into the flume. The channel bed profile at several times and the temporal evolution of the bed elevation at some locations are depicted in Figure 15 and Figure 16, respectively. The water surface elevation is also presented in the plots. The initial bump in the time evolution of the water surface elevation in Figure 16 corresponds to the initial channel regulation (increasing the flow rate and lowering the tailwater condition). Some irregularities are still present in the bed profiles that are mostly due to stickers attached to the flume wall (see Figure 13). These mistakes can be manually removed for a subset of profiles used in following analysis of the results. However, the measurements enabled the key features of the morphologic evolution to be observed, with the simultaneous downstream propagation of an aggrading sediment front (at 1800 and 2340 mm for times of 80 and 90 s, respectively) and dunes. Arguments on how the two morphological features can/should be separated were given, for example, by [11,15], but are beyond the scope of the present paper.

4. Discussion and Conclusions

A novel system was designed and setup for the simultaneous measurement of several key quantities in hydromorphologic laboratory experiments. The measured quantities involved both experimental controls (with a continuous measurement of the sediment feeding rate and the water depth at the downstream end of the flume) and the morphologic evolution of the flume subject to nonequilibrium sediment feeding (continuous measurement of the longitudinal profiles of the sediment bed and of the coevolving free surface). The system is based on using five action cameras shooting different components of the experimental facility: one for the vibrating channel used for sediment feeding, one for a wall-attached piezometer panel, and three for three consecutive reaches of the flume. Once the cameras are triggered, the researcher can concentrate only on carefully operating the run, while all the information is continuously acquired and the measurements are actually performed in the aftermath of the experiment. In this sense, the measuring system meets a goal of reducing the human effort related with performing the experiments.
While the image-analysis routines employed in this work are, in general, derived from similar ones developed in earlier works, the added value of the present study is an efficient integration of existing processing tools into a comprehensive measuring system. Notably, the latter is relatively low cost in spite of several cameras used. Industrial cameras are not involved and, in the field of cameras for daily use, a combination of more and less expensive ones is set in place. The measurements of the profile of the free surface and of the sediment bed elevation can be performed with cheaper tools, while the measurements of the sediment feeding rate needs a more expensive camera. The key difference between the two kinds of measurements is that the former requires only one frame to be performed, while the latter applies particle image velocimetry to two frames that are, in some cases, separated by a very short time interval. Therefore, for the measurement of the sediment feeding rate, it is important that the cameras and acquisition cards reliably respect the imposed sampling frequency (in the present case, 30 fps).
Automatic measurements dramatically reduce the time needed to collect data. Moreover, avoiding manual readings also virtually eliminates the dependence of the measured values on who takes them. In this respect, it must be acknowledged that application of image processing to physical measurements is never exempt from some intervention by the user. In this work, several parameters used to process the images need some expert-based setting by the user. All the involved parameters have been mentioned in the paper, providing the values used in the present work. However, the most suitable parameter values may change for different conditions (principally, the lighting conditions in the laboratory where the experiments are performed and the sediment particles used for the sediment layer). On the other hand, once set, the image-processing tool works exactly in the same way for the entire duration of the experiment and the measurements are fully repeatable, a condition that is not met by a human.
Even though the system used five cameras at the same time, the issue of camera synchronization was not addressed in this paper. The importance of this aspect depends on the time scales of the processes under investigation. In some earlier works related to sediment transport mechanics and interaction with a turbulent flow [39,49], the cameras were synchronized (possibly, also with other instruments) using suitable methods such as correlating spikes in temporal signals or by switching the room lights on and off. In the present study, instead, the time scales of the sediment front migration are relatively long and, therefore, the cameras could be synchronized up to a precision of 1 s using a stopwatch and marking on a paper the time at which the shooting was triggered for each camera.
As a future prospect, after having the measurement system set, it will be extensively used for hydromorphologic experiments with downstream migration of aggrading and degrading sediment fronts. Two main issues that will be considered analyzing the data are the following ones. First, the identification of a sediment front may be easier or more difficult for translating or dispersing fronts, respectively. The scientific community has not yet achieved a consensus on which dynamics should prevail in different yield and transport conditions (see, for example, [8,11,13,50]). Another issue that will be considered in follow-up development of the measurement technique is the effect of three-dimensional bed forms. Since in the present case the sediment bed elevation is surveyed from the side, an assumption that the sediment front can be represented well by these measurements shall be appropriately verified.

Author Contributions

A.R. conceived and designed the experimental configuration, and developed the measurement methods for sediment feeding rate and water surface; A.R. and B.Z. developed the measurement method for the bed elevation and performed the sample experiment; B.Z. produced the results for the experiment; A.R. wrote the paper.

Acknowledgments

The authors are grateful to Michael Nones for inviting the present paper as a feature paper in Geosciences. This research was partially supported by Fondazione Cariplo (Italy) through the project entitled Sustainable MAnagement of sediment transpoRT in responSE to climate change conditions (SMART-SED). Matteo Zucchi is gratefully acknowledged for contributing to the experiment through his thesis in Civil Engineering for Risk Mitigation at the Politecnico di Milano. Thought-provoking comments and suggestions by three anonymous Reviewers enabled the paper to be considerably improved.

Conflicts of Interest

The authors declare no conflict of interest.

References

  1. Lenzi, M.A.; D’Agostino, V.; Billi, P. Bedload transport in the instrumented catchment of the Rio Cordon. Part I: Analysis of bedload records, conditions and threshold of bedload entrainment. Catena 1999, 36, 171–190. [Google Scholar] [CrossRef]
  2. Milzow, C.; Molnar, P.; McArdell, B.W.; Burlando, P. Spatial organization in the step-pool structure of a steep mountain stream (Vogelbach, Switzerland). Water Resour. Res. 2006, 42, W04418. [Google Scholar] [CrossRef]
  3. Turowski, J.M.; Yager, E.M.; Badoux, A.; Rickenmann, D.; Molnar, P. The impact of exceptional events on erosion, bedload transport and channel stability in a step-pool channel. Earth Surf. Proc. Land. 2009, 34, 1661–1673. [Google Scholar] [CrossRef]
  4. Cohen, H.; Laronne, J.B.; Reid, I. Simplicity and complexity of bed load response during flash floods in a gravel bed ephemeral river: A 10 year field study. Water Resour. Res. 2010, 46, W11542. [Google Scholar] [CrossRef]
  5. Ferguson, R.I.; Bloomer, D.J.; Church, M. Evolution of an advancing gravel front: Observations from Vedder Canal, British Columbia. Earth Surf. Proc. Land. 2011, 36, 1172–1182. [Google Scholar] [CrossRef]
  6. Dell’Agnese, A.; Brardinoni, F.; Toro, M.; Mao, L.; Engel, M.; Comiti, F. Bedload transport in a formerly glaciated mountain catchment constrained by particle tracking. Earth Surf. Dyn. 2015, 3, 527–542. [Google Scholar] [CrossRef]
  7. Szilo, J.; Bialik, R.J. Grain size distribution of bedload transport in a glaciated catchment (Baranowski Glacier, King George Island, Western Antarctica). Water 2018, 10, 360. [Google Scholar] [CrossRef]
  8. Soni, J.P.; Garde, R.J.; Ranga Raju, K.G. Aggradation in streams due to overloading. ASCE J. Hydraul. Div. 1980, 106, 117–132. [Google Scholar]
  9. Soni, J.P. Laboratory study of aggradation in alluvial channels. J. Hydrol. 1981, 49, 87–106. [Google Scholar] [CrossRef]
  10. Yen, C.L.; Chang, S.Y.; Lee, H.Y. Aggradation-degradation process in alluvial channels. J. Hydraul. Eng. 1992, 118, 1651–1669. [Google Scholar] [CrossRef]
  11. Alves, E.; Cardoso, A. Experimental study on aggradation. Int. J. Sediment Res. 1999, 14, 1–15. [Google Scholar]
  12. Cui, Y.; Parker, G.; Lisle, T.E.; Gott, J.; Hansler-Ball, M.E.; Pizzuto, J.E.; Allmendinger, N.E.; Reed, J.M. Sediment pulses in mountain rivers: 1. Experiments. Water Resour. Res. 2003, 39, 1239. [Google Scholar] [CrossRef]
  13. Sklar, L.S.; Fadde, J.; Venditti, J.G.; Nelson, P.; Wydzga, M.A.; Cui, Y.; Dietrich, W.E. Translation and dispersion of sediment pulses in flume experiments simulating gravel augmentation below dams. Water Resour. Res. 2009, 45, W08439. [Google Scholar] [CrossRef]
  14. Wang, L.; Cuthbertson, A.; Pender, G.; Cao, Z. The response of bed-load sediment transport and bed evolution under unsteady hydrograph flows. In Proceedings of the River Flow 2014, Lausanne, Switzerland, 3–5 September 2014. [Google Scholar]
  15. Unigarro Villota, S. Laboratory Study of Channel Aggradation Due to Overloading. Master’s Thesis, Politecnico di Milano, Milan, Italy, December 2017. [Google Scholar]
  16. Cui, Y.; Parker, G.; Pizzuto, J.E.; Lisle, T.E. Sediment pulses in mountain rivers: 2. Comparison between experiments and numerical predictions. Water Resour. Res. 2003, 39, 1240. [Google Scholar] [CrossRef]
  17. Papanicolaou, A.N.; Bdour, A.; Wicklein, E. One-dimensional hydrodynamic/sediment transport model applicable to mountain streams. J. Hydraul. Res. 2004, 42, 357–375. [Google Scholar] [CrossRef]
  18. Tayfur, G.; Singh, V.P. Kinematic wave model for transient bed profiles in alluvial channels under nonequilibrium conditions. Water Resour. Res. 2007, 43, W12412. [Google Scholar] [CrossRef]
  19. Miglio, A.; Gaudio, R.; Calomino, F. Mobile-bed aggradation and degradation in a narrow flume: Laboratory experiments and numerical simulations. J. Hydro-Environ. Res. 2009, 3, 9–19. [Google Scholar] [CrossRef]
  20. Chiari, M.; Friedl, K.; Rickenmann, D. A one-dimensional bedload transport model for steep slopes. J. Hydraul. Res. 2010, 48, 152–160. [Google Scholar] [CrossRef]
  21. Neuhold, C.; Stanzel, P.; Nachtnebel, H.P. Incorporating river morphological changes to flood risk assessment: Uncertainties, methodology and application. Nat. Hazards Earth Syst. Sci. 2009, 9, 789–799. [Google Scholar] [CrossRef]
  22. Verhaar, P.M.; Biron, P.M.; Ferguson, R.I.; Hoey, T.B. Implications of climate change in the twenty-first century for simulated magnitude and frequency of bed-material transport in tributaries of the Saint-Lawrence River. Hydrol. Process. 2011, 25, 1558–1573. [Google Scholar] [CrossRef]
  23. Radice, A.; Rosatti, G.; Ballio, F.; Franzetti, S.; Mauri, M.; Spagnolatti, M.; Garegnani, G. Management of flood hazard via hydro-morphological river modelling. The case of the Mallero in Italian Alps. J. Flood Risk Manag. 2013, 6, 197–209. [Google Scholar] [CrossRef]
  24. Pender, D.; Patidar, S.; Hassan, K.; Haynes, H. Method for incorporating morphological sensitivity into flood inundation modeling. J. Hydraul. Eng. 2016, 142, 04016008. [Google Scholar] [CrossRef]
  25. Radice, A.; Longoni, L.; Papini, M.; Brambilla, D.; Ivanov, V.I. Generation of a design flood-event scenario for a mountain river with intense sediment transport. Water 2016, 8, 597. [Google Scholar] [CrossRef]
  26. Singh, A.; Fienberg, K.; Jerolmack, D.J.; Marr, J.; Foufoula-Georgiou, E. Experimental evidence for statistical scaling and intermittency in sediment transport rates. J. Geophys. Res. Earth Surf. 2009, 114, F01025. [Google Scholar] [CrossRef]
  27. Mendes, L.; Antico, F.; Sanches, P.; Alegria, F.; Aleixo, R.; Ferreira, R.M.L. A particle counting system for calculation of bedload fluxes. Meas. Sci. Technol. 2016, 27, 125305. [Google Scholar] [CrossRef]
  28. Frey, P.; Ducottet, C.; Jay, J. Fluctuations of bed load solid discharge and grain size distribution on steep slopes with image analysis. Exp. Fluids 2003, 35, 589–597. [Google Scholar] [CrossRef]
  29. Lajeunesse, E.; Malverti, L.; Charru, F. Bed load transport in turbulent flow at the grain scale: Experiments and modeling. J. Geophys. Res. Earth Surf. 2010, 115, F04001. [Google Scholar] [CrossRef]
  30. Heays, K.G.; Friedrich, H.; Melville, B.W.; Nokes, R. Quantifying the dynamic evolution of graded gravel beds using Particle Tracking Velocimetry. J. Hydraul. Eng. 2014, 140, 04014027. [Google Scholar] [CrossRef]
  31. Campagnol, J.; Radice, A.; Ballio, F.; Nikora, V. Particle motion and diffusion at weak bed load: Accounting for unsteadiness effects of entrainment and disentrainment. J. Hydraul. Res. 2015, 53, 633–648. [Google Scholar] [CrossRef]
  32. Fathel, S.; Furbish, D.; Schmeeckle, M. Parsing anomalous versus normal diffusive behavior of bedload sediment particles. Earth Surf. Proc. Land. 2016, 41, 1797–1803. [Google Scholar] [CrossRef]
  33. Heyman, J.; Bohorquez, P.; Ancey, C. Entrainment, motion and deposition of coarse particles transported by water over a sloping mobile bed. J. Geophys. Res. Earth Surf. 2016, 121, 1931–1952. [Google Scholar] [CrossRef]
  34. Spinewine, B.; Zech, Y. Small-scale laboratory dam-break waves on movable beds. J. Hydraul. Res. 2007, 45, 73–86. [Google Scholar] [CrossRef]
  35. Wang, Y.; Wang, D.; Wang, L.; Zhang, Y. Measurement of sand creep on a flat sand bed using a high-speed digital camera. Sedimentology 2009, 56, 1705–1712. [Google Scholar] [CrossRef]
  36. Huang, M.Y.F.; Huang, A.Y.L.; Capart, H. Joint mapping of bed elevation and flow depth in microscale morphodynamics experiments. Exp. Fluids 2010, 49, 1121–1134. [Google Scholar] [CrossRef]
  37. Redolfi, M.; Guidorizzi, L.; Tubino, M.; Bertoldi, W. Capturing the spatiotemporal variability of bedload transport: A time-lapse imagery technique. Earth Surf. Proc. Land. 2017, 42, 1140–1147. [Google Scholar] [CrossRef]
  38. Radice, A.; Aleixo, R.; Hosseini Sadabadi, S.A.; Sarkar, S. On image grabbing and processing for measurement of geophysical flows. In Proceedings of the HydroSenSoft 2017, Madrid, Spain, 1–3 March 2017. [Google Scholar]
  39. Radice, A.; Sarkar, S.; Ballio, F. Image-based Lagrangian particle tracking in bed-load experiments. J. Vis. Exp. 2017, 125, e55874. [Google Scholar] [CrossRef] [PubMed]
  40. Radice, A.; Malavasi, S.; Ballio, F. Solid transport measurements through image processing. Exp. Fluids 2006, 41, 721–734. [Google Scholar] [CrossRef]
  41. Keshavarzy, A.; Ball, J.E. An application of image processing in the study of sediment motion. J. Hydr. Res. 1999, 37, 559–576. [Google Scholar] [CrossRef]
  42. Radice, A.; Ballio, F. Double-average characteristics of sediment motion in one-dimensional bed load. Acta Geophys. 2008, 56, 654–668. [Google Scholar] [CrossRef]
  43. Radice, A.; Porta, G.; Franzetti, S. Analysis of the time-averaged properties of sediment motion in a local scour process. Water Resour. Res. 2009, 45, W03401. [Google Scholar] [CrossRef]
  44. Radice, A.; Ballio, F.; Nikora, V. Statistics and characteristic scales for bed load in a channel flow with sidewall effects. Acta Geophys. 2010, 58, 1072–1093. [Google Scholar] [CrossRef]
  45. Radice, A.; Tran, C.K. Study of sediment motion in scour hole of a circular pier. J. Hydraul. Res. 2012, 50, 44–51. [Google Scholar] [CrossRef]
  46. Longoni, L.; Ivanov, V.; Brambilla, D.; Papini, M.; Brebbia, C.; Teanini, E.; Radice, A. Application of multiple surveying techniques at a to-be-gauged river section. In Proceedings of the HydroSenSoft 2017, Madrid, Spain, 1–3 March 2017. [Google Scholar]
  47. McEwan, I.K.; Sheen, T.M.; Cunningham, G.J.; Allen, A.R. Estimating the size composition of sediment surfaces through image analysis. Proc. Inst. Civ. Eng. Water Marit. Eng. 2000, 142, 189–195. [Google Scholar] [CrossRef]
  48. Parchkoohi, M.H.; Farajkhah, N.K.; Delshad, M.S. Automatic detection of karstic sinkholes in seismic 3D images using circular Hough transform. J. Geophys. Eng. 2015, 12, 764–769. [Google Scholar] [CrossRef]
  49. Radice, A.; Nikora, V.; Campagnol, J.; Ballio, F. Active interactions between turbulence and bed load: Conceptual picture and experimental evidence. Water Resour. Res. 2013, 49, 90–99. [Google Scholar] [CrossRef]
  50. Lisle, T.E.; Vui, Y.; Parker, G.; Pizzuto, J.E.; Dodd, A.M. The dominance of dispersion in the evolution of bed material waves in gravel-bed rivers. Earth Surf. Proc. Land. 2001, 26, 1409–1420. [Google Scholar] [CrossRef]
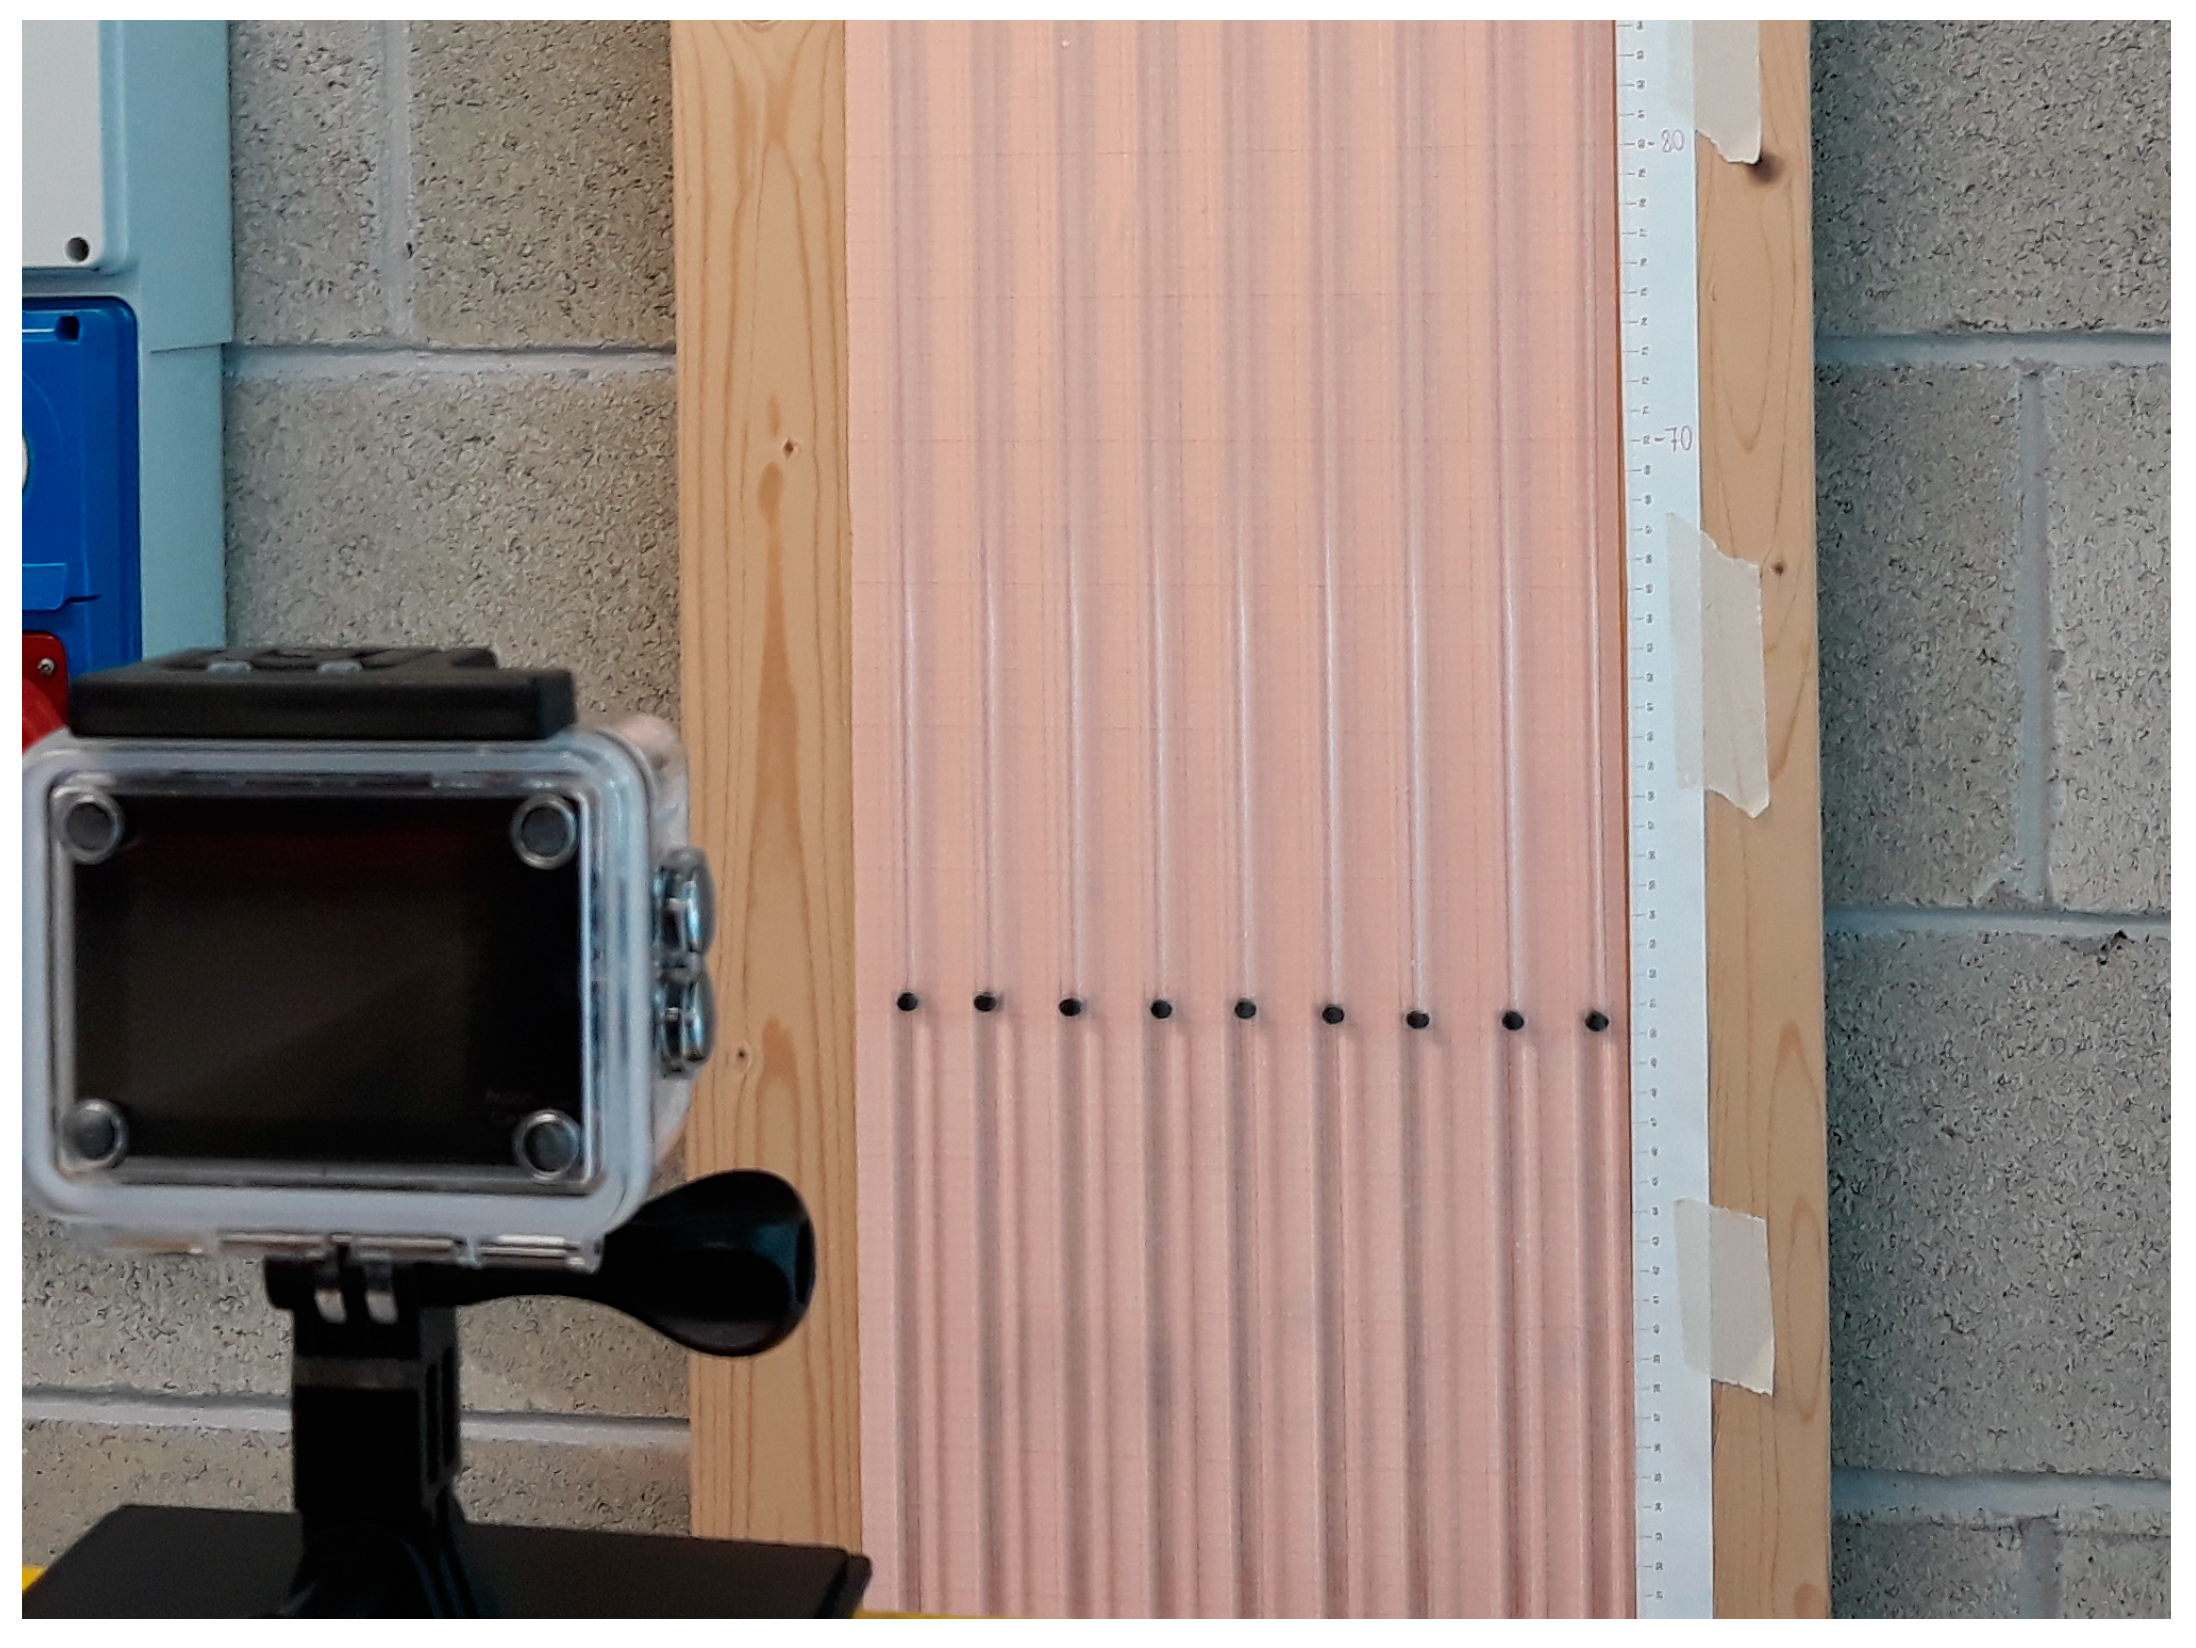
Figure 1. Camera shooting the piezometer panel.
Geosciences 08 00172 g001
Figure 2. (a) An acquired image of the piezometer pipes; (b) The image after distortion removal; (c) A selected working region within the image with the points (indicated by hollow circles) used to determine the image calibration.
Geosciences 08 00172 g002aGeosciences 08 00172 g002b
Figure 3. (a) An image slice depicting one of the piezometers; (b) The corresponding negative image; (c) The binary image with a white blob corresponding to the plastic sphere.
Geosciences 08 00172 g003
Figure 4. The sphere identification by changing values of the intensity threshold used to convert a negative image into a binary one. Threshold values in this picture vary (left to right) every 0.1 from 0.47 to 0.97 times the white level of 255.
Geosciences 08 00172 g004
Figure 5. Camera shooting the vibrating channel from the top. Another camera is depicted that shoots a sediment slide; this second camera was used in an additional method that was later abandoned and is not described in this paper.
Geosciences 08 00172 g005
Figure 6. An acquired image for the sediment vibrating channel. Sediment motion is from the bottom to the top of the image.
Geosciences 08 00172 g006
Figure 7. Sensitivity of the time-mean surface sediment velocity to the step value for (a) low and (b) high sediment feeding rate. In (a), uncertainty bars are displayed only if larger than the marker size (threshold value for display = 0.002 cm/s). The arrow indicates a measurement that is further explored in Figure 8.
Geosciences 08 00172 g007
Figure 8. (a) The succession of measured velocity values leading to the mean velocity marked with an arrow in Figure 9; (b) the corresponding autocorrelation function (lag expressed in terms of number of values).
Geosciences 08 00172 g008
Figure 9. Relationship between the time-mean values of the sediment surface sediment velocity and feeding rate. Uncertainty bars for sediment velocity are displayed only if larger than the marker size (threshold value for display = 0.04 cm/s). Uncertainty bars for sediment feeding rate are never visible.
Geosciences 08 00172 g009
Figure 10. The cameras for the measurement of the bed elevation (flume view from upstream).
Geosciences 08 00172 g010
Figure 11. (a) A movie frame; (b) The image obtained from the Sobel edge-detection method.
Geosciences 08 00172 g011
Figure 12. A sample vertical profile of percentage of white pixels in a search area (white circles) and the profile reaches based on slope values (gray dashed line).
Geosciences 08 00172 g012
Figure 13. Detected bed profile, with the arrow indicating the bed elevation determined from the vertical profile of Figure 13.
Geosciences 08 00172 g013
Figure 14. Temporal evolution of the sediment velocity along the vibrating channel for the sample experiment presented.
Geosciences 08 00172 g014
Figure 15. Longitudinal profiles of the water surface (dashed) and bed elevation (continuous) at (a) 70 s, (b) 80 s, and (c) 90 s from the beginning of sediment feeding for the sample experiment. The original bed elevation z0 is indicated by the gray line. Note the flow from right to left, consistently with Figure 10, Figure 11 and Figure 13.
Geosciences 08 00172 g015aGeosciences 08 00172 g015b
Figure 16. Temporal evolution of the water surface (dashed) and bed elevation (continuous) at (a) 1.5 m; (b) 1.75 m and (c) 2 m from the flume inlet for the sample experiment. The original bed elevation z0 is indicated by the gray line.
Geosciences 08 00172 g016aGeosciences 08 00172 g016b