Article

Systematic Evaluation of Different Infrastructure Systems for Tsunami Defense in Sendai City

International Research Institute of Disaster Science, Tohoku University, 468-1 Aramaki-Aza, Aoba-ku, Sendai 980-0845, Japan
*
Author to whom correspondence should be addressed.
Geosciences 2018, 8(5), 173; https://doi.org/10.3390/geosciences8050173
Submission received: 5 February 2018 / Revised: 7 May 2018 / Accepted: 8 May 2018 / Published: 10 May 2018
(This article belongs to the Special Issue Interdisciplinary Geosciences Perspectives of Tsunami)

Abstract

:
The aim of this study is to assess the performances of different infrastructures as structural tsunami countermeasures in Sendai City, based on the lessons from the 11 March 2011, Great East Japan Tsunami, which is an example of a worst-case scenario. The tsunami source model Ver. 1.2 proposed by Tohoku University uses 10 subfaults, determined based on the tsunami height and the run-up heights measured for all tsunami affected areas. The TUNAMI-N2 model is used to simulate 24 cases of tsunami defense in Sendai City based on a combination of 5 scenarios of structural measures, namely, a seawall (existing and new seawall), a greenbelt, an elevated road and a highway. The results of a 2D tsunami numerical analysis show a significant difference in the tsunami inundations in the areas protected by several combinations of structures. The elevated road provides the highest performance of the single schemes, whereas the highest performance of the 2-layer schemes is the combination of an existing seawall and an elevated road. For the 3-layer scenarios, the highest performance is achieved by the grouping of an existing seawall, a new seawall, and an elevated road. The combination of an existing seawall, a new seawall, a greenbelt and an elevated road is the highest performing 4-layer scenario. The Sendai City plan, with a 5-layer scenario, reduces the tsunami inundation area by 20 sq. km with existing structural conditions. We found that the combination of an existing seawall, a greenbelt, an elevated road and a highway (a 4-layer scheme) is the optimum case to protect the city against a tsunami similar to the 2011 Great East Japan Tsunami. The proposed approach can be a guideline for future tsunami protection and the evaluation of countermeasure schemes.

1. Introduction

A magnitude 9.0 earthquake generated a huge tsunami in the Tohoku region of Japan on 11 March 2011, affecting human lives and causing economic losses. The affected area was recorded as approximately 561 sq. km and covered 3 prefectures (Iwate, Miyagi, and Fukushima) along the Pacific coast of Japan [1,2]. The maximum recorded tsunami run-up height was approximately 40 m located in Iwate Prefecture [3]. The fatality number reported by the National Police Agency was approximately 15,866 people, with approximately 2946 people missing [4]. The number of buildings and houses that collapsed or were washed away was approximately 130,411 [5,6]. The economic losses associated with the disaster were approximately 25 trillion yen, which was 30% of the national income of Japan in 2011 [7]. After the event occurred, approximately 82,000 people lost their houses [8]. Then, the recovery efforts of the central and local government began, including the conceptual planning of the reconstruction of infrastructures including dike renovation, transportation, land-use zoning and urban relocation.
Tsunami modeling is an important aspect prior to protection planning and includes using models such as the Cornell Multi-grid Coupled Tsunami Model (COMCOT), the Method of Splitting Tsunami (MOST) and Tohoku University’s Numerical Analysis Model for Investigation of Near-field Tsunami, No.2 (TUNAMI-N2), which are based on the non-linear shallow water equation. The COMCOT, developed by Liu et al. (1998) uses the leap-frog finite difference method on a staggered mesh scheme [9,10]. Titov and Gonzalez (1997) developed the MOST model, which splits a 2D system into 1D systems for the early prediction of a tsunami [11]. The TUNAMI-N2 model, developed by Imamura (1995) [12] to model the tsunami process, has been widely utilized in a number of research and assessments though the TIME (Tsunami Inundation Modeling Exchange) project. In previous research, several studies on tsunami modeling were performed. For example, the Arabian Sea tsunami, generated by the 1945 Makran earthquake, has been simulated by the TUNAMI-N2 model [13], based on several historical earthquake hypotheses [14]. The vulnerability of the Car Nicobar coast to tsunami hazards has also driven the use of TUNAMI-N2. A study was performed on the 2004 Indian Ocean tsunami to understand the effects of wave run-up in the Koodankulam region of the Tamil Nadu Coast using TUNAMI-N2. The 2004 tsunami was simulated using 28 scenarios with a run-up wave range between 1.30–3.54 m [15]. In addition, the fragility curve of the 2004 tsunami in Thailand was estimated by using numerical modeling and satellite remote sensing. The tsunami modeling of the fragility curve provided by the TUNAMI-N2 model demonstrated reasonable accuracy [16]. The TUNAMI-N2 model has been applied to the 2011 Tohoku-oki tsunami to understand inundation characteristics and sedimentation processes [17,18]. The results show that the flood depth ranges between 2.4–6.0 m and the flow velocity ranges between 3.4–6.2 m/s; furthermore, the sand layer is distributed on land approximately 2.8 km from the coastline. For the early warning system, the TUNAMI-N2 was modified using parallel programming to reduce the computation time such that the computation time for this model in this study is 75 times faster than real time [19].
The perfect early warning system with a non-structural scheme is difficult to obtain and to use as a tsunami protection method. Combinations of hard and soft structures perform better than single schemes [20]. The concept of multi-layered safety has been proposed in the distributed reconstruction in the Tohoku area after the 11 March 2011 tsunami [21,22]. It was realized that there was a need for multiple layers of safety to ensure the protection of coastal residents. Research in the field of disaster risk management usually focuses on the perceived shared benefits of coastal structures that can increase the safety of people against coastal hazards [21,23]. Coastal structures are categorized as offshore and onshore structures. Offshore structures include breakwaters, jetties and groins, whereas onshore structures include seawalls, dikes and roads. However, there have been few studies that define and measure the performance of coastal structures in tsunami protection. The performance of a breakwater in reducing tsunami inundation was measured in [24]. The study suggests that a breakwater cannot reduce the flood inundation; however, the arrival time of a tsunami wave is delayed by a breakwater, based on the 2011 tsunami event in Japan. For inland structures, the protection efficiency of a multi-layered structure was evaluated for the 2004 Indian tsunami in Sri Lanka [25]. The multi-layered structure (revetment seawall and railway embankment) demonstrated a potential to reduce damage by approximately 30% compared with existing conditions.
Sendai City was one of the impact areas of the 2011 Great Tsunami, and the prefecture and local governments have a plan to develop multilayered infrastructure systems to protect the city from future tsunamis under the limitations and uncertain conditions of funding [26,27]. This idea was developed after the existing highway located approximately 4–5 km from the sea helped to protect the city from the 2011 tsunami by chance. The conceptual plan is a combination of existing and new infrastructure systems such as seawall reconstruction, land use zoning, and construction of new roads. As shown in Figure 1a, the plan is to reduce the tsunami flood depth to less than 2 m in the newly planned residential area [28]. The reconstruction plan of Sendai City, as presented in Figure 1b, uses a combination of several features such as seawalls, forests, parks, new elevated roads and existing highways to reduce the disaster losses. The planned view of the multi-structural system of Sendai City is based on a 7.2 m seawall reconstruction (originally approximately 6.0 m) and a 6.0 m elevated road. As of 2017, the seawall reconstruction has already been completed, while the elevated road is still under construction. The protection efficiency of the elevated road and seawall in this plan was evaluated for the 2011 tsunami scenario [2]. The study reveals that the 2011 tsunami would flow over the top of a 7.2 m seawall and 6.0 m elevated road.
For Sendai City, the reconstructed and new structures have already been evaluated for the 2011 tsunami scenario as previously mentioned, but the study considers only the reconstructed seawall and the new elevated road, without the greenbelt and economic approach. Currently, few studies have been performed on investigating and determining the explicit benefits of multi-layered coastal structures, which would involve a comprehensive economic estimate of their disaster prevention value. To address this gap, this study aims to assess the tsunami prevention of a multi-infrastructure system, with an economic approach to selecting the optimum combination of structures.
The objective of this study is to understand the tsunami behavior on different terrains to obtain new insights on the damage for the previously mentioned multi-infrastructure system. The tsunami modeling of the Sendai Plain was reestablished and studied using a numerical mathematical model called TUNAMI-N2. The model applies the shallow water theory using an initial water level and seafloor deformation estimated using fault parameters. The numerical model results were then calibrated with the field measurements. The tsunami hazard maps for each component of the infrastructure system for protecting against tsunamis were analyzed with respect to the tsunami impacts on the Sendai City coastal area of the Sendai Plain generated by the 2011 Tohoku earthquake. The findings of this paper present the significance of infrastructure system management for protecting against future tsunami disasters. The evaluation of these plans is generally academic research to raise awareness of loss reduction for future disasters and has application in other areas.
The paper is organized as follows. Section 2 presents the detailed study method, including tsunami modeling. The results and discussion are given in Section 3, with consideration to the tsunami inundation map and evaluation of the optimum scenario. Section 4 presents conclusions.

2. Methods

This section presents a tsunami model that is used to evaluate countermeasure tsunami defense scenarios composed of multiple levels of infrastructure. It consists of four subsections: (i) the numerical tsunami simulation, (ii) the tsunami source model, (iii) the calibration and validation of the tsunami model, and (iv) a tsunami simulation of the multi-infrastructure scenario.

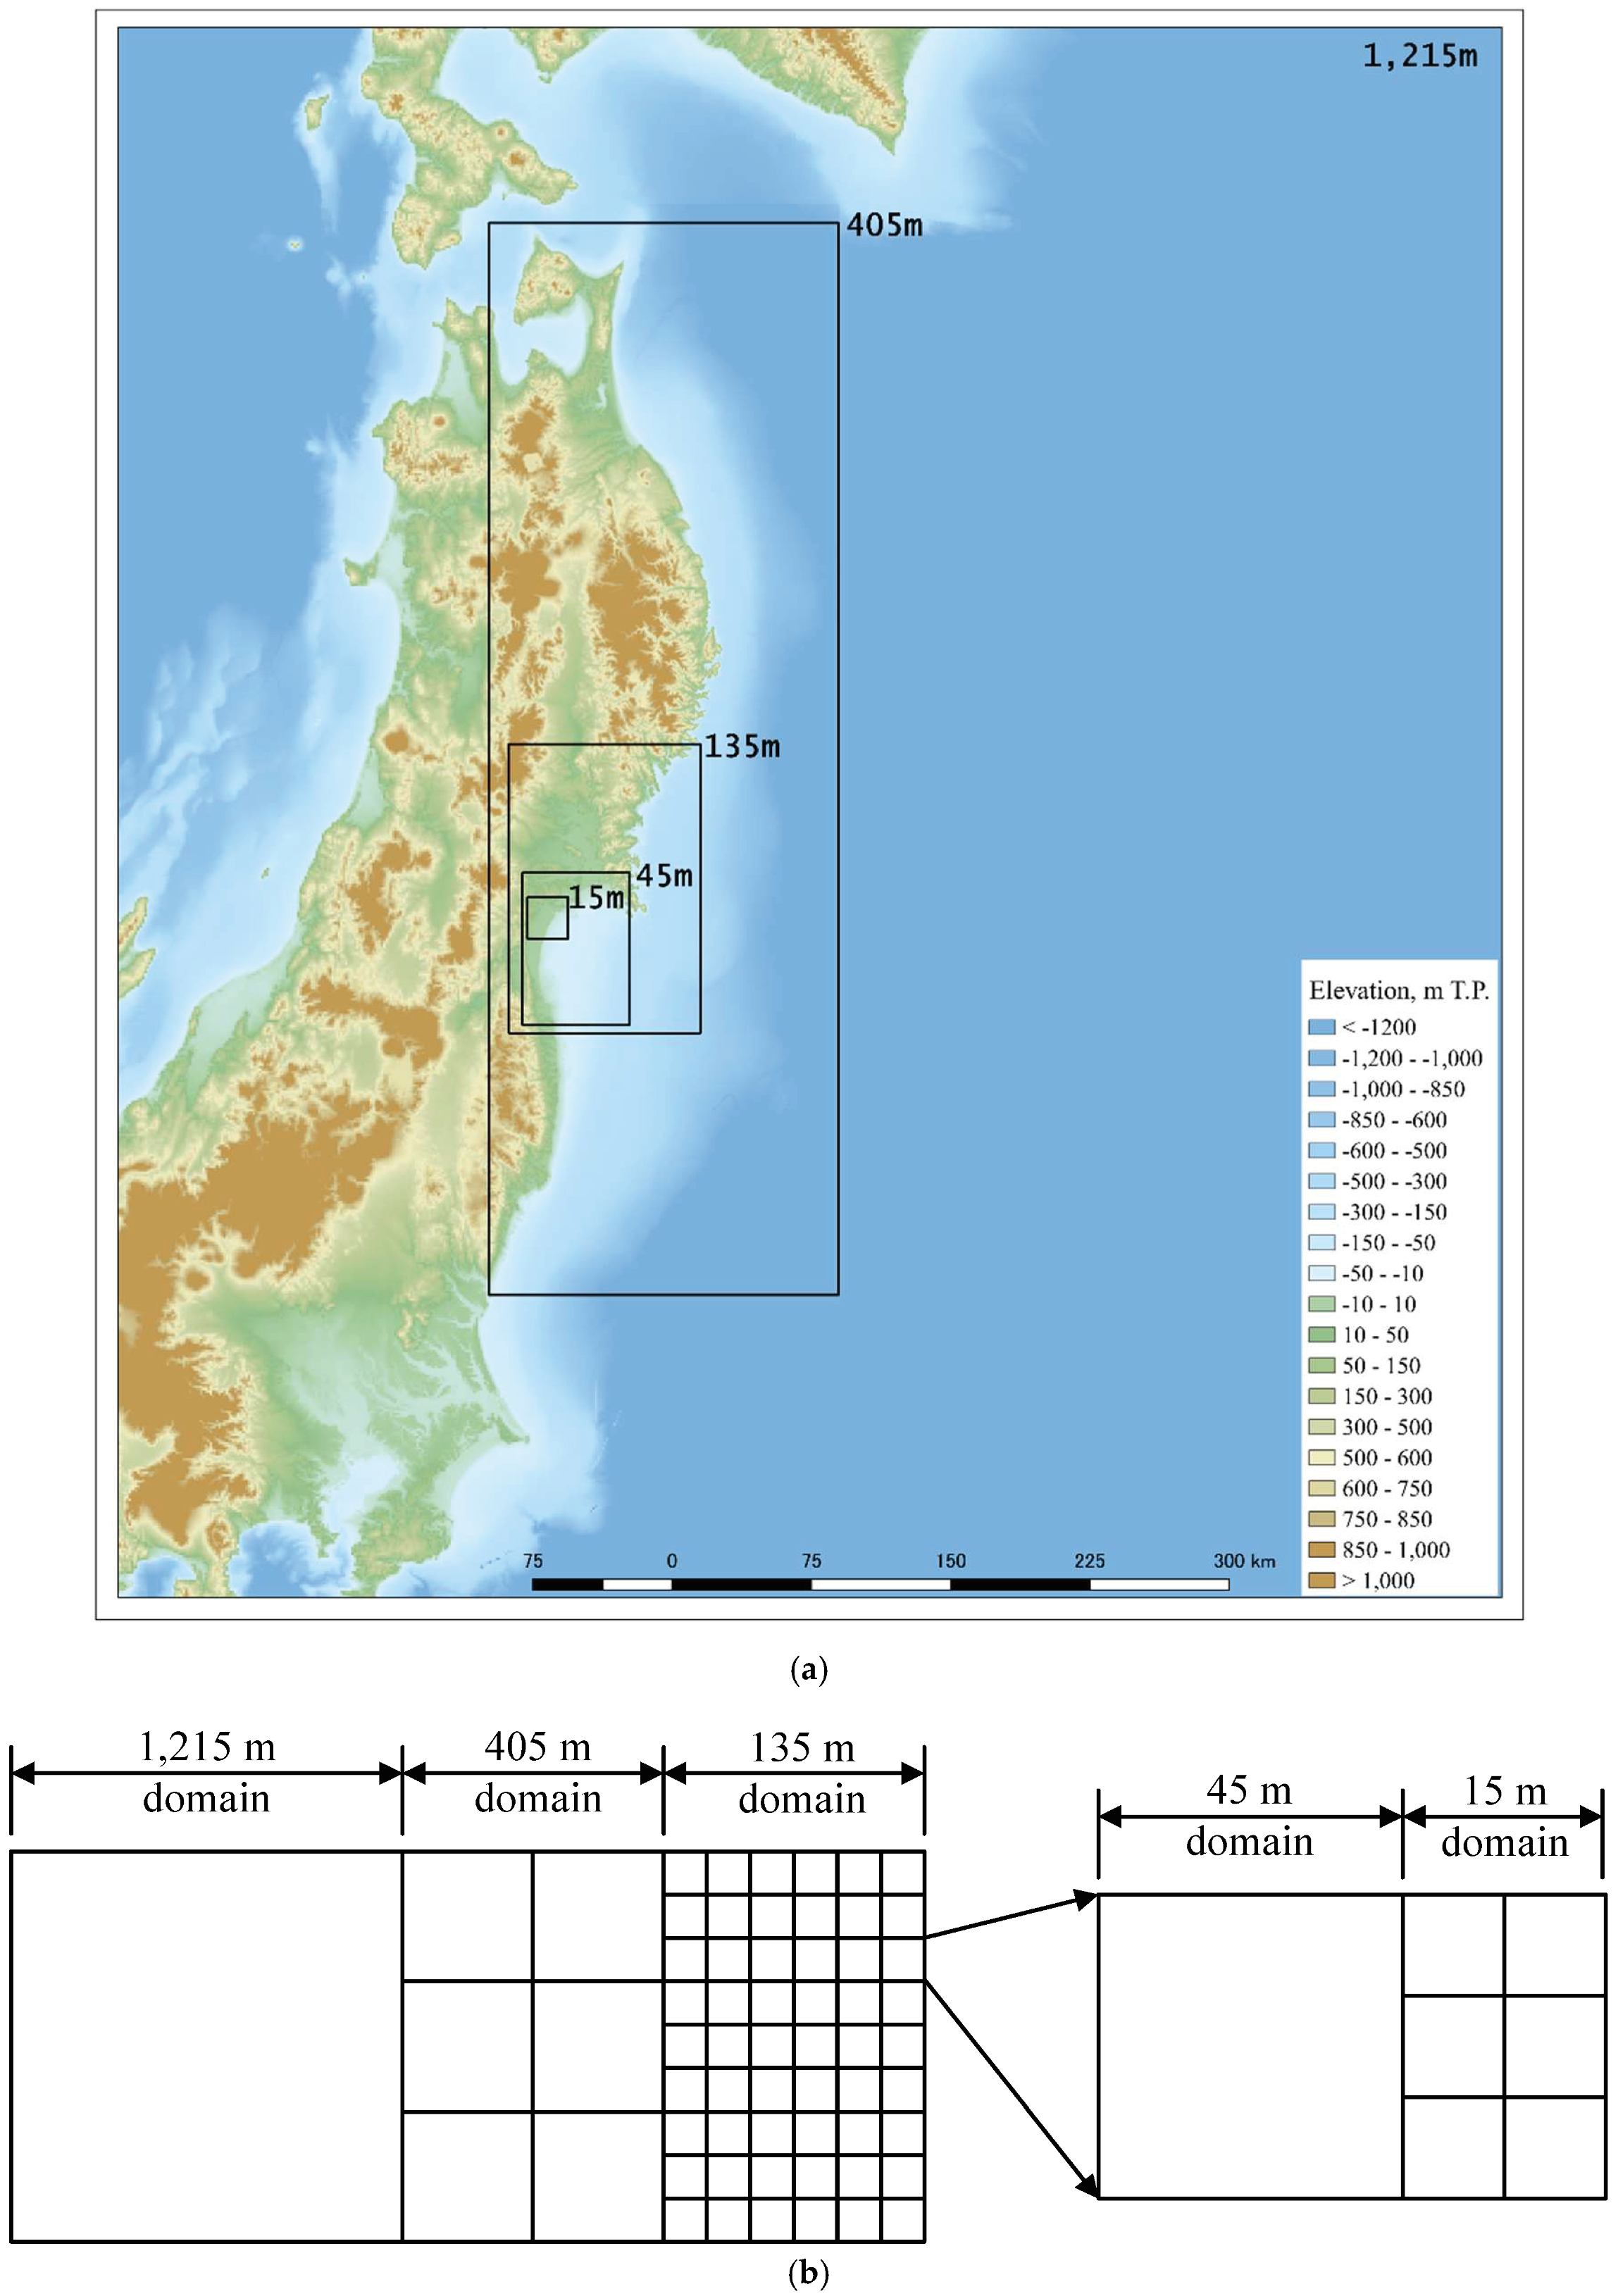
2.1. Numerical Tsunami Simulation

To obtain the tsunami inundations for different infrastructure-system conditions, a numerical tsunami simulation was conducted with the TUNAMI-N2 model [12]. The simulation was run on a computational domain using a nesting grid system, from large areas to small areas, along the coastline of Sendai City. The TUNAMI-N2 model was first developed at Tohoku University to model tsunami propagation and inundation on land and operates using the nonlinear theory of the shallow water equation, which is solved using a leap-frog staggered-grid finite difference scheme. The nonlinear shallow water equation is shown by Equations (1)–(3), wherein the finite difference method is applied to run the nonlinear equation with the bottom friction represented by Manning’s roughness coefficient.
η t + M x + N y = 0 ,
M t + x ( M 2 D ) + y ( M N D ) + g D η x + g n 2 D 7 3 M M 2 + N 2 = 0 ,
N t + x ( N M D ) + y ( N 2 D ) + g D η y + g n 2 D 7 3 N M 2 + N 2 = 0 ,
where η is the water level, M and N are the fluxes of water in the x and y directions, D is the total depth, g is gravitational acceleration, and n is Manning’s roughness coefficient. The preparation process was performed for the bathymetry data for the tsunami propagation and inundation simulations. The tsunami model was run on five computational domains as shown the nested grid system in Figure 2a; the data were provided by Geospatial Information Authority of Japan (GSI). The projection of collected data is based on the Cartesian coordinates from the Japanese Geodetic Datum 2000 and the Tokyo Peil (T.P.) datum for the horizontal and vertical references, respectively. The fixed ratio of the two domains is one-third (see Figure 2b). In the smallest domain, the inundations were calculated for the proposed protective structure, which was inserted into the bathymetry by using GIS techniques, as presented in Figure 2c. The GIS task was done by the Quantum GIS (QGIS) software on Conversion tool and Raster calculator tool. The Conversion tool used to convert the vector format (hypothesis structure line) to the rater format as same as the format of bathymetry data. The combination between hypothesis structure in rater format and existing bathymetry is done by the Rater calculator tool. Note that the simulation without a greenbelt area is run with a constant Manning coefficient of 0.025.

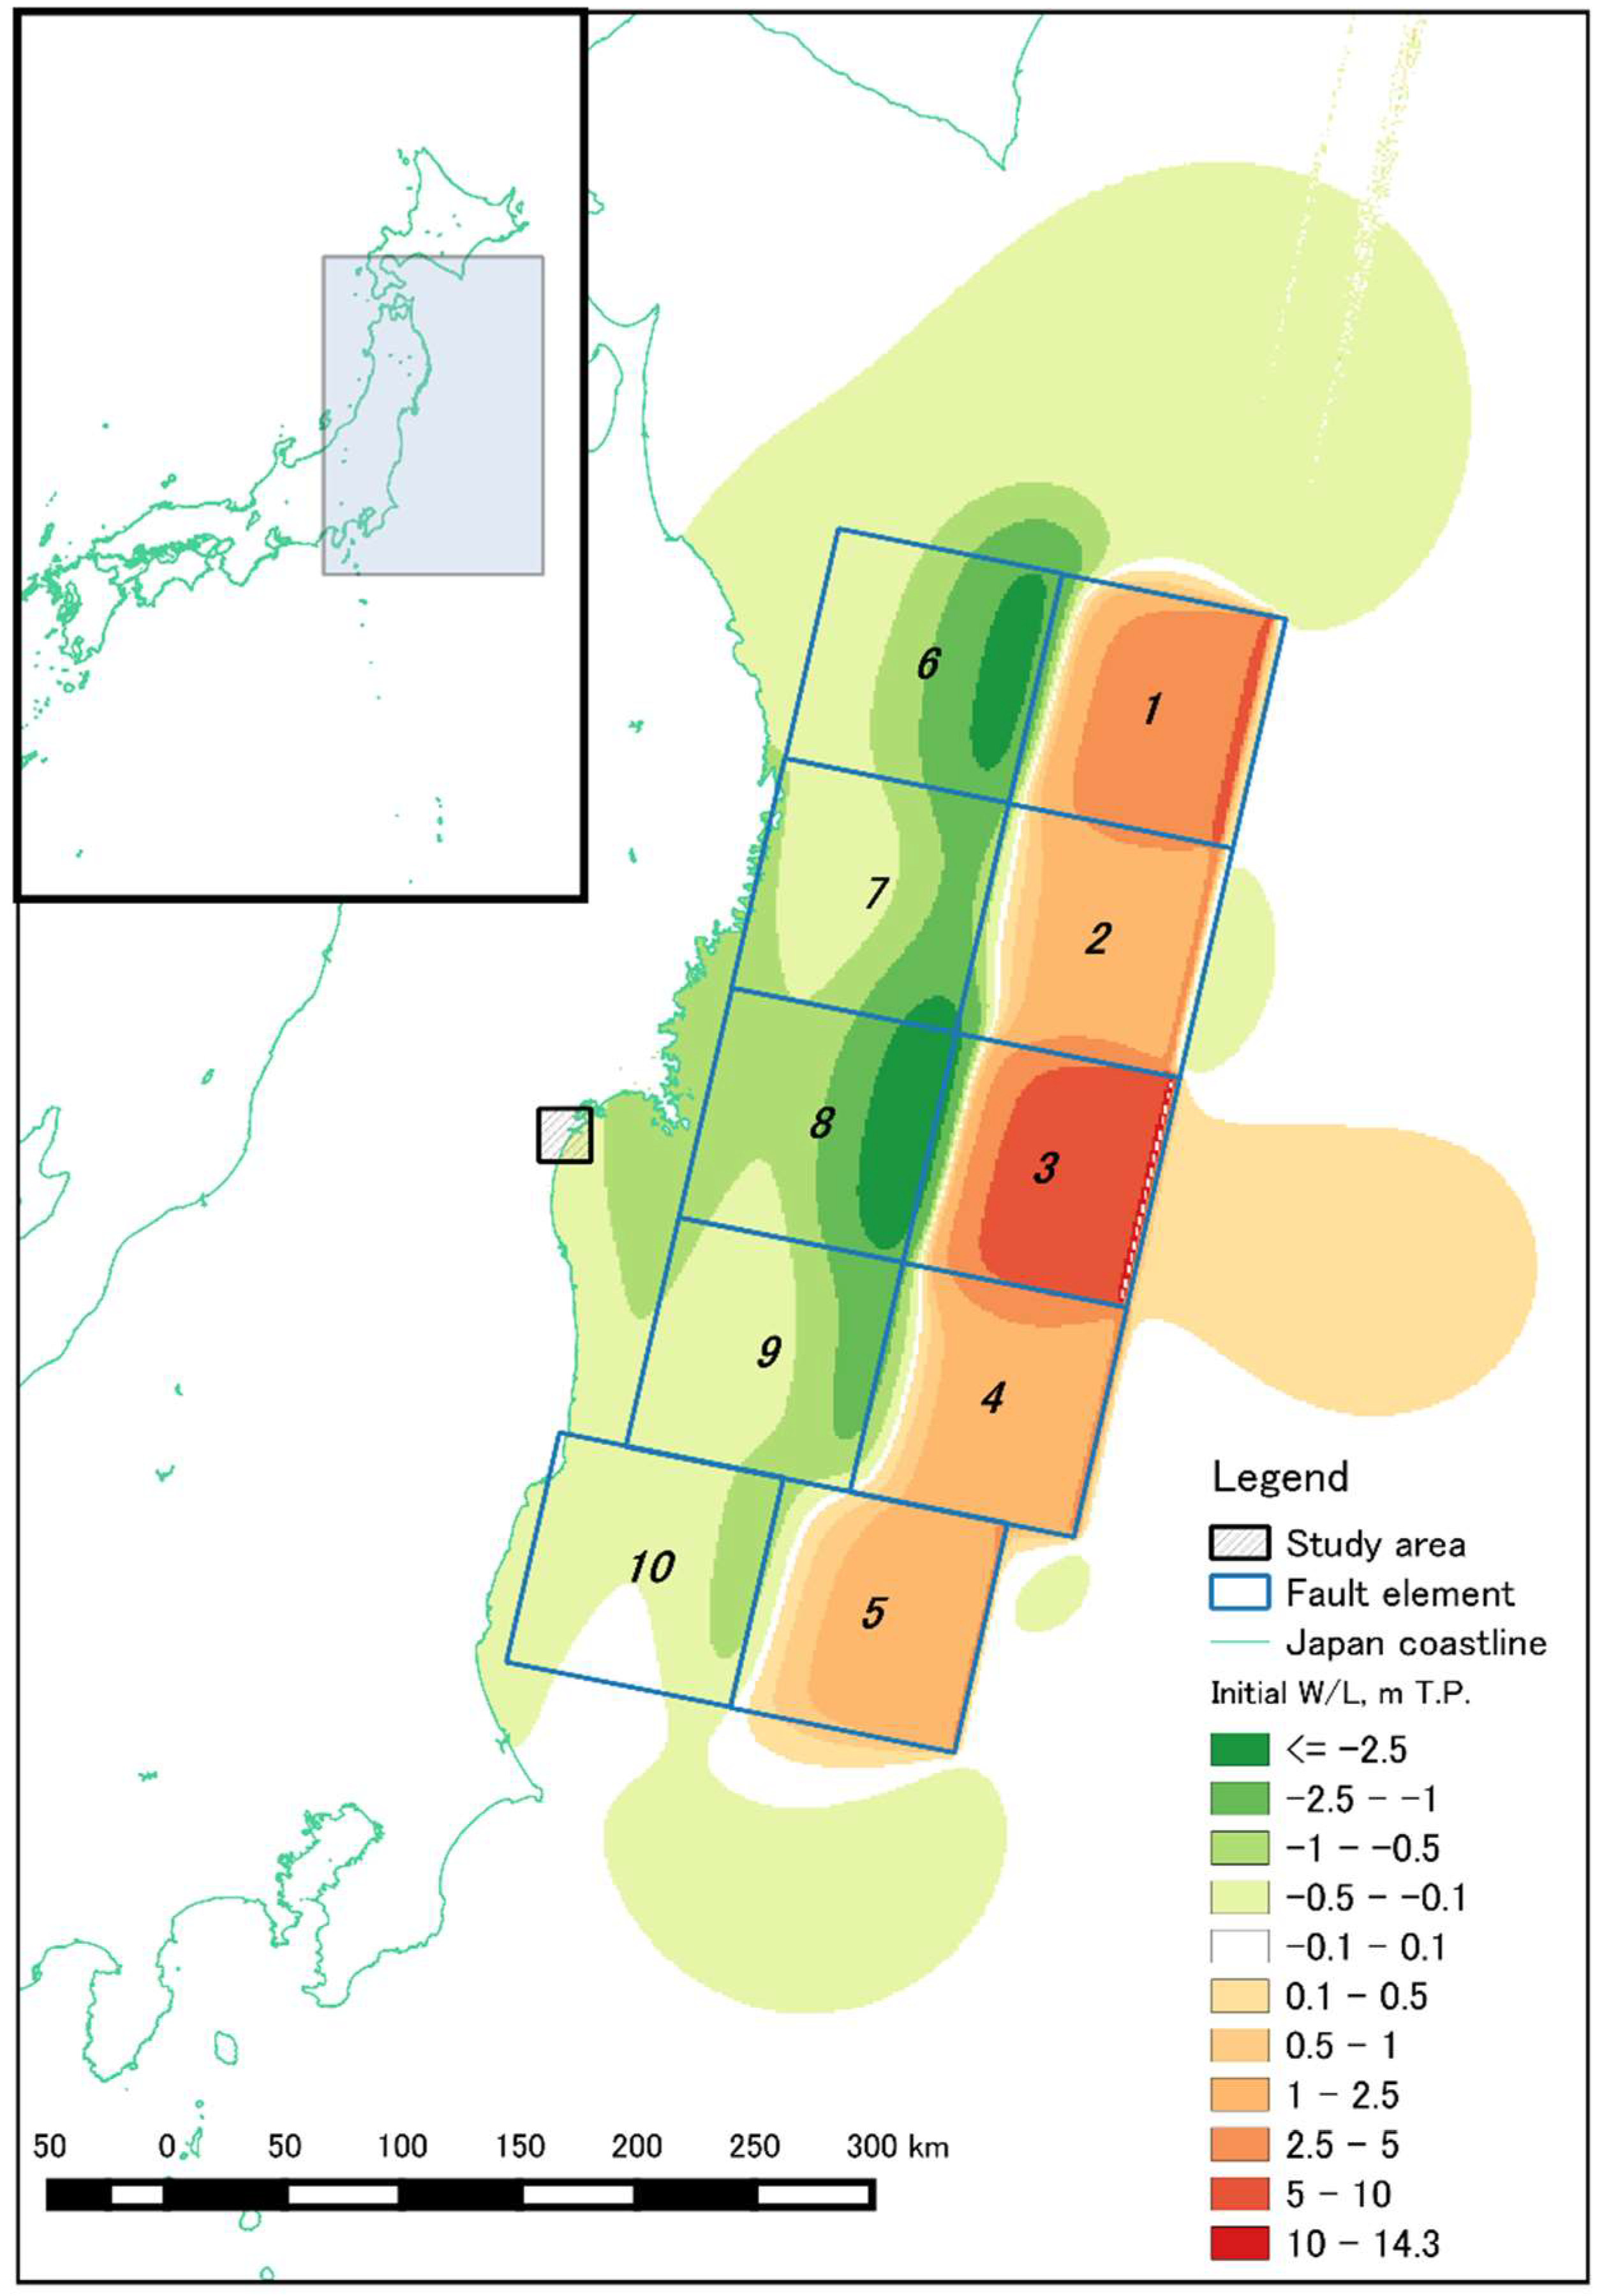
2.2. Tsunami Source Model

An important variable for simulating tsunami propagation and inundation is the initial seafloor deformation that is computed from the fault modeling of the tsunami source model. Because of the complexity and uncertainty of the fault rupture processes, this study estimated the initial water level based on a rectangular fault model and assumed that the change in the sea surface is the same as the seafloor deformation. The rectangular faults are assumed to have a fast movement toward the sea surface that is only a vertical displacement [29]. The fault parameter of the 2011 Great Pacific Coast Japanese earthquake is based on the Tohoku University model [30]. The Tohoku fault model (V. 1.2) establishes 10 subfaults. Figure 3 presents the initial water level distribution generated by the Tohoku University model based on the Okada formula [29] where the maximum water level or uplift is about +14.3 m T.P., while −4.7 m T.P. is the minimum water level or subsidence. The T.P. datum is the Tokyo Peil datum referenced by the sea water level in Tokyo bay [1].

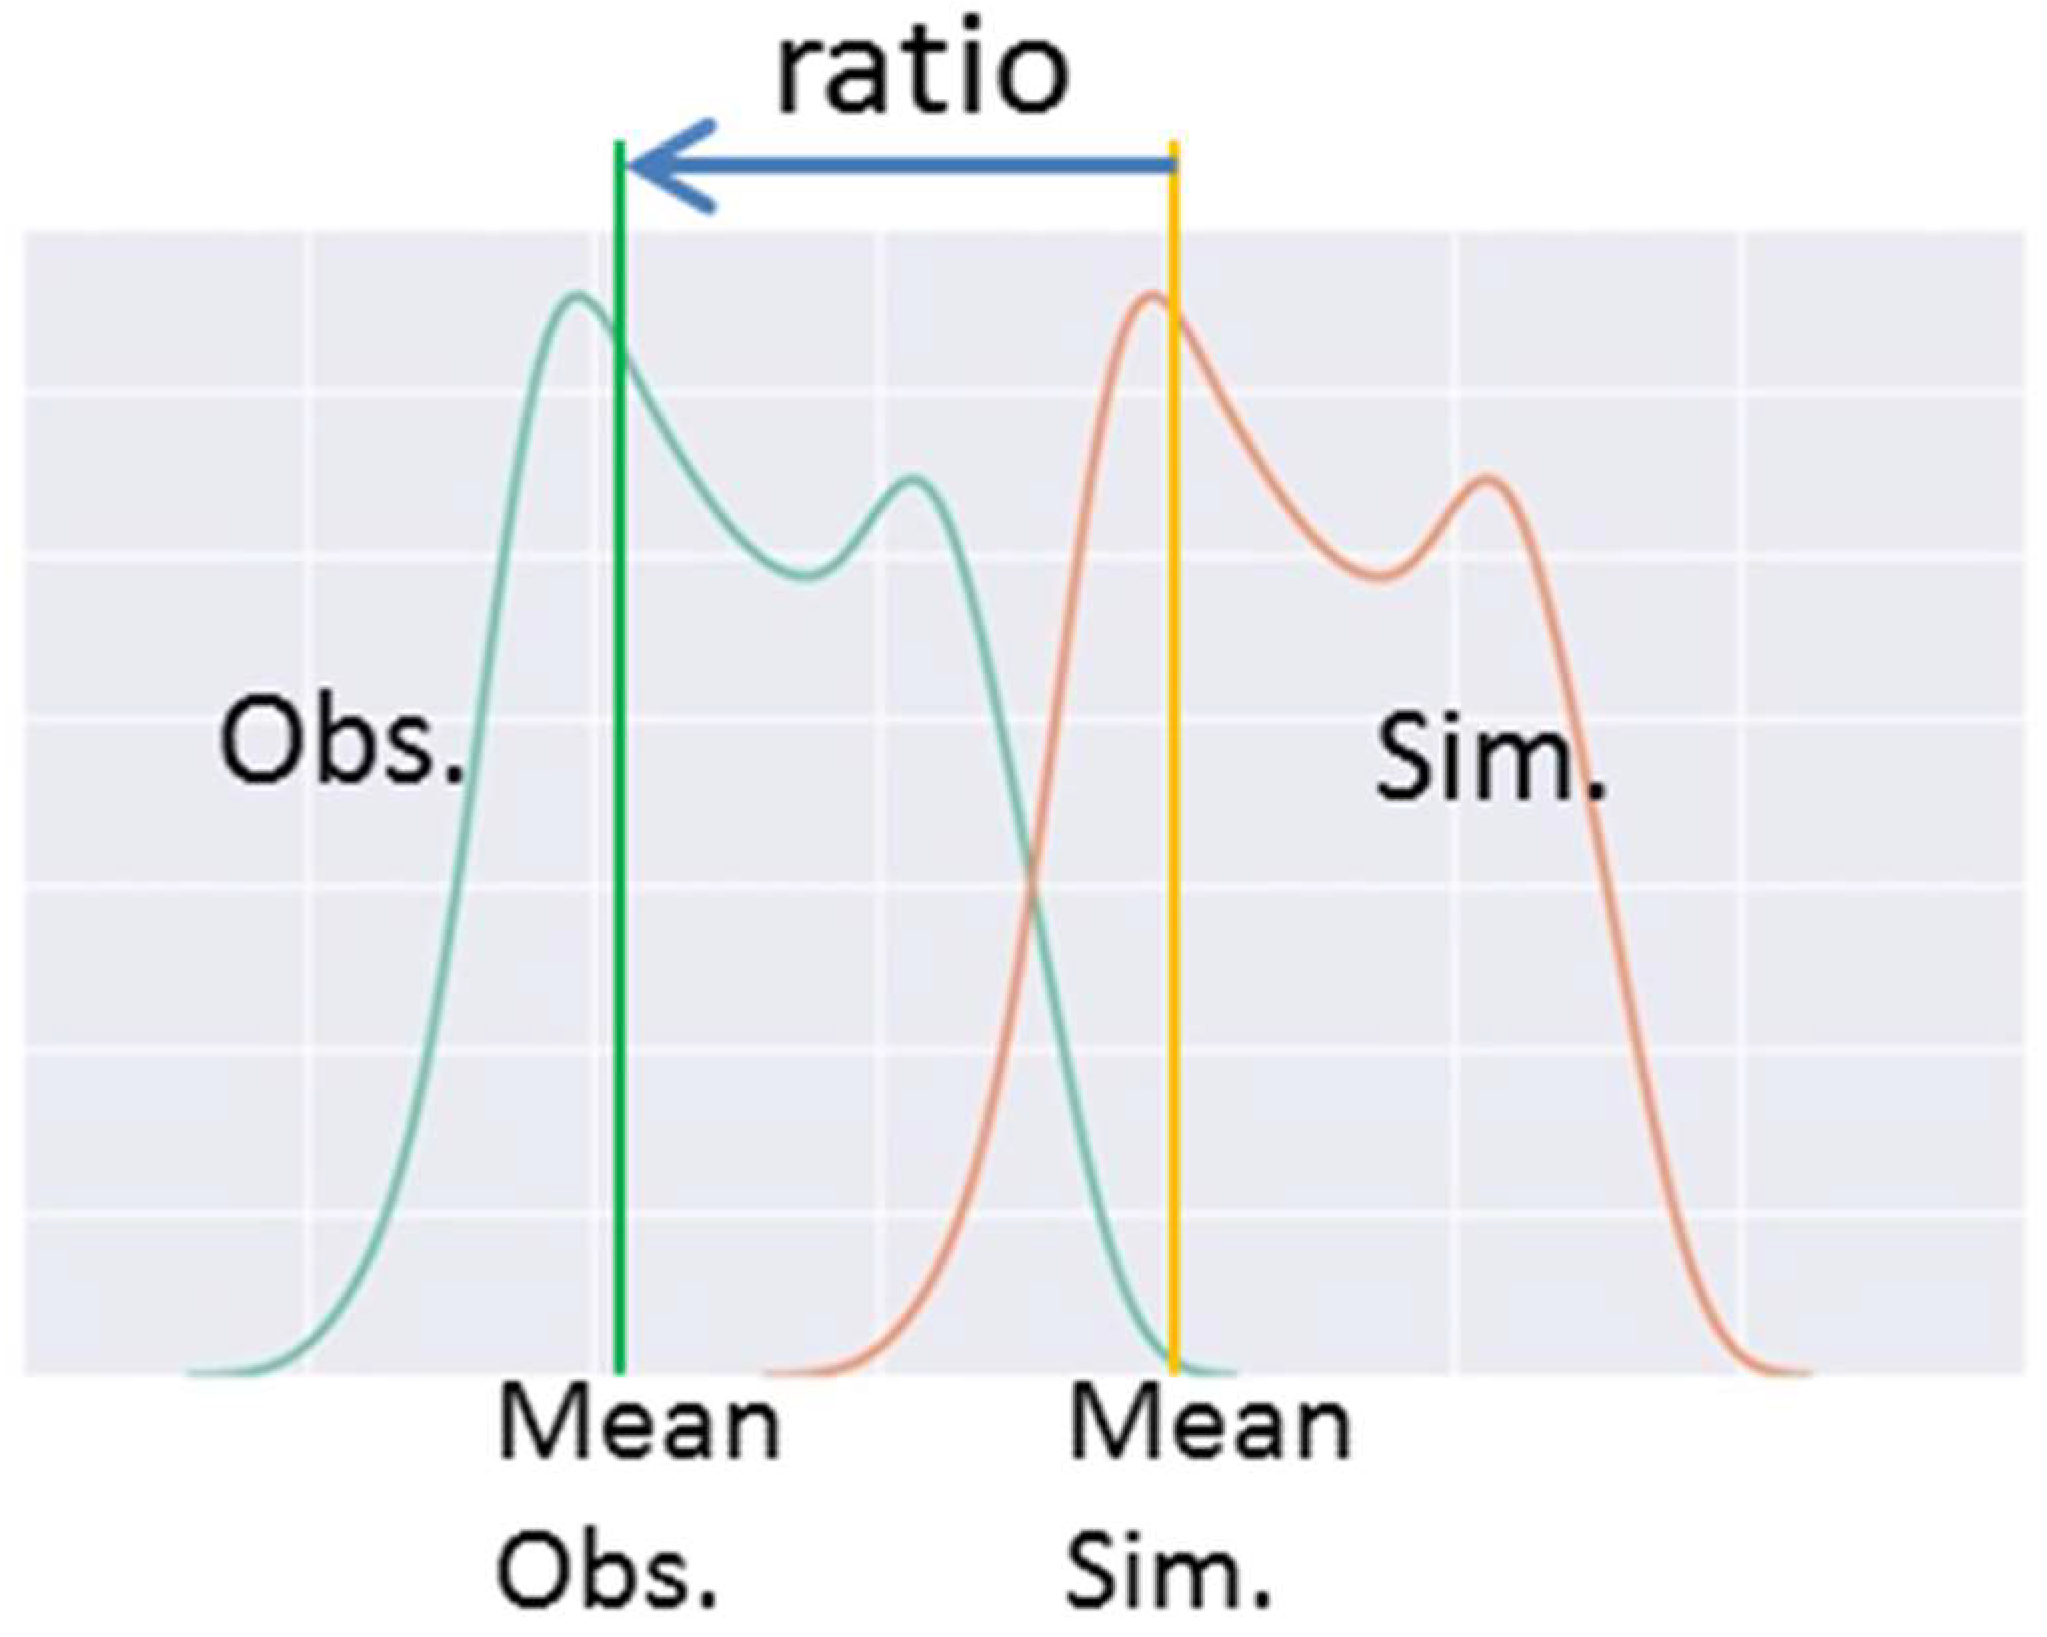
2.3. Calibration and Validation of Tsunami Model

The tsunami inundation and flow depth collected from the survey data taken from the GNSS (Global Navigation Satellite System) measurements after the 2011 Great Pacific Coast Japan Tsunami were collected by TTJS (The 2011 Tohoku Earthquake Tsunami Joint Survey) Group [31]. The tsunami run-up was further determined using a numerical model since insufficient field measurement data were collected. The numerical tsunami model was calibrated using a performance parameter, such as the geometric mean K or geometric standard deviation k proposed by Aida [32], to reproduce the tsunami inundation and flow depth data. The K and k values were chosen for the calibration of tsunami run-up heights. The K value was derived from the mean of the K and k values, which refers to the deviations or variances from the proportion of observed and computed data. The Japan Society of Civil Engineering (JSCE) recommends values of 0.95 < K < 1.05 and k < 1.45 for the model results to achieve “good agreement” when evaluating the tsunami source and propagation models [33]. According to the K and k values mentioned above, the simulation requires further calibration methods to find a “good agreement” model because the proposed model was based on field measurement data from all along the Tohoku coast while this study focuses only on Sendai City. The parameters K and k are determined as shown below:
log K = 1 n i = 1 n log K i
log k = 1 n i = 1 n ( log K i ) 2 ( log K ) 2
K i = x i y i
where x i and y i are the observed and simulated data, respectively, at point i .
The calibration method, as recommended in this study, is meant to improve the initial water level using the mean ratio bias correction method. The corrected data were first adjusted by finding the mean ratio between the recorded and computed data [34,35,36], as shown in Equation (7).
R i = R ¯ S ¯ · S i ,
where R ¯ is the mean of the observed data, S ¯ is the mean of the simulated data, R i is the corrected data, and S i is the simulated data. The ratio value is calculated using the cross validation method [37], as shown in Figure 4. The advantage of this technique is that the bias value is removed from the mean, whereas its disadvantage is failing to correct the time series data.

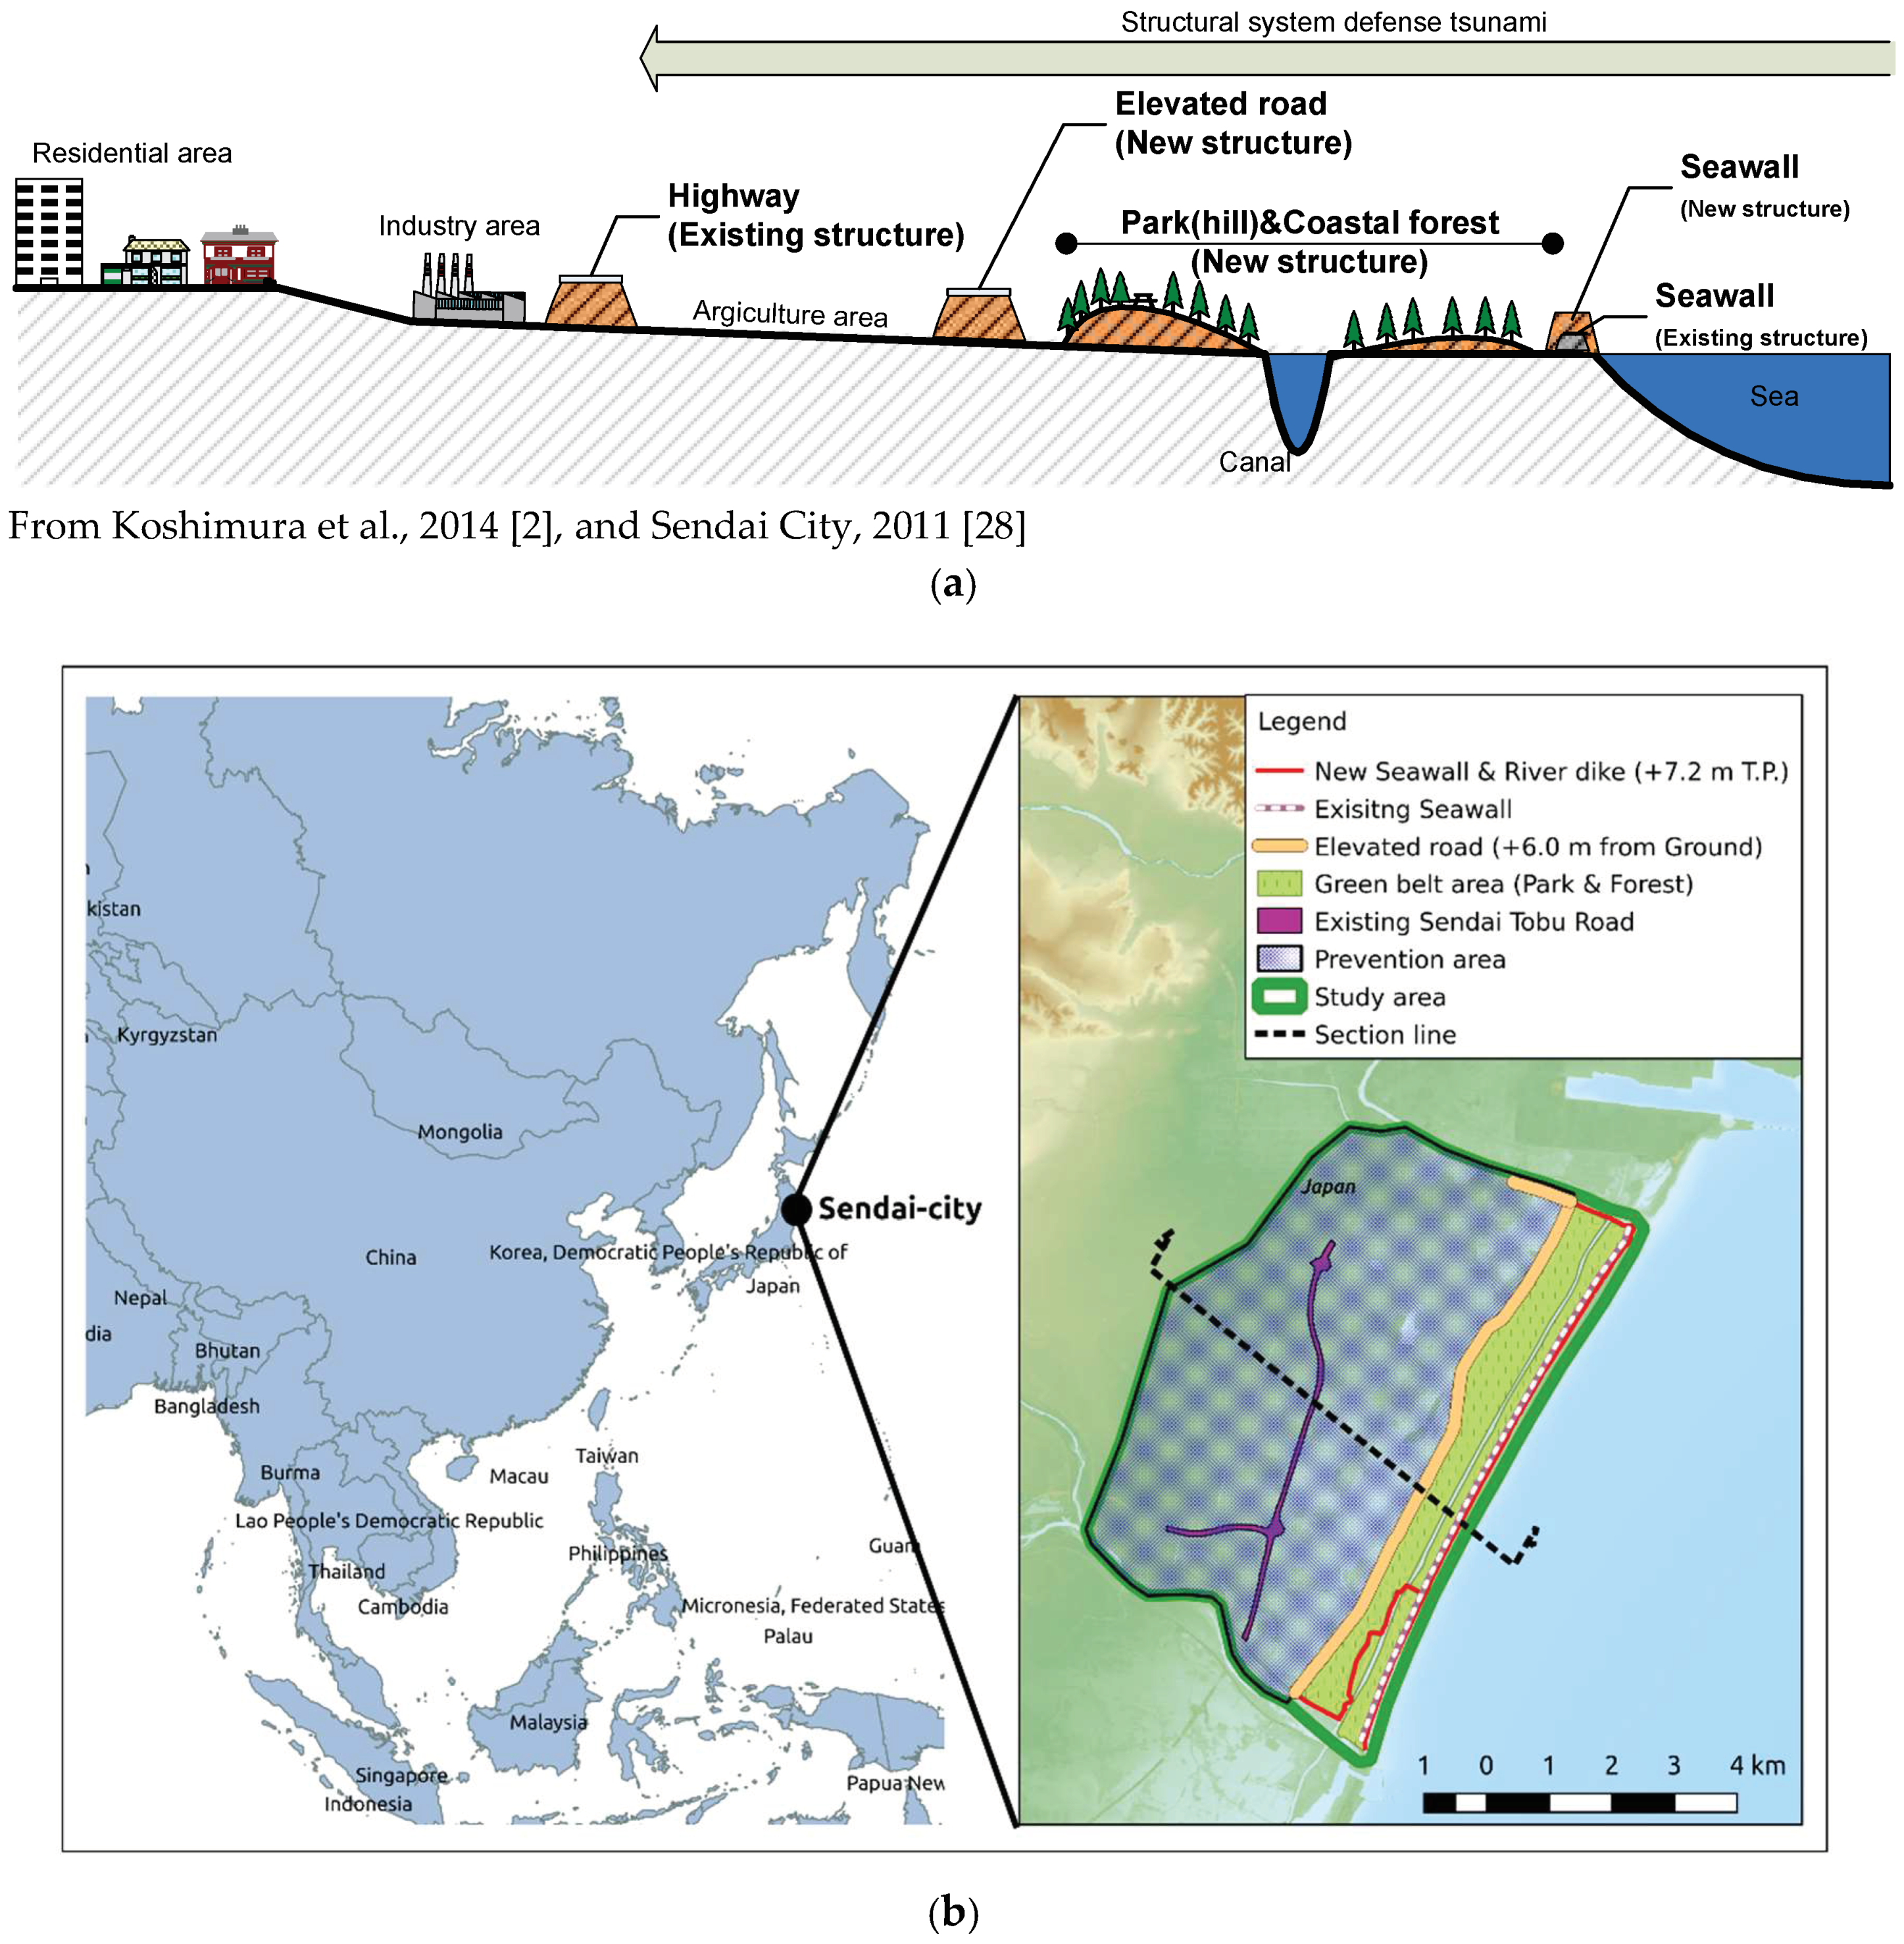
2.4. Tsunami Simulation of the Multi-Infrastructure Scenario

Determining the impact of multiple structures on preventing tsunami-related disasters is the target of this study. The structural system shown in Figure 1 as part of the Sendai City plan has five components: an existing seawall, a reconstructed seawall, a greenbelt area (park and coastal forest), an elevated road, and an existing highway. The greenbelt area was assumed to include grass areas (n = 0.030) in parks and pine trees (n = 0.160) in coastal forests [38]. Based on the components of the existing and reconstructed structures, the scenario of the simulation is divided into six schemes: (1) no-structure, (2) single structure, (3) 2 components, (4) 3 components, (5) 4 components and (6) 5 components. The no-structure condition is used to model the actual terrain without any tsunami protection structures. For the single-structure condition, one preventative structure is selected and input into the numerical tsunami model using the structure-insertion method previously described in Figure 2c. Using the condition of an inundation depth of less than two meters behind the road, an elevated road was suggested for the protection of Sendai City against tsunamis [2]. This condition can be used to reveal the performance of each preventative structure. The scenario of 2 components of preventative structures is used to reveal the performances of a combination of structures, such as the case of a seawall and a highway, as mentioned by the existing case in the calibration dataset. In the time line of development, the new and renovated preventative structures are contracted as 3-, 4-, and 5-component scenarios. The scenario of 5 components of preventative structures is the fullest extent of Sendai City’s ability to protect against tsunamis in the future. This scheme has 2 options in which the tsunami wave either can or cannot overflow the elevated road. These schemes are used to evaluate transportation safety during tsunami occurrences in the future. To understand the effects of the different protective structures during the progress of a tsunami wave, 24 sets of bathymetry (as shown in Table 1) were established and applied in the inundation simulation. The results of the 24 cases are presented according to the inundation depth to reveal their performance in protecting against tsunamis.

3. Results and Discussion

The performances of multilayered structures for tsunami mitigation in Sendai City were investigated by comparing the results of different geometries, with and without preventative structures. The TUNAMI-N2, a numerical tsunami model, uses a tsunami source model based on Tohoku University’s fault model (V. 1.2) of the 2011 Great Tsunami. The numerical model is calibrated with bias correction of the mean ratio algorithm. The simulation results with the corrected initial water level is evaluated by the K (kappa) coefficient. In addition to the actual structures, their heights are represented in the terrain data, and the hypothetical structures were recommended by the plan to protect Sendai City against tsunamis. The existing and planned structures with the highest crests were evaluated in order to investigate the effects of the overtopping of the structures on the behaviors of the tsunami flows. The last case is an enclosed structure that is hypothesized to be fully protected by multiple structures to examine the effects of implementing multilayer infrastructures to protect against large tsunamis. Finally, a demand/supply curve is used to evaluate the optimum combination of structures by using the intersected region between the demand line and the supply line.

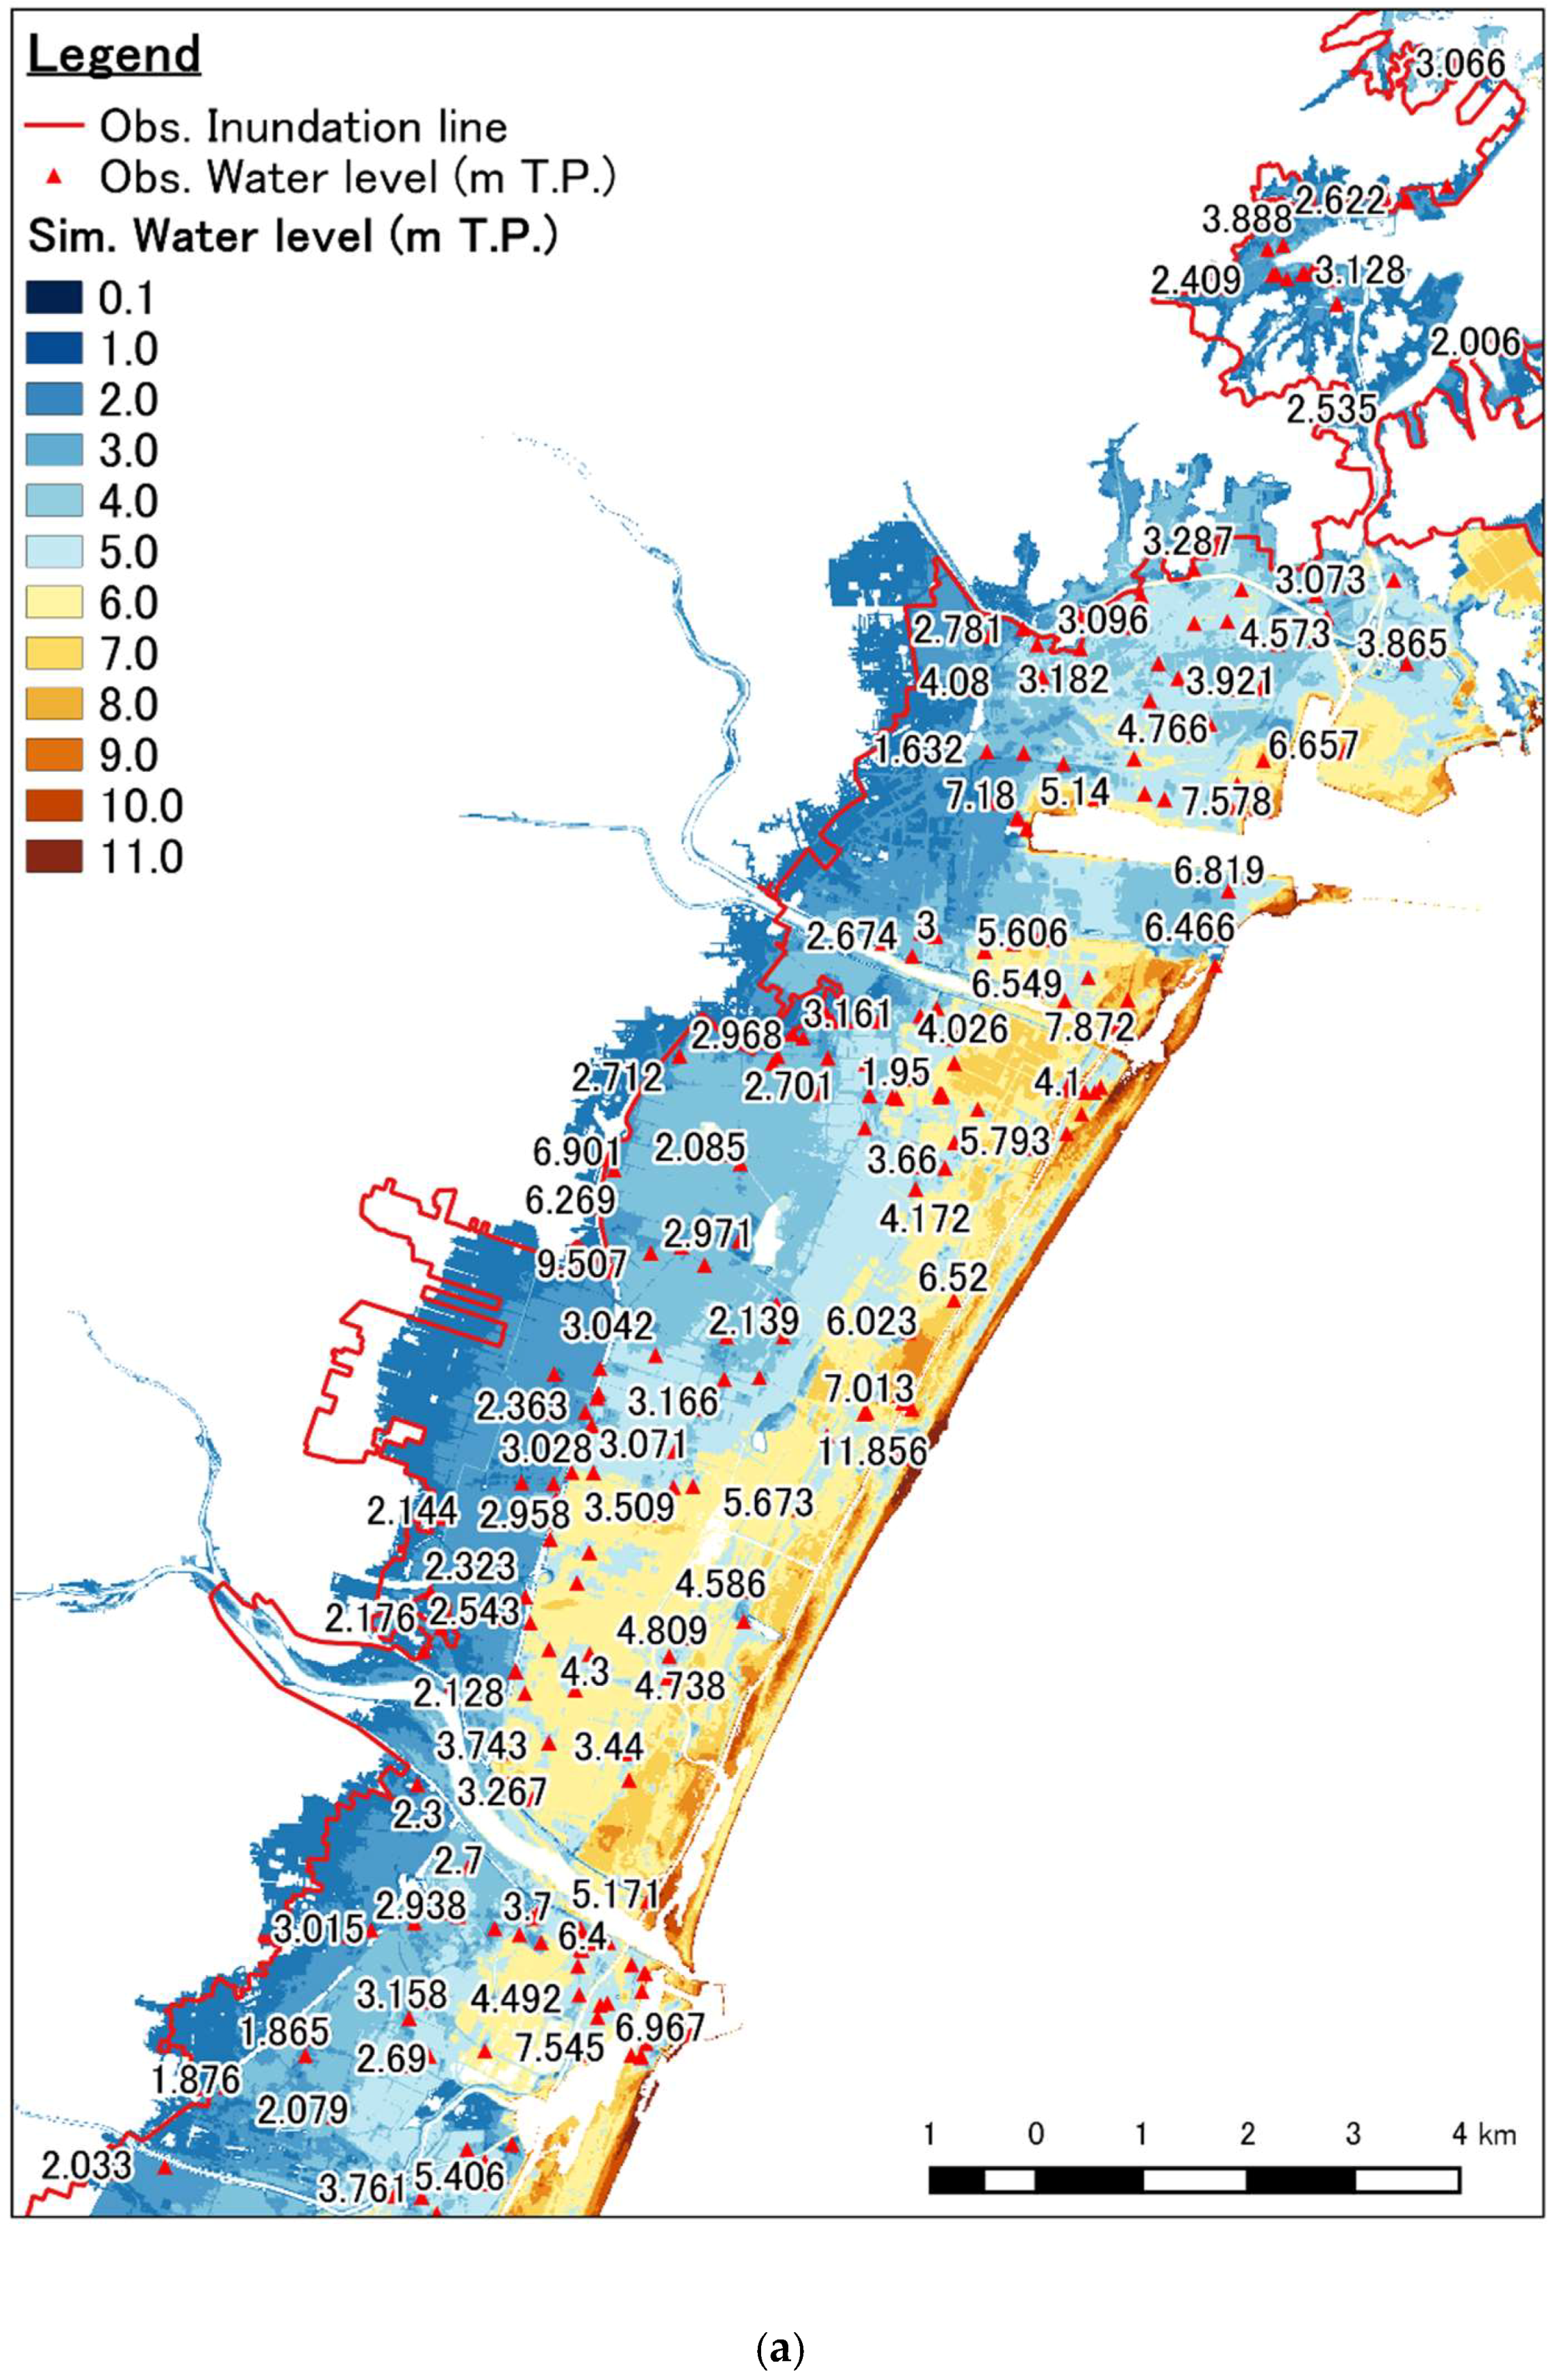
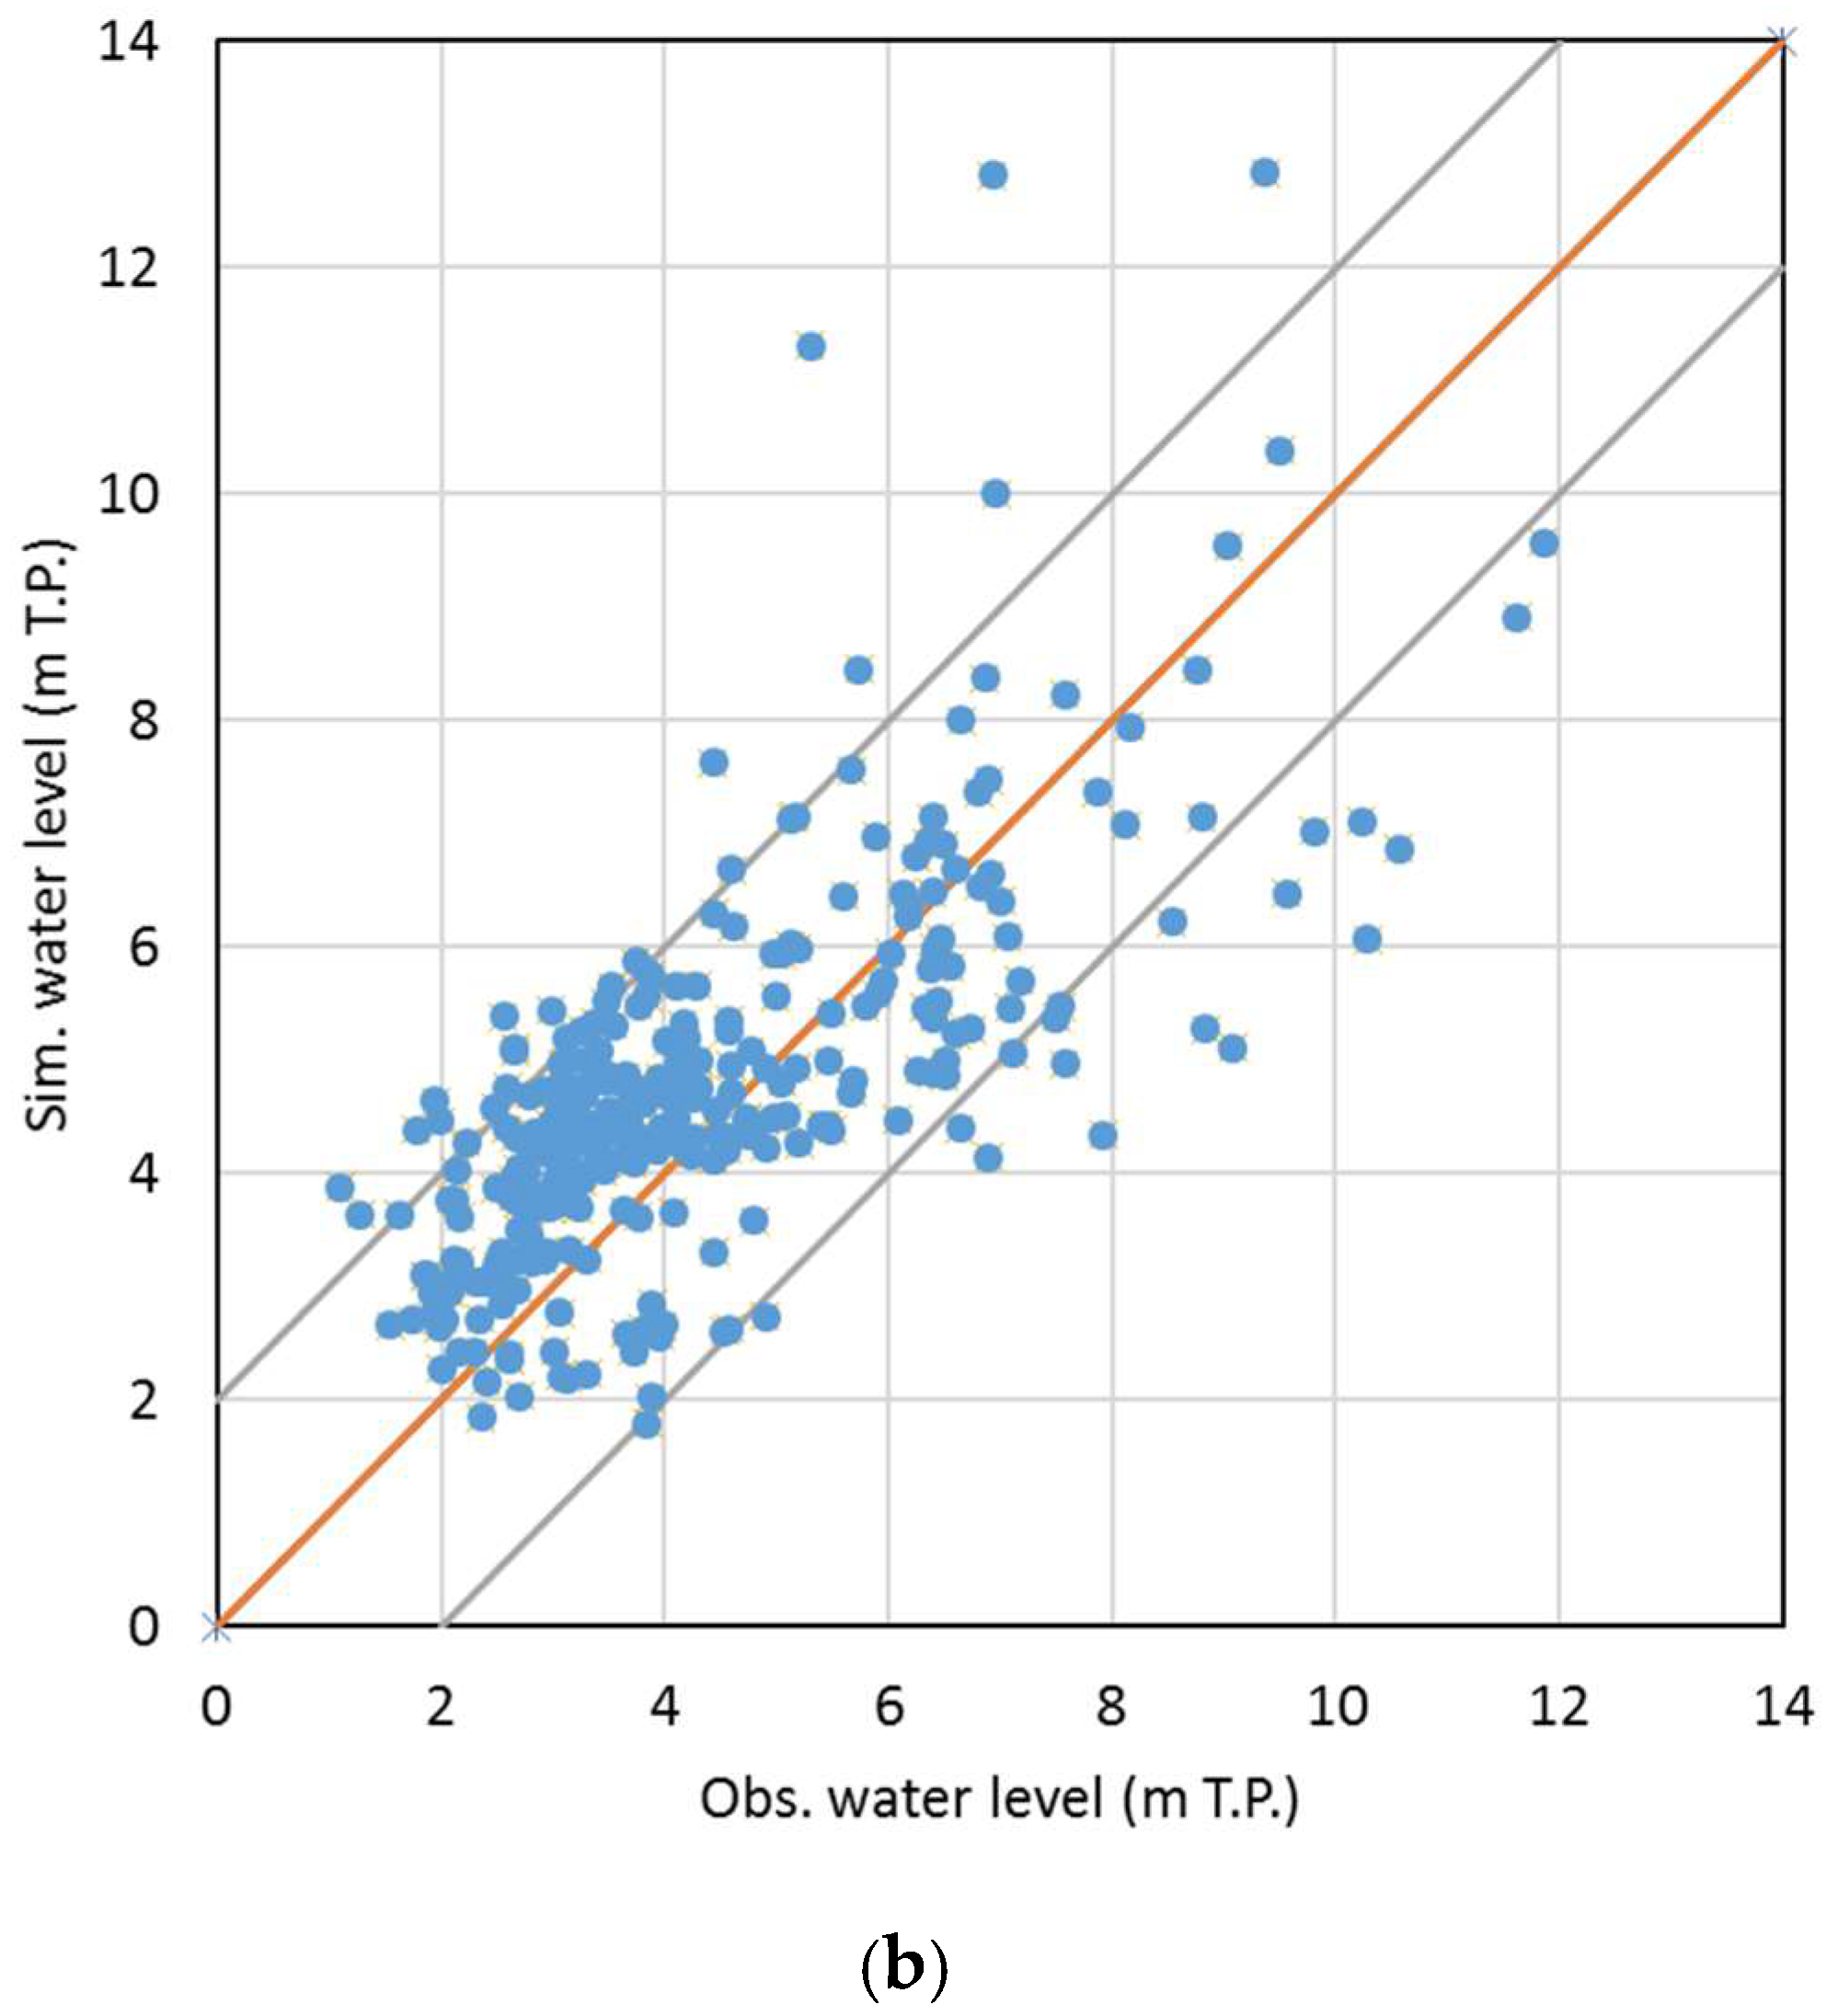
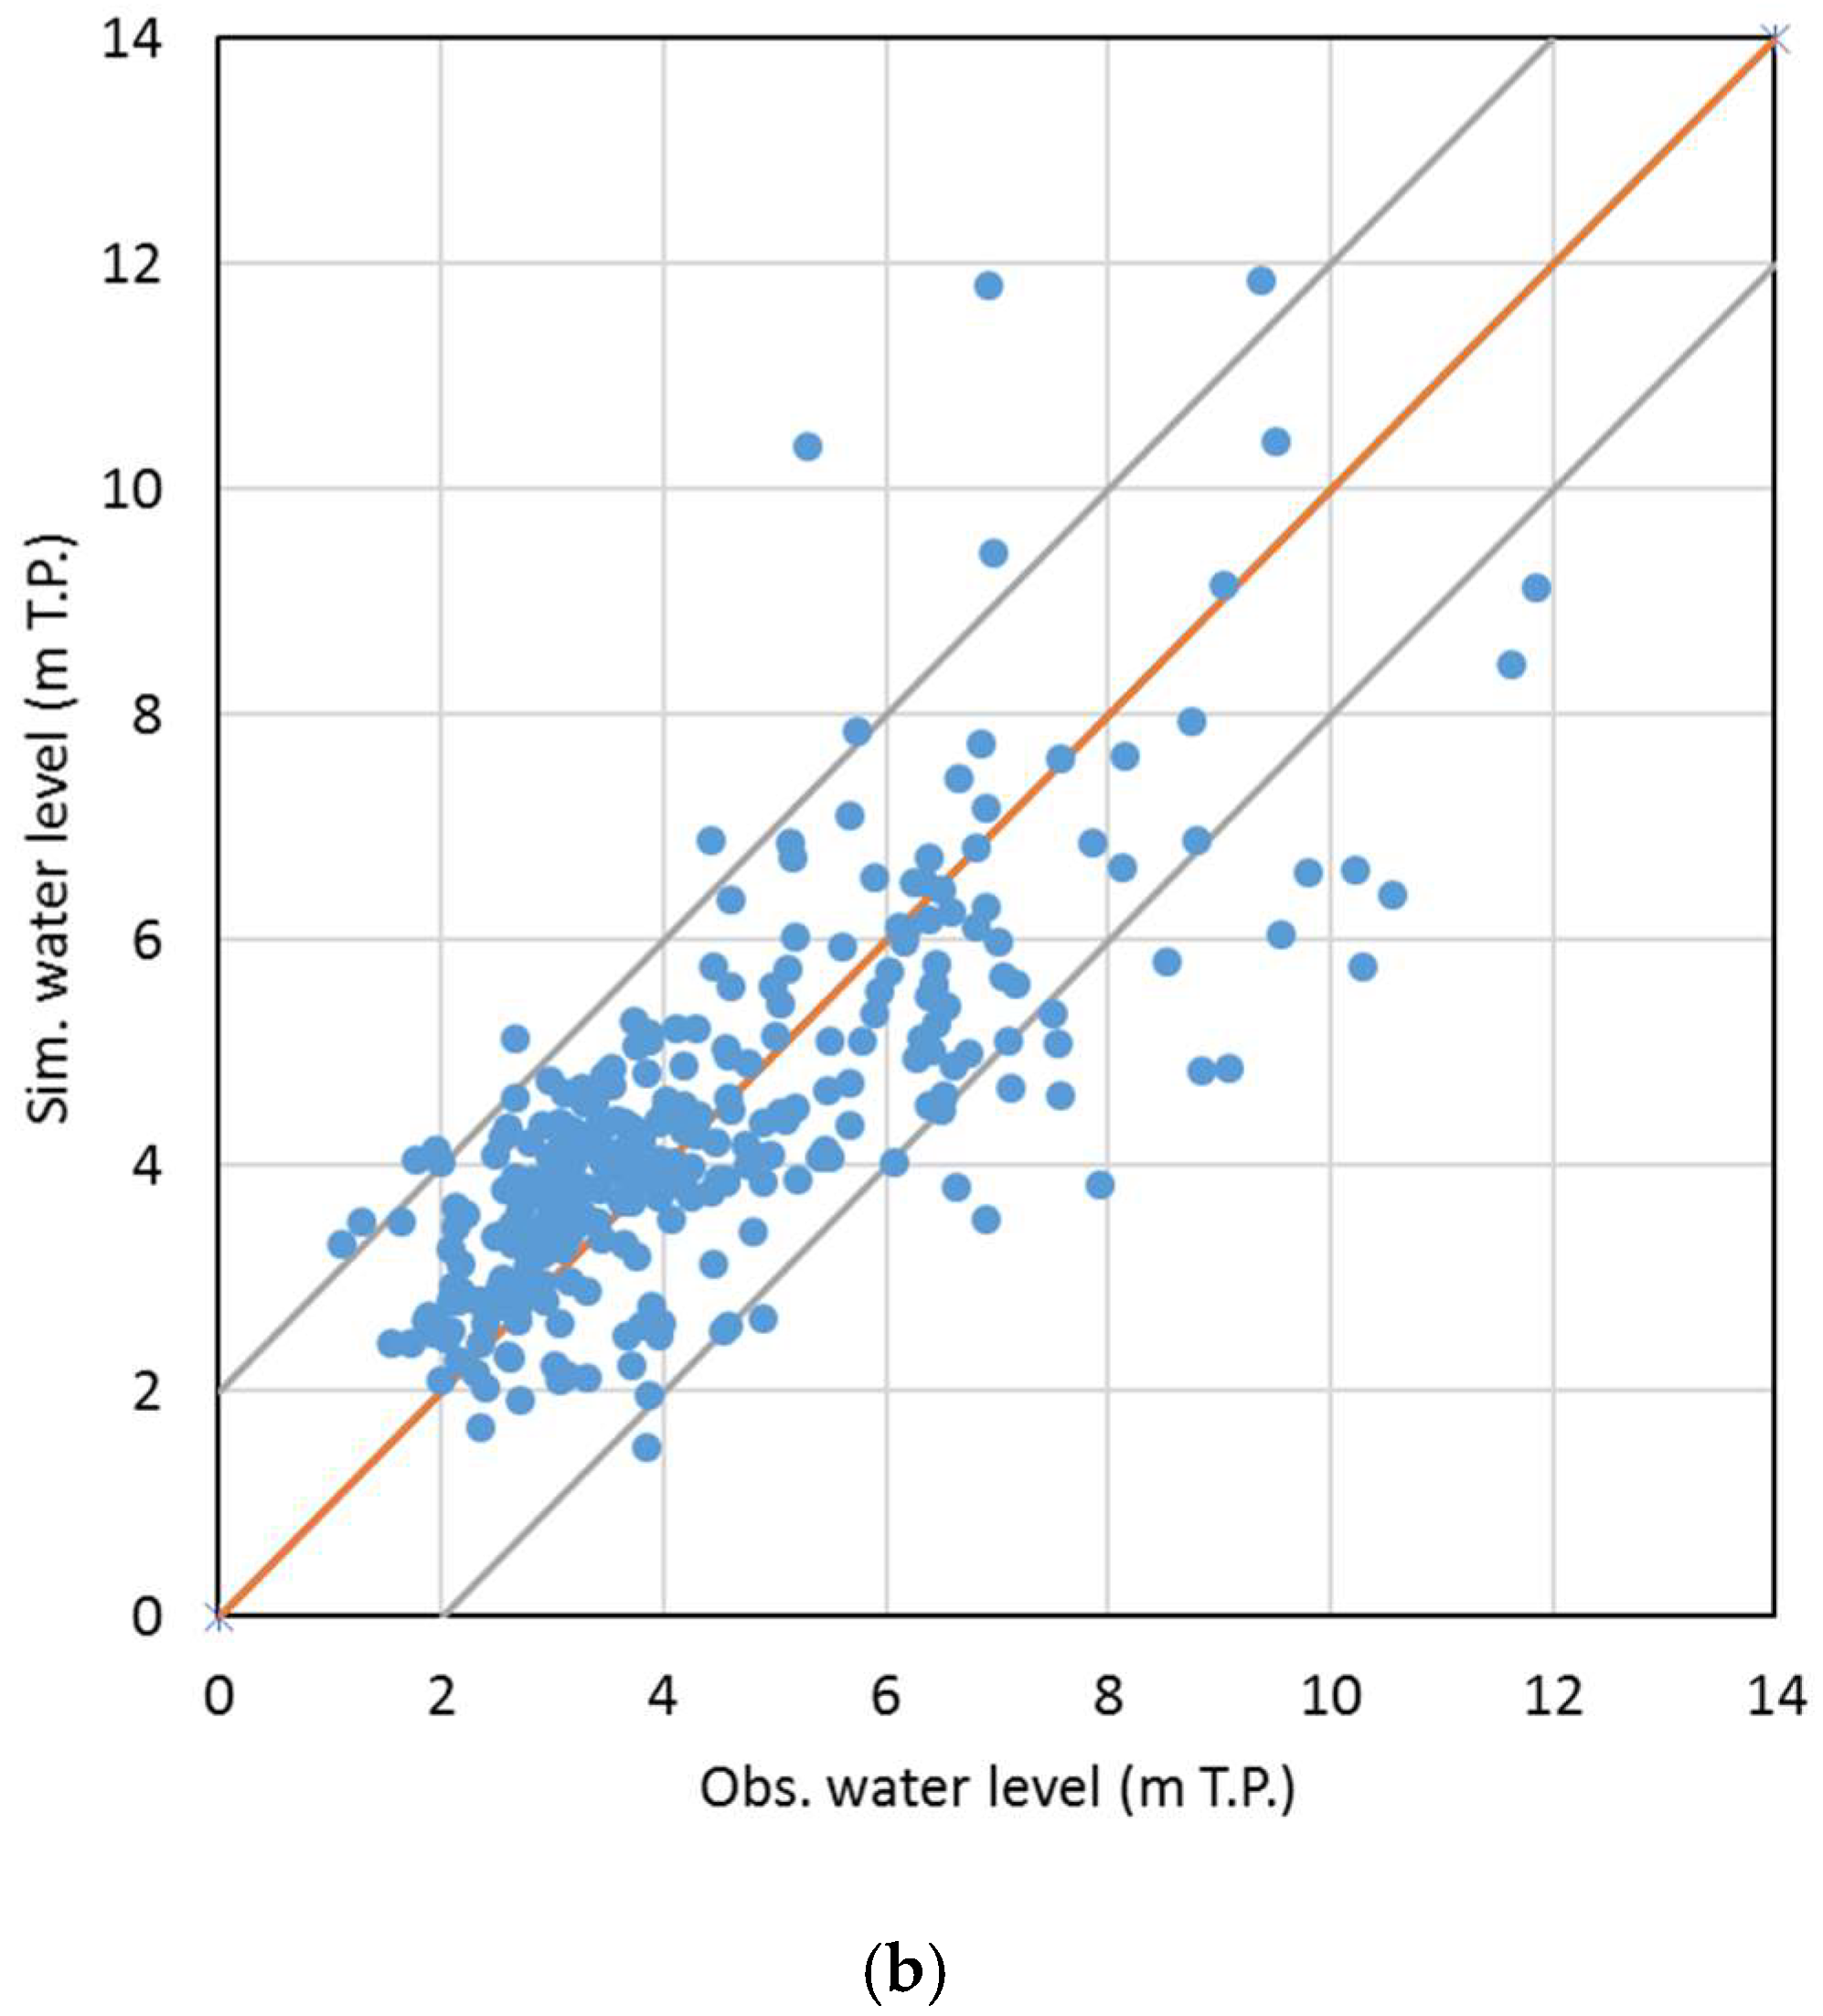
3.1. Calibration and Validation Results

The tsunami run-up height from the numerical simulation based on the Tohoku University fault model and bathymetry data with existing structures present during 2011 (Case 09) was calibrated using field measurement data, as shown in Figure 5. Figure 5a presents a comparison of the inundation extent with the inundation line provided by the Geospatial Information Authority of Japan [39]. Scatter plots of the observed and simulated data are shown in Figure 5b, wherein K is 0.874 and k is 1.359.
In this study, the observed water level data have a mean value of approximately 4.314 m, whereas the existing runs have a mean value of approximately 4.749, indicating that the simulation results overestimated the observed data. The bias correction parameter is approximately 0.908 and was used to improve the existing initial water level. The bias parameter was multiplied with the spatial existing initial water level. The improved initial water levels have a maximum value of approximately +12.6 m and a minimum of approximately −4.1 m. Comparing the corrected data with the existing data, the maximum increases by approximately 0.6 m, while the minimum decreases by approximately 1.7 m. The modified initial water level is input into the TUNAMI-N2 model again for the inundation simulation, and the simulated results were used for the validation, as shown in Figure 6. Figure 6a shows the validation of the inundation extents with the inundation line, while the scatter plot of the observations and simulations is shown in Figure 6b using a K of 0.957 and a k of 1.339, which agree well with the mentioned form of the JSCE. The evaluation of the simulation results in a spatial scheme. For a detailed evaluation, Figure 7 shows five cross sections of the simulated terrain inundation. Sections A and E represent the outside of the protected area to the north and south of Sendai City, respectively. The other sections, Sections A, B, and C, are in the reconstruction area. The evaluations of the sections reveal that the corrected model is closer to the field measurement data than the existing model.

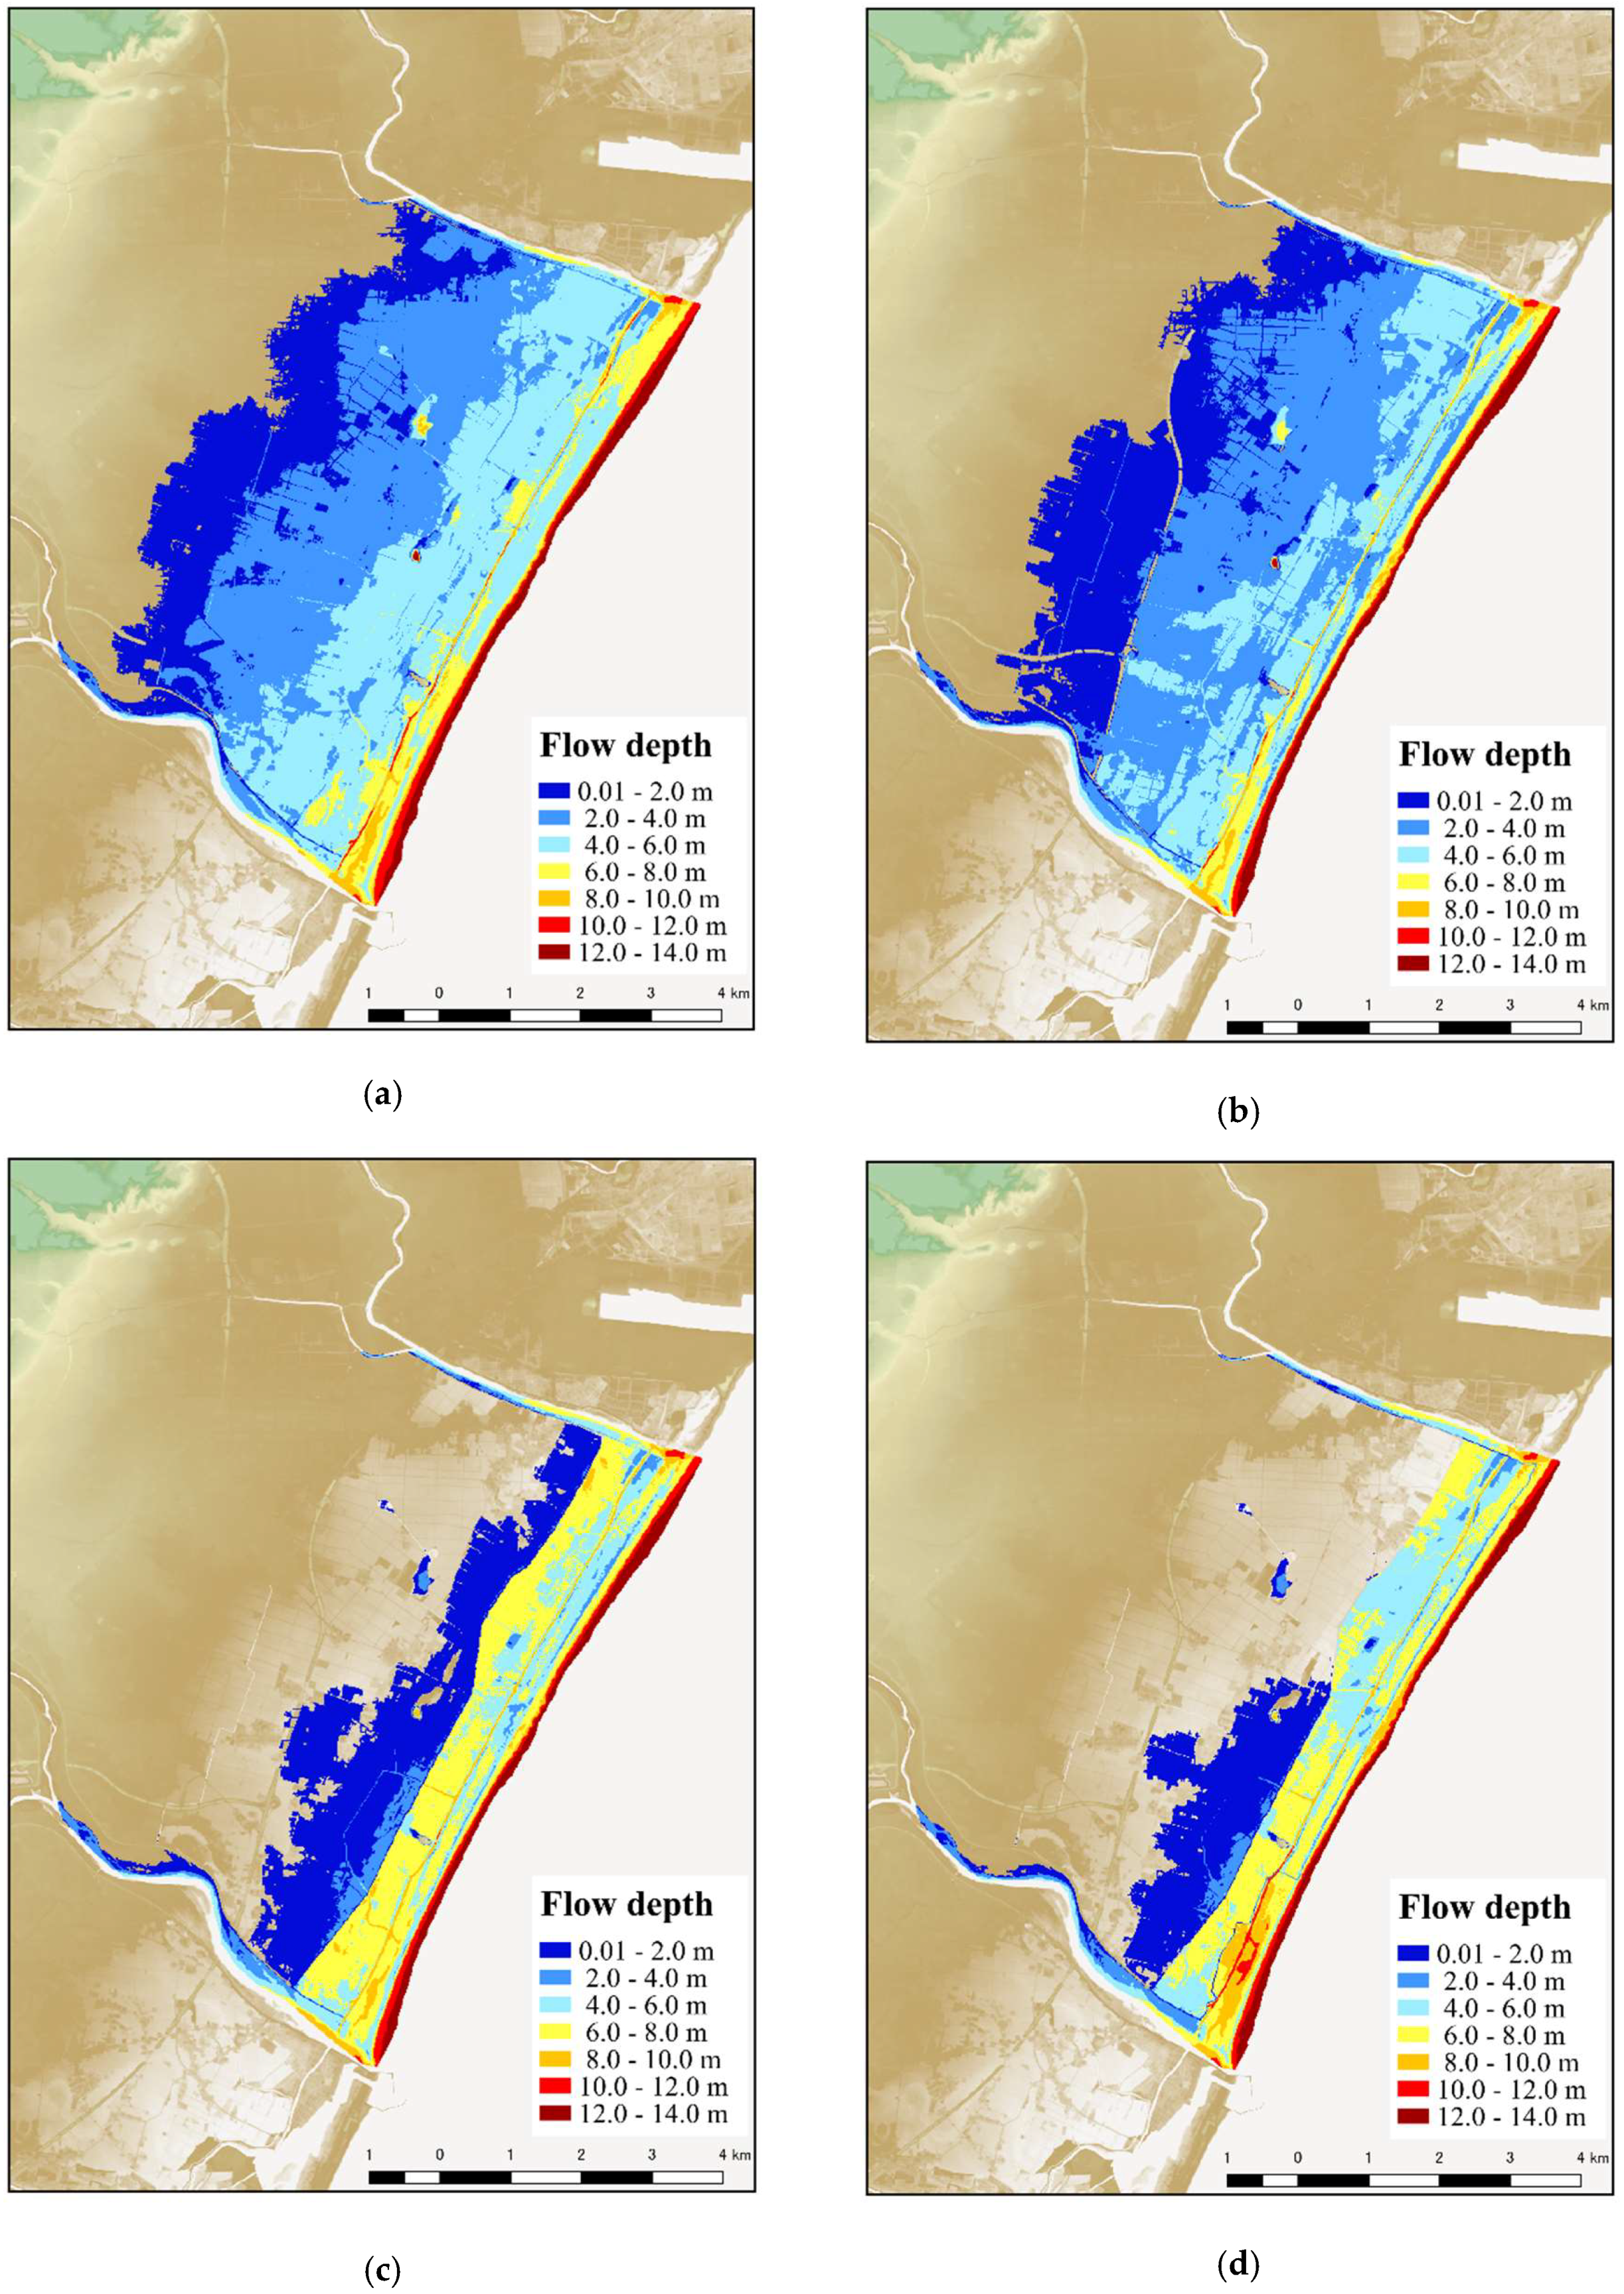
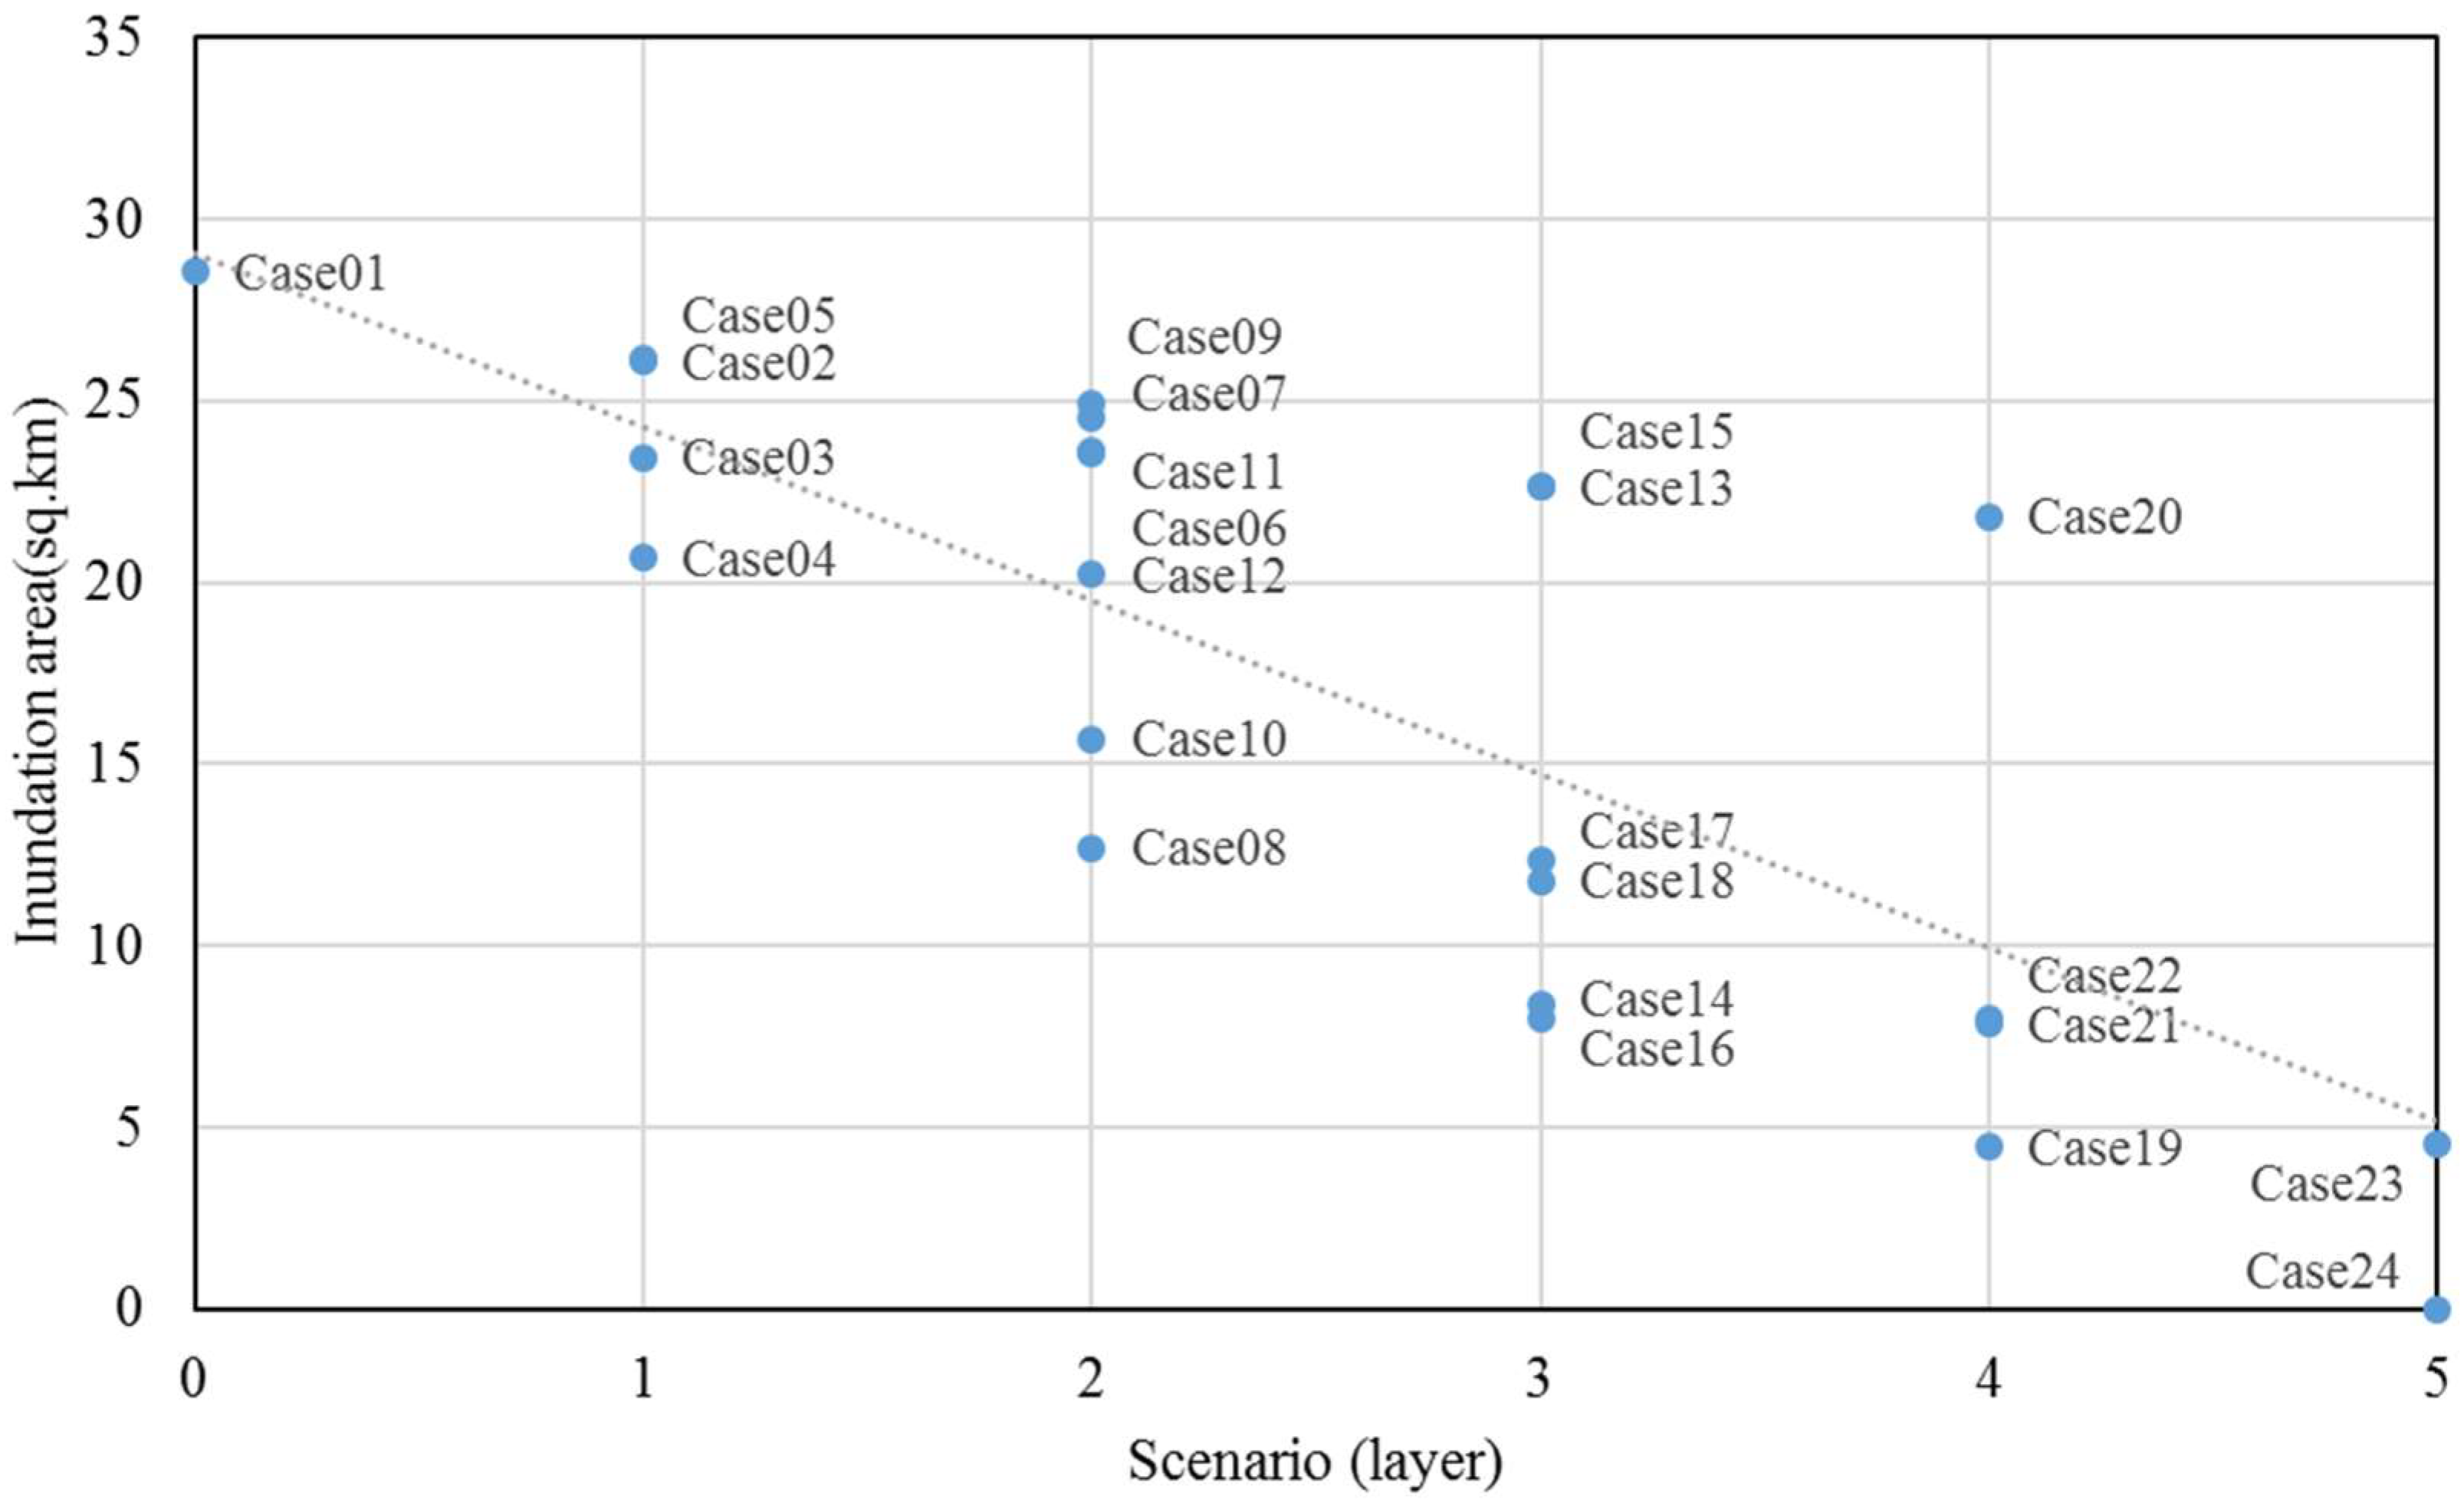
3.2. Inundation Results of the Tsunami Simulation for Each Scenario

The performances of the multilayered structures for tsunami protection were evaluated by the inundation area, flow depth, velocity and arrival time. The simulated results based on the 2011 Great Tsunami were derived from 24 cases of different geometric scenarios of tsunami protection. The inundation results for some cases are shown in Figure 8 as a spatial map. The number of inundation areas at each depth and the ranges of the areas are shown in Table 2 and are separated into 5 classes. These classes are based on the prevention area represented in Figure 1, and the inundation area within the prevention boundary is shown in Figure 9 with each combination scenario.
The first scenario is a scheme of 0 layers, presenting a no-structure approach to tsunami protection, wherein the single case is termed case 01. Case 01 is the base case used to evaluate the protective structure cases. The terrain of this case is based on the existing terrain model, which originally included existing structures such as seawalls and highways, but all of the existing structures are removed using GIS techniques before modeling to reveal the actual tsunami behavior on a natural terrain, which is the same as a no-protection scheme. The results of case 01 show a total inundation area of approximately 28.56 sq. km in the prevention area, of which the inundation depth is mostly in the range of approximately 2.0–4.0 m.
The single tsunami protection scheme is the second scenario. It is based on a structural component of Sendai City, either planned or existing, and has a hypothetical structure of one of 4 cases: a seawall, a greenbelt, an elevated road, or a highway. The objective of this scheme is to reveal the performance of each component of the countermeasure structures in mitigating tsunamis, and their performances are evaluated against the nonstructural scheme. In summary, the inundation area of this scenario varies from 20.0–27.0 sq. km with an average of approximately 24.0 sq. km.
The 7 simulated cases of 2-layer schemes resulted in several sets of data that are explained below. The inundation area of the 2-layer schemes varies from 12.0–25.0 sq. km with a range of approximately 12.5 sq. km. The average inundation area of this scenario is approximately 20.74 sq. km. The maximum value is for case 09, while case 08 has the minimum value. The 3-layer schemes to protect against tsunamis include combining the proposed structures into 6 cases. To summarize this scheme, the inundation area varies from 7.5–23.0 sq. km with a mean of approximately 14.3 sq. km. The 4-component structural combination schemes are divided into 4 cases for their evaluations as tsunami protection. To summarize this scheme, the inundation area varies from 5.0–22.0 sq.km with a mean of approximately 10.54 sq. km.
The two conditions of the 5-component structural combinations are categorized as with and without overflow of the elevated road and represent the full development of Sendai City’s protection against future large tsunamis. The overflow case shows a 24.02 sq. km reduction in the tsunami inundation area. The tsunami does not overflow the elevated road; however, the tsunami wave overflows the elevated road by an average depth of approximately 0.30–1.0 m. The output shows the inundation resulting from the no-overflow case, which reduces the inundation area by 28.56 sq. km relative to that of the nonstructural scheme.

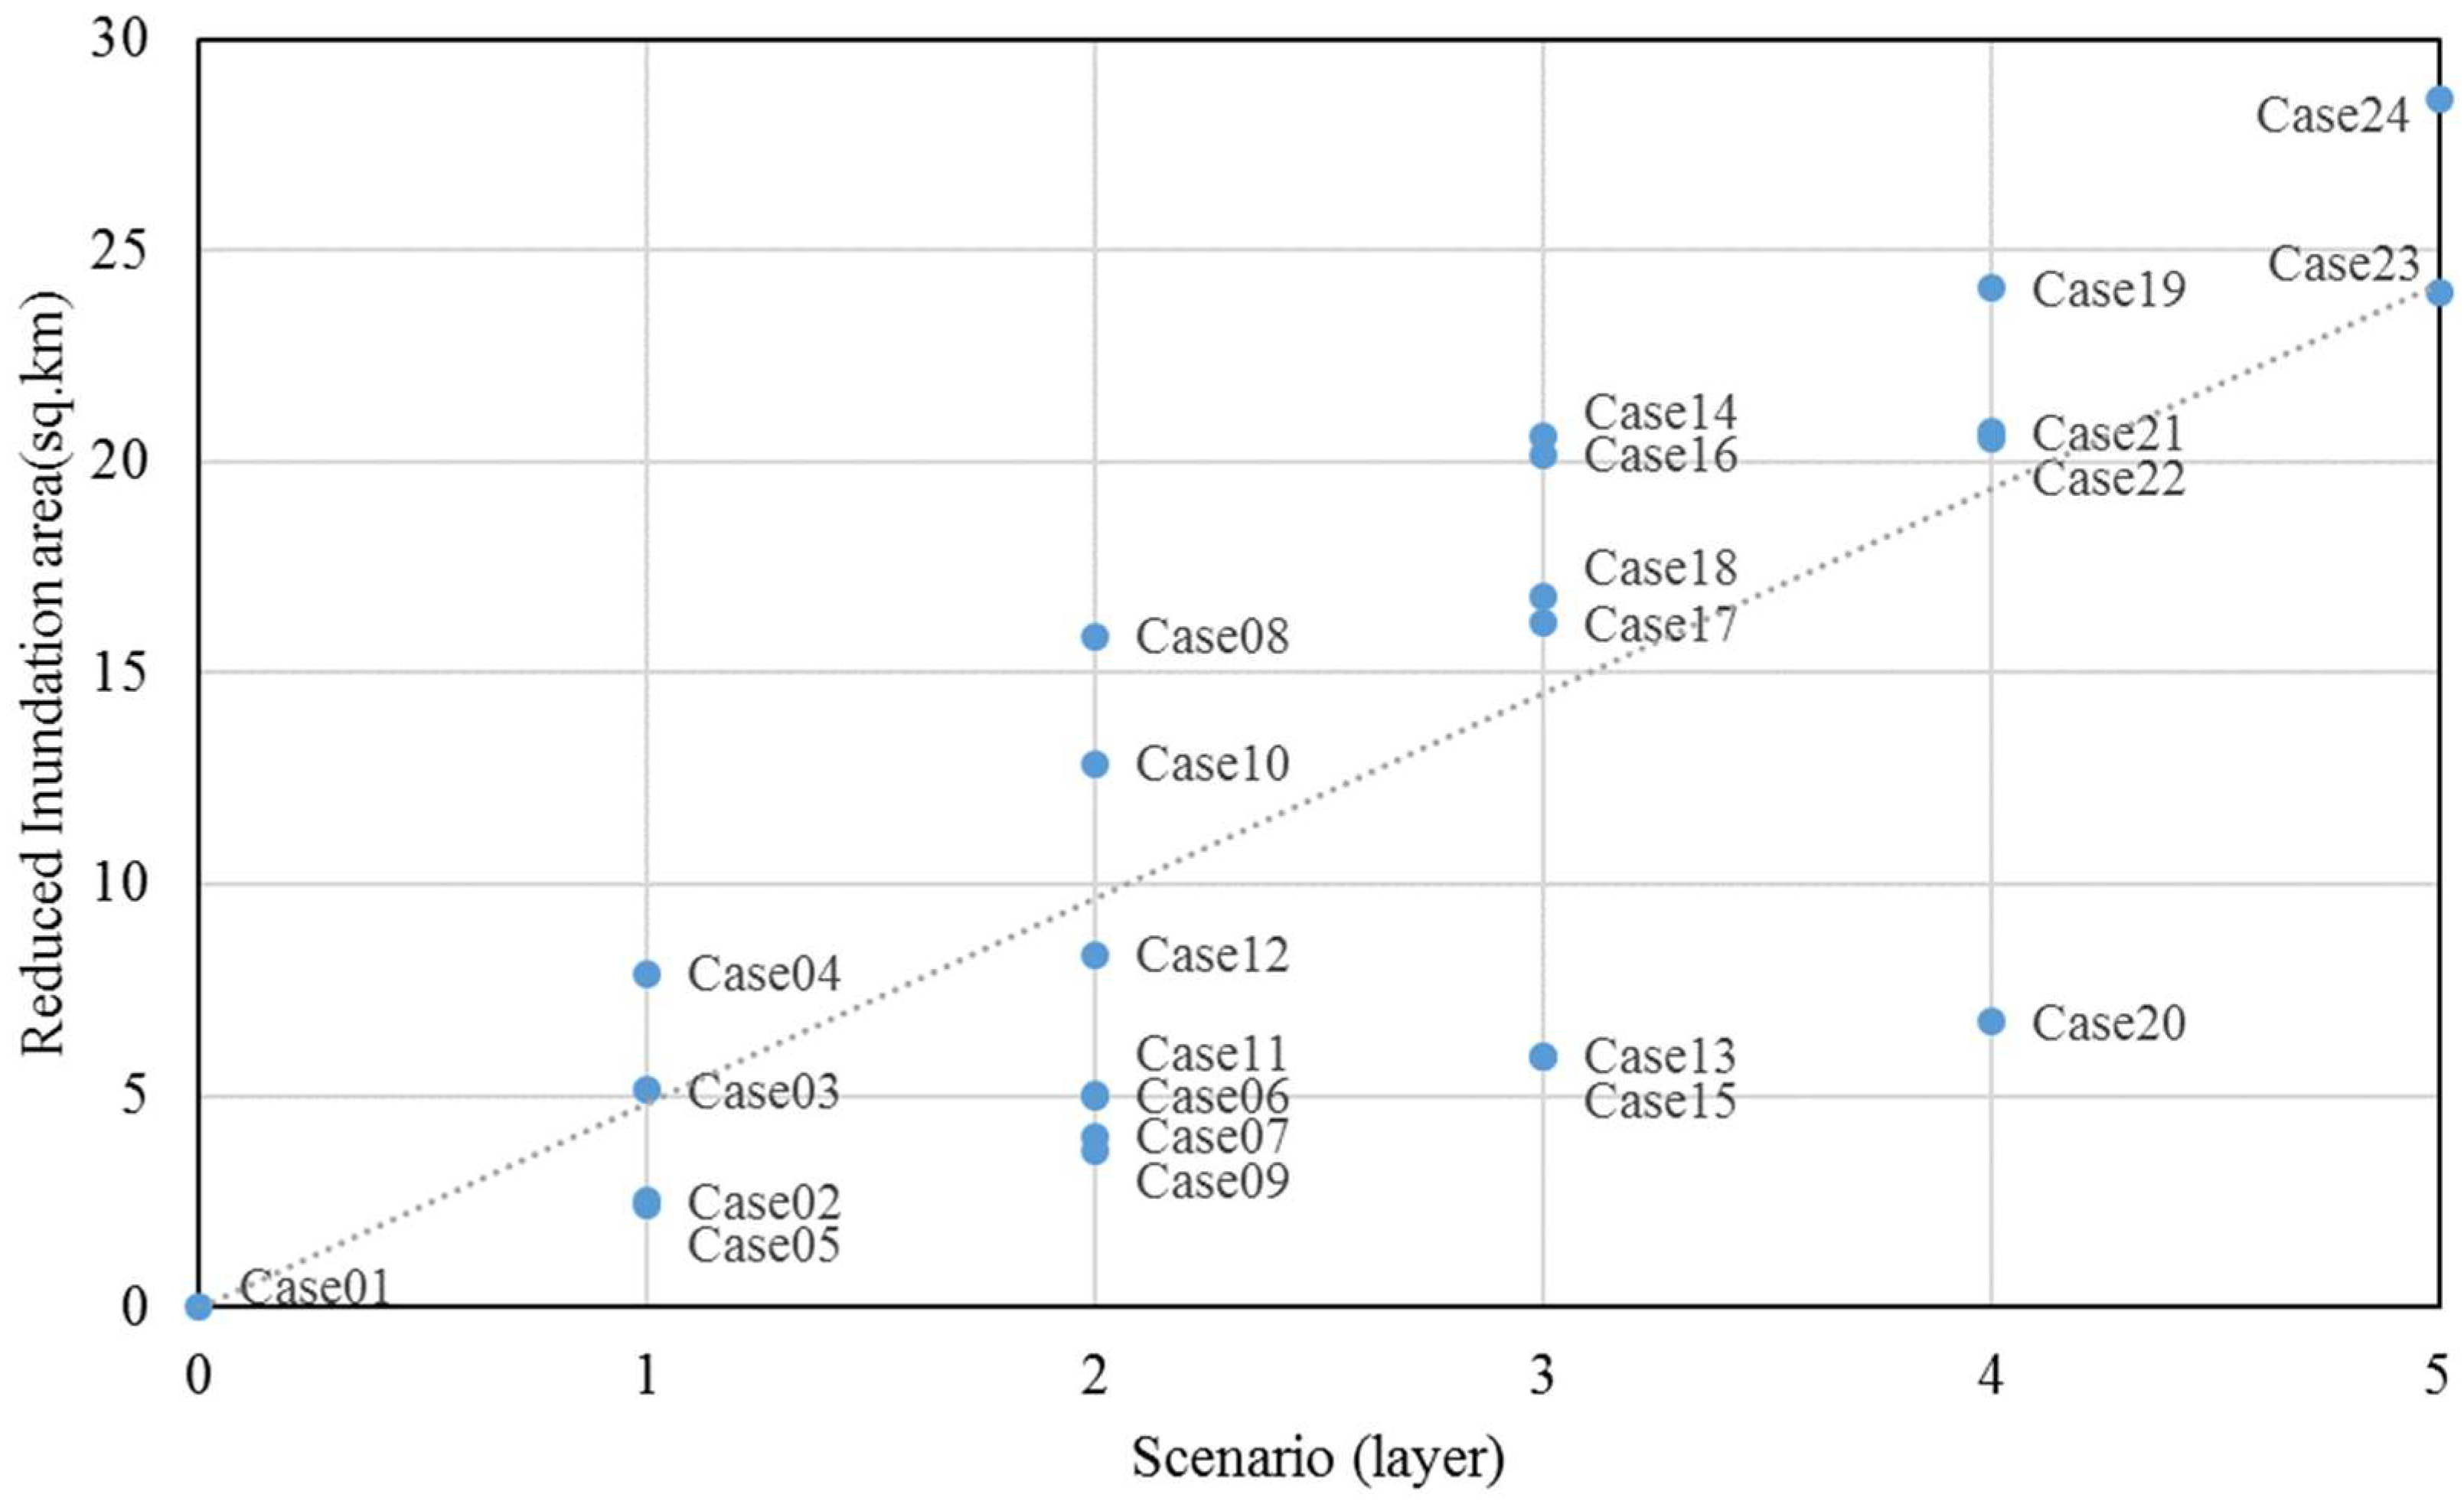
3.3. Performances of Several Combinations of Multilayered Structures

Other results show a significant difference in the inundation of the protected areas for several combinations of structures. The reduced inundation areas were calculated by computing the difference between case 01 and other cases. The performance of each case shown in Figure 10 are based on the reduction of the inundation area compared with the nonstructural case (case 01). Case 04 (with the elevated road) is the highest performing single-structure scheme, while the highest performing 2-layer scheme is case 08 (existing seawall and elevated road). For the 3-layer scenarios, the highest performing case is case 14, which combined the existing seawall, a new seawall, and an elevated road. Case 19 is the combination of the existing seawall, a new seawall, a greenbelt, and an elevated road and has the best performance of the 4-layer scenarios.

3.4. Performances of the Existing and Reconstructed Structural Measures against the 2011 Tsunami

The existing structural system in Sendai City includes 2 structures, the seawall and the highway, as in case 09 of this study. However, after the 2011 Great Tsunami occurred, Sendai City identified a plan to protect against large tsunamis in the future, which is presented in Figure 1 as case 23 in this study. To show the performance of the Sendai City plan, several cases were compared, showing that case 23 result in a reduction of the tsunami inundation area over the existing structural conditions (case 09), which is equivalent to approximately 20.35 sq. km. In the Sendai City plan, hills in the park in the greenbelt region are used as safety areas when facing tsunamis; thus, the result of case 23 can be used to recommend the hill height. The hill’s height is recommended to be higher than 6.0 m in the northern area of the greenbelt, while in the southern area, the height is recommended to be higher than 8.0 m.

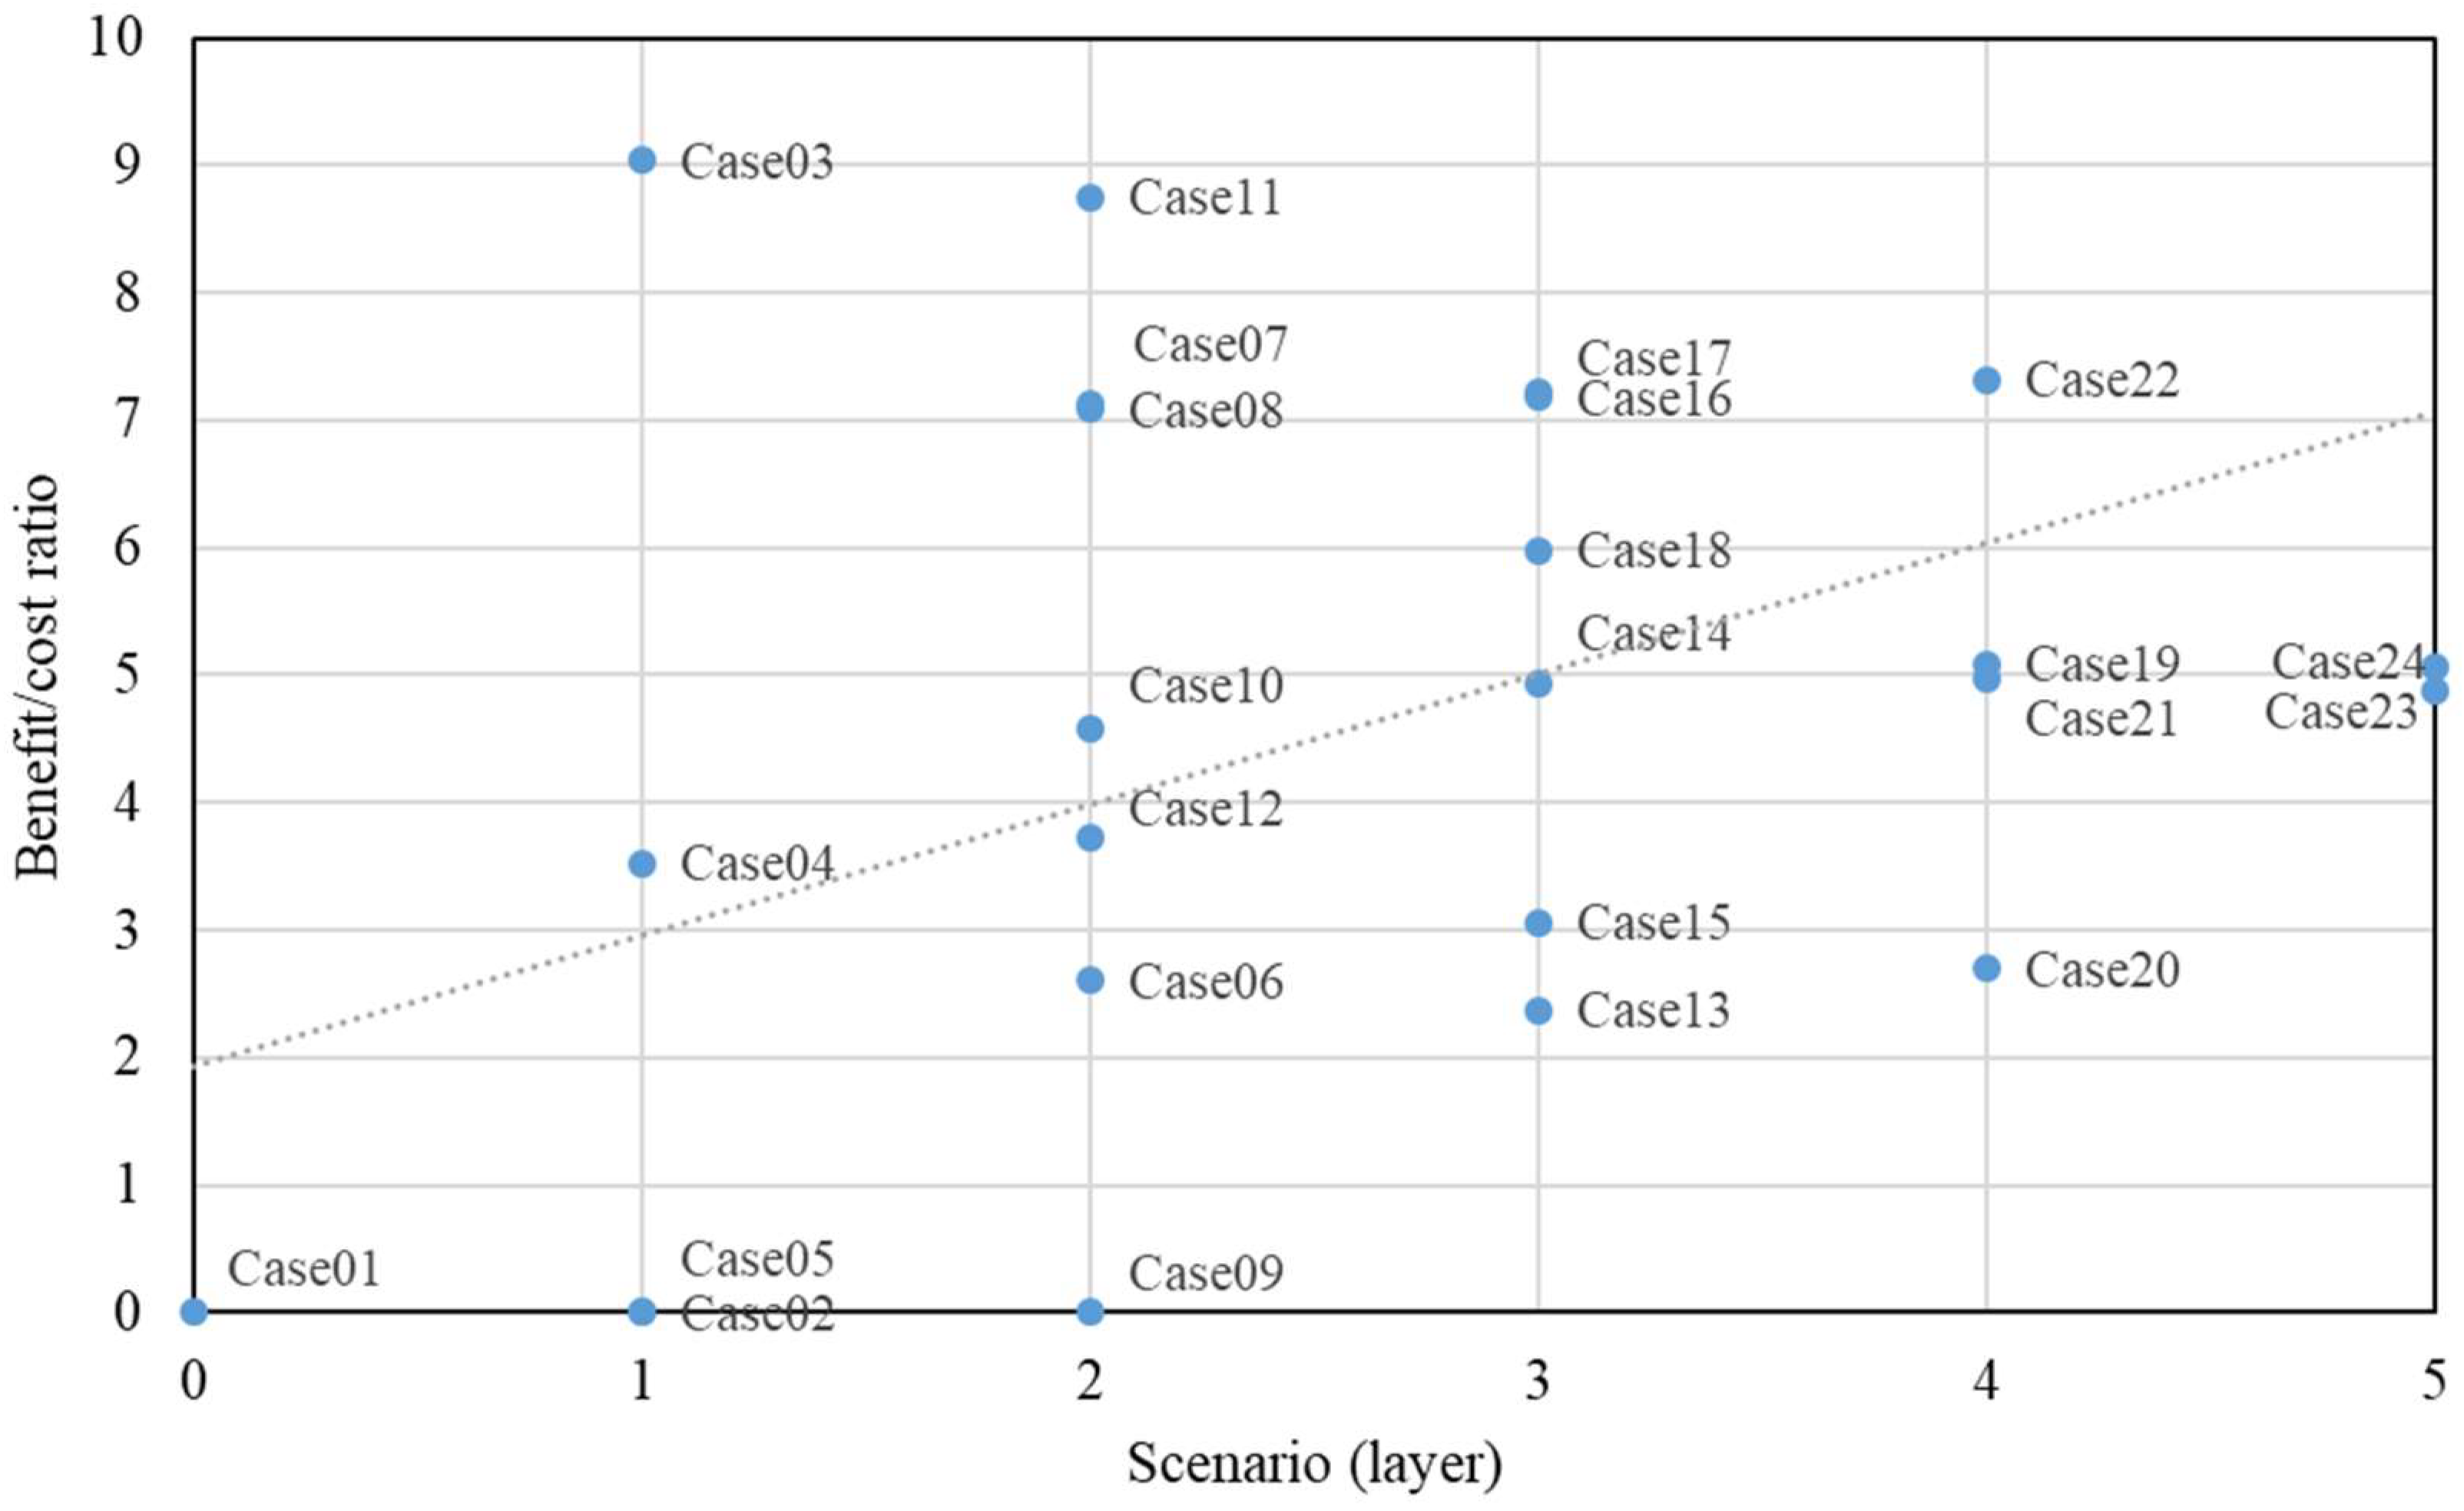
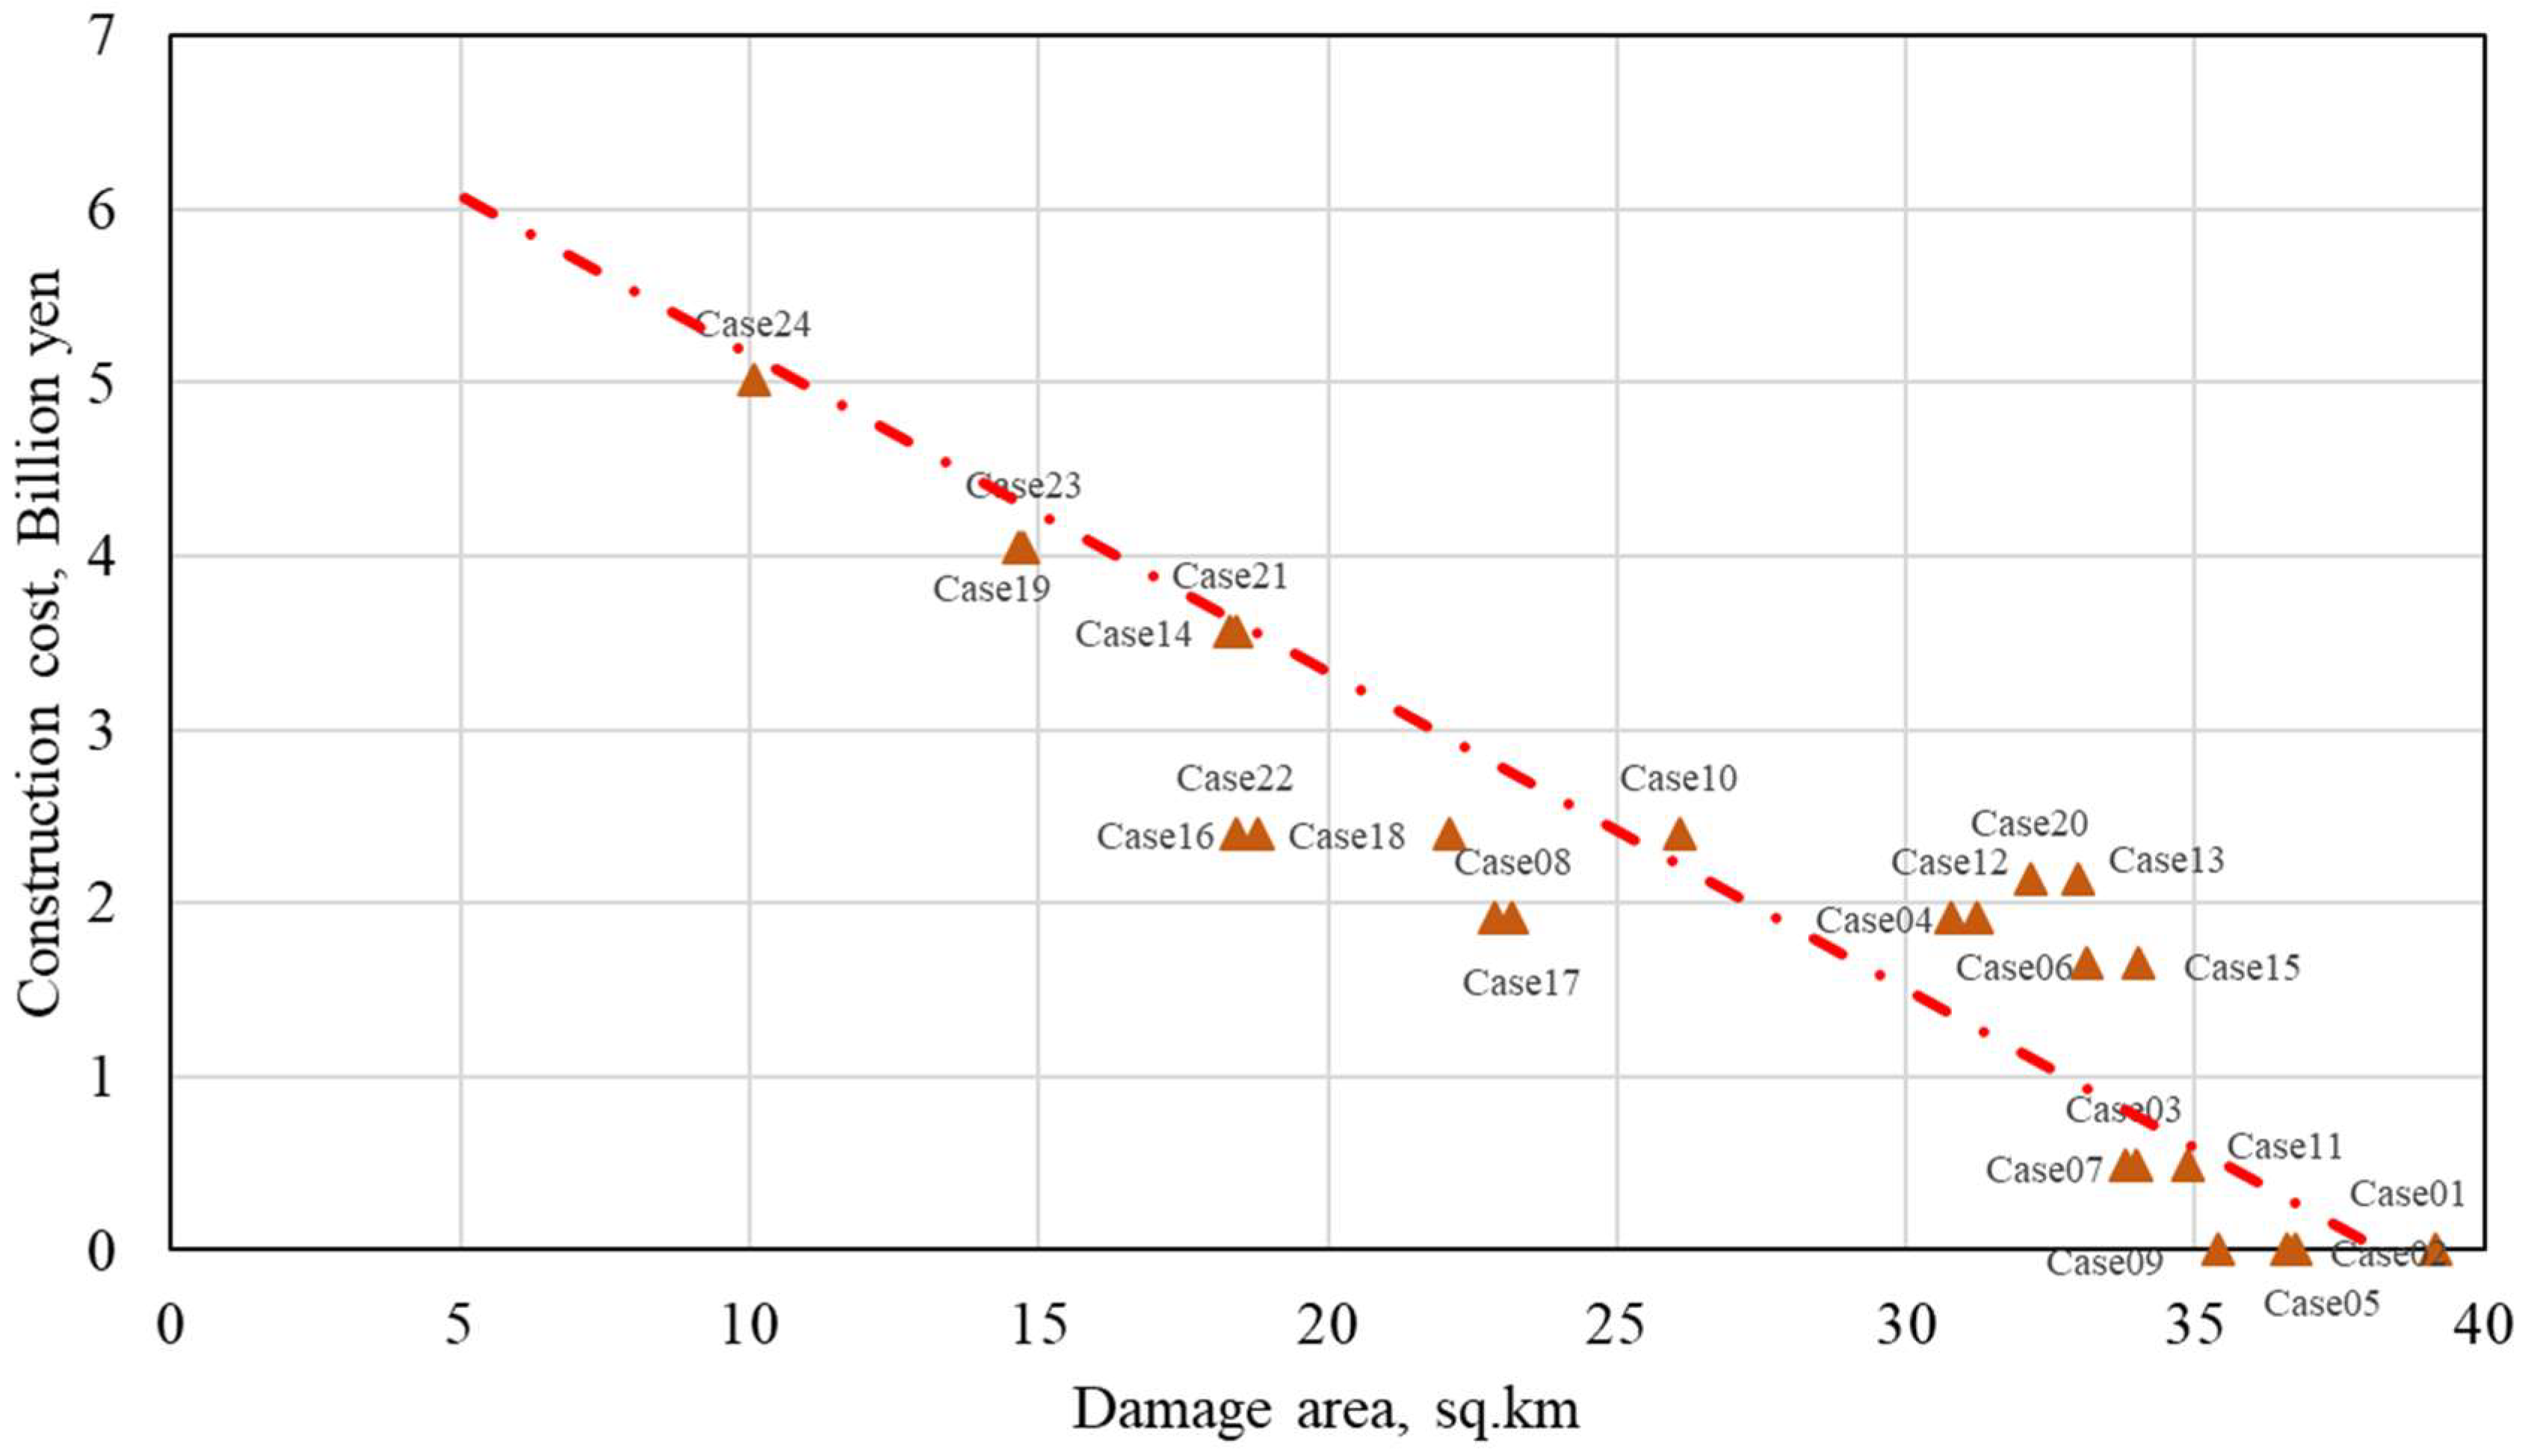
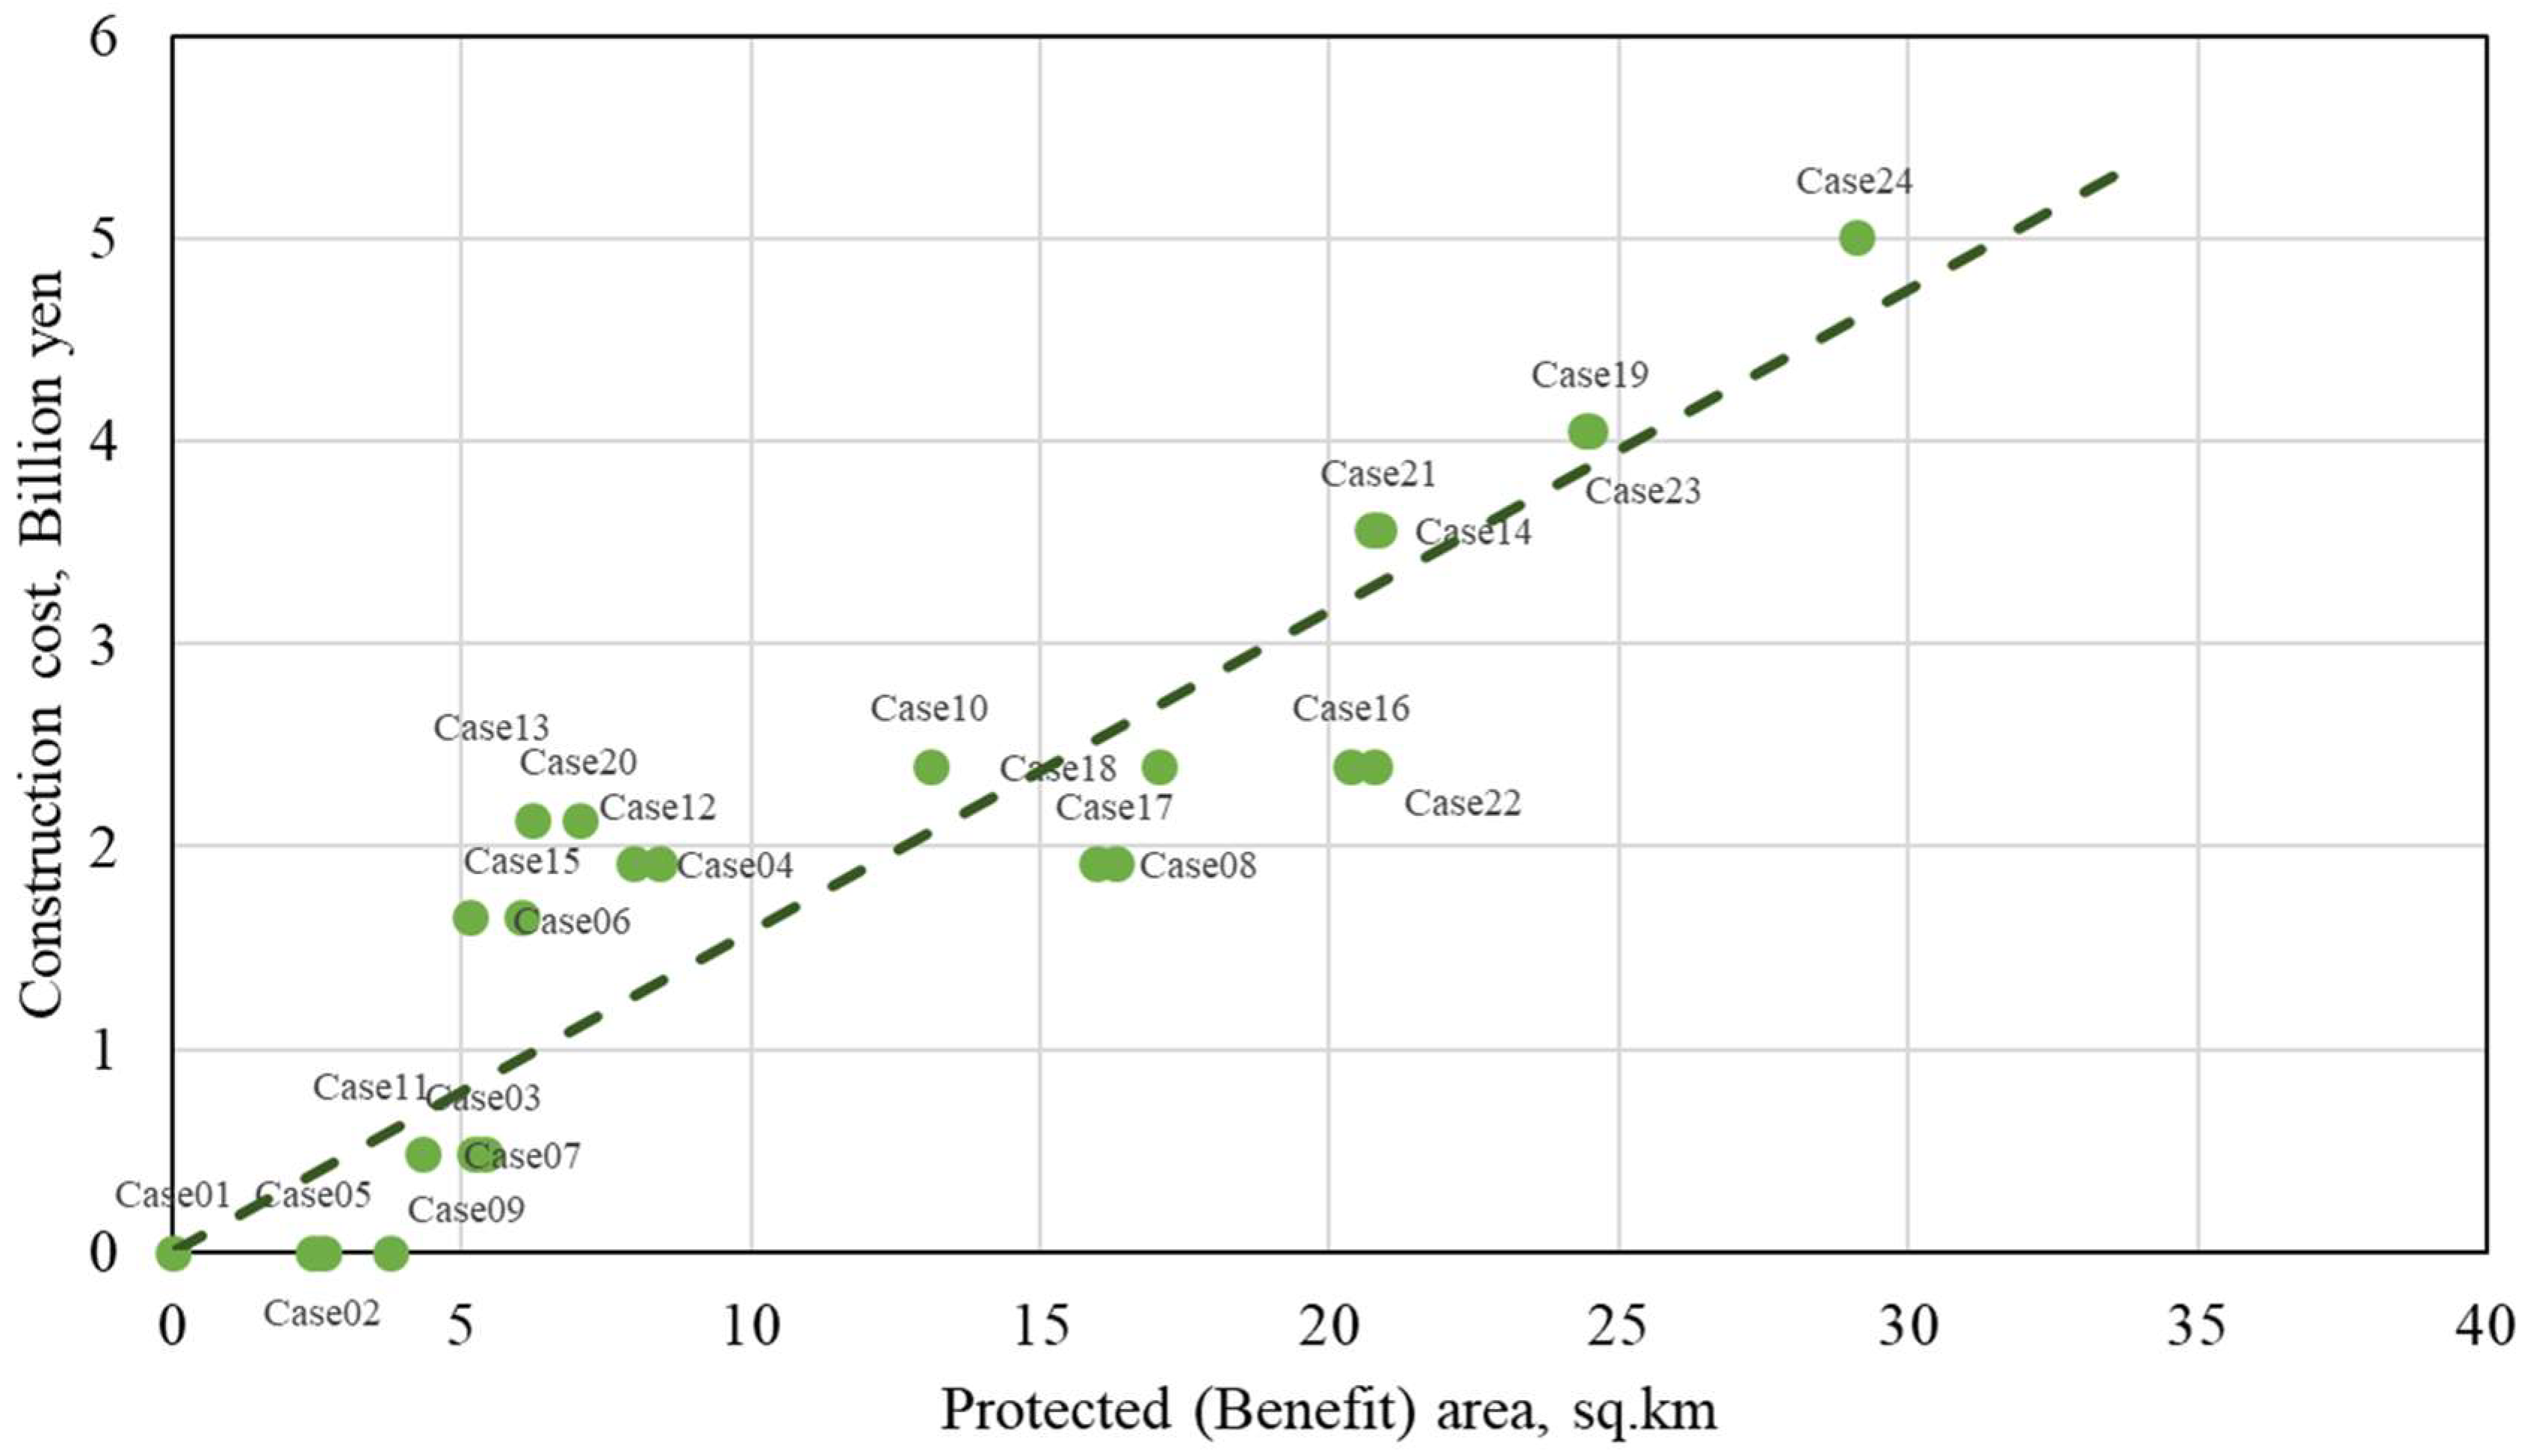
3.5. Construction Cost Perspectives of the Multilayered Countermeasures

The construction costs for the 3 structures (the seawall, greenbelt, and road) are the costs for reconstructing and introducing new components to protect against future tsunami disasters in Sendai City. The construction costs are based on the established materials needed for Sendai City to construct the elevated road, which assumes either a unit length or a unit area. The construction cost of the elevated road is a base cost required to estimate the construction costs of the other structures, such as the highway and seawall. The elevated road cost is approximately 1.92 billion yen for a length of 10.2 km [28]. The construction material is assumed to have 2 components: the cost of building up the earth and road and the manpower cost, which is assumed to account for approximately 75% of the material cost. The assumptions used to estimate the construction cost above is used for the other structures, such as the seawall and the highway. Table 3 shows the cost of the 3 structures in which the unit cost is based on the material cost of the elevated road. The cost of each structure is used to calculate the construction cost for each protection case. Figure 11 shows the construction cost in each case within the scenario groupings.
The economic value of the Tohoku region can be obtained from the Research and Statistics Department Minister’s Secretariat Ministry of Economy, Trade and Industry (METI), Japan. The total economic cost is approximately 57,267 billion yen for the total area of approximately 66,890 sq. km for the Tohoku area [40]. Given that, the economic unit area cost is approximately 0.856 billion yen per sq. km, a value that can be used to estimate the benefit of protection. Figure 12 presents the benefit/cost analysis (BCA) for each method of protecting Sendai City. The construction cost is estimated using the unit cost and the quantity of units. The benefit can be estimated by the reduction of the inundation area (protected area) plus the economic unit area cost. The BCA index can be estimated by the cost of the protected area divided by the construction cost. The trend of the BCA index for tsunami protection is increased when the number of protected lines (scenarios) increases. Thus, the layers of protection have an effect on the tsunami behavior that is reflected in the BCA.

3.6. Performance of Multilayered Structures from an Economic Construction Cost Perspective

Several cases used to protect against tsunamis have provided 2 different results: those of the tsunami inundation area (damaged area) on the demand side and those of the protected area (reduction area from the nonstructural case) on the supply side. Figure 13 shows the relationship between the tsunami inundation area and the construction costs. The relationship trend decreases when the damage area increases, leading to a smaller construction cost. The relationship between the protected area and the construction cost is shown in Figure 14. The trend increases when the protected area and the construction costs increase. The optimum point is the recommended balance between the damaged and benefited areas for the optimization of the protections against tsunamis in Sendai City.
Based on the results mentioned above, the performance of large numbers of components, such as in the 5-layer scenarios, have higher efficiencies than those of other numbers of layers, on average. However, certain cases, such as the 5-layer case 23 and the 4-layer case 19, have the same performance in protecting against tsunamis, and several cases have the same results. The optimum point to consider is an important key to identifying the best scenario for tsunami prevention. To determine the best multilayer scenario, finding the equilibrium point between demand and supply in an economic sense is required. The equilibrium point can be determined by using the cost and quantity domain, and the point can be presented as the intersection point between the demand and supply curves [41,42,43]. For this study, the demand side is the damage-cost curve, while the supply is the protection-cost curve. Figure 15 shows the interaction between the damage costs and the protection costs, showing the optimization of the investment with respect to potential damage. The equilibrium value is approximately 5–6 billion yen for construction costs. Of the 24 cases considered, 2 cases are in the equilibrium zone: the 4-layer scenarios of case 21 (existing seawall + new seawall + elevated road + highway) and case 22 (existing seawall + greenbelt + elevated road + highway). A comparison of both cases based on the performance of the protected area in Figure 10 and the BCA presented in Figure 12 indicates that the optimum case is case 22. Thus, the results of case 22 of the 4-layer scenario reveal that the inclusion of the greenbelt has a better performance in protecting against tsunamis in Sendai City, reflecting this structure’s performance in the single-layer scenarios mentioned above.

4. Conclusions

The present study investigated the performance of structural countermeasures of Sendai City in the face of the tsunami on 11 March 2011, and assessed the performance of multilayer structural countermeasures for future tsunami mitigation. The tsunami source model was calculated using the 10 subfaults based on the Tohoku University fault parameters (V. 1.2). The 10-subfault model was evaluated with the recorded water levels collected by the TTJS group, using the mean ratio bias correction to calibrate the initial water level. The TUNAMI-N2 model resulted in several inundation datasets from 24 cases based on 5 scenarios of structural combination: no structure, a seawall, a greenbelt, an elevated road or a highway.
The results of the tsunami modeling demonstrate significant differences in tsunami inundations when evaluating several combinations of structures. The elevated road (case 04) provides the highest performance of the single schemes, whereas the highest performance of the 2-layer schemes is the combination of an existing seawall and an elevated road (case 09). For the 3-layer scenario, the highest performance is case 14, which is the grouping of an existing seawall, a new seawall, and an elevated road. The combination of an existing seawall, a new seawall, a greenbelt and an elevated road (case 19) is the highest performing 4-layer scenario. The 5-layer scenario reduces the tsunami inundation area by 20 sq. km via existing structural conditions. Finally, a demand/supply curve was applied to determine the optimum combination of structures that can protect Sendai City against tsunamis. The best solution indicates that the combination of the existing seawall, a greenbelt, an elevated road and a highway (case 22) in the 4-layer scenario would provide optimal protection to the city from tsunamis similar to the 2011 Great Tsunami.
The results of this study are limited by the inundation values estimated from the TUNAMI-N2 model. To study the tsunami, there are several required variables, such as the traveling time of the tsunami wave, its duration and peak, and the ranges of the inundation depths. For cost estimations, the construction cost was estimated by the unit cost to demonstrate the performance of the prevention structures, but these structures have several other costs in real applications. In future work, the arrival time, duration and peak times can be used to identify the performance of the prevention structures in the face of tsunami disasters. Finally, the results of this study can be used to evaluate tsunami protection and mitigation schemes with a countermeasure methodology.

Author Contributions

K.P., A.S. and F.I. contributed to the implementation of the research, analysis of the results and writing of the manuscript.

Acknowledgments

The observational data used to calibrate and verify the tsunami models of the 2011 Great Tsunami in Japan were provided by TTJS. This research was funded by the Willis Research Network (WRN) under the Pan-Asian/Oceanian tsunami risk modeling project through the International Research Institute of Disaster Science (IRIDeS) at Tohoku University.

Conflicts of Interest

The authors declare no conflict of interest.

References

  1. Geospatial Information Authority of Japan (GSI). Available online: http://www.gsi.go.jp/ (accessed on 14 March 2011).
  2. Koshimura, S.; Hayashi, S.; Gokon, H. The impact of the 2011 Tohoku earthquake tsunami disaster and implications to the reconstruction. Soils Found. 2014, 54, 560–572. [Google Scholar] [CrossRef]
  3. Mori, N.; Takahashi, T. The 2011 Tohoku Earthquake Tsunami Joint Survey Group. Nationwide post event survey and analysis of the 2011 Tohoku earthquake tsunami. Coast. Eng. J. 2012, 54, 125001. [Google Scholar] [CrossRef]
  4. Lacharote, P.; Leelawat, N.; Suppasri, A.; Thamarax, P.; Imamura, F. Estimation of fatality ratios and investigation of influential factors in the 2011 Great East Japan Tsunami. Int. J. Disaster Risk Reduct. 2017, 29, 37–54. [Google Scholar] [CrossRef]
  5. Suppasri, A.; Koshimura, S.; Imai, K.; Mas, E.; Gokon, H.; Muhari, A.; Imamura, F. Damage characteristic and field survey of the 2011 Great East Japan tsunami in Miyagi prefecture. Coast. Eng. J. 2012, 54, 1250005. [Google Scholar] [CrossRef]
  6. National Police Agency. Report of the Damage Caused by the 2011 Tohoku Earthquake and Tsunami. Available online: http://www.npa.go.jp/archive/keibi/biki/higaijokyo.pdf (accessed on 9 December 2016). (In Japanese)
  7. Ministry of Finance Japan, 2011. Japan’s Fiscal Condition. Available online: www.mof.go.jp/english/budget/budget/ (accessed on 20 December 2011).
  8. Ministry of Land, Infrastructure, Transport and Tourism (MLIT). 2011. Available online: http://www.mlit.go.jp/common/000138154.pdf (accessed on 3 March 2014).
  9. Liu, P.L.F.; Cho, Y.S.; Yoon, S.B.; Seo, S.N. Numerical Simulation of the 1960 Chilean Tsunami Propagation and Inundation as Hilo, Hawaii; Recent Development in Tsunami Research; Kluwer Academic Publishers: Dordrecht, The Netherlands, 1994; pp. 99–115. [Google Scholar]
  10. Liu, P.L.F.; Woo, S.B.; Cho, Y.S. Computer Programe for Tsunami Propagation and Inundation; Technical Report; Cornell University: Ithaca, NY, USA, 1998. [Google Scholar]
  11. Titov, V.; Synolakis, C.E. Numerical Modeling of Tidal Wave Run-up. J. Waterw. Port Coast. Ocean Eng. 1998, 124, 157–171. [Google Scholar] [CrossRef]
  12. Imamura, F. Review of tsunami simulation with a finite difference method. In Long-Wave Runup Models; World Scientific Pub Co Inc.: Singapore, 1995; pp. 25–42. [Google Scholar]
  13. Jais wal, R.K.; Singh, A.P.; Rastogi, B.K. Simulation of the Arabian Sea tsunami propagation generated due to 1945 Makran earthquake and its effect on the western parts of Gujarat, India. Nat. Hazards 2008, 48, 245–248. [Google Scholar] [CrossRef]
  14. Usha, T.; Ramana Murthy, M.V.; Murthy, N.T.; Murty, T.S. Vulnerability Assessment of Car Nicobar to Tsunami Hazard using Numerical Model. Sci. Tsunami Hazards 2009, 28, 15–34. [Google Scholar]
  15. Chenthamil Selvan, S.; Kankara, R.S. Tsunami model simulation for 26 December 2004 and its effect on Koodankulam region of Tamil Nadu Coast. Int. J. Ocean Clim. Syst. 2016, 7, 62–69. [Google Scholar] [CrossRef]
  16. Koshimura, S.; Oie, T.; Yanagisa, H.; Imamura, F. Developing fragility curves for tsunami damage estimation using numerical and post-tsunami data from Banda Aceh, Indonesia. Coast. Eng. J. 2009, 51, 234–273. [Google Scholar] [CrossRef]
  17. Yamashita, K.; Sugawara, D.; Takahashi, T.; Imamura, F.; Saito, Y.; Imato, Y.; Kai, T.; Uehara, H. Numerical simulation of large-scale sediment transport caused by the 2011 Tohoku Earthquake Tsunami in Hirota Bay, Southern Sanriku Coast. Coast. Eng. J. 2016, 58, 1640015. [Google Scholar] [CrossRef]
  18. Sugawara, D.; Goto, K. Numerical modeling of the 2011 Tohoku-oki tsunami in the offshore and onshore of Sendai Plain, Japan. Sediment. Geol. 2012, 282, 110–123. [Google Scholar] [CrossRef]
  19. Oishi, Y.; Imamura, F.; Sugawara, D. Near-field tsunami inundation forecast using the parallel TUNAMI-N2 model: Application to the 2011 Tohoku-Oki earthquake combined with source inversions. Geophys. Res. Lett. 2015, 42, 1083–1091. [Google Scholar] [CrossRef]
  20. Sato, S. Characteristics of the 2011 Tohoku Tsunami and introduction of two level tsunamis for tsunami disaster mitigation. Proc. Jpn. Acad. Ser. B Phys. Biol. Sci. 2015, 91, 262–272. [Google Scholar] [CrossRef] [PubMed]
  21. Vana Tsimopoulou, J.K.V.; Sebastiaan, M.K.; Jonkman, N. Cost-Efficient Design of Multilayer Safety Systems against Large-Scale Coastal Disasters, 1st ed.; Elsevier Inc.: Oxford, UK, 2015. [Google Scholar]
  22. Tsimopoulou, V.; Jonkman, S.N.; Kolen, B.; Maaskant, B.; Mori, N.; Yasuda, T. A multi-layered safety perspective on the tsunami disaster in Tohoku, Japan. In Proceedings of the Flood Risk 2012 Conference, Rotterdam, The Netherlands, 19–23 November 2012; pp. 1–10. [Google Scholar]
  23. Khew, Y.T.J.; Jarzebski, M.P.; Dyah, F.; San Carlos, R.; Gu, J.; Esteban, M.; Aránguiz, R.; Akiyama, T. Assessment of social perception on the contribution of hard-infrastructure for tsunami mitigation to coastal community resilience after the 2010 tsunami: Greater Concepcion area, Chile. Int. J. Disaster Risk Reduct. 2015, 13, 324–333. [Google Scholar] [CrossRef]
  24. Takagi, H.; Bricker, J.D. Assessment of the effectiveness of general breakwaters in reducing tsunami inundation in Ishinimaki. Coast. Eng. J. 2014, 56, 1–21. [Google Scholar] [CrossRef]
  25. Samawasekara, R.S.M.; Sasaki, J.; Esteban, M. Assessment of the co-benefits of structures in coastal areas for tsunami mitigation and improving community resilience in Sri Lanka. Int. J. Disaster Risk Reduct. 2015, 13, 324–333. [Google Scholar] [CrossRef]
  26. Suppasri, A.; Latcharote, P.; Bricker, J.D.; Leelawat, N.; Hayashi, A.; Yamashita, K.; Makinoshima, F.; Roeber, V.; Imamura, F. Improvement of tsunami countermeasures based on lessons from the 2011 great east japan earthquake and tsunami -Situation after five years. Coast. Eng. J. 2016, 58, 1640011. [Google Scholar] [CrossRef]
  27. Strusińska-Correia, A. Tsunami mitigation in Japan after the 2011 Tōhoku Tsunami. Int. J. Disaster Risk Reduct. 2017, 22, 397–411. [Google Scholar] [CrossRef]
  28. Sendai City, Sendai City Earthquake Disaster Reconstruction Plan, Digest Version. Available online: https://www.city.sendai.jp/shinsaifukko/shise/daishinsai/fukko/kanren/kekaku/documents/english14511_cover-p2.pdf (accessed on 5 February 2018).
  29. Okada, Y. Surface deformation due to shear and tensile faults in a half-space. Bull. Seismol. Soc. Am. 1985, 75, 1135–1154. [Google Scholar]
  30. Imamura, F.; Koshimura, S.; Murashima, Y.; Akita, Y.; Shintani, Y. The Tsunami Source Model of the 2011 Tohoku Earthquake (ver.1.2). Available online: http://www.tsunami.civil.tohoku.ac.jp/hokusai3/J/events/tohoku_2011/model/dcrc_ver1.2.pdf (accessed on 25 April 2012).
  31. The 2011 Tohoku Earthquake Tsunami Joint Survey (TTJS) Group. Nationwide field survey of the 2011 off the Pacific coast of Tohoku earthquake tsunami. J. Jpn. Soc. Civ. Eng. 2011, 67, 63–66. [Google Scholar]
  32. Aida, I. Reliability of a tsunami source model derived from fault parameters. J. Phys. Earth 1978, 26, 57–73. [Google Scholar] [CrossRef]
  33. Suppasri, A.; Koshimura, S.; Imamura, F. Developing tsunami fragility curves based on the satellite remote sensing and the numerical modeling of the 2004 Indian Ocean tsunami in Thailand. Nat. Hazards Earth Syst. Sci. 2011, 11, 173–189. [Google Scholar] [CrossRef]
  34. Ines, A.V.M.; Hansen, J.W. Bias correction of daily GCM rainfall for crop simulation studies. J. Agric. For. Meteorol. 2006, 138, 44–53. [Google Scholar] [CrossRef]
  35. Acharya, N.; Chattopadhyay, S.; Mohanty, U.C.; Dasha, S.K.; Sahooc, L.N. On the bias correction of general circulation model output for Indian Summer Monsoon. J. Meteorol. Appl. 2013, 20, 349–356. [Google Scholar] [CrossRef]
  36. Asadullah, A.; Mcintyre, N.E.I.L.; Kigobe, M.A.X. Evaluation of five satellite products for estimation of rainfall over Uganda. Hydrol. Sci. J. 2010, 53, 1137–1150. [Google Scholar] [CrossRef]
  37. Pakoksung, K. Runoff Analysis Using Satellite Data for Regional Flood Assessment; Spatial and Time Series Bias Correction of Satellite Data. Ph.D. Thesis, Kochi University of Technology, Kami, Japan, 23 September 2016; p. 132. [Google Scholar]
  38. Hayashi, S.; Koshimura, S. The 2011 Tohoku tsunami flow velocity estimation by the aerial video analysis and numerical modeling. J. Disaster Res. 2013, 8, 561–572. [Google Scholar] [CrossRef]
  39. Geospatial Information Authority of Japan (GSI). On Estimation of Flooded Area by the 2011 Tsunami. Available online: www.gsi.go.jp/common/000059939.pdf (accessed on 5 May 2013). (In Japanese)
  40. Research and Statistics Department Minister’s Secretariat, Ministry of Economic, Trade and Industry (METI), Japan. Available online: http://www.meti.go.jp/english/statistics/tyo/tiikiio/index.html (accessed on 5 February 2018).
  41. Leng, L. Health Economic Evaluation: A Primer for Healthcare Professionals. Prim. Health Care 2016, 6, 223. [Google Scholar] [CrossRef]
  42. Locke, J. Some Considerations of the Consequences of Lowering the Interest and Raising the Value of Money. Available online: http://la.utexas.edu/users/hcleaver/368/368LockeSomeConsiderationsAlltable.pdf (accessed on 5 February 2018).
  43. Denham-Steuart, J. Inquiry into the Principles of Political Economy. Published in The Strand. 1767. Available online: https://www.marxists.org/reference/subject/economics/steuart/index.htm (accessed on 27 October 2014).
Figure 1. Actual plans to develop Sendai City tsunami disaster protection in the future: (a) Conceptual plan to develop Sendai City for protection against tsunamis, presented as a profile; (b) Location of Sendai City and the line of tsunami prevention facilities.
Geosciences 08 00173 g001
Figure 2. Bathymetry data to compute tsunami propagation and inundation. (a) The largest modeling domain with a 1215 m grid size. The black boxes represent the grid for smaller domains; (b) The ratios of different grid sizes; (c) The method of inserting the hypothesized infrastructure into the existing mesh.
Geosciences 08 00173 g002aGeosciences 08 00173 g002b
Figure 3. Initial sea floor deformation from the tsunami source based on the Tohoku University Model V. 1.2.
Geosciences 08 00173 g003
Figure 4. Method for calibrating the initial water level based on the mean ratio algorithm.
Geosciences 08 00173 g004
Figure 5. Validation of the water level resulting from the existing initial water level for the tsunami source scenarios: (a) Tsunami inundation extent achieved using the tsunami numerical model based on the Tohoku University Model V. 1.2 (Existing case); (b) Scatter plot between the observed and simulated (existing case) data at the maximum water level. The modeled results reveal that K is approximately 0.874 and k is approximately 1.359.
Geosciences 08 00173 g005aGeosciences 08 00173 g005b
Figure 6. Validation of the water level resulting from the calibrated initial water level of the tsunami source scenario. (a) Tsunami inundation extent achieved with the calibrated initial water level; (b) Scatter plot between the observed and simulated data (calibrated initial water level) at the maximum water level. The modeled results reveal that K is approximately 0.957 and k is approximately 1.339.
Geosciences 08 00173 g006aGeosciences 08 00173 g006b
Figure 7. Validation of the simulation results, existing and calibrated, in a section. (a) Location of Sections A–E, presenting a comparison of the observed and simulated (existing and calibrated) results; (b) Comparison of the results of the observations and simulations in the cross section.
Geosciences 08 00173 g007aGeosciences 08 00173 g007b
Figure 8. Some examples of the inundated regions for different sets of multiple prevention structure conditions: (a) case 01; (b) case 09; (c) case 22; and (d) case 23.
Geosciences 08 00173 g008
Figure 9. Inundation area of each scenario and case for tsunami protection in Sendai City.
Geosciences 08 00173 g009
Figure 10. Evaluating the performances of each case for the protection against tsunamis in Sendai City.
Geosciences 08 00173 g010
Figure 11. Construction costs for each case of tsunami protection in Sendai City.
Geosciences 08 00173 g011
Figure 12. Benefit/cost analysis (BCA) index for each case of tsunami protection in Sendai City.
Geosciences 08 00173 g012
Figure 13. Relationship between the tsunami inundation area and construction costs.
Geosciences 08 00173 g013
Figure 14. Relationship between the protected area (benefit area) and construction costs.
Geosciences 08 00173 g014
Figure 15. Relationship between the protected area (benefit area) and the damaged area, used to identify the optimum point of the multilayer countermeasures for preventing tsunami damage in Sendai City.
Geosciences 08 00173 g015
Table 1. Scenarios for the simulation of the tsunami impact and the corresponding multi-condition protective structures.
ScenarioCaseDescription
0 layer01Non-structure
1 layer02Existing seawall
03Greenbelt
04Elevated road
05Existing highway
2 layers06Existing seawall + New seawall
07Existing seawall + Greenbelt
08Existing seawall + Elevated road
09Existing seawall + Existing highway
10Greenbelt + Elevated road
11Greenbelt + Existing highway elevation
12Elevated road + Existing highway
3 layers13Existing seawall + New seawall + Greenbelt
14Existing seawall + New seawall + Elevated road
15Existing seawall + New seawall + Existing highway
16Existing seawall + Greenbelt + Elevated road
17Existing seawall + Elevated road + Existing highway
18Greenbelt + Elevated road + Existing highway
4 layers19Existing seawall + New seawall + Greenbelt + Elevated road
20Existing seawall + New seawall + Greenbelt + Existing highway
21Existing seawall + New seawall + Elevated road + Existing highway
22Existing seawall + Greenbelt + Elevated road + Existing highway
5 layers23Existing seawall + New seawall + Greenbelt + Elevated road (overflow) + Existing highway
24Existing seawall + New seawall + Greenbelt + Elevated road (no-overflow) + Existing highway
Table 2. Inundation area inside the prevention area for each depth range resulting from different multi-structural conditions.
Scenario (Layer)CaseInundation Area in Each Flow Depth Range, sq. km
0.01–2 m2–4 m4–6 m6–8 m8–10 m
0010.3238.49213.2726.4550.018
1020.27111.56211.9622.2720.000
030.32513.9288.4200.7530.000
040.35812.4567.4970.3510.000
050.3507.8269.2428.6700.045
2060.29013.3799.4540.4240.000
070.24012.90710.2211.1420.000
080.47910.0852.1250.0000.000
090.3169.64611.9852.9440.000
100.60811.1513.9270.0190.000
110.2189.72710.9102.7360.000
120.33611.4918.0330.3510.000
3130.35314.7057.1980.3750.000
140.4336.8550.6910.0000.000
150.25111.92510.0510.4240.000
160.4197.3800.6050.0000.000
170.4319.8172.1250.0000.000
180.3509.6831.7430.0000.000
4190.2184.0240.2290.0000.000
200.30913.7157.5960.2030.000
210.3956.7760.6910.0000.000
220.3737.0800.5470.0000.000
5230.2214.0830.2350.0000.000
240.0000.0000.0000.0000.000
Table 3. The construction cost of three structures to protect Sendai City from a tsunami.
StructureUnit CostQuantityCost (Billion yen)
Elevated road0.19billion yen/km10.20km1.92
New seawall0.14billion yen/km1.65km1.65
Greenbelt1.00million yen/hectare486.00hectare0.49

