Migration and Morphology of Asymmetric Barchans in the Central Hexi Corridor of Northwest China

1
Key Laboratory of Desert and Desertification, Northwest Institute of Eco-environment and Resources, Chinese Academy of Sciences, Lanzhou 730000, China
2
School of Geography and Tourism, Shaanxi Normal University, Xi’an 710119, China
3
Department of Geosciences, University of Cologne, 50969 Cologne, Germany
*
Authors to whom correspondence should be addressed.
Geosciences 2018, 8(6), 204; https://doi.org/10.3390/geosciences8060204
Submission received: 4 May 2018
/
Revised: 30 May 2018
/
Accepted: 1 June 2018
/
Published: 6 June 2018
(This article belongs to the Special Issue Aeolian Processes and Geomorphology)
Abstract
:Crescent-shaped barchan dunes often display an asymmetric shape, with one limb longer than the other. As shown in previous studies, asymmetric bimodal winds constitute one major cause of barchan asymmetry, but the heterogeneous conditions of sand availability or flux, as well as topographic influences, may be also important. Understanding the morphology and dynamics of asymmetric barchans may have an impact in a broad range of areas, particularly as these dunes may serve as a proxy for planetary wind regimes and soil conditions in extraterrestrial environments. However, in addition to the existing theories and numerical models that explain barchan asymmetry, direct measurements of migration rates and morphologic changes of real asymmetric barchans over a time span of several years would be beneficial. Therefore, here we report such measurements, which we have acquired by investigating asymmetric barchans in the Hexi Corridor, northwest of China. We have found that dune interactions and asymmetric influx conditions are the most important causes of barchan asymmetry in this field. Particle size distributions in the Hexi Corridor display strong variations over different parts of the asymmetric barchans, as well as over different dunes, with gravel particles being incorporated from the substrate as the dunes migrate. Our observations have shown that upwind sediment sources are important for dune formation in the Hexi Corridor, and that interdune interactions affect dune shape in different ways, depending on their offset. The asymmetric barchans in the Hexi Corridor are active, with an average migration rate (MR) between 8 and 53 m year−1, in spite of the different asymmetric shapes. Our data for dune migration rates can be described well by a scaling of MR = A/(W + W0), where W is the barchan cross-wind width, A ≈ 2835 m2 s−1, and W0 ≈ 44 m. A similar scaling fits very well the migration rate as a function of dune along-wind width L, (i.e., MR = B/(L + L0), with B ≈ 1722 m2 s−1 and L0 ≈ 13 m). Linear relations are also found between both dune widths and the average limb and windward side lengths, thus indicating that the morphometric relations that are predicted from models for steady-state, symmetric crescent-shaped dunes can be applied to different transitional morphologies of interacting, asymmetric barchans.
1. Introduction
The barchan dune is a common dune type in many deserts of the Earth and it is also widespread on Mars. This dune type has a crescent-shaped morphology with two horns pointing in the wind direction. Barchans often have an asymmetric shape (Figure 1), with one horn longer than the other. As shown in several studies [1,2,3,4], the main reasons for barchan asymmetry are the asymmetric bimodal wind regime, asymmetric upwind flux conditions, barchan collisions, and topography. Understanding the morphology and dynamics of asymmetric barchans is thus important, not only to predict their propagation in areas that are affected by desertification, but also for the planetary science, as these dunes may serve as a proxy for wind behavior and local soil conditions in extraterrestrial environments.
Asymmetric barchans have been mainly investigated through conceptual and numerical models for dune morphology because of the different causes for dune asymmetry [2,3,5,6]. Moreover, numerical modeling provides useful means to studying the long-term dynamics of dunes because of the large time-scales that are involved in their evolution and migration. However, any model for the dynamics of asymmetric barchans must be first of all validated based on field measurements. Bourke [1] reported, for the first time, an estimate for the migration rate of an asymmetric barchan dune in the Namib desert, which was based on the analysis of two satellite images that were obtained within a time span of five years. Since the barchan dynamics are affected by interactions with other dunes and local soil conditions, acquisition of further field data on the migration of asymmetric dunes would be beneficial both to provide models with experimental results for validation and to improve our understanding of these dunes.
Here we report measurements of morphologic changes and migration of asymmetric barchans in the Hexi Corridor of the Gansu province in China, over a time span of 12 years. Various asymmetric barchan shapes occur in this field, and many of them are affected by dune interactions or asymmetric influx conditions. Moreover, particle size distribution varies strongly over different parts of the barchan dunes. All of these factors are important for the dune physics, and the present manuscript discusses their potential role for the barchans in the Hexi Corridor.
2. Method and Materials
2.1. Study Area
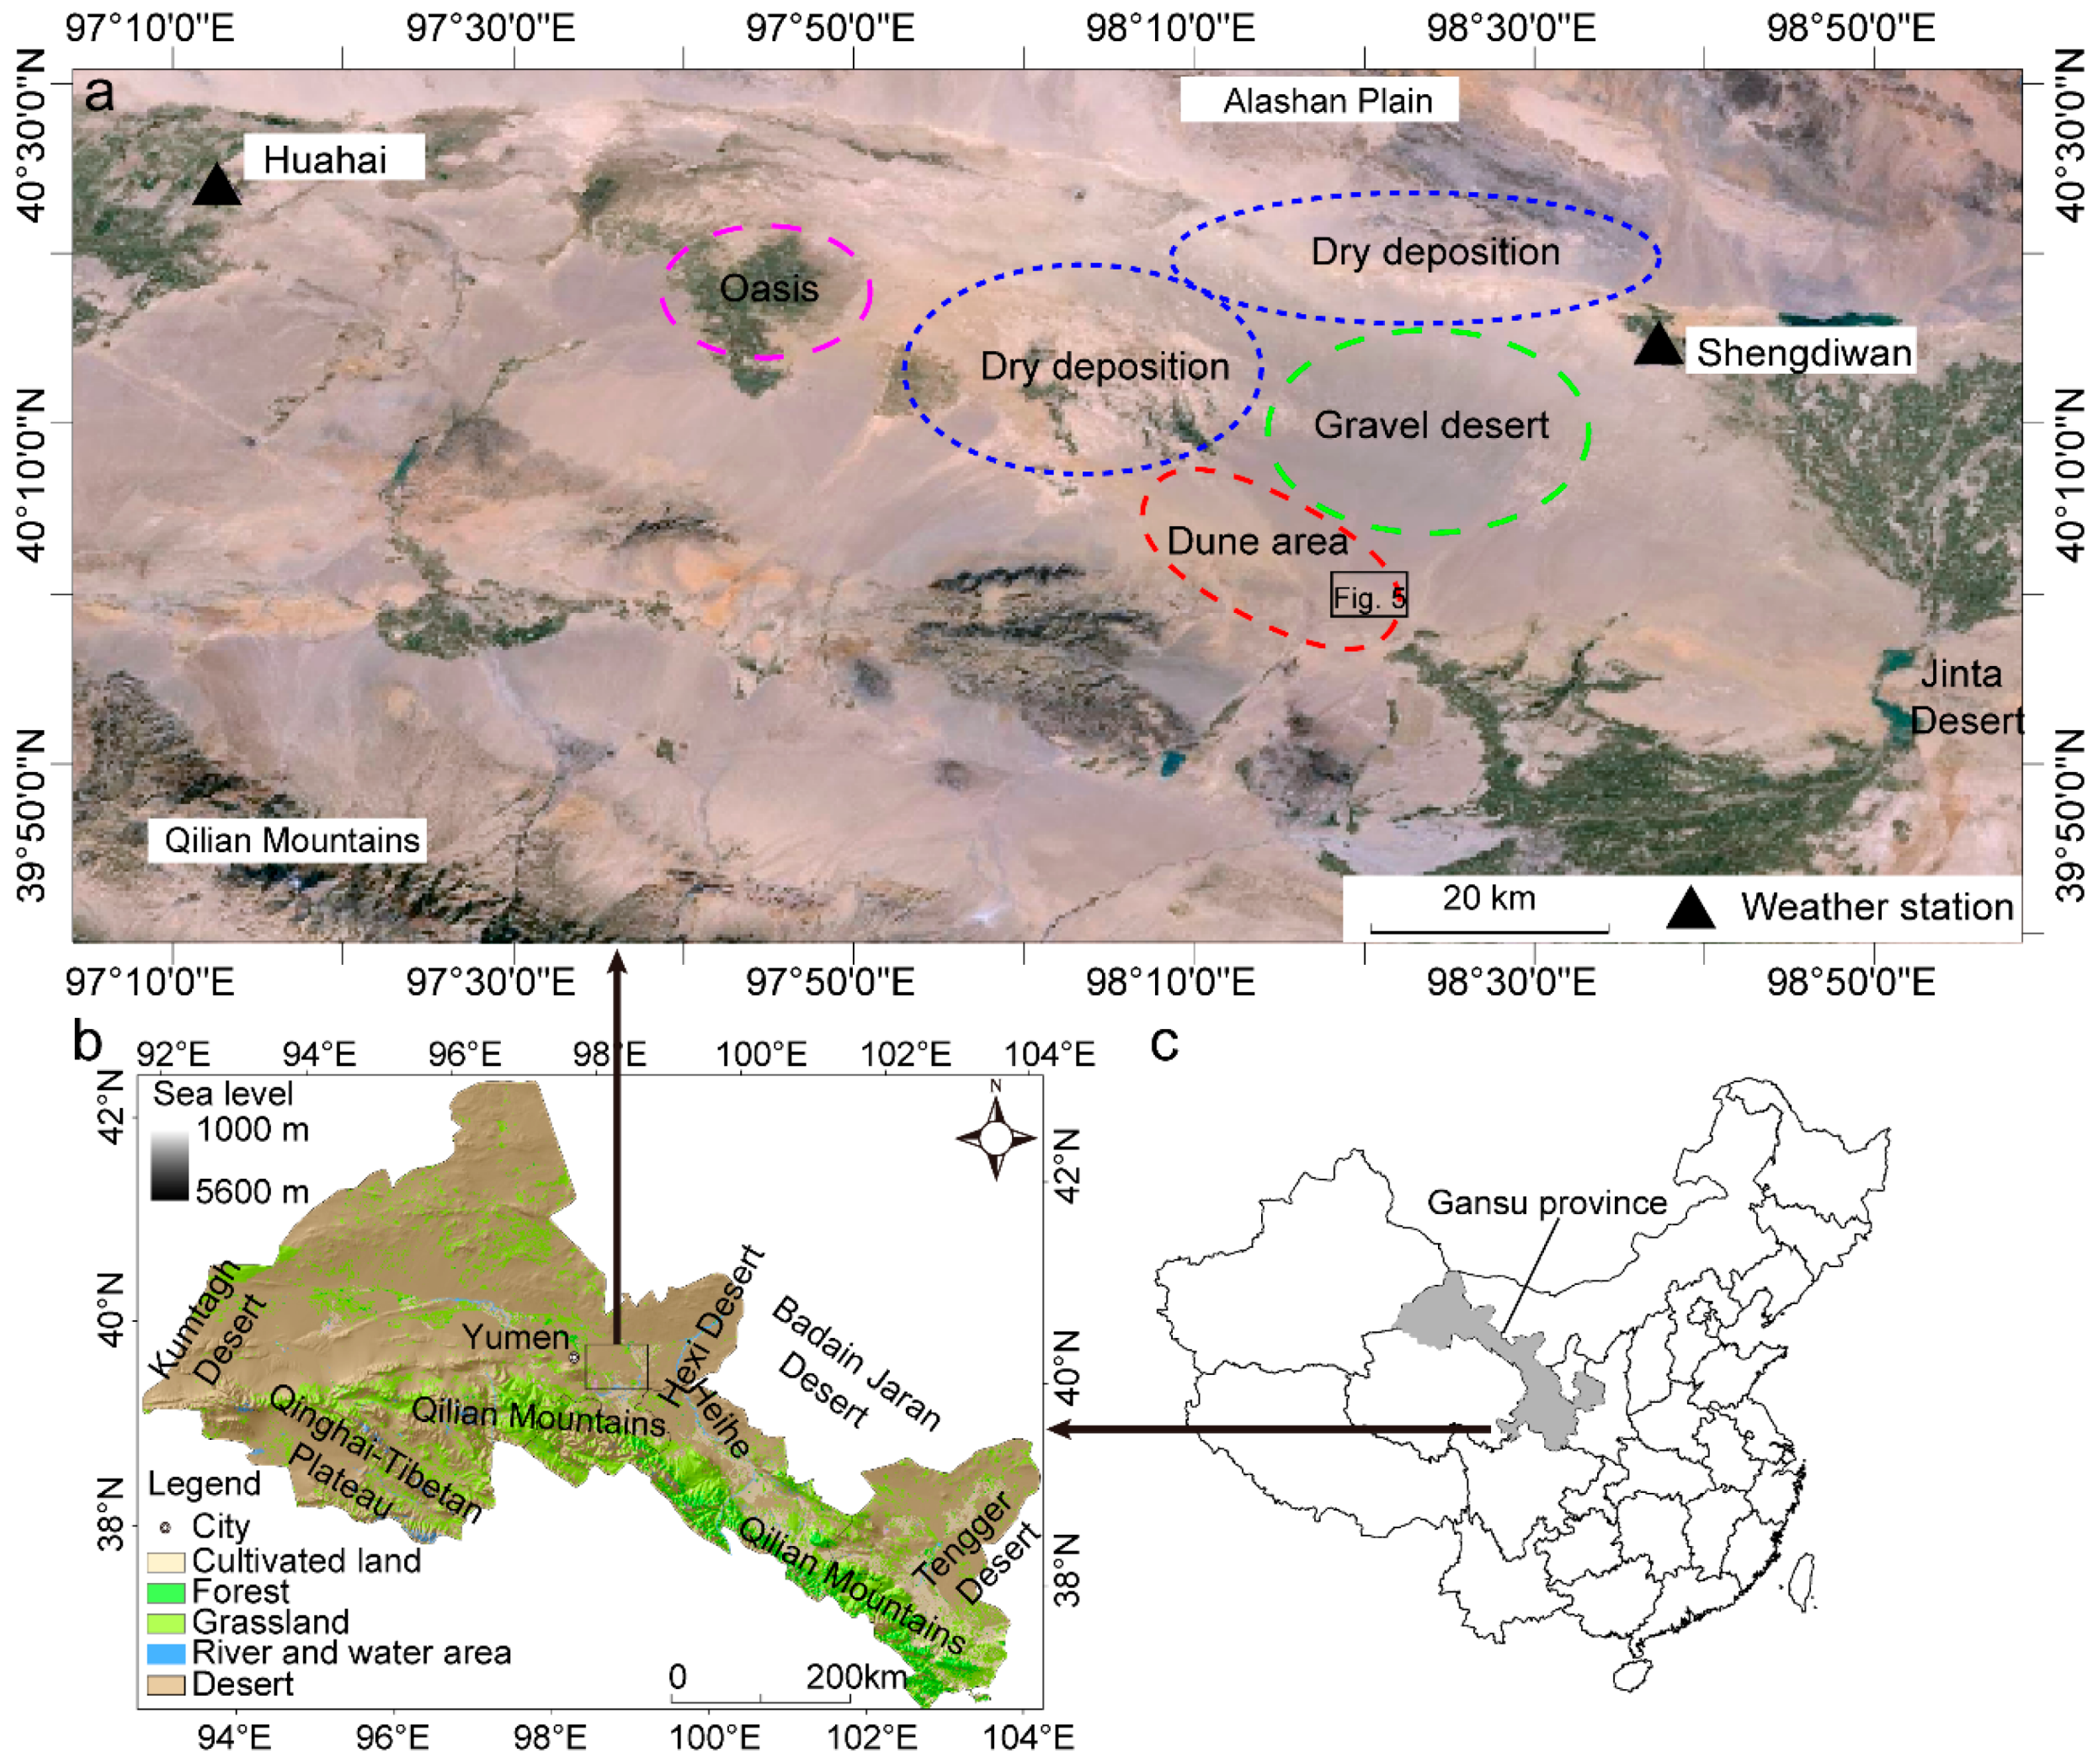
The study area is located in the desert of the Hexi Corridor, Gansu province, China (39°59′47.10″ N, 98°19′18.47″ E, Figure 2b). Previous studies indicated that there were paleolakes in the Hexi Corridor Desert; however, since 18 ka, because of warmer climate conditions (wind direction was from northwest to southeast), the paleolake dried up [7]. Present landforms in the Hexi Corridor Desert were gravel desert, sandy desert, and dry lakebeds (Figure 2a). The desert is bordered on the southwest by the Qilian Mountains. On the east and northwest, it was bordered by the Tengger Desert and Badain Jaran Desert, respectively. On the north, the desert was bounded by the Alashan Plain (mainly a gravel desert). The elevation of the study area ranges from more than 3000 m a.s.l. in the southwest (Qilian Mountains) to 1200 m a.s.l. in the northeastern margin of the Hexi Corridor. The Qilian Mountains is a source of extensive alluvial deposits in the lowlying region of the study area, and the runoff from the mountains formed paleolakes (such as Huahai Lake, Figure 2a), which has provided sand material for dune formation and development. The climate is an extreme continental type with cold winters and moderately warm summers. Annual rainfall averaged 76.9 mm and mainly falls from June through to August. The mean annual temperature about 6.2 °C, and is highest in July (23.1 °C) and smallest in January (−9.7 °C). The annual potential evaporation is more than 2500 mm. The annual mean wind velocity ranges from 2.8 to 4.6 m s−1, and the strongest winds occur in April and May.
The asymmetric barchans constitute the dominating dune type in the corridor. Upwind of the barchan dunes, there are dry lacustrine deposits. Nottebaum et al. [8] reported that the sediment in the Hexi Corridor (site A in [8], located approximately 18 km north of dune d in this paper) was deposited at approximately 12 ka, and the local glacial sediment had provided a large source for lacustrine deposition and sand dune formation there. Wang et al. [7] reported that the paleolake dried up at 4.5 ka and that the age of the modern diluvial surface layer (0.38 m) was approximately 290 ± 70 years. As a result of strong wind erosion (the sand drift potential is 388 UV, and there are ventifacts on the gravel surface; Figure 2d), some of the dry lacustrine sediment was transported downwind and had formed barchan dunes. This wind erosion caused an increase in the coarse sand content (Table S1) on the lacustrine surface, and Yardang landforms had developed (Figure 2b).
2.2. Methods
This section describes methods that were used to calculate the wind regimes in the Hexi Corridor, estimate dune migration rates, and measure particle size of the asymmetric barchans.
2.2.1. Wind Regime
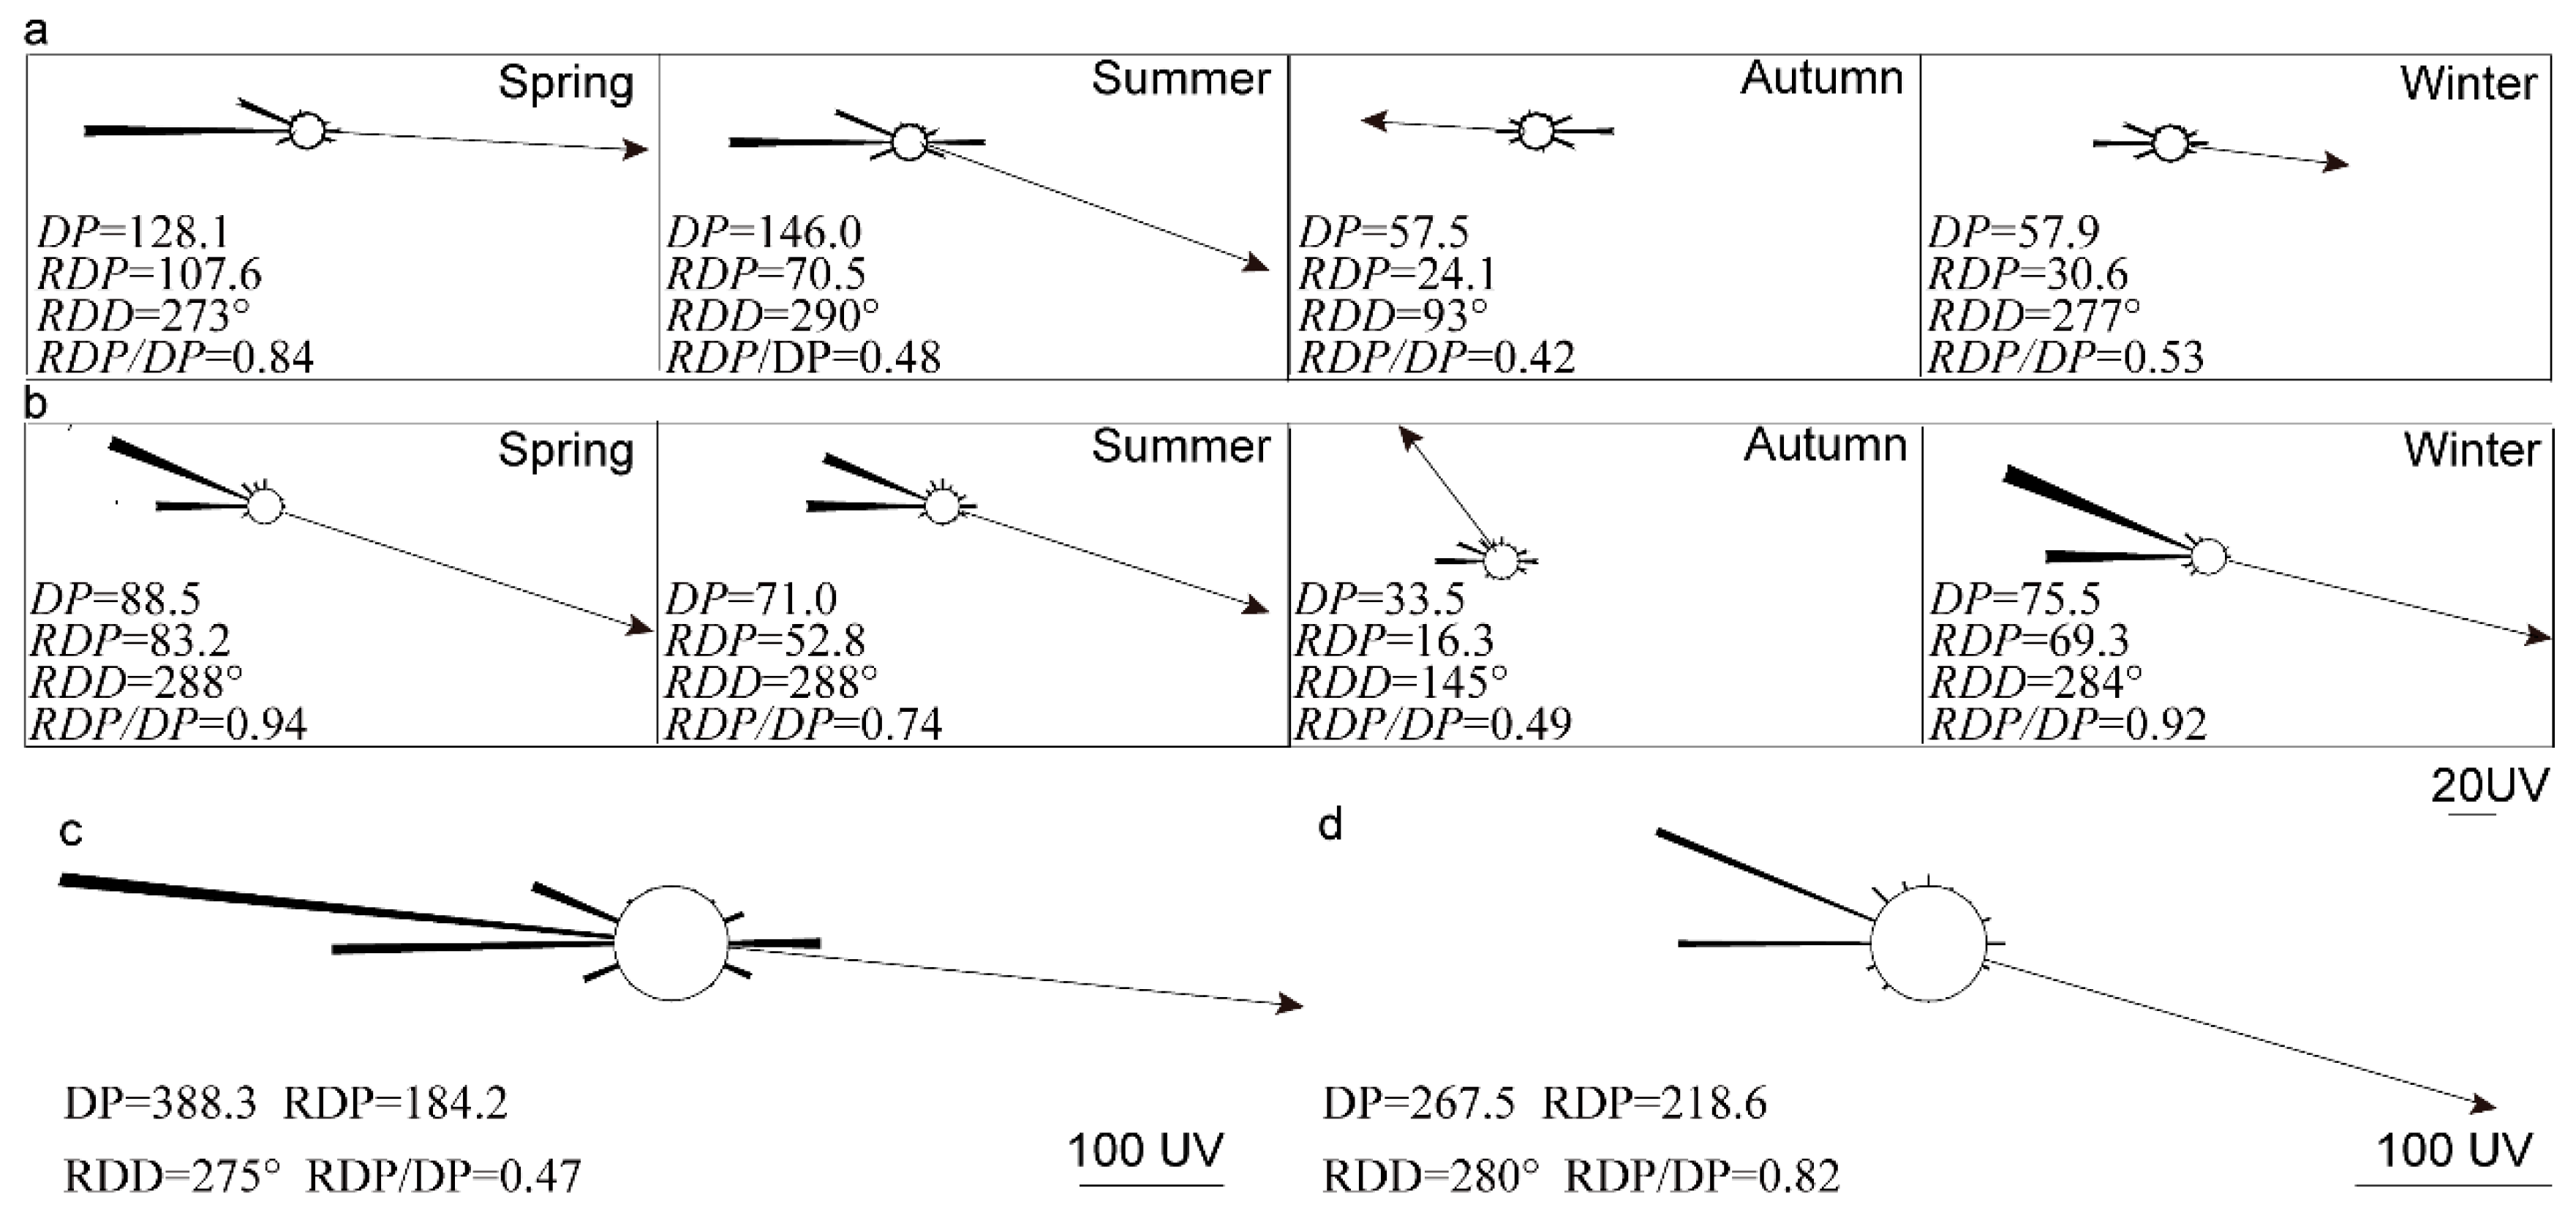
The wind data from the automatic weather stations at two locations (Huahai on the upwind side and Shengdiwan on the downwind side; Figure 2) were selected to study the effect of the wind regime on dune movement. The wind sensors were set 10 m above the ground in accordance with World Meteorological Organization standards for anemometer heights. The wind sensors were produced by the Changchun Meteorological Instrument Research Institute (Changchun, China). The wind sensors’ measurement accuracy for wind speed was ±2% and the wind direction was ±3%; the resolution was 0.01 m s−1 for wind speed and 1° for wind direction, with a 0.02 m s−1 threshold for wind speed. The wind velocity data were measured at 15 min intervals and were recorded by a CR1000 datalogger (Campbell Scientific, Logan, UT, USA). The wind regime including the values of the sand drift potential (DP), resultant drift potential (RDP), resultant drift direction (RDD), and RDP/DP ratio were calculated following the method by Fryberger and Dean [9] for sand rose calculation (wind data were converted to knots as per [9]).
A sand rose gave the potential sand drift from the 16 directions of the compass [9]. The length of each arm of the sand rose was proportional to the drift potential DPi, which was the potential rate of sediment transport as a result of winds above the threshold wind velocity . The total drift potential DP was calculated using the formula , while the resultant drift potential was obtained from , where is the unit vector pointing in the direction i.
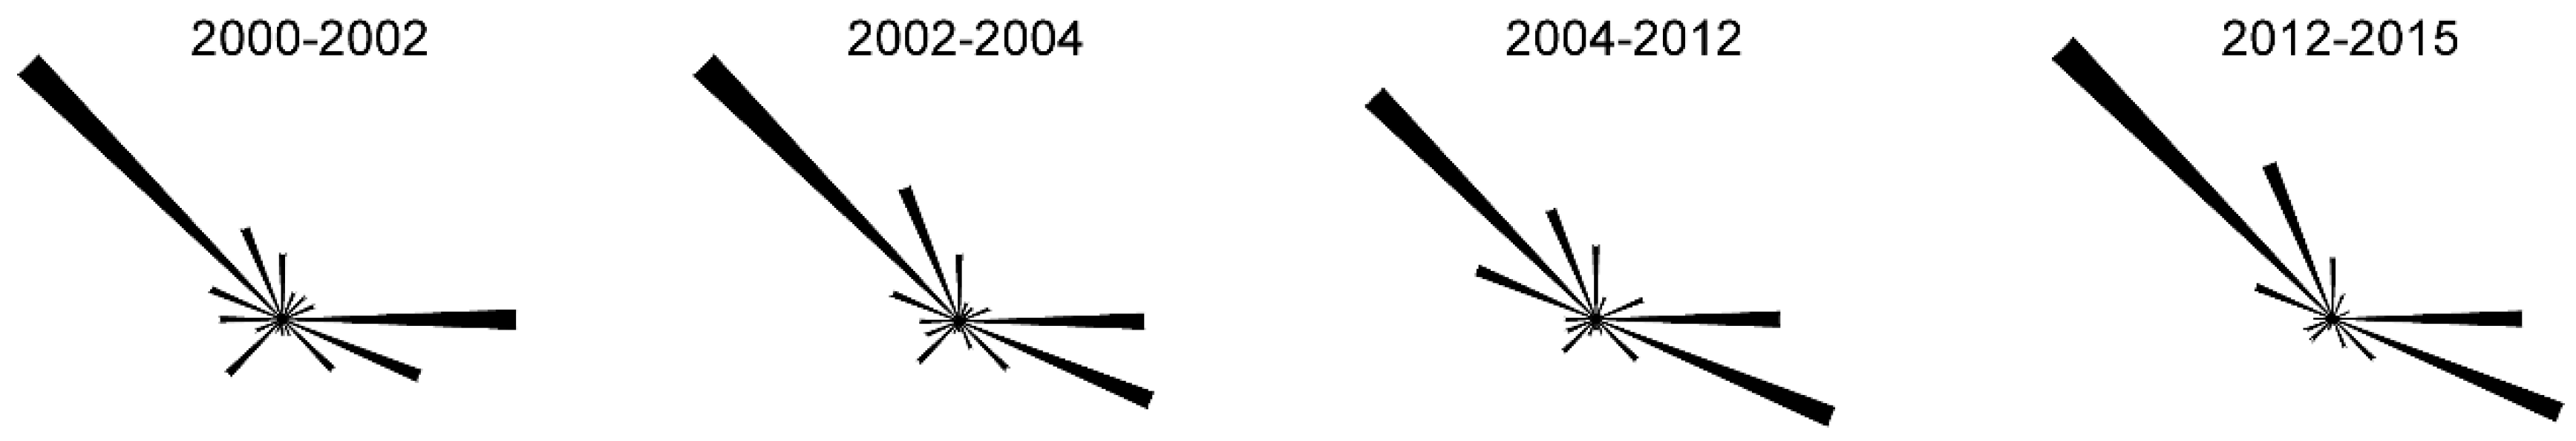
Although this approach makes a number of interpretative simplifications and assumptions [10,11], previous studies of the wind energy environments of global sand seas have demonstrated its value [10,11,12,13,14,15]. More detailed descriptions of these methods can be found in [14,15]. Although only two years of wind data were collected in the study area, a previous study indicated that the wind regime did not change greatly from 2001 to 2011 on the downwind side of the study area (in Jinta county, DP was 73 ± 20 UV, RDP was 52 ± 18 UV, RDD was 299 ± 3°, and RDP/DP was 0.7 ± 0.1; [14]). To investigate the effects of the wind direction changes on dune movement, the maximum wind direction (data come from The National Basic Weather Stations) from 2000 to 2015 on the upwind side of the study region (Jiuquan) was analyzed.
2.2.2. Dune Migration
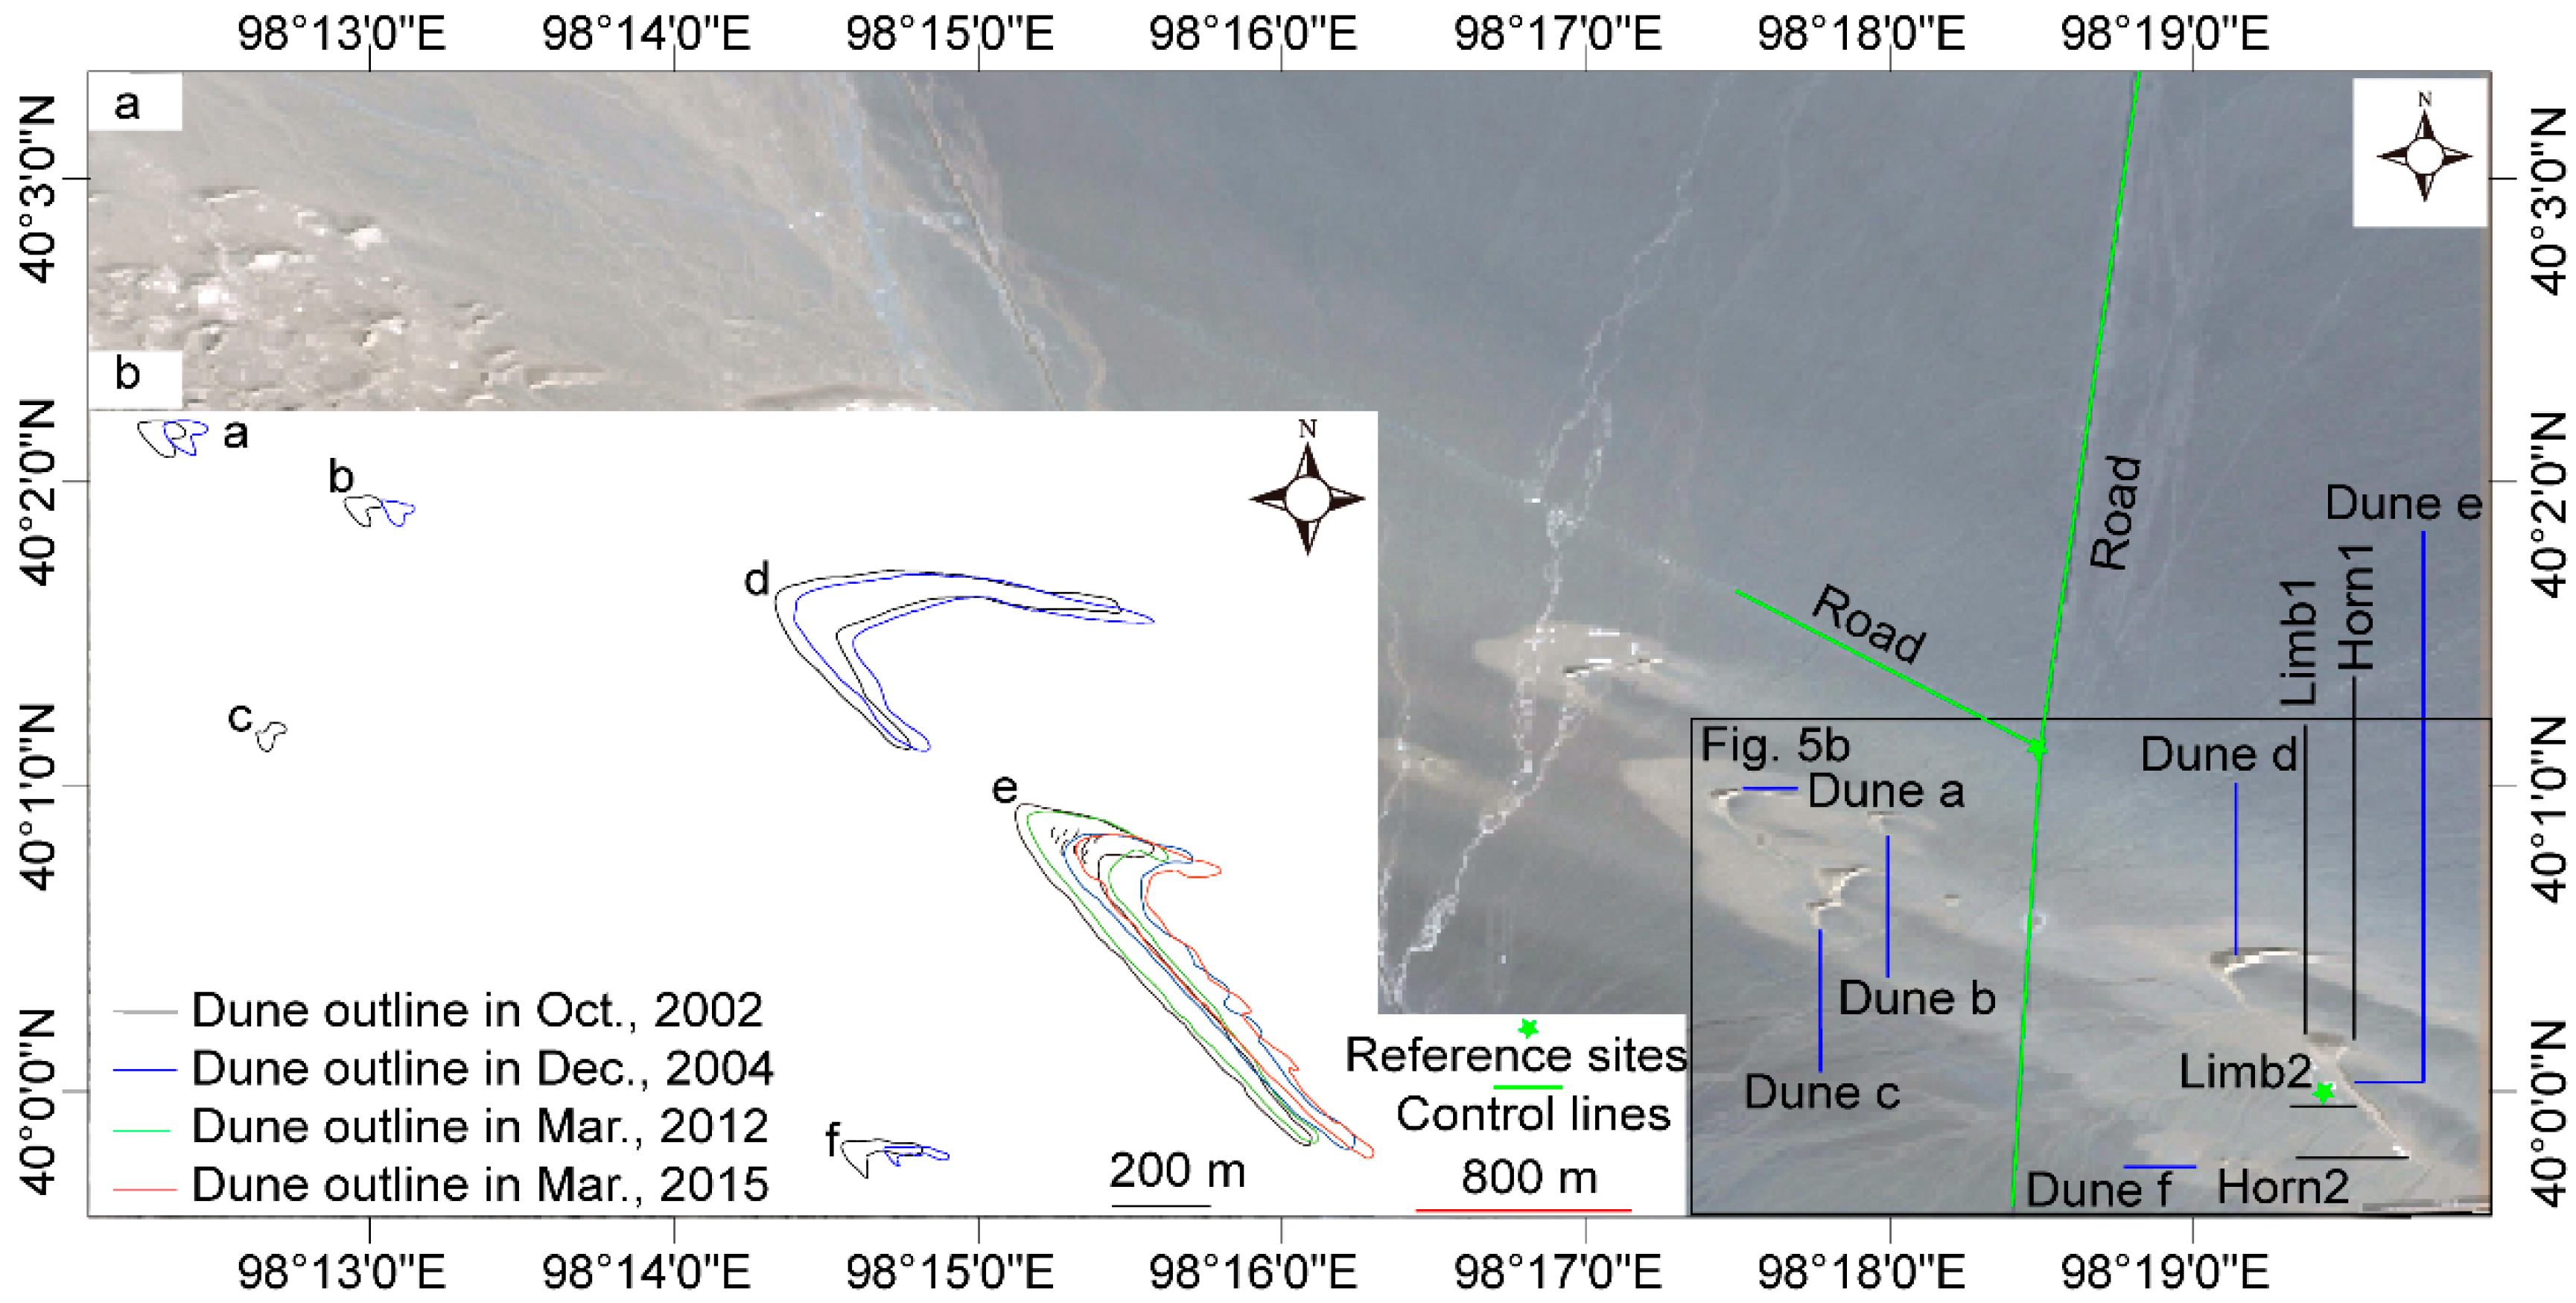
The dune migration was measured using Google Earth historical satellite images, which was widely used to investigate the dune changes [16,17,18,19]. The valuable Google Earth satellite images that showed the study area are dated October 2002, December 2004, March 2012, and March 2015. The images were extracted using ArcGIS software (Esri, Redlands, CA, USA). This step was performed by locating two control lines of the known coordinates in the Google Earth image, which were saved as a shape file, and a layer of the reference points in the ArcGIS database. The outlines of the selected dunes were traced in two layers, and the images were then superimposed. The dune migration rates were calculated from the distances between four points (windward toe, leeward toe, horn 1, and horn 2) in the two images. The migration rate was calculated as this distance divided by the time span (m a−1). The mean migration rates of these four points were treated as the mean migration rate of each barchan dune [17,20,21,22,23,24,25].
One important aspect in the analysis of barchan dune migration and morphology is the uncertainty in the measurement of the location of the barchan edges and mapped features. Even though the barchans look relatively crisp, their edges are often gradational and an exact position is often subjective (see Scuderi et al. [26] for a discussion on the issues of quantifying the fuzzy edges of aeolian objects). Therefore, to reduce the uncertainty related to the fuzzy edges when outlining the selected dunes, we have enlarged every satellite image at a scale of 1:250 before drawing the dune’s contour by hand. Moreover, one further aspect to be considered is that, in some of the images, the image frames may be slightly misregistered, which leads to slight mislocations of the barchan positions, thus potentially affecting the estimates of the barchan migration rates. To minimize this problem, when superimposing two images so as to determine the changes in the barchan position, we selected two control lines, which were defined as two roads in the area near the selected dunes (see Figure 3), as well as two reference sites (the crossroad and the dry lacustrine deposit; see Figure 3).
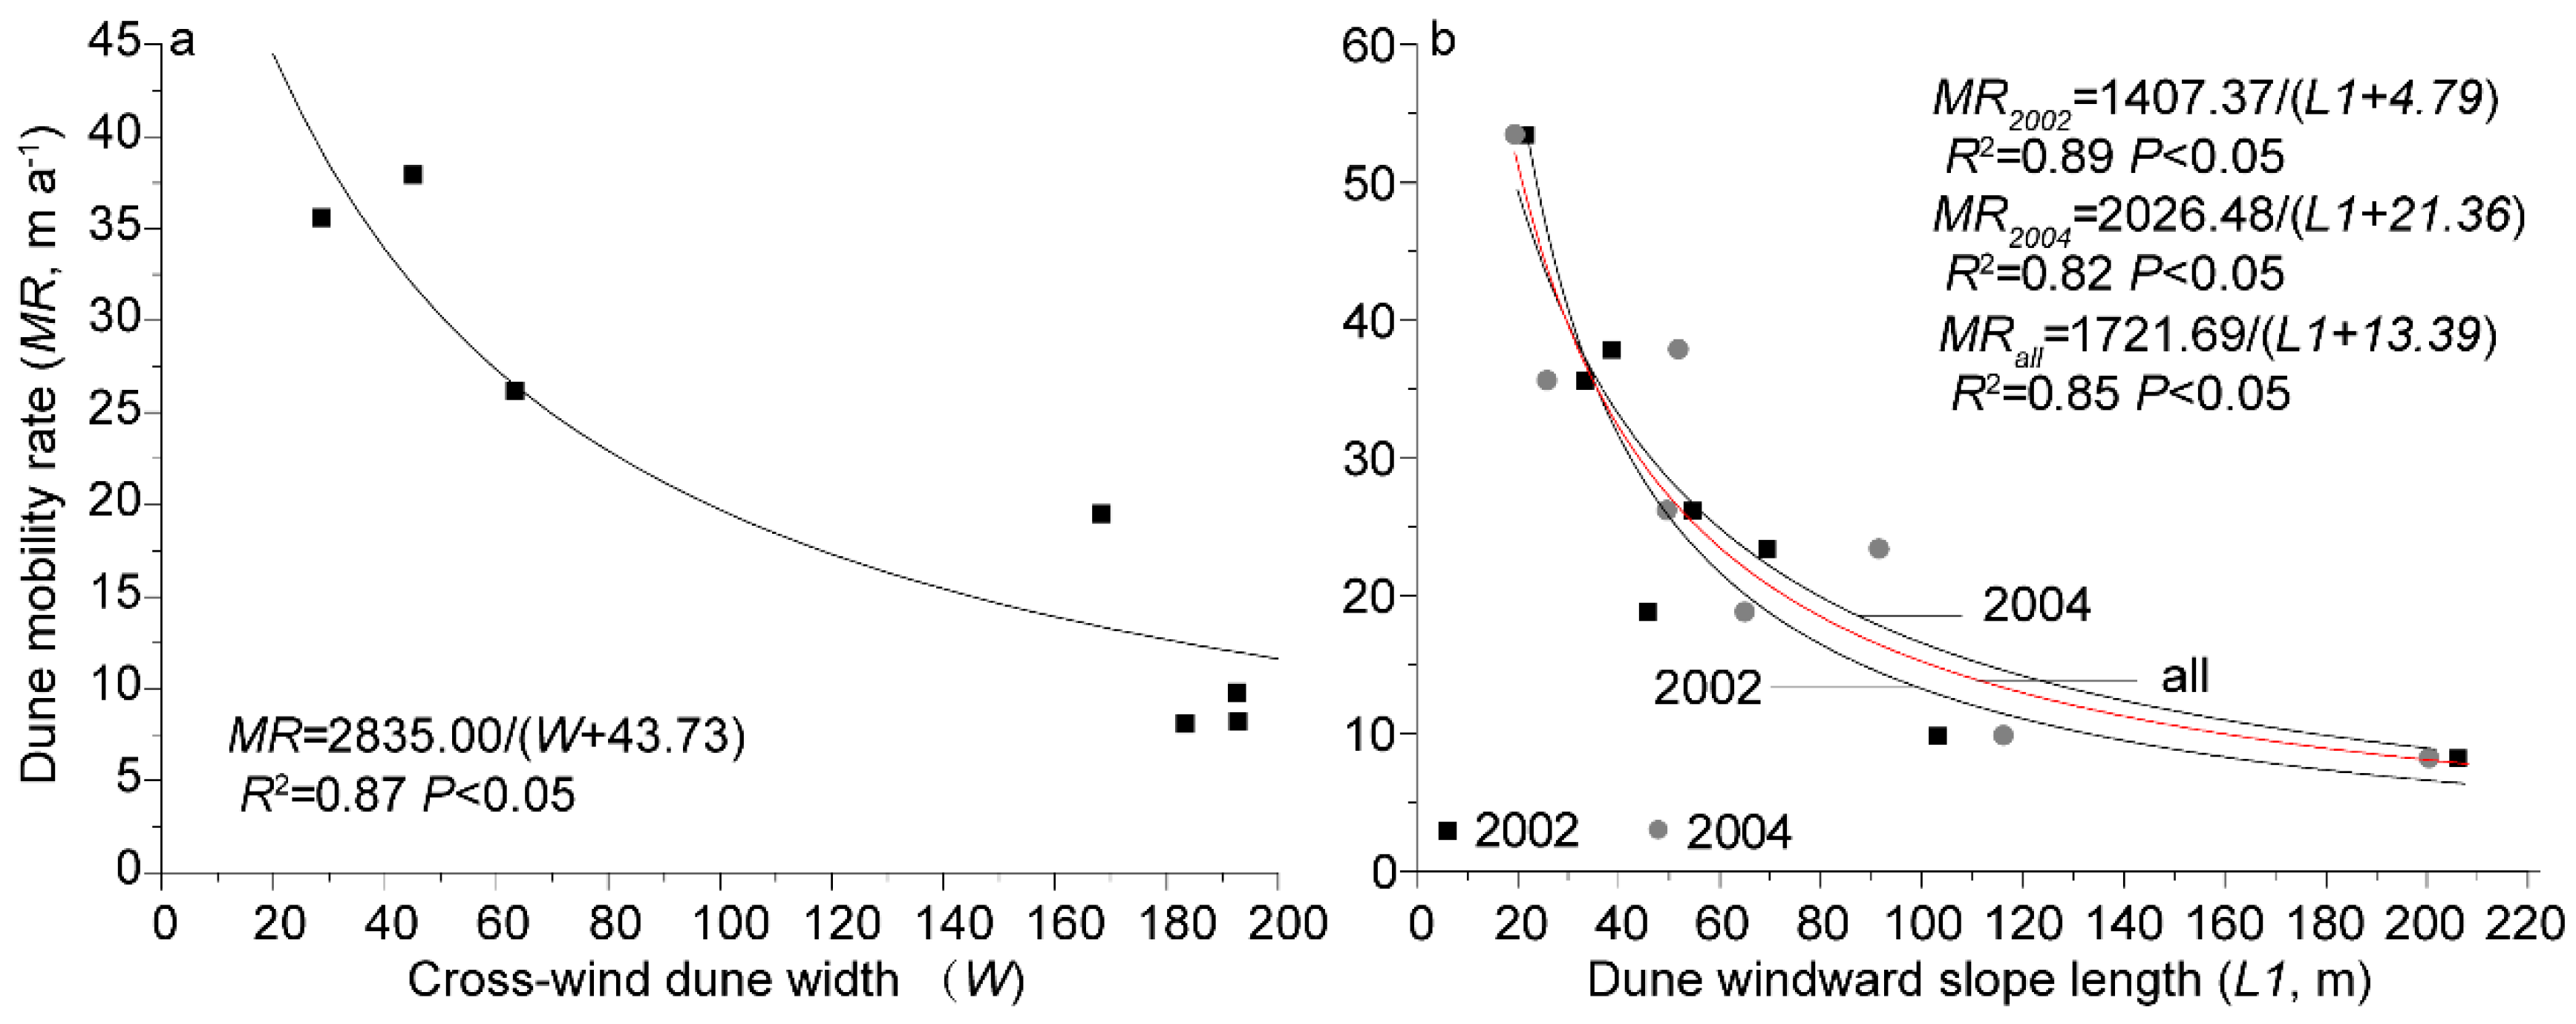
We described our results for the migration rates of the barchan dunes using the expression MR = A/(W + W0), where the fit constant A is proportional to the sand flux; MR is the dune migration rate (m a−1) (i.e., the averaged migration rate of dune toe and horns); W is the cross-wind dune width (in the direction perpendicular to dune migration) measured at the crest, and W0 is a second fit parameter, which encodes the break in scale invariance of the dune shape because of the existence of a minimal dune size [27,28].
2.2.3. Particle Size Distribution
In May 2015, 38 dune sediment samples from the dune surface were collected in the study area, as follows:
- ▪
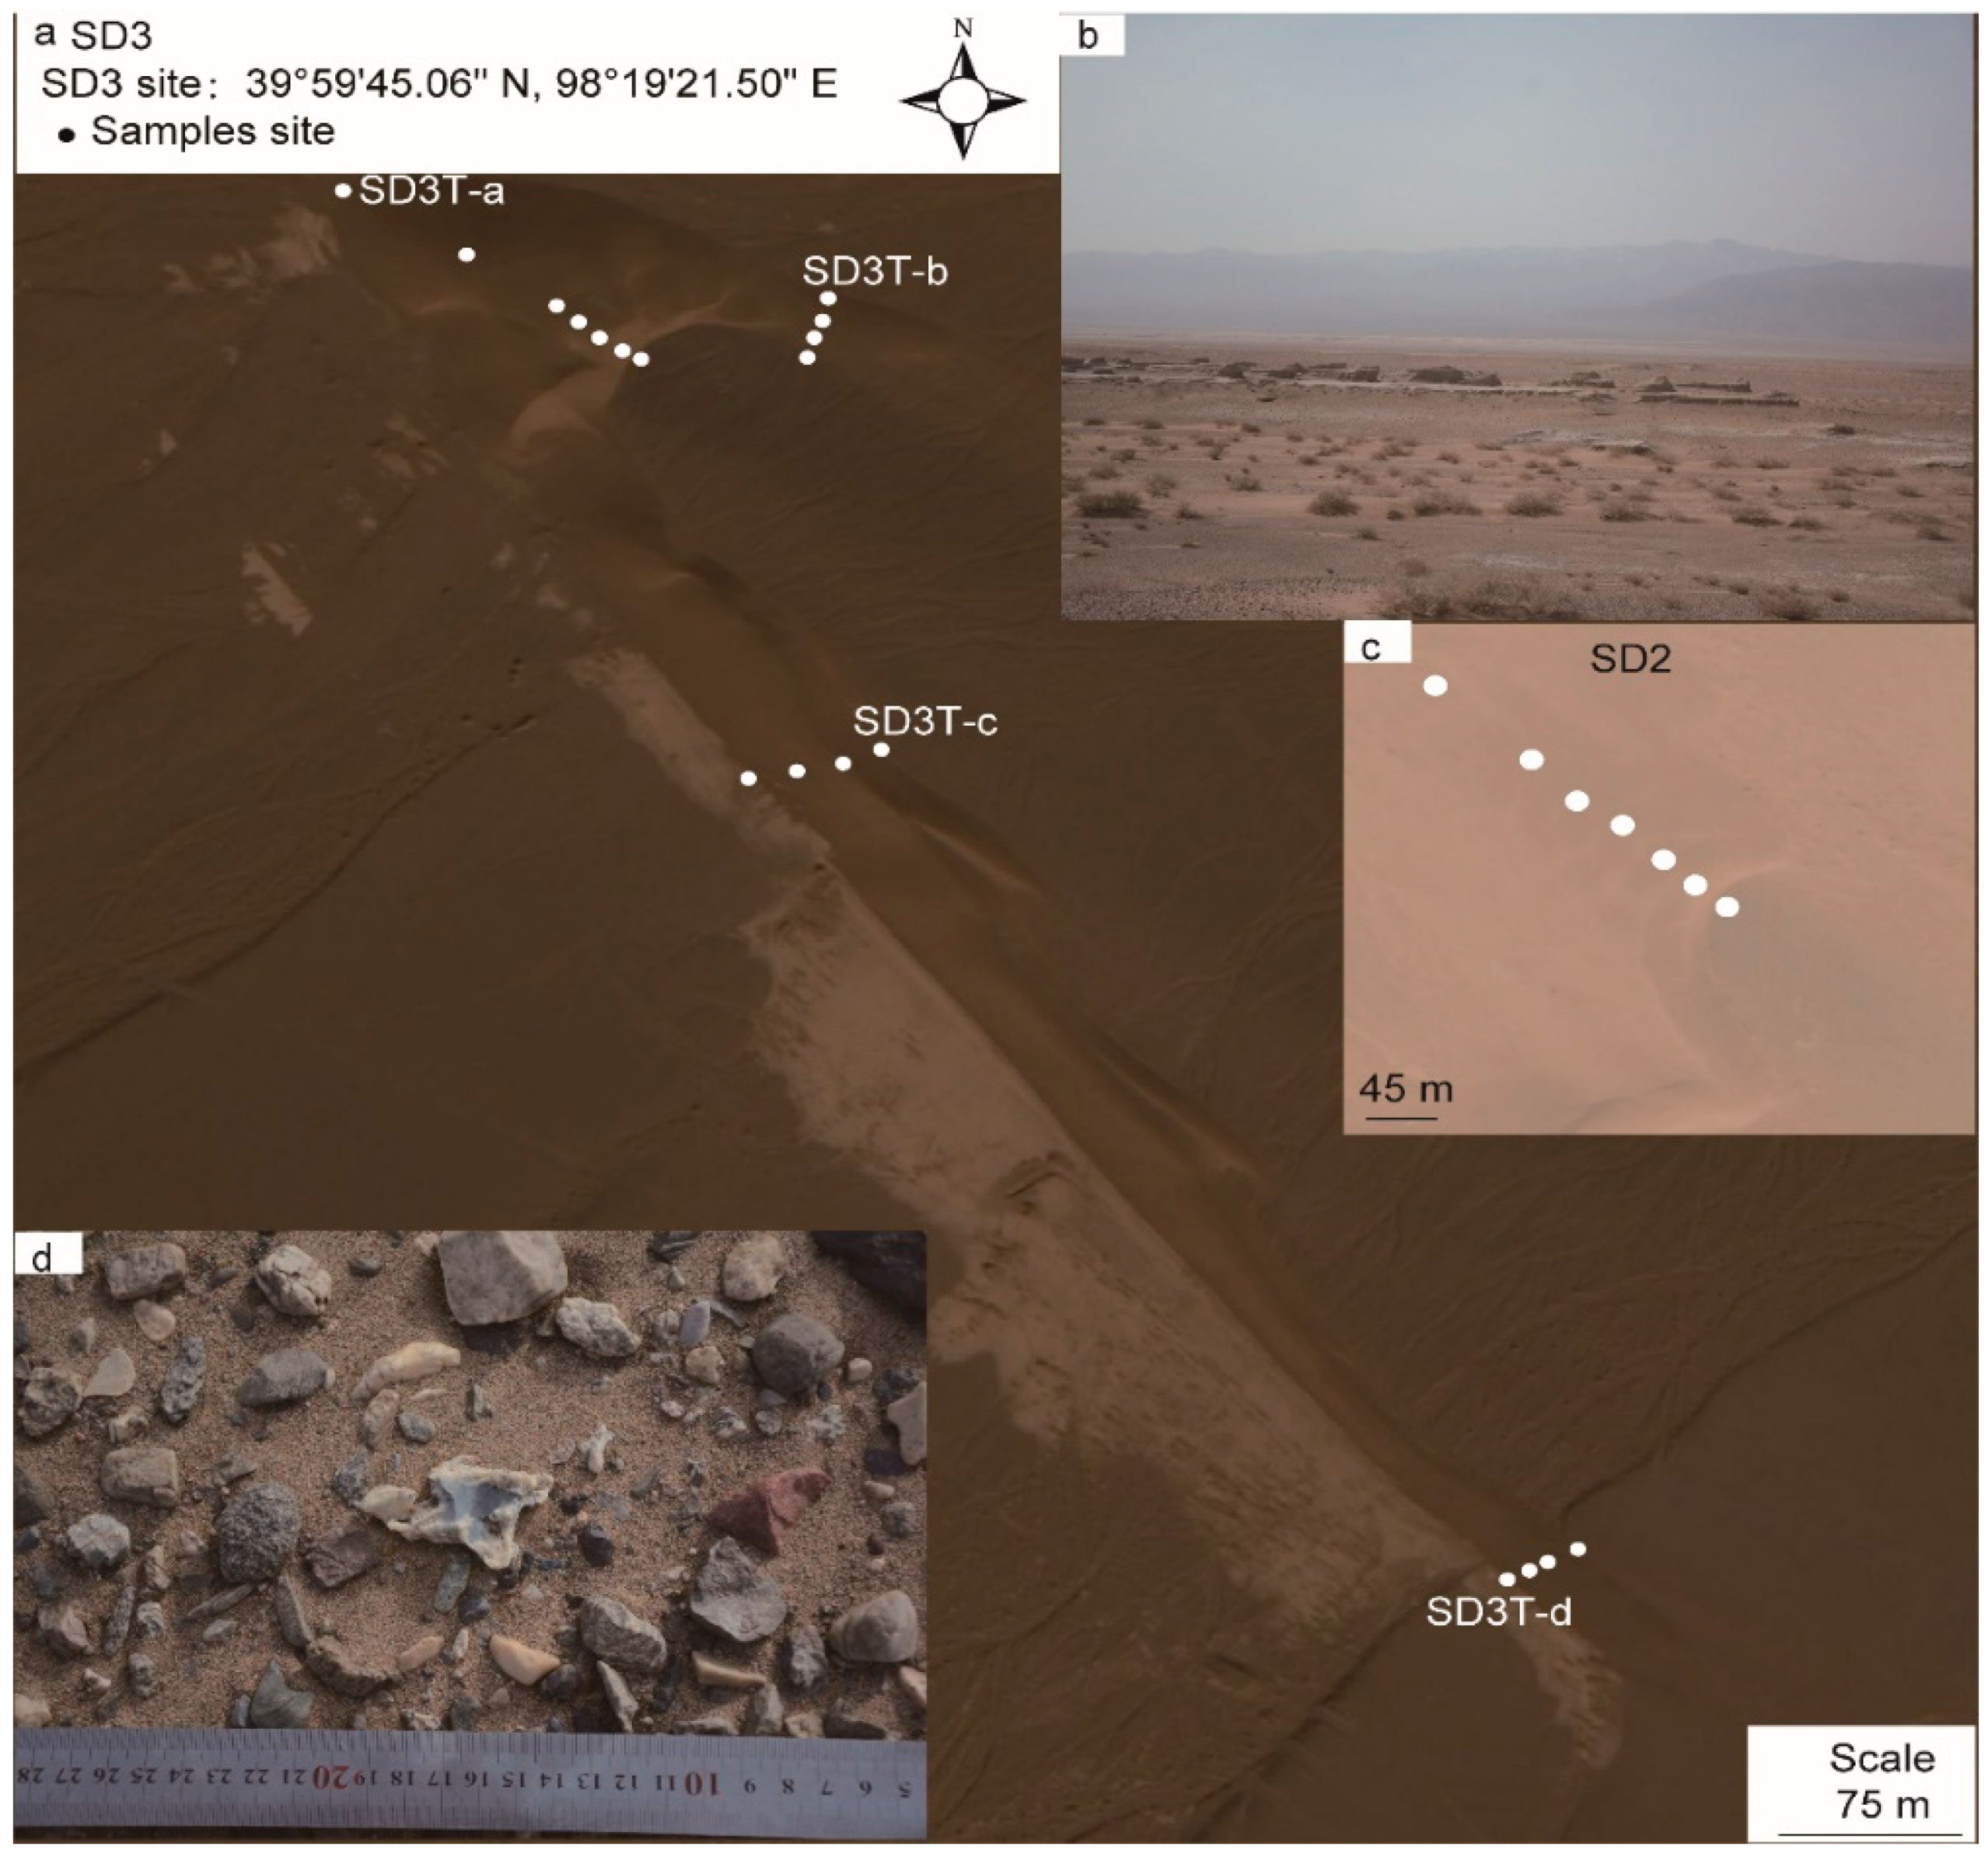
- 26 samples from two barchan dunes (see Figure 4c). From these 26 samples, seven were collected over the windward toe, stoss, front of top, middle of top, back of top, crest, and leeward toe of sand dune SD2; moreover, 19 samples were collected at four transacts (Figure 4c,d) of sand dune SD3, 7 sites for SD3T-a (windward toe, stoss, front of top, middle of top, back of top, crest, leeward toe), and 4 sites for SD3T-a, SD3T-b, SD3T-c, and SD3T-d (windward toe, stoss, crest, and leeward toe, respectively);
- ▪
- 4 samples from the inner layer of a barchan dune (surface, on the gravel layer, gravel layer, and under gravel layer);
- ▪
- 3 samples from vegetated dunes (windward, crest, and leeward);
- ▪
- 3 samples from gravel surfaces (2 sites, 2 gravel surfaces, and 1 gravel under layer);
- ▪
- 2 samples from dry lacustrine sediment (one from the surface and one from the under layer).
The dune surface sediments were collected from the windward toe, stoss, crest, and leeward toe. The gravel and dry lacustrine sediment were collected from the surface and from 1 to 4 cm below. At each site, surface materials (0–1 cm layer) from a 20 × 20 cm area were collected. Each sample weighed approximately from 0.5 to 1 kg.
In order to facilitate the description of the grain size distribution (based on the distribution area and relative aggregation of the sand dunes and sand sea source material), the study area was divided into five subregions, as follows:
- ▪
- one designated GD (dunes formed on gravel surface), consisting of gravel and dry lacustrine sediment (Figure 4b,d);
- ▪
- a VD (vegetation dunes) region consisting of vegetated dunes, which were located in the central portion of the study area;
- ▪
- SD1, an upwind sand dune located in the Huahai village (Figure 2);
- ▪
- SD2, a sand dune located near the center of the study area (Figure 2); and
- ▪
- SD3, a downwind sand dune located in the downwind portion of the study area (Figure 4a).
There were four transects (SD3T-a, SD3T-b, SD3T-c, and SD3T-d, in Figure 4a) that were also located in subregion SD3. Both SD2 and SD3 exhibited relatively flat regions downwind of their stoss side, as well as on their crest. However, the horns of SD2 were shorter than the ones of SD3. Moreover, the horns of SD3 had different lengths (Figure 4a); the SD3T-b limbs were shorter (87 m), while the SD3T-c and SD3T-d limbs were longer (689 m). The windward slope gradient of the SD3 sand was 15°, its flat top was approximately 34 m wide, the distance from the top point to the crest was approximately 19 m, and the leeward slope gradient was 32°.
The grain size distributions were analyzed using a Malvern MasterSizer 2000 (Malvern Instruments Ltd., Malvern, UK) and the mean size (Mz) was analyzed.
3. Results
3.1. Wind Regime in the Study Area
Figure 5a,b show the sand roses calculated from the wind data that were obtained from the weather stations in Huahai (located on the upwind side of the study area) and Shengdiwan (located on the downwind side of the study area), respectively. The DP on both sides was moderate (200–400 UV), according to Fryberger and Dean’s classification [9]. Overall, we saw from Figure 5 no significant change in the wind behavior between both of the stations, which had encompassed the studied dunes. However, both the RDD and the RDP/DP ratio vary over the seasons. The greatest sand drift potentials occurred in the spring and summer, while, in both stations, the RDD in the autumn was nearly the opposite to the resultant transport direction that prevailed in all of the other seasons. Figure 5c,d show the yearly averaged sand roses from the respective wind stations. As we could see from these figures, the directionality of the sand-moving winds was nearly unidirectional, with mean transporting winds from the west (W) and north west (NW).
Figure 6 shows the mean percentage wind direction frequencies in the 16 directions of the compass, while Table S2 gives the frequencies of the winds blowing from the four quadrants (NE, SE, SW, NW). We saw that in the study area, the winds from the SW and NE became slightly less frequent over time during the period from 2000 to 2015, while the frequency of the winds from the NW and SE increased during the same period. Overall, most of the winds blew from the NW quadrant (47.7%), followed by winds from the SE quadrant (23.4%).
3.2. Dune Pattern and Movement
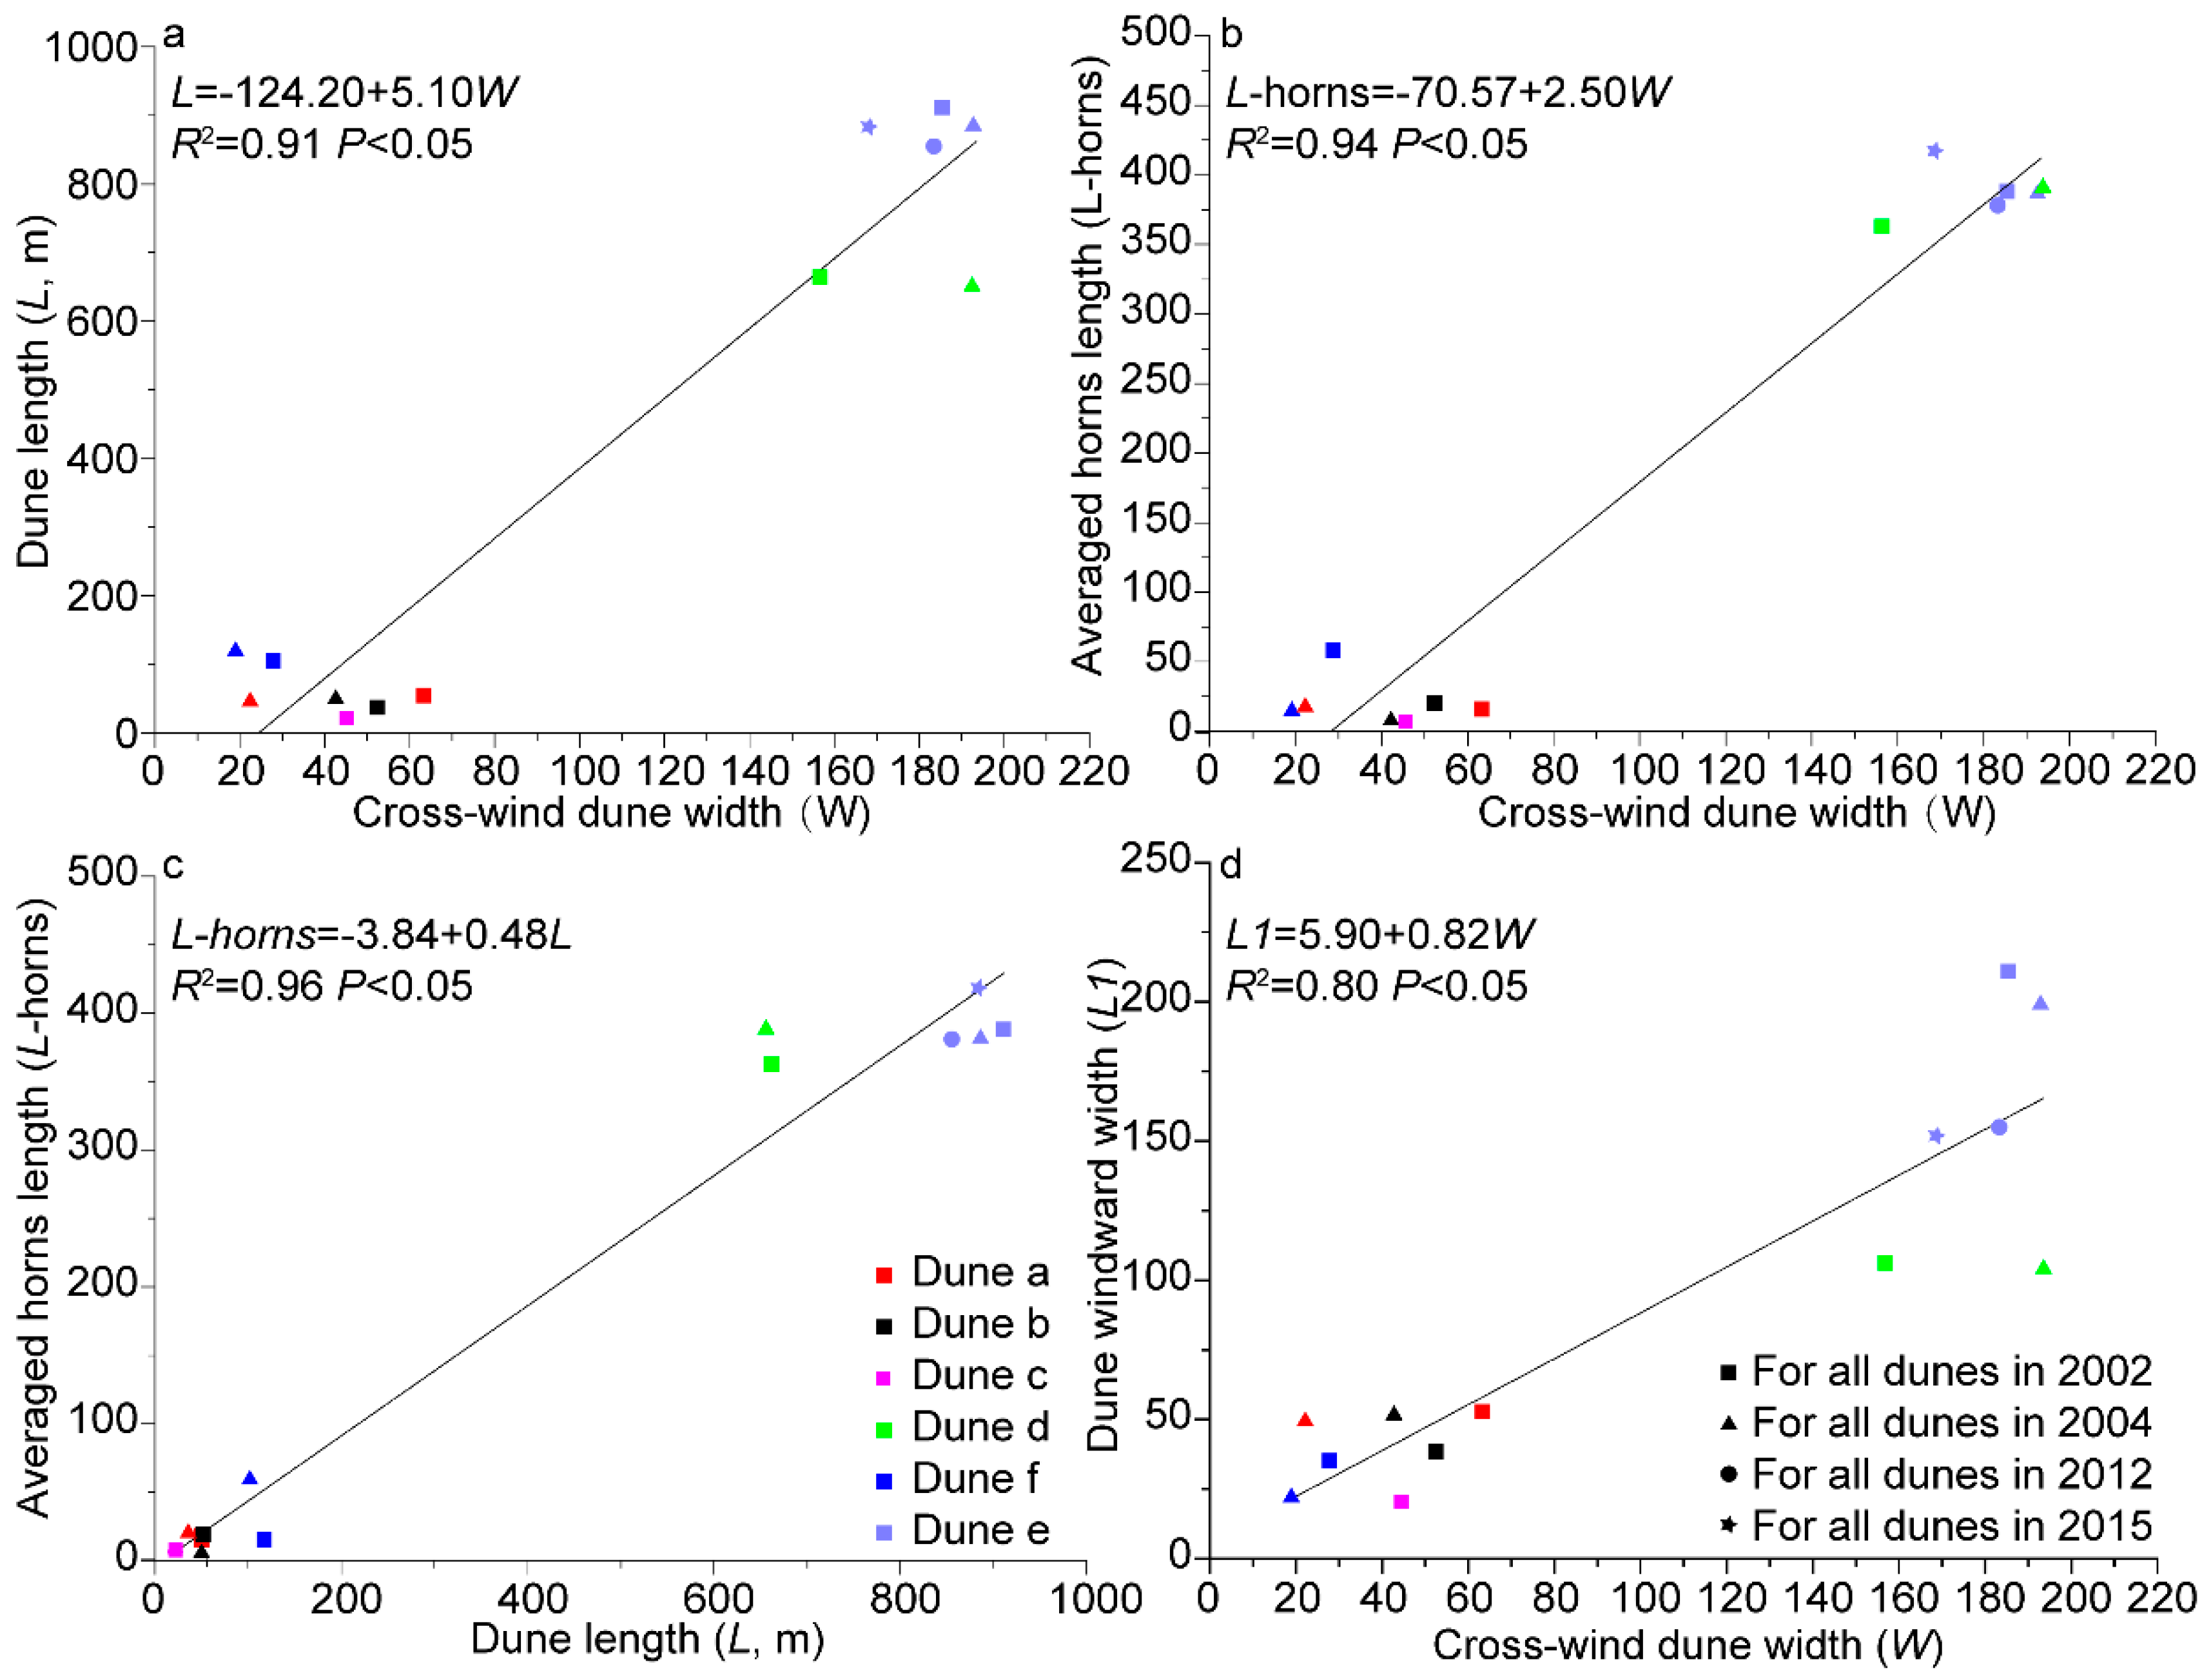
The shape of a barchan dune may vary with its development, as explained by Cooke et al. [29]. Our results reflect the following behavior: the morphometric relations of dune e displayed measurable changes between 2002 and 2015, as specified in Table 1. Nevertheless, the dune length-to-width ratio remained nearly constant over the referred time period (it ranged from 2.23 to 2.27). We found strong correlations between the cross-wind width (W), dune length or along-wind width (L), mean horn length (L-horns), and dune slip-face length L1, as shown in Figure 7.
Because dunes a, b, c, and f disappeared before 2012 (Figure 3b), their migration rates were analyzed only for the period of 2002–2004. Moreover, human activities affected the morphology and dynamics of dune d for the period of 2004–2012. Some material was removed from the windward slope of this dune, so that the windward slope length and dune width changed as the amount of sand decreased as a result of the referred dune sand removal. Therefore, the migration rate of this dune was analyzed only for the period of 2002–2004. Table 2 and Table 3 present the values of the migration rate for the selected barchan dunes. Our results indicated that these rates depended on where the measurement was conducted, that is, on the position on the dune surface (windward toe, leeward toe, horn 1, and horn 2).
In spite of the dynamical behavior of the dune shape, we found that this shape was consistently size-dependent. Specifically, the crest and brink of simple or small barchan dunes in the study area (i.e., dunes a, b, c, and f) were at the same position, whereas for the complex or large barchan dunes d and e, the dune crest was upwind of the brink. This finding was intriguing because it was exactly the opposite behavior of the field observations that were reported by Sauermann [30], as well as the physical models for equilibrium barchan dunes [27,31], according to which the small barchans have a rounded shape, while the large barchans have a sharp crest. Clearly, other factors (discussed below) are affecting the shape of the dunes in the Hexi Corridor and their dependence on the size. Moreover, the simple or small barchan dunes that might have been present, disappeared as a result of the greater potential sand transport (Figure 5).
We found that the dune migration rate was correlated with the dune cross-wind width (W) and dune windward slope length (L1) (Figure 8). There were strong linear relationships between the migration rate and the cross-wind (R2 = 0.87, p < 0.05), which was in agreement with the field observations and numerical simulations [28,32,33,34].
A comparison of the shapes and migration rates of dunes d and e indicated that their migration rates were affected by the sand supply, dune shape, and their compound morphology. The windward side of these dunes displayed many small dunes, which affected the aerodynamics and sand flux over the topography. In 2002, there was abundant loose sand in front of the windward toe of dune d, which was indicated by the muddy color in Figure 3b, while the sediment source was absent from the front of dune e. Moreover, horns 1 and 2 of dune d migrated at different rates during different periods, as shown in Figure 3 and Table 1. However, both of the horns of dune e moved at similar rates during the whole investigation period of 2002–2015 (11.4 and 12.0 m a−1; Table 2). All of these findings suggested that not only the local changes in the wind direction (NW quadrant wind increased from 46.8 to 50.4%, and NE quadrant wind decreased from 24.0 to 18.1%), but also the characteristics of the asymmetric compound dunes d and e and the local sediment availability might have been influencing the dune limb alignment.
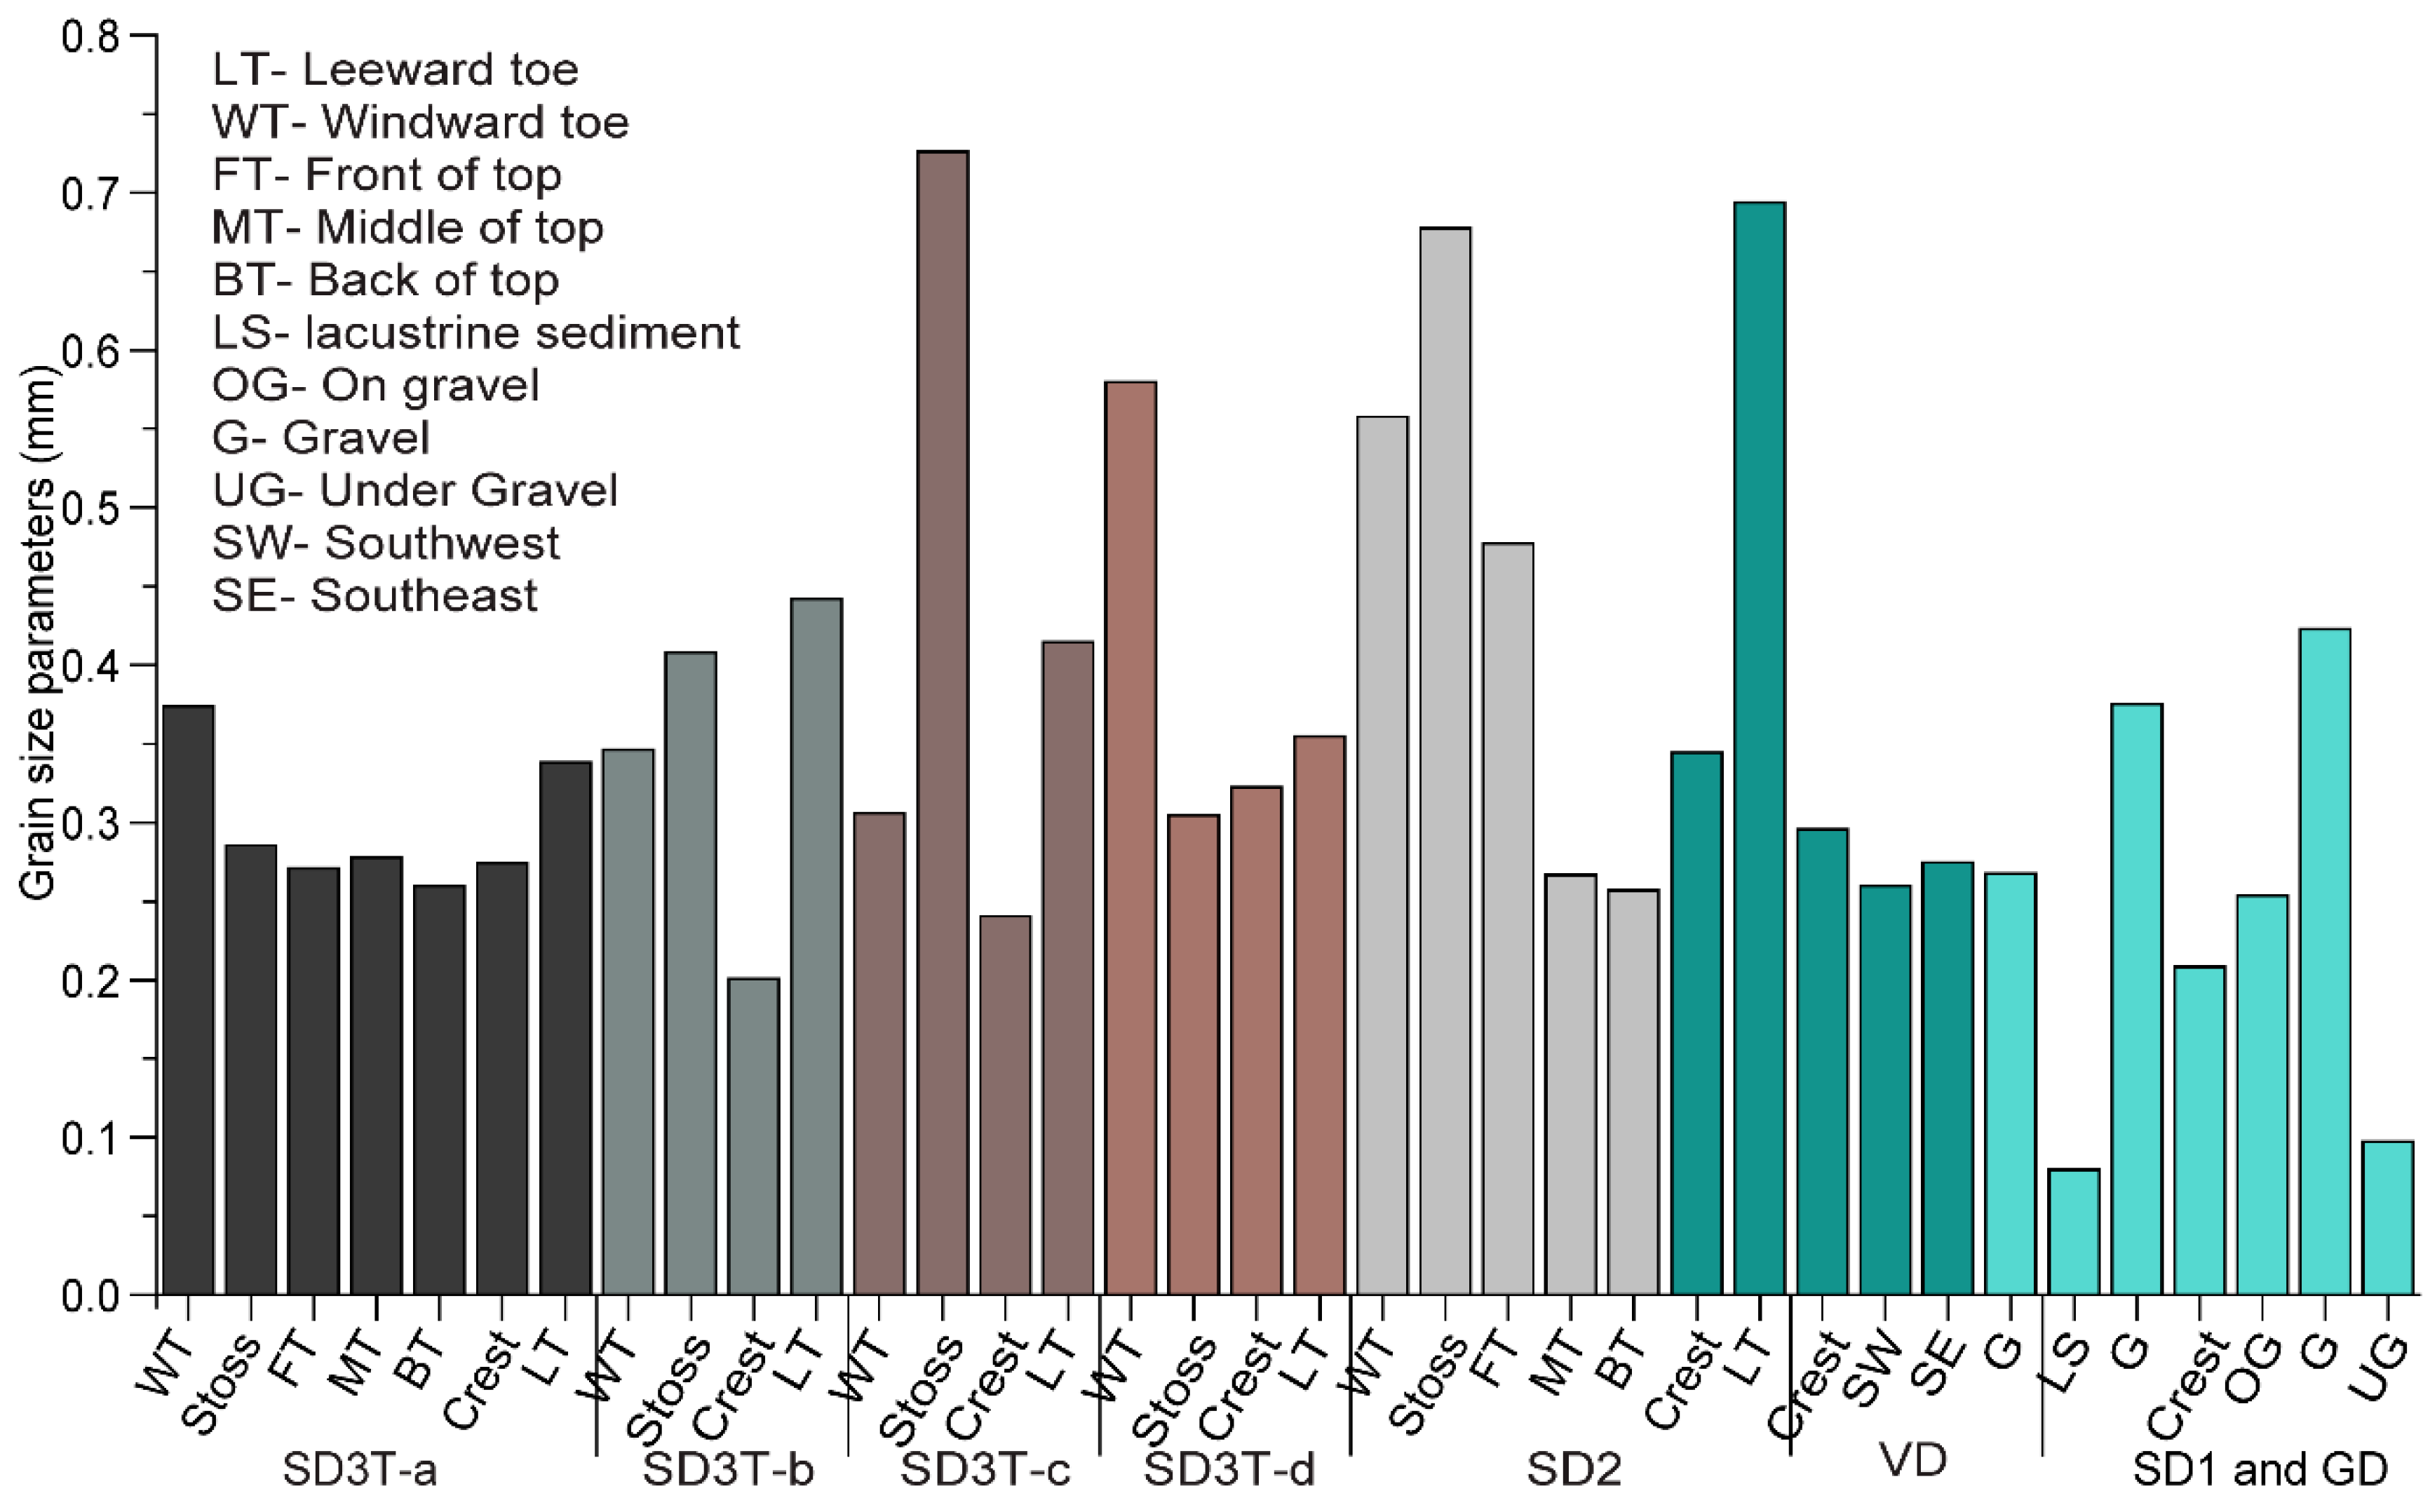
3.3. Grain Size Parameters
Figure 9 shows the grain size parameters (mean grain size, sorting, skewness, and kurtosis) in the study area. The mean grain size was the smallest for the lacustrine sediment and gravel under layer (0.08 and 0.11 mm, respectively) and larger for the dune surface (0.25 to 0.47 mm). The mean grain size for all of the sand dune surfaces decreased from upwind (SD2 is 0.47 mm) to downwind (SD3 is 0.30 mm), which was a similar behavior as in the observations by Zhang and Dong [35]. In dune SD3, the mean grain size was smaller on the windward slope than on the two limbs (0.30 mm on the windward slope (SD3T-a); 0.39 mm at SD3T-b; 0.42 and 0.35 at SD3T-c and SD3T-d, respectively).
In the study area, the mean grain size (Mz) was 0.37 ± 0.14 mm (N = 30), which was much larger than the mean grain size in the other dune fields (Table 4). In the study area, Mz was fine at the crest, which was similar to the findings by Lancaster [36] and Livingstone et al. [37]. However, there were three types (coarser, finer, or no difference between the windward slope and leeward slope) of Mz variations over the dune surfaces in the Tengger Desert and Hexi Corridor Desert [14,15].
The sand samples were mostly moderately sorted (83%) and poorly sorted (13%). Of the samples, 20% were negatively skewed, and 73% were nearly symmetrical. There were 13% that was platykurtic, and 87% were mesokurtic. In a study that was performed approximately 60 km downwind of our study area, Zhang and Dong [35] reported that the sand was mainly moderately sorted (46%) and well sorted (29%), the skewness is mainly symmetrical (40%) and negative (27%), and the kurtosis is mainly mesokurtic (37%) and platykurtic (29%). Based on the findings from the study area and those of [15], the sorting increased, the skewness graded toward symmetrical, and the kurtosis graded toward mesokurtic, with an increasing distance downwind that was consistent with the conclusions that were developed by Zhang et al. [15] from a study that was performed in the Hexi Corridor Desert.
4. Discussion
4.1. Wind Regimes and Asymmetric Barchan Dunes
Barchan dunes form when the wind direction is approximately the same over the year. According to Fryberger and Dean [9], a very narrow bimodal wind regime with a wind direction variability of approximately 0.7–0.9 leads to bedforms aligned transversely to the wind direction. Barchans form if there is a relatively low sand supply [43,44,45,46,47] and are often asymmetric, with one limb extended downwind [1,2].
The wind regime near the study area was essentially unimodal throughout almost the entire year, with main potential sand transport rates as a result of W and NW winds, as shown in Figure 5. There was, however, a change in the sand drift direction in the Autumn (E, SE), which, combined with the winds during the rest of the year, provided the major factor for the overall dune orientation [43,46]. In particular, although the divergence angle of the autumn winds and the winds from the rest of the year were obtuse (both groups of winds were nearly reverse to each other), the autumn winds were much weaker and less frequent. These winds were of insufficient strength to cause persistent elongation of one limb towards a longitudinal seif dune, which was expected to occur under obtuse bimodal wind regimes [2,4,34,47,48,49,50,51,52]. In fact, none of the barchans in the Hexi Corridor, whilst asymmetric to some degree, were undergoing a transition to longitudinal seif dunes.
Under nearly unidirectional wind regimes, such as in the Hexi Corridor from winter to summer, and in the absence of topographic influences, the barchan asymmetry is mainly caused by dune collisions and sediment supply asymmetry [1,2,3,4,53,54,55]. The relevance of these factors for the dune morphology in the Hexi Corridor has been discussed in subsequent sections.
4.2. Sand Sources for the Dune Formation and Development
Previous studies indicated that river or lacustrine sediments often provide sand sources for the dune field formation, and dune fields are often located downwind of rivers or lakes [56]. Sand sources affected dune formation and development in the study area. The local barchan dunes had formed under conditions of a scarce sand supply. Near the dry lacustrine sediment, because of the relatively high sand supply, barchanoidal dunes had formed. However, at long distances from sand sources, a few barchan dunes were observed. Based on the locations of the barchans, their sand sources could be divided into two types, namely, dry lacustrine sediment (Figure 4a,e,f) and a mixture of dry lacustrine sediment and loose gravel (Figure 4c). Wind erosion caused an increase in the coarse sediment content (Table S1) on the lacustrine surface, and yardang landforms developed (Figure 2b).
Based on the grain size characteristics from dune e, we found that the sand sources over the gravel surface were mixed. On the surface of dune e, there was coarse sand (grain size larger than 1000 μm) on the windward and leeward toes (Figure 9), which had not been reported previously. However, there was no coarse sand on the dune surfaces in the upwind region (SD1, SD2, and dry lacustrine deposits), which indicated that the desert gravel provided some of the sand material for dune formation in the study area. Collisions of medium sand grains on the gravel bed under conditions of strong winds led to the ejection of coarse particles from the gravel surface, whereupon these coarse particles were further entrained into the transport layer. Although the gravel surface provided an additional source of sediment for the dune formation, the amount of such sediment was limited. We thus concluded that the sand dunes on the gravel surface consisted of sand material that was transported from the upwind and deposited on the gravel surface. This interpretation is supported by the lack of sand dunes in the adjacent gravel desert.
4.3. Collision of Barchan Dunes
Several studies [2,57,58] showed that the collisions between the barchans can lead to the calving of small dunes from the limbs of the larger, downwind dune. Such breeding dynamics have been investigated in flume experiments [33] and numerical simulations [2,57,58], and their occurrence in real dune fields was confirmed by field observations [23]. Smaller dunes might have form in the wake region of other dunes after dune collision [23,24,59,60]. Hugenholtz and Barchyn [23], based on field observations using Google Earth images, reported that smaller barchan dunes undergo collision and calving. Ewing and Kocurek [59], and Kocurek et al. [60], based on a field experiment application of GIS, concluded that the dune geomorphic development interactions included interactions that involved the entire bedforms (merging, off-center collision, bedform repulsion, cannibalization), defect interactions (lateral linking, defect repulsion, and defect creation), and remote interaction.
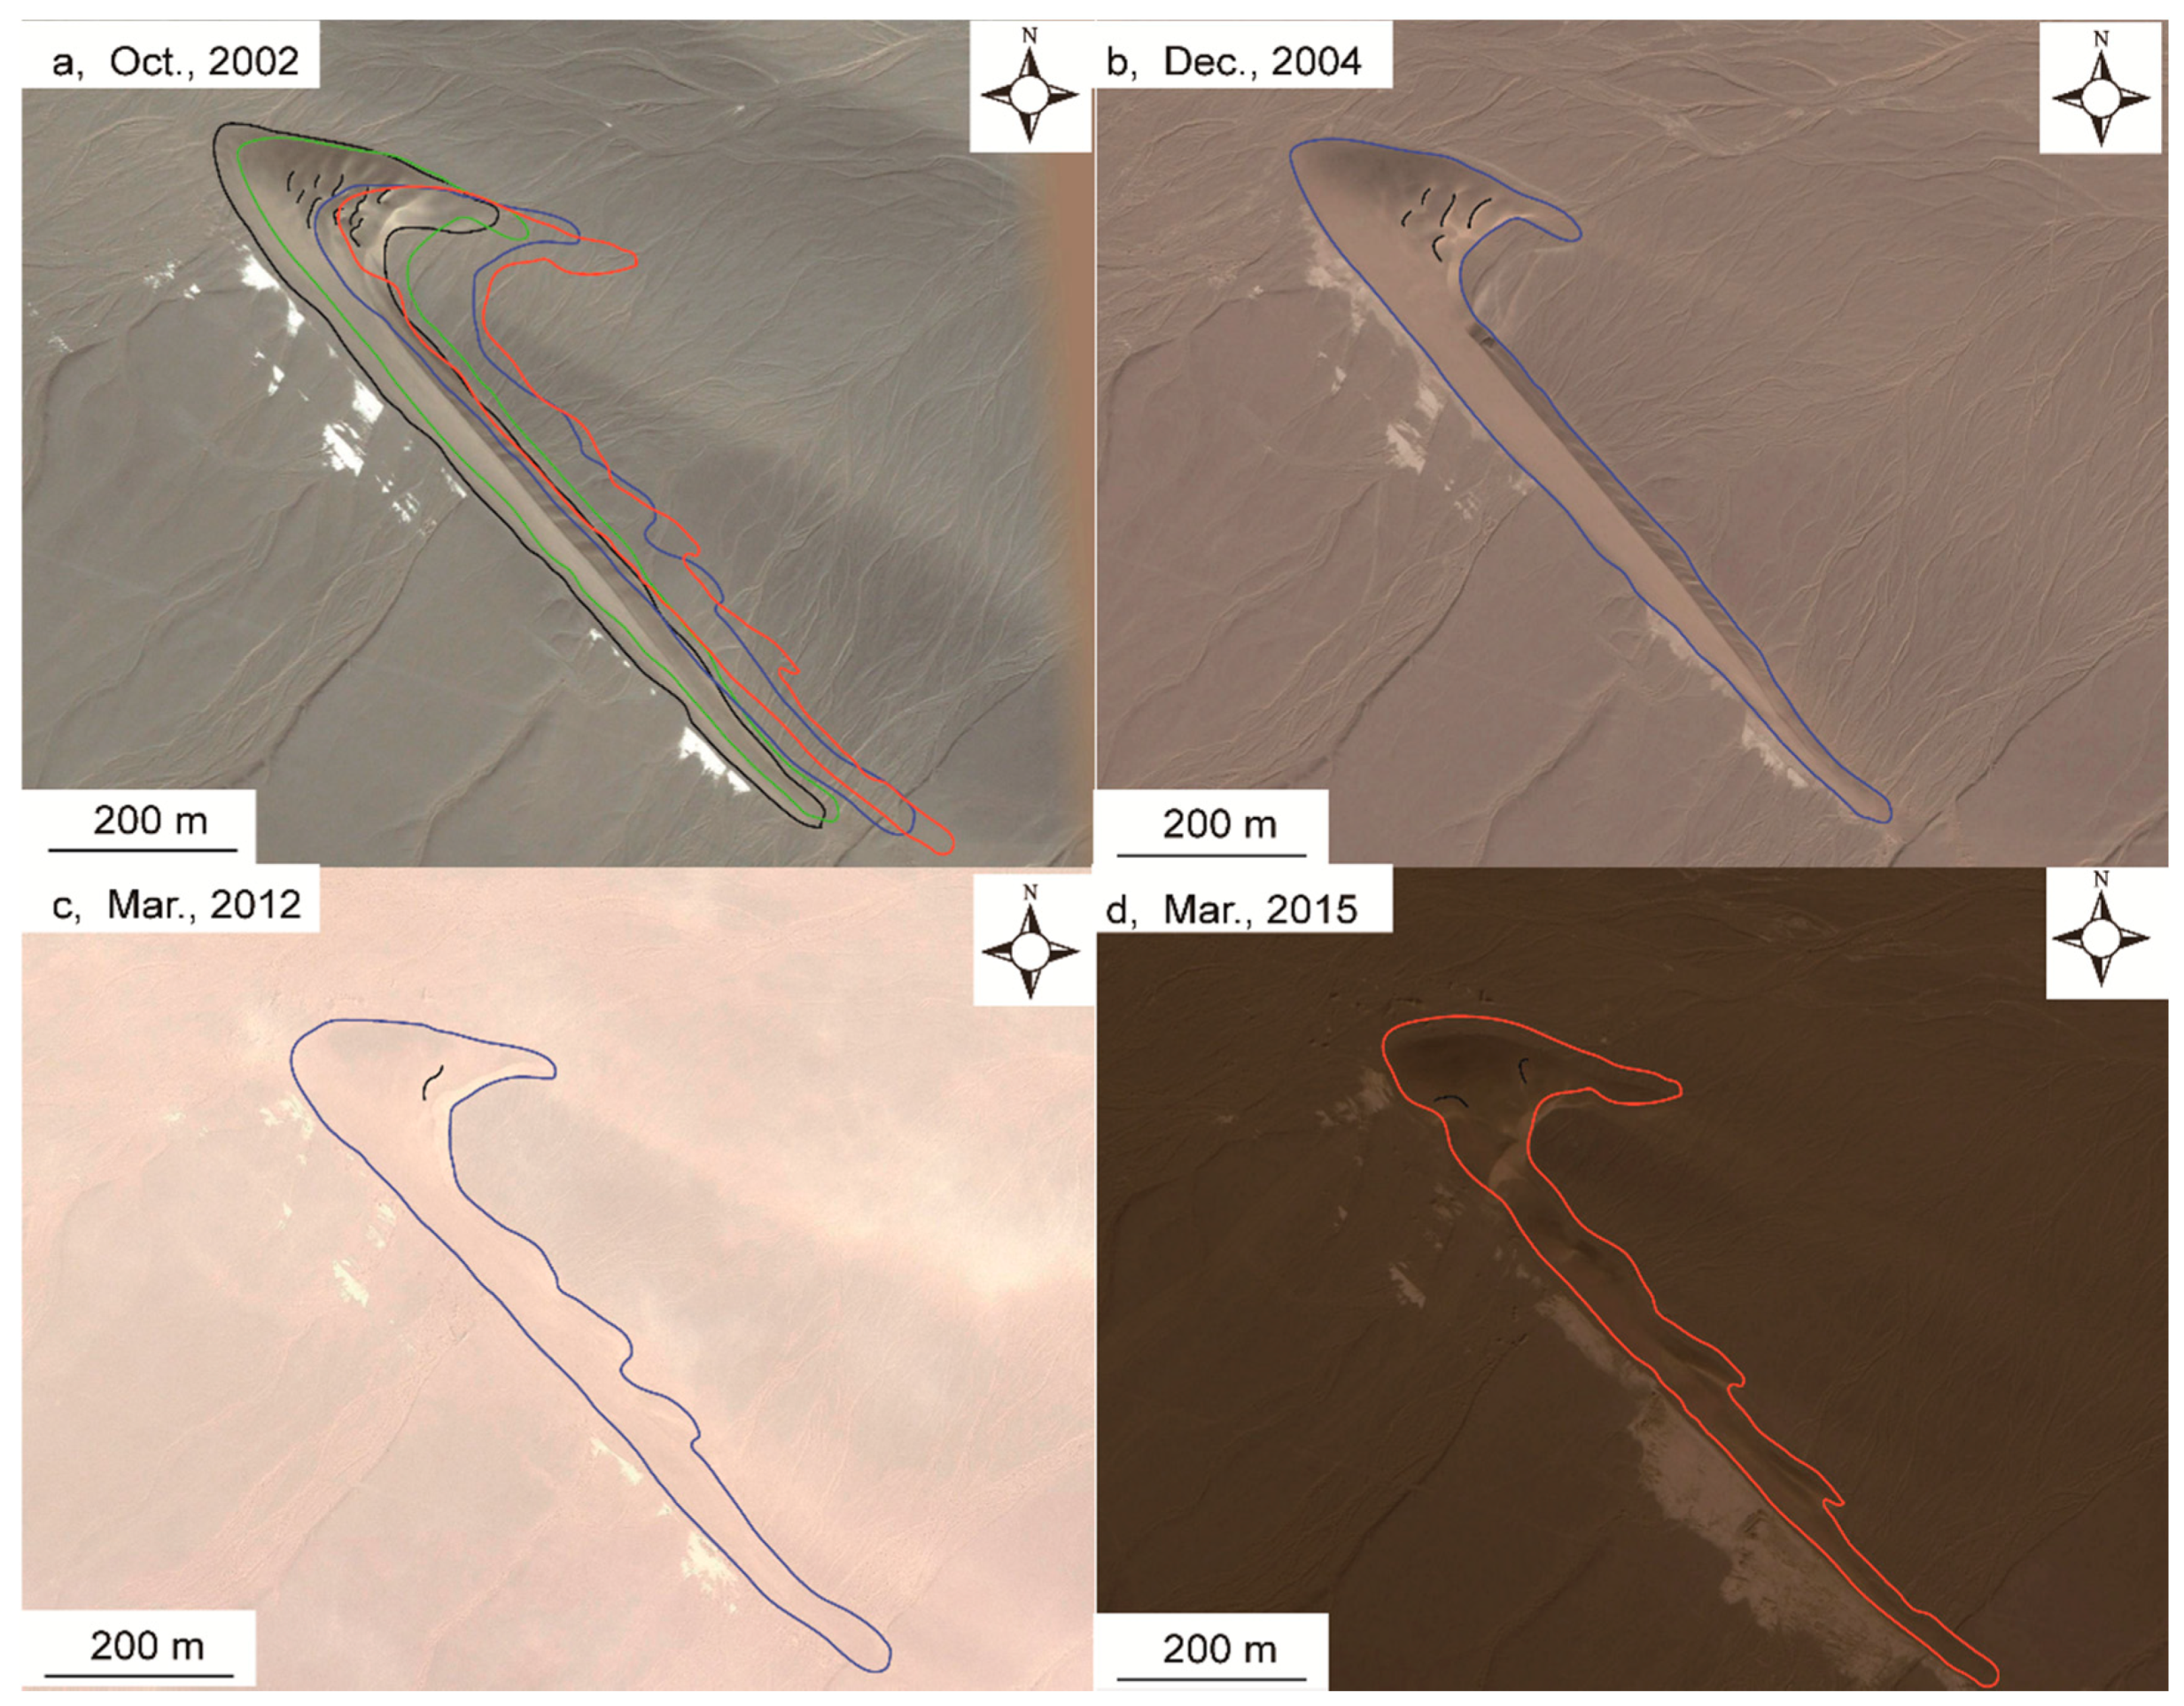
The dune collisions in our study area could be divided into two types, based on the collision characteristics, namely, collisions that involved a substantial part of the dune windward slope, and those that involved mainly the dune limbs. Our results confirmed a previous study of windward slope collisions [24]. In this type of dune collision, the sand material from the smaller, upwind dune dominated the exchange of mass in the collision process. A comparison of dunes d and e in the study region before 2002 indicated that the sand material from the upwind dune was deposited on the southwestern windward slope and formed smaller overlying dunes (Figure 3 and Figure 10). However, the sand from limb 1 of dune d (Figure 3) provided the source of sand for dune e and formed smaller overlying dunes on the northeastern windward slope (Figure 3). During the period of 2002–2004, the available sand material decreased, and the overlying smaller dune moved to the dune crest and then to the leeward slope, which caused the number of smaller dunes on the windward slope to decrease down to 0 on dune d and to 3 on dune e (Figure 10). Such limb collision dynamics had been predicted in numerical studies [33,61] and were observed in a previous field study [1]. In these previous studies, it was shown that the collision involving mainly the dune limb led to an asymmetric barchan dune shape with an elongated limb, such as we observed in the present case study on the barchan dunes of the Hexi Corridor.
Our data suggested that a decrease in sand availability might have suppressed calving on the windward slope, while a collision involving mainly the dune limbs led to an elongation of the limb and, thus, to an asymmetric barchan shape. Although our observations are based on a small number of dune interaction events, they are consistent with previous findings [33,62] that showed that the downwind dune’s limb at the same side of the upwind dune elongates. As shown by Wang et al. [62], the reason for this process was the occurrence of the flow channeling in the interdune, with the horn of the downwind dune that was at the same side as the upwind dune being subjected to a zone of the enhanced momentum and, thus, elongating.
4.4. Asymmetric Sediment Supply
The asymmetric shapes of the barchan dunes may be caused by an asymmetric sediment supply. This theory was first proposed by Rim [63] and received support recently from various studies [1,2,34,60]. Our findings provide support to the view that an asymmetric sediment supply is one main factor affecting the asymmetry of the barchan dunes in the study area.
A higher sediment budget implies higher sand flux [2]. For dune e, there was a rich source of sand (the earthy yellow region is deposited sand) available on the upwind side before 2004, and thus limb 2 of dune e (Figure 3) was longer than limb 1 (Figure 3). Moreover, the sand from upwind dunes a and b (which disappeared after 2004, Figure 3b) provided a sand source for the collision at 1 (Figure 3) and formed two overlying dunes (Figure 10), and some material was released from the limb that formed two smaller limbs (Figure 10c). The two newly formed limbs moved along with limb 1 (Figure 3) at rates of 26 and 37 m a−1 (Figure 10d). The similar horn migration rates (11.4 and 12.0 m a−1) from 2002 to 2005 also indicate that the barchan dune asymmetry is influenced by asymmetric sediment supply in the study area.
5. Conclusions
The Hexi Corridor Desert in northwestern China contains areas of sandy desert and gravel desert. Alluvial material from the Qilian Mountains had been deposited in the lowlying region of the Hexi Corridor and had formed lakes. The paleolake there had dried up as a result of climate change, which exposed the lacustrine deposits. The dry lacustrine material was eroded away by a strong wind and formed sand dunes downwind of the former lakebed, thereby providing dust material for the formation of loess. In this study, the local wind regime, dune types and movements, and surface sediments on the dunes and former lakebed were analyzed. The findings support the following conclusions:
(1) Among the four main factors contributing to barchan dune asymmetry—wind regime, topography, dune collision, and asymmetric sand supply—the latter two are the most important ones for the asymmetry in the shape of the barchans of the Hexi Corridor. In particular, the strongest and most frequent winds (winter to summer) led to a nearly unimodal wind regime and there were neither obvious topographic effects nor preferential limb alignment in the Hexi Corridor. All of the asymmetric barchans in this field are either participating in collisions or under asymmetric sediment supply. The fact that some of the barchans have the left limb extended while others elongate the right limb, is consistent with the predictions from numerical simulations [2] that the barchan collisions and heterogeneous sand supply cause an alternate elongation of the left and right limbs throughout the field.
(2) Sand availability affects dune collision dynamics and the resulting calving of small barchans. In the Hexi Corridor, calving occurs where there is a relatively rich sand supply.
(3) Our observations from the Hexi dunes suggested that the result of the dune collisions depends upon whether these involve a substantial part of the windward side, or whether mainly the limbs are participating in the process. Collisions involving mainly the windward side produce breeding, while if only the limbs are involved, then an asymmetric dune with elongated limb results.
(4) While the migration of the asymmetry dunes has been documented in a few studies [1], here we have shown that, in spite of the effects of dune interactions and the transient nature of the resulting dune shapes at Hexi Corridor, the dune migration rates and morphometrics could be described well by the scaling laws developed for steady-state, symmetric barchans. In particular, the rates of the barchan dune migration were 8.1–53.5 m year−1. These rates were inversely related to the cross-wind dune width (W) and windward slope length (L). The equation MR = A/(W + W0) describes very well the data, with A ≈ 2835 m2/s and W0 ≈ 44 m, while the best fit using MR = B/(L + L0) yields B ≈ 1722 m2/s and L0 ≈ 13 m. A linear scaling between W and L, as well as between both of the lengths and the average horn length, describes well our measurements.
(5) We have found that the grain size distribution is complex, but its effect on the dune shape still remains to be investigated in future work, using the data collected here. The mean grain size on the dune surfaces is much larger (0.37 mm) than that of the other dunes worldwide (Table 4).
It is important to remark that the morphodynamic processes owing to sand transport events within the time gap of 2–7 years, between two consecutive images, may have also affected the dune shape. Since we had no imagery of the field within this time gap, our analysis might have thus missed some of the sediment transport mechanisms and processes that can be further contributing to the dune dynamics in the Hexi Corridor. Although our data were obtained over a time span of 12 years, thus representing the longest period of investigation of asymmetric barchan dune dynamics that was ever reported, further field observations and modeling work are thus indispensable to continue the present work.
Moreover, the number of dunes in the Hexi Corridor is small, thus making it difficult to obtain large enough statistics to draw conclusions about the detailed dune behavior, for instance, as a function of polydispersity and spatial inhomogeneity in the sediment size distributions. Nevertheless, our observations clearly showed how the asymmetric sand supply and dune collisions are affecting the dune shapes in the Hexi Corridor (as summarized in the conclusions, 1–5, above), and are providing valuable data on sediment size distributions in a field where asymmetric barchan shapes emerge because of local sediment conditions and dune interactions. Recent modeling work has helped to push forward our understanding of sediment transport and dune migration dynamics [64,65,66,67], and the data provided in the present manuscript is valuable to inspire future applications of such theoretical modeling and numerical simulations. It would be interesting to investigate the dune processes in Hexi Corridor by means of numerical modeling, in particular, to verify the conclusions made here on the effect of the sediment source distributions, barchan collisions, and asymmetry in the sediment supply on the dune shape.
Supplementary Materials
The following are available online at https://www.mdpi.com/2076-3263/8/6/204/s1, Table S1: Grain-size distributions in the four subregions of the study area; Table S2: Mean percentage frequencies of wind directions in the four quadrants and in four directions in the NW quadrant.
Author Contributions
Z.Z., Z.B and G.Y. performed the field research and collected the granular samples. Z.Z. and E.J.R.P. analyzed the data and wrote the paper. All authors contributed to discussions and revision of the manuscript.
Funding
This research was funded by Youth Innovation Promotion Association of the Chinese Academy of Sciences grant number [2015348], the National Natural Science Foundation of China [41771011], the West Light Foundation of CAS, and the German Research Foundation for funding through Grant RI 2497/3-1.
Acknowledgments
We thank the Google Earth’s images and two anonymous reviewers for constructive comments.
Conflicts of Interest
The authors declare no conflict of interest.
References
- Bourke, M.C. Barchan dune asymmetry: Observations from Mars and Earth. Icarus 2010, 205, 183–197. [Google Scholar] [CrossRef]
- Parteli, E.J.R.; Durán, O.; Bourke, M.C.; Tsoar, H.; Pöschel, T.; Herrmann, H. Origins of barchan dune asymmetry: Insights from numerical simulations. Aeolian Res. 2014, 12, 121–133. [Google Scholar] [CrossRef] [Green Version]
- Lv, P.; Dong, Z.; Narteau, C.; Rozier, O. Morphodynamic mechanisms for the formation of asymmetric barchans: Improvement of the Bagnold and Tsoar models. Environ. Earth Sci. 2016, 75, 259. [Google Scholar] [CrossRef]
- Tsoar, H.; Parteli, E.J.R. Bidirectional winds, barchan dune asymmetry and formation of seif dunes from barchans: A discussion. Environ. Earth Sci. 2016, 75, 1237. [Google Scholar] [CrossRef]
- Bagnold, R.A. The Physics of Blown Sand and Desert Dunes; William Morrow & Company: New York, NY, USA, 1941. [Google Scholar]
- Tsoar, H. The formation of seif dunes from barchans-a discussion. Z. Geomorphol. 1984, 28, 99–103. [Google Scholar]
- Wang, N.A.; Li, Z.L.; Li, Y.; Cheng, H.Y. Millennial-scale environmental changes in the Asian monsoon margin during the Holocene, implicated by the lake evolution of Huahai Lake in the Hexi Corridor of northwest China. Quat. Int. 2013, 313–314, 100–109. [Google Scholar] [CrossRef]
- Nottebaum, V.; Lehmkuhl, F.; Stauch, G.; Lu, H.Y.; Yi, S.Q. Late Quaternary aeolian sand deposition sustained by fluvial reworking and sediment supply in the Hexi Corridor-An example from northern Chinese drylands. Geomorphology 2015, 250, 113–127. [Google Scholar] [CrossRef]
- Fryberger, S.G.; Dean, G. Dune forms and winds regime. In A Study of Global Sand Seas; Geological Survey Professional Paper; McKee, E.D., Ed.; U.S. Geological Survey: Washington, DC, USA, 1979; pp. 137–169. [Google Scholar]
- Bullard, J.E. A note on the use of the ‘Fryberger Method’ for evaluating potential sand transport by wind. J. Sediment. Res. 1997, 67, 499–501. [Google Scholar] [CrossRef]
- Pearce, K.I.; Walker, I.J. Frequency and magnitude biases in the ‘Fryberger’ model, with implications for characterizing geomorphically effective winds. Geomorphology 2005, 68, 39–55. [Google Scholar] [CrossRef]
- Wang, X.M.; Dong, Z.B.; Yan, P.; Zhang, J.W.; Qian, G.Q. Wind energy environments and dune field activity in the Chinese deserts. Geomorphology 2005, 65, 33–48. [Google Scholar] [CrossRef]
- Zhang, Z.C.; Dong, Z.; Qian, G.; Li, J.; Luo, W. Formation and development of dunes in the Northern Qarhan Desert, central Qaidam Basin, China. Geol. J. 2018, 53, 1123–1134. [Google Scholar] [CrossRef]
- Zhang, Z.C.; Dong, Z.B.; Li, C.X. Wind regime and sand transport in China’s Badain Jaran Desert. Aeolian Res. 2015, 17, 1–13. [Google Scholar] [CrossRef]
- Zhang, Z.C.; Dong, Z.B.; Wen, Q.; Jiang, C.W. Wind regimes and aeolian geomorphology in the western and southwestern Tengger Desert, NW China. Geol. J. 2015, 50, 707–719. [Google Scholar] [CrossRef]
- Hereher, M.E. Sand movement patterns in the Western Desert of Egypt: An environmental concern. Environ. Earth Sci. 2010, 59, 1119–1127. [Google Scholar] [CrossRef]
- Hugenholtz, C.H.; Barchyn, T.E. Spatial analysis of sand dunes with a new global topographic dataset: New approaches and opportunities. Earth Surf. Process. Landf. 2010, 35, 986–992. [Google Scholar] [CrossRef]
- Sparavigna, A.C. A Study of Moving Sand Dunes by Means of Satellite Images. Int. J. Sci. 2013, 8, 33–42. [Google Scholar] [CrossRef]
- Hamdan, M.A.; Refaat, A.A.; Wahed, M.A. Morphologic characteristics and migration rate assessment of barcha dunes in the Southeastern Western Desert of Egypt. Geomorphology 2016, 257, 57–74. [Google Scholar] [CrossRef]
- Bailey, S.D.; Bristow, C.S. Migration of parabolic dunes at Aberffraw, Anglesey, north Wales. Geomorphology 2004, 59, 165–174. [Google Scholar] [CrossRef]
- Levin, N.; Ben-Dor, E. Monitoring sand dune stabilization along the coastal dunes of Ashdod-Nizanim, Israel, 1945–1999. J. Arid Environ. 2004, 58, 335–355. [Google Scholar] [CrossRef]
- Levin, N. Climate-driven changes in tropical cyclone intensity shape dune activity on Earth’s largest sand island. Geomorphology 2011, 125, 239–252. [Google Scholar] [CrossRef]
- Hugenholtz, C.H.; Levin, N.; Barchyn, T.E.; Baddock, M.C. Remote sensing and spatial analysis of aeolian sand dunes: A review and outlook. Earth-Sci. Rev. 2012, 111, 319–334. [Google Scholar] [CrossRef] [Green Version]
- Hugenholtz, C.H.; Barchyn, T.E. Real barchan dune collisions and ejections. Geophys. Res. Lett. 2012, 39, L02306. [Google Scholar] [CrossRef]
- Tsoar, H.; Blumberg, D.G. Formation of parabolic dunes from barchan and transverse dunes along Israel’s Mediterranean coast. Earth Surf. Process. Landf. 2002, 27, 1147–1161. [Google Scholar] [CrossRef]
- Scuderi, L.A.; Weissmann, G.S.; Hartley, A.J.; Yang, X.P.; Lancaster, N. Application of Database Approaches to the Study of Earth’s Aeolian Environments: Community Needs and Goals. Aeolian Res. 2017, 27, 79–109. [Google Scholar] [CrossRef]
- Kroy, K.; Sauermann, G.; Herrmann, H.J. Minimal model for sand dunes. Phys. Rev. Lett. 2002, 88, 054301. [Google Scholar] [CrossRef] [PubMed]
- Durán, O.; Parteli, E.J.R.; Herrmann, H.J. A continuous model for sand dunes: Review, new developments and application to barchan dunes and barchan dune fields. Earth Surf. Process. Landf. 2010, 35, 1591–1600. [Google Scholar] [CrossRef]
- Cooke, R.; Warren, A.; Goudie, A. Desert Geomorphology; UCL Press: London, UK, 1993; Volume 526, pp. 372–373. [Google Scholar]
- Sauermann, G.; Rognon, P.; Poliakov, A.; Herrmann, H.J. The shape of the barchan dunes of Southern Morocco. Geomorphology 2000, 36, 47–62. [Google Scholar] [CrossRef]
- Kroy, K.; Fischer, S.; Obermayer, B. The shape of barchan dunes. J. Phys. Condens. Matter 2005, 17. [Google Scholar] [CrossRef]
- Hesp, P.A.; Hastings, K. Width, height and slope relationships and aerodynamic maintenance of barchans. Geomorphology 1998, 22, 193–204. [Google Scholar] [CrossRef]
- Hersen, P.; Douady, S. Collision of barchan dunes as a mechanism of size regulation. Geophys. Res. Lett. 2005, 32, L21403. [Google Scholar] [CrossRef]
- Parteli, E.J.R.; Herrmann, H.J. Saltation transport on Mars. Phys. Rev. Lett. 2007, 98, 198001. [Google Scholar] [CrossRef] [PubMed]
- Zhang, Z.C.; Dong, Z.B. Grain size characteristics in the Hexi Corridor Desert. Aeolian Res. 2015, 18, 55–67. [Google Scholar] [CrossRef]
- Lancaster, N. Geomorphology of Desert Dunes; Routledge: New York, NY, USA, 1995. [Google Scholar]
- Livingstone, I.; Warren, A. Aeolian Geomorphology: An Introduction; Longman: Singapore, 1996. [Google Scholar]
- Lancaster, N. Grain size characteristics of Namib Desert linear dunes. Sedimentology 1981, 28, 115–122. [Google Scholar] [CrossRef]
- Lancaster, N. Star dunes. Prog. Phys. Geogr. 1989, 13, 67–92. [Google Scholar] [CrossRef]
- Hasi, E.; Wang, G.Y. Grain-size variation on transverse dune in connection with slope morphology at fringe of Tengger Desert. J. Desert Res. 1996, 16, 216–221. (In Chinese) [Google Scholar]
- Dong, Z.B.; Su, Z.Z.; Qian, G.Q.; Luo, W.Y.; Zhang, Z.C.; Wu, J.F. Aeolian Geomorphology of the Kumtagh Desert; Science Press: Beijing, China, 2011. [Google Scholar]
- Qian, G.Q.; Dong, Z.B.; Luo, W.Y.; Zhang, Z.C.; Xiao, S.C.; Zhao, A.G. Grain size characteristics and spatial variation of surface sediment in the Badain Jaran Desert. J. Desert Res. 2011, 31, 1357–1364. (In Chinese) [Google Scholar]
- Wasson, R.J.; Hyde, R. Factors determining desert dune type. Nature 1983, 304, 337–339. [Google Scholar] [CrossRef]
- Lima, H.P.M.; Parteli, E.J.R.; Andrade, J.S., Jr.; Herrmann, H.J. Linear stability analysis of transverse dunes. Physica A 2012, 391, 4606–4614. [Google Scholar]
- Lucas, A.; Rodriguez, S.; Narteau, C.; Charnay, B.; Courrech du Pont, S.; Tokano, T.; Garcia, A.; Thiriet, M.; Hayes, A.G.; Lorenz, R.D.; et al. Growth mechanisms and dune orientation on Titan. Geophys. Res. Lett. 2014, 41, 6093–6100. [Google Scholar] [CrossRef] [Green Version]
- Courrech du Pont, S.; Narteau, C.; Gao, X. Two modes for dune orientation. Geology 2014, 42, 743–746. [Google Scholar] [CrossRef]
- Lucas, A.; Narteau, C.; Rodriguez, S.; Rozier, O.; Callot, Y.; Garcia, A.; Courrech du Pont, S. Sediment flux from the morphodynamics of elongating linear dunes. Geology 2015, 43, 1027–1030. [Google Scholar] [CrossRef] [Green Version]
- Rubin, D.M.; Hunter, R.E. Bedform alignment in directionally varying flows. Science 1987, 237, 276–278. [Google Scholar] [CrossRef] [PubMed]
- Rubin, D.M.; Ikeda, H. Flume experiments on the alignment of transverse, oblique, and longitudinal dunes in directionally varying flows. Sedimentology 1990, 37, 673–684. [Google Scholar] [CrossRef]
- Rubin, D.M.; Tsoar, H. A second look at western Sinai seif dunes and their lateral migration. Geomorphology 2008, 93, 335–342. [Google Scholar] [CrossRef]
- Parteli, E.J.R.; Durán, O.; Tsoar, H.; Schwämmle, V.; Herrmann, H.J. Dune formation under bimodal winds. Proc. Natl. Acad. Sci. USA 2009, 106, 22085–22089. [Google Scholar] [CrossRef] [PubMed] [Green Version]
- Reffet, E.; Courrech du Pont, S.; Hersen, P.; Douady, S. Formation and stability of transverse and longitudinal sand dunes. Geology 2010, 38, 491–494. [Google Scholar] [CrossRef]
- Bourke, M.C.; Goudie, A.S. Varieties of barchan form in the Namib Desert and on Mars. Aeolian Res. 2009, 1, 45–54. [Google Scholar] [CrossRef] [Green Version]
- Elbelrhiti, H.; Andreotti, B.; Claudin, P. Barchan dune corridors: Field characterization and investigation of control parameters. J. Geophys. Res. 2008, 113, F02S15. [Google Scholar] [CrossRef]
- Elbelrhiti, H. Field evidence of appearance and disappearance of the brink line on barchans. Aeolian Res. 2015, 18, 115–120. [Google Scholar] [CrossRef]
- Zhang, Z.C.; Dong, Z.B. Dune field patterns and wind environments in the middle reaches of the Heihe Basin. J. Desert Res. 2014, 34, 332–341. [Google Scholar]
- Schwämmle, V.; Herrmann, H.J. Solitary wave behaviour of sand dunes. Nature 2003, 426, 619–620. [Google Scholar] [CrossRef] [PubMed]
- Durán, O.; Schwämmle, V.; Herrmann, H.J. Breeding and solitary wave behavior of dunes. Phys. Rev. E 2005, 72, 021308. [Google Scholar] [CrossRef] [PubMed]
- Ewing, R.C.; Kocurek, G.A. Aeolian dune interactions and dune-field pattern formation: White Sands Dune Field, New Mexico. Sedimentology 2010, 57, 1199–1219. [Google Scholar] [CrossRef]
- Kocurek, G.A.; Ewing, R.C.; Mohrig, D. How do bedform patterns arise? New views on the role of bedform interactions within a set of boundary condition. Earth Surf. Process. Landf. 2010, 35, 51–63. [Google Scholar] [CrossRef]
- Endo, N.; Taniguchi, K.; Katsuki, A. Observation of the whole process of interaction between barchans by flume experiments. Geophys. Res. Lett. 2004, 31, 12503. [Google Scholar] [CrossRef]
- Wang, C.; Tang, Z.; Bristow, N.; Blois, G.; Christensen, K.T.; Anderson, W. Numerical and experimental study of flow over stages of an offset merger dune interaction. Comput. Fluids 2017, 158, 72–83. [Google Scholar] [CrossRef]
- Rim, M. Simulations by dynamical model, of sand tract morphology occurring in Israel. Bull. Res. Counc. Isr. 1958, 7-G, 123–137. [Google Scholar]
- Selmani, H.; Valance, A.; Ould El Moctar, A.; Dupont, P.; Zegadi, R. Aeolian sand transport in out-of-equilibrium regimes. Geophys. Res. Lett. 2018, 45, 1838–1844. [Google Scholar] [CrossRef]
- Khosronejad, A.; Sotiropoulos, F. On the genesis and evolution of barchan dunes: Morphodynamics. J. Fluid Mech. 2017, 815, 117–148. [Google Scholar] [CrossRef]
- Pähtz, T.; Parteli, E.J.R.; Kok, J.; Herrmann, H.J. Analytical model for flux saturation in sediment transport. Phys. Rev. E 2014, 89, 052213. [Google Scholar] [CrossRef] [PubMed] [Green Version]
- Andreotti, B.; Claudin, P. Aeolian and subaqueous bedforms in shear flows. Philos. Trans. R. Soc. A 2013, 371, 20120364. [Google Scholar] [CrossRef] [PubMed]
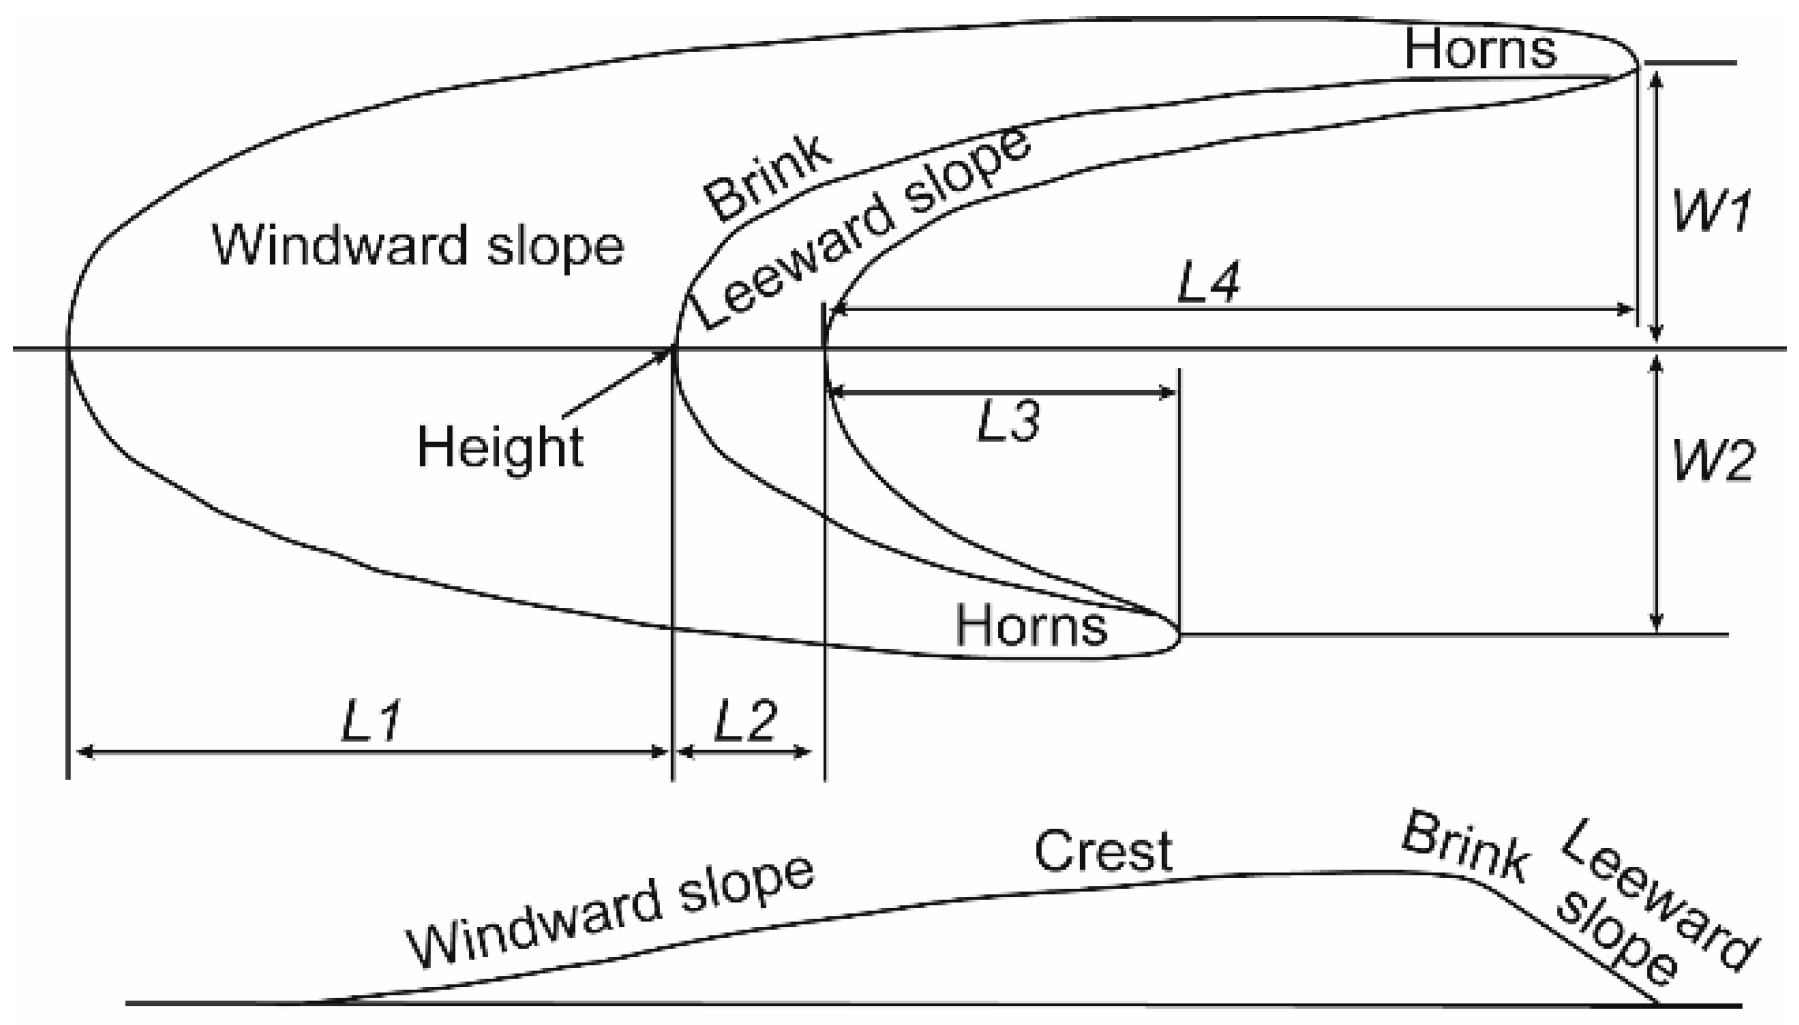
Figure 1.
Schematical diagram of an asymmetric barchan dune.

Figure 2.
Location of the study area. (a) Landform, weather stations, dry lacustrine deposition, and distribution of dunes in the study area; (b) Location of the study area in the Gansu province; (c) Location of Gansu province.
Figure 2.
Location of the study area. (a) Landform, weather stations, dry lacustrine deposition, and distribution of dunes in the study area; (b) Location of the study area in the Gansu province; (c) Location of Gansu province.

Figure 3.
Dune migration in the study area. (a) Google Earth Image; (b) Dune contours showing dune positions and shapes at different times. The green lines in (a) denote two roads that have been selected as control lines for evaluating dune migration. The fixed reference sites adopted for the dune migration analysis are indicated by the green symbols in the figure (see legend).

Figure 4.
Typical landforms in the study area. (a) Asymmetric barchan dune e and its limbs (1 and 2) (Figure 3), as well as four field sand samples’ collection transacts and sites; (b) Yardang, lined in the upwind of the study region; (c) Field samples collection sites for the dune SD2; (d) Gravel desert surface in the central part of the study area (Figure 3).

Figure 5.
Wind regime on the upwind and downwind sides of the study area. (a) Seasonal potential sand transport parameters at the upwind of the study (Huahai); (b) Seasonal potential sand transport parameters at the downwind of the study (Shendiwan); (c,d) The annual potential sand transport parameters upwind (Huahai) and downwind (Shendiwan) of the study area. DP: Drift potential; RDP: Resultant drift potential; RDD: Resultant drift direction.

Figure 6.
The maximal wind direction changed during four observation periods.

Figure 7.
Dune morphometry.

Figure 8.
Dune migration rate as a function of cross-wind dune width (W) and windward slope length (L1).
Figure 8.
Dune migration rate as a function of cross-wind dune width (W) and windward slope length (L1).

Figure 9.
Grain size parameters for the sand dunes, at (a) SD1 and GD, (b) VD, (c) SD2, (d) SD3T-a, (e) SD3T-b, (f) SD3T-c, and (g) SD3T-d.
Figure 9.
Grain size parameters for the sand dunes, at (a) SD1 and GD, (b) VD, (c) SD2, (d) SD3T-a, (e) SD3T-b, (f) SD3T-c, and (g) SD3T-d.

Figure 10.
Changes in dune e from 2002 to 2015.


Table 1.
Dune e pattern parameters during the observation period. The definition of all parameters presented in Figure 1.
Table 1.
Dune e pattern parameters during the observation period. The definition of all parameters presented in Figure 1.
| 2002 | 2004 | 2012 | 2015 | |
|---|---|---|---|---|
| L1/L2 | 288.25 | 183.13 | 117.60 | 111.46 |
| W1/W2 | 0.16 | 0.18 | 0.25 | 0.27 |
| L3/L4 | 0.13 | 0.14 | 0.12 | 0.18 |
| L1 + L2 + L4/W1 + W2 | 2.26 | 2.27 | 2.23 | 2.27 |
| W2/L3 | 0.50 | 0.49 | 0.45 | 0.43 |
| W1/L4 | 0.65 | 0.63 | 0.96 | 0.64 |
Table 2.
Migration rates of dunes a, b, c, d, and f in Figure 3b during 2002–2004. MR = migration rate (m a−1); D = migration direction (°); WT = windward toe; LT = leeward toe; H1 = horn 1; H2 = horn 2.
Table 2.
Migration rates of dunes a, b, c, d, and f in Figure 3b during 2002–2004. MR = migration rate (m a−1); D = migration direction (°); WT = windward toe; LT = leeward toe; H1 = horn 1; H2 = horn 2.
| Locations | Dune a | Dune b | Dune c | Dune d | Dune f | |||||
|---|---|---|---|---|---|---|---|---|---|---|
| MR | D | MR | D | MR | D | MR | D | MR | D | |
| WT | 30.2 | 128 | 41.0 | 129 | 57.2 | 116 | 10.0 | 110 | 43.3 | 114 |
| LT | 24.4 | 121 | 40.2 | 128 | 53.7 | 118 | 5.0 | 112 | 32.2 | 122 |
| H1 | 25.9 | 113 | 33.1 | 124 | 50.4 | 116 | 18.6 | 108 | 33.5 | 101 |
| H2 | 24.3 | 135 | 37.2 | 134 | 52.7 | 121 | 5.8 | 116 | 33.4 | 135 |
| Mean | 26.2 | 125 | 37.9 | 111 | 53.5 | 119 | 9.8 | 115 | 35.6 | 108 |
Table 3.
Migration of sand dune e in Figure 3b. L = locations.
Table 3.
Migration of sand dune e in Figure 3b. L = locations.
| 2002–2004 | 2004–2012 | |||||||||
| L | WT | LT | H1 | H2 | Mean | WT | LT | H1 | H2 | Mean |
| MR | 5.8 | 7.4 | 11.4 | 8.2 | 8.2 | 9.8 | 7.1 | 5.2 | 10.5 | 8.1 |
| D | 120 | 123 | 123 | 137 | 123 | 133 | 125 | 112 | 134 | 126 |
| 2012–2015 | 2002–2015 | |||||||||
| L | WT | LT | H1 | H2 | Mean | WT | LT | H1 | H2 | Mean |
| MR | 20.4 | 10.4 | 28.0 | 19.3 | 19.5 | 11.1 | 7.7 | 11.4 | 12.0 | 10.5 |
| D | 115 | 121 | 124 | 110 | 118 | 127 | 120 | 116 | 114 | 118 |
Table 4.
Mean grain size in deserts worldwide. Mz is the mean grain size.
| Region | Mz (mm) | References |
|---|---|---|
| Namib Desert | 0.15–0.29 | Lancaster [38,39] |
| Deserts worldwide | 0.11–0.33 | Lancaster [36,39] |
| Tengger Desert | 0.17 | Hasi and Wang [40]; Zhang et al. [14] |
| Kumutagh Desert | 0.19 | Dong et al. [41] |
| Badain Jaran Desert | 0.19 | Qian et al. [42] |
| Hexi Corridor Desert | 0.17–0.23 | Zhang et al. [15] |
| Hexi Corridor barchan dunes | 0.37 ± 0.14 | This paper |
© 2018 by the authors. Licensee MDPI, Basel, Switzerland. This article is an open access article distributed under the terms and conditions of the Creative Commons Attribution (CC BY) license (http://creativecommons.org/licenses/by/4.0/).
Share and Cite
MDPI and ACS Style
Zhang, Z.; Dong, Z.; Hu, G.; Parteli, E.J.R. Migration and Morphology of Asymmetric Barchans in the Central Hexi Corridor of Northwest China. Geosciences 2018, 8, 204. https://doi.org/10.3390/geosciences8060204
AMA Style
Zhang Z, Dong Z, Hu G, Parteli EJR. Migration and Morphology of Asymmetric Barchans in the Central Hexi Corridor of Northwest China. Geosciences. 2018; 8(6):204. https://doi.org/10.3390/geosciences8060204
Chicago/Turabian StyleZhang, Zhengcai, Zhibao Dong, Guangyin Hu, and Eric J. R. Parteli. 2018. "Migration and Morphology of Asymmetric Barchans in the Central Hexi Corridor of Northwest China" Geosciences 8, no. 6: 204. https://doi.org/10.3390/geosciences8060204
Note that from the first issue of 2016, this journal uses article numbers instead of page numbers. See further details here.