Migration of Barchan Dunes in Qatar–Controls of the Shamal, Teleconnections, Sea-Level Changes and Human Impact


Abstract
1. Introduction
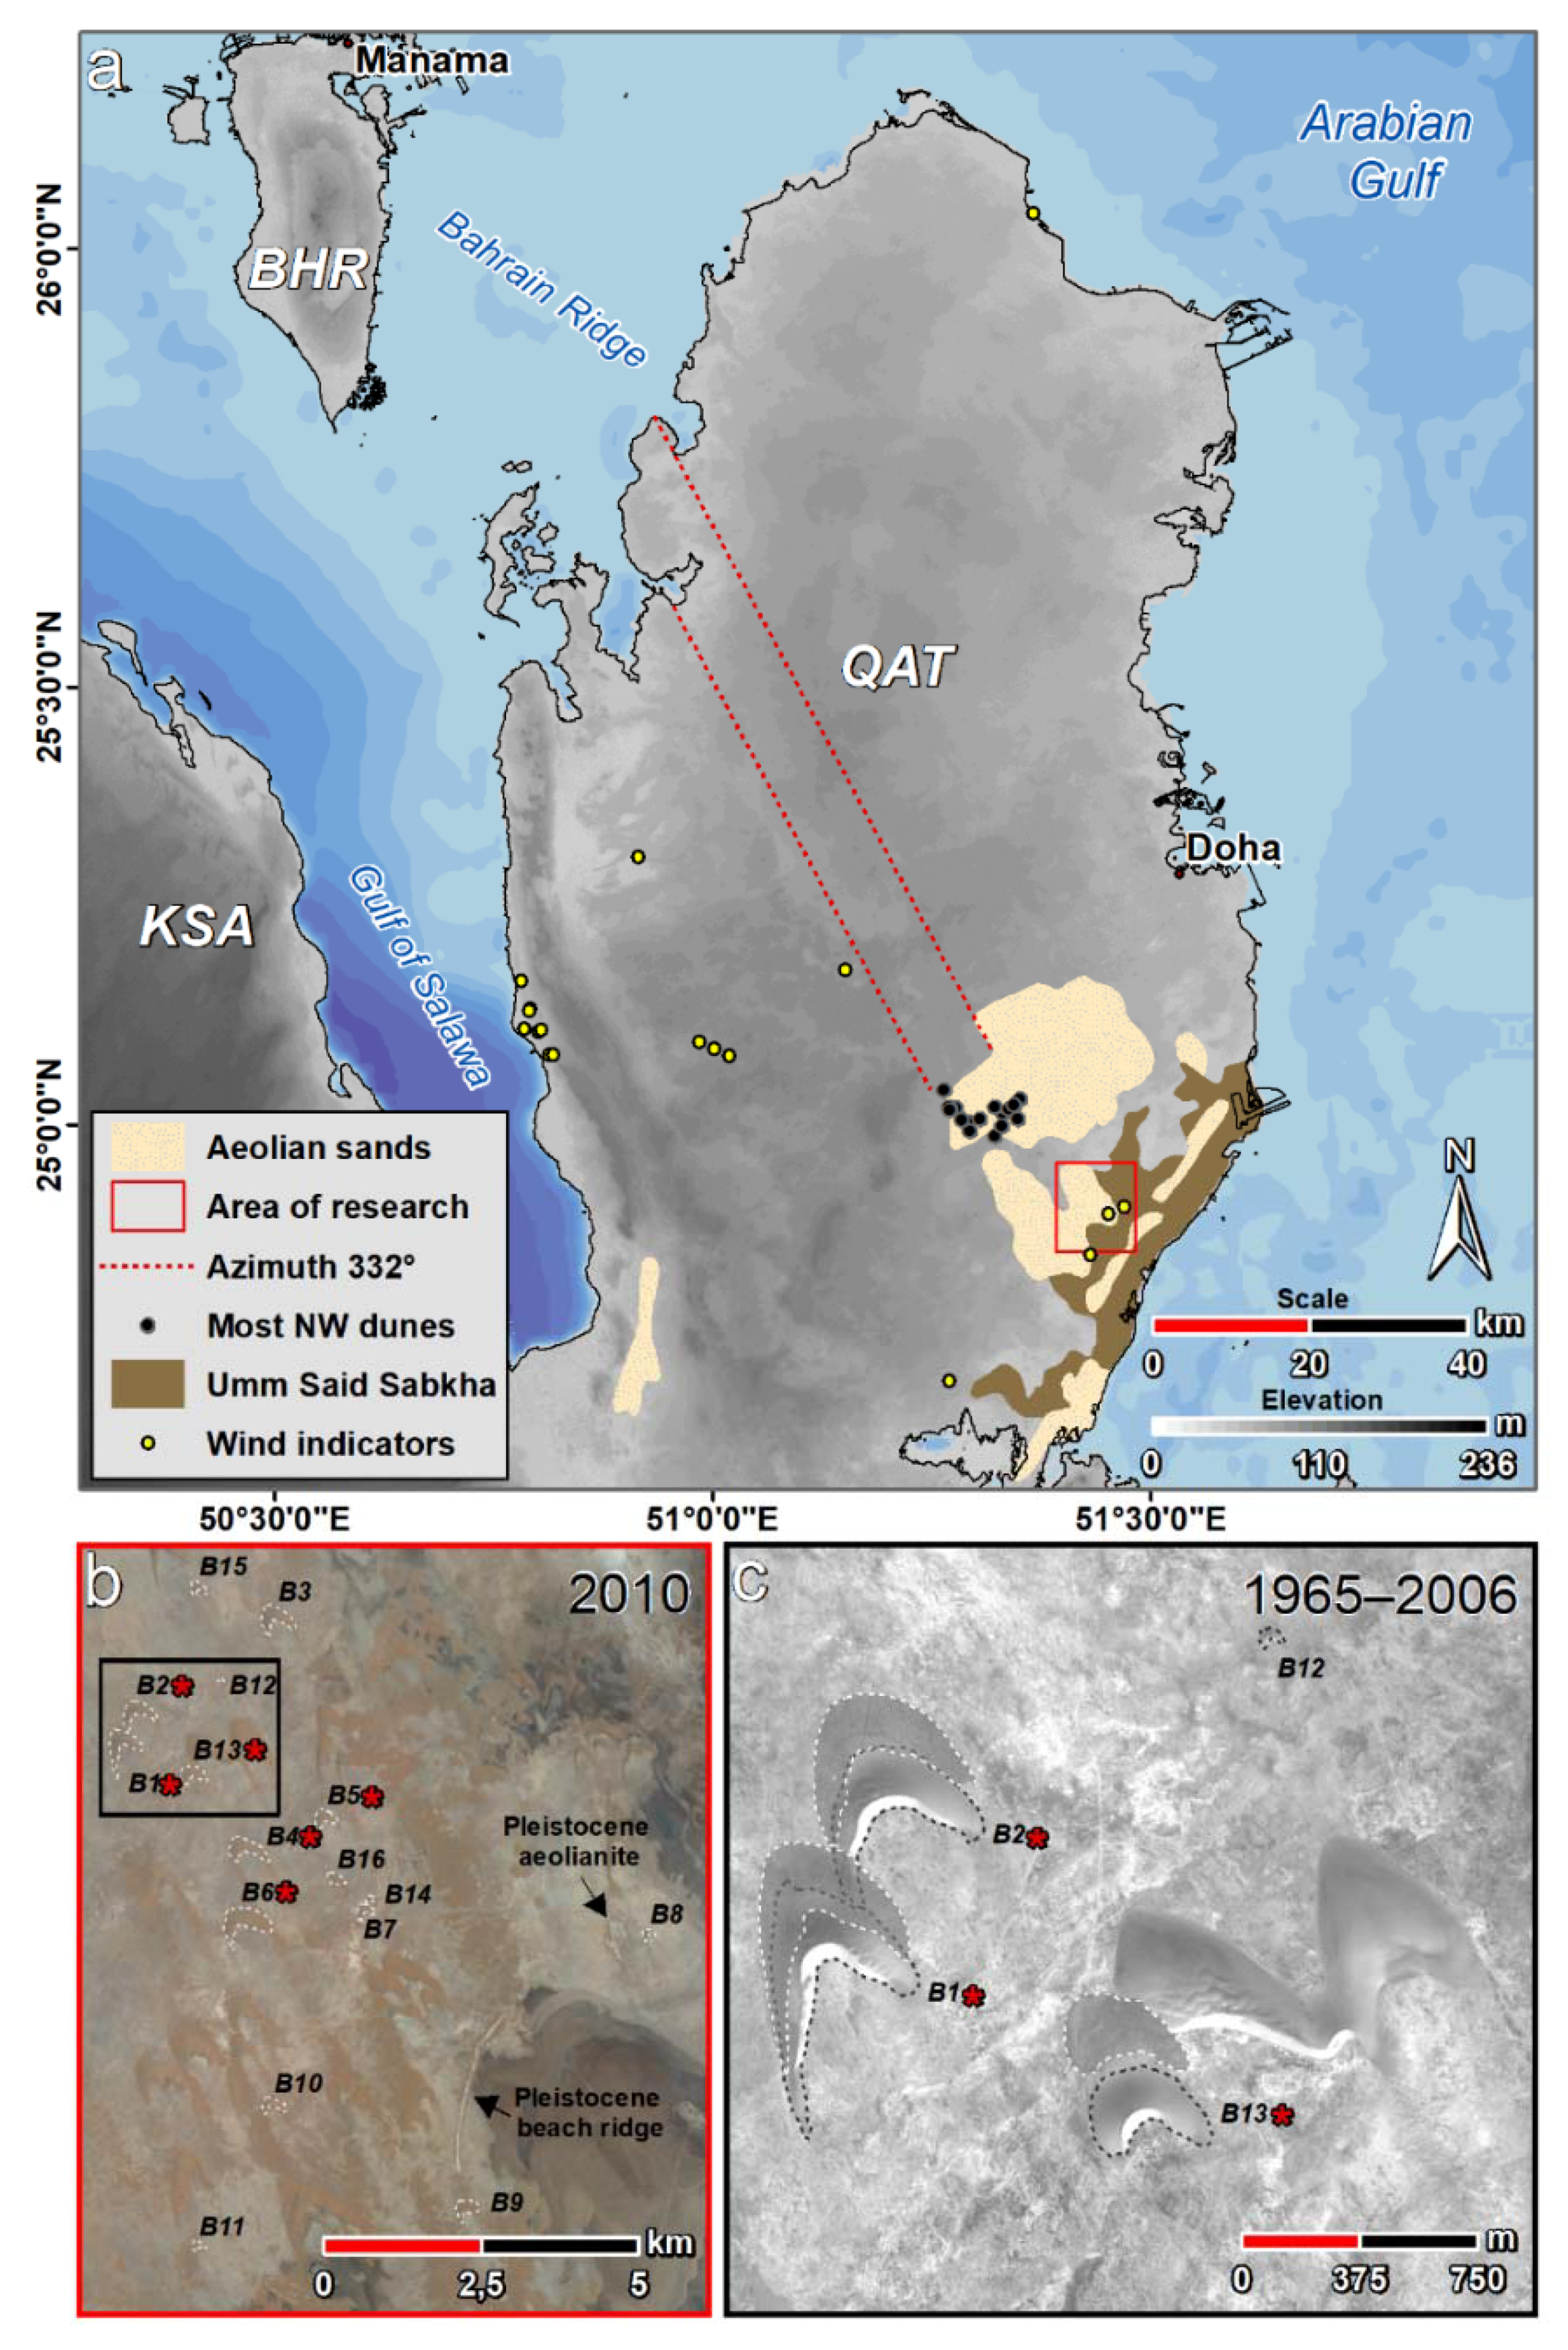
2. Study Area
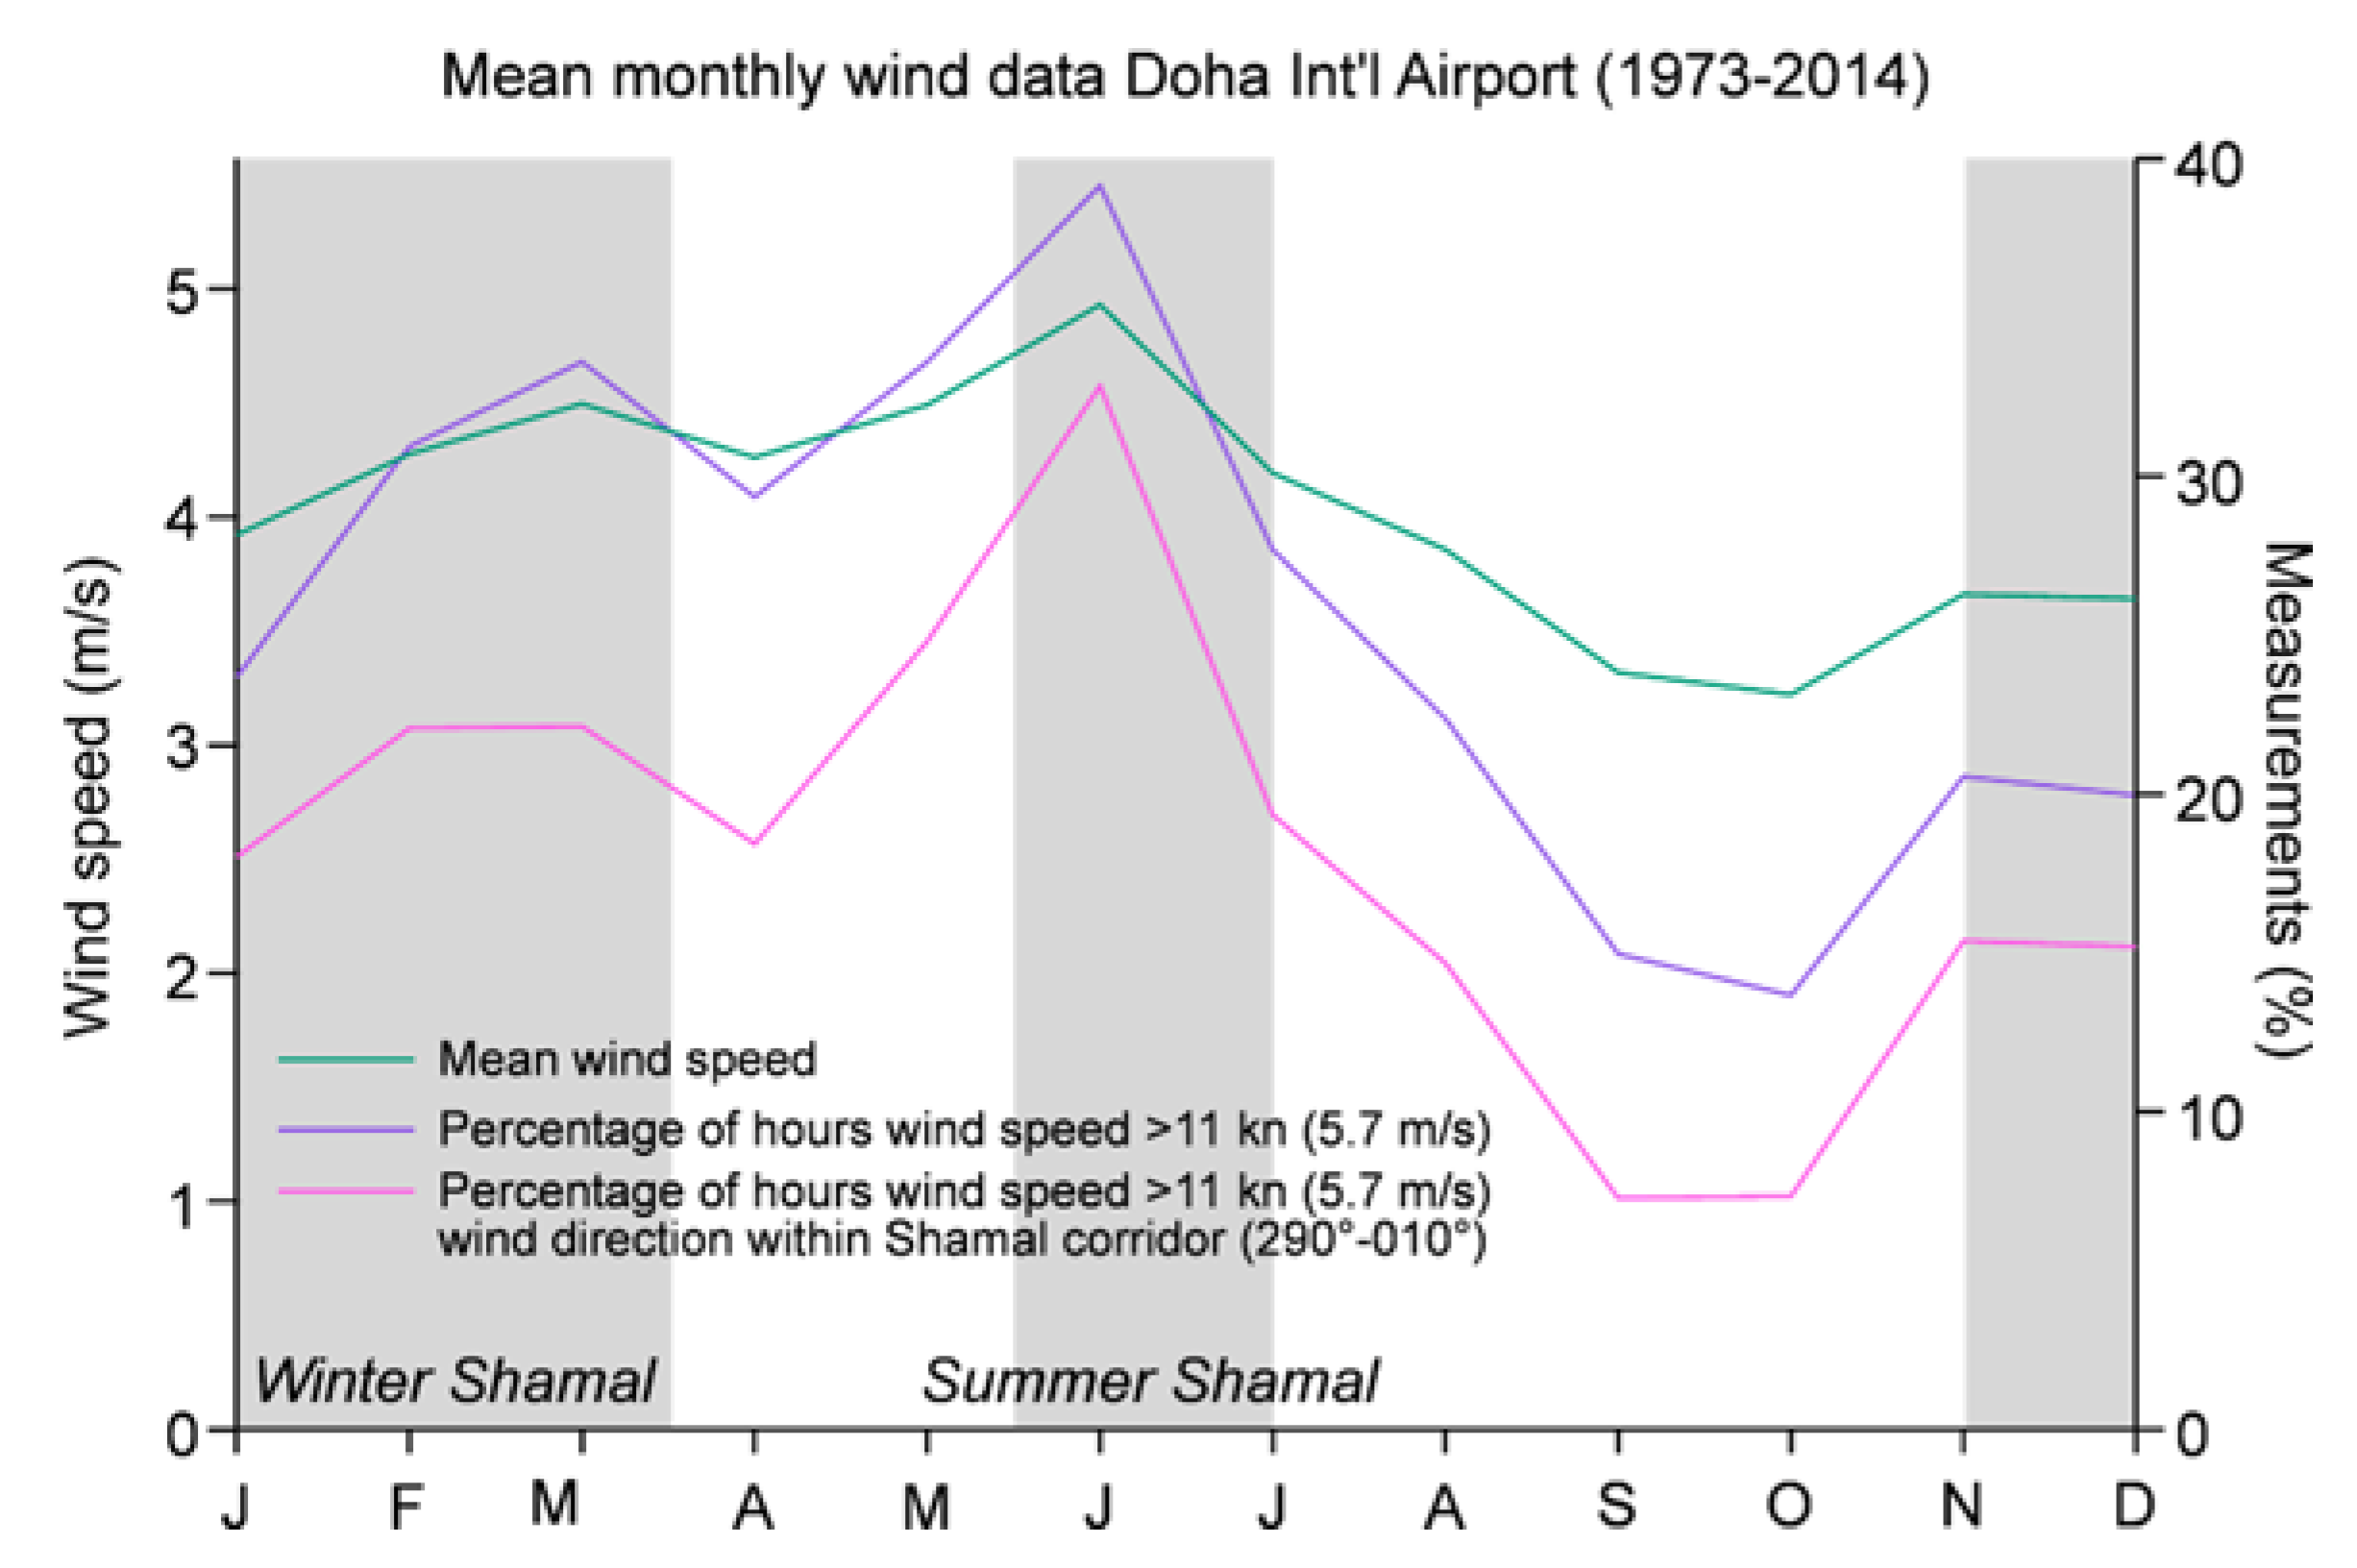
2.1. The Physical Setting and Wind Pattern of Qatar
2.2. Barchans of Qatar
3. Materials and Methods
4. Results
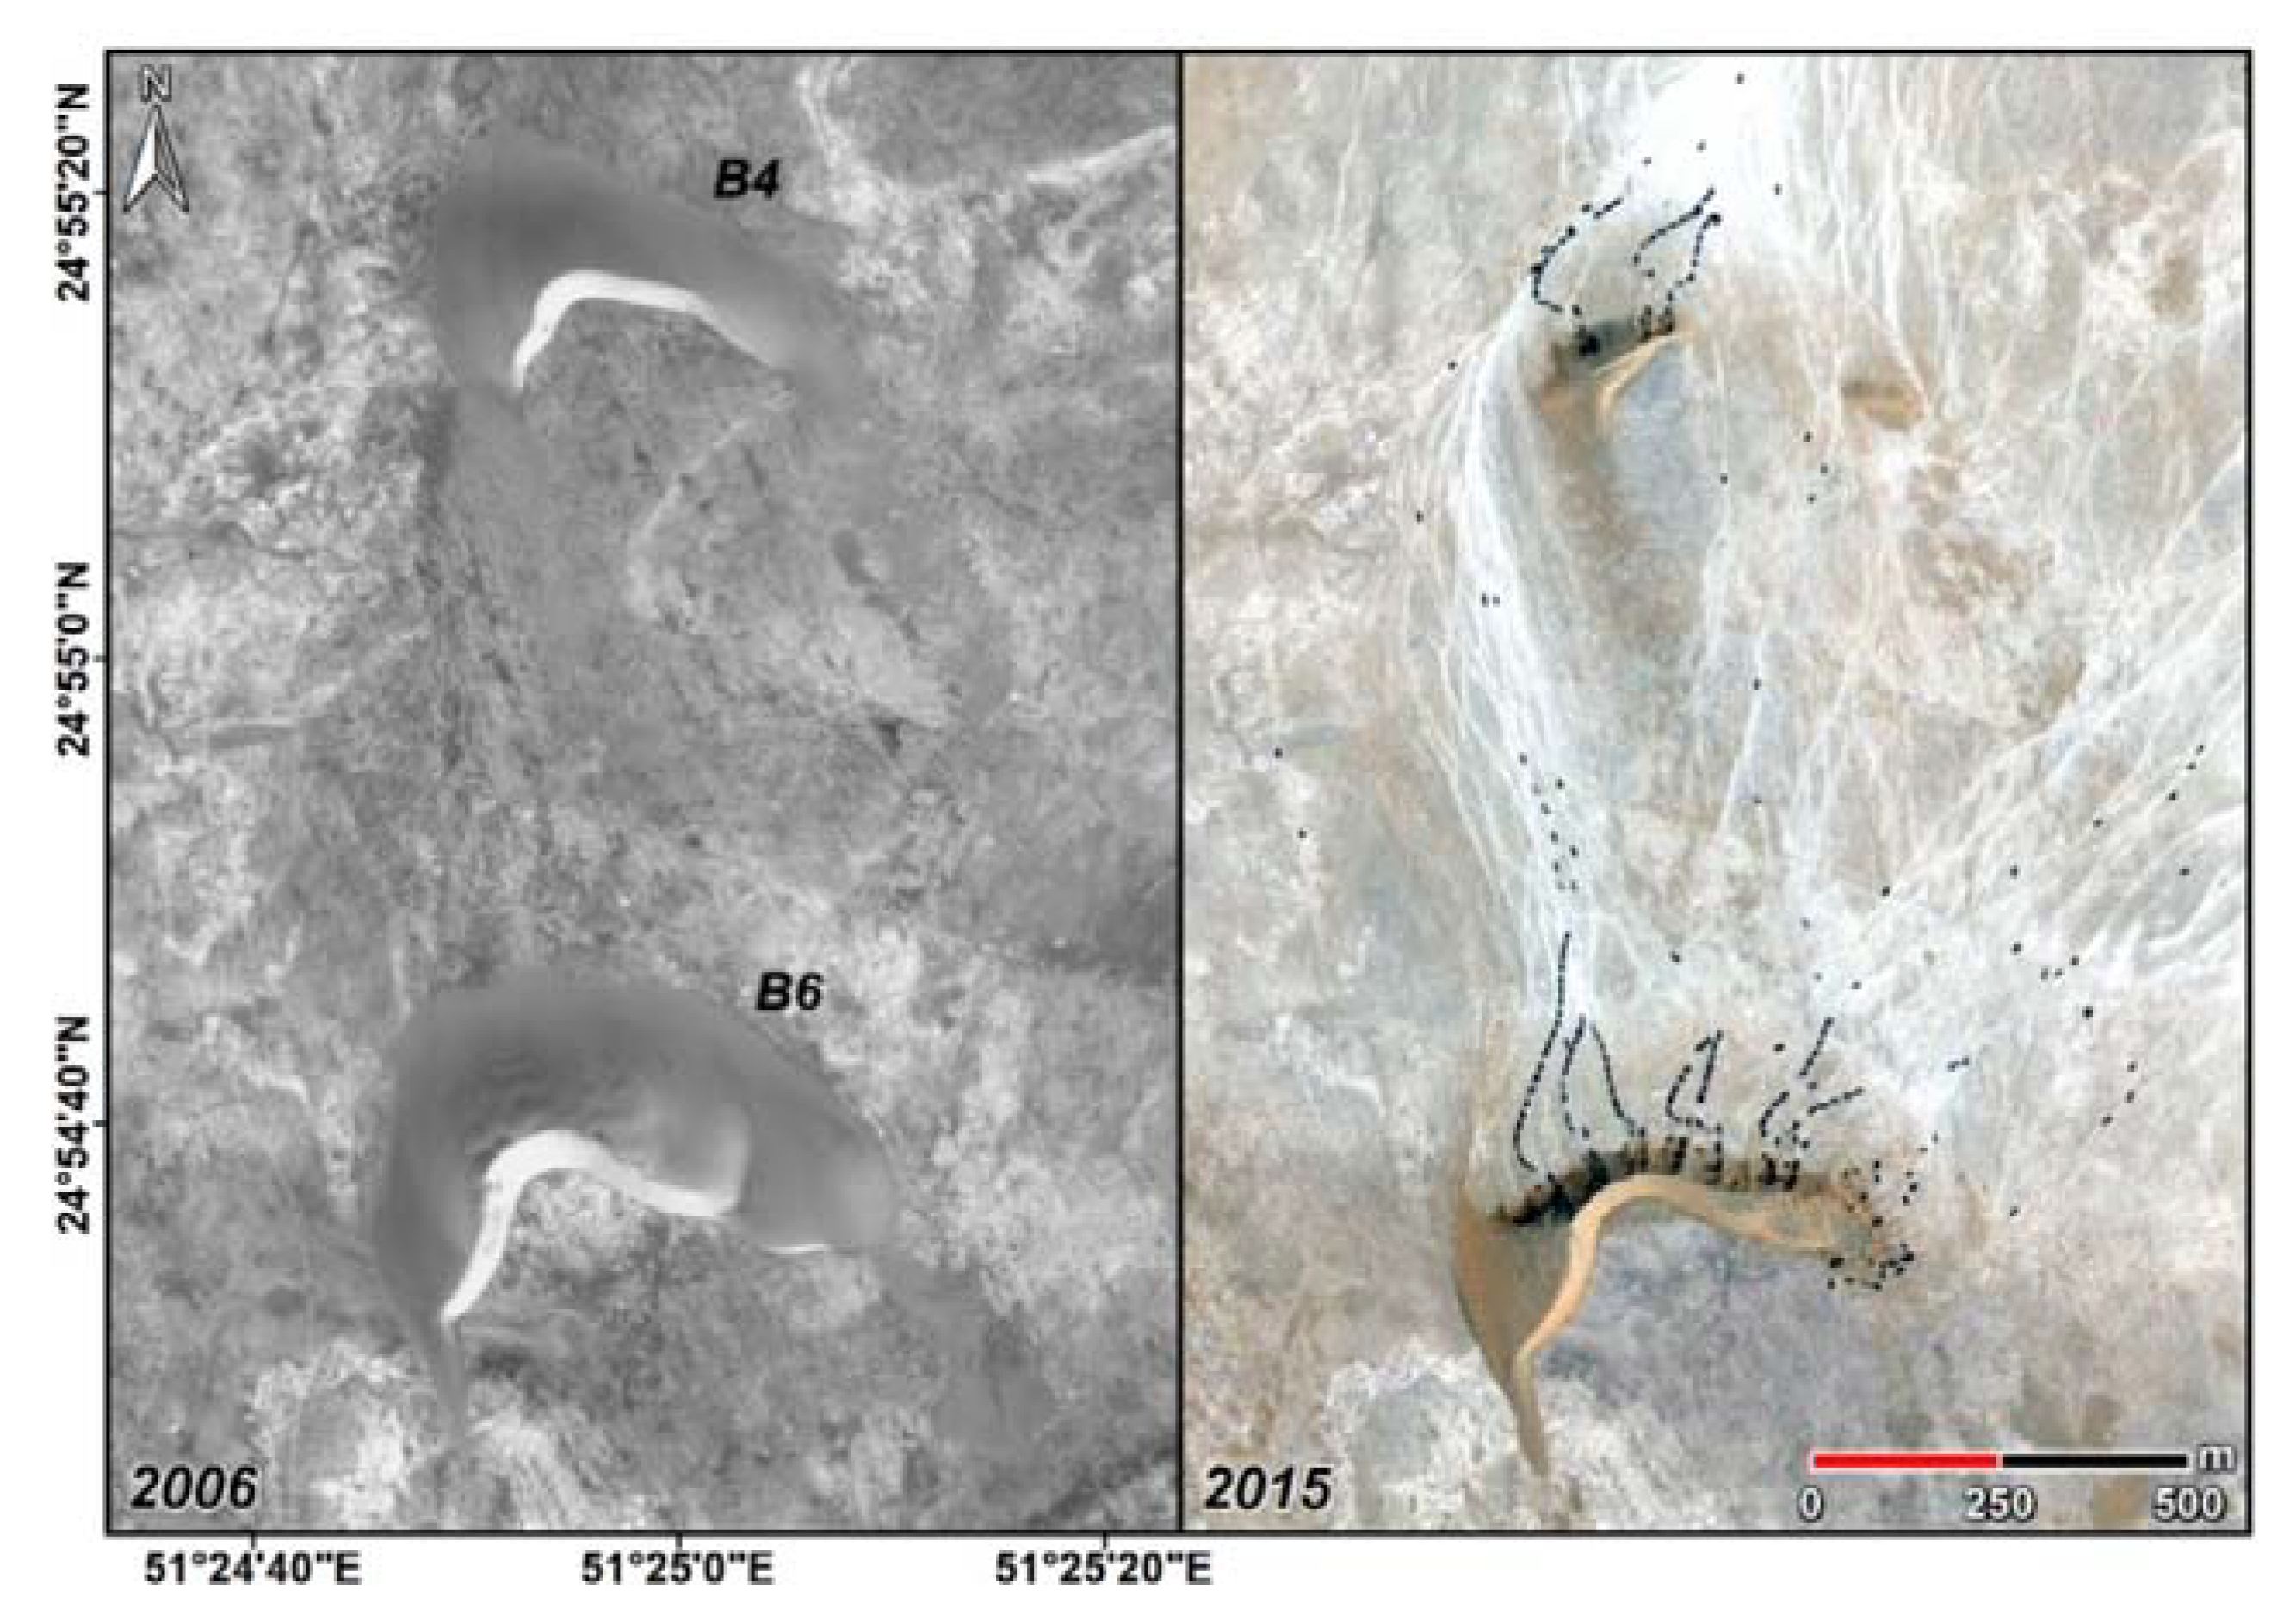
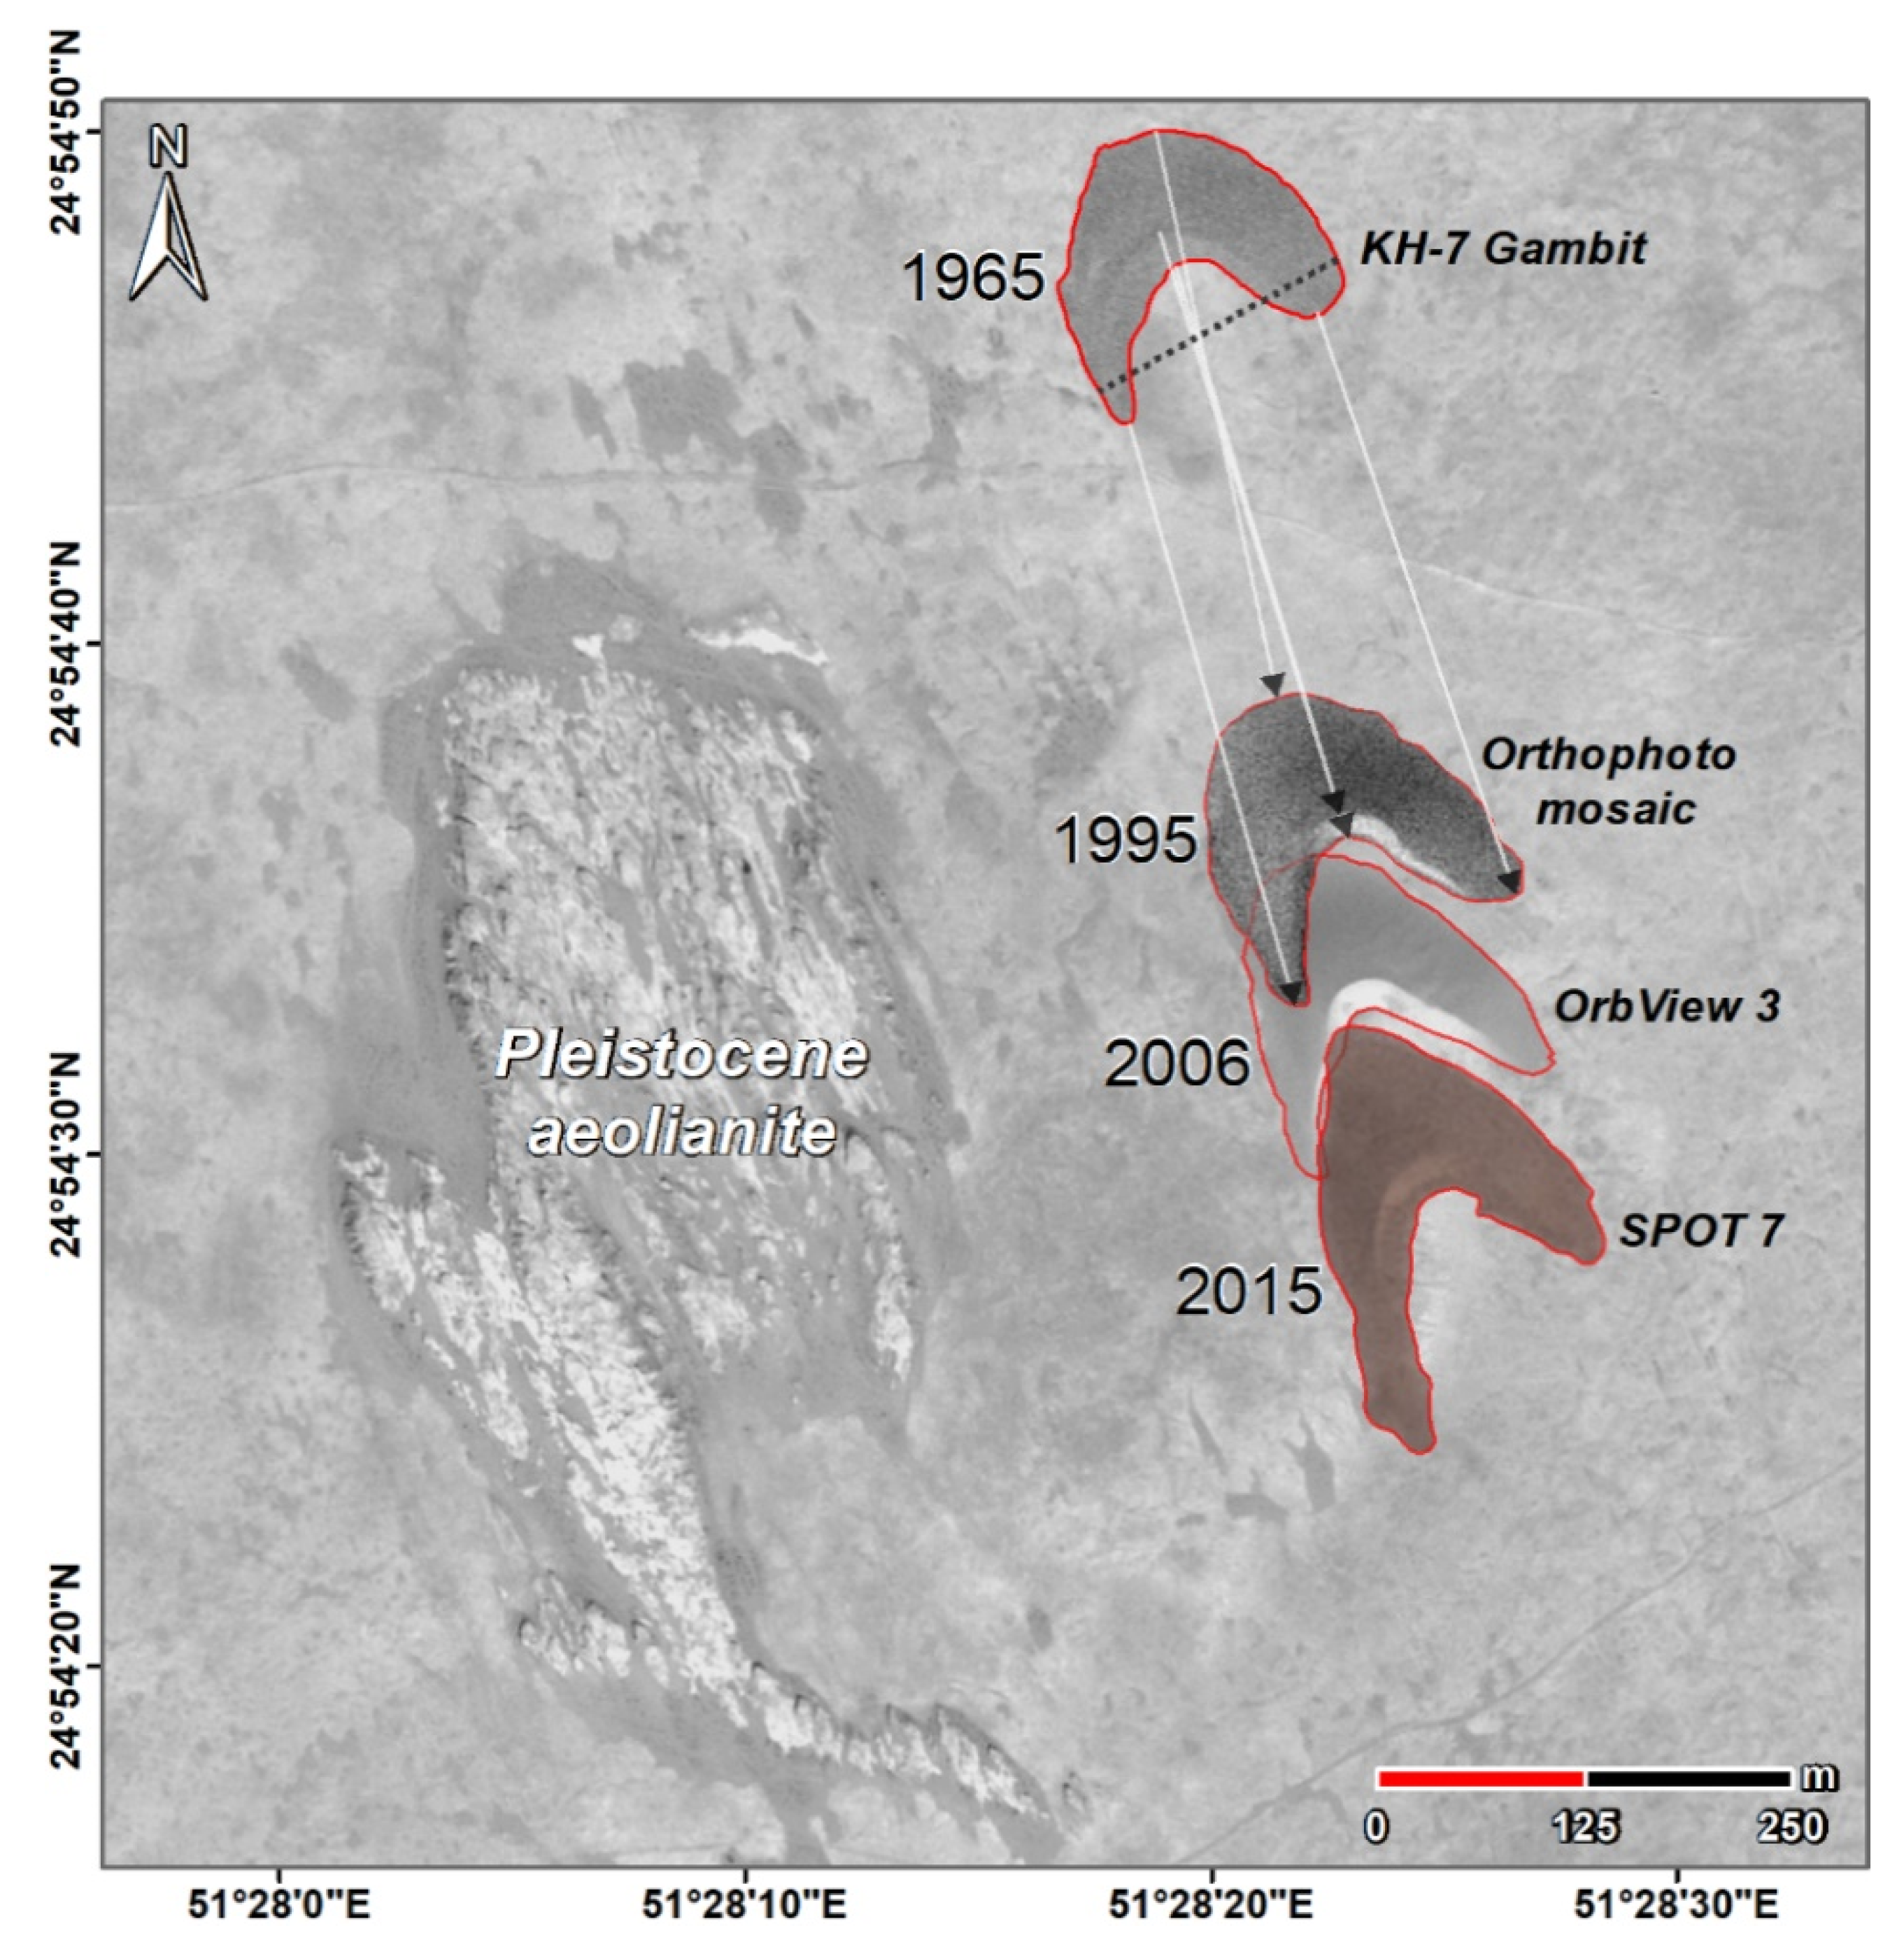
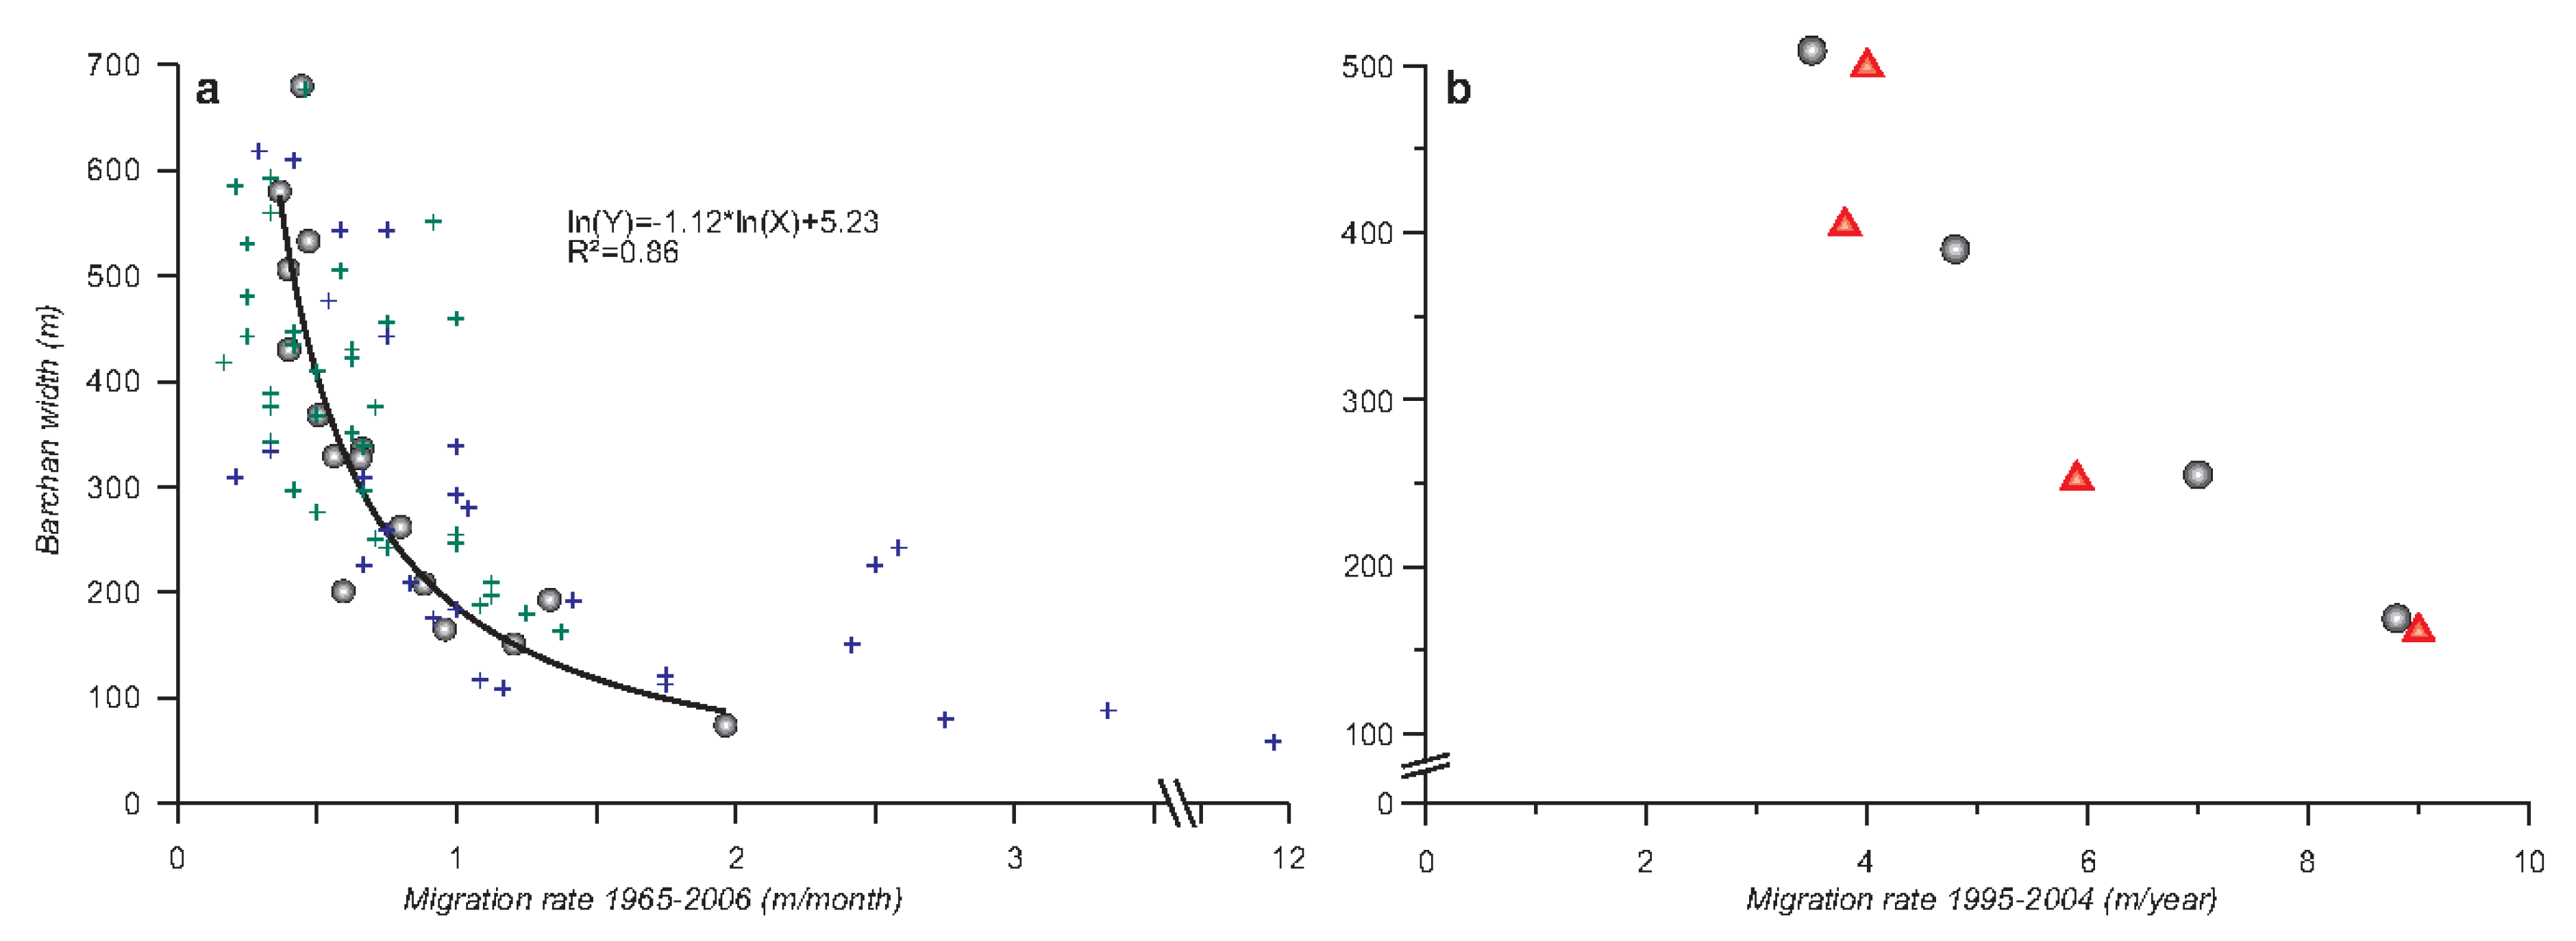
4.1. Barchan Migration
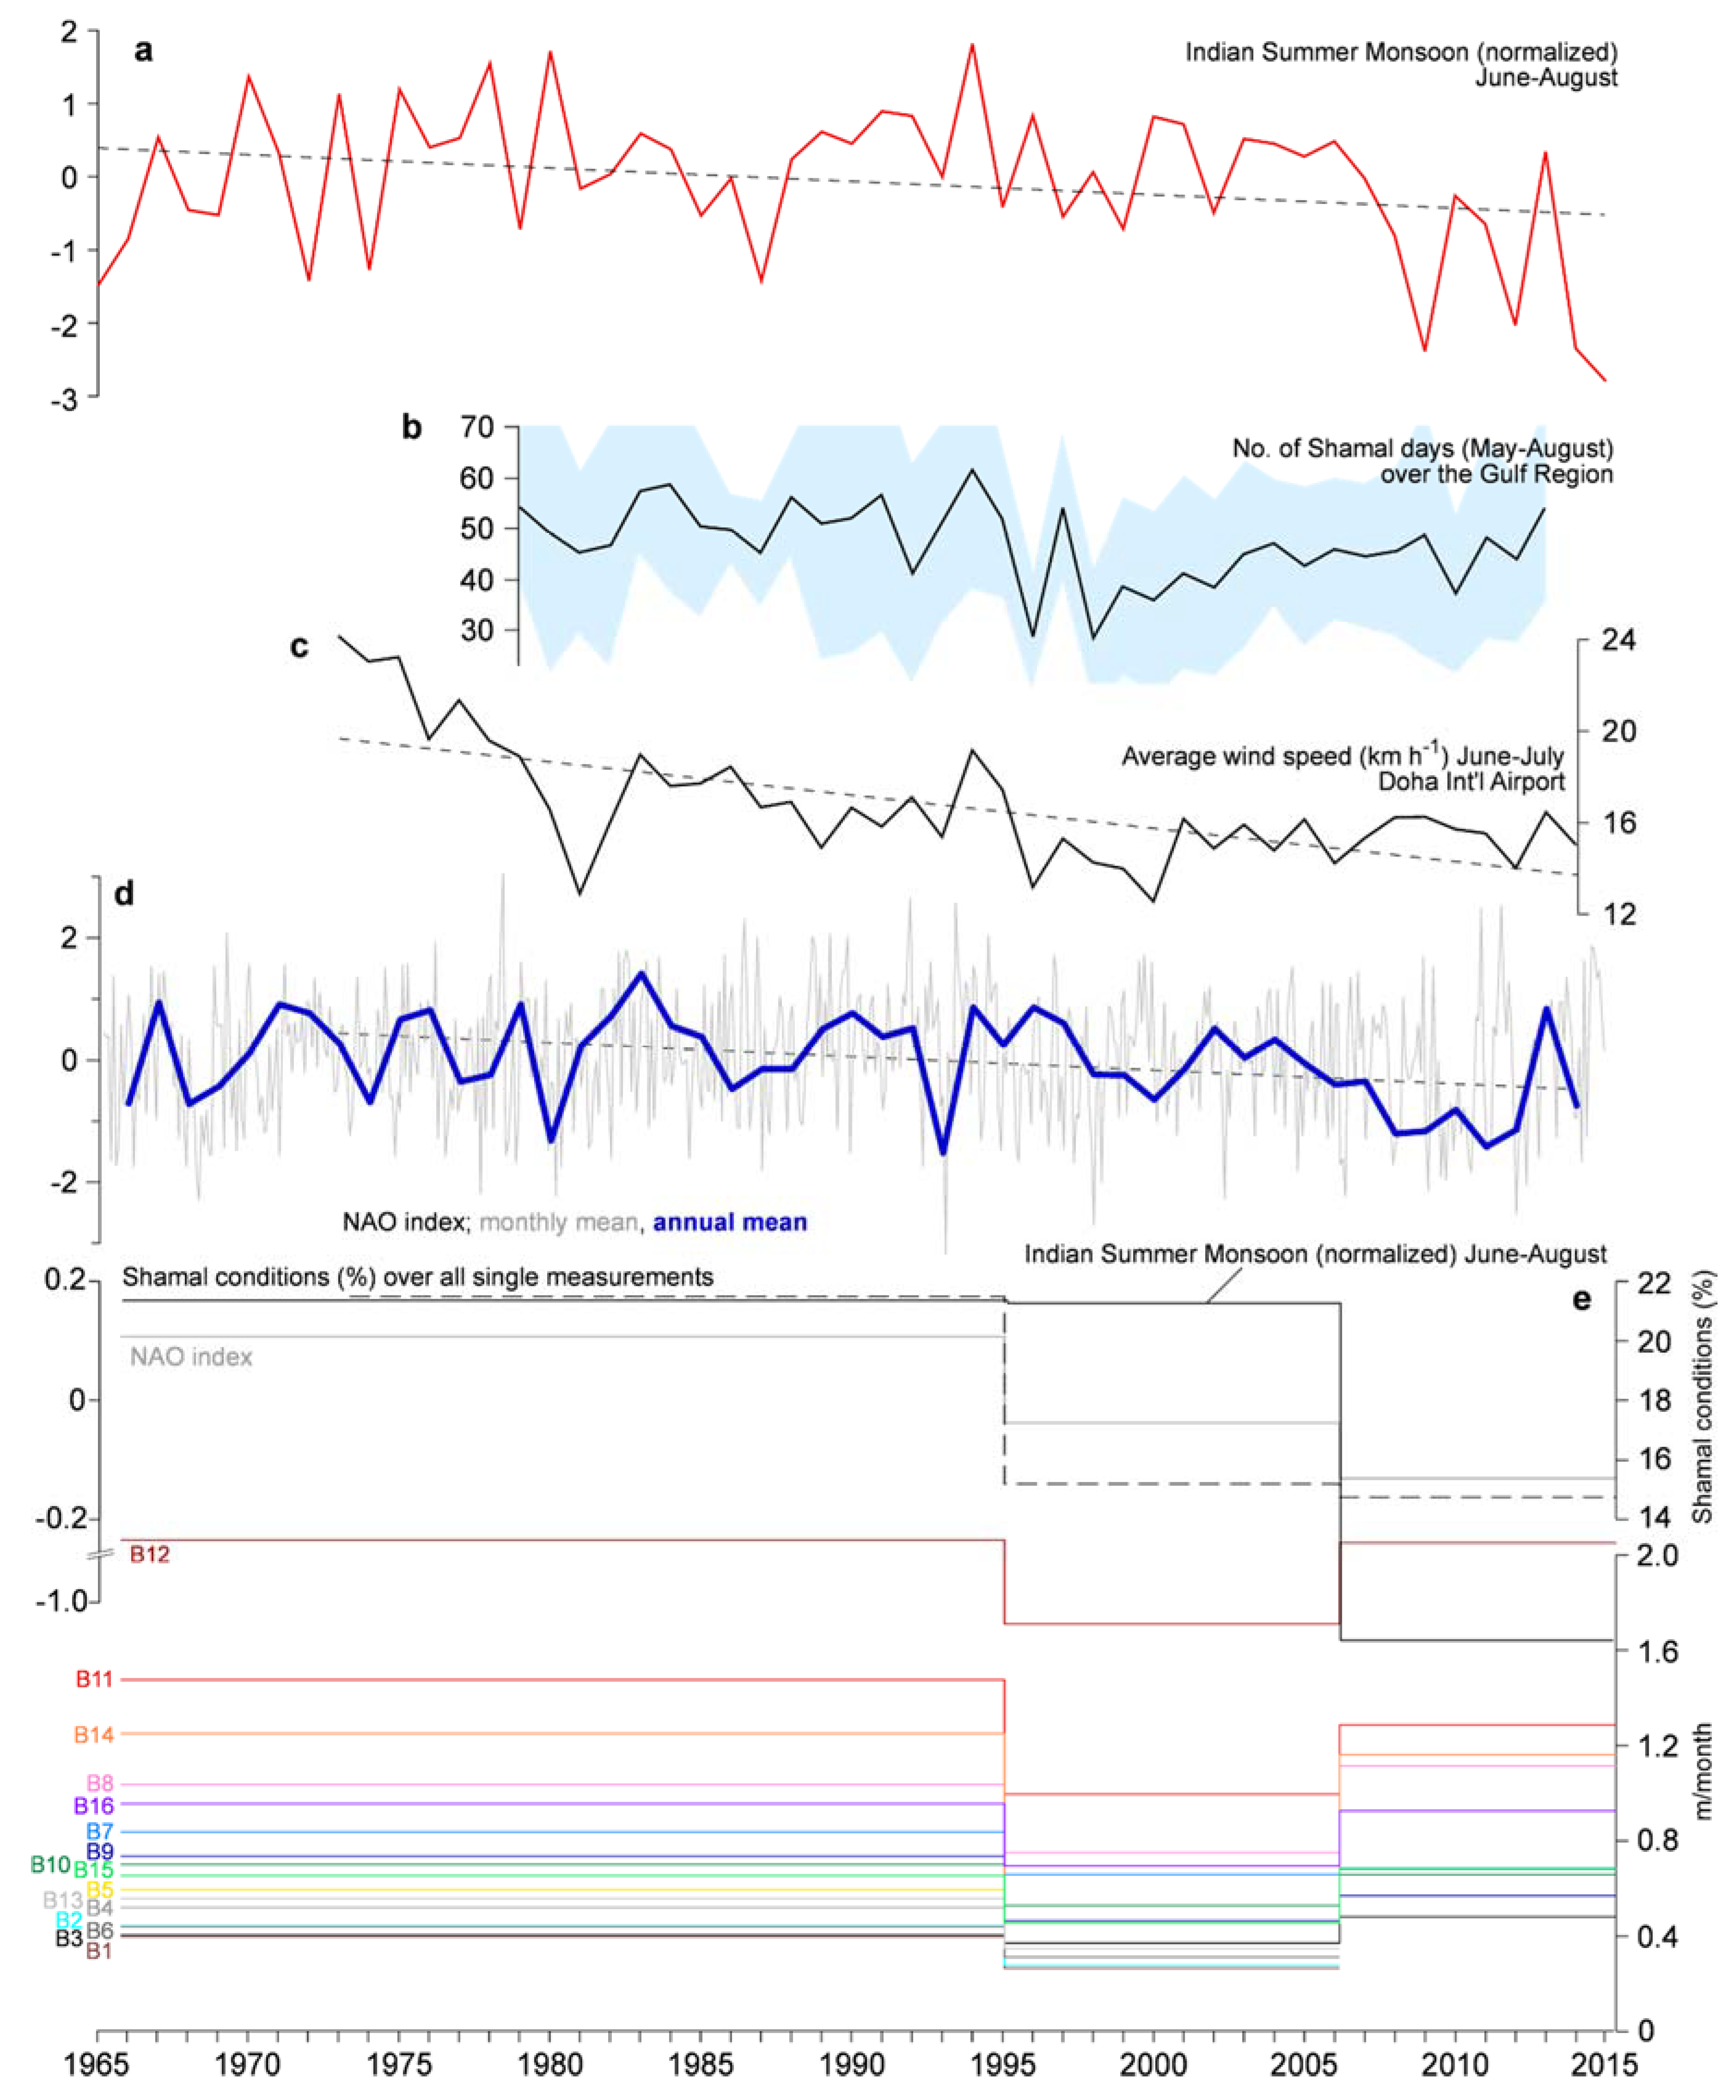
4.2. Shamal Activity
5. Discussion
5.1. Barchan Dynamics and Their Control
5.2. Long-Term Perspective on Shamal Controls
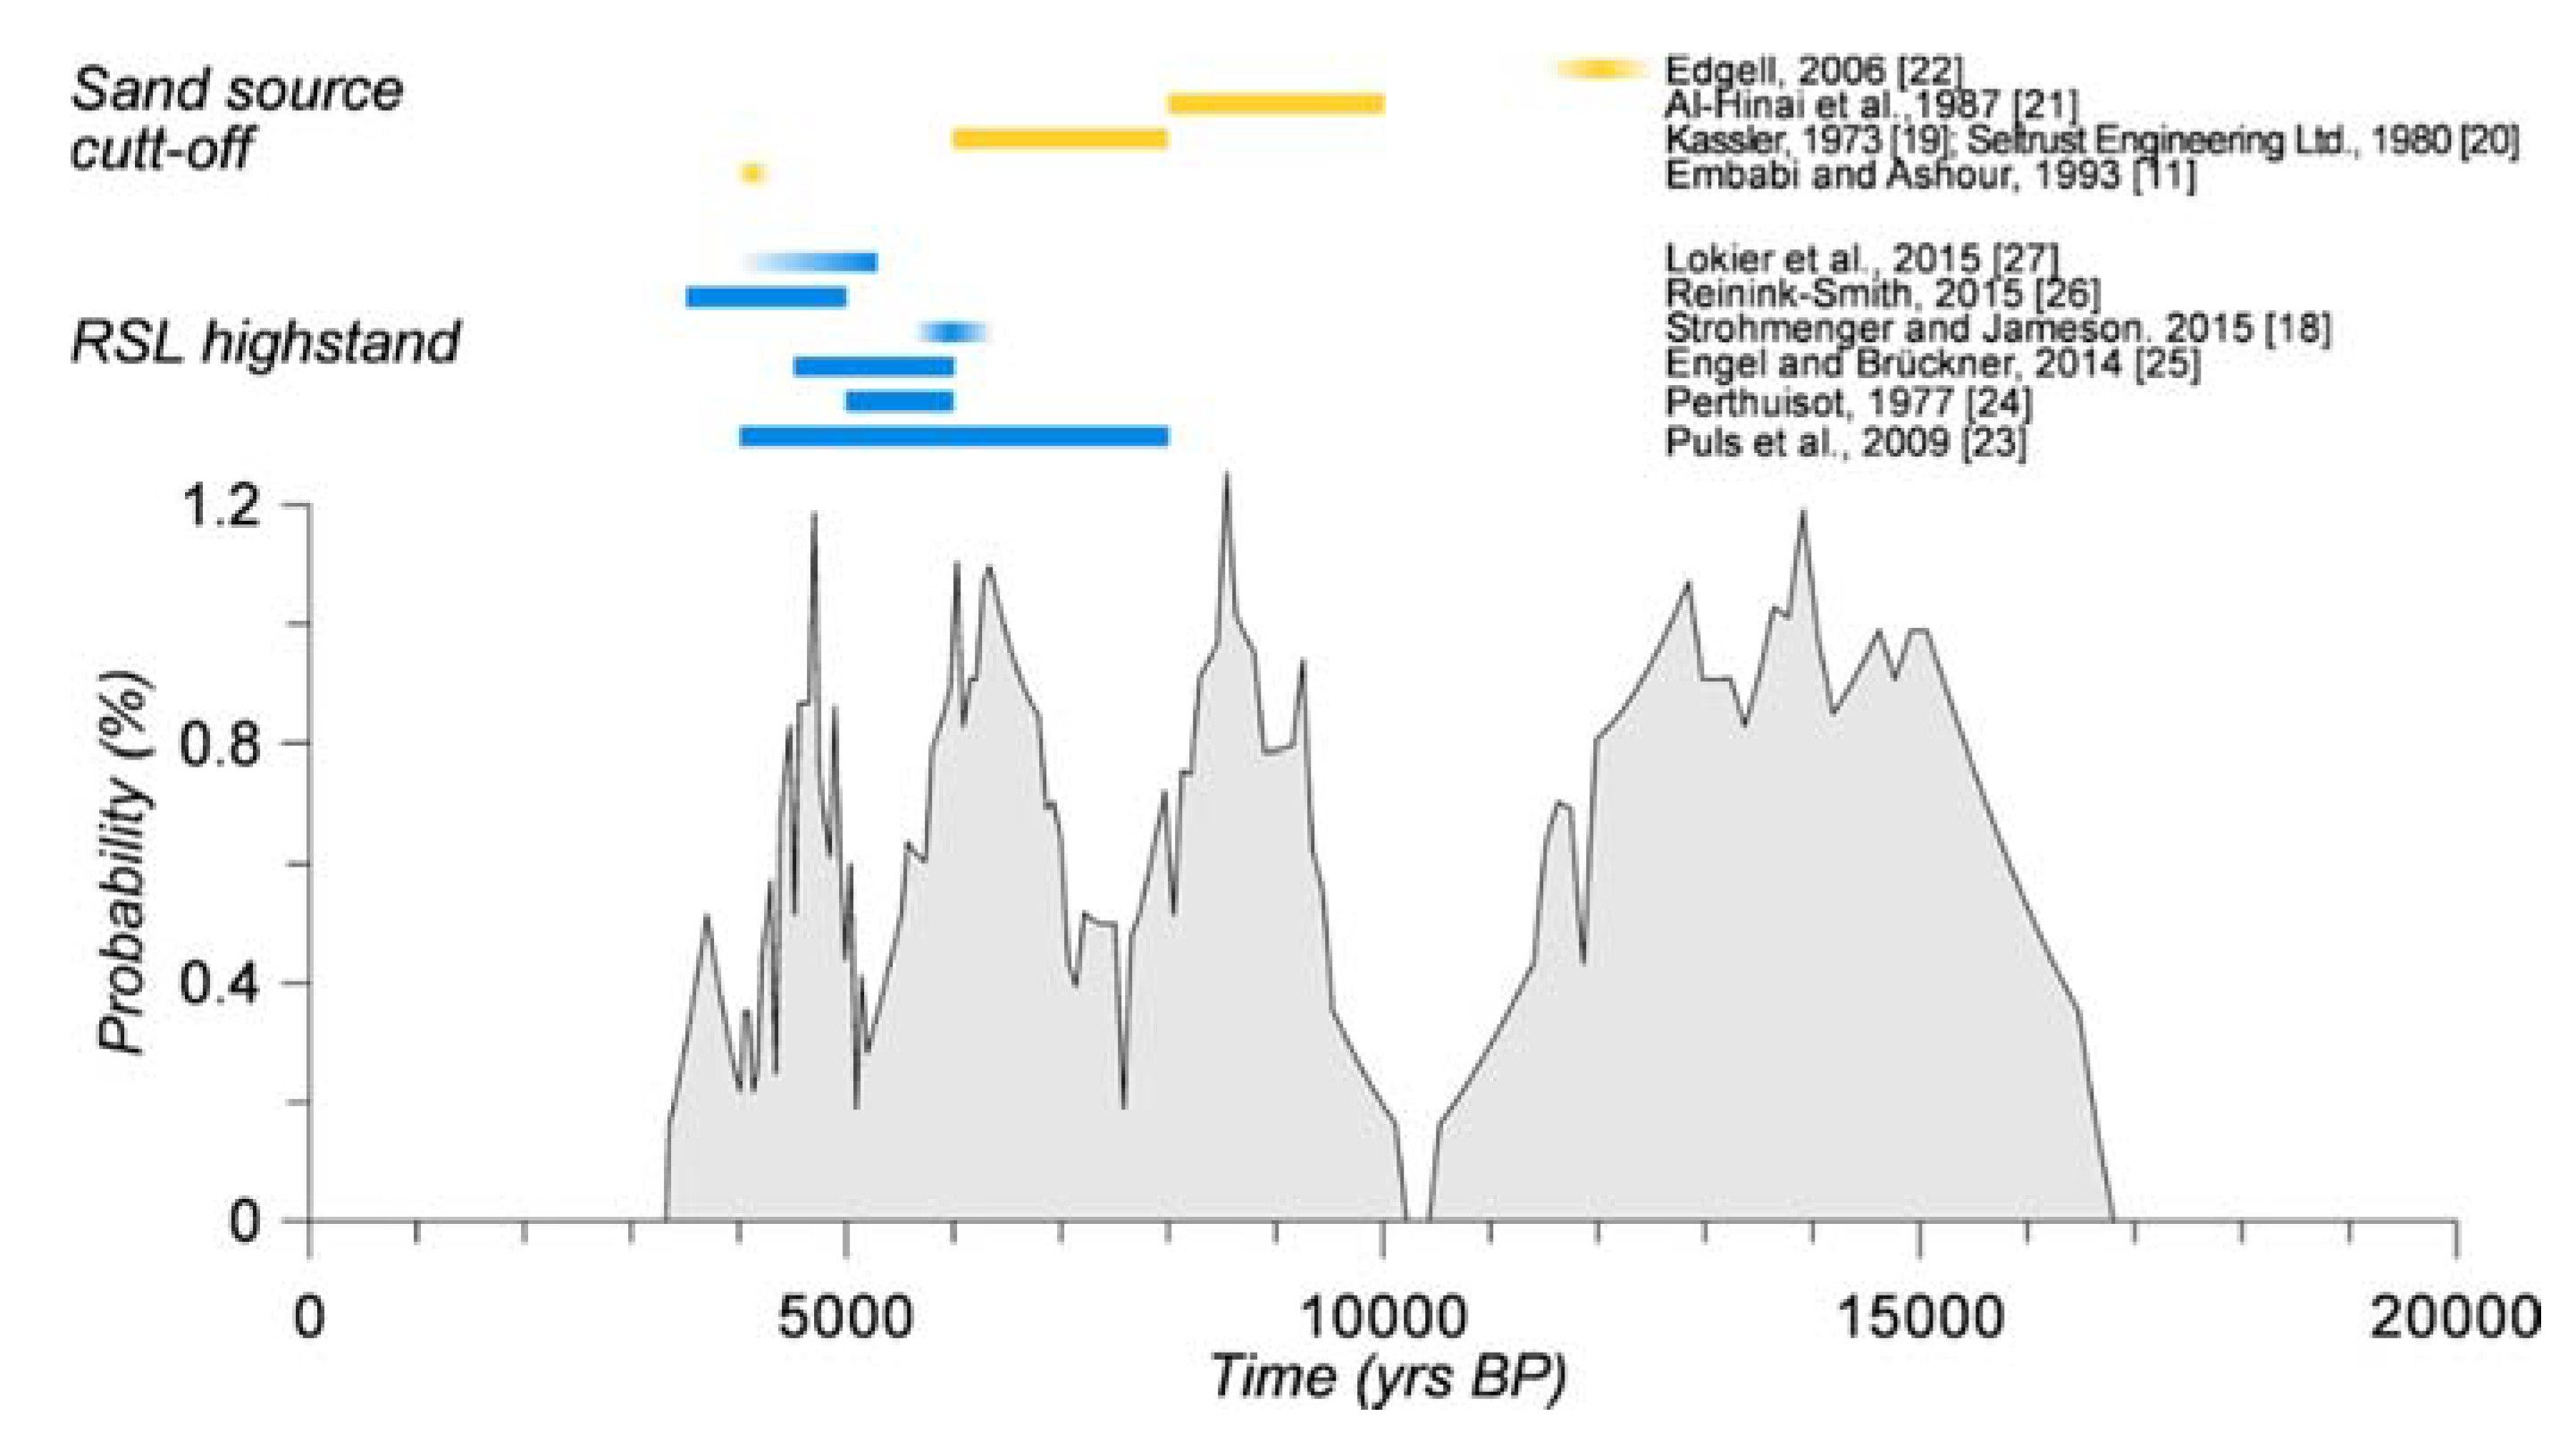
5.3. Barchan Migration, Sediment Supply and Relative Sea-Level Change
6. Conclusions
Author Contributions
Acknowledgments
Conflicts of Interest
References
- Besler, H. Eine Wanderdüne als Soliton? Phys. Bl. 1997, 53, 983–985. [Google Scholar] [CrossRef]
- Livingstone, I.; Wiggs, G.F.S.; Weaver, C.M. Geomorphology of desert sand dunes: A review of recent progress. Earth Sci. Rev. 2007, 80, 239–257. [Google Scholar] [CrossRef]
- Parteli, E.J.R.; Durán, O.; Herrmann, H.J. Minimal size of a barchan dune. Phys. Rev. E 2007, 75, 011301. [Google Scholar] [CrossRef] [PubMed]
- Wiggs, G.F.S. Dune morphology and dynamics. In Treatise in Geomorphology, Vol. 11: Aeolian Geomorphology; Lancaster, N., Sherman, D.J., Baas, A.C.W., Eds.; Academic Press: London, UK, 2013; pp. 201–218. [Google Scholar]
- Hesp, P.A.; Hastings, K. Width, height and slope relationships and aerodynamic maintenance of barchans. Geomorphology 1998, 22, 193–204. [Google Scholar] [CrossRef]
- Vermeesch, P.; Leprince, S. A 45-year time series of dune mobility indicating constant windiness over the central Sahara. Geophys. Res. Lett. 2012, 39, L14401. [Google Scholar] [CrossRef]
- Bagnold, R.A. The Physics of Blown Sand and Desert Dunes; Methuen: London, UK, 1941. [Google Scholar]
- Farr, T.G.; Rosen, P.A.; Caro, E.; Crippen, R.; Duren, R.; Hensley, S.; Kobrick, M.; Paller, M.; Rodriguez, E.; Roth, L.; et al. The Shuttle Radar Topography Mission. Rev. Geophys. 2007, 45, RG2004. [Google Scholar] [CrossRef]
- Weatherall, P.; Marks, K.M.; Jakobsson, M.; Schmitt, T.; Tani, S.; Arndt, J.E.; Rovere, M.; Chayes, D.; Ferrini, V.; Wigley, R. A new digital bathymetric model of the world’s oceans. Earth Space Sci. 2015, 2, 331–345. [Google Scholar] [CrossRef]
- Embabi, N.S.; Ashour, M.M. Barchan dunes in Qatar. J. Arid Environ. 1993, 25, 49–69. [Google Scholar] [CrossRef]
- Bubenzer, O.; Besler, H. Sands as Archives of Environmental Change: Examples from Egypt, Sudan and Namibia. In Towards Interdisciplinarity—Experiences of the Long-Term ACACIA Project; Möhlig, W.J.G., Bubenzer, O., Menz, G., Eds.; Rüdiger Köppe Verlag: Cologne, Germany, 2010; pp. 23–48. [Google Scholar]
- NCDC (National Climate Data Center). NOAA NCDC Climate Data Online. Available online: https://www7.ncdc.noaa.gov/CDO/ (accessed on 12 November 2017).
- Anderson, R.S. The attraction of sand dunes. Nature 1996, 379, 24–25. [Google Scholar] [CrossRef]
- Hersen, P.; Andersen, K.H.; Elbelrhiti, H.; Andreotti, B.; Claudin, P.; Douady, S. Corridors of barchan dunes: Stability and size selection. Phys. Rev. E 2004, 69, 011304. [Google Scholar] [CrossRef] [PubMed]
- Hesse, R. Do swarms of migrating barchan dunes record paleoenvironmental changes?—A case study spanning the middle to late Holocene in the Pampa de Jaguay, southern Peru. Geomorphology 2009, 104, 185–190. [Google Scholar] [CrossRef]
- Shinn, E.A. Carbonate coastal accretion in the area of longshore transport, NE Qatar. In The Persian Gulf: Holocene Carbonate Sedimentation and Diagenesis in a Shallow Epicontinental Sea; Purser, B.H., Ed.; Springer: Berlin, Germany, 1973; pp. 179–191. [Google Scholar]
- Lambeck, K. Shoreline reconstructions for the Persian Gulf since the Last Glacial Maximum. Earth Planet. Sci. Lett. 1996, 142, 43–57. [Google Scholar] [CrossRef]
- Strohmenger, C.J.; Jameson, J. Modern coastal systems of Qatar as analogues for arid climate carbonate reservoirs: Improving geological and reservoir modelling. First Break 2015, 33, 41–50. [Google Scholar] [CrossRef]
- Kassler, P. The structural and geomorphic evolution of the Persian Gulf. In The Persian Gulf: Holocene Carbonate Sedimentation and Diagenesis in a Shallow Epicontinental Sea; Purser, B.H., Ed.; Springer: Berlin, Germany, 1973; pp. 11–32. [Google Scholar]
- Seltrust Engineering Ltd. Qatar Geological Map, scales 1:100,000 (Four Sheets) and 1:200,000 (One Sheet) and Explanatory Booklet; IDTC: Doha, Qatar, 1980; 20p. [Google Scholar]
- Al-Hinai, K.G.; McMahon Moore, J.; Bush, P.R. LANDSAT image enhancement study of possible submerged sand-dunes in the Arabian Gulf. Int. J. Remote Sens. 1987, 8, 251–258. [Google Scholar] [CrossRef]
- Edgell, H.S. Arabian Deserts—Nature, Origin, and Evolution; Springer: Dordrecht, The Netherlands, 2006; pp. 187–188. [Google Scholar]
- Puls, D.D.; Jameson, J.; Kozar, M.; Al-Ansi, H.; LeBlanc, J. The Dukhan Sabkha: A Modern Analog for the Arab C Carbonate Reservoir, Dukhan Field, Qatar. In Proceedings of the International Petroleum Technology Conference, Doha, Qatar, 7–9 December 2009; Volume 3, pp. 1799–1811. [Google Scholar] [CrossRef]
- Perthuisot, J.P. Contribution a l’étude du Quaternaire marin de la péninsule de Qatar. Bull. Soc. Géol. Fr. 1977, 1167–1170. [Google Scholar] [CrossRef]
- Engel, M.; Brückner, H. The South Qatar Survey Project (SQSP)—Preliminary findings on Holocene coastal changes and geoarchaeological archives. Z. Orient Archäol. 2014, 7, 290–301. [Google Scholar]
- Reinink-Smith, L.M. AMS-dated mollusks in beach ridges and berms document Holocene sea-level and coastal changes in northeastern Kuwait Bay. Quat. Res. 2015, 87, 200–213. [Google Scholar] [CrossRef]
- Lokier, S.W.; Bateman, M.D.; Larkin, N.R.; Rye, P.; Stewart, J.R. Late Quaternary sea-level changes of the Persian Gulf. Quat. Res. 2015, 84, 69–81. [Google Scholar] [CrossRef]
- Sadiq, A.; Hoqari, F. Remote sensing and spectral characteristics of desert sand from Qatar Peninsula, Arabian/Persian Gulf. Remote Sens. 2009, 1, 915–933. [Google Scholar] [CrossRef]
- Al-Yousef, M. Mineralogy, Geochemistry and the Origin of Quaternary Sabkhas in the Qatar Peninsula, Arabian Gulf. Ph.D. Thesis, University of Southampton, Southampton, UK, 2003. [Google Scholar]
- Al-Saad, H. Lithostratigraphy of the Middle Eocene Dammam Formation in Qatar, Arabian Gulf: Effects of sea-level fluctuations along a tidal environment. J. Asian Earth Sci. 2005, 25, 781–789. [Google Scholar] [CrossRef]
- Rao, P.G.; Al-Sulaiti, M.; Al-Mulla, A.H. Winter shamals in Qatar, Arabian Gulf. Weather 2001, 56, 444–451. [Google Scholar] [CrossRef]
- Rao, P.G.; Hatwar, H.R.; Al-Sulaiti, M.H.; Al-Mulla, A.H. Summer shamals over the Arabian Gulf. Weather 2003, 58, 471–478. [Google Scholar] [CrossRef]
- Bartlett, K.S. Dust Storm Forecasting for Al Udeid AB, Qatar: An Empirical Analysis. Master’s Thesis, Air University, Montgomery County, OH, USA, 2004. [Google Scholar]
- Barth, H.-J. Characteristics of the wind regime north of Jubail, Saudi Arabia, based on high resolution wind data. J. Arid Environ. 2001, 47, 387–402. [Google Scholar] [CrossRef]
- Yu, Y.; Notaro, M.; Kalashnikova, O.V.; Garay, M.J. Climatology of summer Shamal wind in the Middle East. J. Geophys. Res. Atmos. 2016, 121, 289–305. [Google Scholar] [CrossRef]
- Al Senafi, F.; Anis, A. Shamals and climate variability in the Northern Arabian/Persian Gulf from 1973 to 2012. Int. J. Climatol. 2015, 35, 4509–4528. [Google Scholar] [CrossRef]
- Breed, C.S.; Grow, T. Morphology and distribution of dunes in sand seas observed by remote sensing. Geol. Surv. Prof. Paper 1979, 1052, 253–304. [Google Scholar]
- Wang, B.; Fan, Z. Choice of South Asian Summer Monsoon Indices. Bull. Am. Meteorol. Soc. 1999, 80, 629–638. [Google Scholar] [CrossRef]
- NWS (National Weather Service). North Atlantic Oscillation (NAO). Available online: http://www.cpc.ncep.noaa.gov/data/teledoc/nao.shtml (accessed on 16 April 2018).
- Middleton, N.J. A geography of dust storms in Southwest Asia. Int. J. Climatol. 1986, 6, 183–196. [Google Scholar] [CrossRef]
- Ben-Gai, T.; Bitan, A.; Manes, A.; Alpert, P.; Kushnir, Y. Temperature and surface pressure anomalies in Israel and the North Atlantic Oscillation. Theor. Appl. Climatol. 2001, 69, 171–177. [Google Scholar] [CrossRef]
- Saeed, S.; Müller, W.A.; Hagemann, S.; Jacob, D. Circumglobal wave train and the summer monsoon over northwestern India and Pakistan: The explicit role of the surface heat low. Clim. Dyn. 2011, 37, 1045–1060. [Google Scholar] [CrossRef]
- Hamidi, M.; Kavianpour, M.R.; Shao, Y. Synoptic analysis of dust storms in the Middle East. Asia-Pac. J. Atmos. Sci. 2013, 49, 279–286. [Google Scholar] [CrossRef]
- Bansod, S.D.; Singh, S.V. Pre-monsoon surface pressure and summer monsoon rainfall over India. Theor. Appl. Climatol. 1995, 51, 59–66. [Google Scholar] [CrossRef]
- Cullen, H.M.; deMenocal, P.B. North Atlantic Influence on Tigris–Euphrates Streamflow. Int. J. Climatol. 2000, 20, 853–863. [Google Scholar] [CrossRef]
- Yizhaq, H.; Ashkenazy, Y.; Tsoar, H. Sand dune dynamics and climate change: A modeling approach. J. Geophys. Res. 2009, 114, F01023. [Google Scholar] [CrossRef]
- Al-Ansary, M.; Pöppelreiter, M.C.; Al-Jabry, A.; Iyengar, S.R. Geological and physiochemical characterisation of construction sands in Qatar. Int. J. Sust. Built Environ. 2012, 1, 64–84. [Google Scholar] [CrossRef]
- Gillette, D.A.; Adams, J. Accelerated Wind Erosion and Prediction of Rates. In Environmental Effects of Off-Road Vehicles; Webb, R.H., Wilshire, H.G., Eds.; Springer: New York, NY, USA, 1983; pp. 97–111. [Google Scholar]
- Rimbu, N.; Lohmann, G.; Kim, J.-H.; Arz, H.W.; Schneider, R. Arctic/North Atlantic Oscillation signature in Holocene sea surface temperature trends as obtained from alkenone data. Geophys. Res. Lett. 2003, 30, 1280. [Google Scholar] [CrossRef]
- Fleitmann, D.; Burns, S.J.; Mangini, A.; Mudelsee, M.; Kramers, J.; Villa, I.; Neff, U.; Al-Subbary, A.A.; Buettner, A.; Hippler, D.; et al. Holocene ITCZ and Indian monsoon dynamics recorded in stalagmites from Oman and Yemen (Socotra). Quat. Sci. Rev. 2007, 26, 170–188. [Google Scholar] [CrossRef]
- Glennie, K.W.; Singhvi, A.K. Event stratigraphy, paleoenvironment and chronology of SE Arabian deserts. Quat. Sci. Rev. 2002, 21, 853–869. [Google Scholar] [CrossRef]
- Parker, A.G.; Goudie, A.S. Geomorphological and palaeoenvironmental investigations in the southeastern Arabian Gulf region and the implication for the archaeology of the region. Geomorphology 2008, 101, 458–470. [Google Scholar] [CrossRef]
- Engel, M.; Brückner, H.; Pint, A.; Wellbrock, K.; Ginau, A.; Voss, P.; Grottker, M.; Klasen, N.; Frenzel, P. The early Holocene humid period in NW Saudi Arabia—Sediments, microfossils and palaeohydrological modelling. Quat. Int. 2012, 266, 131–141. [Google Scholar] [CrossRef]
- Matter, A.; Neubert, E.; Preusser, F.; Rosenberg, T.; Al-Wagdani, K. Palaeo-environmental implications derived from lake and sabkha deposits of the southern Rub’al-Khali, Saudi Arabia and Oman. Quat. Int. 2015, 382, 120–131. [Google Scholar] [CrossRef]
- Lancaster, N.; Baas, A. Influence of vegetation cover on sand transport by wind: Field studies at Owens Lake, California. Earth Surf. Process. Landf. 1998, 23, 69–82. [Google Scholar] [CrossRef]
- Thomas, D.S.G.; Knight, M.; Wiggs, G.F.S. Remobilization of southern African desert dune systems by twenty-first century global warming. Nature 2005, 435, 1218–1221. [Google Scholar] [CrossRef] [PubMed]
- Doornkamp, J.C.; Brunsden, D.; Jones, D.K.C. Geology. Geomorphology and Pedologv of Bahrain; Geo. Abstracts Ltd.: Norwich, UK, 1980; p. 443. [Google Scholar]


| Mission | Date | Resolution | Remarks |
|---|---|---|---|
| Gambit (KH-7) | 4 November 1965 | c. 0.6–1.2 m/pixel | 0.8 m/pixel in the used scene |
| Aerial ortho-mosaic | February 1995 | 1 m/pixel | Sampled to 1 m/pixel |
| IKONOS | 2004 | 1 m/pixel | First commercial satellite to reach 1 m/pixel; color (only for georeferencing) |
| OrbView-3 | 4 March 2006 | c. 1 m/pixel | 1 m/pixel in the used scene |
| SPOT 7 | 4 May 2015 | c. 1.5 m/pixel | 1.7 m/pixel in the used scene, color |
© 2018 by the authors. Licensee MDPI, Basel, Switzerland. This article is an open access article distributed under the terms and conditions of the Creative Commons Attribution (CC BY) license (http://creativecommons.org/licenses/by/4.0/).
Share and Cite
Engel, M.; Boesl, F.; Brückner, H. Migration of Barchan Dunes in Qatar–Controls of the Shamal, Teleconnections, Sea-Level Changes and Human Impact. Geosciences 2018, 8, 240. https://doi.org/10.3390/geosciences8070240
Engel M, Boesl F, Brückner H. Migration of Barchan Dunes in Qatar–Controls of the Shamal, Teleconnections, Sea-Level Changes and Human Impact. Geosciences. 2018; 8(7):240. https://doi.org/10.3390/geosciences8070240
Chicago/Turabian StyleEngel, Max, Fabian Boesl, and Helmut Brückner. 2018. "Migration of Barchan Dunes in Qatar–Controls of the Shamal, Teleconnections, Sea-Level Changes and Human Impact" Geosciences 8, no. 7: 240. https://doi.org/10.3390/geosciences8070240
APA StyleEngel, M., Boesl, F., & Brückner, H. (2018). Migration of Barchan Dunes in Qatar–Controls of the Shamal, Teleconnections, Sea-Level Changes and Human Impact. Geosciences, 8(7), 240. https://doi.org/10.3390/geosciences8070240