Experimental Determination of Impure CO2 Alteration of Calcite Cemented Cap-Rock, and Long Term Predictions of Cap-Rock Reactivity


1
School of Earth and Environmental Sciences, University of Queensland, Queensland 4072, Australia
2
UQ Energy Initiative, University of Queensland, Queensland 4072, Australia
*
Author to whom correspondence should be addressed.
Geosciences 2018, 8(7), 241; https://doi.org/10.3390/geosciences8070241
Submission received: 5 June 2018
/
Revised: 27 June 2018
/
Accepted: 28 June 2018
/
Published: 29 June 2018
(This article belongs to the Special Issue Geological Storage of Gases as a Tool for Energy Transition)
Abstract
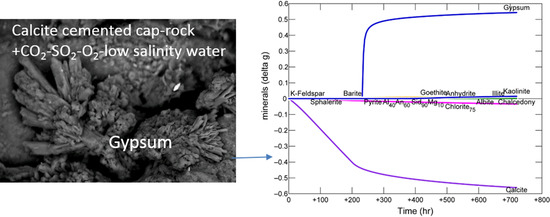
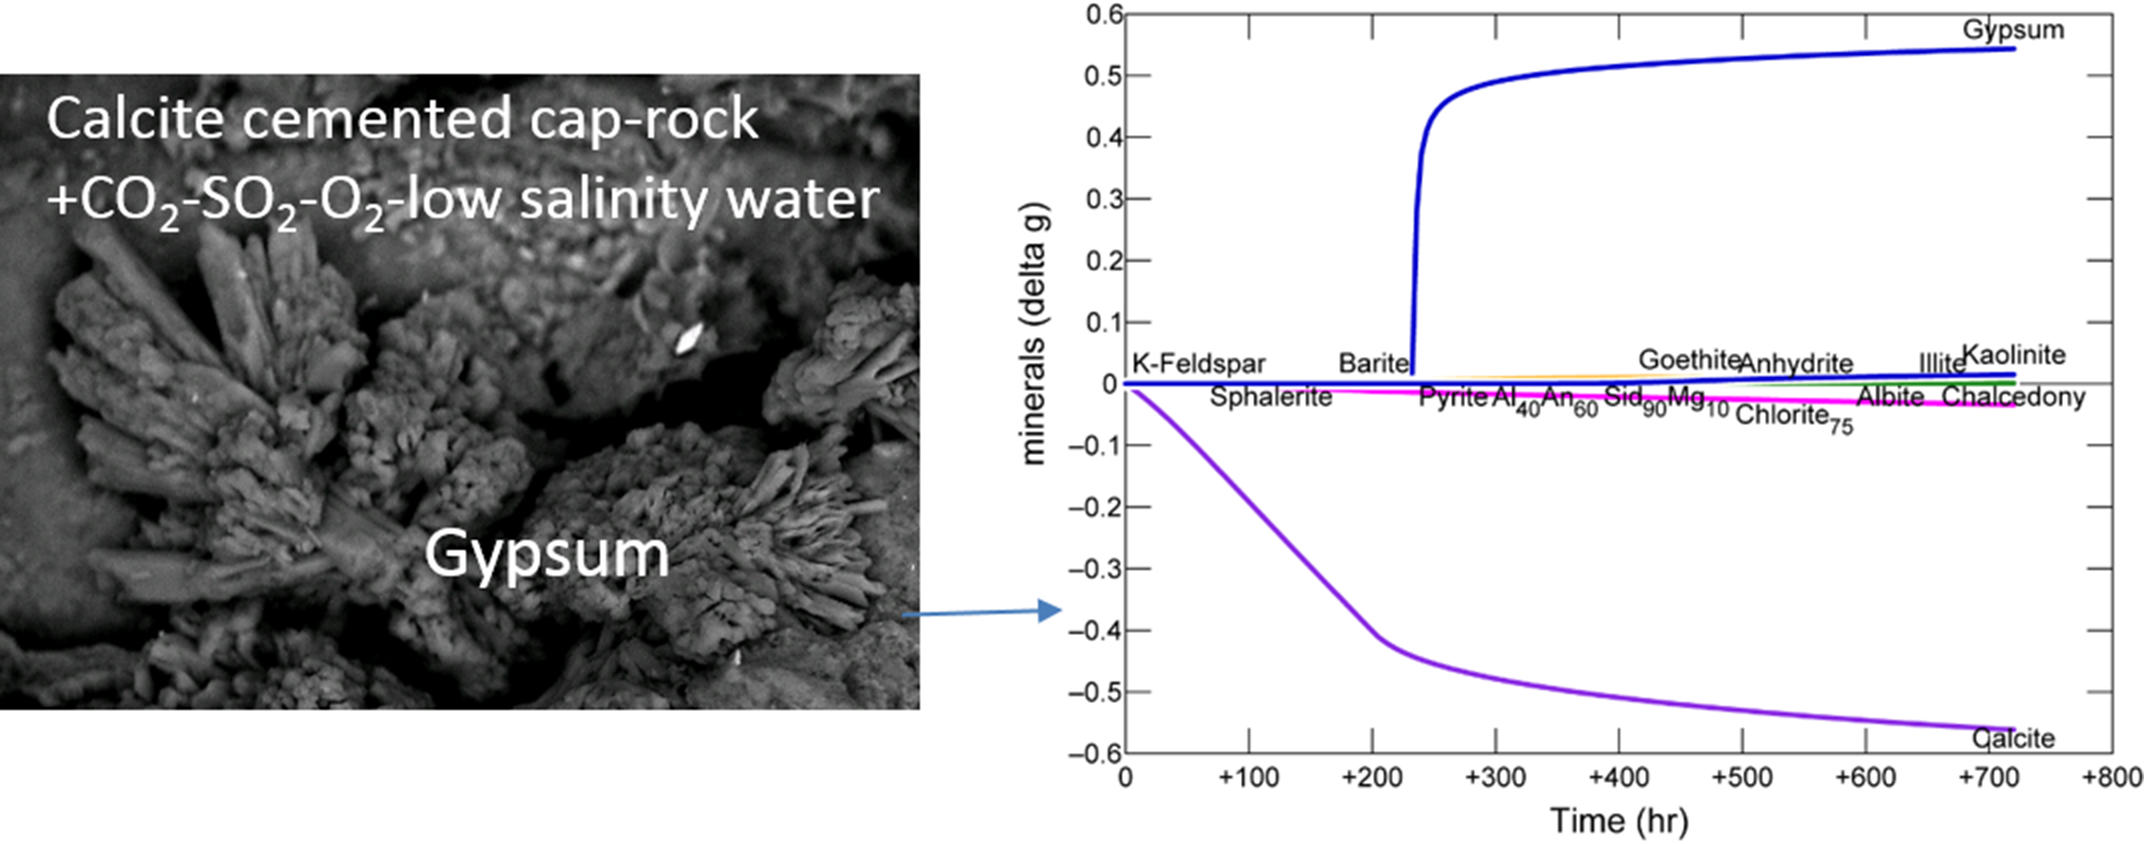
:Cap-rock integrity is an important consideration for geological storage of CO2. While CO2 bearing fluids are known to have reactivity to certain rock forming minerals, impurities including acid gases such as SOx, NOx, H2S or O2 may be present in injected industrial CO2 streams at varying concentrations, and may induce higher reactivity to cap-rock than pure CO2. Dissolution or precipitation of minerals may modify the porosity or permeability of cap-rocks and compromise or improve the seal. A calcite cemented cap-rock drill core sample (Evergreen Formation, Surat Basin) was experimentally reacted with formation water and CO2 containing SO2 and O2 at 60 °C and 120 bar. Solution pH was quickly buffered by dissolution of calcite cement, with dissolved ions including Ca, Mn, Mg, Sr, Ba, Fe and Si released to solution. Dissolved concentrations of several elements including Ca, Ba, Si and S had a decreasing trend after 200 h. Extensive calcite cement dissolution with growth of gypsum in the formed pore space, and barite precipitation on mineral surfaces were observed after reaction via SEM-EDS. A silica and aluminium rich precipitate was also observed coating grains. Kinetic geochemical modelling of the experimental data predicted mainly calcite and chlorite dissolution, with gypsum, kaolinite, goethite, smectite and barite precipitation and a slight net increase in mineral volume (decrease in porosity). To better approximate the experimental water chemistry it required the reactive surface areas of: (1) calcite cement decreased to 1 cm2/g; and, (2) chlorite increased to 7000 cm2/g. Models were then up-scaled and run for 30 or 100 years to compare the reactivity of calcite cemented, mudstone, siderite cemented or shale cap-rock sections of the Evergreen Formation in the Surat Basin, Queensland, Australia, a proposed target for future large scale CO2 storage. Calcite, siderite, chlorite and plagioclase were the main minerals dissolving. Smectite, siderite, ankerite, hematite and kaolinite were predicted to precipitate, with SO2 sequestered as anhydrite, alunite, and pyrite. Predicted net changes in porosity after reaction with CO2, CO2-SO2 or CO2-SO2-O2 were however minimal, which is favourable for cap-rock integrity. Mineral trapping of CO2 as siderite and ankerite however was only predicted in the CO2 or CO2-SO2 simulations. This indicates a limit on the injected O2 content may be needed to optimise mineral trapping of CO2, the most secure form of CO2 storage. Smectites were predicted to form in all simulations, they have relatively high CO2 sorption capacities and provide additional storage.
1. Introduction
Cap-rocks traditionally act as low porosity and permeability structural seals of CO2 plumes stored geologically in high porosity reservoirs. Cap-rocks consisting of shales, mudstones, siltstones, sandstones, carbonates or evaporites have been documented internationally [1,2,3,4,5,6]. In many cases, these sealing units are thick interbedded formations of variable lithology and mineralogy. When stored at depths greater than ~800 m and temperatures above 31 °C, CO2 exists as a supercritical fluid. Water can dissolve into the buoyant plume (forming wet supercritical CO2), and CO2 can dissolve in formation water to form a weak carbonic acid [7,8,9]. CO2 rich fluids have been shown to be reactive to some rock forming minerals, especially carbonates, grain coating Fe-oxides, and more reactive silicates such as plagioclase and Fe-rich clays [10,11,12,13].
CO2 streams from industrial sources e.g., coal-fired post combustion capture (PCC), oxyfuel firing, cement or steel processing, have been reported to contain ancillary (or impurity) gases such as N2, Ar, O2, and acid forming gases such as NOx, SOx, H2S [14,15]. The type and concentration of these gases depend on the capture and purification process, with generally <5% impurity gases recommended for CO2 storage, although acid gas streams with up to ~25% H2S have been successfully stored in Canada or Iceland for example [16,17,18]. The majority of storage demonstrations, experimental and modelling studies however use pure food grade CO2 and studies using impure CO2 are needed.
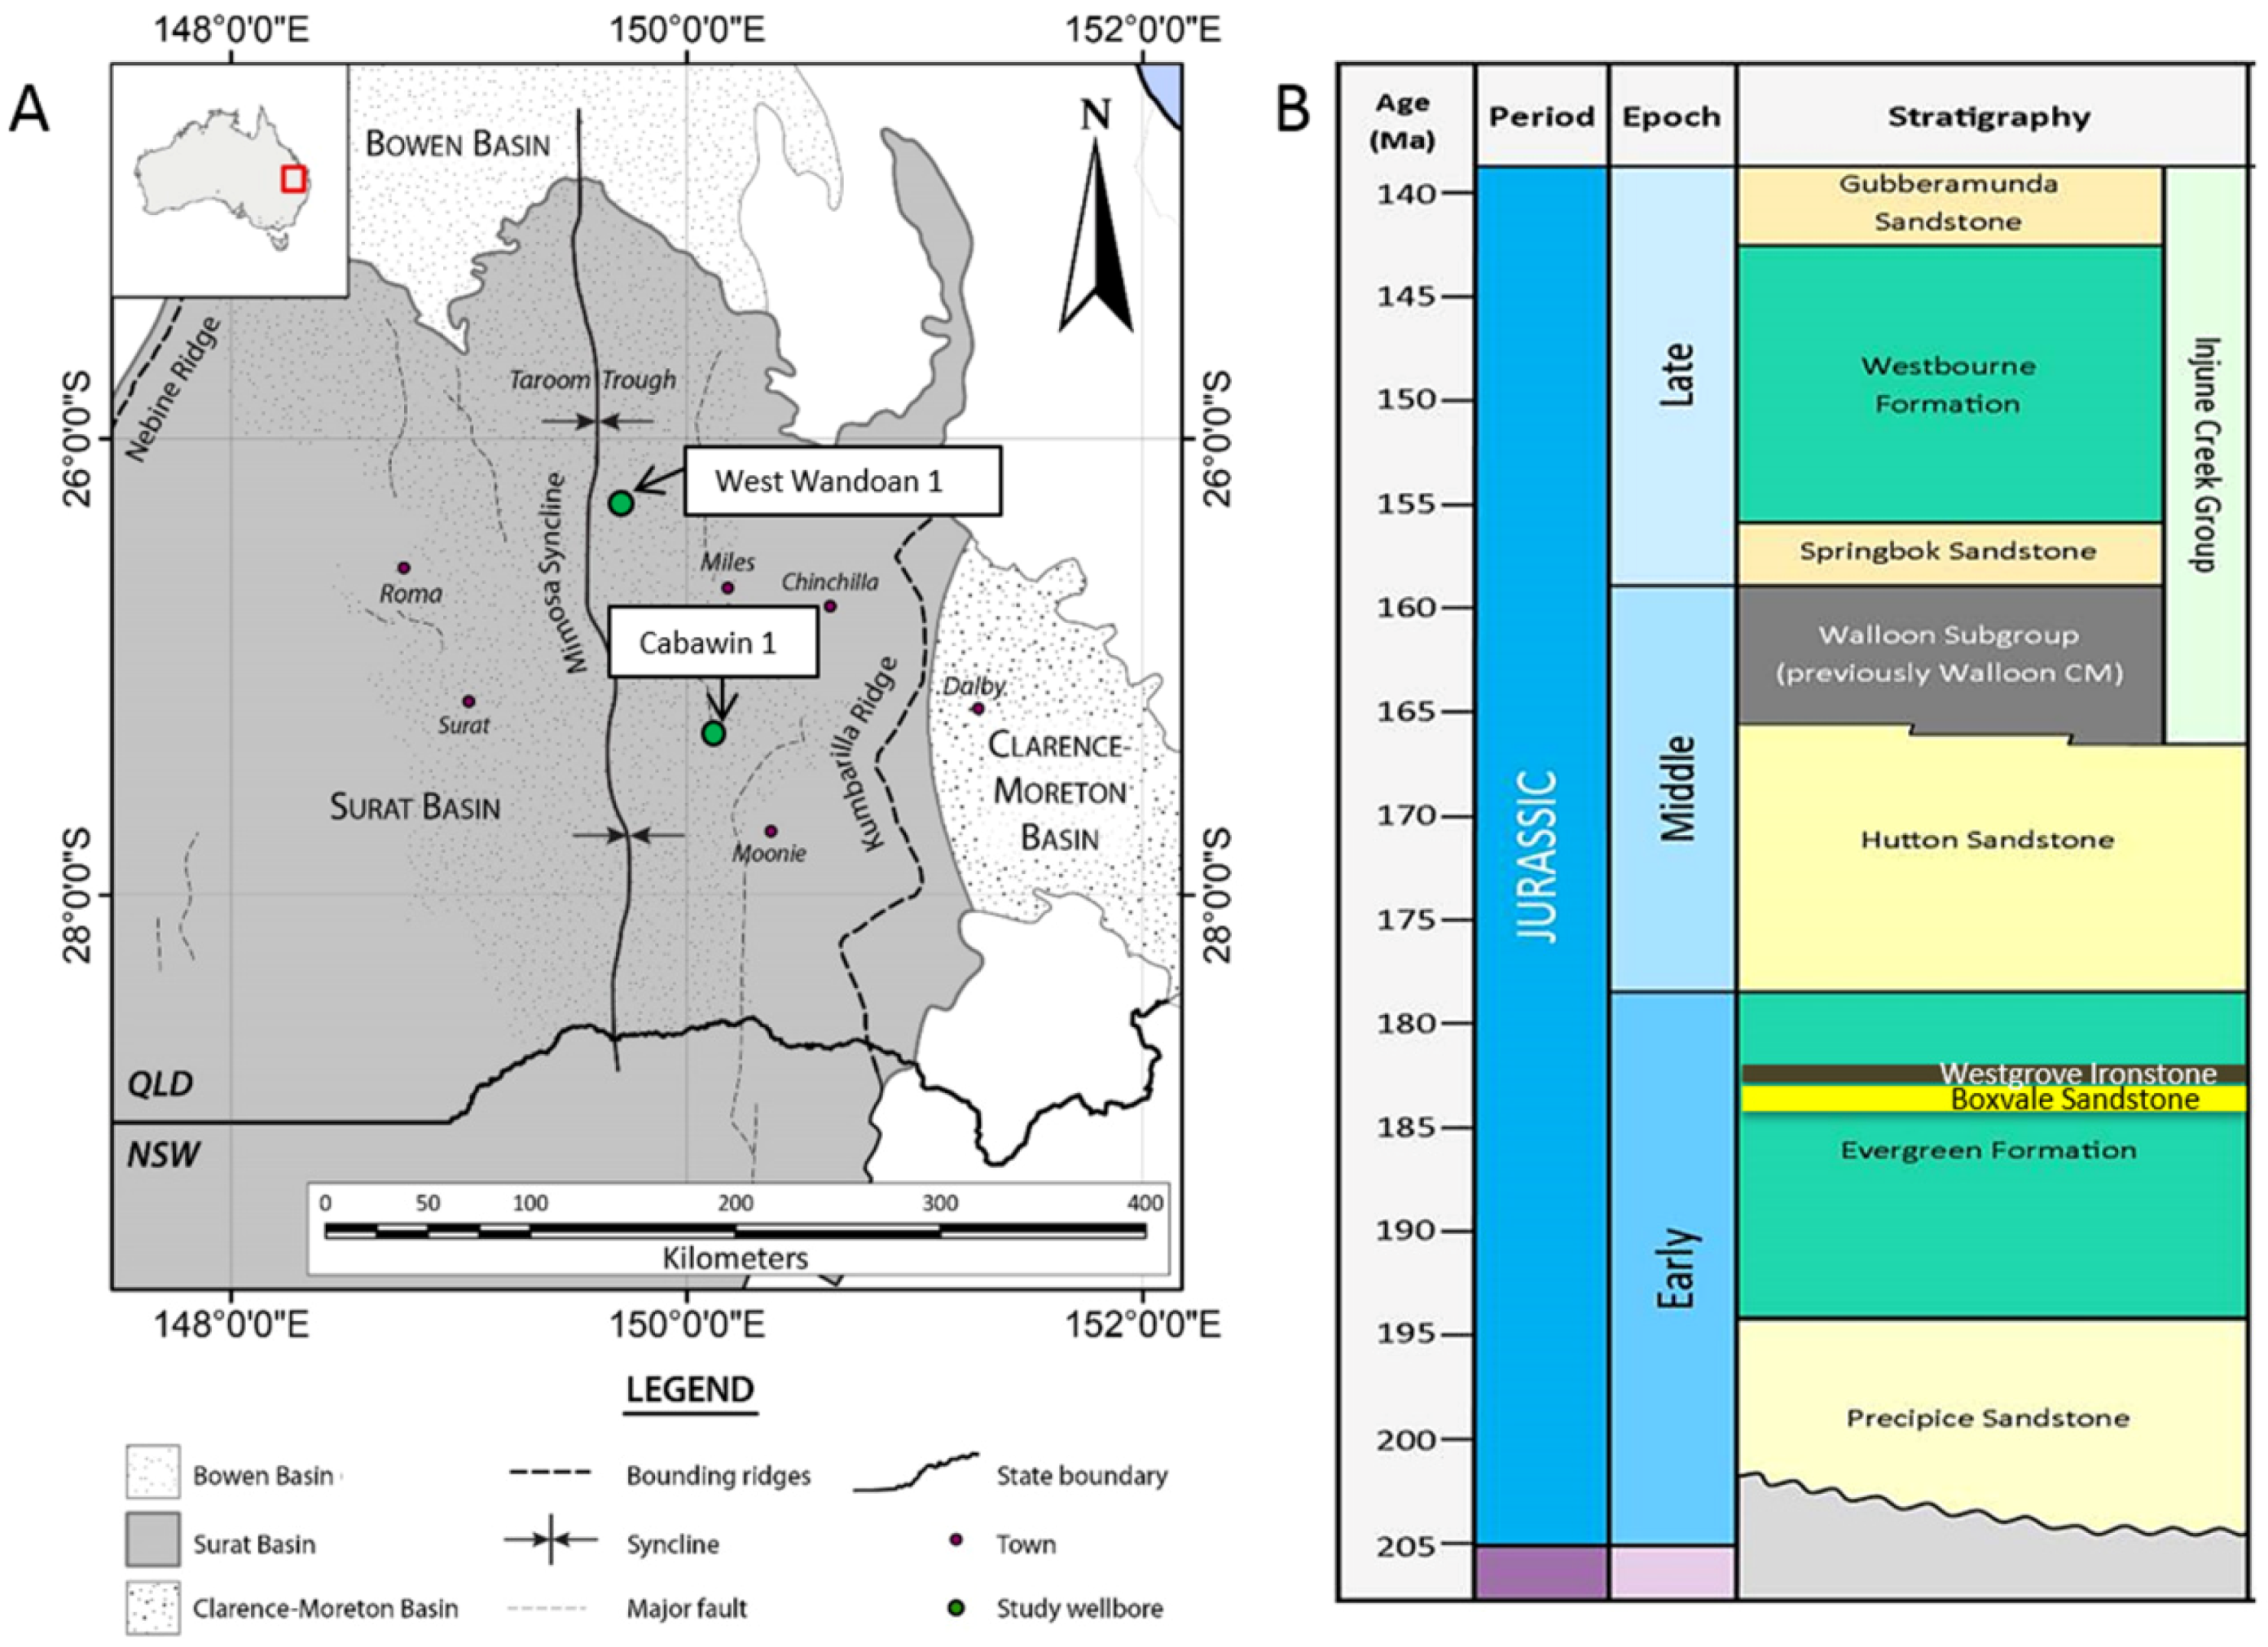
The Precipice Sandstone and Evergreen Formation of the Surat Basin, Australia, form a storage reservoir and seal pair that has been reported to have high prospectivity for CO2 storage, and is currently undergoing a study for its future feasibility as a large scale storage site [19,20]. The Precipice Sandstone is a quartz rich, low salinity fresh to brackish aquifer, increasing in depth towards the central part of the Basin [21,22]. The Precipice Sandstone outcrops in the north, and reaches depths of ~1236 m near the West Wandoan 1 well (Figure 1), and ~2134 m near Cabawin 1 further south. The lower Precipice sandstone reservoir ranges from ~60–115 m thick in the central fairway, and pinches out to the West. The Evergreen Formation has been reported to contain interbedded shales, mudstone, sandstone, and carbonate cemented sections [23,24]. This formation has a total thickness of ~175 m near the West Wandoan 1 well. Generally more mineralogical and petrophysical data is available from the Northern parts of the basin, with a more limited number of wells drilled in the deeper central region. The West Wandoan 1 well for example, drilled for a small scale CO2 storage demonstration feasibility study, has reported micro CT calculated porosities for the Evergreen Formation of 0.1–20.4%, and helium porosities of 4.6–21.5% (Figure 1) [25].
Calcite is kinetically one of the most reactive rock-forming mineral phases to CO2 bearing fluids, therefore calcite cemented zones may be the most susceptible to mineral and porosity changes [26,27]. Minerals with high available surface areas such as clays; or Fe-oxide grain coatings have also been shown elsewhere to be the most reactive mineral phases in sandstone reservoirs or cap-rocks, demonstrating the importance of the minerals reactive surface areas [28]. This study aims to use experimental CO2-SO2-O2-water-cap-rock reaction data to modify and validate a geochemical model at the experimental scale using reactive surface areas as a variable. Geochemical models will be subsequently upscaled to estimate mineral and porosity alteration with a higher degree of confidence over longer timescales for common cap-rock compositions including mudstones and shales.
2. Materials and Methods
Drill core was sampled at 1056.10–1056.18 m KB from the Evergreen Formation of the West Wandoan 1 well (latitude −26.181622, longitude 149.812422) in the Surat Basin (Figure 1). This core depth section has been characterized mineralogically previously (Table 1) [29]. Reported reservoir temperature and pressure near this well are ~60 °C and 120 bar.
A 1.5 cm3 cube, a block and offcuts were cut from the core. Unstressed N2 gas permeability was performed on the cube in the vertical and two horizontal directions, with the methods described previously [30]. Brine permeability was also attempted but was below the resolution of the technique (<0 mD). Scanning electron microscopy with energy dispersive spectroscopy (SEM EDS) was performed on uncoated block surfaces before and after reaction on a JEOL JSM-6460LA environmental SEM with a Minicup EDS, and a TM3030 with a Brucker EDS. In addition the block was broken after reaction and the inner surfaces surveyed with SEM EDS. Disaggregated grains collected from the bottom of the reactor were dried, fixed to a carbon stub, and also analyzed by SEM-EDS. After reaction the core offcuts were also dried and crushed, and powder X-ray diffraction (XRD) performed with the methods reported elsewhere [30].
For reaction, the core blocks and offcuts (6.27 g) were submerged in 100 mL of a low salinity water with 1500 mg/kg NaCl in reactors based on Parr vessels. The reactors and general methods have been reported previously in detail and so are only briefly described below [31]. The rectors were maintained at 60 °C, purged of air, and pressurized to 120 bar initially with inert N2 gas to perform a water-rock soak and obtain a baseline water measurement. After 7 days, the reactors were sampled and depressurized, then repressurised to 120 bar with a gas mixture containing 0.2% SO2, 2% O2 and a balance of CO2. At this temperature and pressure CO2 was in a supercritical state. The experiment was then run for 720 days and fluid sampled periodically. After the reaction, the reactor was depressurized, and the remaining fluid (referred to as quench) was sampled. Solution pH and conductivity were immediately measured on fluid sampling. The degassing of CO2 on sampling will however have resulted in the pH rising as dissolved CO2 exsolves in ex situ samples. Therefore the experimental measured pH will be higher than the in situ and predicted pH. Sampled fluid was filtered, diluted ten times, and acidified with ultrapure nitric acid for analysis by Inductively Coupled Plasma Optical Emission Spectroscopy (ICP-OES) with a Perkin Elmer Optima 3300DV and Inductively Coupled Plasma Mass Spectrometry (ICP-MS) as described previously [32]. Selected sample aliquots were not acidified and analyzed for bicarbonate alkalinity by titration, and sulphate and chloride concentrations by ion chromatography (ALS environmental). The bicarbonate concentration can be expected to represent a maximum value owing to CO2 degassing. No precipitated carbonates were identified in sampled waters.
The experiment was also geochemically modelled at 60 °C using the react module of Geochemist Workbench 9 (GWB) and a thermodynamic database based on the EQ3/6 database [33,34]. The experimental N2-water-rock soak data was used as the initial water chemistry for 100 mL of fluid, and the mass of minerals determined in the core supplemented by SEM-EDS information for the reacted subsample (Table 2 “Exp WW1CalCem”). The methods are similar to those described in detail previously, with the fugacity of CO2 calculated for 60 °C and 120 bar from the work of Duan and Sun, with a mass of SO2 and an O2 fugacity to approximate the experiment data (e.g., the dissolved sulphate concentration) [31,35]. The input kinetic and thermodynamic parameters are given in Table 2 and Supplementary Material and are from published sources [36,37,38,39,40]. Minerals were input as script files, with an Fe-rich chlorite (Fe:Mg 3:1), ordered ankerite (Ca:Fe:Mg 1:0.7:0.3), and siderite (Fe:Mg 0.9:0.1) composition most closely representing those minerals observed in drill core [31]. The reactive surface areas were modified to improve the prediction of the experimental water chemistry. The initial mineral surface areas were based on a geometric calculation from SEM observations of grain size and morphology [41]. These were decreased to account for surface coating and armouring as described previously [31]. Reactive surface areas of minerals were then increased or decreased to improve the fit to the experimental water chemistry. The minerals observed to be corroded or that dissolved completely during the experiment via SEM observations guided the changes. Calcite mainly controlled the Ca concentration, and in this case mainly chlorite controlled the Fe and Mg concentrations. Illite, plagioclase, kaolinite and K-feldspar surface area modification additionally improved the Si, Al and K concentrations. The final reactive surface areas values used are in Table 2, the pre-exponential crystal nucleation factors Г were also modified for kaolinite and goethite with the values used in Supplementary Material (Table S1).
Geochemical models were also run at 60 °C for an upscaled calcite cemented caprock with the mineral input from XRD data for 10 kg of rock, with an amount of fluid added to occupy the pore space from the measured rock porosity (Table 2 “WW1 CalCem”, and Supplementary Material) as described elsewhere [42]. Reactive surface areas were upscaled by decreasing by a factor of 10–100 based on methods described elsewhere [27,42]. The water chemistry used was from published data equilibrated with the minerals [22]. The mudstone cap-rock “WW1 MudS” input data is from 981 m drill core from the same well (West Wandoan 1) and this model was also run at the same PT conditions.
The siderite cemented and shale cap-rocks “Cab1SidCem” and “Cab1Shale” are based on drill core data from the Cabawin 1 well in the deeper part of the Basin [43]. These were run at 70 °C with a fugacity of CO2 for 200 bar pressure based on reported pressure and temperature data for this well [44]. The water chemistry was based on published water chemistry data equilibrated with the rock, and the porosities given in Supplementary Material [22].
3. Results
3.1. Calcite Cemented Caprock
The sampled drill core was previously characterized by XRD, and sub-plug slices by QEMSCAN, and contains mainly quartz, plagioclase, K-feldspar, illite and calcite (Table 1) [29,30]. Micro CT porosities of sub-plugs from this core depth section were previously reported at 4.4–6.8%, helium porosity at 6.8%, and mercury intrusion porosity of adjacent material at 8.2% [25].
3.1.1. Experimental Results
The N2 permeabilities of the core cube were low at 0.96 mD vertical, 1.28 mD horizontal, and 2.55 mD horizontal.
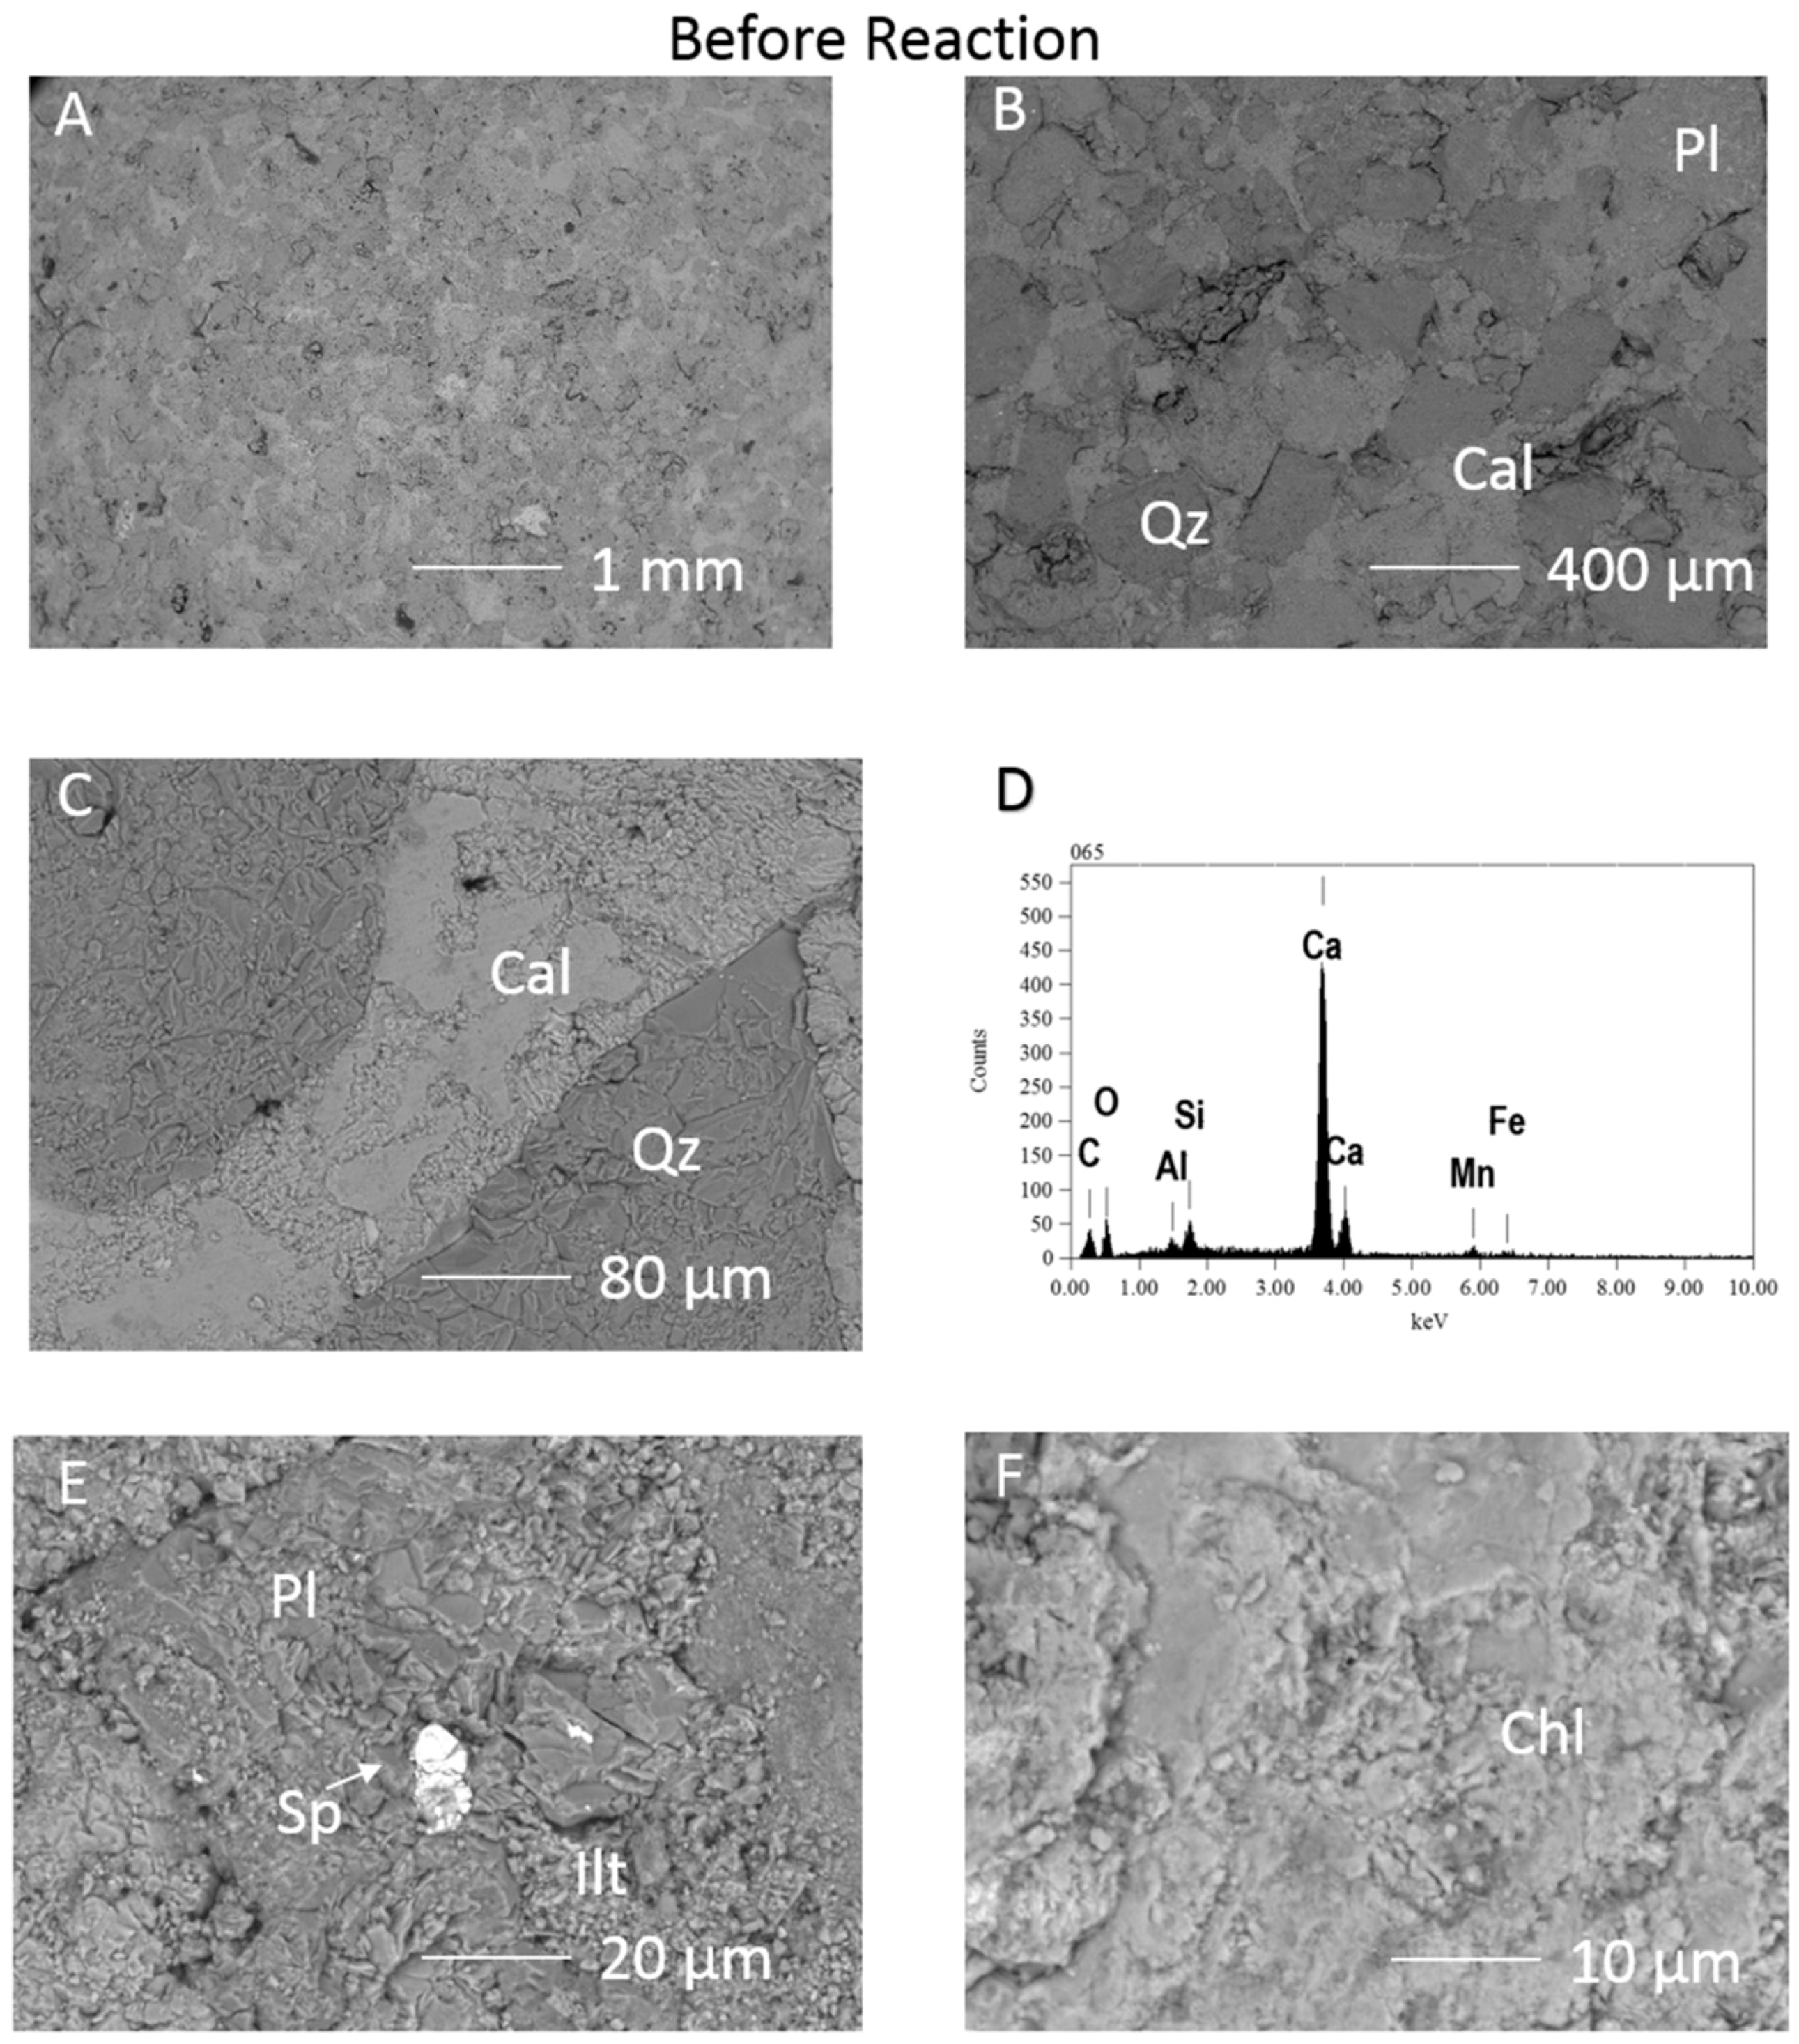
SEM-EDS before reaction showed calcite cemented framework grains, with the calcite EDS signatures indicating trace Mn and Fe content (Figure 2). Pore filling clays including illite and Fe-Mg-chlorite were partly covered by the calcite. Trace amounts of sphalerite or ZnFeS, organic matter, Ti-oxide, and apatite were occasionally present (Figure 2E). Both a Na-plagioclase albite, and Ca-Na-plagioclases close to oligoclase and andesine compositions were observed.
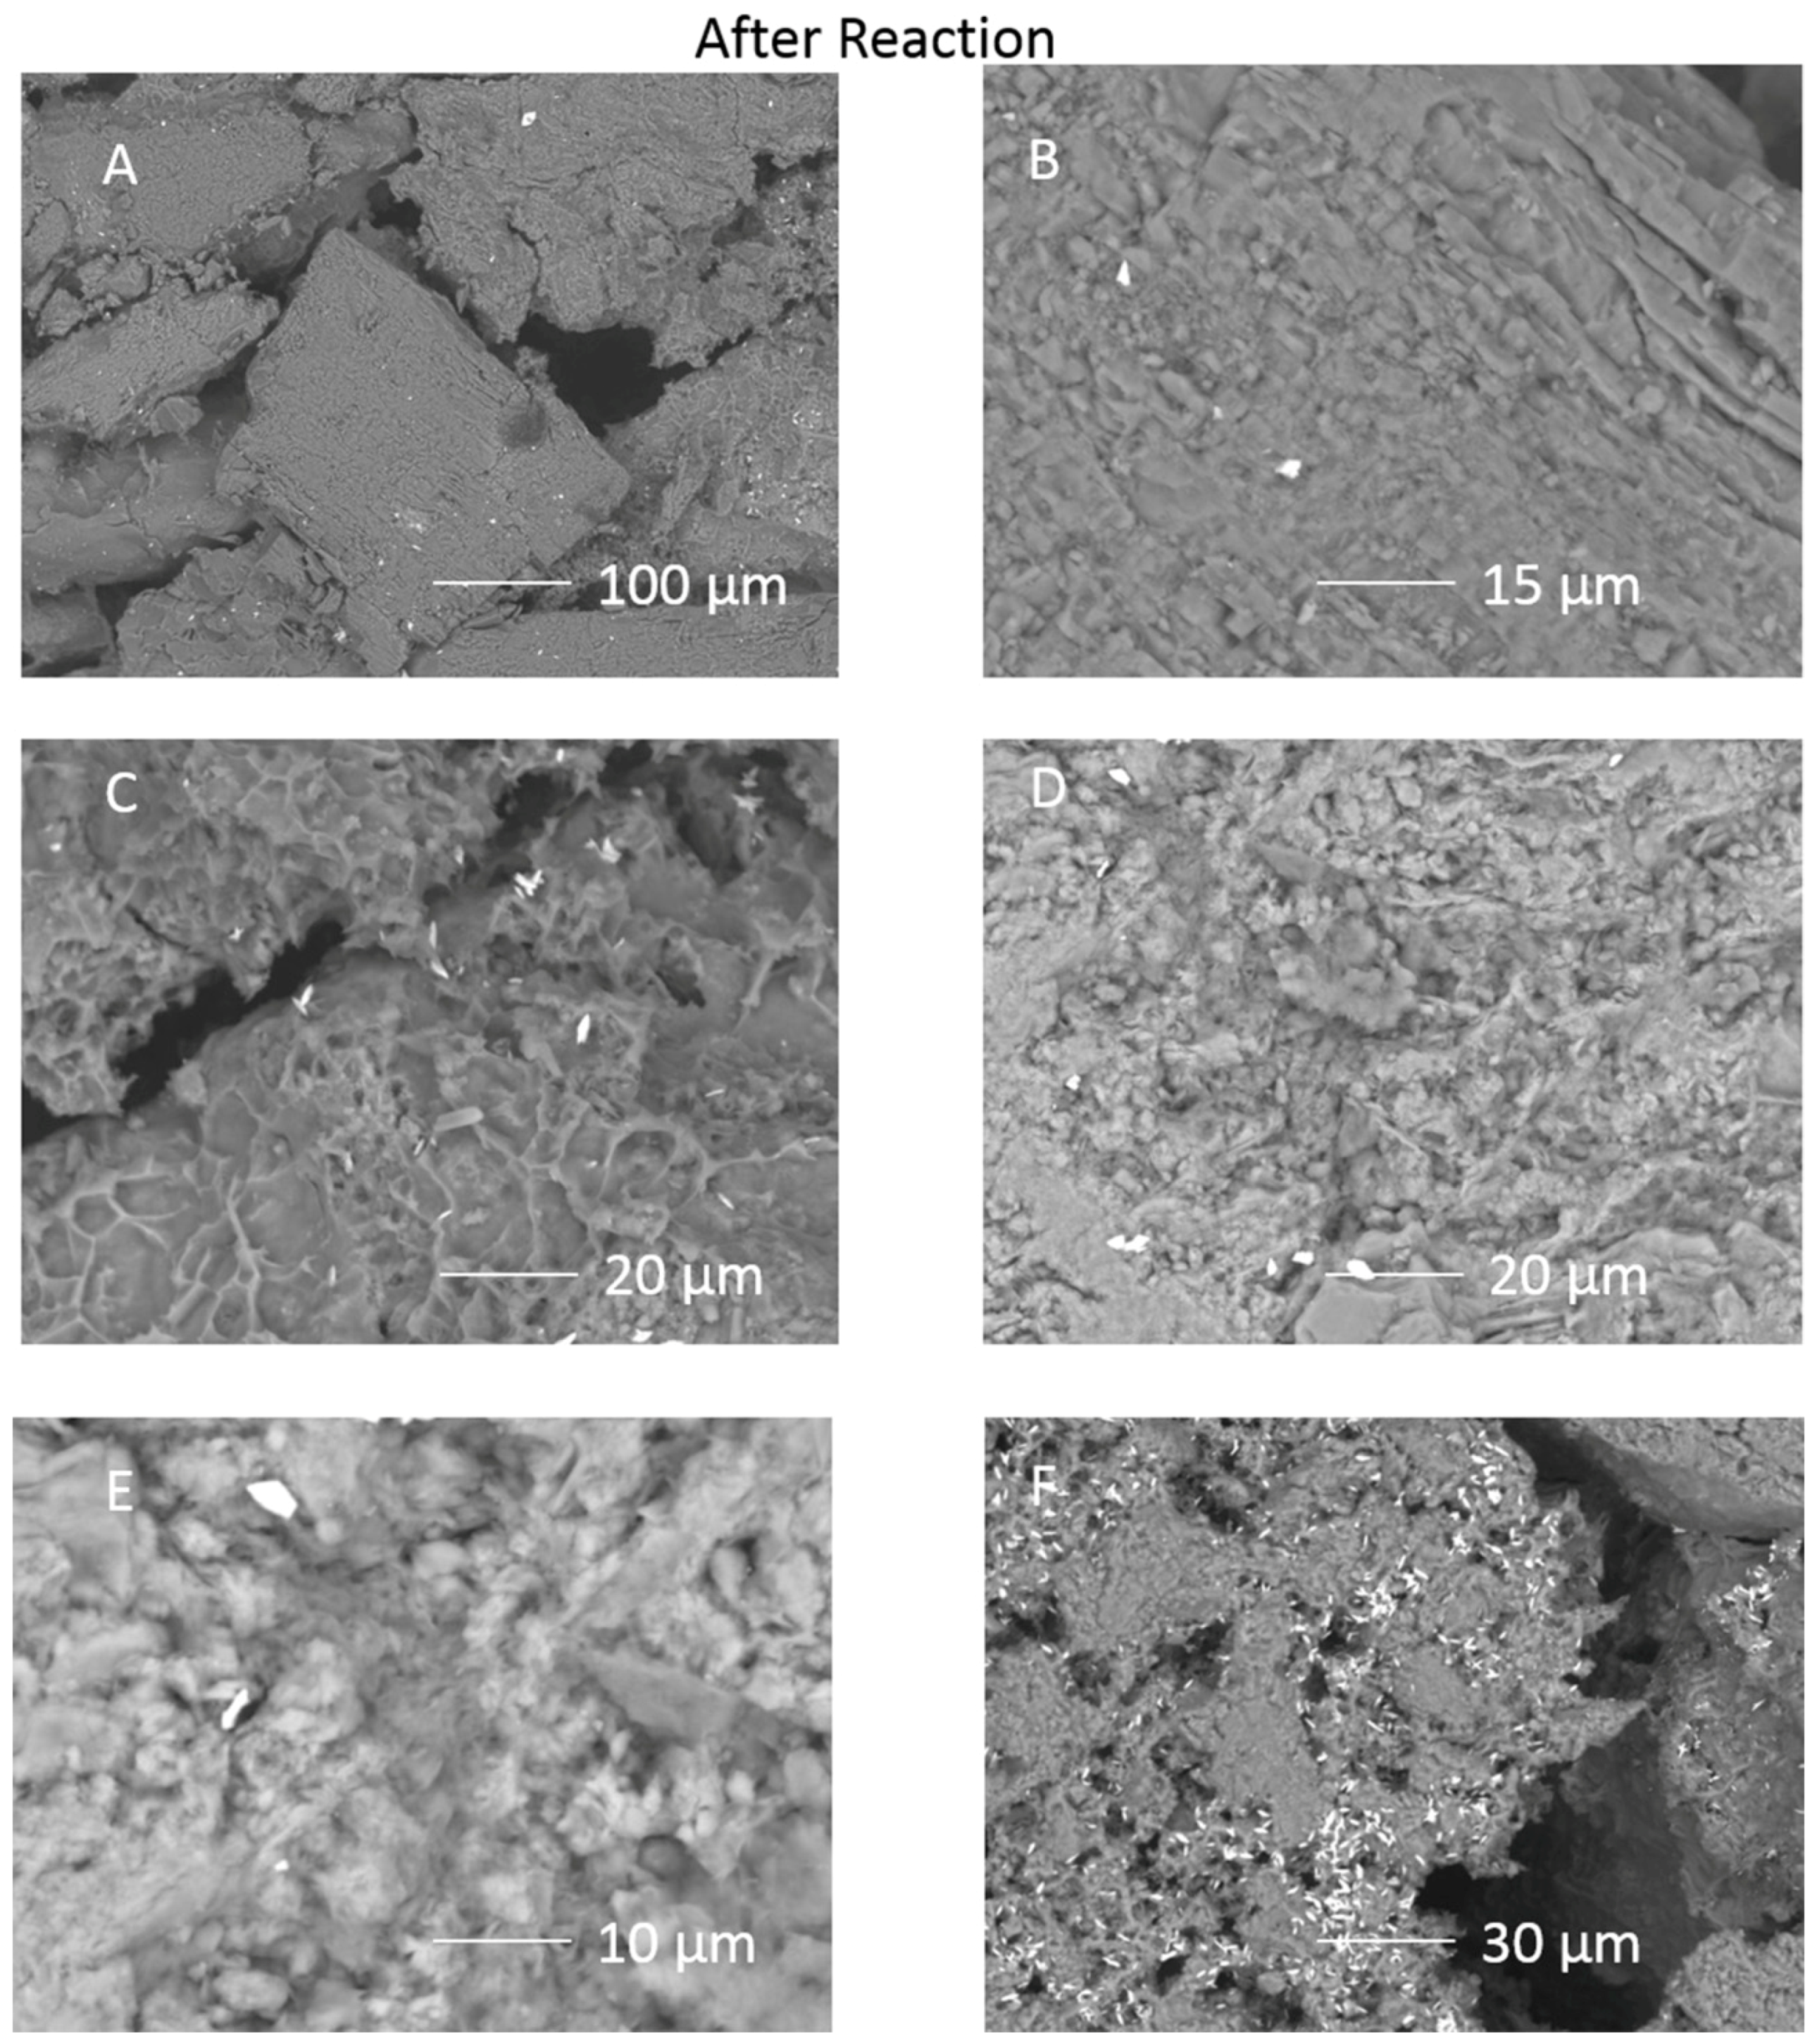
After reaction, on the outer rock cube surface, calcite cement had been dissolved exposing framework grains and pore filling clays (Figure 3A–D). Some chlorite and illite surfaces appeared altered; however other framework silicates did not show obvious corrosion features. A Ca-sulphate mineral was occasionally observed growing from the pore space formed by calcite dissolution, and barite crystals were mainly clustered on those precipitates (Figure 3E,F, and Supplementary Material Figures S3 and S5).
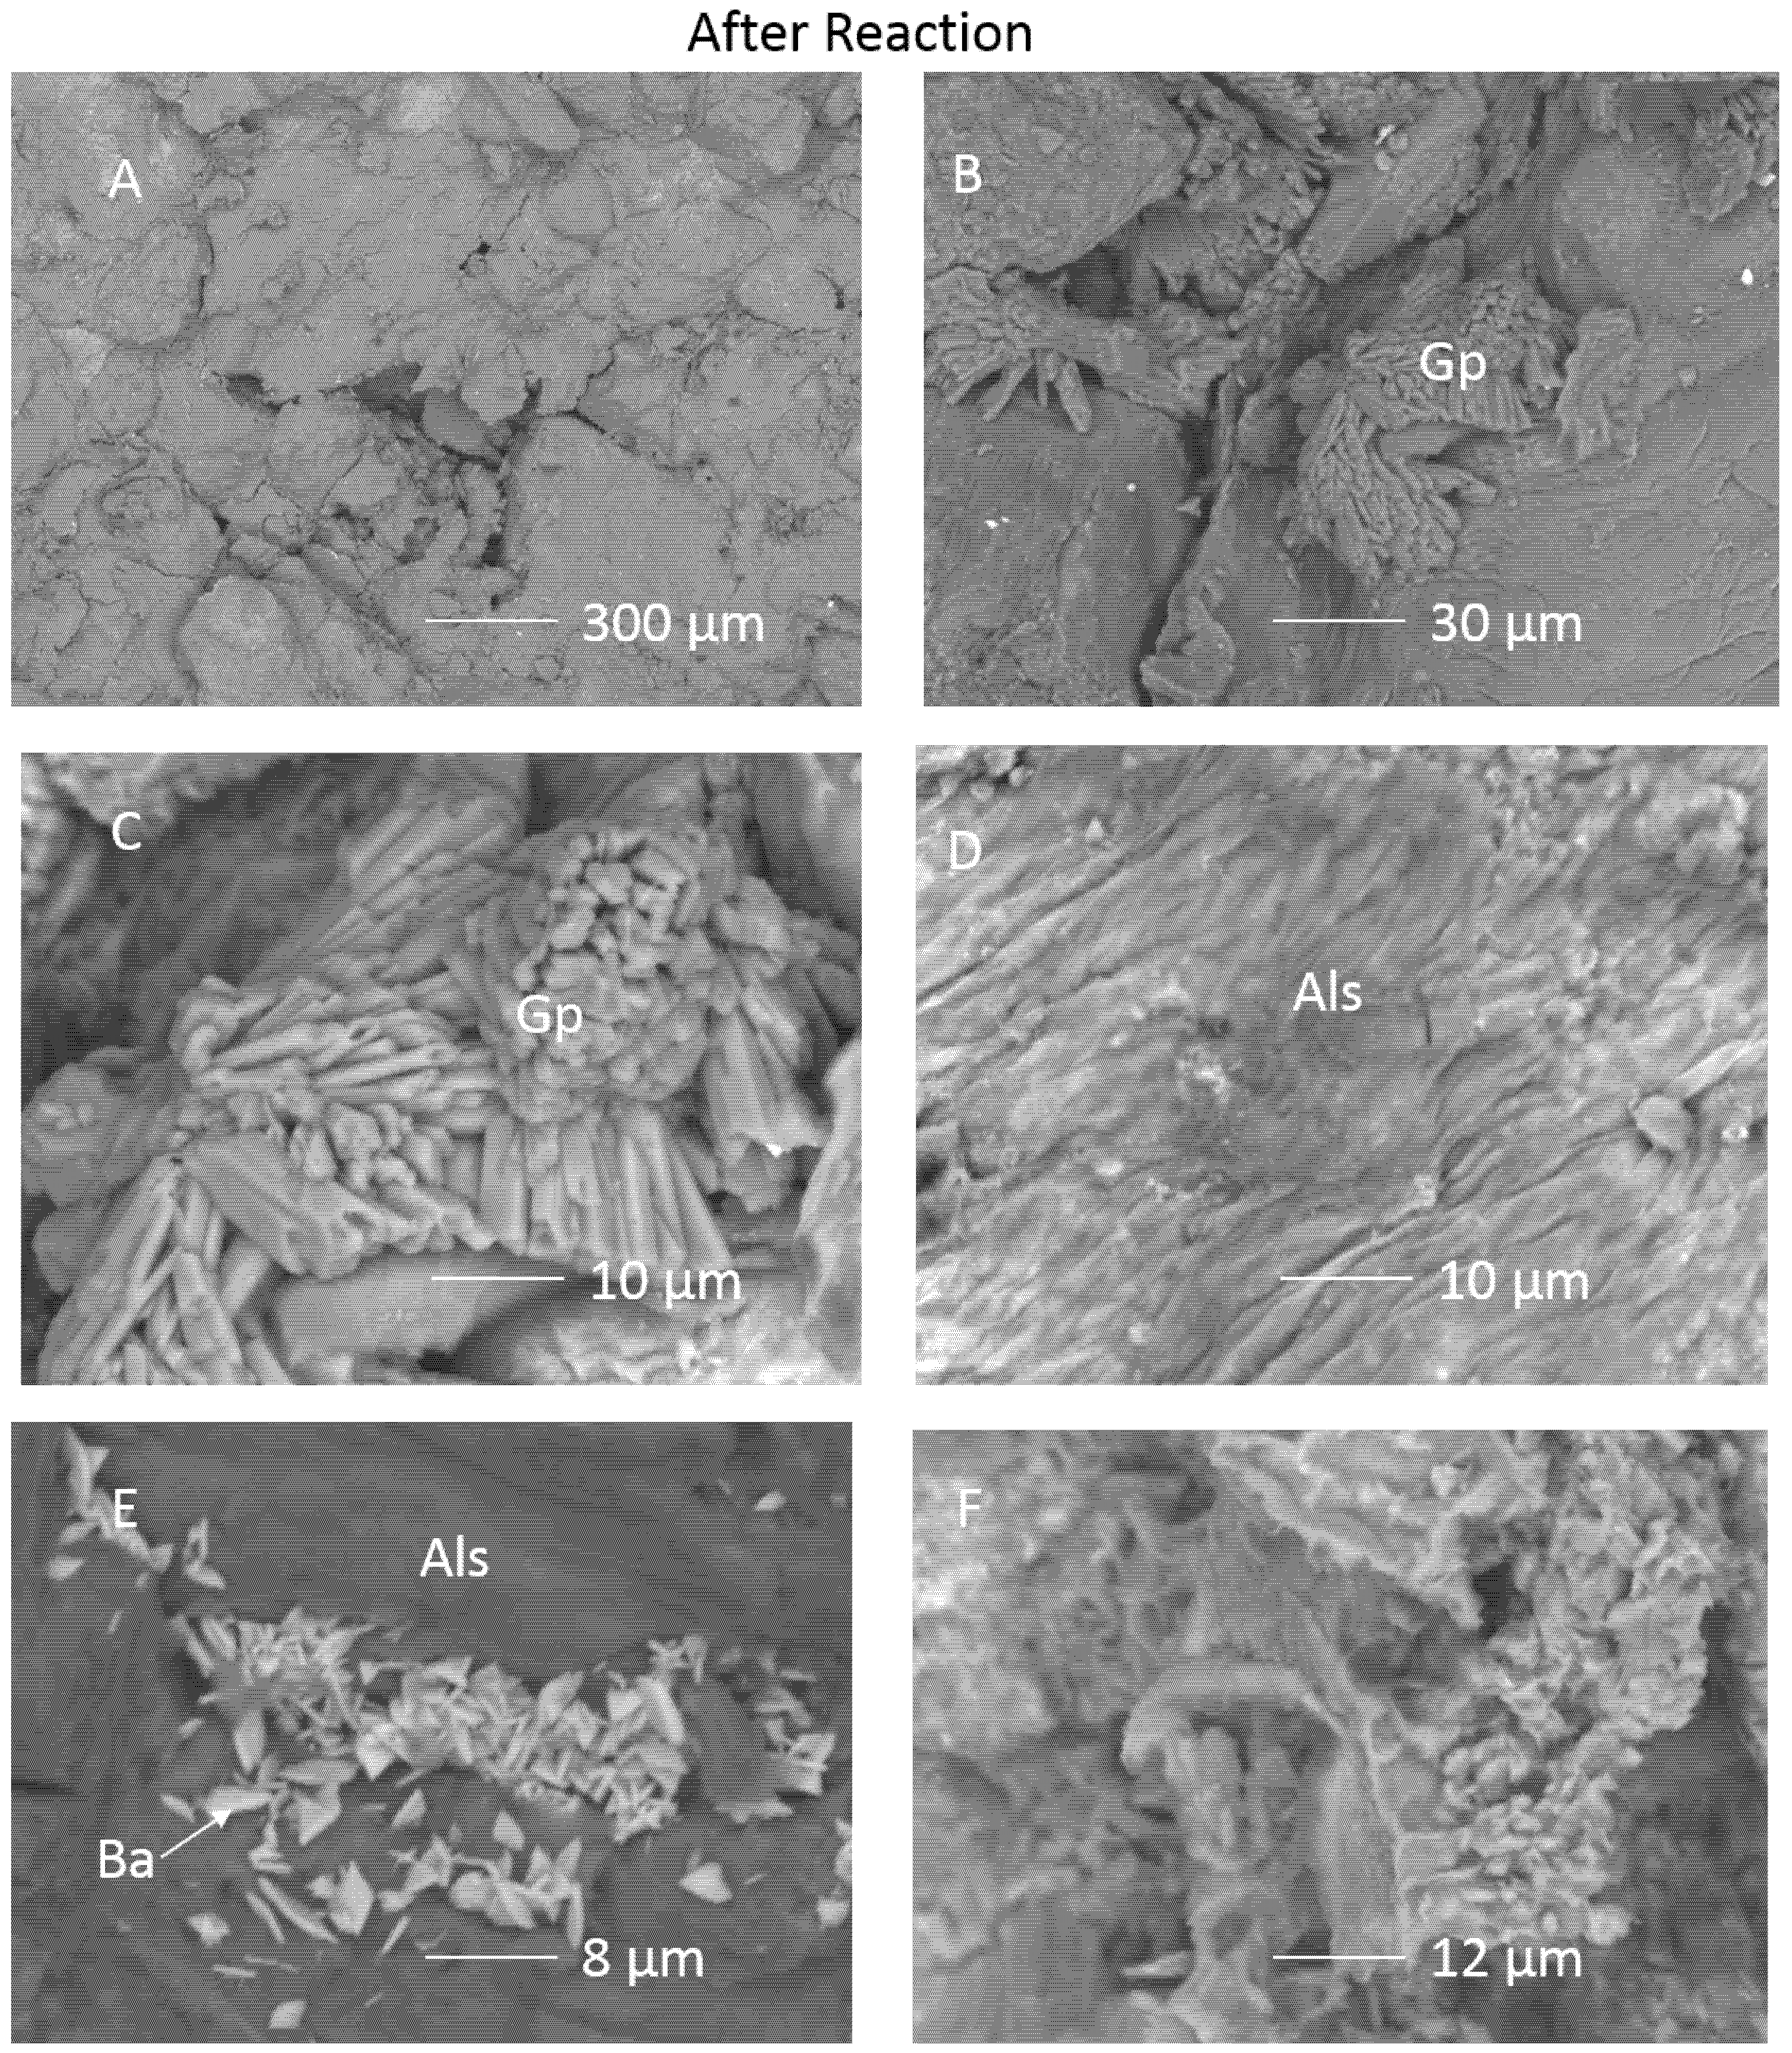
On the inner cube surface, calcite cement had also been dissolved (Figure 4A). Chlorite near the outer edges of the cube had a corroded appearance, with material precipitated on it (Figure 4D). Precipitated coatings on framework grains were present, including with a smectite-like morphology (Figure 4C). Barite crystals were also present over the surfaces (Figure 4D and Supplementary Material). A precipitated Si-Al layer covered grains on inner cube surfaces and was occasionally intermingled with barite crystals indicating that at least part of the barite had precipitated during the reaction rather than on reactor depressurization (Figure 5A,D,E). Again a Ca-sulphate mineral had precipitated “growing” out of the formed pore space and was in higher abundance on the inner surfaces (Figure 5B,C). Occasionally illite had a skeletal or corroded appearance indicating that it had been altered (Figure 5F).
Disaggregated grains collected from the bottom of the reactor had Fe-oxide coatings, and occasional barite crystal coatings (Supplementary Material Figure S6). Reacted core offcuts were analyzed by XRD which indicated a total loss of calcite, and formation of a smectite (montmorillonite) phase and kaolinite (Table 1). It should be noted however that the smaller changes may also be affected by rock heterogeneity. No Ca-sulphate minerals were detected but these were likely below detection.
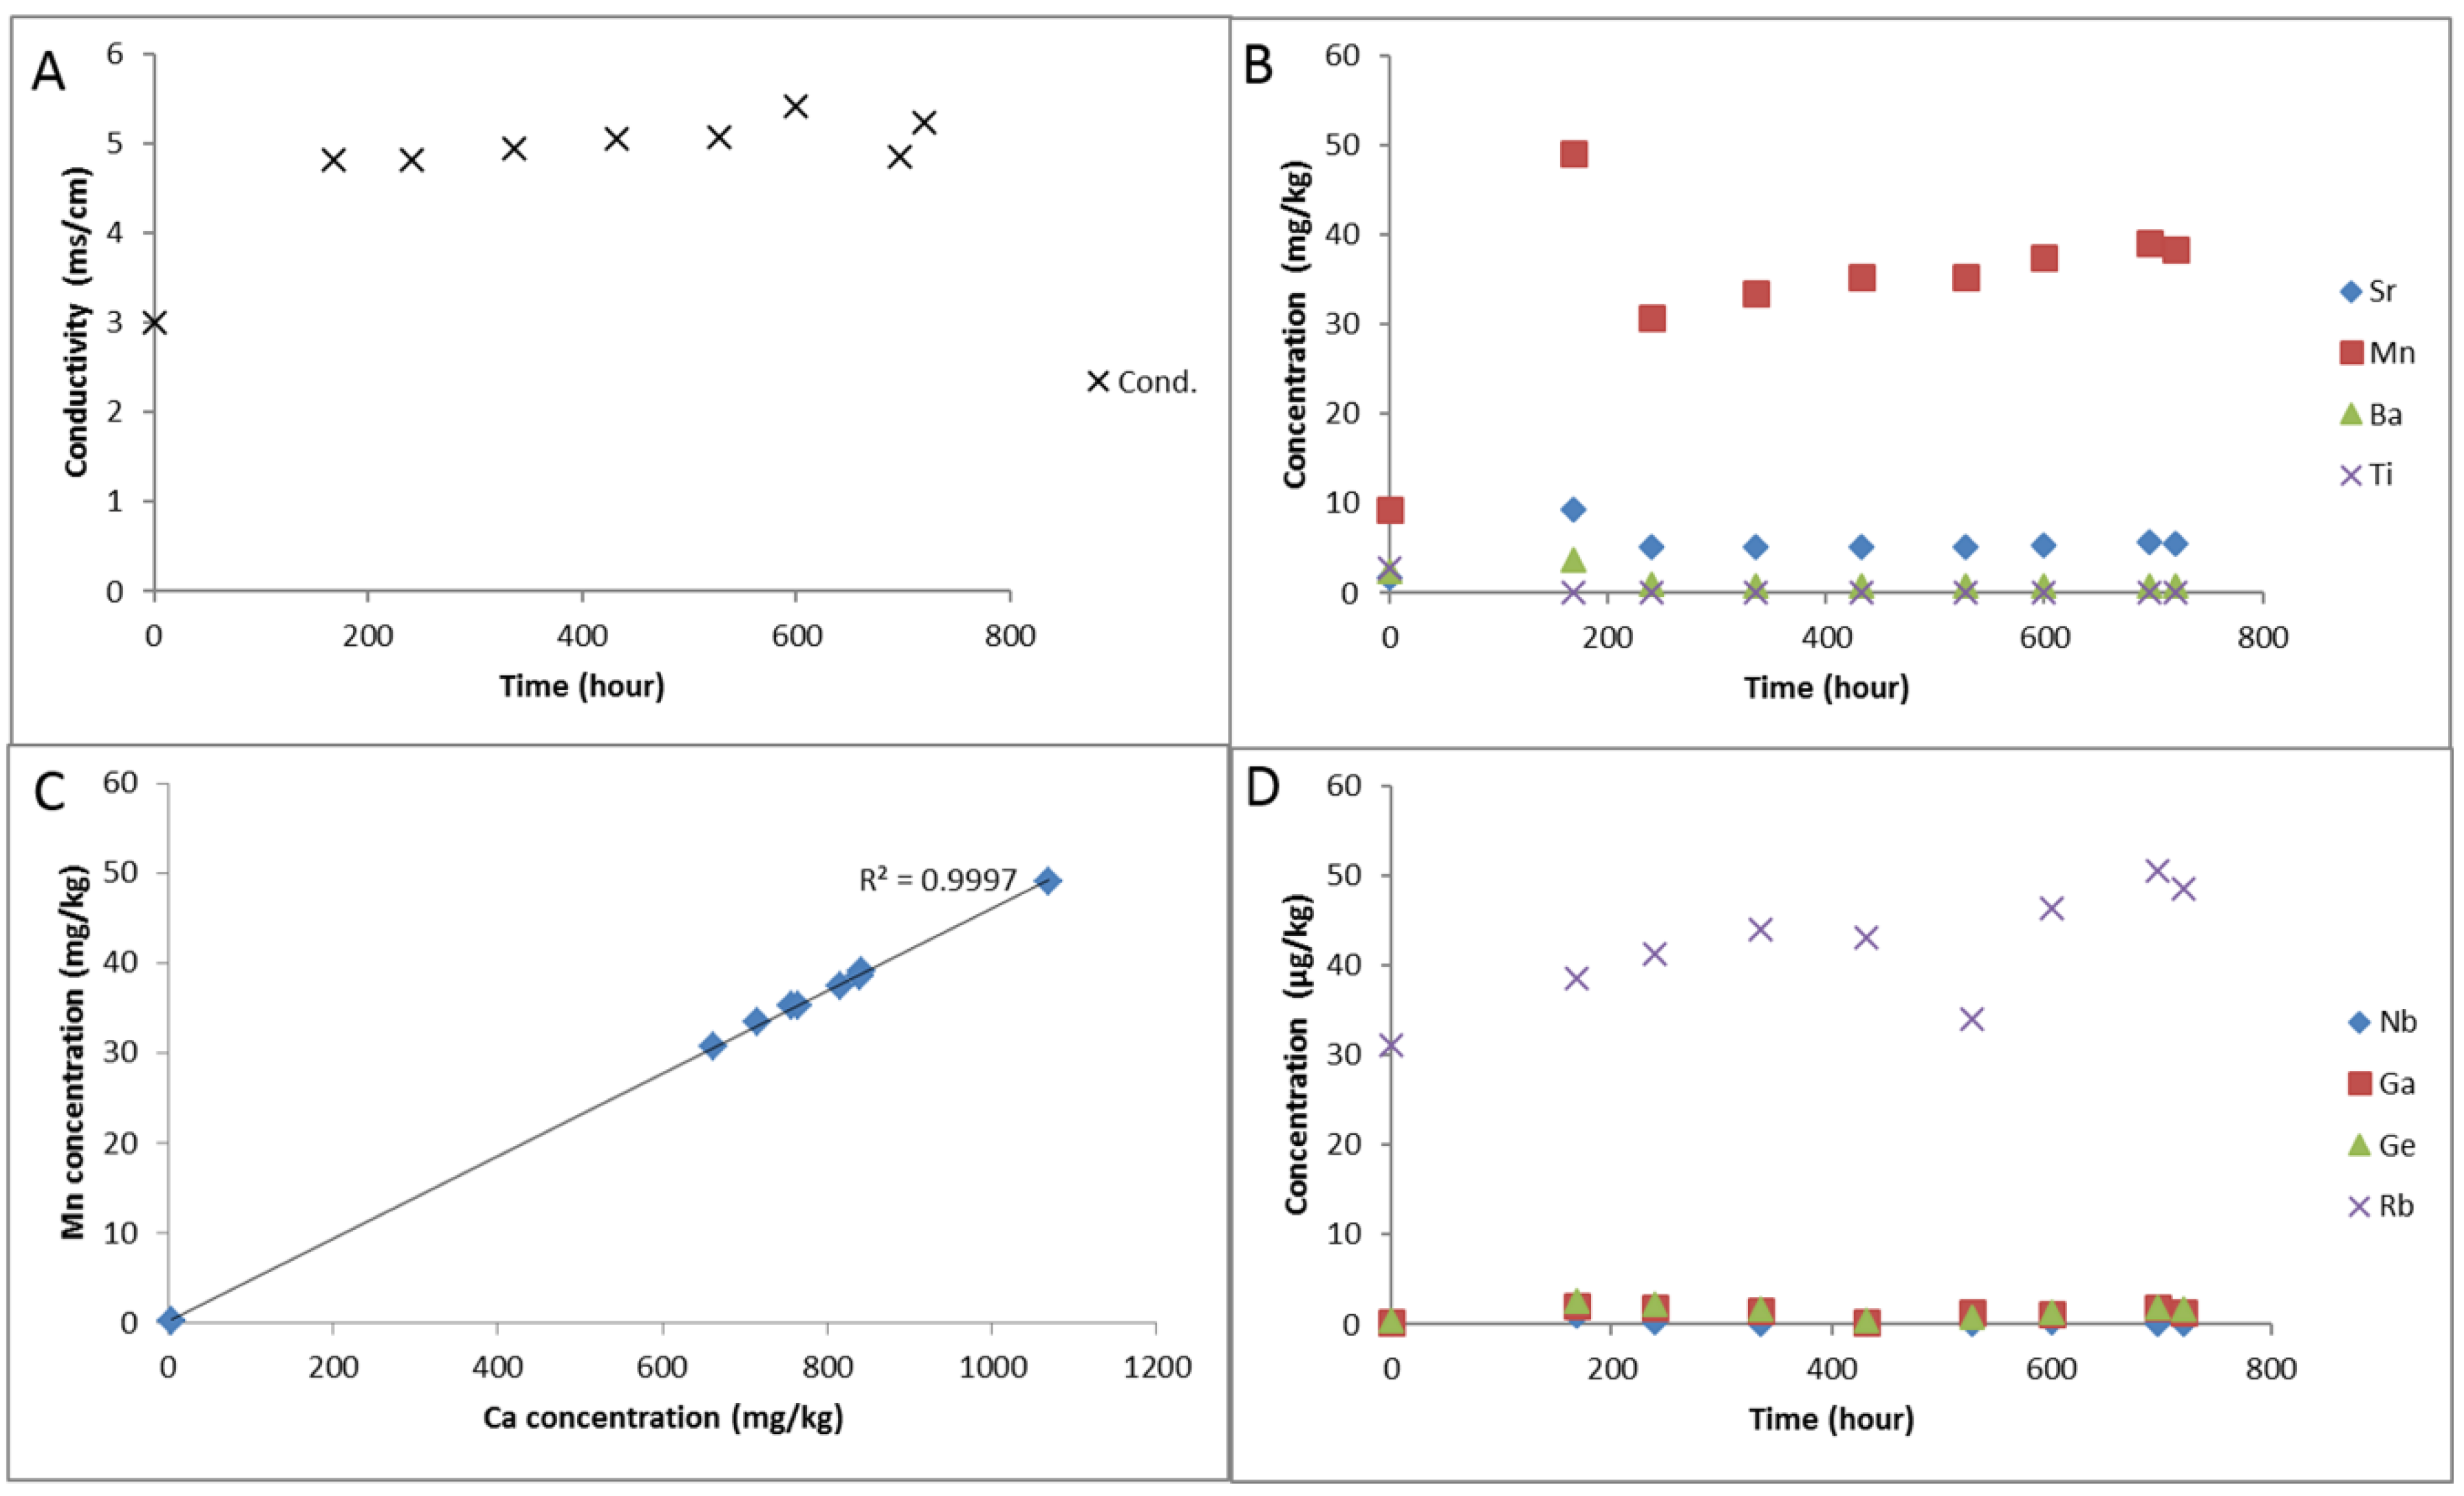
The solution alkalinity was 109.8 mg/kg as bicarbonate after the N2-water-rock soak. Ex situ measured pH initially decreased from 6.12 to 5.07 after CO2-SO2-O2 gas addition, and was subsequently buffered to 5.61 (Table 3). Solution conductivity increased after CO2-SO2-O2 gas addition along with the concentration of several dissolved elements including Al, Ba, Ca, Fe, Si, Mn, Mg, S, Sr which subsequently decreased (Table 3, Figure 6 and Figure 7). Dissolved Rb increased gradually during the reaction likely from clays (Table 4, Figure 7). Dissolved Ca and Mn were strongly correlated from the dissolution of calcite (Figure 7). Dissolved sulphate and chloride concentrations were measured at the end of the reaction to be 1206.7 and 972.0 mg/kg respectively.
3.1.2. Modelling the Experiment
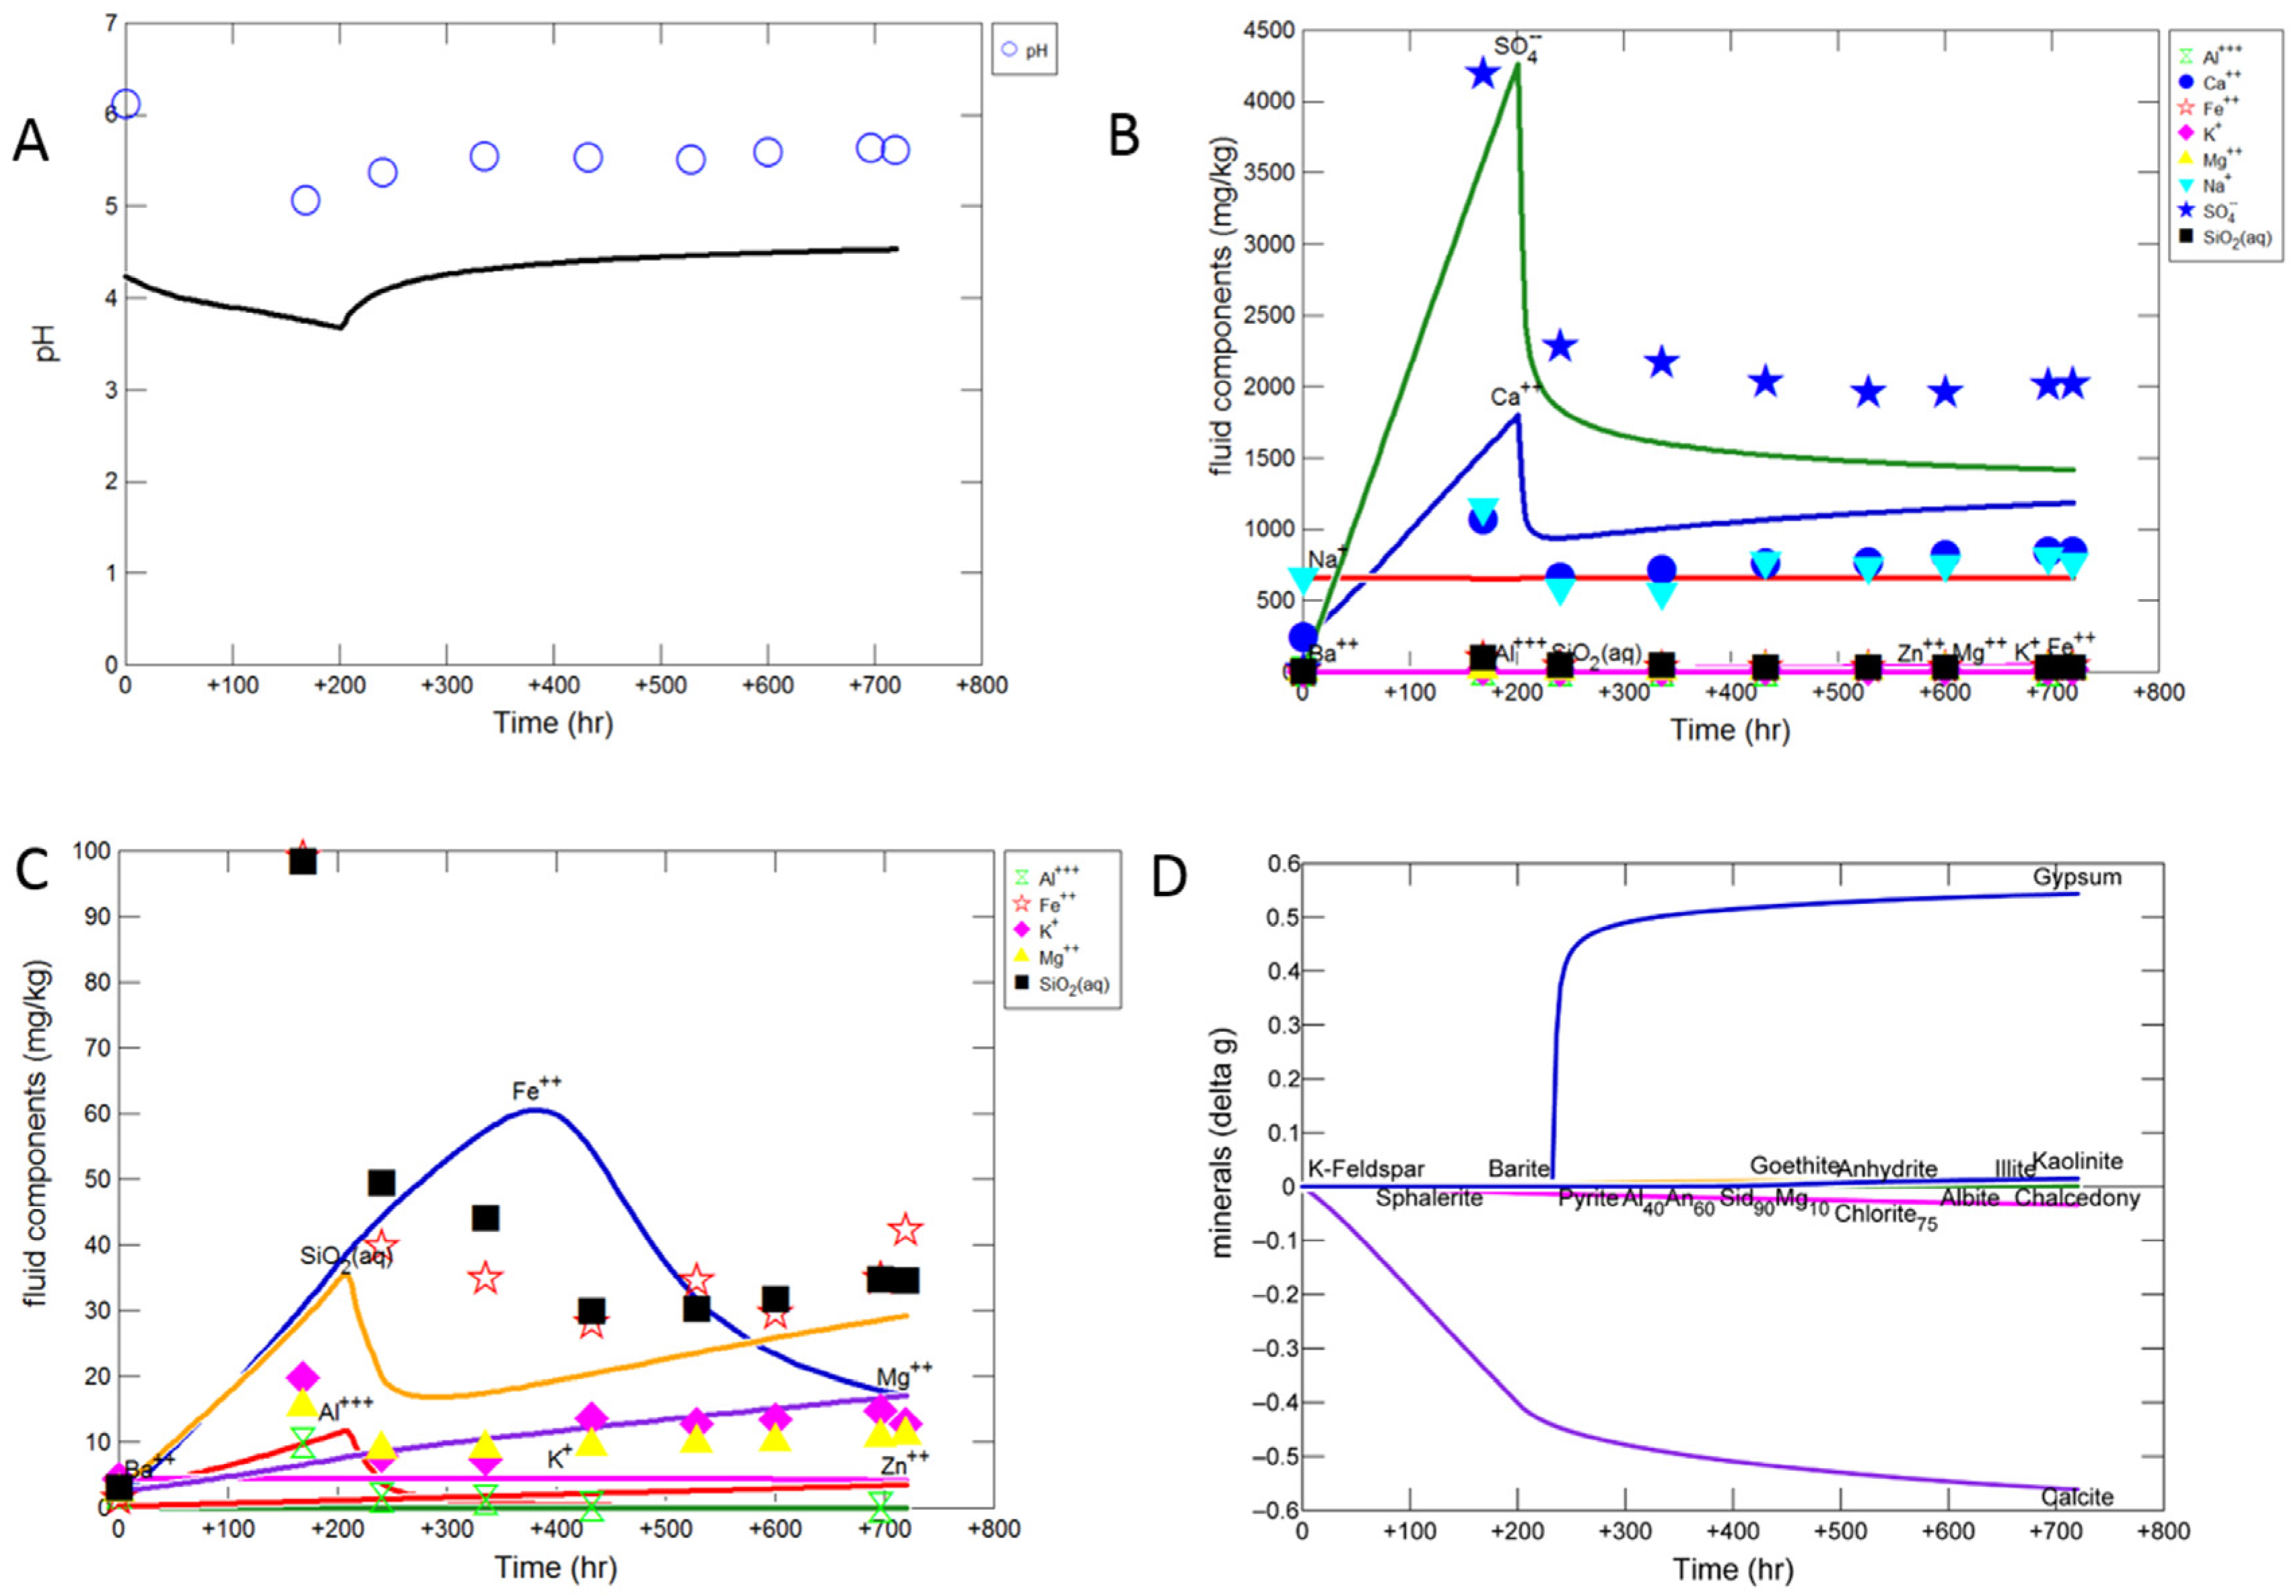
The modified mineral reactive surface areas to achieve an improved approximation to the experimental results are given in Table 2 “AsMod”. The simulated in situ pH was calculated to decrease to 3.8 and then increase to 4.5 (Figure 6A). The experimental dissolved Ca and sulphate trends were captured by calcite dissolution and gypsum precipitation (Figure 6B). The calcite reactive surface area necessitated a decrease to 1 cm2/g to approximate the experimental data, which is reasonable given the cementing nature of the calcite would have decreased its available surface area. The predicted sulphate concentration after 720 days is lower than the measured concentration assuming all measured dissolved S was present as sulphate. However it is in better agreement with the measured sulphate concentration at 720 days, this indicates that part of the measured total dissolved total S existed as a different S species, or that the model over estimates gypsum precipitation. Dissolution of a small amount of chlorite, illite, plagioclase, and pyrite/sphalerite were also needed to capture the experimental data; with precipitation of barite, kaolinite, and goethite (Supplementary Material Figure S7). The reactive surface areas of chlorite and illite were increased to 7000 cm2/g to improve Mg, Al, Fe and Si prediction overall. With dissolution of plagioclase, kaolinite, and K-feldspar additionally contributing to dissolved Si, Al and K. Dissolved concentrations of lower concentration elements such as Si and Fe were however harder to replicate, likely owing to the presence of Fe also in the calcite structure which was not in the calcite used in the model, and potentially the fast release of Fe and Si from ion exchange with clays also not included in the model. Occasional amorphous silica appeared to be present mixed with calcite and may have been another Si source in the experiment. The Si and Al trends were replicated by predicted precipitation of kaolinite (Figure 6C,D). Precipitation of kaolinite appeared to be initially overestimated, with predicted concentrations of Si and Al lower than the experimental data (Supplementary Material Figure S7). The kaolinite script file was subsequently modified to change the pre-exponential crystal nucleation factor (Г) from 2E10 to 2E11 to improve the prediction (Supplementary Material Table S1). Fe-oxide coatings were observed in the experiment, and the decreasing experimental dissolved Fe trend was closest replicated with the precipitation of goethite. Again goethite precipitation appeared to be initially overestimated with a much lower predicted Fe concentration than observed experimentally. The goethite reactive surface area was decreased to 0.0001 cm2/g and in the script file Г modified to from 1E10 to 9E10 to improve the predicted trend (Supplementary Material Table S1). Hematite was also saturated in the model; however allowing its precipitation resulted in a very low predicted Fe concentration (Supplementary Material Figure S7). Generally the precipitation of amorphous or oxyhydroxide Fe minerals would be expected on the short timescale of the experiment, with hematite precipitation over longer timescales, therefore goethite was used for the experiment simulation [45]. Additionally, a smectite (Na-nontronite) was saturated in the model and smectite precipitation observed in the experiment. Allowing its precipitation resulted in a very low predicted Si concentration (Supplementary Material Figure S8). This indicates that a small amount of smectite may have also precipitated in the experiment.
Overall the net predicted change in mineral volume was a slight net increase of 1.2% of the initial total volume, indicating potentially a slight decrease in porosity.
3.2. Geochemical Modelling of Cap-Rock
3.2.1. Calcite Cemented Cap-Rock
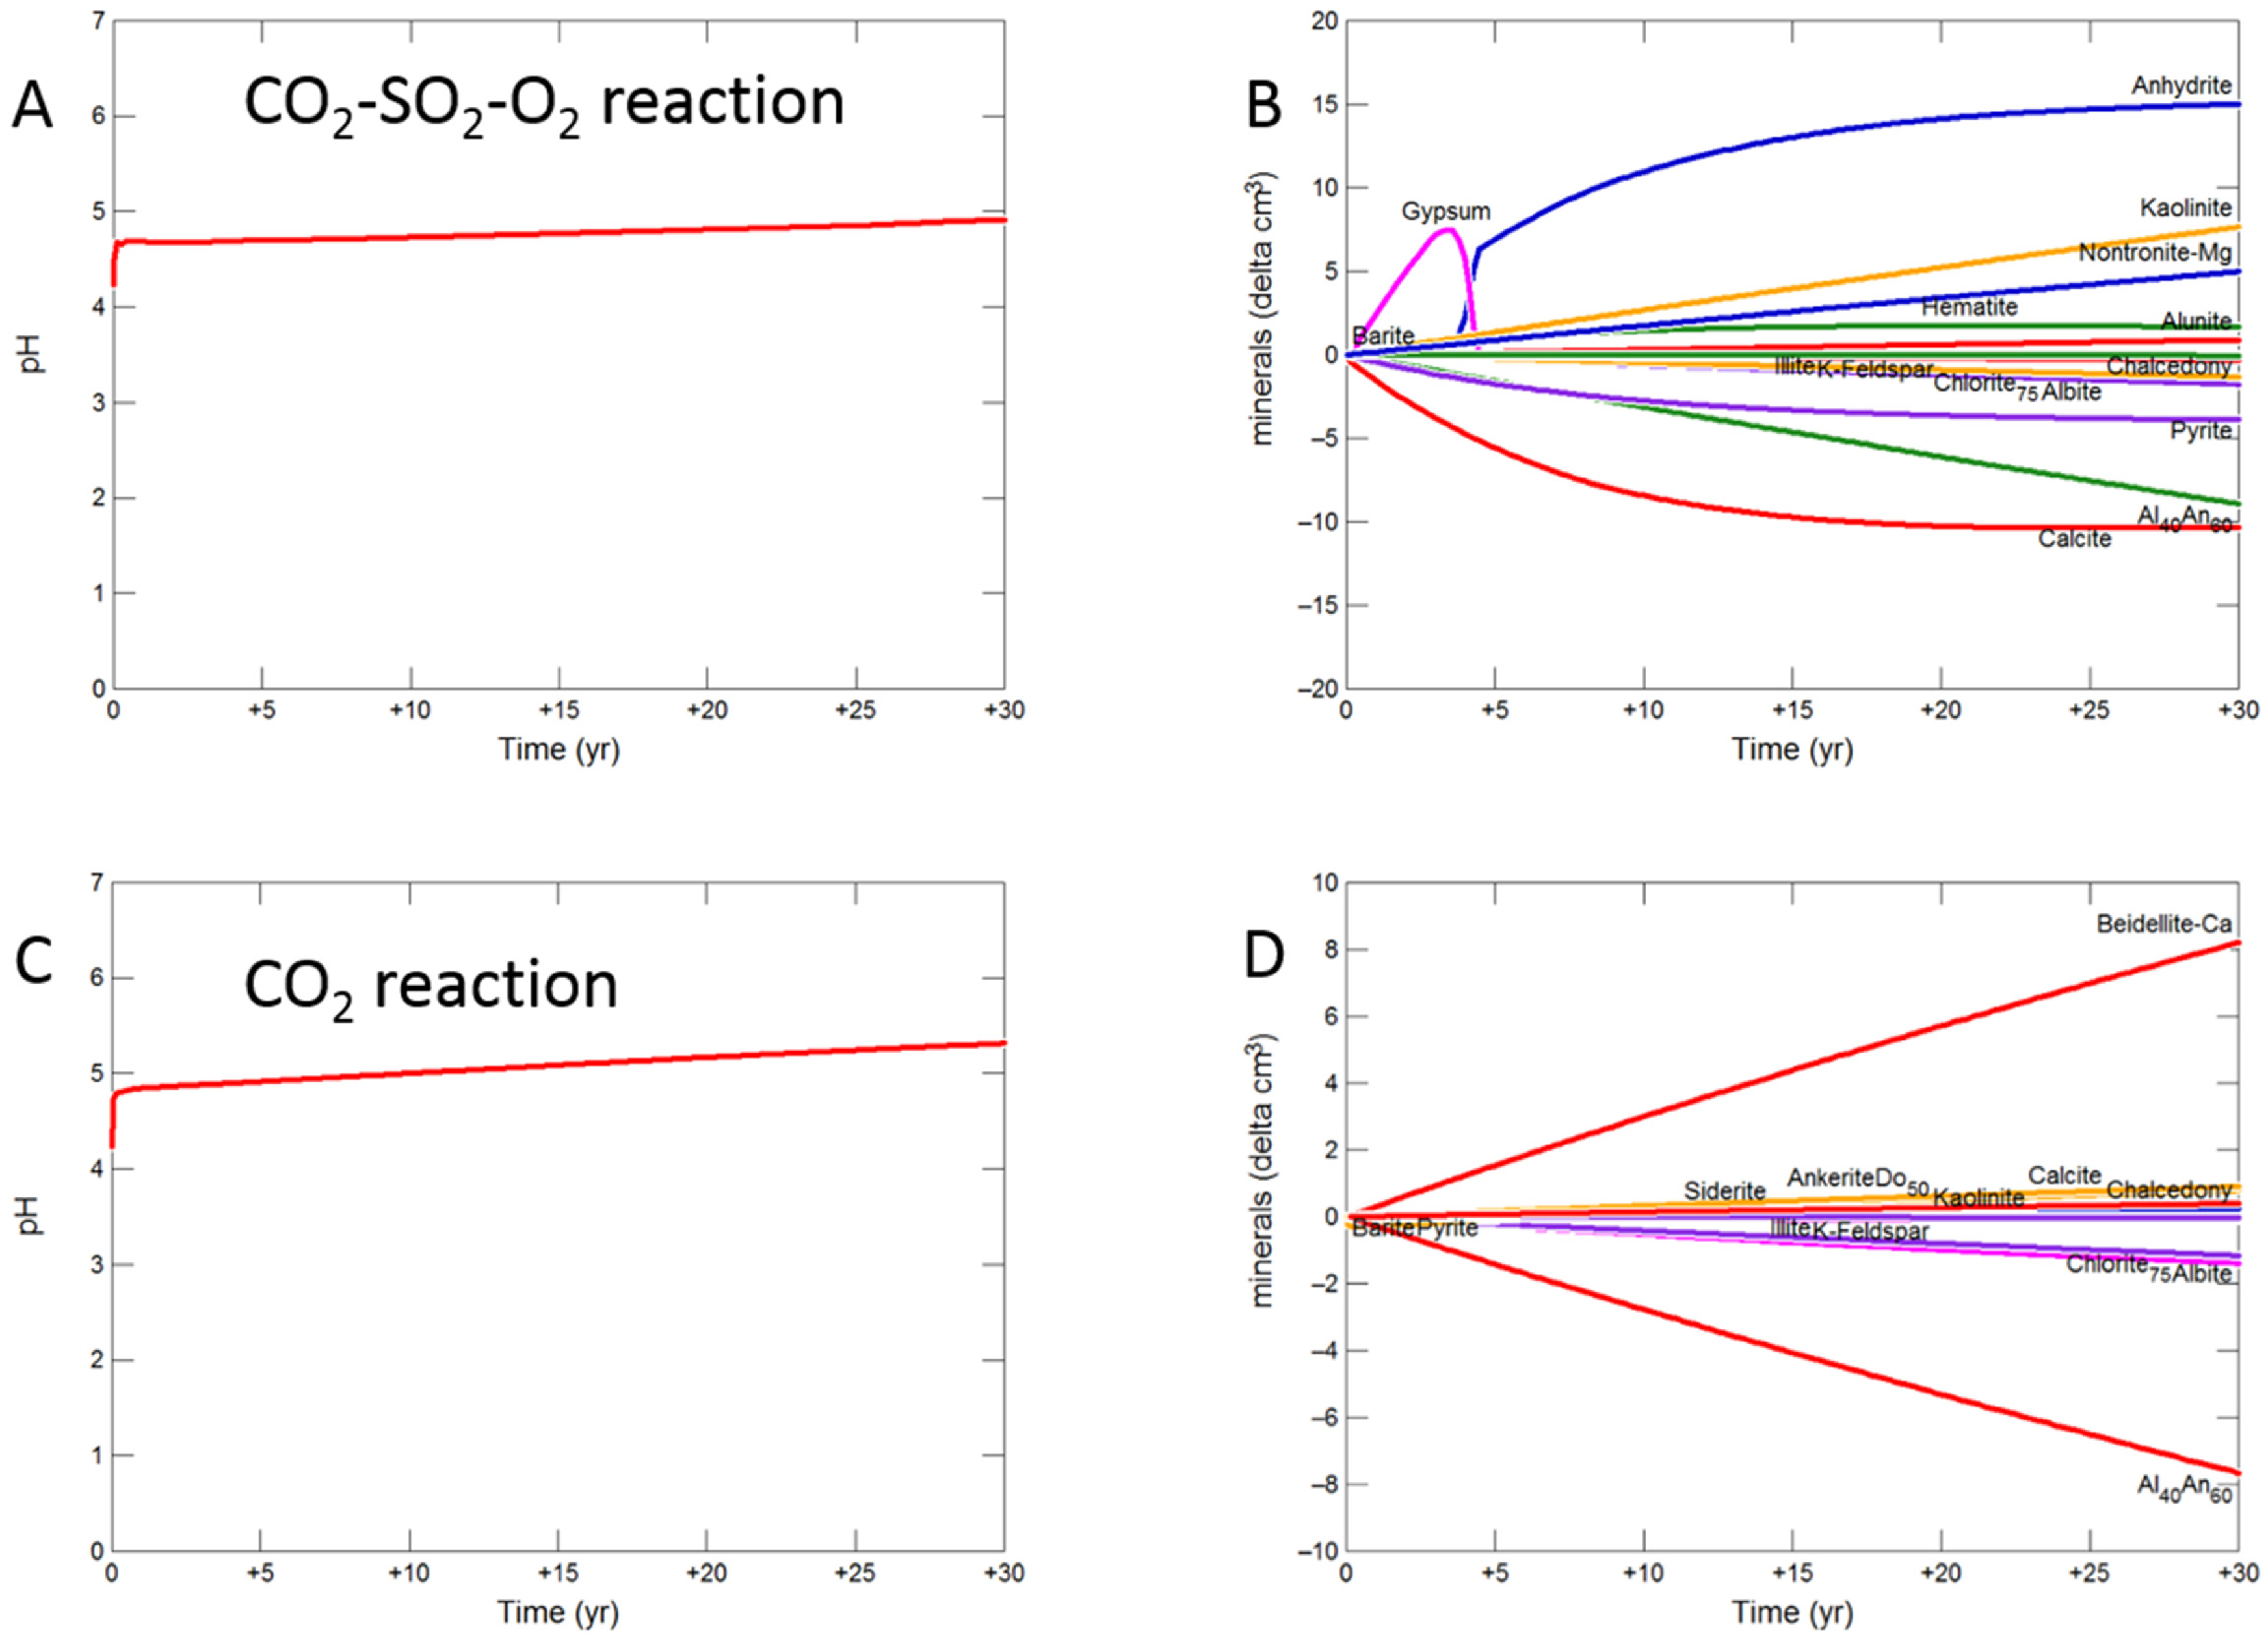
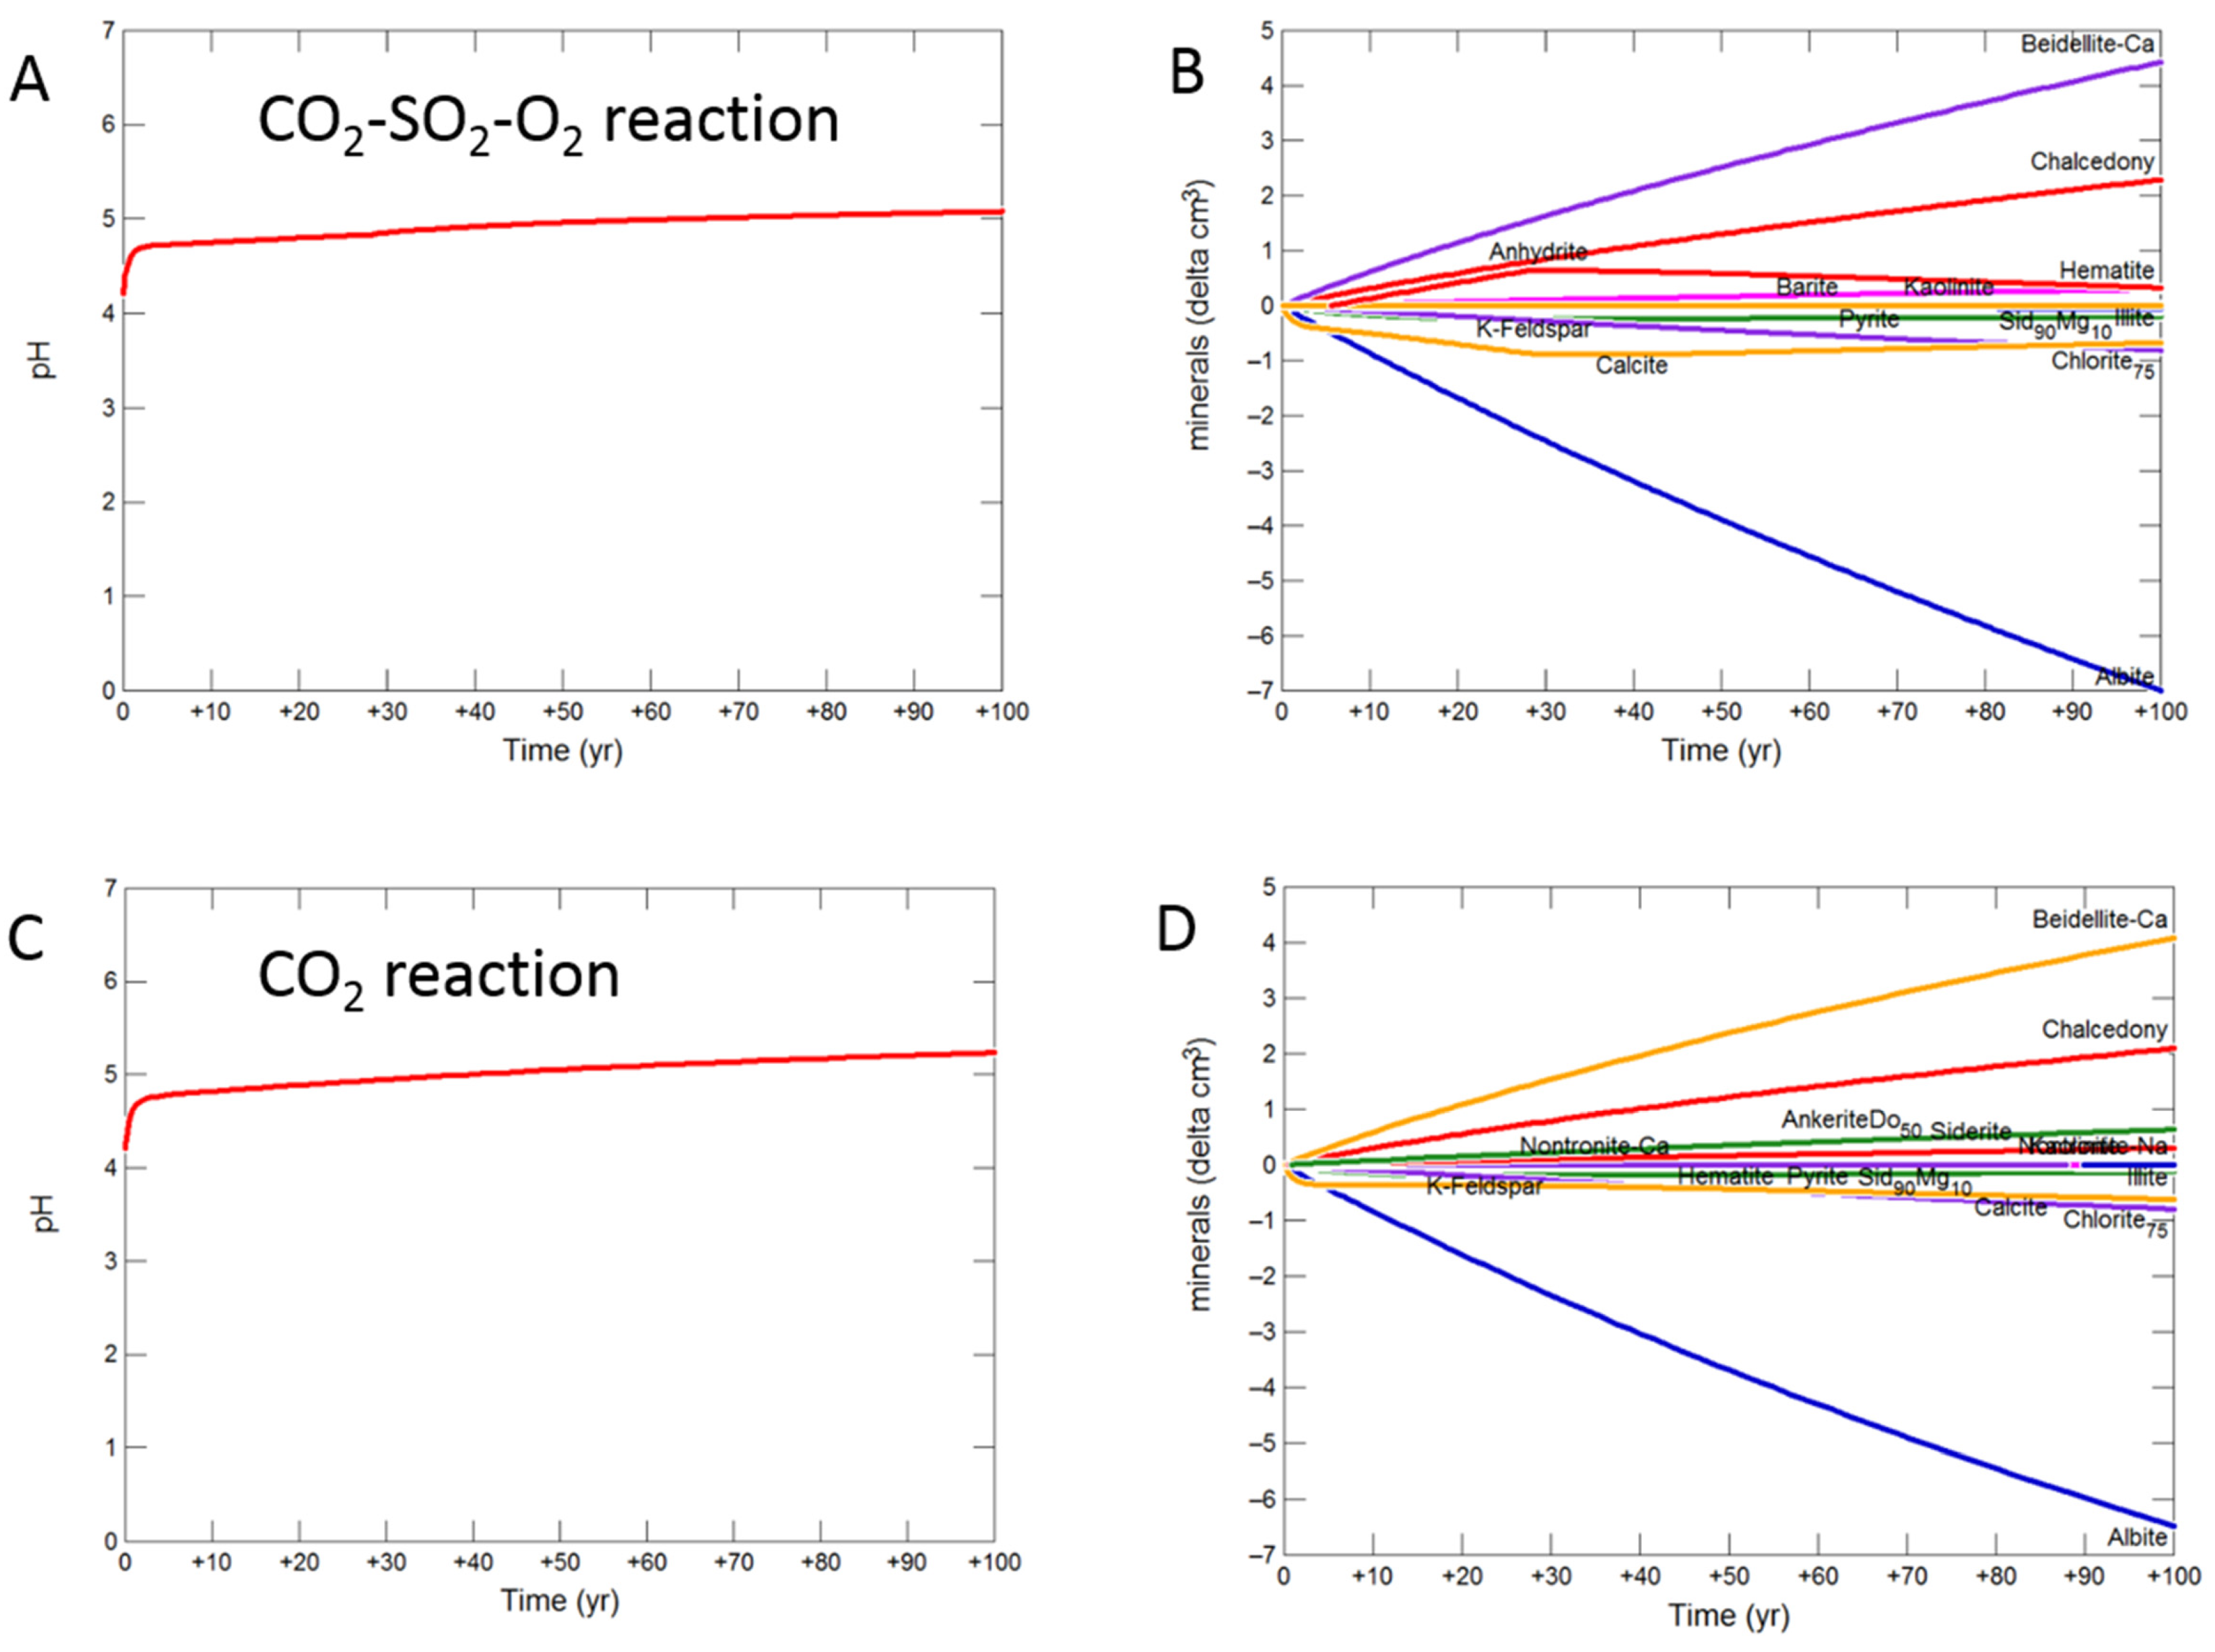
During the upscaled calcite cemented cap-rock reaction with CO2-SO2-O2, pH was buffered to 4.93 after 30 years (Figure 8A). Calcite, andesine, pyrite, chlorite and albite were the main minerals dissolving (Figure 8B); with initially gypsum and subsequently anhydrite precipitating along with kaolinite, smectite, hematite, alunite and barite. The amounts of mineral change (<20 cm3) were however small compared to the total rock volume (3735 cm3). Overall there was a slight net increase in mineral volume, owing to the higher molar volume of anhydrite, with only 0.1% change, indicating a slight loss of porosity.
On reaction with pure CO2, pH was buffered to 5.32 (Figure 8C). Calcite initially dissolved and subsequently re-precipitated as the pH was buffered. Andesine, chlorite, and albite also dissolved; smectite, ankerite, siderite and kaolinite precipitated (Figure 8D). Again there was a very slight increase in mineral volume with a 0.01% change, indicating overall a negligible loss of porosity.
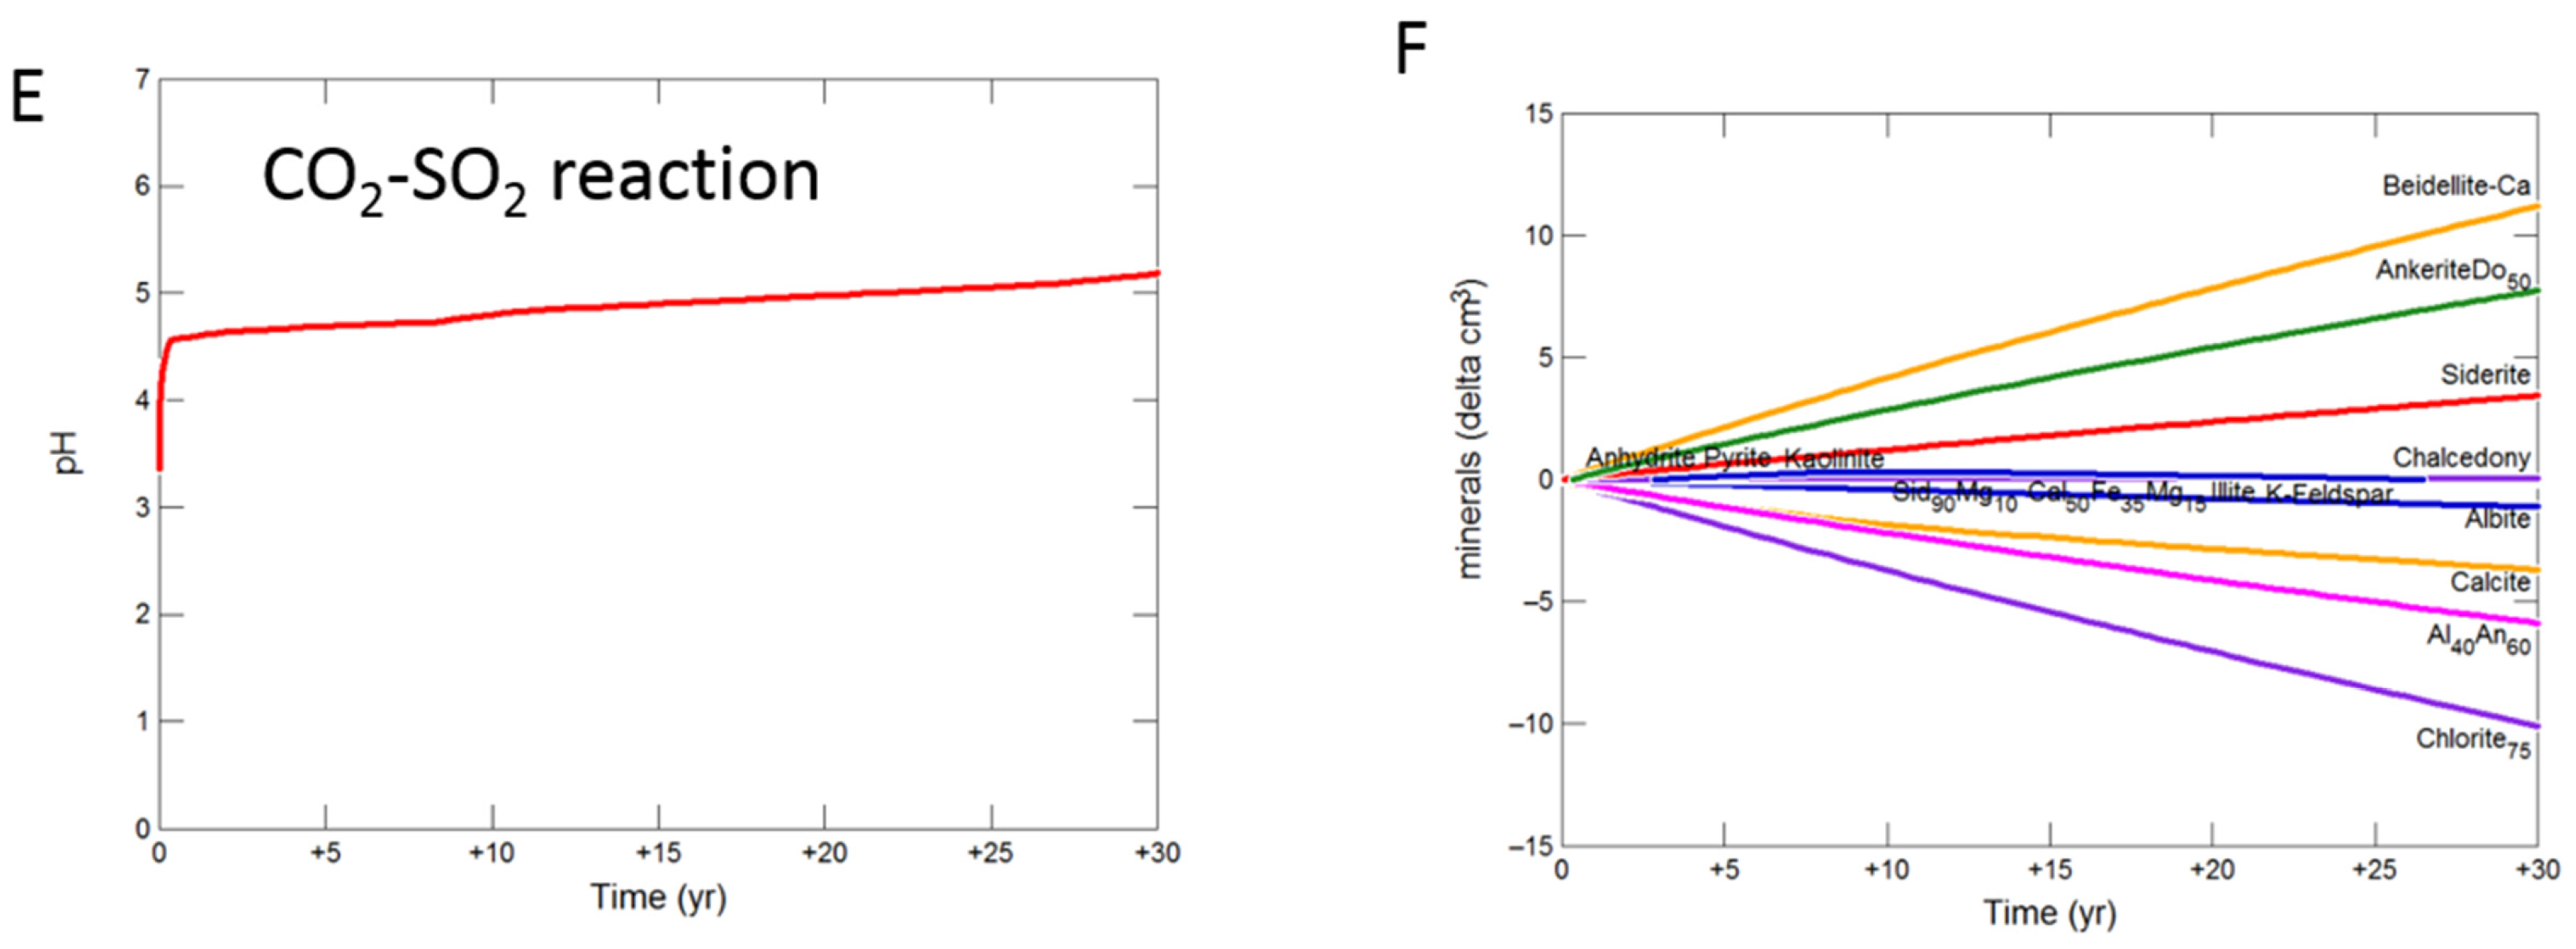
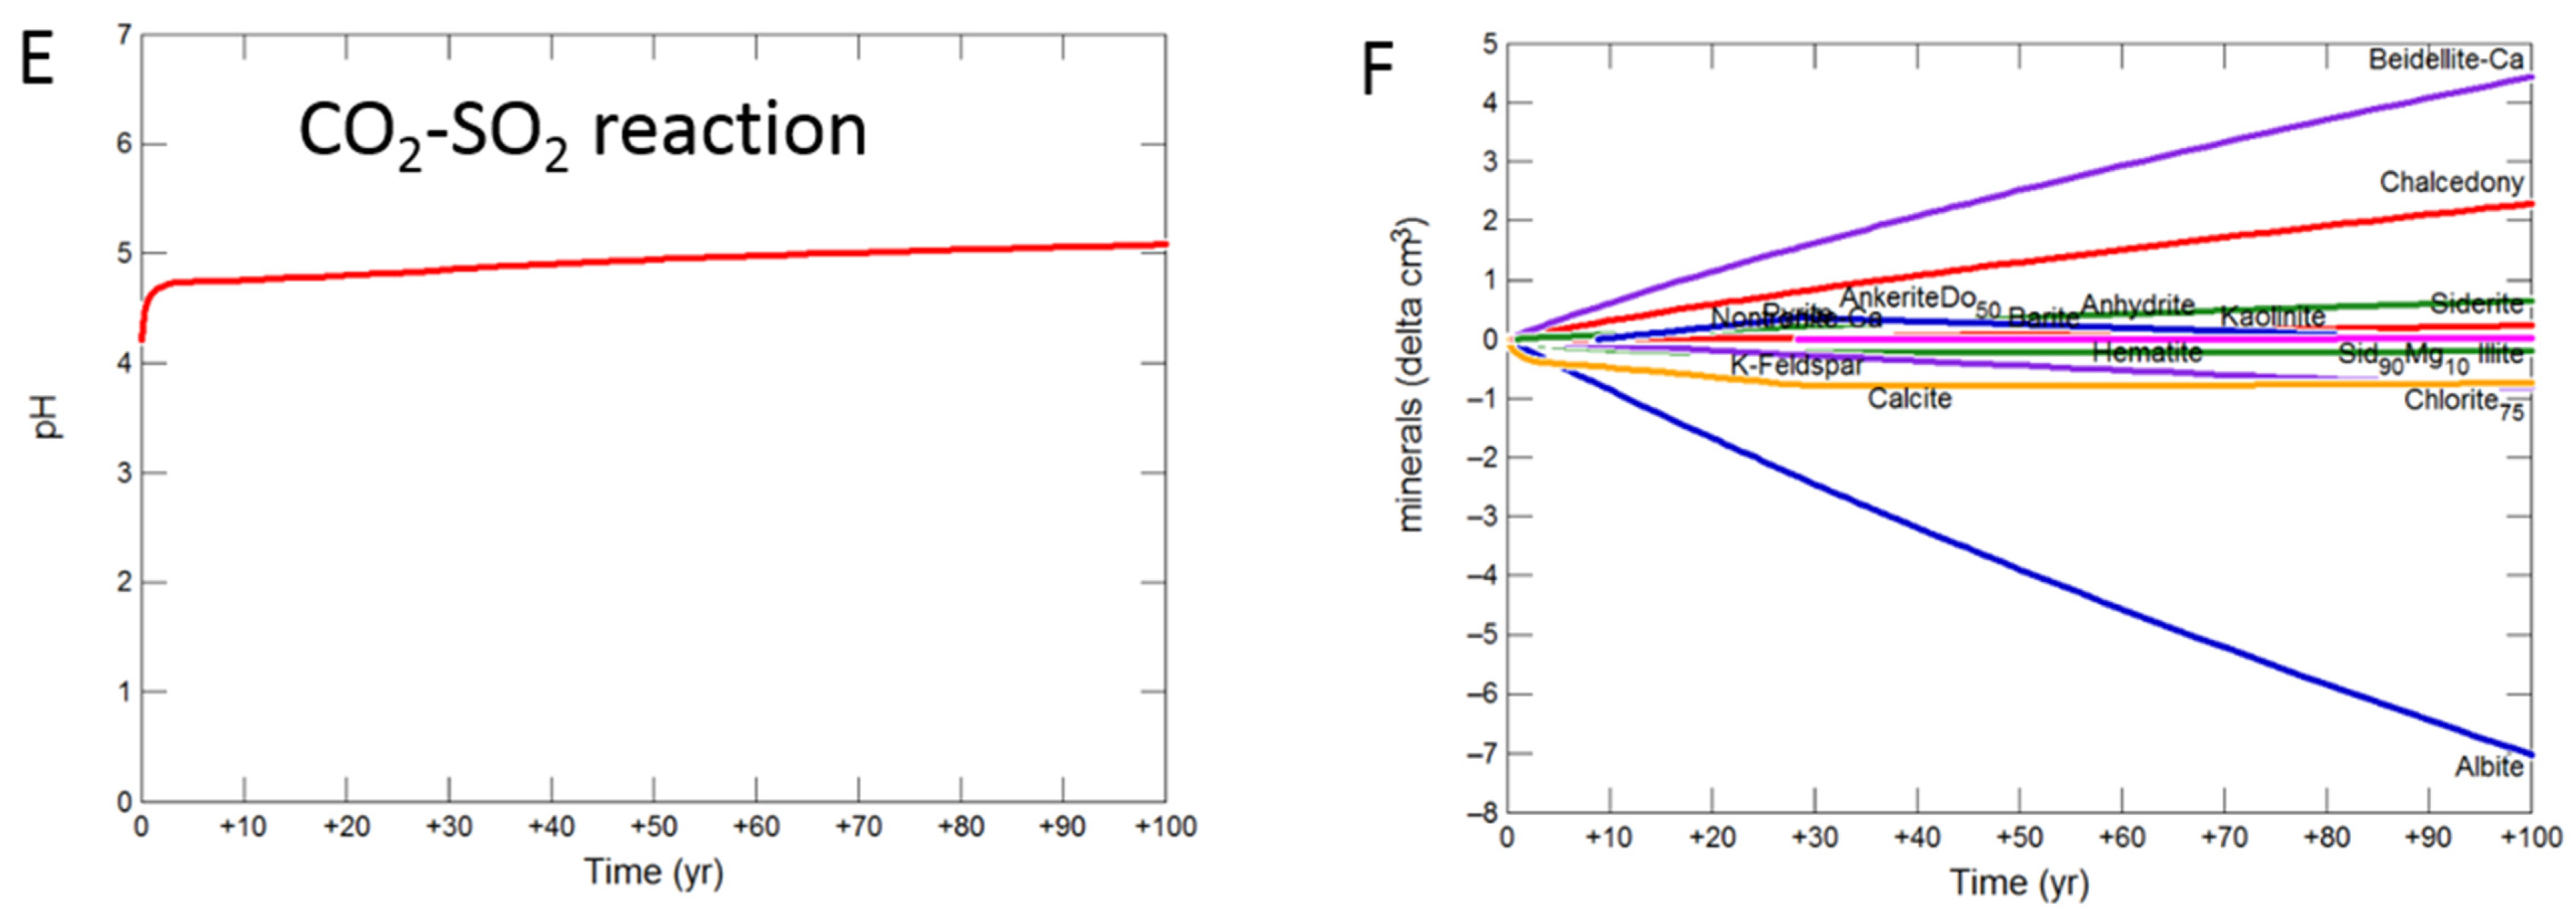
Reaction with CO2-SO2 resulted in an intermediate pH buffered to 5.12. Again calcite, andesine, chlorite and albite dissolved (Figure 8E,F). Calcite was later re-precipitated, along with formation of smectite, ankerite, pyrite, kaolinite, gypsum and subsequently anhydrite and barite.
3.2.2. Mudstone Cap-Rock
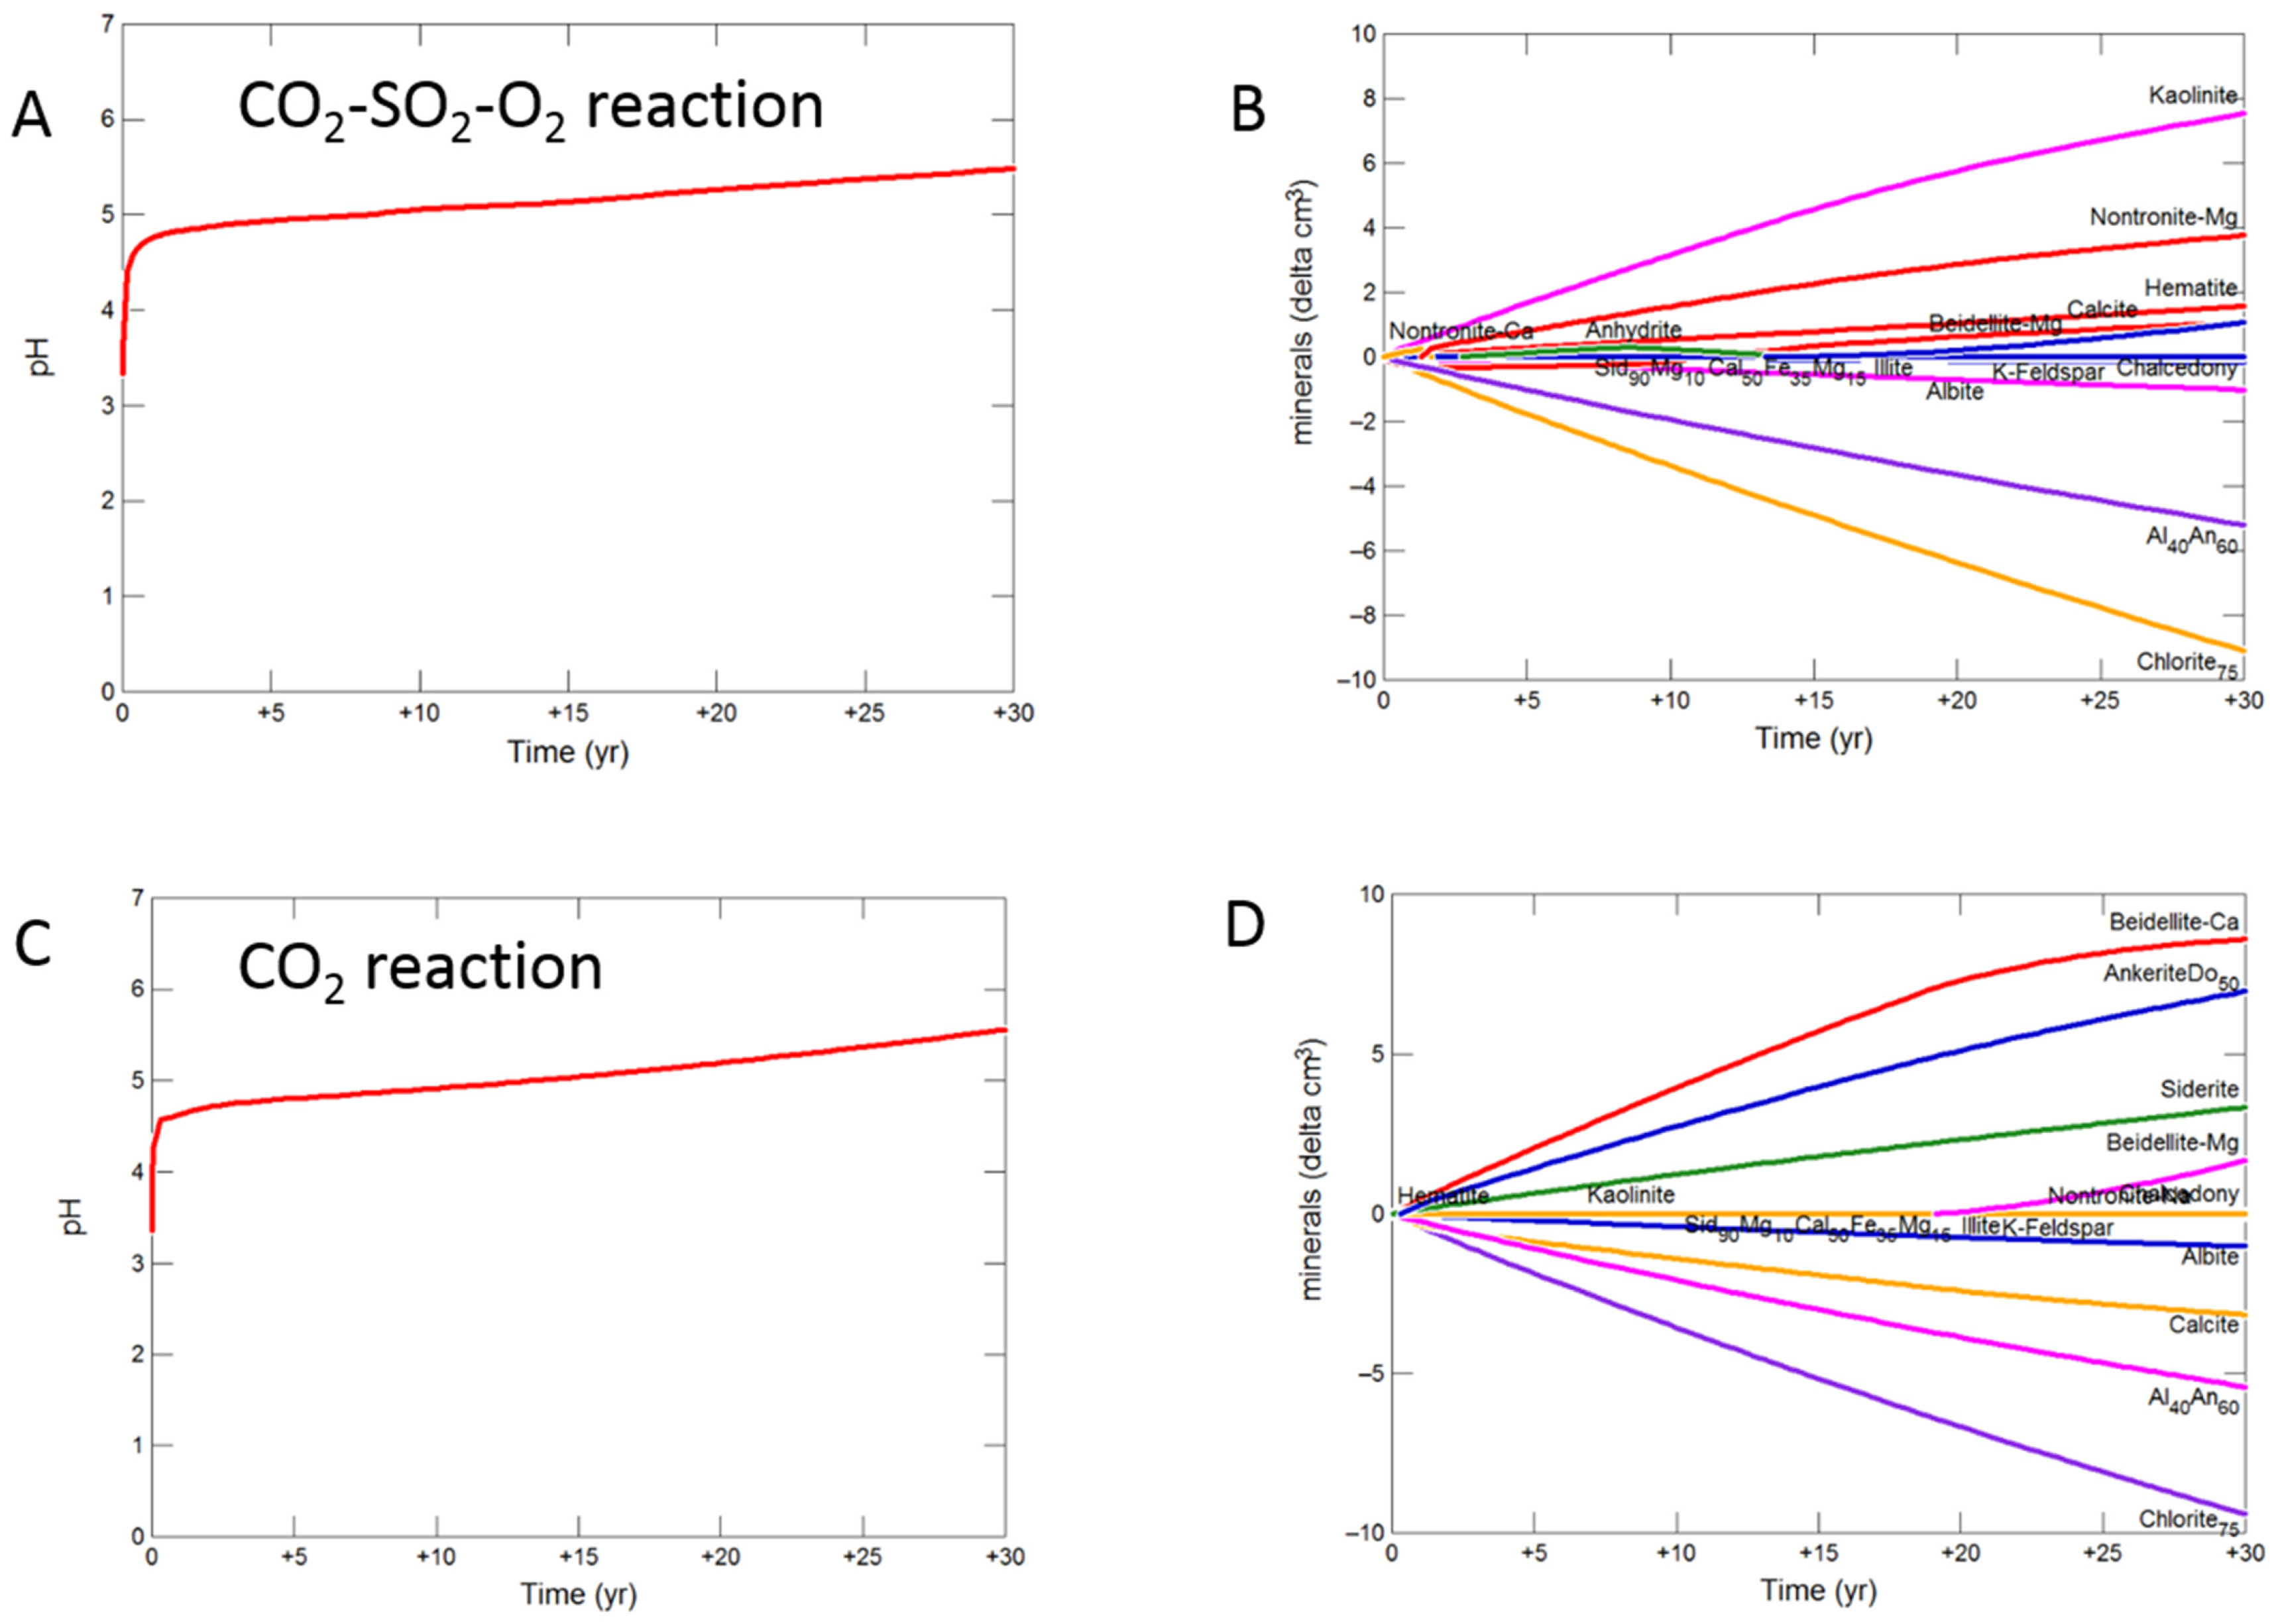
On reaction of the mudstone cap-rock with CO2-SO2-O2 the pH increased more gradually to 5.48. Calcite, chlorite, andesine, albite, siderite and ankerite were the main minerals dissolving, with calcite later re-precipitating (Figure 9A,B). Kaolinite, smectite, anhydrite and hematite precipitated.
With pure CO2 pH was buffered to 5.56 after 30 years, with calcite, chlorite, andesine, albite, siderite and ankerite dissolution (Figure 9C,D). Chlorite and andesine were altered to ankerite and siderite, smectite, and kaolinite.
The pH was buffered to 5.19 on reaction with CO2-SO2, with again chlorite, calcite, andesine and albite mainly dissolving along with siderite and ankerite. Smectite, ankerite, siderite and kaolinite were again formed along with anhydrite and pyrite (Figure 9E,F).
3.2.3. Siderite Cemented Cap-Rock
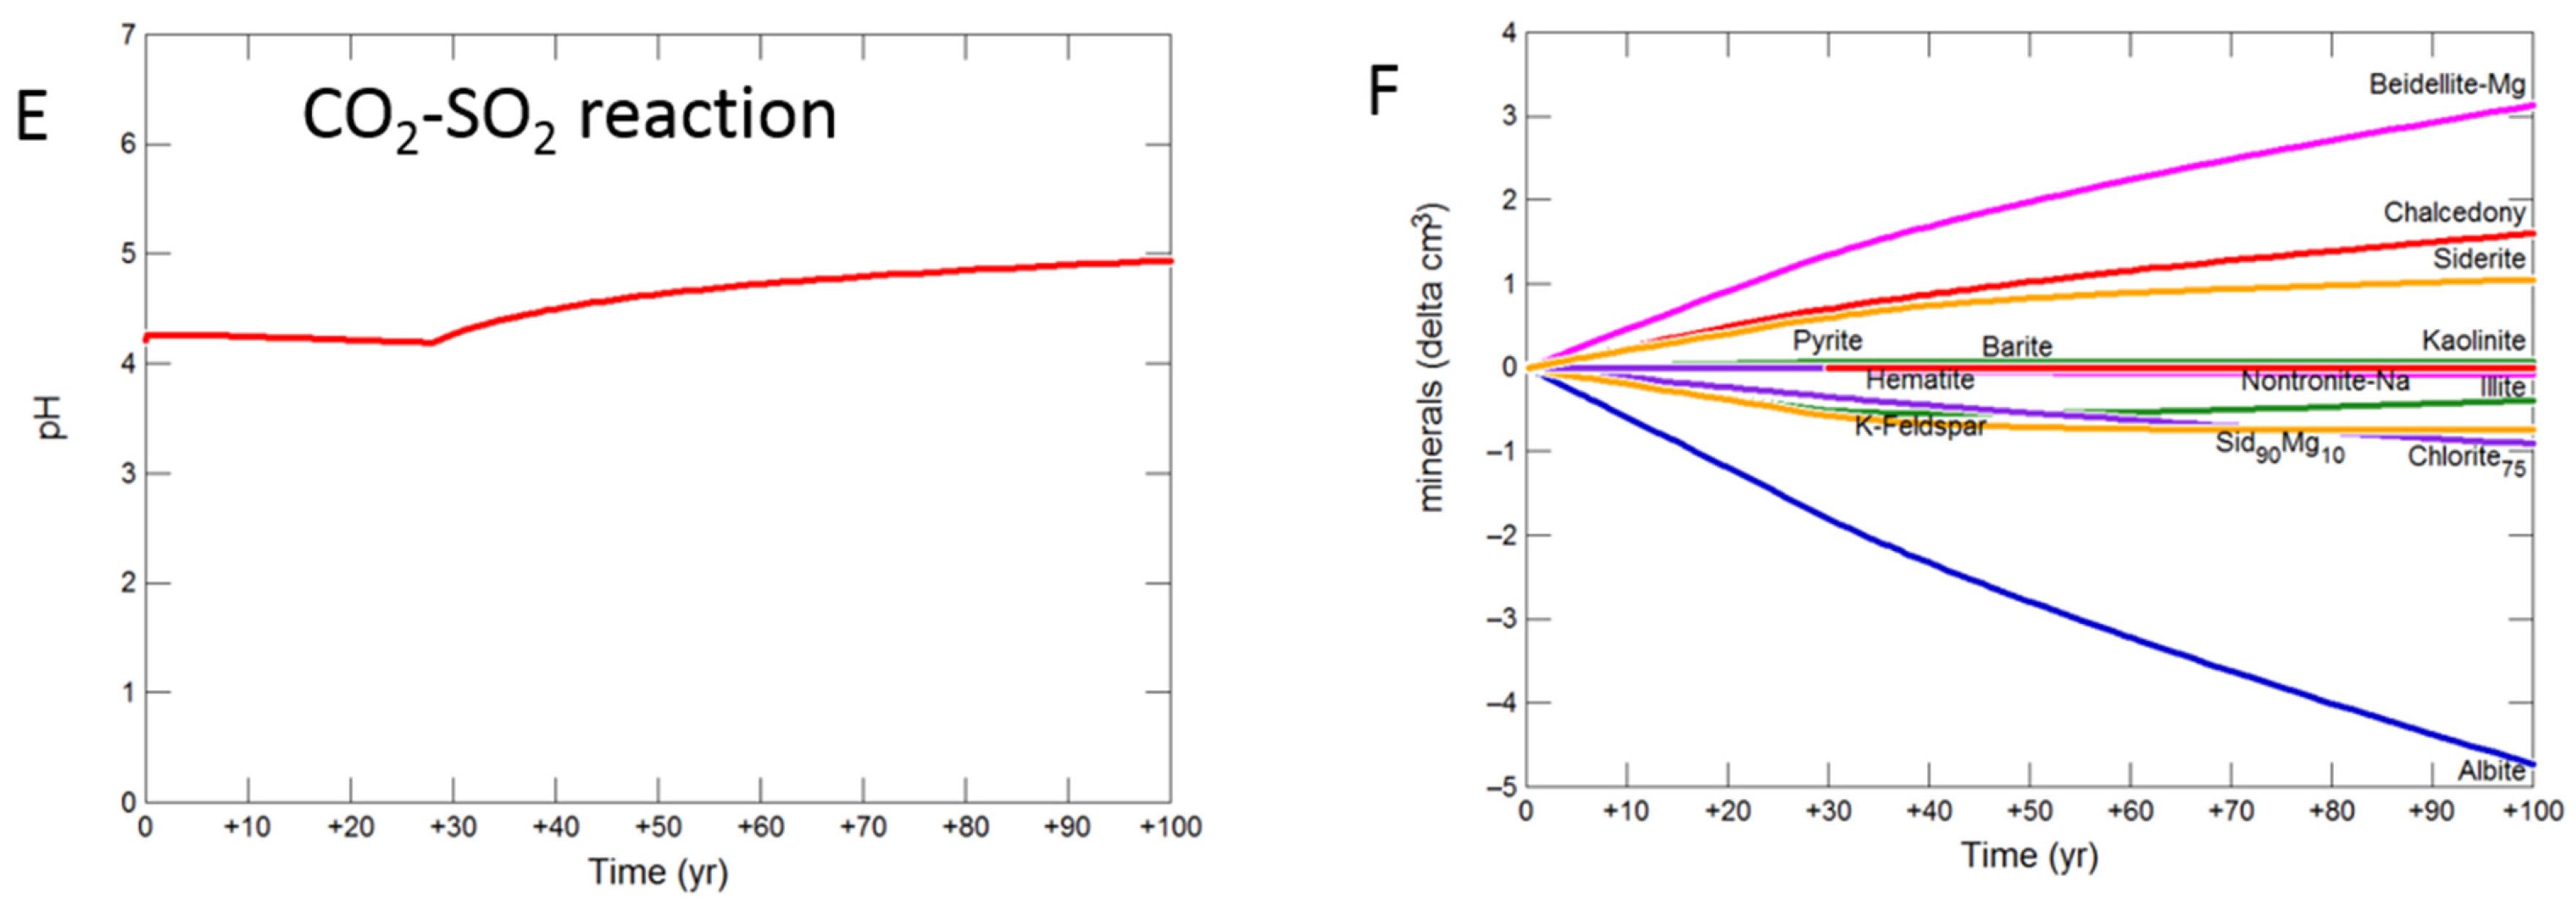
The siderite-cemented cap-rock was based on core from the deeper Cabawin 1 well. Geochemical models for this well were run out to 100 years since deeper sections of the Precipice Sandstone are a more likely target for longer term CO2 storage. The predicted pH was buffered to 5.08 with CO2-SO2-O2 by dissolution of albite, siderite, K-feldspar and chlorite after 100 years (Figure 10A,B). Smectite, kaolinite, alunite, and hematite were predicted to be precipitated. With pure CO2, albite, chlorite, K-feldspar and siderite were altered to smectite, siderite and chalcedony/amorphous silica with pH increasing to 5.10. For the reaction with SO2, the pH increase from 30 to 100 years to 4.94 (Figure 10E). Albite, siderite, K-feldspar, chlorite and illite dissolved with siderite and illite later re-precipitating (Figure 10F). Smectite, chalcedony, Fe-siderite, kaolinite, pyrite and barite were also predicted to precipitate.
3.2.4. Shale Cap-Rock
The shale cap-rock contained traces of calcite which quickly buffered the pH, increasing to 5.08 with CO2-SO2-O2 after 100 years (Figure 11A). Albite, chlorite, calcite, siderite and K-feldspar were altered to smectite, chalcedony, anhydrite, barite, kaolinite and hematite (Figure 11B). With pure CO2, pH was buffered to 5.24, with albite, chlorite, calcite, siderite and K-feldspar altered to smectite, chalcedony, ankerite, siderite and kaolinite (Figure 11C,D). The pH again increased to 5.08 with SO2 present, with albite, calcite, chlorite, siderite and K-feldspar altered to smectite, chalcedony, anhydrite, pyrite, ankerite, siderite, kaolinite and barite (Figure 11E,F).
4. Discussion
4.1. Experimental Results and Relevant Comparison Studies
In the experimental reaction of the calcite cemented cap-rock, CO2 dissolved to form carbonic acid, and the co-injected SO2 and O2 dissolved to form a stronger sulphuric acid (Equation (1)).
SO2 (g) + H2O + ½O2 (g) ↔ H2SO4 ↔ SO42− + 2H+
Calcite dissolution buffering acidity (Equation (2)), and subsequent gypsum precipitation (Equation (3)) were the main reactions occurring.
CaCO3 + H+ → Ca2+ + HCO3−
Ca2+ + SO42− + 2H2O → CaSO4:2H2O
The acid activated corrosion of Fe-rich chlorite (Equation (4)) (and andesine), and formation of kaolinite (Equation (4)) was also occurring.
Fe4MgAl2Si3O10(OH)8 (Fe−rich chlorite) + 10H+ → 4Fe2+ + Mg2+ + Al2Si2O5(OH)4 (kaolinite) + SiO2 + 7H2O
Oxidised Fe from chlorite dissolution in the presence of co-injected O2 precipitated as goethite (Equation (5)).
Fe3+ + 2H2O → FeO(OH) (goethite) +3H+
Barite precipitation was observed, with the source of the Ba likely from the calcite or clay structure, and sulphate from the co-injected SO2 (Equation (6)).
Ba2+ + SO42− → BaSO4 (barite)
There are relatively few published experimental studies reacting rock core with impure CO2 containing SO2 or O2, compared to pure CO2 studies. Renard and co-workers reacted a dolostone with saline brine and a gas mixture of CO2 with small amounts of SO2 O2, N2, and Ar at 150 °C and 150 bar [46]. They observed complete dissolution of calcite (in agreement with our work), with partial dissolution of dolomite and clays, and pyrite oxidation to hematite. Vermiculite clay and barite were precipitated, along with a Ca-sulphate phase, anhydrite, which is more stable than gypsum at the higher temperature employed. With pure CO2 reaction they instead observed formation of the smectite beidellite (from illite alteration), in agreement with the pure CO2 cap-rock models performed here where beidellites were predicted to be formed. Clay and feldspar rich cap-rocks have also been reacted with CO2 containing SO2 and O2 and a low salinity brine at 60 °C and 120 bar [47]. In that case the pH initially decreased to ~2 as only small amounts of carbonate minerals were present to dissolve and buffer pH, chlorite and other silicates also were observed to dissolve. Precipitation of clays and Fe-oxide minerals contributed to a decrease in the meso-porosity of the cap-rocks after reaction. A calcite rich mineral assemblage was reacted at 110 °C with CO2 and SO2 by Chopping and Katsuba [48]. They also noted a strong pH buffering from the dissolution of calcite either with or without the co-injection of SO2, in agreement with the geochemical modelling in this study. The precipitation of the Ca-sulphate anhydrite trapped dissolved S species at the higher employed temperature in their experiments. The precipitation of gypsum or anhydrite observed in studies co-injecting SO2 may be significant as these minerals have high molar volumes and can reduce porosity potentially sealing cap-rock, additionally they provide a sink for mineral trapping of SO2.
4.2. Comparison of Modelling Outputs to Natural Analogue or Field Trial Observations
Modifying and validating geochemical models with experimental or field data by the alteration of parameters such as mineral reactive surface areas have been performed by several authors, while other researchers have employed adjustments to other model parameters e.g., using an adjustable incongruent factor especially where the exact dissolving mineral composition is not known or not available for input [4,27,31,49]. Since model outputs are subject to the amount of available input data and user selection, comparing model outputs to natural analogues of CO2 storage is useful to determine if the outputs are reasonable.
In the longer term cap-rock reaction models performed here with pure CO2 or SO2-CO2 calcite was dissolved, with gypsum or anhydrite formed when SO2 was co-injected. K-feldspar and plagioclase was converted to kaolinite and chalcedony (Equations (7) and (8)), or smectite formed from e.g., plagioclase (Equation (9)).
KAlSi3O8 (K-feldspar) + H+ + 0:5H2O → 0:5Al2Si2O5(OH)4 (kaolinite) + 2SiO2 + K+
NaAlSi3O8 (albite) + H+ + 0:5H2O → 0:5Al2Si2O5(OH)4 (kaolinite)+ 2SiO2 + Na+
7NaAlSi3O8 (albite) + 6CO2(aq) + 6H2O ↔ 6HCO3− + Na+ + Na-smectite + 10SiO2
Chlorite was converted to siderite or ankerite (with Ca from calcite or andesine dissolution) mineral trapping CO2 (Equation (10)). These minerals contain Fe2+ formed in reducing conditions.
Fe4Mg1Al2Si3O10(OH)8 (Fe-chlorite) + 5CaCO3 (calcite) + 5CO2(aq) → 5Ca(Fe0:8Mg0:2)(CO3)2 (ankerite) + Al2Si2O5(OH)4 (kaolinite) + SiO2 + H2O
In the presence of CO2 and SO2, formation of pyrite was predicted in the reducing conditions from long-term reaction with dissolved Fe from Fe-bearing minerals (chlorite, siderite) in the calcite cemented, siderite cemented, shale and mudstone cap-rocks (Equation (11)).
15Fe2+ + 2SO42− + 16H+ → FeS2 + 14Fe3+ + 8H2O
In the long-term cap-rock models with CO2, SO2 and O2 the oxidizing conditions resulted in predicted formation of minerals containing oxidized Fe3+ including hematite and nontronite, and also sulphate minerals including alunite (Equations (12) and (13)).
KAlSi3O8 (K-feldspar) + 4H2O + 4H+ → K+ + Al3+ + 3H4SiO4
K+ + 3Al3+ +2SO42− + 6H2O → KAl3(SO4)2(OH)6 (alunite) + 6H+
Sites of natural CO2 accumulation or “natural analogues” give unique insights into the long term CO2-water-rock reactions in various reservoir or cap-rock types [50]. In the siliciclastic Ladbroke Grove Field, Australia, Fe-rich chlorite was altered to siderite, and calcite or plagioclase altered to ankerite/Fe-dolomite by naturally occurring CO2 and CH4 [51,52]. Kaolinite and quartz were also precipitated with local porosity maintained or slightly increased. Higgs and co-workers demonstrated that while the reservoir showed localized porosity generation, tighter rocks (such as cap-rocks) in the CO2-rich Kapuni Field, New Zealand, tended to undergo kaolinite or carbonate cementation reducing porosity and permeability [53]. They observed dissolution of K-feldspar and plagioclase, and kaolinitisation of mica. Formation of illite/smectite, siderite, ankerite, calcite, ferroan dolomite and quartz cement occluded porosity.
Exhumed sandstones in or near Green River, USA, have been altered by leaking CO2 ± CH4 or H2S bearing fluids [28]. Alteration of K-feldspar to kaolinite and illite, dissolution of Fe-hydroxide grain coatings, and precipitation of ferroan carbonates (Fe-dolomite, ankerite or siderite) and Fe-oxide were reported in the Navajo Sandstone, Utah by CO2-CH4 bearing fluids [50]. CO2-H2S leakage at Green River has altered cap-rocks with the dissolution of K-feldspar, dolomite and hematite locally increasing porosity [6]. The precipitation of ferroan dolomite, gypsum, Fe-oxides, pyrite, Cu-sulphides and illite/smectite over centimeter scales has then decreased the porosity.
The Madison Limestone on the Moxa Arch, USA, has been exposed to supercritical CO2, H2S and dissolved sulphate and hydrogen sulphide over 50 million years [54]. Secondary anhydrite, pyrite, and native S has reportedly filled porosity in dolomite, and calcite is also present. Analcime and dolomite re-precipitation was also reported. The CarbFix project in Iceland has sequestered CO2 and H2S from a geothermal power plant into basalts [17]. Mineral trapping of CO2 as calcite and siderite has been reported, along with trapping of S as pyrite. Chalcedony, analcime and kaolinite were also saturated in sampled fluids.
Our predicted mineral alterations are in good agreement overall with natural analog studies above, predicting alteration of plagioclase, chlorite, and carbonates, and precipitation of ferroan carbonates, kaolinite, smectite, pyrite and gypsum/anhydrite ± Fe-oxides. The long-term predictions of cap-rock reactivity reported in our study did not result in significant predicted changes to porosity, expected to be favorable for cap-rock integrity. However, while mineral trapping of CO2 as siderite or ankerite was predicted for pure CO2 or CO2-SO2 reactions; when O2 was present in the gas mixture mineral trapping was generally not predicted. Instead smectites, sulphate minerals and Fe-oxides were predicted to form. In simulations of a reservoir scale CO2 injection field trial (CO2 containing 50 ppm O2) into the Frio Sandstone, dissolution of calcite and oxyhydroxides and precipitation of dolomite, ankerite, kaolinite, nontronite and montmorillonite were predicted [55]. The predicted changes in porosity were also low over 1000 years at ~0.002 vol % in reasonable agreement with our study. Our results generally are also in agreement with Gaus and co-workers who predicted only a very small decrease in the porosity after CO2 reaction of a clayey cap-rock at Sleipner, which may improve the sealing capacity in the lowest meters [56]. Seismic observations after a CO2 injection field trial at Sleipner, and associated modelling, have shown growing CO2 accumulations under thin (~1 m) mudstone beds in the Utsira sand [57]. This is also evidence for the field scale integrity of mudstone toward CO2 reaction. However, reactive transport modelling of CO2 and H2S or SO2 reaction with a saline sandstone reservoir by Xu and co-workers resulted in more significant predicted changes to porosity, with increases in the reservoir, and decreases in the far field from precipitation of carbonates, alunite, anhydrite and pyrite [58]. Although the magnitude of porosity change is less in our study (which may be somewhat site specific), the minerals predicted to form with co-injection of impurities are in agreement.
4.3. Significance
The cap-rock lithologies studied here are generally representative of many cap-rocks worldwide. The experimental results, and long-term modelled cap-rock reactions with dissolved pure CO2, CO2-SO2 or CO2-SO2-O2 show mineral alterations but no significant net porosity changes are predicted. This is favorable as it indicates CO2 seal integrity is not likely to be significantly affected by mineral corrosion from acid gases. It should be noted however that while initial generalizations can be made, changes will be site specific and predictions are limited by available data. This and other studies show that in more mineralogically reactive formations, co-injected SO2 can be expected to be sequestered as minerals including pyrite, anhydrite/gypsum, barite, and alunite. For the Evergreen Formation cap-rocks studied here predicted siderite and ankerite precipitation mineral trapped CO2 for pure CO2 or CO2-SO2 reactions. However, for the CO2-SO2-O2 reactions siderite and ankerite were not predicted instead oxidized Fe minerals, Fe-oxides and nontronite were formed. In sites where ferroan carbonates, rather than calcite, are predicted to be the mineral traps for CO2, this suggests that a limit would be needed on co-injected O2 content to optimize mineral trapping. In all predictions performed here smectites were formed. These have relatively high CO2 sorption capacities, and their formation may be favorable for providing additional storage potential through gas sorption.
4.4. Potential Issues, Limitations, and Future Work
Although our study predicts only minor changes in net porosity, minerals were altered. The alteration of minerals may result in rock mechanical property changes. Hangx and co-workers (2013) reported no change in mechanical properties or rock strength of calcite cemented cap-rock as the framework grains were not dissolved on the experimental CO2—brine reaction timescale [59]. However they noted that longer term dissolution of silicates or precipitation of minerals may affect these parameters. In addition, other parameters such as cap-rock hardness could be altered by e.g., replacement of K-feldspar (Mohns hardness of 6) by kaolinite (hardness of 2). Arman and co-workers reported recently a decrease in sandstone or siltstone drill core toughness and hardness after CO2-brine reaction, which could affect the mechanical properties of cap-rock [60]. Other potential site specific questions related to storage reservoirs have not been addressed here, e.g., acidification near the wellbore, release of trace metals from pyrite oxidation or Fe-oxide reduction, fines migration and its effect on permeability etc. Future work is suggested on coupled geochemical, petrophysical and mechanical parameter changes to reservoir or cap-rocks via experimental CO2-fluid reactions, field injection studies, and natural analog studies, especially for O2 co-injection
Further studies of natural analogue sites, especially those where S or O2 bearing fluids where present with CO2, are suggested to understand alterations on a geological timescale. The Surat, Bowen, and Eromanga Basins have recently been shown to have previously undergone natural CO2 alteration especially around faults, this deserves further work to understand the long term potential for CO2 storage mineral trapping and metal sequestration [61,62]. The models performed here were limited by the availability of data on the Evergreen Formation in the central and southern Surat Basin. For the Surat Basin, further data is needed on the reservoir and cap-rock especially in the deeper central basin areas including mineralogies, porosities and permeabilities of drill core to populate predictive models. Uncertainties also remain around the expected temperature in the region of the plume, since several field studies globally have reported significant cooling below reservoir temperature which persists over long time scales, this would have an effect on the reaction rates.
5. Conclusions
- Experimental CO2-SO2-O2 reaction of calcite cemented cap-rock resulted in calcite dissolution and chlorite corrosion, pH buffering and gypsum, barite, goethite and clay precipitation.
- To model the experimental data, reactive surface areas needed for calcite cement were low at 1 cm2/g, and high for silicates including plagioclase (300 cm2/g) and clays chlorite and illite (7000 cm2/g).
- Upscaled longer-term calcite cemented, siderite cemented, mudstone or shale cap-rock reactivity models predicted minimal net changes to porosity, favorably indicating cap-rock integrity was likely not significantly affected at these conditions.
- Smectite formation was predicted in all the long-term reactions, smectite has a high CO2 sorption capacity, favorable for trapping.
- Mineral trapping of CO2 as siderite and ankerite was only predicted to occur with pure CO2 or CO2-SO2. With O2 present, smectites, sulphate and oxide minerals were instead predicted to form. A limit on the O2 content co-injected may be needed to optimize CO2 mineral trapping, the most secure form of storage.
Supplementary Materials
The following are available online at https://www.mdpi.com/2076-3263/8/7/241/s1, Figure S1: SEM image and EDS element maps after reaction, Figure S2: SEM and EDS spectra of corroded chlorite, Figure S3: SEM images and EDS spectra of the inside surface of the block after reaction, Figure S4: SEM images and EDS spectra of the exposed surface after reaction, Figure S5: SEM images and EDS spectra of precipitated material, Figure S6: SEM images and EDS spectra of disaggregated grains, Table S1: Geochemical modelling parameters, Table S2: Cap-rock porosities, Figure S7: Additional experimental models, Figure S8: Additional experimental models.
Author Contributions
J.K.P. conceived and designed the experiments; J.K.P. performed the experiments; J.K.P. and G.K.W.D. analyzed the data and performed SEM-EDS; G.K.W.D. performed permeability and XRD measurements; J.K.P. performed geochemical modelling and wrote the manuscript.
Funding
Part of this work was funded by the UQ Surat Deep Aquifer Appraisal Project (UQ-SDAAP) 2016001337. For their contribution and support, UQ would like to acknowledge: the Commonwealth Government of Australia and ACA Low Emissions Technology Pty Ltd. (ACALET).
Acknowledgments
Part of this work was funded by the UQ Surat Deep Aquifer Appraisal Project (UQ-SDAAP). For their contribution and support, UQ would like to acknowledge: the Commonwealth Government of Australia and ACA Low Emissions Technology Pty Ltd. (ACALET). The information, opinions and views expressed here do not necessarily represent those of The University of Queensland, the Australian Government or ACALET. Researchers within or working with the UQ-SDAAP are bound by the same policies and procedures as other researchers within The University of Queensland, which are designed to ensure the integrity of research. A. Garnett, S. Golding, J. Undershultz and A. La Croix are acknowledged for support and helpful discussions. D. Kirste is thanked for providing mineral reaction scripts and helpful discussions. M. Mostert of the UQ environmental geochemistry lab is acknowledged for performing ICP-OES and MS, and D. Biddle is thanked for assistance with experiments and permeability measurements. We acknowledge the facilities, and the scientific and technical assistance, of the Australian Microscopy and Microanalysis Research Facility at the Centre for Microscopy and Microanalysis, The University of Queensland. M. Grigorescu, J. Esterle, R. Heath and CTSCo Pty Ltd. are thanked for access to drill core and data. Two anonymous reviewers are thanked for their comments that significantly improved this manuscript.
Conflicts of Interest
The authors declare no conflict of interest. The founding sponsors had no role in the design of the study; in the collection, analyses, or interpretation of data; in the writing of the manuscript, and in the decision to publish the results.
References
- Fischer, S.; Liebscher, A.; De Lucia, M.; Hecht, L. Reactivity of sandstone and siltstone samples from the Ketzin pilot CO2 storage site-laboratory experiments and reactive geochemical modeling. Environ. Earth Sci. 2013, 70, 3687–3708. [Google Scholar] [CrossRef]
- Smith, M.M.; Sholokhova, Y.; Hao, Y.; Carroll, S.A. Evaporite Caprock integrity: An experimental study of reactive mineralogy and pore-scale heterogeneity during brine-CO2 exposure. Environ. Sci. Technol. 2013, 47, 262–268. [Google Scholar] [CrossRef] [PubMed]
- Zhang, L.; Soong, Y.; Dilmore, R.M. Numerical investigation of lower Tuscaloosa sandstone and Selma chalk Caprock under geological CO2 sequestration conditions: Mineral precipitation and permeability evolution. Greenh. Gases Sci. Technol. 2017, 7, 988–1007. [Google Scholar] [CrossRef]
- Carroll, S.A.; McNab, W.W.; Dai, Z.; Torres, S.C. Reactivity of mount Simon sandstone and the eau Claire shale under CO2 storage conditions. Environ. Sci. Technol. 2013, 47, 252–261. [Google Scholar] [CrossRef] [PubMed]
- Kampman, N.; Bickle, M.J.; Maskell, A.; Chapman, H.J.; Evans, J.P.; Purser, G.; Zhou, Z.; Schaller, M.F.; Gattacceca, J.C.; Bertier, P.; et al. Drilling and sampling a natural CO2 reservoir: Implications for fluid flow and CO2-fluid–rock reactions during CO2 migration through the overburden. Chem. Geol. 2014, 369, 51–82. [Google Scholar] [CrossRef]
- Kampman, N.; Bertier, P.; Busch, A.; Snippe, J.; Harrington, J.; Pipich, V.; Maskell, A.; Bickle, M. Validating reactive transport models of CO2-brine-rock reactions in Caprocks using observations from a natural CO2 reservoir. Energy Procedia 2017, 114, 4902–4916. [Google Scholar] [CrossRef]
- Loring, J.S.; Schaef, H.T.; Turcu, R.V.F.; Thompson, C.J.; Miller, Q.R.S.; Martin, P.F.; Hu, J.; Hoyt, D.W.; Qafoku, O.; Ilton, E.S.; et al. In situ molecular spectroscopic evidence for CO2 intercalation into montmorillonite in supercritical carbon dioxide. Langmuir 2012, 28, 7125–7128. [Google Scholar] [CrossRef] [PubMed]
- Deng, H.; Fitts, J.P.; Crandall, D.; McIntyre, D.; Peters, C.A. Alterations of fractures in carbonate rocks by CO2-acidified brines. Environ. Sci. Technol. 2015, 49, 10226–10234. [Google Scholar] [CrossRef] [PubMed]
- Dubacq, B.; Bickle, M.J.; Evans, K.A. An activity model for phase equilibria in the H2O–CO2–NaCl system. Geochim. Cosmochim. Acta 2013, 110, 229–252. [Google Scholar] [CrossRef]
- Ellis, B.; Fitts, J.; Bromhal, G.; McIntyre, D.; Tappero, R.; Peters, C. Dissolution-driven permeability reduction of a fractured carbonate Caprock. Environ. Eng. Sci. 2013, 30, 187–193. [Google Scholar] [CrossRef] [PubMed]
- Wunsch, A.; Navarre-Sitchler, A.K.; Moore, J.; McCray, J.E. Metal release from limestones at high partial-pressures of CO2. Chem. Geol. 2014, 363, 40–55. [Google Scholar] [CrossRef]
- Bickle, M.; Kampman, N.; Chapman, H.; Ballentine, C.; Dubacq, B.; Galy, A.; Sirikitputtisak, T.; Warr, O.; Wigley, M.; Zhou, Z. Rapid reactions between CO2, brine and silicate minerals during geological carbon storage: Modelling based on a field CO2 injection experiment. Chem. Geol. 2017, 468, 17–31. [Google Scholar] [CrossRef]
- Wigley, M.; Dubacq, B.; Kampman, N.; Bickle, M. Controls of sluggish, CO2-promoted, hematite and k-feldspar dissolution kinetics in sandstones. Earth Planet. Sci. Lett. 2013, 362, 76–87. [Google Scholar] [CrossRef]
- Talman, S. Subsurface geochemical fate and effects of impurities contained in a CO2 stream injected into a deep saline aquifer: What is known? Int. J. Greenh. Gas Control 2015, 40, 267–291. [Google Scholar] [CrossRef]
- Porter, R.T.J.; Fairweather, M.; Pourkashanian, M.; Woolley, R.M. The range and level of impurities in CO2 streams from different carbon capture sources. Int. J. Greenh. Gas Control 2015, 36, 161–174. [Google Scholar] [CrossRef]
- Harkin, T.; Filby, I.; Sick, H.; Manderson, D.; Ashton, R. Development of a CO2 specification for a CCS hub network. Energy Procedia 2017, 114, 6708–6720. [Google Scholar] [CrossRef]
- Snæbjörnsdóttir, S.Ó.; Gislason, S.R.; Galeczka, I.M.; Oelkers, E.H. Reaction path modelling of in situ mineralisation of CO2 at the Carbfix site at Hellisheidi, SW-Iceland. Geochim. Cosmochim. Acta 2018, 220, 348–366. [Google Scholar] [CrossRef]
- Bachu, S.; Gunter, W.D. Overview of acid-gas injection operations in western Canada. In Greenhouse Gas Control Technologies 7; Rubin, E.S., Keith, D.W., Gilboy, C.F., Wilson, M., Morris, T., Gale, J., Thambimuthu, K., Eds.; Elsevier Science Ltd.: Oxford, UK, 2005; pp. 443–448. [Google Scholar]
- Hodgkinson, J.; Preda, M.; Hortle, A.; McKillop, M.; Dixon, O.; Foster, L. The Potential Impact of Carbon Dioxide Injection on Freshwater Aquifers: The Surat and Eromanga Basins in Queensland; Dept. of Employment, Economic Development and Innovation, Geological Survey of Queensland: Brisbane, Australia, 2010; p. 133. ISBN 9781921489570. [Google Scholar]
- Farquhar, S.M.; Pearce, J.K.; Dawson, G.K.W.; Golab, A.; Kirste, D.; Biddle, D.; Golding, S.D. A fresh approach to investigating CO2 storage: Experimental CO2-water-rock interactions in a freshwater reservoir system. Chem. Geol. 2015, 399, 98–122. [Google Scholar] [CrossRef]
- Hodgkinson, J.; Grigorescu, M. Background research for selection of potential geostorage targets—Case studies from the Surat basin, Queensland. Aust. J. Earth Sci. 2012, 60, 71–89. [Google Scholar] [CrossRef]
- Feitz, A.J.; Ransley, T.R.; Dunsmore, R.; Kuske, T.J.; Hodgkinson, J.; Preda, M.; Spulak, R.; Dixon, O.; Draper, J. Geoscience Australia and Geological Survey of Queensland Surat and Bowen Basins Groundwater Surveys Hydrochemistry Dataset (2009–2011); Geoscience Australia: Canberra, Australia, 2014. [Google Scholar]
- Farquhar, S.M.; Dawson, G.K.W.; Esterle, J.S.; Golding, S.D. Mineralogical characterisation of a potential reservoir system for CO2 sequestration in the Surat basin. Aust. J. Earth Sci. 2013, 60, 91–110. [Google Scholar] [CrossRef]
- Golab, A.; Arena, A.; Sommacal, S.; Goodwin, C.; Rajan, P.; Dodd, N.; Khor, J.; Deakin, L.; Zhang, J.; Young, B.; et al. Milestone 2.9: Final Report of Digital Core Analysis Results for Plug Samples from West Wandoan-1 Well; Report for ANLEC R&D; FEI-Lithicon: Hillsboro, OR, USA, 2015. [Google Scholar]
- Golab, A.; Arena, A.; Khor, J.; Goodwin, C.; Young, B.; Carnerup, A.; Hussain, F. Milestone 1.4 Final Report of RCA and SCAL Data on Plugs from West Wandoan-1 Well; Report for ANLEC R&D; FEI Lithicon: Hillsboro, OR, USA, 2015. [Google Scholar]
- Ellis, B.; Peters, C.; Fitts, J.; Bromhal, G.; McIntyre, D.; Warzinski, R.; Rosenbaum, E. Deterioration of a fractured carbonate Caprock exposed to CO2-acidified brine flow. Greenh. Gases Sci. Technol. 2011, 1, 248–260. [Google Scholar] [CrossRef]
- Kirste, D.; Pearce, J.; Golding, S. Parameterizing geochemical models: Do kinetics of calcite matter? Procedia Earth Planet. Sci. 2017, 17, 606–609. [Google Scholar] [CrossRef]
- Wigley, M.; Kampman, N.; Dubacq, B.; Bickle, M. Fluid-mineral reactions and trace metal mobilization in an exhumed natural CO2 reservoir, green river, Utah. Geology 2012, 40, 555–558. [Google Scholar] [CrossRef]
- Golab, A.; Knuefing, L.; Goodwin, C.; Sommacal, S.; Carnerup, A.; Dawson, G.; Pearce, J.K.; Golding, S.D. Milestone 5.7: Final Report on Geochemical Reactivity Studies of Core Material Using SCCO2; Report for ANLEC R&D; Lithicon FEI: Hillsboro, OR, USA, 2015. [Google Scholar]
- Dawson, G.K.W.; Biddle, D.; Farquhar, S.M.; Gao, J.; Golding, S.D.; Jiang, X.; Keck, R.; Khan, C.; Law, A.C.K.; Li, Q.; et al. Achieving Risk and Cost Reductions in CO2 Geosequestration through 4D Characterisation of Host Formations; ANLEC R&D; University of Queensland: Brisbane, Australia, 2015. [Google Scholar]
- Pearce, J.K.; Kirste, D.M.; Dawson, G.K.W.; Farquhar, S.M.; Biddle, D.; Golding, S.; Rudolph, V. SO2 impurity impacts on experimental and simulated CO2-water-reservoir rock reactions at carbon storage conditions. Chem. Geol. 2015, 399, 65–86. [Google Scholar] [CrossRef]
- Pearce, J.K.; Law, A.C.K.; Dawson, G.K.W.; Golding, S.D. SO2-CO2 and pure CO2 reactivity of ferroan carbonates at carbon storage conditions. Chem. Geol. 2015. [Google Scholar] [CrossRef]
- Bethke, C.M.; Yeakel, S. The Geochemist’s Workbench (Version 9.0): Reaction Modeling Guide; Aqueous Solutions LLC: Champaign, IL, USA, 2012; 96p. [Google Scholar]
- Delany, J.M.; Lundeen, S.R. The LLNL Thermodynamic Database; Lawrence Livermore National Laboratory Report UCRL-21658; Lawrence Livermore National Laboratory: Livermore, CA, USA, 1989. [Google Scholar]
- Duan, Z.; Sun, R. An improved model calculating CO2 solubility in pure water and aqueous NaCl solutions from 273 to 533 k and from 0 to 2000 bar. Chem. Geol. 2003, 193, 257–271. [Google Scholar] [CrossRef]
- Palandri, J.L.; Kharaka, Y.K. A Compilation of Rate Parameters of Water-Mineral Interaction Kinetics for Application to Geochemical Modeling; USGS Open File Report 2004-1068; USGS: Reston, VA, USA, 2004; p. 64. [Google Scholar]
- Lowson, R.T.; Brown, P.L.; Comarmond, M.C.J.; Rajaratnam, G. The kinetics of chlorite dissolution. Geochim. Cosmochim. Acta 2007, 71, 1431–1447. [Google Scholar] [CrossRef]
- Köhler, S.J.; Dufaud, F.; Oelkers, E.H. An experimental study of Illite dissolution kinetics as a function of pH from 1.4 to 12.4 and temperature from 5 to 50 °C. Geochim. Cosmochim. Acta 2003, 67, 3583–3594. [Google Scholar] [CrossRef]
- Pham, V.T.H.; Lu, P.; Aagaard, P.; Zhu, C.; Hellevang, H. On the potential of CO2–water–rock interactions for CO2 storage using a modified kinetic model. Int. J. Greenh. Gas Control 2011, 5, 1002–1015. [Google Scholar] [CrossRef]
- Steefel, C.I. Gimrt, Version 1.2: Software for Modeling Multicomponent, Multidimensional Reactive Transport. User’s Guide, UCRL-MA-143182; Lawrence Livermore National Laboratory: Livermore, CA, USA, 2001. [Google Scholar]
- White, A.F. Chemical weathering rates of silicate minerals in soils. Rev. Mineral. Geochem. 1995, 31, 407–461. [Google Scholar]
- Pearce, J.; Kirste, D.; Altaf, I.; Golding, S.; Undershultz, J. Geochemistry of storing CO2 and NOx in the deep precipice sandstone. In Proceedings of the Australasian Exploration Geoscience Conference, Sydney, Australia, 18–21 February 2018. [Google Scholar]
- Grigorescu, M. Mineralogy of the North-Eastern Bowen Basin and North-Eastern Surat Basin, Queensland; Geological Survey of Queensland: Queensland, Australian, 2011. [Google Scholar]
- Raza, A.; Hill, K.C.; Korsch, R.J. Mid-cretaceous uplift and denudation of the Bowen and Surat basins, Eastern Australia: Relationship to Tasman Sea rifting from apatite fission-track and vitrinite-reflectance data. Aust. J. Earth Sci. 2009, 56, 501–531. [Google Scholar] [CrossRef]
- Hu, Y.; Ray, J.R.; Jun, Y.-S. Biotite–brine interactions under acidic hydrothermal conditions: Fibrous illite, goethite, and kaolinite formation and biotite surface cracking. Environ. Sci. Technol. 2011, 45, 6175–6180. [Google Scholar] [CrossRef] [PubMed]
- Renard, S.; Sterpenich, J.; Pironon, J.; Chiquet, P.; Randi, A. Geochemical effects of an oxycombustion stream containing SO2 and O2 on carbonate rocks in the context of CO2 storage. Chem. Geol. 2014, 382, 140–152. [Google Scholar] [CrossRef]
- Pearce, J.K.; Dawson, G.K.W.; Blach, T.P.; Bahadur, J.; Melnichenko, Y.B.; Golding, S.D. Impure CO2 reaction of feldspar, clay, and organic matter rich cap-rocks: Decreases in the fraction of accessible mesopores measured by sans. Int. J. Coal Geol. 2018, 185, 79–90. [Google Scholar] [CrossRef]
- Chopping, C.; Kaszuba, J.P. Reactivity of supercritical sulfur dioxide and carbon dioxide in a carbonate reservoir: An experimental investigation of supercritical fluid-brine-rock interactions relevant to the Madison limestone of southwest Wyoming. Interpretation 2017, 5, SS43–SS58. [Google Scholar] [CrossRef]
- Smith, M.M.; Wolery, T.J.; Carroll, S.A. Kinetics of chlorite dissolution at elevated temperatures and CO2 conditions. Chem. Geol. 2013, 347, 1–8. [Google Scholar] [CrossRef]
- Bickle, M.J.; Kampman, N.; Wigley, M. Natural analogues. Geochemistry of Geologic Carbon Sequestration. Rev. Mineral. Geochem. 2013, 77, 15–71. [Google Scholar] [CrossRef] [Green Version]
- Watson, M.N.; Zwingmann, N.; Lemon, N.M. The ladbroke grove-katnook carbon dioxide natural laboratory: A recent CO2 accumulation in a lithic sandstone reservoir. Energy 2004, 29, 1457–1466. [Google Scholar] [CrossRef]
- Higgs, K.E.; Haese, R.R.; Golding, S.D.; Schacht, U.; Watson, M. The pretty hill formation as a natural analogue for CO2 storage; an investigation of mineralogical and isotopic changes associated with sandstones exposed to low, intermediate and high CO2 concentrations over geological time. Chem. Geol. 2015, 399, 36–64. [Google Scholar] [CrossRef]
- Higgs, K.E.; Funnell, R.H.; Reyes, A.G. Changes in reservoir heterogeneity and quality as a response to high partial pressures of CO2 in a gas reservoir, New Zealand. Mar. Pet. Geol. 2013, 48, 293–322. [Google Scholar] [CrossRef]
- Kaszuba, J.P.; Navarre-Sitchler, A.; Thyne, G.; Chopping, C.; Meuzelaar, T. Supercritical carbon dioxide and sulfur in the Madison limestone: A natural analog in southwest Wyoming for geologic carbon-sulfur co-sequestration. Earth Planet. Sci. Lett. 2011, 309, 131–140. [Google Scholar] [CrossRef]
- Ilgen, A.G.; Cygan, R.T. Mineral dissolution and precipitation during CO2 injection at the Frio-I brine pilot: Geochemical modeling and uncertainty analysis. Int. J. Greenh. Gas Control 2016, 44, 166–174. [Google Scholar] [CrossRef]
- Gaus, I.; Azaroual, M.; Czernichowski-Lauriol, I. Reactive transport modelling of the impact of CO2 injection on the clayey cap rock at Sleipner (North Sea). Chem. Geol. 2005, 217, 319–337. [Google Scholar] [CrossRef]
- Bickle, M.; Chadwick, A.; Huppert, H.E.; Hallworth, M.; Lyle, S. Modelling carbon dioxide accumulation at Sleipner: Implications for underground carbon storage. Earth Planet. Sci. Lett. 2007, 255, 164–176. [Google Scholar] [CrossRef]
- Xu, T.F.; Apps, J.A.; Pruess, K.; Yamamoto, H. Numerical modeling of injection and mineral trapping of CO2 with H2S and SO2 in a sandstone formation. Chem. Geol. 2007, 242, 319–346. [Google Scholar] [CrossRef]
- Hangx, S.; van der Linden, A.; Marcelis, F.; Bauer, A. The effect of CO2 on the mechanical properties of the captain sandstone: Geological storage of CO2 at the goldeneye field (UK). Int. J. Greenh. Gas Control 2013, 19, 609–619. [Google Scholar] [CrossRef]
- Aman, M.; Espinoza, D.N.; Ilgen, A.G.; Major, J.R.; Eichhubl, P.; Dewers, T.A. CO2 induced chemo mechanical alteration in reservoir rocks assessed via batch reaction experiments and scratch testing. Greenh. Gases Sci. Technol. 2018, 8, 133–149. [Google Scholar] [CrossRef]
- Golding, S.D.; Uysal, I.T.; Bolhar, R.; Boreham, C.J.; Dawson, G.K.W.; Baublys, K.A.; Esterle, J.S. Carbon dioxide-rich coals of the oaky creek area, central Bowen basin: A natural analogue for carbon sequestration in coal systems. Aust. J. Earth Sci. 2013, 60, 125–140. [Google Scholar] [CrossRef]
- Farquhar, S. CO2–Water–Rock Interactions in Low-Salinity Reservoir Systems. Ph.D. Thesis, University of Queensland, Brisbane, Australia, 2016. [Google Scholar]
Figure 1.
(A) Map of the Surat Basin, Australia, also showing the Bowen Basin and Clarence Moreton Basin. The West Wandoan 1, and Cabawin 1 wells are marked in green; (B) Generalized stratigraphic column showing the Precipice Sandstone and overlying Evergreen Formation.
Figure 1.
(A) Map of the Surat Basin, Australia, also showing the Bowen Basin and Clarence Moreton Basin. The West Wandoan 1, and Cabawin 1 wells are marked in green; (B) Generalized stratigraphic column showing the Precipice Sandstone and overlying Evergreen Formation.

Figure 2.
SEM images of the 1053m Calcite cemented cap-rock before reaction (A) surface view of the framework grains with calcite cement; (B) and (C) quartz and plagioclase framework grains cemented by calcite; (D) EDS spectrum of the calcite cement containing Mn and possibly Fe; (E); Plagioclase with areas of illitisation, and FeZn sulphide (F) Chlorite surface. Qz = quartz, Cal = calcite, Chl = chlorite, Pl = plagioclase, Sp = sphalerite or FeZn sulphide, Ilt = illite.

Figure 3.
SEM images of the exposed surface of the 1053 m calcite cemented cap-rock sub-sample after reaction (A) surface view of the framework grains with calcite cement dissolved; (B) Quartz and silicate framework grains remaining with calcite cement dissolved; (C) Chlorite surface with alteration; (D) quartz, plagioclase and K-feldspar grains remain with open porosity formed; (E) gypsum growing out of pore space; (F) precipitated gypsum and bright barite crystals. Chl = chlorite, Pl = plagioclase, Qz = quartz, Kfs = K-feldspar, Gp = gypsum/Ca-sulphate.

Figure 4.
SEM images of the inner surface of the cap-rock sub-sample after reaction (A) surface view of Ca-Na-plagioclase (andesine) grain with surrounding calcite cement dissolved; (B) Ca-Na-plagioclase surface; (C) smectite precipitate layer; (D) corroded chlorite surface with precipitated material in the center; (E) corroded chlorite surface and bright barite crystal; (F) pore filling clay revealed by calcite dissolution, and bright barite precipitates.

Figure 5.
SEM images of the inner surface of the cap-rock sub-sample after reaction (A) surface view of a Si-Al-containing precipitated layer on grains; (B) Gypsum growing in pore space; (C) Gypsum crystals; (D) Si-Al containing precipitated layer; (E) Barite crystals on and in Si-Al-precipitated layer; (F) Skeletal pore filling clay. Gp = gypsum/Ca-sulphate, Als = precipitated aluminosilicate layer.

Figure 6.
Modelled data as lines and experimental data shown as symbols for calcite cemented cap-rock reaction (A) Solution pH; (B) concentration of major ions; (C) concentration of minor ions; (D) predicted change in mineral mass in grams (g) where positive values indicate precipitation, and negative values dissolution. Note experimentally measured dissolved Si and S were converted to SiO2 and sulphate for comparison to the modelled outputs, assuming all of the measured dissolved S was present as sulphate.

Figure 7.
Experimental water chemistry during reaction of the cap-rock (A) solution electrical conductivity; (B) Dissolved concentrations of Sr, Mn, Ba and Ti; (C) correlation of dissolved Ca and Mn; (D) Concentrations of dissolved Nb, Ga, Ge, and Rb.
Figure 7.
Experimental water chemistry during reaction of the cap-rock (A) solution electrical conductivity; (B) Dissolved concentrations of Sr, Mn, Ba and Ti; (C) correlation of dissolved Ca and Mn; (D) Concentrations of dissolved Nb, Ga, Ge, and Rb.

Figure 8.
Up-scaled calcite cemented cap-rock, reaction over 30 years. Reaction with CO2-SO2-O2 (A) predicted pH; (B) predicted change in mineral volumes (delta cm3), where positive values indicate mineral precipitation, and negative values mineral dissolution; Reaction with CO2 (C) predicted pH; (D) predicted change in mineral volumes; Reaction with CO2-SO2 (E) predicted pH; (F) predicted change in mineral volumes.


Figure 9.
Up-scaled mudstone cap-rock reaction over 30 years. Reaction with CO2-SO2-O2 (A) predicted pH; (B) predicted change in mineral volumes (delta cm3) where positive values indicate precipitation, and negative values dissolution; Reaction with CO2 (C) predicted pH; (D) predicted change in mineral volumess; Reaction with CO2-SO2 (E) predicted pH; (F) predicted change in mineral volumes.


Figure 10.
Up-scaled siderite cap-rock reaction over 100 years. Reaction with CO2-SO2-O2 (A) predicted pH; (B) predicted change in mineral volumes (delta cm3) where positive values indicate precipitation, and negative values dissolution; Reaction with CO2 (C) predicted pH; (D) predicted change in mineral volumes; Reaction with CO2-SO2 (E) predicted pH; (F) predicted change in mineral volumes.


Figure 11.
Up-scaled shale cap-rock reaction over 100 years. Reaction with CO2-SO2-O2 (A) predicted pH; (B) predicted change in mineral volumes (delta cm3), where positive values indicate precipitation, and negative values dissolution; Reaction with CO2 (C) predicted pH; (D) predicted change in mineral volumes; Reaction with CO2-SO2 (E) predicted pH; (F) predicted change in mineral volumes.


Table 1.
Quantified minerals in the cap-rock from 1056.10–1056. 18 m. Where QEMSCAN was previously reported on two adjacent sub-plug slices [29] and is reported in area %. XRD was performed on a powdered section of the whole core, and also on the subsample after reaction, reported in wt. %. * Fe-rich chlorite/chalmosite.
| Mineral | QEMSCAN a | QEMSCAN b | Mineral | XRD | XRD Post |
|---|---|---|---|---|---|
| Depth/m | 1056.1 | 1056.1 | 1056.10–1056.18 | ||
| Quartz | 25 | 21 | Quartz | 27.3 | 37.6 |
| Alkali feldspar | 13 | 12 | Orthoclase | 6 | 12 |
| Plagioclase | 17.7 | 21.6 | Na(Ca)plagioclase | 14.7 | 12.5 |
| Musc/Illite | 0.4 | 0.2 | Illite/Musc M1 | 19 | 17.4 |
| Illite-Smec | 11.9 | 9.2 | Montmorillonite | 0 | 7.3 |
| Kaolinite | 0.9 | 0.6 | Kaolinite | 2 | 9 |
| Chlorite | 0.9 | 0.8 | Chlorite * | 1 | 4 |
| Calcite | 25.2 | 30.1 | Calcite | 16.3 | 0 |
| Dolomite/Mg-Cal | 0.5 | ||||
| Ca(Na)plagioclase | 13 | ||||
| Unclassified 1 | 4.9 | 4.7 | |||
| Total | 99.9 | 100.2 | 99.8 | 99.8 |
1 Includes minerals unclassified or in trace amounts, and organic matter.
Table 2.
Reactive surface areas and mineral proportions used in geochemical models. * As are the initial reactive surface areas assigned to each mineral. Asmod are the modified reactive surface areas to model the experiment data. Asres are the up-scaled reactive surface areas. # Used for precipitation only.
| Mineral | As * cm2/g | Asmod cm2/g | Asres cm2/g | ExpWW1 CalCem | WW1 CalCem | WW1 MudS | Cab1 SidCem | Cab1 Shale |
|---|---|---|---|---|---|---|---|---|
| Quartz | 10 | 10 | 1 | 24 | 27.3 | 43.0 | 39.0 | 40.1 |
| K-feld | 10 | 300 | 30 | 12.1 | 6.0 | 4.0 | 6.3 | 10.2 |
| Albite | 10 | 300 | 30 | 10.6 | 14.7 | 12.6 | 5.3 | 10.6 |
| Andesine | 10 | 300 | 30 | 6.4 | 13.0 | 9.0 | ||
| Kaolinite | 70 | 70 | 70 | 5.3 | 2.0 | 2.0 | 19.4 | 31.5 |
| Ill/Musc | 70 | 7000 | 70 | 13.2 | 19.0 | 23.0 | 6.7 | 4.4 |
| Smectite | 150 | 15 | ||||||
| Biotite | 70 | |||||||
| Chlorite | 70 | 7000 | 70 | 11.2 | 1.0 | 8.0 | 0.1 | 0.1 |
| Calcite | 10 | 1 | 0.01 | 16 | 16.8 | 1.0 | 0.7 | |
| Ankerite | 10 | 1 | 0.01 | 0.1 | ||||
| Siderite | 10 | 1 | 0.01 | 0.1 | 23.4 | 1.0 | ||
| Fe-oxide | 70 | 0.001 # | 10 | 1.5 | ||||
| Gyp/Anh | 10 | 0.05 # | 1 | |||||
| Pyrite | 10 | 10 | 10 | 0.8 | 0.2 | 0.05 | 0.05 | |
| Sphal | 10 | 10 | 10 | 0.5 |
Table 3.
Solution pH and conductivity (ms/cm) during the cap-rock reaction, note this was measured ex situ immediately on sampling. Dissolved element concentrations (mg/kg), and the associated detection limit (DL) and effective detection limit multiplied by the dilution factor (DL*DF). <DL indicated the measurement was below detection. Time zero refers to the sample after the N2-water-rock soak. Quench refers to the residual fluid in the reactor after depressurization. The associated error for the analyses by ICP-OES is <5%.
| Time (h) | pH | Cond. | Al | Ba | Ca | Co | Cr | Fe | K | Li | Mg | Mn | Na | Ni | S | Si | Sr | Ti | Zn |
|---|---|---|---|---|---|---|---|---|---|---|---|---|---|---|---|---|---|---|---|
| 0 | 6.12 | 3 | 2.24 | 2.42 | 242.32 | 0.06 | 0.45 | 1.28 | 4.44 | <DL | 2.44 | 9.27 | 661.45 | 0.4 | 6.07 | 1.38 | 1.65 | 2.86 | 0.25 |
| 168 | 5.07 | 9.83 | 3.77 | 1068.89 | 0.33 | 8.39 | 98.96 | 19.63 | 0.1 | 15.37 | 49.08 | 1148.48 | 5.51 | 1398.85 | 45.94 | 9.36 | 0.08 | 0.97 | |
| 240 | 5.37 | 4.81 | 1.55 | 0.91 | 662.88 | 0.16 | 1.65 | 39.63 | 7.85 | 0.05 | 8.93 | 30.73 | 586.52 | 1.62 | 762.27 | 23.04 | 5.17 | 0.01 | 0.43 |
| 336 | 5.54 | 4.94 | 1.27 | 0.81 | 714.69 | 0.18 | 1.27 | 34.83 | 7.34 | 0.05 | 9.07 | 33.39 | 554.12 | 2.48 | 723.02 | 20.59 | 5.16 | 0.01 | 0.48 |
| 432 | 5.53 | 5.06 | 0.24 | 0.78 | 757.6 | 0.17 | 0.3 | 28 | 13.54 | 0.06 | 9.38 | 35.23 | 772.98 | 0.95 | 679.4 | 13.92 | 5.22 | 0.01 | 0.52 |
| 528 | 5.51 | 5.08 | <DL | 0.72 | 764.97 | 0.16 | 0.16 | 34.47 | 12.63 | 0.06 | 9.79 | 35.29 | 737.24 | 0.67 | 654.3 | 14.11 | 5.14 | 0 | 0.38 |
| 600 | 5.59 | 5.41 | <DL | 0.74 | 816.87 | 0.17 | 0.1 | 29.49 | 13.33 | 0.06 | 10.03 | 37.51 | 752.06 | 0.51 | 653.44 | 14.83 | 5.34 | 0.01 | 0.54 |
| 696 | 5.64 | 4.86 | 0.08 | 0.73 | 841.76 | 0.16 | 0.06 | 34.92 | 14.62 | 0.06 | 10.78 | 39.04 | 800.88 | 0.48 | 670.81 | 16.19 | 5.76 | 0 | 0.44 |
| 720 | 5.61 | 5.24 | <DL | 0.74 | 839.74 | 0.2 | 0.04 | 42.22 | 12.73 | 0.07 | 11.07 | 38.44 | 765.62 | 0.53 | 672.82 | 16.09 | 5.44 | 0.02 | 0.45 |
| quench | <DL | 0.68 | 768.49 | 0.15 | 0.02 | 25.17 | 11.75 | 0.07 | 10.19 | 35.75 | 710.06 | 0.2 | 618.41 | 15.06 | 5.01 | <DL | 0.3 | ||
| DL | 0.001 | 0.0001 | 0.0051 | 0.0007 | 0.0034 | 0.0009 | 0.27 | 0.0001 | 0.021 | 0.0002 | 0.27 | 0.0019 | 0.0018 | 0.03 | 0 | 0.0002 | 0.001 | ||
| DL*DF | 0.01 | 0.0011 | 0.051 | 0.0067 | 0.034 | 0.0088 | 2.7 | 0.0007 | 0.21 | 0.0015 | 2.7 | 0.019 | 0.018 | 0.3 | 0.0004 | 0.0024 | 0.01 |
Table 4.
Water chemistry sampled during the cap-rock reaction, with dissolved element concentrations (µg/kg), and the associated detection limit (DL) and effective detection limit multiplied by the dilution factor (DL*DF). <DL indicated the measurement was below detection. Quench refers to the residual fluid in the reactor after depressurization. The associated error for the analyses by ICP-MS is <10%.
| Time (h) | P | V | Cu | Ga | Ge | Rb | Nb | Sn | Sb | Th | U |
|---|---|---|---|---|---|---|---|---|---|---|---|
| 0 | <DL | 0.81 | 52.24 | 0.30 | 0.45 | 31.19 | 0.07 | 3.63 | 0.81 | 0.06 | 0.63 |
| 168 | <DL | 34.54 | 151.85 | 2.10 | 2.57 | 38.63 | 1.03 | 5.02 | 1.57 | 0.66 | 1.28 |
| 240 | <DL | 10.82 | 101.38 | 1.89 | 2.33 | 41.23 | 0.29 | 5.61 | 3.95 | 0.31 | 1.41 |
| 336 | <DL | 4.32 | 68.50 | 1.47 | 1.73 | 43.94 | 0.15 | 4.25 | 1.00 | 0.16 | 1.38 |
| 432 | <DL | 0.33 | 0.33 | 0.42 | 43.02 | 0.04 | 4.46 | 0.99 | 0.07 | 1.06 | |
| 528 | <DL | 3.47 | 56.67 | 1.32 | 0.84 | 34.02 | 0.10 | 6.52 | 1.59 | 0.17 | 1.30 |
| 600 | <DL | 3.00 | 50.29 | 1.09 | 1.41 | 46.29 | 0.17 | 4.93 | 1.54 | 0.13 | 1.71 |
| 696 | <DL | 3.51 | 46.72 | 1.86 | 1.87 | 50.50 | 0.13 | 8.35 | 9.61 | 0.15 | 2.05 |
| 720 | <DL | 2.59 | 24.17 | 1.33 | 1.67 | 48.45 | 0.11 | 5.87 | 9.96 | 0.14 | 1.92 |
| Quench | <DL | 4.27 | 68.56 | 2.14 | 1.77 | 43.32 | 0.22 | 4.41 | 1.02 | 0.14 | 1.36 |
| DL | 3.8200 | 0.0076 | 0.0487 | 0.0021 | 0.0048 | 0.0062 | 0.0018 | 0.0385 | 0.0076 | 0.0015 | 0.0040 |
| DL*DF | 38.200 | 0.0762 | 0.4870 | 0.0208 | 0.0483 | 0.0615 | 0.0183 | 0.3850 | 0.0763 | 0.0146 | 0.0398 |
© 2018 by the authors. Licensee MDPI, Basel, Switzerland. This article is an open access article distributed under the terms and conditions of the Creative Commons Attribution (CC BY) license (http://creativecommons.org/licenses/by/4.0/).
Share and Cite
MDPI and ACS Style
Pearce, J.K.; Dawson, G.K.W. Experimental Determination of Impure CO2 Alteration of Calcite Cemented Cap-Rock, and Long Term Predictions of Cap-Rock Reactivity. Geosciences 2018, 8, 241. https://doi.org/10.3390/geosciences8070241
AMA Style
Pearce JK, Dawson GKW. Experimental Determination of Impure CO2 Alteration of Calcite Cemented Cap-Rock, and Long Term Predictions of Cap-Rock Reactivity. Geosciences. 2018; 8(7):241. https://doi.org/10.3390/geosciences8070241
Chicago/Turabian StylePearce, Julie K., and Grant K. W. Dawson. 2018. "Experimental Determination of Impure CO2 Alteration of Calcite Cemented Cap-Rock, and Long Term Predictions of Cap-Rock Reactivity" Geosciences 8, no. 7: 241. https://doi.org/10.3390/geosciences8070241
Note that from the first issue of 2016, this journal uses article numbers instead of page numbers. See further details here.