Next Article in Journal
Measurement and Modeling Air Quality Impacts of Dust Emissions from Unpaved Roads in Tuxtla Gutierrez, Chiapas
Next Article in Special Issue
A New Occurrence of Terrestrial Native Iron in the Earth’s Surface: The Ilia Thermogenic Travertine Case, Northwestern Euboea, Greece
Previous Article in Journal
An Attempt to Use Non-Linear Regression Modelling Technique in Long-Term Seasonal Rainfall Forecasting for Australian Capital Territory
Previous Article in Special Issue
Geology and Isotope Systematics of the Jianchaling Au Deposit, Shaanxi Province, China: Implications for Mineral Genesis
 
 
Correction published on 5 November 2018, see Geosciences 2018, 8(11), 403.
Article

REY and Trace Element Chemistry of Fluorite from Post-Variscan Hydrothermal Veins in Paleozoic Units of the North German Basin

1
GeoZentrum Nordbayern, Friedrich-Alexander-University Erlangen-Nuremberg, Schlossgarten 5, 91054 Erlangen, Germany
2
Geowissenschaftliches Zentrum der Universität Göttingen, Goldschmidtstrasse 1-3, 37077 Göttingen, Germany
3
Department of Physics and Earth Sciences, Jacobs University Bremen, Campus Ring 1, 28759 Bremen, Germany
4
GFZ, German Research Centre for Geosciences, Telegrafenberg, 14473 Potsdam, Germany
*
Author to whom correspondence should be addressed.
Geosciences 2018, 8(8), 283; https://doi.org/10.3390/geosciences8080283
Submission received: 19 June 2018 / Revised: 24 July 2018 / Accepted: 26 July 2018 / Published: 29 July 2018
(This article belongs to the Special Issue Magmatic-Hydrothermal Ore Deposits)

Abstract

:
Hydrothermal fluorites from Paleozoic sedimentary rocks and volcanic units in the North German Basin (NGB) have been investigated to create a petrographic and geochemical inventory—with particular focus on strategic elements such as rare earth elements (REE)—and to uncover possible links between the post-Variscan hydrothermal mineralization in the NGB and bordering areas such as the Harz Mountains and Flechtingen Calvörde Block (FCB). Fluorites from ten localities underwent a detailed petrographic examination, including SEM-BSE/CL imagery, and were compositionally analysed using LA-ICP-MS. Overall, REY concentrations are comparatively low in fluorite from all investigated areas—the median sum of REY ranges from 0.3 to 176 ppm. EuropiumCN anomalies are slightly negative or absent, indicating that either the formation fluid experienced temperatures above 250 °C or that fluid-rock interactions and REE enrichment was likely controlled by the source rock (i.e., volcanic) composition and complexation processes. Fluorites from the Altmark-Brandenburg Basin (ABB) and the Lower Saxony Basin (LSB) display distinctly different REYCN signatures, suggesting that fluid compositions and genetic processes such as fluid-rock interaction differed significantly between the two areas. Complex growth zones and REYCN signatures in fluorite from the ABB and the FCB reflect geochemical variability due to adsorption processes and intrinsic crystallographic controls and imply that they are genetically related. Two petrographically and geochemically distinct generations are observed: Fluorite I—light SEM shades, relatively enriched in LREE; Fluorite II—darker SEM shades, comparatively depleted LREE, slightly higher HREE concentrations. These fluorite generations represent zoned (or cyclical) growth within a single progressive hydrothermal event and do not reflect a secondary remobilization process. We demonstrate that increasing Tb/La ratios and decreasing La/Ho ratios can be the result of continuous zoned growth during a single mineralizing event, with significant compositional variations on a micron-scale. This has implications for the interpretation of such trends and hence the inferred genetic evolution of fluorite that displays such geochemical patterns. The complex micro-scale intergrowth of these generations stresses the need for detailed petrographic investigations when geochemical data are collected and interpreted for mineral exploration.

1. Introduction

As part of the r4 national collaborative research effort that explores the resource potential of strategic elements such as rare earth elements (REE) in Germany, we investigated hydrothermal fluorite mineralization in Paleozoic sedimentary rocks and volcanic units of the North German Basin (NGB). Although the structure, stratigraphy and evolution of the NGB and its sub-basins are well-studied due to extensive exploration and production drilling programs, hydrothermal mineralization, including fluorite-barite and base metal sulphide mineralization in different parts of the basin, have not been studied in detail until recently [1,2,3]. Here, we present macro- and micro-scale petrographic observations (optical microscopy, back-scattered secondary electron (BSE) and cathodoluminescence (CL) imaging) in combination with geochemical data (laser ablation inductively coupled mass spectrometry (LA-ICP-MS), bulk rock X-ray fluorescence (XRF)), including REE and minor and trace element contents, for hydrothermal fluorite from four distinct areas within the NGB—specifically, the Altmark-Brandenburg Basin (ABB) as part of the North East German Basin (NEGB), the Lower Saxony Basin (LSB) in the western part of the NGB, the Flechtingen High (Flechtingen Calvörde Block, FCB) and the Harz Mountains south of the ABB. The latter two were selected to investigate possible links between the hydrothermal mineralization in the NGB and the surrounding areas. In addition to the characterization of the fluorite mineralization and the observed characteristic geochemical signatures, we present and discuss the micro-scale fluorite mineralogy and the corresponding elemental distribution which can have considerable impact on the interpretation of bulk and in-situ fluorite data regarding the evolution of the hydrothermal system.

1.1. General Setting

The NGB is a post-Variscan intracratonic structure formed by crustal thinning accompanied by extensive volcanic activity (Upper Carboniferous to Lower Permian) and later inversion (Cretaceous) which is also evident in the uplift of the FCB and Harz Mountains south of the NEGB (e.g., [4,5,6,7,8,9,10]). Changing tectonic settings, from extensional to divergent movements and the stepwise and long-term subsidence followed by a later inversion of the basin enabled fluid migration along structurally controlled pathways and led to the formation of several hydrothermal vein systems in the NGB [2,11,12,13,14,15]. The possible fluid sources (e.g., meteoric or magmatic water) and the heat source for the enhanced geothermal gradients are also discussed by these authors. Extensive fault systems provided pathways for migrating fluids and convective fluid flow in Rotliegend (Lower Permian) and Upper Carboniferous units [1,11,15,16] which was further enhanced during basin inversion, also allowing for basinal brines of various salinities to mix e.g., [16]. In particular the fluorite-barite mineralization and REE-enriched hematite veins in the ABB and FCB have been attributed to the latter phase [13,17]. The Harz Mountains have historically been an important mining area for fluorite and other commodities and post-Variscan hydrothermal mineralization in this area shows many similarities to the hydrothermal veins found in sedimentary rocks and volcanic units further north in the FCB and the ABB [12,18]. For example, sulphur isotopic ratios measured by Schmidt Mumm and Wolfgramm [13] are strikingly similar and could reflect a mutual source, that is, Rotliegend volcanics and underlying Carboniferous sedimentary rocks. Hence, we compare the hydrothermal fluorite from the ABB, FCB and LSB with a quartz-calcite-fluorite vein from the Biwender Vein Complex near Straßberg in the Harz Mountains. This area has a mining history that dates back to the 1300s, with fluorite, lead and silver being the main resources [19].

1.2. Fluorite (Ca2F) Geochemistry

Fluorite is a common accessory and gangue mineral in many magmatic and hydrothermal deposits and can also occur as a primary economic mineral in massive or vein-type mineralization (e.g., Vergenoeg [20], Pennine Orefield [21,22] and Wölsendorf [23]). It has been the subject of many studies investigating its unique geochemical signature as a function of its formation history e.g., [24,25,26,27,28,29,30,31,32,33]. Many of these investigations focused on the REE + Y (REY) concentrations in fluorite because the behaviour of these elements follows well established trends and is controlled by a number of known variables such as temperature, fluid composition, fluid-rock interaction and intrinsic crystallographic controls [23,32,34,35,36,37,38,39,40]. Fluorites and other Ca-bearing minerals such as calcite may preserve the REY signature of the hydrothermal fluid and hence the REY signature of the source [36]. REY are largely unaffected by water-rock interactions and are therefore independent of the host rock composition [29,30,36]. This makes them a valuable proxy for the formation conditions and the initial fluid composition [29]. This information may include the metal source, temperature conditions of water-rock interactions, migration, precipitation and the chemical composition of the fluid phase [29,32,33,36,41]. Möller [33] introduced the Tb/Ca-Tb/La diagram which can discriminate between sedimentary, hydrothermal and pegmatitic fluorite and allows the differentiation between primary and recrystallized fluorite [32,38,42]. Further relevant examples are studies by Bau et al. [32] and Kraemer et al. [43] who used REY patterns and Sr-Nd-Pb isotopes in fluorites from the Pennine MVT ore field to demonstrate that temperature and sources of the fluorite-forming fluids differed significantly between the Southern Pennine Orefield and the Northern Pennine Orefield. Fluorites in the Alston Block of the Northern Pennine Orefield are about ten-fold enriched in REY (553 mg kg−1; [43]) relative to fluorites from the Askrigg Block in the Northern Pennine Orefield (42.7 mg kg−1, [43]) and fluorites from the Southern Pennine Orefield (28 mg kg−1; [32]).
In addition to REY, the Ca2+ cation in the fluorite crystal structure can be substituted by a range of other foreign cations including Li+, Na+, K+, Mg2+, Mn2+, Fe2+,3+, Zn2+, Sr2+, Y3+, Zr4+, Ba2+, Pb2+, Th4+, and U4+ e.g., [29,36,44,45,46]. The overall concentrations of these cations usually occur at minor to trace element levels, that is, they do not commonly exceed 1 wt.% [47].

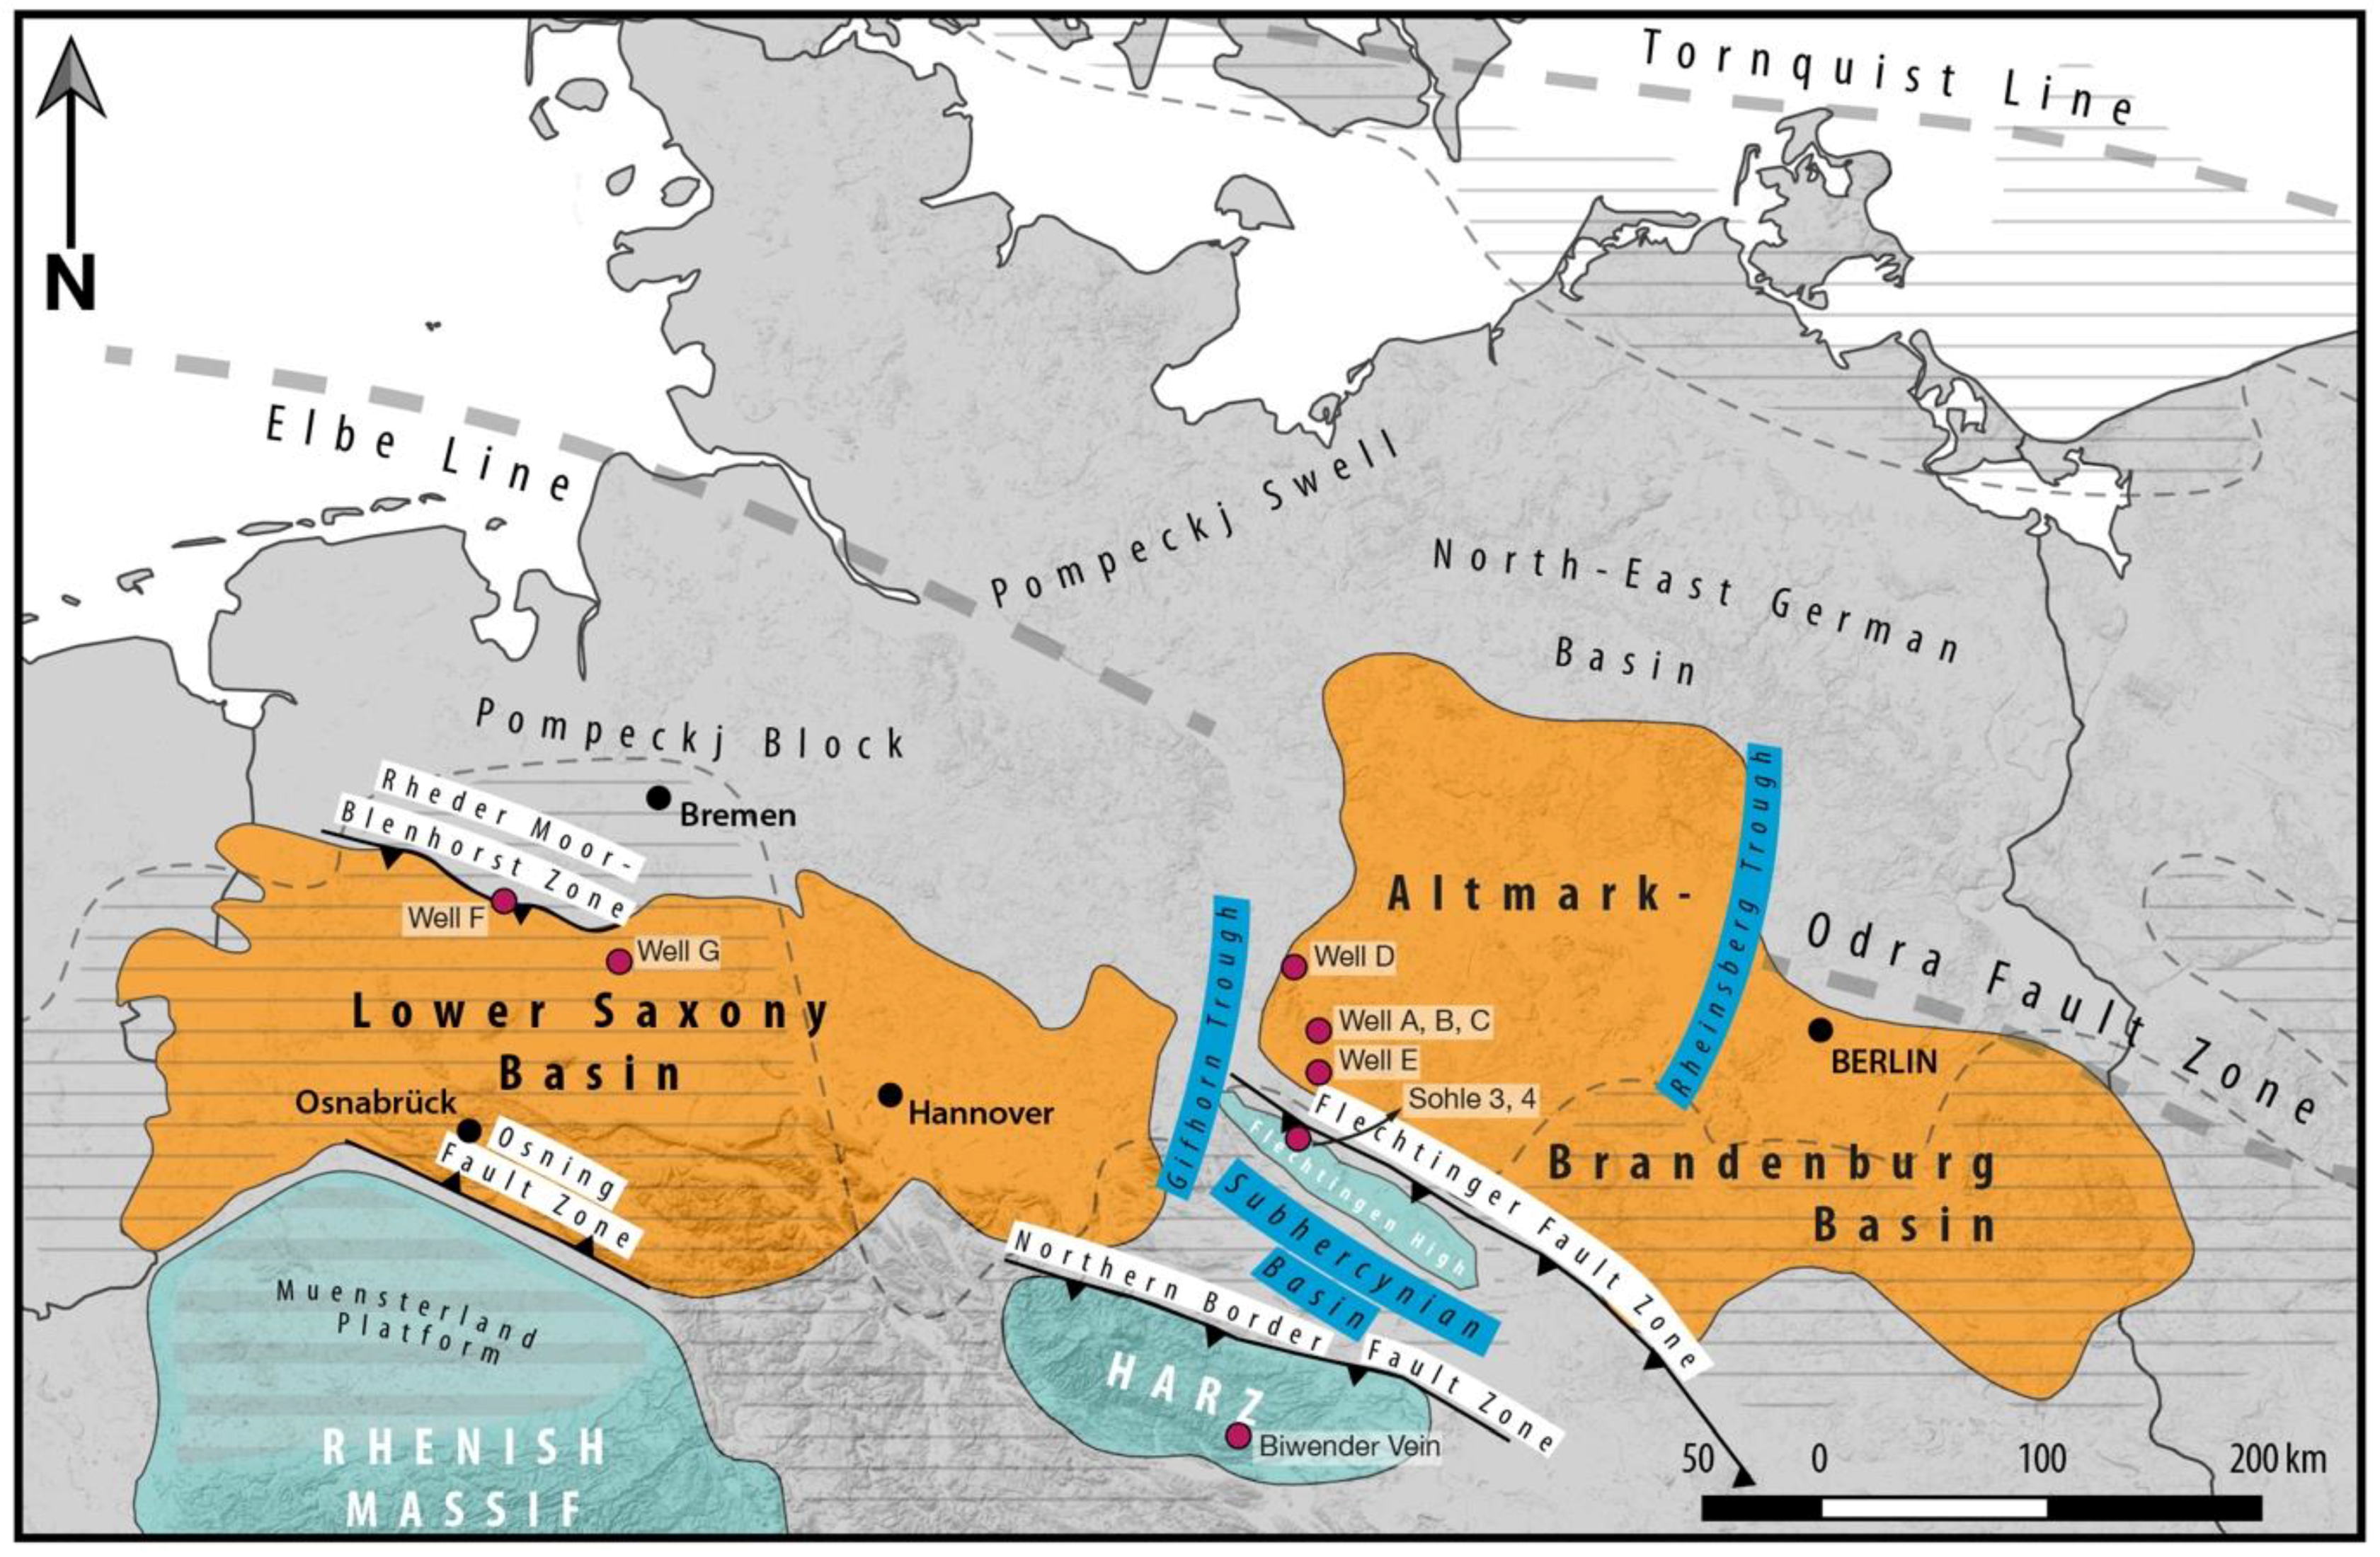
2. Geological Setting

The three main study areas, that is, the Altmark-Brandenburg Basin (ABB), the Flechtingen Calvörde Block (FCB) and the Lower Saxony Basin (LSB) are briefly introduced (see also Figure 1).

2.1. North German Basin

The North German Basin (NGB) is part of the supra-regional Central European Basin System, which developed after the break-down of Pangea [9,48]. The German part is formed by the Variscan Foreland Basin of Late Carboniferous age, including the NGB, the LSB of Late Jurassic to Early Cretaceous age and the North Sea Basin. Rotliegend sandstones and Zechstein (Upper Permian) carbonates within the NGB host hydrocarbon accumulations [49] and have been drilled extensively by the oil and gas industry. A number of these drill cores feature hydrothermal mineralization, including base metal sulphide and fluorite-barite veins, in deeply buried Paleozoic sedimentary rocks of the NGB (ca. 3–4 km), specifically the ABB and the LSB.

2.2. Altmark-Brandenburg Basin

The Flechtinger Fault Zone and the Gifhorn Trough mark the southern and western border of the ABB, respectively [50,51] (Figure 1). The ABB is commonly considered devoid of any known economically viable mineralization. However, hydrothermal vein-type F-Ba mineralization hosted by Rotliegend volcanic rocks [7] and Permian siliciclastic sedimentary rocks were found in gas exploration drill cores in the Altmark area e.g., [52].

2.3. Lower Saxony Basin

The E–W trending LSB is located in the NW-part of Germany (Figure 1), north of the Rhenish Massif [5,53]. The LSB developed during a tectonically active period in Late Jurassic to Mid-Cretaceous times along NW–SE trending fault systems, superimposing the Late Carboniferous Variscan Foreland Basin and parts of the Variscan Fold Belt [5,54,55]. During the Cretaceous uplift and inversion, the LSB was in part overthrust on the southern Muensterland Block along the Osning Thrust Zone [56,57,58]. Faults of Permian age limit the Osning Thrust Zone to the south [59].

2.4. Flechtingen Calvörde Block and Harz Mountains

The Harz Mountains and the FCB are expressions of the Variscan Fold Belt within the Rhenohercynian Zone e.g., [18,60] (Figure 1). The FCB to the northeast is divided from the Harz by the Subhercynian Basin [18]. The Harz Mountains are located along the southern margin of the EFZ, between the two major sub-basins, the LSB in the northwest and the ABB in the northeast (Figure 1). The occurrence of major fault-related hydrothermal mineralization in the Harz Mountains such as the Biwender Vein and their association with the complex post-Variscan tectonic history may be connected with fluid migration in the adjacent sedimentary NGB [61,62]. The Harz Mountains were uplifted during the Late Cretaceous-Early Cenozoic contemporaneously with the NGB inversion e.g., [63,64].
The formation of vein mineralization in the Harz Mountains developed from the Late Variscan through to Upper Cretaceous times. Hydrothermal vein-type Pb-Zn (Ag), Ba-F, Ba-Fe and F-Ba mineralization was deposited in the Mesozoic (Triassic through Late Cretaceous) e.g., [65,66,67]. Post-Variscan, Late Triassic-Jurassic sulphide mineralization was preceded by intense hematitization and silicification (pre-ore stage) followed by the deposition of typically banded quartz and carbonate-sulphide veins [68]. Post-Variscan fluorite veins, such as the Biwender Vein which is hosted in Carboniferous siliciclastic sedimentary rocks, have been attributed to the mixing of low-salinity, low-temperature formation waters with ascending high-salinity and high-temperature brines [42]. This area is also known for its historic Pb-Zn and Ag mining [19]. Hydrothermal Ba-F, F-Ba, and specular hematite vein-type mineralization within the FCB is hosted by Upper Carboniferous and lower Permian rhyolitic and andesitic volcanic rocks, which underwent intense alteration, that is, bleaching, oxidation, and sericitization [17]. These volcanic rocks host steeply-dipping hematite veins which are exposed in the Bodendorf quarry, 35 km northwest of Magdeburg. The length of these NW–SE-trending veins reaches several hundred meters and widths of up to 1.5 m [69]. Fluorite-bearing veins hosted by andesites most probably reflect hydrothermal activity induced by granite intrusion of uncertain (Permian?) age [70]. Schmidt Mumm & Wolfgramm [13,14] suggested a similarity between this hematite mineralization and iron oxide copper gold (IOCG) deposits formed in intracratonic basins. However, the character of the iron ore-forming mechanisms, the direct age of mineralization, and the iron source for the hematite veins remain unknown.
Outcrops of stratigraphic units of interest are scarce in our study areas, however, three quarries located in volcanic basement units of the FCB were investigated to compare fluid systems and mineralization ages as well as related fault systems with those found in drill cores from the adjacent ABB.

3. Methodology

Seventeen fluorite samples from the ABB and LSB (drill core samples) and the FCB and Harz Mountains (hand samples) have been investigated using the following array of analytical techniques. Polished mounts and thin sections of each sample were also investigated with transmitted and reflected light microscopy.
REY data are presented in C1 chondrite-normalized CN [71] spidergrams (REYCN plots).

3.1. SEM-BSE

The scanning electron microscope (SEM) was first and foremost used for the identification of small fluorite grains as well as the visualization of structural and textural features of fluorite. Thin sections and polished mounts were prepared with carbon coating and silver paint. For evaporation, the prepared samples were stored in a vacuum cabin for at least 24 h. The measurements were carried out at the GeoZentrum Nordbayern with a Tescan VEGA-II XMU coupled with a X-MAX EDS system from Oxford Instrument and a 50 mm² X-Max detector. Prior to analysis, quantum optimization with a Cu and Ti chip was carried out. Operating conditions are shown in Table 1 and also apply to the CL measurements.

3.2. Cathodoluminescence (CL)

CL was used to identify and illustrate internal structures and textures of fluorite grains. The wavelength in combination with the intensity of the emitted light can characterize individual minerals as well as the distribution of certain impurities within those minerals. Cathodoluminescence can be applied for distinguishing carbonate and quartz cement generations, and for contrasting microstructures related with fluid-rock interaction, like fluid pathways, paleo-porosity, diffusional textures, healed microfractures [72,73]. These textures can normally not be observed by standard petrographical microscopy.
CL analyses were carried out on thin- and thick sections. At the GZG Göttingen a high-power HC3-LM- Simon-Neuser CL microscope [73] with a coupled Peltier-cooled Kappa PS 40C-285 (DX) camera system (resolution 1.5 mpx) attached to an Olympus BH-2 microscope was used. The electron gun was operated at a voltage of 14 keV under high vacuum (10−4 bar) with a filament current of 0.18 mA. The diameter of the electron beam was ca. 4 µm. Further CL measurements were carried out with the SEM at the GeoZentrum Nordbayern (see Table 1).

3.3. LA-ICP-MS

Laser ablation ICP-MS measurements were carried out on (1) bulk rock samples (fused discs) and (2) individual fluorite grains (polished mounts). The analyses were undertaken at the Bureau Veritas commercial laboratories in Perth and at the GeoZentrum Nordbayern.
(1)
For this investigation, a New Wave 193 μm eximer laser coupled to a 7700 agilent ICP-MS was used. The laser was equipped with a 2-volume cell. Each fused disc was ablated for 60 s with a laser spot-size of 150 μm in diameter, a pulse rate of 20 Hz, and measured fluence of 8 J/cm2. As carrier gas a mixture of He and Ar was used with a flow rate optimized for highest sensitivity. For calibration three reference materials were used. Two of these were manufactured and validated in-house at the Bureau Veritas laboratory, the third one was the OREAS 134b standard reference material.
(2)
An Agilent 7500c quadrupole ICP-MS coupled with a New Wave 193 µm excimer laser was used for analyses, with 35 µm spot-size, a 16 Hz repetition rate and a fluence of 7.8 J/cm2. The background was measured for 20 s; the samples were analysed for 20 s. The NIST SRM 612 and NIST SRM 610 glasses were used as reference materials for fluorite. A stoichiometric value of 51.1 wt.% for Ca [74] was used as the internal standard for fluorite. Elemental concentrations, 1 sigma errors and minimum detection limits were calculated using GLITTER (Version 4.4.4, On-line Interactive Data Reduction for LA-ICPMS (Macquarie Research Ltd., Sydney, Australia) using the protocol of Griffin et al. [75]. For each element, the limit of quantification (LOQ) was set to three times the limit of detection (LOD). Signals lower than LOQ were not considered for further interpretation. The following isotopes were measured (typical LODs in ppm in brackets): 23Na (1.28), 29Si (43.8), 42Ca, 44Ca at 10 ms integration time each and 7Li (0.11), 24Mg (1.08), 26Mg, 39K (1.18), 55Mn (0.13), 57Fe (2.8), 66Zn (0.41), 71Ga (0.02), 73Ge (0.08), 74Ge, 85Rb (0.005), 88Sr (0.006), 89Y (0.008), 90Zr (0.017), 93Nb (0.01), 115In (0.008), 118Sn (0.07), 137Ba (0.06), 139La (0.01), 140Ce (0.01), 141Pr (0.005), 146Nd (0.03), 147Sm (0.04), 153Eu (0.005), 157Gd (0.002), 159Tb (0.003), 163Dy (0.03), 165Ho (0.004), 166Er (0.01), 169Tm (0.005), 172Yb (0.02), 175Lu (0.008), 178Hf (0.014), 181Ta (0.0035), 208Pb (0.021), 232Th (0.01), 238U (0.005) at 20 ms integration time each.

3.4. XRF Bulk Rock Chemistry

An oven dry (105 °C) fused disc of each sample was measured by X-ray fluorescence spectrometry using a Robotic TGA system at the Bureau Veritas Mineral Laboratory in Perth (Australia) to detect the bulk rock elemental composition. Fourteen major elements and oxides (CaO, F, SiO2, Al2O3, Fe2O3, K2O, MgO, SO3, TiO2, P2O5, Na2O, MnO, Cl) given in wt.% were determined for low-sulphide samples and twelve major elements and oxides (Fe2O3, SiO2, Al2O3, TiO2, CaO, MnO, SO3, MgO, K2O, Pb, P2O5, ZnO) given in wt.% were determined for high-sulphide samples.
For error correction, internal rock standards of fluorspar, stream sediments, kinzingite and phosphate rock were used for the first determination. For the second determination, the internal rock standards OREAS 134b Zn-Pb-Ag, Gold-Enargite, Greenstone Ore, Canmet SU-1b and Canmet CPB-2 were used.

4. Results

4.1. Petrography

Hydrothermal fluorite found in drill core and hand samples from the investigated areas (i.e., ABB, FCB, LSB, and Harz Mountains) displays several modes of occurrence (Figure 2). In the ABB, fluorite is an abundant mineral phase that occurs as small interstitial grains (<100 µm), as vuggy space-fillings, in massive mineralization associated with hydrothermal veins and as coatings on tectonic planes (Figure 2A,F–I). Hyp-idiomorphic grains (1–100s micron range) within ±quartz ± calcite ± anhydrite veins (Figure 2G) are common. In the LSB, hydrothermal fluorite is often associated with sulphides such as sphalerite and pyrite and occurs as rims surrounding sphalerite (Figure 2B) or as massive (mm-cm-scale) fluorite mineralization (Figure 2J and Figure 3E,F) that is often associated with quartz, calcite, anhydrite and in rare cases, barite. The latter gangue minerals are also commonly present together with fluorite in veins and on tectonic planes in the volcanic and sedimentary host rocks in the FCB (Figure 2C,D,K,L) and Harz Mountains (Figure 2E,M,N). Although fluorite is in most cases colourless or only displays a slight hue, some distinctly coloured varieties occur (Figure 2A–E). Finely dispersed fluorite was identified with short wavelength UV light (Figure 2B). Anhydrite is often coeval with fluorite but also occurs together with paragenetically later barite in a sample from ABB Well D (Figure 2I and Figure 3D).

4.2. SEM (BSE, CL)

Back-scattered electron and CL reveal complex textures in fluorite and associated hydrothermal minerals such as calcite and quartz (Figure 3A–F) that cannot be observed with transmitted or reflected light microscopy. Cyclical growth features (i.e., cyclical banding) are apparent in fluorite, calcite and quartz (Figure 3F). Furthermore, fine, vein-like textures within the fluorite are visible in several samples (Figure 3B). Figure 3E shows a high magnification CL image of a complex patchwork or network of distinct fluorite phases that have different luminescent characteristics. Larger patches of two distinct phases (I-lighter grey and II-medium grey, corresponding to I and II in geochemistry chapter), that were also analysed using LA-ICP-MS, are surrounded by thin rims of a third phase (darkest grey) which lie below the spatial resolution of the LA-ICP-MS.

4.3. Geochemistry

The collected LA-ICP-MS data for fluorite from the investigated areas are summarized in Table 2 and Table 3 as well as in the corresponding boxplots and spidergrams in Figure 4 and Figure 5.

4.3.1. Minor and Trace Elements (Excluding REY)

Minor and trace element concentrations (Figure 4) are characteristically low in fluorite from all areas—median of 633 ppm—i.e., the sum of all measured median element concentrations (excluding the REY) ranges between a minimum of 221 ppm (ABB Well DII) and a maximum of 2048 ppm (ABB Well DI). The later value for ABB Well DI is likely affected by an exceedingly high value for K which is based on only one measurement and likely attributed to a mineral inclusion that was overlooked during LA-ICP-MS data screening.
Only Na and Fe concentrations reach median concentrations that consistently exceed 100 ppm across all sample sites. Only samples ABB Well AI, AII, EI and BVII (Biwender Vein II) have median concentrations below 100 ppm for Na. Lithium contents are comparable among all sample groups and median concentrations range between 0.3 and 7.5 ppm. Sodium and potassium concentrations are also relatively evenly distributed and show comparable ranges in most samples—median values of 140–470 ppm and 20–60 ppm, respectively. Manganese shows slightly higher median concentrations in samples from the ABB (1.67–30.5 ppm) than in the other sample populations (0.5–1.3 ppm). Only BVI (Biwender Vein I) has a comparable median Mn concentration (4.49 ppm). Lead shows the opposite trend with median concentrations being about an order of magnitude higher in samples from the LSB and Flechtingen High compared to the ABB and BV fluorites. Iron shows the most pronounced and characteristic variation among the investigated sample groups. Median concentrations of 670–984 ppm can be found in samples ABB Well AI, II and CII as well as in the two sample populations from the BV. The remaining samples have significantly lower median concentrations of between 150–220 ppm. Zinc, Ga and Ba show no distinct compositional trends among the different fluorite populations. Gallium concentrations are commonly below the level of detection or slightly above with median concentrations barely exceeding 1 ppm in only a couple of samples. The high Ba concentration for sample ABB well DI is likely attributed to a mineral inclusion (see also K content). Strontium concentrations plot consistently at median values of around 10–20 ppm. Samples ABB Well EI, LSB Well FI, GI and BVI show greater ranges and or higher median concentrations of up to ca. 500 ppm.
There appears to be a subtle but noticeable trend between the I and II fluorites from ABB Well A and C, with generation II displaying slightly higher median minor and trace element contents. However, this difference is always less than an order of magnitude. Fluorite from the Biwender Vein displays the opposite trend with higher concentrations of all minor and trace elements except Fe and Pb in BV I compared to BVII. This trend is also reflected in the REY concentrations (Figure 5g).

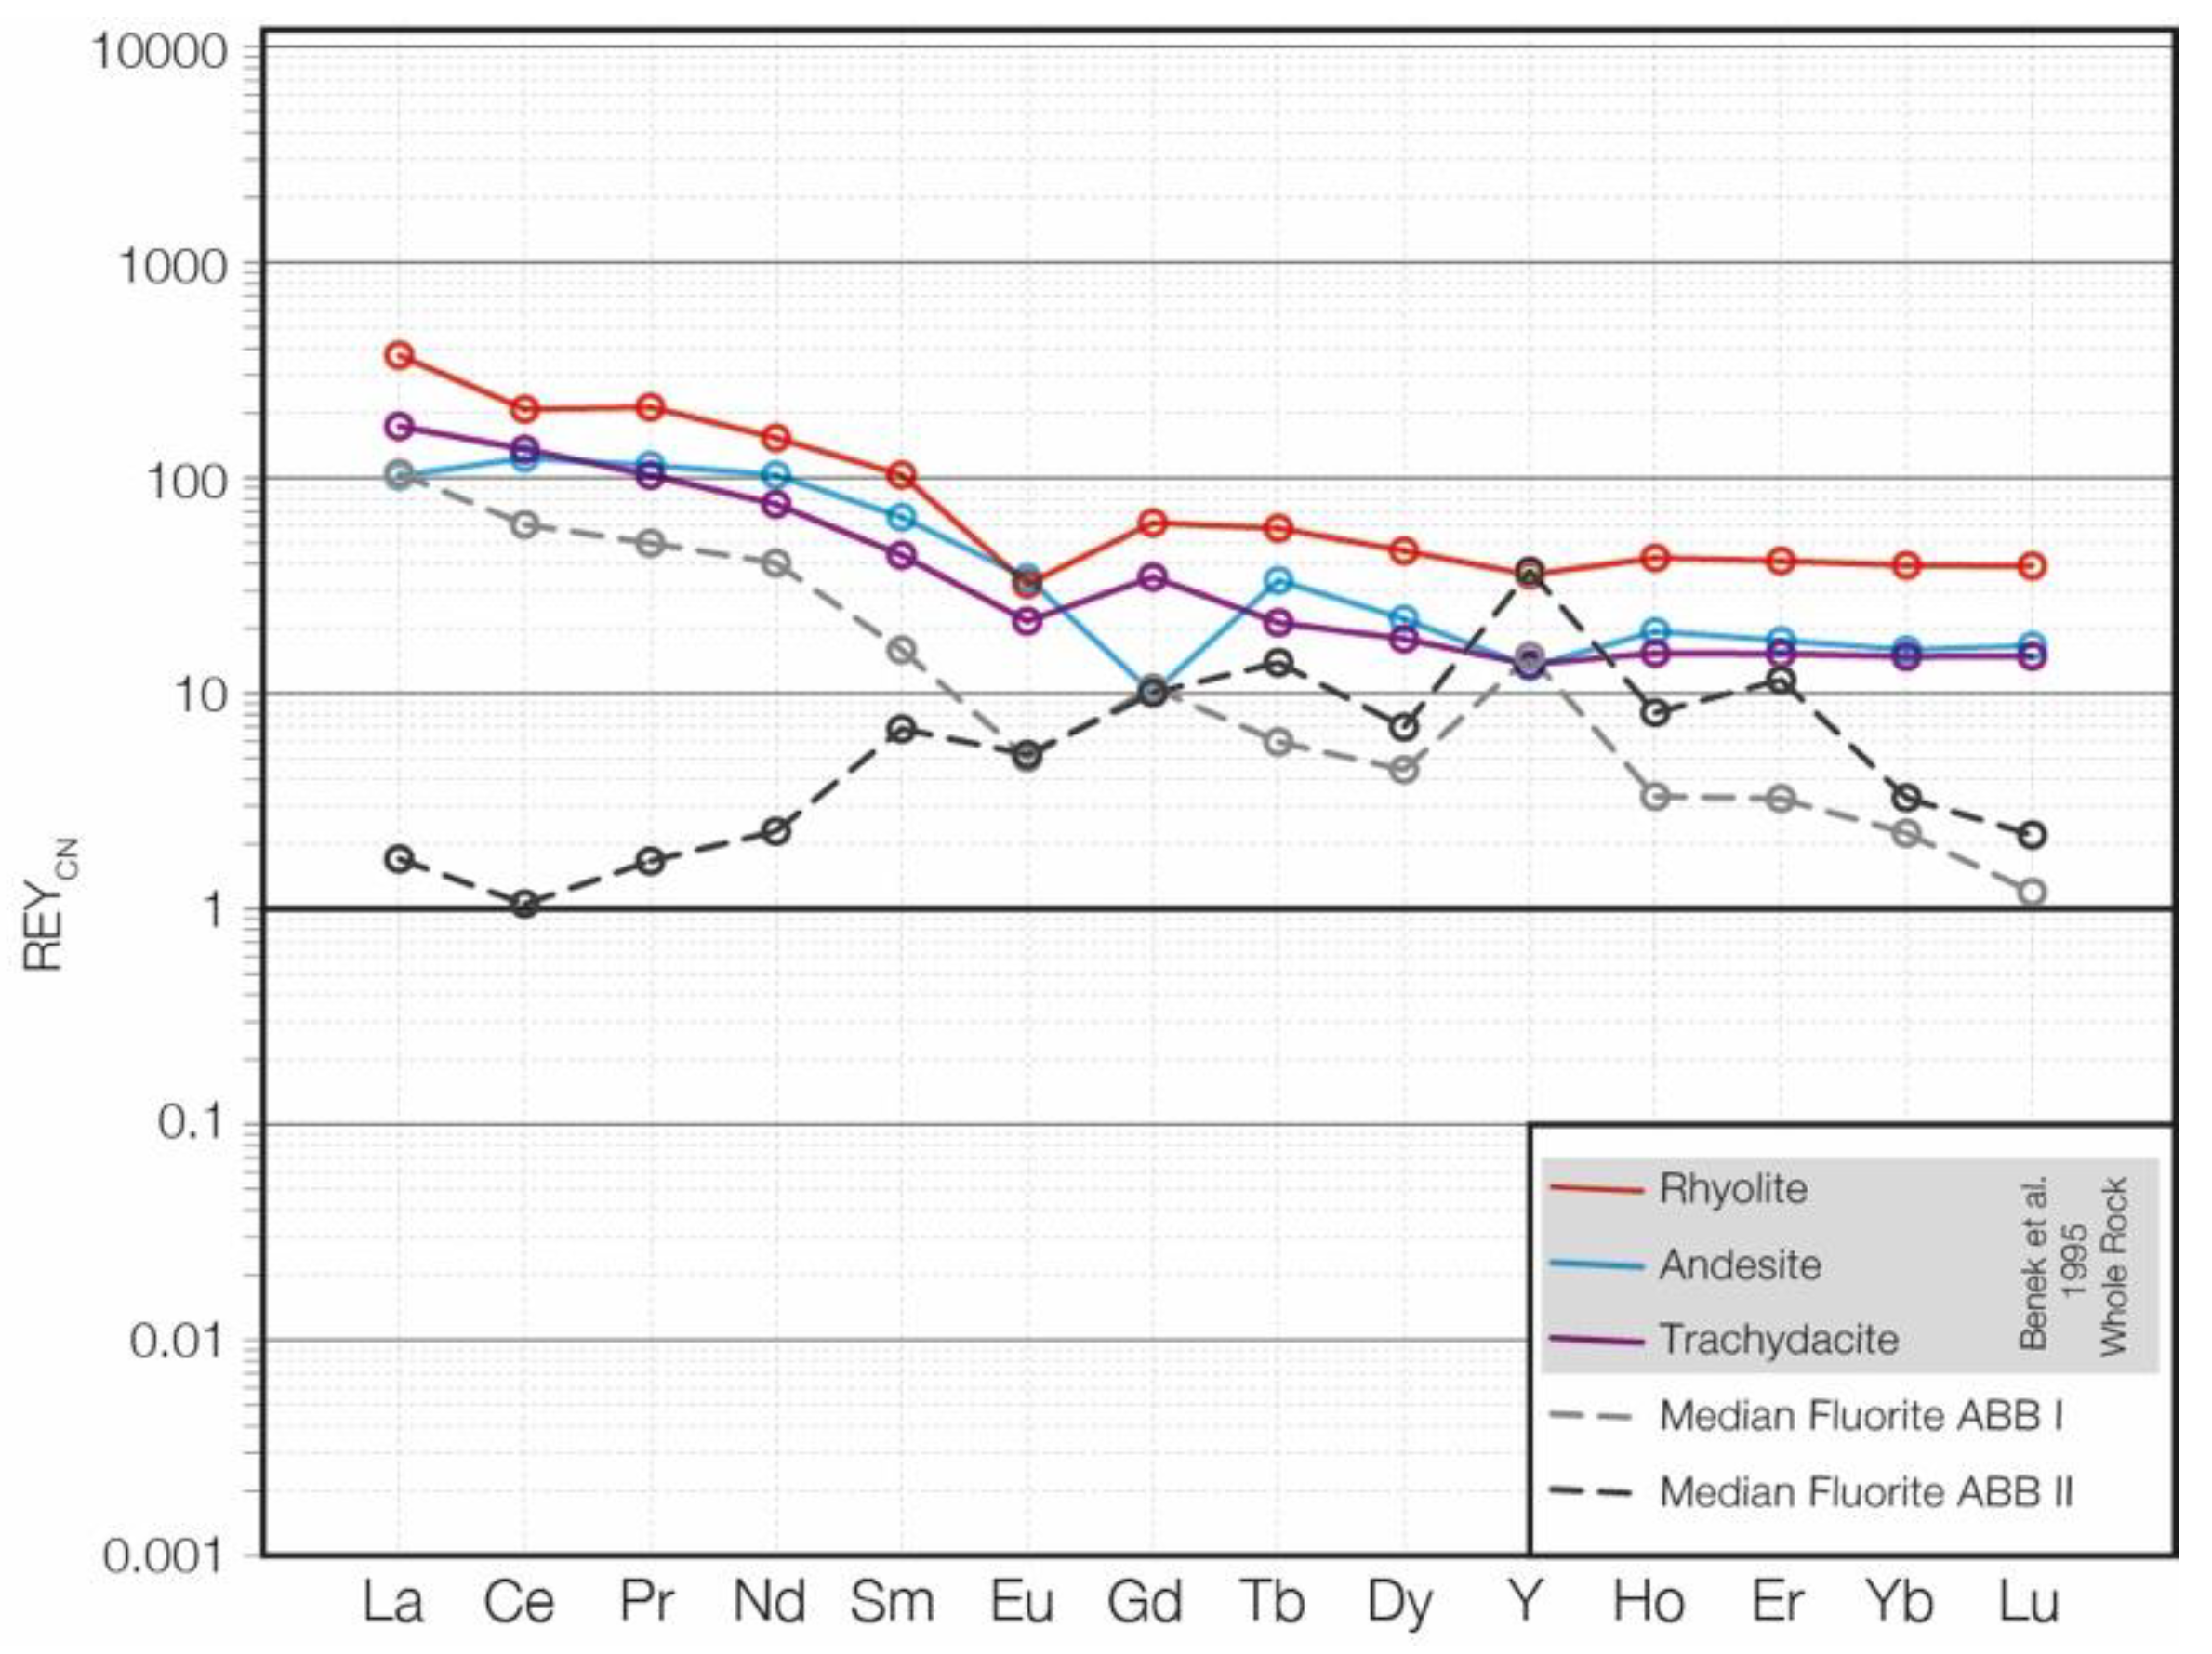
4.3.2. Rare Earth Elements and Yttrium (REY)

Similar to the overall minor and trace element contents the REY concentrations are low in comparison to fluorite from magmatic-hydrothermal settings. The median sum of REY ranges from 0.3 to 176 ppm. Despite these comparatively low concentrations, characteristic trends and patterns are evident in the REY signatures of fluorite from the different sample sites (Figure 5). While fluorite from the LSB shows a flat REYCN pattern (Figure 5d), fluorites from the ABB show two distinct REYCN patterns (Figure 5a–d). The two generations are labelled I and II in the corresponding spidergrams in Figure 5. Generation I is consistently enriched in LREE (La to Sm) and shows a significant depletion in the HREE compared to fluorite generation II (Figure 5a–d). These trends are particularly pronounced in fluorite from ABB Well A, B and C. Fluorite from Sohle 3 and 4 (Flechtingen High, FCB) show an almost identical signature with Sohle 4 corresponding to ABB generation I and Sohle 3 corresponding to ABB generation II. Due to a limited number of analyses the trend of LREE enrichment and HREE depletion in chondrite-normalized patterns is less pronounced but still visible in fluorite from ABB Well D (Figure 5d). Fluorite from ABB Well E displays a flat C1 chondrite-normalized signature and is overall quite similar to the signatures found in fluorite from the LSB (Figure 5d,e) which also correspond with previously published data by Duschl et al. [12]. Negative EuCN anomalies were also in some of the samples (ABB Well AI, CI, EI) but are not particularly pronounced. A pronounced positive YCN anomaly is present in most samples. However, fluorite from ABB Well DI, EI and LSB Well GI does not show this relative Y enrichment in the median concentrations. Fluorite from the Biwender Vein can be divided into two groups. Both show a similar shape, with a noticeable relative depletion in LREE (La-Nd) and HREE (Er-Lu), but differ in their relative REY concentrations, that is, BVI largely plotting above 10 and BVII plotting below 10 in the C1 chondrite-normalized spidergram (Figure 5g).
The whole rock (i.e., bulk drill core) REY data from the ABB and the LSB are shown for comparison in Figure 5. Both display a minor relative enrichment in LREE in comparison to HREE with the overall REY content in the ABB whole rock data being an order of magnitude higher than those detected in the LSB whole rock samples. A negative EuCN and a positive YCN anomaly is discernible in the ABB whole rock data. Note that the ABB REY whole rock range is very similar in overall ratio and shape to ABB fluorite type I.

5. Discussion

5.1. Fluorite Precipitation and the Fluorine Source

Fluorite in the deeply covered Paleozoic units of the NGB can be of sedimentary or hydrothermal origin. A syn-sedimentary formation of fluorite in the NGB has been ascribed by Möller et al. [25]. They also discussed the processes leading to the necessary enrichment of fluorine from marine waters to form fluorite. Seawater and marine pore waters are usually under saturated in F- and thus precipitation of fluorite is prevented in oxygenated seawater. Under these conditions the diagenetic formation of fluorite is linked to dolomite formation in calcareous sediments due to Mg2+ removal from pore fluids and consequent release of F due to break-up of MgF+ complexes [25]. Organic material e.g., [77,78], fresh water influx with elevated fluorine concentrations attributed to pegmatitic sources [79], or a volcanogenic source [80,81] have also been invoked to account for the required saturation to allow fluorite precipitation under diagenetic conditions. It is also possible that diagenetic fluorite may act as a precursor for later hydrothermal fluorite generations, that is, a remobilization of primary sedimentary fluorite yielded sufficient fluorine for the deposition of hydrothermal fluorite. Basinal brines that migrated through igneous units (i.e., thick successions of Rotliegend volcanics in the ABB and FCB) may also have acquired the necessary fluorine contents to achieve hydrothermal saturation and deposition along structurally controlled veins within the NGB. In the LSB zones of hydrothermal sulphide mineralization, specifically sphalerite and galena, have been documented in Zechstein carbonates by several authors i.e., [2,82,83,84]. Although researchers have argued about the possible sources of the mineralizing fluids and the style of mineralization (from magmatic to MVT) [82,85,86,87,88,89,90,91,92], recent studies have presented convincing evidence that structurally and thermochemical sulphate reduction (TSR)-controlled hydrothermal basinal brines led to the Pb-Zn mineralization and the associated fluorite-barite mineralization [2]—a model that can be equally applied to the hydrothermal fluorite mineralization in the ABB, although a different lithology (i.e., thick volcanic layers) translates into distinct variations compared to the LSB [14,93].

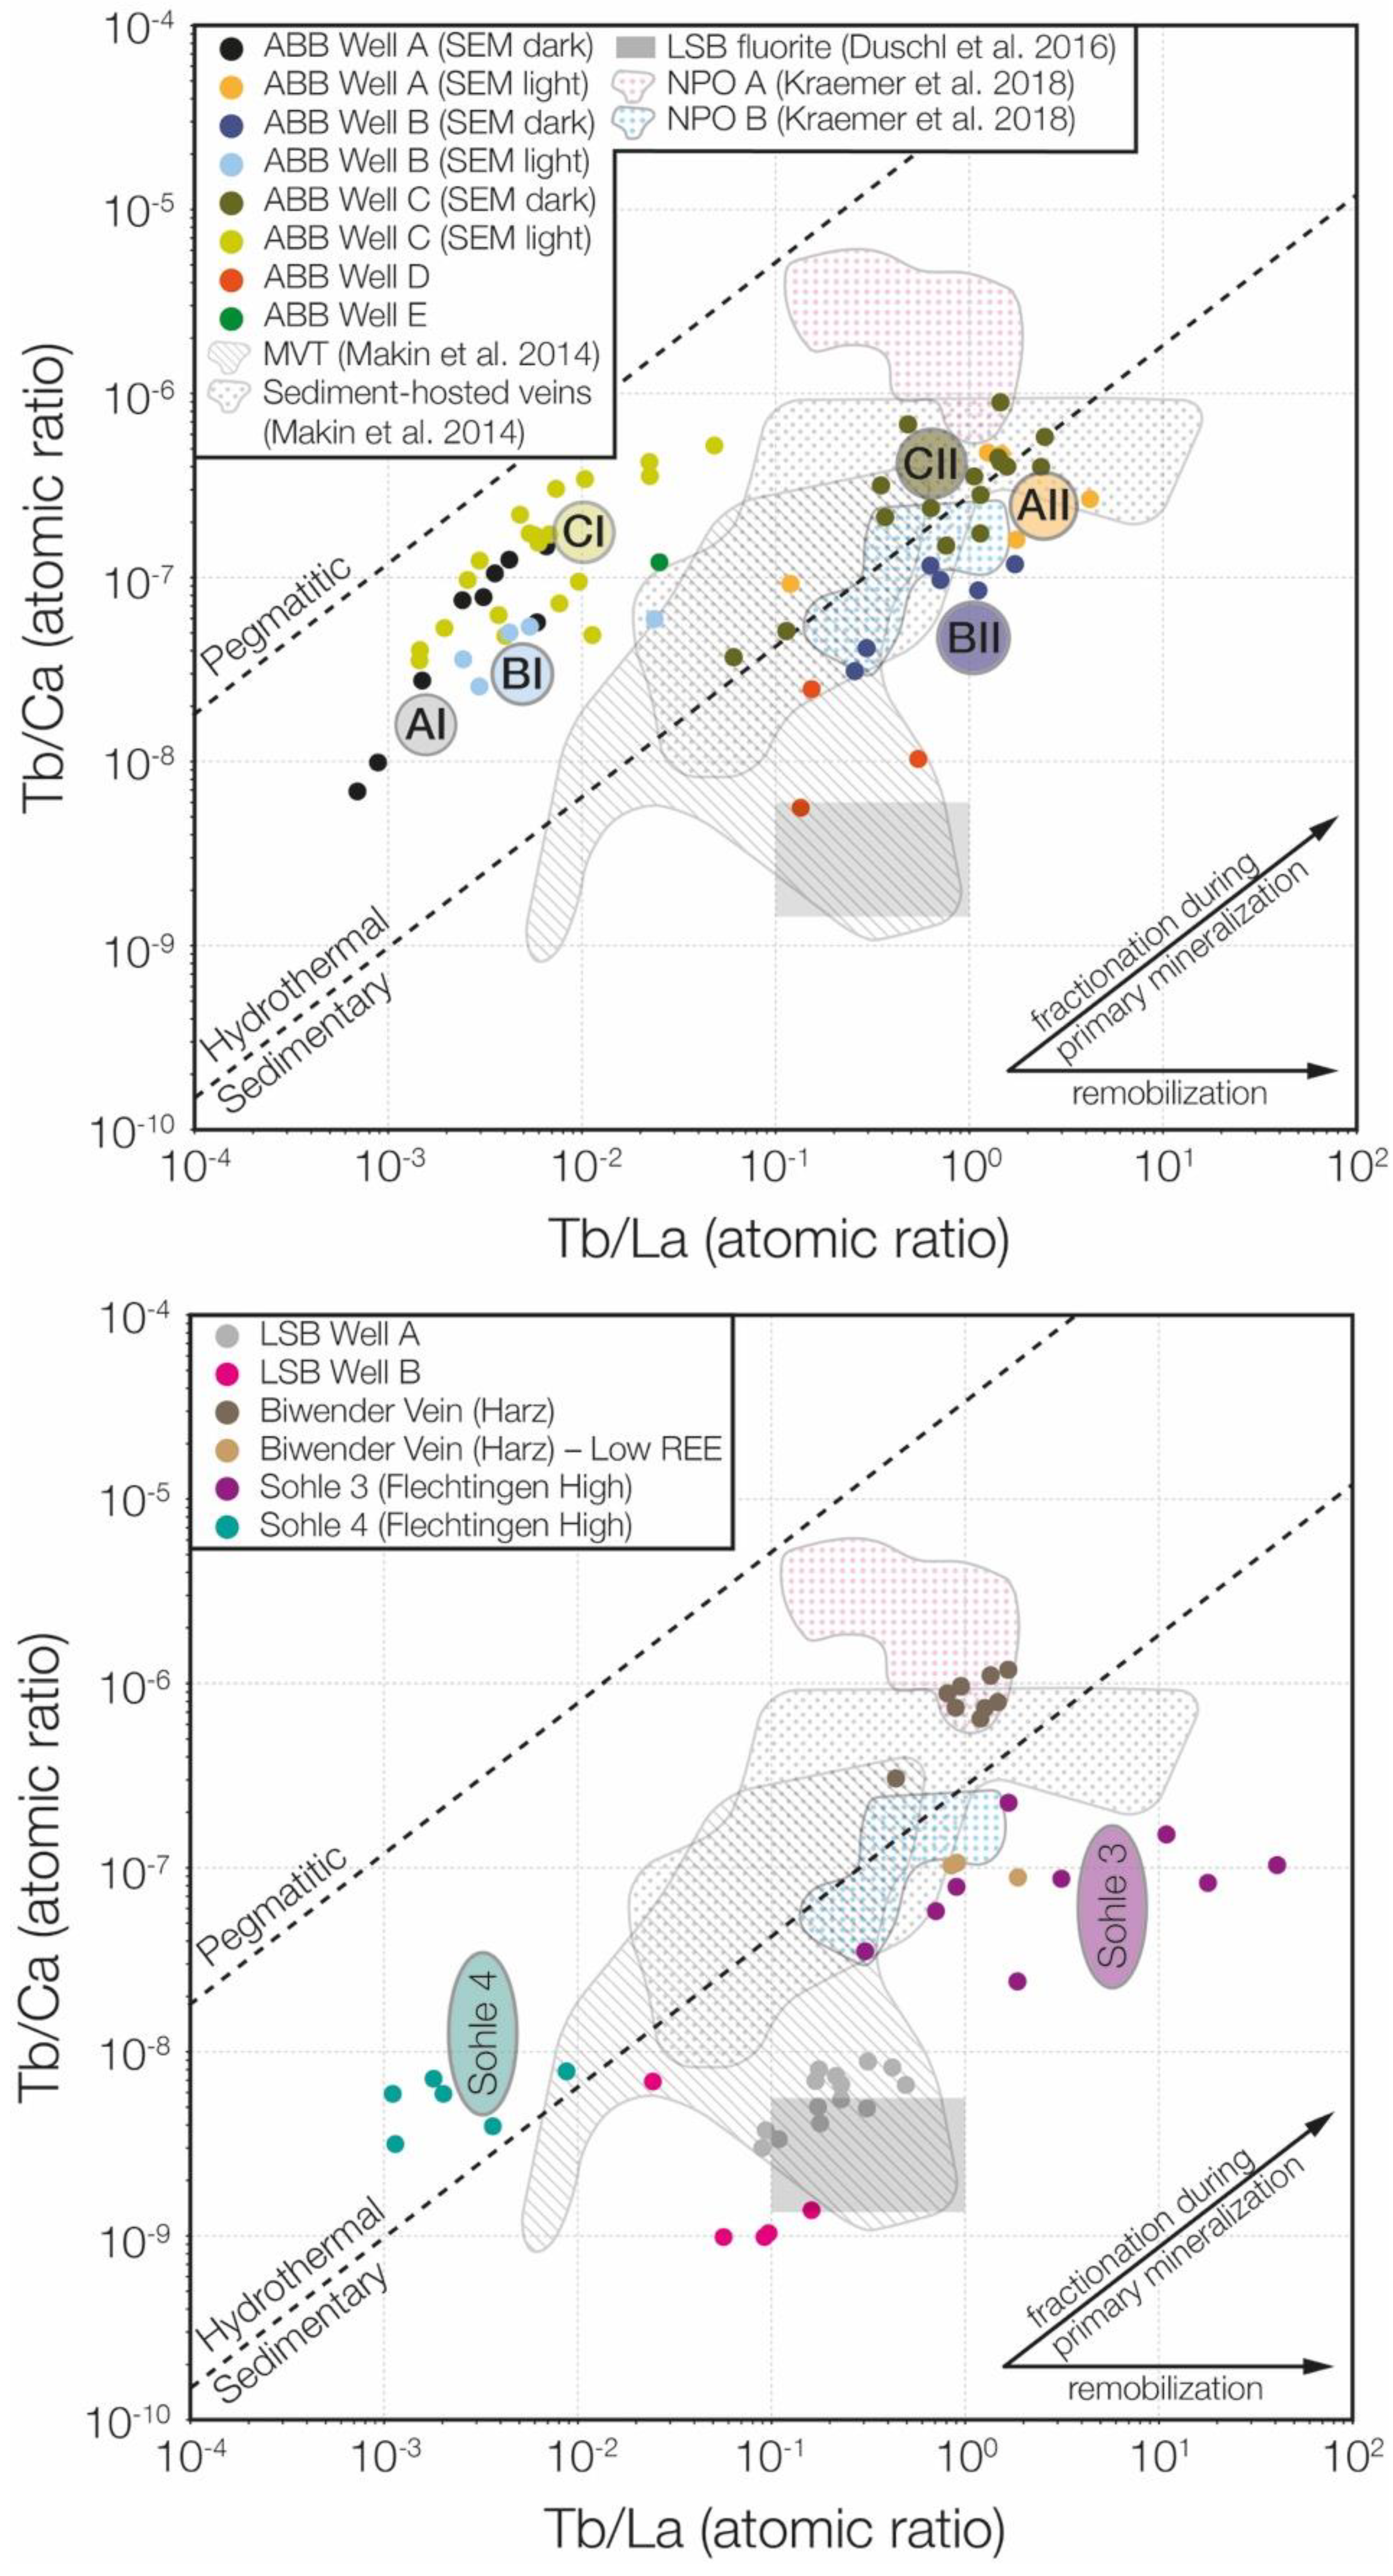
5.2. REY Composition and Systematics

In general, fluorites preserve or inherit the REY signature of the hydrothermal fluid from which they precipitated and hence offer an insight into the source of the REY in the hydrothermal fluid (i.e., intrusive or volcanic rocks) e.g., [36]). In particular in the ABB, where a suite of volcanogenic units of variable compositions [7] is part of the basin’s Paleozoic rock inventory, the possibility that percolating basinal brines migrated through these volcanic rocks along steep and deep-reaching faults [94] and picked up their distinct REY signature, including a typical negative Eu anomaly, is a plausible explanation for the observed REYCN signatures. Lüders et al. [12], for example, provide evidence from fluid inclusion investigations that indicated high water-rock interactions with Permian volcanic and sedimentary rocks in the ABB. However, a primary volcanogenic fluid source can be discarded for both the ABB and LSB [2,12,18,93]. The flat REYCN signature [95,96] and the overall low concentrations are strong indicators that basinal brines derived from marine water represent the mineralizing fluid in the LSB. A comparison of a selection of whole rock volcanic REYCN patterns with median ABB fluorite signatures is shown in Figure 6. The median fluorite ABB I signature displays a similar REYCN pattern to the whole rock volcanic rocks from the NEGB compiled by Benek et al. [7], with a relative enrichment of LREE. Particularly the rhyolite is a good match for the LREE to MREE. However, while the volcanics show a flat HREE pattern the fluorite ABB I generation displays a slight slope downwards toward the heavier HREE and a distinct positive peak for Y, which is missing entirely in the volcanics. Fluorite ABB II bears no similarities with the volcanic signatures, that is, is significantly depleted in LREE in comparison.
Many authors have suggested that fluoro-complexes as the primary means of REE transport and the deposition of fluorite [97,98]. However, Migdisov and William-Jones [99] presented experimental evidence that challenges this assumption. They argued that fluoro-complexes are in fact negligible for the hydrothermal transport of REE and that chloride- and sulphate-complexes are much more efficient at binding and transporting REE in hydrothermal fluorine-bearing fluids whereas fluoro-, carbonate-, and phosphate-complexes are important as depositional ligands [35]. Lee and Byrne [100,101] presented stability constants for chloro-complexes which exhibit a decrease from LREE to HREE in accordance with the trends observed in our data. Furthermore, Möller et al. [33] noted that LREE are more easily incorporated into fluorite due to their similar radii compared with Ca2+, leading to a preferential incorporation and a positive LREE anomaly in many early generation fluorites. Later generations consequently are relatively depleted in LREE if precipitated by the same fluid [33], especially if the REE are not bound in fluoro-complexes [102]. Following Möller’s interpretation, the fluorite populations in this study that show relatively lower LREE concentrations would therefore have to be considered as a later or secondary (remobilized) fluorite generation (II) compared to the fluorite (generation I) with relatively elevated LREE contents. However, adsorption, chemical complexation, changes in temperature and salinity can lead to highly localized variations in fluorite compositions including the REE [30,31,36,38], making it difficult to attribute different REE signatures to single controls. Moreover, our petrographic observations and characteristic growth patterns detailed in Section 4.2 and Section 5.3 strongly suggest that both fluorite generations formed during one hydrothermal event and reflect micro-scale adsorption features and thermodynamic and compositional variations of the precipitating fluid. Schwinn and Markl [36] proposed that relative LREE enrichment in the outer zones of fluorite crystals may represent a sub-micron LREE-enriched phase or can be attributed to LREE clustering in later, cooler fluids. However, adsorption favours HREE, whereas LREE are more easily held in solution by chemical complexation [32,100,101]. Diffusive processes are highly unlikely to have contributed to compositional variations—as primary sector zoning and oscillatory zonings are preserved [37]—especially at the low formation temperatures (<~250 °C) observed in the ABB and LSB.
Several trends are evident in the chondrite-normalized REYCN spidergrams in Figure 5. The elevated REY concentrations observed in fluorites from the ABB, the FCB and the Harz mountains provide evidence that they were formed from fluids that differed significantly from those in the LSB. Variations in complexation behaviour/chemistry and fluid-rock interaction may also have led to the distinctly different REYCN patterns, that is, a carbonate buffered system in the Permian shelf-carbonate dominated LSB versus Paleozoic volcanics and siliciclastic sedimentary rocks in the ABB, FCB and Harz. The minor but noticeable EuCN anomalies in our samples could be due to (a) an inherited signature that reflects the source REE (i.e., Rotliegend volcanics, Figure 6) e.g., [98], (b) adsorption features and crystallographic controls (see Section 5.3), (c) strongly reducing and or oxidizing conditions, or temperatures above 200 °C—thermochemical reduction of Eu3+ to incompatible Eu2+ [30,36,38], (d) analytical fractionation or bias due to the poor ablation behaviour of fluorite, or (e) a feature induced by the C1 chondrite normalization (i.e, seawater would also display a negative Eu anomaly when normalized to C1 chondrite). Option (c) is unlikely because there is no evidence for these conditions in the literature or in our investigation. Option (d) can be largely ruled-out because that fractionation should be consistent and affect all analyses, which is not the case.
The fluorite samples from the ABB and the Flechtingen High show a pronounced compositional variation between generation I and II, which corresponds to petrographic observations in the corresponding thin sections and polished mounts. Fluorite generation I (light under SEM) exhibits a trend that matches the whole rock composition (ABB whole rock REE). Fluorite generation II (dark under SEM) has distinctly lower LREE concentrations and aligns in terms of the overall trend with the hydrothermal vein fluorite from the Biwender Vein (Harz). These trends could be the result of a remobilization process accompanied by significant fluid/rock interaction with the surrounding sedimentary rocks or reflect physicochemical variations and intrinsic crystallographic controls within a single mineralizing event.

5.3. Remobilization versus Cyclical Growth or Sectoral Zoning

Cathodoluminescence and BSE images of hydrothermal fluorites (Figure 3) from the investigated areas reveal several prominent zoning features visualized as colour contrasts. Different types of growth zoning, mainly concentric and sectoral zoning, are illustrated and discussed further in Figure 7. As demonstrated by Marshall [72], CL in hydrothermal fluorite is mostly activated by intrinsic effects, that is, the incorporation of impurity atoms such as REE or trace elements such as Pb, Mn, Fe, Sr, and Y. Selective incorporation of foreign cations, above all REY, into the fluorite crystal lattice depending on crystal habits, and therefore effects of the surface free energy of specific crystal faces exposed to the hydrothermal fluid during precipitation, has been explained in detail by Bosze and Rakovan [40] and Rakovan [103]. These authors showed how this process is responsible for the fractionation of REE and trace elements during crystal growth, which may explain the significant differences in REE contents, especially LREE, found within individual fluorite crystals (i.e., generation I and II) of our samples. Type and quantity of incorporated cations that substitute for Ca2+ in the crystal lattice depend on ionic charge and radius, element availability in the fluid, as well as the crystal morphology (e.g., octahedron, rhombic dodecahedron, cube etc.) (Figure 8). Crystal habits of hydrothermal fluorite and its variation during growth, however, may be a function of formation temperature and pH/Eh conditions [23,39,104]. Thus, the application of the Tb/Ca-Tb/La diagram [33] (Figure 9), which is widely used to distinguish between different parental fluids is problematic in cases where bulk analyses of fluorite are considered for genetic ore interpretation. Remobilization leads to an increasing Tb/La ratio by maintaining the same Tb/Ca ratio [29,33] and is a common feature in sedimentary and hydrothermal fluorite-bearing deposits e.g., [41]. However, this assumes a dominant complexation by F-ions which will keep HREE in solution during migration. The Tb/La versus Tb/Ca plot in Figure 9 illustrates that both fractionation during crystallization and remobilization trends are evident in the fluorite samples from the ABB, LSB, and Flechtingen High—if we consider the initial statement to be valid. For example, the distribution of ABB Well C (light) shows a spread parallel to the fractionation trend proposed by Möller et al. [33]. Following this interpretation ABB Well A and C (light) and Flechtingen High Sohle 4 can be considered to represent the first fluorite stage. ABB Well A and C (dark) and Flechtingen High Sohle 3 appear to be a remobilization product of this first fluorite generation respectively.
The same trends can be observed in sample ABB Well B where a light and dark variety (SEM shades) was detected (Section 4.2). The LSB fluorites have low Tb/Ca ratios and moderate Tb/La ratios which places them in the sedimentary field. LSB Well A shows a data spread that is interpreted as a fractionation trend but none of the LSB fluorites seem to exhibit a remobilization trend that is evident in the Tb/La versus Tb/Ca plot. Both LSB fluorite samples plot close to fluorite measured by Duschl et al. [11] who also investigated fluorite in the LSB. Fluorite samples from the Biwender Vein (Harz) plot in the same area as the generation II ABB fluorite.
A remobilization or recrystallization trend is also apparent in the La/Ho versus Y/Ho plot in Figure 10. All fluorite samples show two distinct generations (I and II) that follow a remobilization trend [31]. Y/Ho ratios remain constant whereas La/Ho ratios decrease during remobilization.
Schwinn and Markl [36] pointed out that petrographically late fluorite from several of their investigated deposits display geochemical characteristics that reflect new fluid influx rather than remobilization. However, they also acknowledged that variable degrees of supersaturation and fluid/fluorite ratios as well as fluid flux lead to a complex precipitation process that reflects these variable conditions. Hence, a rapid, pulsed crystallization on a micro-scale may display similar features to those seen when new (or later) fluids enter the system.
Under certain conditions it is possible to produce two geochemically distinct types of fluorite from one and the same parental fluid within the same crystal (even without remobilization), in particular with regard to REE and trace elements. When sorption effects along crystal growth surfaces are responsible for impurity atom incorporation, crystal morphology during a specific growth event will control the type and amount of the respective impurity adsorption (Figure 7 and Figure 8). As shown by Dill and Weber [23], among others, fluorite morphology locally strongly depends on fluid temperatures and hence fluid viscosity. For example, if |100| planes of cubic fluorites favour the incorporation of LREEs and yet cubic fluorite is more likely to form at relatively low temperatures, fluorite precipitation at low ambient temperatures will result in fluorite with low LREE concentration. Conversely, higher temperatures will produce octahedral fluorite crystals with comparatively higher LREE concentrations, regardless of the REE content provided by the parental hydrothermal fluid (as long as REEs are present). Since transformation from octahedral to cubic fluorite is a continuous process both fluorite types can coexist (see Figure 3 and Figure 7). Fluctuations in temperature may then cause complex fir tree-type patterns as shown in Figure 7G.
In our samples, a possible third generation of fluorite is evident in the CL images (Figure 3E) as a dark, thin rim surrounding fluorite generation I and II along grain boundaries. The dark CL colour is thought to be attributed to high Sr contents which are concentrated in the residual fluid until it falls out as the last phase. At this stage, we do not have the analytical evidence to back this claim because this third generation eludes the spatial resolution of the applied analytical techniques.

6. Conclusions

Fluorites from the different investigated areas show characteristic petrographic features such as zoned growth, cyclical zoning and other complex zoning structures (i.e., fir tree structures). Petrographically discernible zones can also be discriminated geochemically and show signatures that suggest two (or more) distinct fluorite generations. Hereby, fluorite from the ABB and the FCB display REYCN patterns that invoke a similar fluid source and formation conditions (i.e., basinal brines that interacted with Lower Permian volcanic rocks at similar temperatures), whereas fluorite from the LSB display flat REYCN signatures, comparable to the LSB whole rock patterns, that point to basinal brines derived from marine waters (pore waters) with no volcanic component (primary magmatic or through fluid-rock interaction) as the mineralizing fluids. A primary hydrothermal mineralization and a secondary remobilization geochemical signature is apparent in the frequently used Tb/La versus Tb/Ca and La/Ho versus Y/Ho discrimination diagrams for fluorite from the ABB and FCB. Our investigation suggests that the same trends are the result of zoned growth during a single mineralizing event rather than representing remobilization (i.e., secondary processes). This has implications for the interpretation of such trends and hence the inferred genetic evolution of fluorite that displays such geochemical patterns. The complex micro-scale intergrowth of these generations stresses the need for detailed petrographic investigations when geochemical data are collected and interpreted.

Author Contributions

For research articles with several authors, a short paragraph specifying their individual contributions must be provided. The following statements should be used “Conceptualization, P.N. and R.K.; Methodology, P.N., F.D. and M.R.; Validation, P.N., M.R. and F.D.; Formal Analysis, P.N., F.D. and M.R.; Investigation, P.N., M.R., F.D. and D.K.; Resources, R.K. and P.N.; Data Curation, P.N., M.R., F.D., D.K. and M.S.; Writing-Original Draft Preparation, P.N., M.R., F.D., D.K. and M.S.; Writing-Review & Editing, P.N., M.R., F.D., R.K., D.K. and M.S.; Visualization, P.N., F.D., D.K. and M.R.; Supervision, P.N. and R.K.; Project Administration, P.N. and R.K.; Funding Acquisition, R.K.”

Funding

This research was funded by the German Ministry for Eductaion and Research (BMBF), grant number [033R165].

Acknowledgments

We thank Exxon Mobile, Engie and Wintershall for access to their drill cores, and Norddeutsche Naturstein GmbH for access to the Flechtingen quarry. The authors also thank Helene Brätz for in-house LA-ICP-MS measurements and data integration. Three anonymous reviewers helped to improve the original manuscript greatly and we very much appreciate their comments and suggestions.

Conflicts of Interest

The authors declare no conflict of interest. The funders had no role in the design of the study; in the collection, analyses, or interpretation of data; in the writing of the manuscript, and in the decision to publish the results.

References

  1. Sośnicka, M.; Lüders, V. TSR-controlled Zn-Pb mineralization in Zechstein carbonate (Ca2) in the Lower Saxony Basin, Germany. In Proceedings of the ECROFI 2017 Biennial Meeting, Nancy, France, 23–29 June 2017. [Google Scholar]
  2. Sośnicka, M.; Lüders, V. Super-deep, TSR-controlled Phanerozoic MVT type Zn-Pb deposits hosted by Zechsetin reservoir carbonate, Lower Saxony Basin, Germany. Chem. Geol. 2018, in press. [Google Scholar]
  3. Knorsch, M.; Nadoll, P.; Klemd, R. Base metal sulphides in Zechstein sediments of the North German Basin-Indications for an unknown Mississippi Valley-type deposit? Miner. Depos. 2018, in press. [Google Scholar]
  4. Scheck, M.; Bayer, U. Evolution of the Northeast German Basin—Inferences from a 3D structural model and subsidence analysis. Tectonophysics 1999, 313, 145–169. [Google Scholar] [CrossRef]
  5. Betz, D.; Führer, F.; Greiner, G.; Plein, E. Evolution of the Lower Saxony Basin. Tectonophysics 1987, 137, 127–170. [Google Scholar] [CrossRef]
  6. Baldschuhn, R.; Best, G.; Kockel, F. Inversion tectonics in the north-west German basin. In Generation, Accumulation, and Production of Europe’s Hydrocarbons; Special Publication of the European Association of Petroleum No. 1; Spencer, A.M., Ed.; Oxford University Press: Oxford, UK, 1991; pp. 149–159. [Google Scholar]
  7. Benek, R.; Kramer, W.; McCann, T.; Scheck, M.; Negendank, J.F.W.; Korich, D.; Huebscher, H.D.; Bayer, U. Permo-Carboniferous magmatism of the Northeast German Basin. Tectonophysics 1996, 266, 379–404. [Google Scholar] [CrossRef]
  8. Muchez, P.; Heijlen, W. Origin and migration of fluids during the evolution of sedimentary basins and the origin of ZnPb deposits in Western and Central Europe. J. Geochem. Explor. 2003, 78, 553–557. [Google Scholar] [CrossRef]
  9. Littke, R.; Bayer, U.; Gajewski, D.; Nelskamp, S. Dynamics of Complex Intracontinental Basins; Springer: Berlin, Germany, 2008; p. 519. [Google Scholar]
  10. Stollhofen, H.; Bachmann, G.H.; Barnasch, J.; Bayer, U.; Beutler, G.; Franz, M.; Kästner, M.; Legler, B.; Mutterlose, J.; Radies, D. Upper Rotliegend to Early Cretaceous basin development. In Dynamics of Complex Intracontinental Basins: The Example of the Central European Basin System; Littke, R., Bayer, U., Gajewski, D., Nelskamp, S., Eds.; Springer: Berlin, Germany, 2008; pp. 181–210. [Google Scholar]
  11. Duschl, F.; van den Kerkhof, A.; Sosa, G.; Leiss, B.; Wiegand, B.; Vollbrecht, A.; Sauter, M. Fluid inclusion and microfabric studies on Zechstein carbonates (Ca2) and related fracture mineralizations: New insights on gas migration in the Lower Saxony Basin (Germany). Mar. Pet. Geol. 2016, 77, 300–322. [Google Scholar] [CrossRef]
  12. Lüders, V.; Reutel, C.; Hoth, P.; Banks, D.A.; Mingram, B.; Pettke, T. Fluid and gas migration in the North German Basin: Fluid inclusion and serror isotope constraints. Int. J. Sci. 2005, 94, 990–1009. [Google Scholar] [CrossRef]
  13. Schmidt Mumm, A.; Wolfgramm, M. Stable isotope relationships of mineralisation in the North Eastern German Basin. J. Geochem. Explor. 2003, 78, 261–265. [Google Scholar] [CrossRef]
  14. Schmidt Mumm, A.; Wolfgramm, M. Fluid systems and mineralization in the north German Basin. Geofluids 2004, 4, 315–328. [Google Scholar] [CrossRef]
  15. Wolfgramm, M.; Schmidt Mumm, A. Spatial correlation of fluid inclusion generations: Reconstructing fluid flow during basin evolution. J. Geochem. Explor. 2000, 69, 397–402. [Google Scholar] [CrossRef]
  16. Möller, P.; Lüders, V.; De Lucia, M. Formation of Rotliegend Ca-Cl brines in the North German Basin compared to analogues in the geological record. Chem. Geol. 2017, 459, 32–42. [Google Scholar] [CrossRef] [Green Version]
  17. Stedingk, K.; Ehling, B.-C. Gangmineralisationen im NE-Rhenoherzynikum—Ein strukturgeologisch-paragenetischer Uberblick. Vein mineralizations in the northeastern Rhenohercynian Belt—Structural aspects and parageneses. Zentralblatt zur Geologie und Paläontologie 1995, 9, 1307–1327. (In German) [Google Scholar]
  18. Möller, P.; Lüders, V. Formation of Hydrothermal Vein Deposits: A Case Study of the Pb-Zn, Barite and Fluorite Deposits of the Harz Mountains; Gebrüder Borntraeger: Berlin, Germany, 1993; Volume 30, p. 291. [Google Scholar]
  19. Liessmann, W. Historischer Bergbau im Harz; Springer: Berlin, Germany, 2010. (In German) [Google Scholar]
  20. Goff, B.H.; Weinberg, R.; Groves, D.I.; Vielreicher, N.M.; Fourie, P.J. The giant Vergenoeg fluorite deposit in a magnetite-fluorite-fayalite REE pipe: A hydrothermally-altered carbonatite-related pegmatoid? Miner. Pet. 2004, 80, 173–199. [Google Scholar] [CrossRef]
  21. Bouch, J.E.; Naden, J.; Shepherd, T.J.; McKervey, J.A.; Young, B.; Benham, A.J.; Sloane, H.J. Direct evidence of fluid mixing in the formation of stratabound Pb–Zn–Ba–F mineralisation in the Alston Block, North Pennine Orefield (England). Miner. Depos. 2006, 41, 821–835. [Google Scholar] [CrossRef] [Green Version]
  22. Cann, J.; Banks, D. Constraints on the genesis of the mineralization of the Alston Block, Northern Pennine Orefield, northern England. Proc. Yorks. Geol. Soc. 2001, 53, 187–196. [Google Scholar] [CrossRef]
  23. Dill, H.G.; Weber, B. Variation of color, structure and morphology of fluorite and the origin of the hydrothermal F-Ba deposits at Nabburg-Wölsendorf, SE Germany. J. Mineral. Geochem. 2010, 187, 113–132. [Google Scholar] [CrossRef]
  24. Richardson, C.K.; Holland, H.D. Fluorite deposition in hydrothermal systems. Geochim. Cosmochim. Acta 1979, 43, 1327–1335. [Google Scholar] [CrossRef]
  25. Möller, P.; Schulz, S.; Jacob, K.H. Formation of fluorite in sedimentary basins. Chem. Geol. 1980, 31, 97–117. [Google Scholar] [CrossRef]
  26. Eppinger, R.G. Trace Element and Rare Earth Element Variation in Fluorites Collected from Skarn and Epithermal Mineral Deposits in the Sierra Cuchillo Area, South-Central New Mexico; U.S. Geological Survey: Denver, CO, USA, 1988; p. 108. [Google Scholar]
  27. Eppinger, R.G.; Closs, L.G. Variation of trace elements and rare earth elements in fluorite; a possible tool for exploration. Econ. Geol. 1990, 85, 1896–1907. [Google Scholar] [CrossRef]
  28. Makin, S.A.; Simandl, G.J.; Marshall, D. Fluorite and its potential as an indicator mineral for carbonatite-related rare earth element deposits. In Geological Fieldwork 2013; British Columbia Geological Survey Paper 2014-1; British Columbia Ministry of Energy and Mines: Victoria, BC, Canada, 2013; pp. 207–212. [Google Scholar]
  29. Mao, M.; Simandl, G.J.; Spence, J.; Marshall, D. Fluorite trace-element chemistry and its potential as an indicator mineral: Evaluation of LA-ICP-MS method. In Symposium on Strategic and Critical Materials Proceedings, November 13–14, 2015, Victoria, British Columbia; British Columbia Geological Survey; Simandl, G.J., Neetz, M., Eds.; British Columbia Ministry of Energy and Mines: Victoria, BC, Canada, 2015; pp. 251–264. [Google Scholar]
  30. Bau, M. Rare-earth element mobility during hydrothermal and metamorphic fluid-rock interaction and the significance of the oxidation state of europium. Chem. Geol. 1991, 93, 219–230. [Google Scholar] [CrossRef]
  31. Bau, M.; Dulski, P. Comparative study of yttrium and rare-earth element behaviours in fluorine-rich hydrothermal fluids. Contrib. Miner. Pet. 1995, 119, 213–223. [Google Scholar] [CrossRef]
  32. Bau, M.; Romer, R.L.; Lüders, V.; Dulski, P. Tracing element sources of hydrothermal mineral deposits: REE and Y distribution and Sr-Nd-Pb isotopes in fluorite from MVT deposits in the Pennine Orefield, England. Miner. Depos. 2003, 38, 992–1008. [Google Scholar] [CrossRef]
  33. Möller, P.; Parekh, P.P.; Schneider, H.-J. The application of Tb/Ca-Tb/La abundance ratios to problems of fluorspar genesis. Miner. Depos. 1976, 11, 111–116. [Google Scholar] [CrossRef]
  34. Makin, S.A. Developing Fluorite as a Geochemical Pathfinder Mineral Using Globally Reported REE-Y Contents. Ph.D. Thesis, Simon Fraser University, Burnaby, BC, Canada, 2017. [Google Scholar]
  35. Migdisov, A.; Williams-Jones, A.E.; Brugger, J.; Caporuscio, F.A. Hydrothermal transport, deposition, and fractionation of the REE: Experimental data and thermodynamic calculations. Chem. Geol. 2016, 439, 13–42. [Google Scholar] [CrossRef]
  36. Schwinn, G.; Markl, G. REE systematics in hydrothermal fluorite. Chem. Geol. 2005, 216, 225–248. [Google Scholar] [CrossRef]
  37. Cherniak, D.J.; Zhang, X.Y.; Wayne, N.K.; Watson, E.B. Sr, Y, and REE diffusion in fluorite. Chem. Geol. 2001, 181, 99–111. [Google Scholar] [CrossRef]
  38. Möller, P.; Bau, M.; Dulski, P.; Lüders, V. REE and yttrium fractionation in fluorite and their bearing on fluorite formation. In Proceedings of the Ninth Quadrennial IAGOD Symposium; Hagni, R.D., Ed.; Schweizerbart: Stuttgart, Germany, 1998; pp. 575–592. [Google Scholar]
  39. Zidarova, B. Formation temperature, REE contents and optical spectra of fluorite from the Mikhalkovo deposit (Central Rhodopes, Bulgaria): Genetic implications and practical significance. J. Mineral. Geochem. 2011, 188, 257–283. [Google Scholar] [CrossRef]
  40. Bosze, S.; Rakovan, J. Surface-structure-controlled sectoral zoning of the rare earth elements in fluorite from Long Lake, New York, and Bingham, New Mexico, USA. Geochim. Cosmochim. Acta 2002, 66, 997–1009. [Google Scholar] [CrossRef]
  41. Möller, P.; Dulski, P.; Morteani, G. Partitioning of rare earth elements, yttrium, and some major elements among source rocks, liquid and vapor of Larderello-Travale geothermal field, Tuscany (Central Italy). Geochim. Cosmochim. Acta 2003, 67, 171–183. [Google Scholar] [CrossRef]
  42. Lüders, V.; Gerler, J.; Hein, U.F.; Reutel, C. Chemical and thermal development of ore-forming solutions in the Harz Mountains: A summary of fluid inclusion studies. In Formation of Hydrothermal Vein Deposits. A Case Study of the Pb-Zn, Barite and Fluorite Deposits of the Harz Mountains; Möller, P., Lüders, V., Eds.; Gebrüder Borntraeger: Berlin, Germany, 1993; Volume 30, pp. 117–132. [Google Scholar]
  43. Kraemer, D.; Viehmann, S.; Banks, D.; Sumonduur, A.D.; Koeberl, C.; Bau, M. Regional variations in fluid formation and metal sources in MVT mineralization in the Pennine Orefield, UK: Implications from rare earth element and yttrium distribution, Sr-Nd isotopes and fluid inclusion compositions of hydrothermal vein fluorites. Mine. Depos. 2018, in press. [Google Scholar]
  44. Bill, H.; Calas, G. Color centers, associated rare-earth ions and the origin of coloration in natural fluorites. Phys. Chem. Miner. 1978, 3, 117–131. [Google Scholar] [CrossRef]
  45. Deng, X.-H.; Chen, Y.-J.; Yao, J.-M.; Bagas, L.; Tang, H.-S. Fluorite REE-Y (REY) geochemistry of the ca. 850 Ma Tumen molybdenite–fluorite deposit, eastern Qinling, China: Constraints on ore genesis. Ore Geol. Rev. 2014, 63, 532–543. [Google Scholar] [CrossRef]
  46. Gagnon, J.E.; Samson, I.M.; Fryer, B.J.; Williams-Jones, A.E. Compositional heterogeneity in fluorite and the genesis of fluorite deposits: Insights from LA-ICP-MS analysis. Can. Miner. 2003, 41, 365–382. [Google Scholar] [CrossRef]
  47. Deer, W.A.; Howie, R.A.; Zussman, J. An Introduction to the Rock-Forming Minerals; Mineralogical Society: London, UK, 2013; p. 495. [Google Scholar]
  48. Maystrenko, Y.; Bayer, U.; Brink, H.J.; Littke, R. The Central European Basin System—An Overview. In Dynamics of Complex Intracontinental Basins; Littke, R., Bayer, U., Gajewski, D., Nelskamp, S., Eds.; Springer: Berlin, Germany, 2008; pp. 15–34. [Google Scholar]
  49. Van Wees, J.D.; Stephenson, R.A.; Ziegler, P.A.; Bayer, U.; McCann, T.; Dadlez, R.; Gaupp, R.; Narkiewicz, M.; Bitzer, F.; Scheck, M. On the origin of the Southern Permian Basin, Central Europe. Mar. Pet. Geol. 2000, 17, 43–59. [Google Scholar] [CrossRef]
  50. Hübscher, C.; Hansen, M.B.; Triñanes, S.P.; Lykke-Andersen, H.; Gajewski, D. Structure and evolution of the Northeastern German Basin and its transition onto the Baltic Shield. Mar. Pet. Geol. 2010, 27, 923–938. [Google Scholar] [CrossRef]
  51. Gast, R.; Pasternak, M.; Piske, J.; Rasch, H.-J. Das Rotliegend im Nordostdeutschen Raum, Stratigraphie, Fazies und Diagenese. J. Geotherm Bundesverband 1998, 149, 59–79. [Google Scholar]
  52. Stedingk, K.; Ehling, B.-C.; Knoth, W.; Germann, K.; Schwab, M. Epigenetic mineralizing processes in the Northeastern Rhenohercynian Belt (Harz Mountains, Flechtingen-Rosslau Block). In Society for Geology Applied to Mineral Deposits: Mineral Deposits; From Their Origin to Their Environmental Impacts; A A Balkema: Prague, Czech Republic, 1995; pp. 79–82. [Google Scholar]
  53. Ziegler, P.A. Geology and hydrocarbon provinces of the North Sea. GeoJournal 1977, 1, 7–32. [Google Scholar] [CrossRef]
  54. Boigk, H. Erdöl und Erdölgas in der Bundesrepublik Deutschland; Enke: Stuttgart, Germany, 1981; p. 330. [Google Scholar]
  55. Doornenbal, H.; Stevenson, A. Petroleum Geological Atlas of the Southern Permian Basin Area; EAGE Publ: Houten, The Netherlands, 2010; p. 342. [Google Scholar]
  56. Lüders, V.; Plessen, B.; di Primio, R. Stable carbon isotopic ratios of CH4–CO2-bearing fluid inclusions in fracture-fill mineralization from the Lower Saxony Basin (Germany)—A tool for tracing gas sources and maturity. Mar. Pet. Geol. 2012, 30, 174–183. [Google Scholar] [CrossRef]
  57. Josten, K.-H.; Köwing, K.; Rabitz, A. Oberkarbon. In Geologie des Osnabrücker Berglandes; Klassen, H., Ed.; Naturwissenschaftliches Museum Osnabrück: Osnabrück, Germany, 1984; Volume 1, pp. 7–77. [Google Scholar]
  58. Baldschuhn, R.; Kockel, F. Das Osning-Lineament am Südrand des Niedersachsen-Beckens. J. Ger. Geol. Soc. 1999, 150, 673–695. [Google Scholar]
  59. Ziegler, P.A. Geological Atlas of Western and Central Europe; Shell Internationale Petroleum Maatschappij B.V.: The Hague, The Netherlands, 1990. [Google Scholar]
  60. Ziegler, P.A. Geodynamic model for the Palaeozoic crustal consolidation of Western and Central Europe. Tectonophysics 1986, 126, 303–328. [Google Scholar] [CrossRef]
  61. Gabriel, G.; Jahr, T.; Jentzsch, G.; Melzer, J. Deep structure and evolution of the Harz Mountains: Results of three-dimensional gravity and finite-element modeling. Tectonophysics 1997, 270, 279–299. [Google Scholar] [CrossRef]
  62. Tanner, D.C.; Krawczyk, C.M. Restoration of the Cretaceous uplift of the Harz Mountains, North Germany: Evidence for the geometry of a thick-skinned thrust. Int. J. Earth Sci. 2017, 145, 101. [Google Scholar] [CrossRef]
  63. Franzke, H.J.; Voigt, T.; Eynatten, H.V.; Brix, M.; Burmester, G. Geometrie und Kinematik der Harznordrandstörung, erläutert an Profilen aus dem Gebiet von Blankenburg. Geowiss. Mitt. Thüringen 2004, 11, 39–62. [Google Scholar]
  64. Kley, J.; Franzke, H.-J.; Jähne, F.; Krawczyk, C.M.; Lohr, T.; Reicherter, K.; Scheck-Wenderoth, M.; Sippel, J.; Tanner, D.; van Gent, H.; et al. Stress and Strain. In Dynamics of Complex Intracontinental Basins; Littke, R., Bayer, U., Gajewski, D., Nelskamp, S., Eds.; Springer: Berlin, Germany, 2008; pp. 97–124. [Google Scholar]
  65. Boness, M. Die Radiometrische Altersbestimmung der Pb-Zn-Lagerstätte Grund (Harz) mit der Rb-Sr-Methode. Ph.D. Thesis, Universität Göttingen, Göttingen, Germany, 1987. (In German). [Google Scholar]
  66. Haack, U.; Lauterjung, J. Rb/Sr dating of hydrothermal overprint in Bad Grund by mixing lines. In Formation of Hydrothermal Vein Deposits; Möller, P., Ed.; Borntraeger: Berlin, Germany, 1993; pp. 103–112. [Google Scholar]
  67. Hagedorn, B.; Lippolt, H.J. Isotopic age Constraints for Epigenetic Mineralizations in the Harz Mountains (Germany) from K-Ar and Rb-Sr Data of Authigenic K-Feldspars. Monogr. Ser. Miner. Depos. 1993, 30, 87–102. [Google Scholar]
  68. Lüders, V.; Möller, P. Fluid evolution and ore deposition in the Harz Mountains (Germany). Eur. J. Miner. 1992, 4, 1053–1068. [Google Scholar] [CrossRef]
  69. Schmidt Mumm, A.; Wolfgramm, M. Diagenesis and fluid mobilisation during the evolution of the North German Basin—Evidence from fluid inclusion and Sulphur isotope analysis. Mar. Pet. Geol. 2002, 19, 229–246. [Google Scholar] [CrossRef]
  70. Jacob, G.; Langwich, M.; Neumann, S.; Schwab, M.; Witzke, T. The structural position of hydrothermal mineralisations in Permian volcanic rocks of the Flechtingen—Rosslau block. Zent. Geol. Paläontol. 1994, 5, 567–569. [Google Scholar]
  71. Sun, S.-S.; McDonough, W.F. Chemical and isotopic systematics of oceanic basalts: Implications for mantle composition and processes. Geol. Soc. Lond. Spec. Publ. 1989, 42, 313–345. [Google Scholar] [CrossRef]
  72. Marshall, D.J. Cathodoluminescence of Geological Materials; Unwin Hyman: Boston, MA, USA, 1988; p. 146. [Google Scholar]
  73. Neuser, R.D.; Bruhn, F.; Götze, J.; Habermann, D.; Richter, D.K. Kathodolumineszenz: Methodik und Anwendung—Cathodoluminescence: method and application. J. Ger. Geol. Soc. 1995, 1, 287–306. (In German) [Google Scholar]
  74. Pohl, W. Mineralische und Energie-Rohstoffe: Eine Einführung zur Entstehung und Nachhaltigen Nutzung von Lagerstätten; Schweizerbart: Stuttgart, Germany, 2005. [Google Scholar]
  75. Griffin, W.; Powell, W.; Pearson, N.J.; O’Reilly, S. GLITTER: Data reduction software for laser ablation ICP-MS. In Laser Ablation ICP-MS in the Earth Sciences: Current Practices and Outstanding Issues; Mineralogical Association of Canada: Rue de la Couronne, QC, Canada, 2008; Volume 40, pp. 308–311. [Google Scholar]
  76. McDonough, W.F.; Sun, S.-S. Composition of the Earth. Chem. Geol. 1995, 120, 223–253. [Google Scholar] [CrossRef]
  77. Correns, O.W. Sedimentgesteine. In Die Entstehung der Gesteine; Barth, T.F.W., Correns, C.W., Eskola, P., Eds.; Springer: Berlin, Germany, 1970; pp. 116–262. [Google Scholar]
  78. Füchtbauer, H. Die petrographische Unterscheidung der Zechsteindolomite im Emsland durch ihren Säurerückstand. Erdöl Kohle 1958, 11, 689–693. (In German) [Google Scholar]
  79. Kasakov, A.V.; Sokolova, E.I. Conditions of the Formation of Fluorite in Sedi- Mentary Rocks: The Fluorite System. Available online: https://pubs.er.usgs.gov/publication/tei386 (accessed on 28 July 2018).
  80. Ivanov, V.V. Principal geochemical environments and processes of the formation of hydrothermal waters in regions of recent volcanic activity. Chem. Earths Crust 1967, 2, 260–281. [Google Scholar]
  81. Churakov, A.N. The Russian Plateau and the Alkaline Rocks Boarding It. Available online: https://www.scopus.com/record/display.uri?eid=2-s2.0-84914469516&origin=inward&txGid=b465428b1c36af17f216462fab26ad62 (accessed on 28 July 2018).
  82. Hubald, U. Mineralisation und Genese der Blei-Zink-Vererzung im Hauptdolomit der Bohrung Barenburg Z8 (Nordwestdeutsches Becken). Ph.D. Thesis, RWTH Aachen, Aachen, Germany, 1988. [Google Scholar]
  83. Mempel, G. Verbreitung und Genese der Bunmetallerz-Spuren in den paläozoischen und mesozoischen Sedimenten Nordwestdeutschlands. Z. Erzbergabu Metalhüttenwes. 1962, 15, 62–72. (In German) [Google Scholar]
  84. Mempel, G.; Fesser, H.; Gundlach, H. Untersuchungen an Zinkblende und Bleiglanz aus Geoden Nordwestdeutschlands. Erzmetall 1965, 285–292. (In German) [Google Scholar]
  85. Herrmann, A.G. Über die Einwirkung Cu-, Sn, Pb- und Mn-haltiger Erdölwässer auf die Staßfurt-Serie des Süd-harzbezirkes. New Yearb. Mineral. 1961, 60–67. (In German) [Google Scholar]
  86. Seeliger, E. Pseudohydrothermale Pb-Zn-Erzgänge im Ruhrgebiet und im Gebiet von Velbert-Lintorf: Eine Untersuchung über die Einflüsse heißer Zechsteinsalzlösungen auf Pb-Zn-Erze am Beispiel der Erzgänge von Christian Levin in Essen und von Stein V in Hüls bei Recklinghausen; Akademie-Verlag: Berlin, German, 1950. (In German) [Google Scholar]
  87. Lietz, J. Sulfidische Klufterze im Deckgebirge des Salzstockes Reitbrook. Mitt. Staatsinst. Hambg. 1951, 20, 110–118. (In German) [Google Scholar]
  88. Seidl, K. Über die Bildung von Bitumen bei der Dolomitisierung von Kalkgesteinen unter der Einwirkung von Salzsolen. Neues. Jahrb. Mineral. 1959, 4, 85–92. (In German) [Google Scholar]
  89. Dorn, P. Der junge Vulkanismus im Braunschweiger Raum. Geol. Yearb. 1957, 74, 105–116. (In German) [Google Scholar]
  90. Fabian, H.-J.; Mueller, G.; Roese, K.-L. Eine sideritisch-sideroplesitische Vererzung in einer Zechstein-Bohrung des Erdgasfeldes Rehden (Krs. Diepholz). Neues Jahrb. Geol. Paläontol. 1957, 105, 205–219. (In German) [Google Scholar]
  91. Schneider, H. Über einige Beziehungen der Erzvorkommen im Osnabrücker Raum zum varistischen Magmatismus. Z. Deutsch. Geol. Ges. 1952, 104, 516–533. (In German) [Google Scholar]
  92. Pudlo, D.; Albrecht, D.; Ganzer, L.; Gaupp, R.; Kohlhepp, B.; Meyer, R.; Reitenbach, V.; Wienand, J. Petrophysical, facies and mineralogical-geochemical investigations of Rotliegend sandstones from the Altmark natural gas field in Central Germany. Energy Procedia 2011, 4, 4648–4655. [Google Scholar] [CrossRef]
  93. Lüders, V.; Plessen, B.; Romer, R.L.; Weise, S.M.; Banks, D.A.; Hoth, P.; Dulski, P.; Schettler, G. Chemistry and isotopic composition of Rotliegend and Upper Carboniferous formation waters from the North German Basin. Chem. Geol. 2010, 276, 198–208. [Google Scholar] [CrossRef]
  94. Schretzenmayr, S. Bruchkinematik des Haldenslebener und Gardelegener Abbruchs (Scholle von Calvörde). In Zur Geologie und Kohlenwasserstoff-Führung des Perm im Ostteil der Norddeutschen Senke; Müller, P.E., Porth, H., Eds.; Schweizerbart: Hannover, Germany, 1993; pp. 219–238. (In German) [Google Scholar]
  95. Nozaki, Y. Rare earth elements and their isotopes. Encycl. Ocean Sci. 2001, 4, 2354–2366. [Google Scholar]
  96. Freslon, N.; Bayon, G.; Toucanne, S.; Bermell, S.; Bollinger, C.; Chéron, S.; Etoubleau, J.; Germain, Y.; Khripounoff, A.; Ponzevera, E.; et al. Rare earth elements and neodymium isotopes in sedimentary organic matter. Geochim. Cosmochim. Acta 2014, 140, 177–198. [Google Scholar] [CrossRef]
  97. Wood, S.A. The aqueous geochemistry of the rare-earth elements and yttrium. 2. Theoretical predictions of speciation in hydrothermal solutions to 350 °C at saturation water vapor pressure. Chem. Geol. 1990, 88, 99–125. [Google Scholar] [CrossRef]
  98. Wood, S.A. The aqueous geochemistry of the rare-earth elements and yttrium. Chem. Geol. 1990, 82, 159–186. [Google Scholar] [CrossRef]
  99. Migdisov, A.A.; Williams-Jones, A.E. Hydrothermal transport and deposition of the rare earth elements by fluorine-bearing aqueous liquids. Miner. Depos. 2014, 49, 987–997. [Google Scholar] [CrossRef]
  100. Jong Hyeon, L.; Byrne, R.H. Complexation of trivalent rare earth elements (Ce, Eu, Gd, Tb, Yb) by carbonate ions. Geochim. Cosmochim. Acta 1993, 57, 295–302. [Google Scholar] [CrossRef]
  101. Lee, J.H.; Byrne, R.H. Examination of comparative rare earth element complexation behavior using linear free-energy relationships. Geochim. Cosmochim. Acta 1992, 56, 1127–1137. [Google Scholar] [CrossRef]
  102. Möller, P.; Dulski, P.; Schley, F.; Luck, J.; Szacki, W. A new way of interpreting trace element concentrations with respect to modes of mineral formation. J. Geochem. Explor. 1981, 15, 271–284. [Google Scholar] [CrossRef]
  103. Rakovan, J. Sectoral zoning. Rocks Miner. 2009, 84, 171–176. [Google Scholar] [CrossRef]
  104. Zidarova, B.; Maleev, M.; Kostov, I. Crystal genesis and habit zonality of fluorite from the Mikhalkovo deposit, Central Rhodope Mountains. Geochem. Miner. Pet. 1978, 8, 3–26. [Google Scholar]
Figure 1. Location of sampled wells/localities and major structural features of northern Germany, including the ABB, the LSB, the FCB (Flechtingen High) and the Harz. The thin unlabelled dashed line indicates the extend of the NGB with its shallow platform area (dashed area). Well names are anonymized, and locations are approximate.
Geosciences 08 00283 g001
Figure 2. (A): Pinkish fluorite from ABB Well E. (B): Polished mount with fluorite surrounding sphalerite in hydrothermal quartz-calcite-sulphide vein from the Main Dolomite (Staßfurt Carbonate, Ca2) carbonate, LSB Well F. The right half of the polished mount shows the fluorescence of the fluorite (photographed after UV light exposure). (C): Pale violet fluorite in quartz-calcite vein from FCB Sohle 3 (see also K). Dark angular crystals are large chalcopyrite grains. (D): Greenish to colourless fluorite in quartz-calcite vein from FCB Sohle 4. (see also L) (E): Lavender fluorite in quartz vein (Biwender Vein) from the Harz Mountains. Dark areas are siliciclastic sediment clasts. (see also M). (F): Fluorite (dark) associated with calcite and anhydrite in a hydrothermal vein from ABB WELL A. (crossed polars, transmitted light) (G): Large hypidiomorphic fluorite (dark grey) associated with calcite and anhydrite. Quartz (bottom left) often occurs as idiomorphic inclusions in fluorite. (reflected light). (H): Massive fluorite mineralization with large clusters of hydrothermal anhydrite from ABB Well C. (transmitted light, crossed and plain polars). (I): Massive fluorite mineralization with late barite-anhydrite vein and small quartz veinlets from ABB Well D. (transmitted light, crossed and plain polars). (J): Fluorite associated with carbonate that displays recrystallizing textures is intergrown with organic material (dolomitic Ca2 carbonate) from LSB Well F. (transmitted light) (K): Quartz-calcite-fluorite vein in ignimbrite from FCB Sohle 3. (transmitted light, crossed polars). (L): Quartz-calcite-fluorite vein in ignimbrite from FCB Sohle 4. (transmitted light, crossed polars) (M): Quartz-fluorite vein (Biwender Vein) in fine-grained clastic sedimentary host rock. Quartz shows characteristic syntaxial candle growth texture. A set of later quartz veinlets is cross-cutting the quartz-fluorite vein. (transmitted light, crossed polars). (N): Hypidiomorphic fluorite (dark grey) in quartz-fluorite vein (Biwender Vein) from the Harz Mountains. (reflected light)—qz: quartz, fl: fluorite, cal: calcite, cb: carbonate mineral, anh: anhydrite, ba: barite, sp: sphalerite, sed: clastic sediment clast.
Geosciences 08 00283 g002
Figure 3. (A). BSE image of hydrothermal fluorite, quartz and anhydrite from ABB Well B. (B): Colour-CL image of hydrothermal fluorite, quartz and anhydrite. Sector zoning (generation* I and II) is a prominent feature in fluorite. Anhydrite shows characteristic deformation lamellae. Quartz also displays growth textures that indicate a successive growth under varying conditions. (C): BSE image of a large fluorite grain with pronounced sector zoning and cyclical growth patterns. At least two distinct fluorite generations (I and II) can be observed in this sample from ABB Well C. (D): BSE image of a barite-anhydrite vein in fluorite from ABB Well D. Barite and anhydrite represent the last stage of this hydrothermal event. Due to the large contrast difference between barite and fluorite the growth patterns in fluorite are barely visible in this image. (E): CL image of fluorite from LSB Well A displaying the intricate network of fluid pathways and growth textures typical of complex sectoral growth (e.g., fir tree structures, see Discussion, Figure 7G). Two main generations (I and II) can be distinguished here as well. (F): Fluorite from LSB Well B showing pronounced cyclical growth patterns typical for a combination of sectoral and oscillatory zoning (CL image, see Discussion, Figure 7F). Two distinct fluorite generations (I and II) can be observed in this sample. * ’generation’ is a term that in these cases does not necessarily denote an attribution to different fluid generations and a difference in age (as discussed in Section 5).
Geosciences 08 00283 g003
Figure 4. Minor and trace element concentrations (excluding REY) in fluorite from the different investigated localities. Numbers in the boxplots indicate the number of analyses (above the level of detection) the corresponding values are summarized in Table 2. Note that the displayed median and mean values are based on the logged data and may therefore deviate from the data in Table 2.
Geosciences 08 00283 g004
Figure 5. C1 chondrite-normalized, after [76] REYCN plots for fluorite (ag) and whole rock samples (h,i) from ABB (ad), LSB (e), Flechtingen High, FCB (f), and Biwender Vein (Harz) (g). Median values are represented by the dashed lines. Compositional ranges for the Biwender Vein and the ABB and LSB whole rock data are plotted as references in the background in plots where applicable. Colour coding corresponds to Figure 4. The corresponding REY concentrations are listed in Table 3.
Geosciences 08 00283 g005
Figure 6. Comparison of C1 chondrite-normalized, [after 76] REYCN data for volcanic whole rock samples from the NEGB, [after 7] and the median fluorite signatures for generation I (AI, BI, CI, DI) and II (AII, BII, CII, DII) from the ABB (see also Figure 5).
Geosciences 08 00283 g006
Figure 7. Various examples of growth zoning features typically found in hydrothermal fluorites as evident from the petrography and cathodoluminescence and BSE imaging (Figure 2 and Figure 3). Different colours illustrate image contrasts, and thus, differences in chemical composition (corresponding to fluorite generation I and II). Plane section for (D,G,H) is |110|, all other examples are shown parallel to |001|. No apparent zoning (A) suggests crystallization under constant hydrothermal conditions, whereas concentric zoning (B) indicates discontinuous changes in the fluid chemistry over time; (C) is a typical representation of short-lived oscillating changes in the fluid chemistry. (D,E) Typical sectoral zoning in fluorite crystals with complex crystal habits ((D): cuboctahedral, (E): cubic + rhombic dodecahedral faces) that is only visible in specific plane sections. (F) Combination of sectoral and oscillatory zoning in a cubic fluorite crystal. (G) 'Fir-tree' zoning occurs when growth conditions (T/Eh) alternate over time and thereby favour different crystal morphologies (cuboctahedron ↔ cube), which proves pulsed crystallization (e.g., [106]). (H) 'Petal-type' zoning is the result of a continuous change from octahedral growth to cubic growth; the red line marks the beginning of shape transition (modified from [104]). Image (B,E) correspond to features visible in Figure 3B (parallel to |111|) and Figure 3C (parallel to |100|); image (F) resembles zoning details visible in Figure 3F, while image (G) is similar to growth patterns apparent in Figure 3E in the area labelled II.
Geosciences 08 00283 g007
Figure 8. (A) Schematic illustration of an idealised cube (grey) and octahedron (blue), respectively. Major crystallographic planes are indicated with respective indices, the section plane used for images in (B,C) is marked with green lines. (B) Assuming a fluid of constant composition, at higher temperatures fluorite will precipitate in octahedral shape (I) with only |111| planes exposed to the surrounding fluid (blue shade), which results in the preferential incorporation of elements of specific size/charge (compare [23]). Cooling of the fluid will now favour a cubic fluorite morphology and, consequently, the continuous formation of |100| planes (II), which show different sorption properties compared to |111| planes (grey shade). Although precipitating synchronously from the same fluid, two different fluorite generations will form, since the two exposed crystal planes preferentially incorporate different elements. Note, how isochrones of fluorite growth (red lines) crosscut both generations; they represent former crystallographic growth surfaces that were exposed to the hydrothermal fluid at the same time. Continuous cooling will reduce the total area of |111| planes (II-III, cuboctahedron) and finally result in a purely cubic crystal shape (IV). In this example, temperature is the governing factor for crystal morphology and thus, for element incorporation. Thereby, it overrules other factors that usually control geochemical composition such as fluid composition itself, which may only play a minor role here (i.e., REE and trace element supply). (C) Repeated heating or influx of hot hydrothermal fluid may then cause a reversed growth cycle, when higher ambient temperatures eventually favour octahedral fluorite growth, resulting in the formation of |111| planes (V-VII). (D) Three-dimensional illustration of various fluorite morphologies during growth. Please note that zoning features observed in BSE or CL strongly depend on the section plane of the sample. Features presented in the above illustrations are only visible when the zoned crystal is observed normal to the section plane indicated in Figure 7A.
Geosciences 08 00283 g008
Figure 9. Tb/La versus Tb/Ca atomic ratio diagram after Möller et al. [33] for fluorite from the ABB, LSB, Biwender Vein (Harz), and Flechtingen High. For reference, fields compiled and established by Makin et al. [28], Duschl et al. [11], and Kraemer et al. [43]—North Pennine Ore Field (NPO), Alston Block (A) and Askrigg Block (B) are plotted. Labels, groupings and colours in the diagram (e.g., AI, Sohle 3) correspond to sample populations shown in Figure 4 and Figure 5. See text for discussion.
Geosciences 08 00283 g009
Figure 10. La/Ho versus Y/Ho plot for a selection of fluorite samples from the ABB and the Flechtingen High. The grouping and colours correspond to those in Figure 5. See text for discussion.
Geosciences 08 00283 g010
Table 1. SEM operating conditions.
Process Time6 µs
Channels2K
Energy spectrum0–10 keV
DetectorBSE and CL mode
Accelerating voltage15 kV
Working distance13–15 mm 14.6 mm (optimum conditions)
Sample current300–500 pA
Table 2. LA-ICP-MS minor and trace element data (excluding REY) for fluorite (polished petrographic mounts) from the investigated areas, including total number of in-situ analyses per sample (#) and minimum (Min), maximum (Max) and median values for the sample populations. Null represents the number of analyses that returned values below the detection limit. All concentrations in parts per million (ppm).
ID and (#)StatsLiNaMgKMnFeZnGaSrBaPb
ABB Well AI (9)Null75606060041
Min1.146.42.5613.10.455770.790.463.850.280.041
Max1.251833.6953.03.1991911.5618.40.750.337
Median1.1977.82.6720.21.677070.791.412.00.390.177
ABB Well AII (5)Null31202043023
Min1.9717.72.5914.80.996935.130.0517.291.50.385
Max13.1158310632725.79075.130.11456.66.12.66
Median7.561407.3228.43.867415.130.08211.171.531.52
ABB Well BI (16)Null86142709160516
Min0.4721.71617.12.061172.769.830.66
Max48.3342416.269887.928159.114028
Median4.0325316.138.64.872106.8917.72.07
ABB Well BII (12)Null558050420412
Min0.333487.3114.71.381311.390.1457.91.27
Max12115314.427127.520622.80.92577.19.37
Median2.6521210.928.77.671643.910.39213.82.99
ABB Well CI (21)Null532015010200511
Min0.6052.64.1413.70.691231.210.2075.790.7080.41
Max11.910454.1415819.43234.740.20716768.4357.4
Median3.331924.1442.554.702031.440.20715.62.221.26
ABB Well CII (24)Null54190601210514
Min0.40331.15.7115.71.191601.210.164.530.6771.01
Max2921429.5835735.73437.52.4777.91544.9
Median3.523107.4958.76.33219.52.041.0717.92.383.83
ABB Well DI (1)Null11100011001
Min17436.3322518.555.4
Max17436.3322518.555.4
Median17436.3322518.555.4
ABB Well DII (3)Null33302031013
Min22.630.562.30.37812.71.22
Max6130.52560.85415.52.03
Median28.930.51460.61612.91.625
ABB Well EI (4)Null10101023000
Min0.2146.51.9115.170.32264710.0326.60.2110.152
Max1.2425877649.22457297.550.0351341.694.81
Median0.27125.923518.13.926574.280.035041.130.249
LSB Well FINull70002009000
Min0.5516919.115.10.191300.80.02847.10.3250.85
Max10.590322921554.1818834.70.34846514.995.2
Median1.4346937.336.50.5621536.530.08393.41.0112.75
LSB Well GINull130003005010
Min0.4337.98.28.220.3041175.170.0410.10.070.26
Max2696217028510618229350.602120003.4963.4
Median0.8921629.237.30.9515490.80.22331.20.7714.0
Sohle 3, Flechtingen HighNull60002009000
Min0.4430.6168.770.441422.250.0229.150.2490.436
Max4.7870843.82679.4332457.30.02234.33.8221.1
Median2.6313922.922.31.071655.990.02211.70.55412.1
Sohle 4, Flechtingen HighNull70003001000
Min1.0452.38.5310.40.3131680.830.0398.780.1173.13
Max2.8856916152.34.3520012.110.29624.41.6543.6
Median1.9616428.322.71.2751832.530.11210.80.5313.6
Biwender Vein I, HarzNull00100040000
Min0.44474.21.830.91.748411.030.06624.10.80.895
Max4.5672820.218615.211848.280.22664.515.99.59
Median1.942654.1760.74.499781.770.15234.92.032.3
Biwender Vein II, HarzNull30101032010
Min0.3665.921.5718.00.558840.850.03110.80.1970.389
Max0.36637.42.9132.80.9811350.850.05919.93.375.51
Median0.36620.12.2127.10.5649840.850.04512.80.943.03
Table 3. REY concentrations in fluorite (polished petrographic mounts) from the investigated areas, including number of in-situ analyses per sample (#), minimum (Min), maximum (Max) and median values. Null represents the number of analyses that returned values below the detection limit. All concentrations in parts per million.
ID and (#)StatsLaCePrNdSmEuGdTbDyYHoErTmYbLu
ABB Well AI (9)Null000000000010267
Min17.322.272.179.590.6460.0240.2950.0140.0691.170.02550.0310.0050.0410.015
Max55.496.969.4332.24.50.4592.560.31.6835.90.3340.6550.0490.140.0212
Median40.171.466.5125.22.880.3541.880.1530.9116.80.1320.2610.02620.1040.0181
ABB Well AII (5)Null000000000000113
Min0.1130.2590.0490.40.4130.090.850.1881.6253.80.3990.8730.05330.2320.027
Max1.382.780.3071.851.960.4864.670.977.691191.462.450.2290.720.059
Median0.5681.430.2111.360.770.3742.720.5424.2180.80.9121.610.1780.5390.043
ABB Well BI (16)Null78121313131082048141616
Min0.0820.0760.0460.2160.2980.060.5770.0630.29612.60.0590.1720.049
Max0.3280.3820.10.6241.130.2151.630.2921.5865.30.3260.6880.06
Median0.2060.1820.05550.4980.5560.1911.0550.1850.53322.850.170.3920.0545
ABB Well BII (12)Null111132465089121212
Min3.393.940.1661.320.2940.0440.3650.0520.1630.580.0470.125
Max26.238.24.2621.32.790.3312.580.1210.6129.80.1170.349
Median13182.369.731.460.1580.8760.09550.2018.050.05050.172
ABB Well CI (21)Null3155764420345613
Min0.1390.0710.0350.2380.2620.0750.3370.0750.3032.360.0590.4390.040.2930.033
Max2.54.240.8054.33.090.757.151.8212.11521.964.450.2660.9190.108
Median0.5440.9080.1641.0050.9160.3042.670.6444.36880.8431.920.1880.4870.051
ABB Well CII (24)Null000024343045141522
Min4.745.170.7712.690.3280.0790.4030.0720.1990.6790.0510.1110.0390.140.03
Max81.410214.449.37.571.065.391.066.111201.232.340.1790.540.035
Median38.648.16.7221.052.590.4282.260.2831.5727.750.2750.6020.0910.340.0325
ABB Well DI (1)Null001010110011111
Min0.9541.030.9710.2410.90836.6
Max0.9541.030.9710.2410.90836.6
Median0.9541.030.9710.2410.90836.6
ABB Well DII (3)Null000012222022323
Min8.569.531.466.670.7680.2561.640.2461.574.280.4051.081.28
Max17.429.93.168.981.590.2561.640.2461.5769.80.4051.081.28
Median8.5916.22.247.331.1790.2561.640.2461.577.830.4051.081.28
ABB Well EI (4)Null000013011012213
Min0.0180.03380.01370.0540.1040.01050.0440.01140.0850.0290.01090.0250.00540.0180.0114
Max0.2870.5650.1280.6850.1930.01050.1590.05030.2011.0680.03480.0940.00760.140.0114
Median0.05390.07670.06070.3530.1090.01050.150.0210.1630.40250.01290.05950.00650.0350.0114
LSB Well FI (16)Null000020120032699
Min0.02370.0870.01670.0880.0260.00720.0360.00610.0320.6780.00770.0139.60E-040.01250.0008
Max0.0810.2130.03860.2540.10.02820.1120.0180.0991.5440.020.0440.0130.0350.0105
Median0.05140.1510.02720.1630.0450.0140.0710.01230.06251.11250.0110.0250.005150.0210.0037
LSB Well GI (16)Null41612131210101411191099
Min0.00080.00470.00480.00380.00830.00420.0140.0020.0240.010.00120.00360.00180.00550.002
Max0.5010.9560.1070.6430.0650.0180.0870.0140.0270.4610.0060.0310.00830.0920.0062
Median0.03560.02130.01180.0450.0170.01180.0190.002450.02550.0950.00370.00830.004850.01080.0045
Sohle 3, Flechtingen High (10)Null101010000000104
Min0.00450.01720.00350.010.0350.03250.3080.0490.49632.70.0780.2110.01930.0230.0135
Max0.2390.4620.06060.4510.5020.3841.870.4583.121380.5551.430.0970.3830.0377
Median0.04930.05980.01530.05750.0950.09150.7890.1641.3075.60.3030.7010.04940.190.0226
Sohle 4, Flechtingen High (9)Null000001033021554
Min1.532.3210.2361.0370.0610.01480.0240.00640.0310.7250.00520.00760.000940.0140.00094
Max9.4618.72.29.391.430.1590.450.01590.1124.510.02490.0390.00450.0210.0069
Median4.897.780.7753.090.320.04440.1140.0120.0471.3420.00880.01880.003750.01750.0031
Biwender Vein I, Harz (9)Null000000000000000
Min0.9552.840.4683.111.631.013.550.6214.1583.90.9191.940.2261.210.08
Max1.946.031.117.455.162.7812.022.40115.87188.82.96.710.7023.350.297
Median1.264.380.7155.823.651.698.641.61210.121282.0644.470.4632.140.237
Biwender Vein II, Harz (4)Null000011010000001
Min0.0840.140.02770.1520.1770.2040.1550.180.3299.950.0370.1040.0230.0820.0096
Max0.2150.4230.080.7830.6180.3891.540.2161.5623.70.3040.4590.050.2110.0394
Median0.1680.2340.05570.4130.4550.2520.90.2091.34519.70.2360.4150.04540.1510.0204

