A Permanent, Real-Time Monitoring Network for the Volcanoes Mount Scenery and The Quill in the Caribbean Netherlands

R & D Department of Seismology and Acoustics, Royal Netherlands Meteorological Institute (KNMI), Utrechtseweg 297, 3731 GA De Bilt, The Netherlands
*
Author to whom correspondence should be addressed.
Geosciences 2018, 8(9), 320; https://doi.org/10.3390/geosciences8090320
Submission received: 4 July 2018
/
Revised: 16 August 2018
/
Accepted: 20 August 2018
/
Published: 27 August 2018
(This article belongs to the Special Issue Volcano Monitoring – Placing the Finger on the Pulse)
Abstract
:The stratovolcanoes of Mt. Scenery at Saba and The Quill at St. Eustatius in the Caribbean Netherlands, with a total population of about 5200 people, are part of the active volcanic arc of the Lesser Antilles but lacked a multiparameter volcano and earthquake monitoring system until the beginning of 2018. The permanent seismic network on the islands has been built up since 2006 and was expanded in 2018 with one permanent Global Navigation Satellite System (GNSS) sensor at each volcano and a temperature logger on Saba. We provide technical details of all equipment and the installation procedures, and we show the preliminary results of GNSS data processing. Deploying a remote, permanent network of different sensor types under tropical island conditions and sustaining access to real-time high-quality data to monitor the state of volcanoes is an underappreciated challenge. Despite the problems encountered, we operated the network with an overall availability of 84.5% in the first half of 2018 compared to 70.3% in the years before. The main unresolved problem affecting seismic data quality is related to sudden out-of-balance seismometer mass positions. We provide a complete overview of our monitoring network, the various challenges encountered, and the solutions applied, and we address future plans.
1. Introduction
Of the 1500 known active volcanoes on Earth, only 35 % are adequately monitored [1]. If and how extensively a volcano is monitored depends on many different aspects: the state of unrest of the volcano, the proximity to any population, the remoteness of the location, and the resources—both financial and in expertise—of the local government or responsible agency. Monitoring is the only way to gain knowledge on the state of the volcano, as magma intrusions and eruptions are usually preceded or accompanied by measurable signals, such as increased seismicity and/or surface deformation. Continuous (real-time) monitoring can help detect such precursory activity and thus aid in the mitigation of volcanic risk. In this paper, we describe the volcano monitoring network of Saba and St. Eustatius, in the Caribbean Netherlands, which started with seismic observations in 2006. We discuss the recent efforts to expand the network with Global Navigation Satellite System (GNSS) observations and temperature measurements of hot springs. We then examine the data quality, characteristics, and performance of the seismic network and finally, we make recommendations for future improvements.
1.1. Geology of the Islands
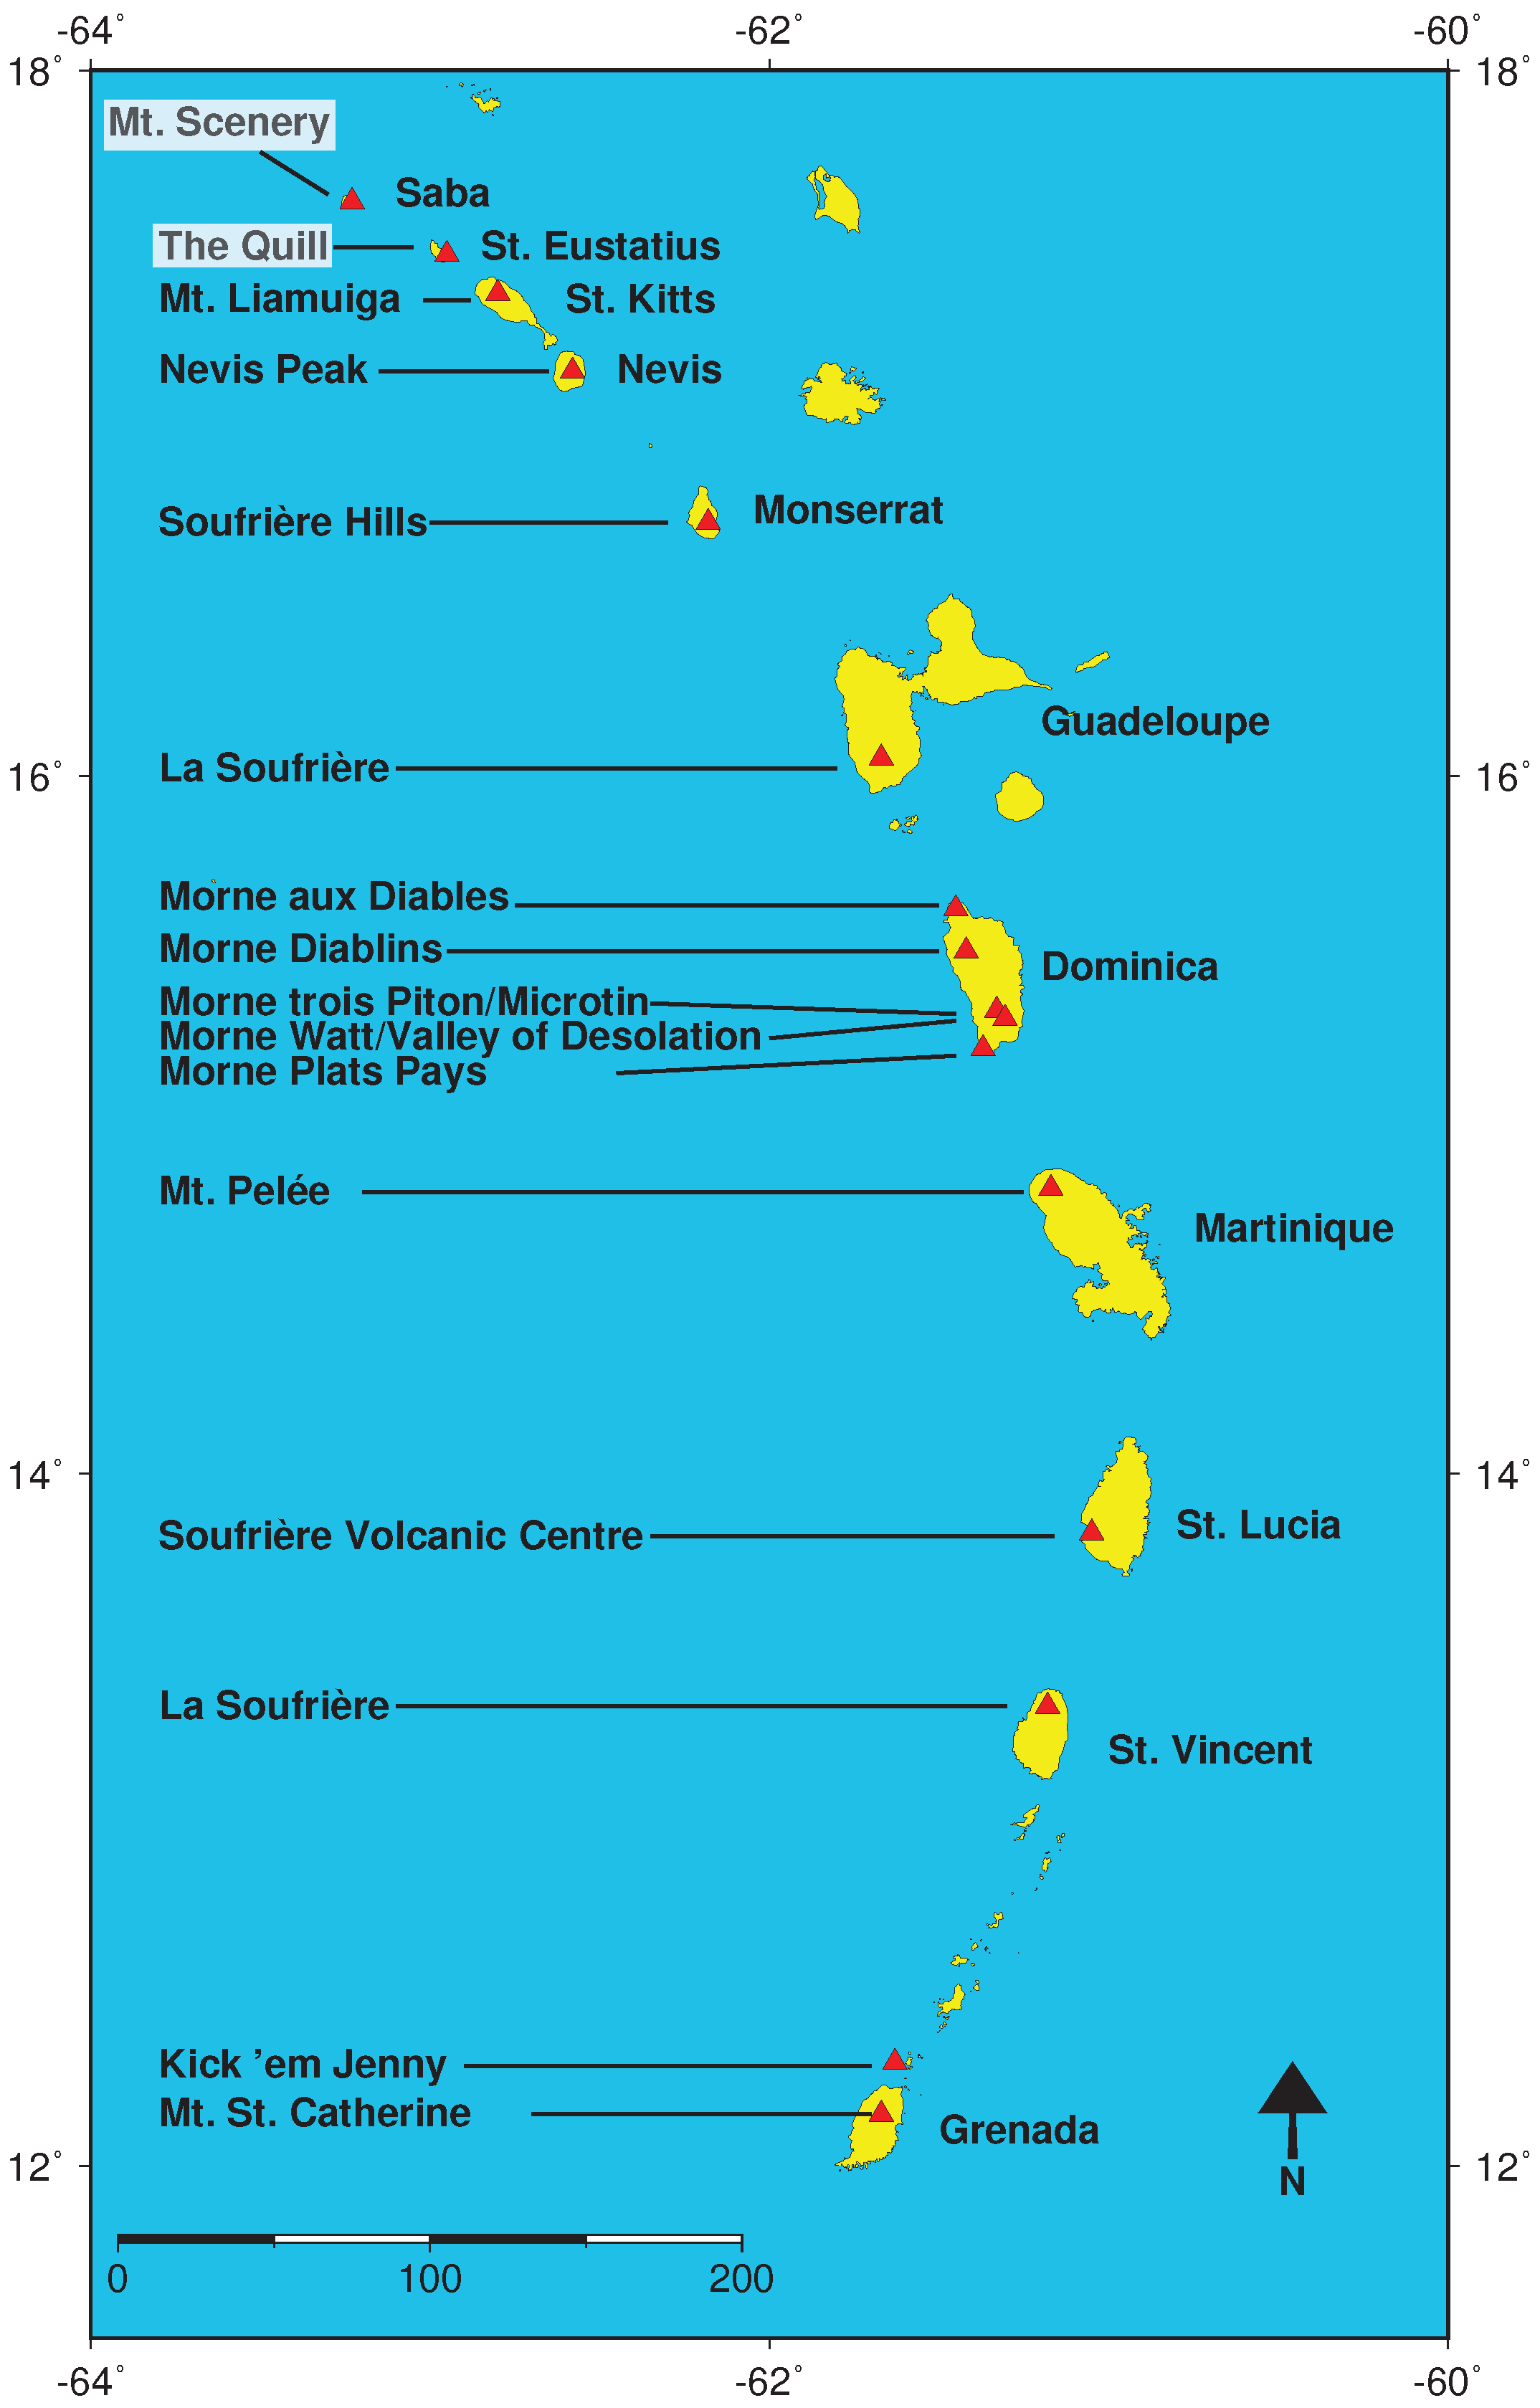
The islands of Saba (13 km2) and St. Eustatius (21 km2) are located at the Northernmost part of the active volcanic arc of the Lesser Antilles (Figure 1), which is the surface expression of the subduction of the oceanic crust of the North and South American plates beneath the Caribbean Plate. Perpendicular to the subduction zone, a series of faults has been identified underlying the submarine beds which form a platform delineated by the 1000 m submarine contour [2]. The geology of Saba and St. Eustatius was first described in detail by Westerman and Kiel [3] based on a month long survey conducted in 1958 and updated by Robool and Smith [2] after 25 years of extensive study.
Both islands host a stratovolcano: Mt. Scenery (887 m elevation) at Saba and The Quill (600 m elevation) at St. Eustatius (Figure 2). Saba is composed of a single stratovolcano with multiple andesitic domes on its flanks, causing the topography to be irregular and steep [2]. A basaltic andesite lava flow, with clearly pronounced levees, covers the NE side of the island. From the center towards the SW, a sector collapse scar with an elongated horseshoe shape open to the SW dominates the landscape but is mostly filled by products from Mt. Scenery. Based on the timing of the collapse structure (~100,000 years ago), the deposits found on the island are divided into the pre-collapse ‘older division’ and the post-collapse ‘younger division’ [2].
St. Eustatius can geologically be divided into three units [3]: ‘The Quill’, ‘The Northern Centers’ and the ‘White-Wall-Sugar Loaf Ridge’. ‘The Quill’ is a 600 m high symmetrical stratovolcano, located on the south side of the island, hosting a 800 m wide and 300 m deep summit crater. The cone of the volcano was fully built from pyroclastic deposits, reflecting its explosive history [2]. ‘The Northern Centers’ is a complex of five individual volcanic centers that display varying degrees of erosion and is located on the north side of the island, while ‘White-Wall-Sugar Loaf Ridge’ represents a tilted and raised interbedded limestone-volcaniclastic succession located at the southern tip of the island [2].
1.2. Eruption History
The main evidence of volcanic hazards at the islands stems from the abundant occurrence of volcanic deposits. As there are no historical records of eruptive activity, all information about the eruption history, frequency, and distribution has come from the study of these deposits. Pyroclastic ashfall, pyroclastic flow, and pyroclastic surge deposits are all present [2] suggesting an explosive nature to past eruptions. The age of the most recent eruption at both volcanoes remains debated mainly because of the paucity of charcoal suitable for dating in the most recently deposited bedsets. For The Quill, Roobol and Smith [2] consider a date of 1700 ± 90 year B.P., circa 250 CE, to be the most likely date for the last eruption, based on archaeological dating of the posthole backfill. One charcoal sample from a pit in The Bottom on Saba (Figure 2) was dated at 310 ± 80 year B.P., circa 1640 CE [2] and matched to the most recent eruption of Mt. Scenery. The uncertainty in the dates of the most recent eruptions on the two islands and the lack of data to complete the geochronology complicate the understanding of the characteristics of the volcanoes. This affects the hazard assessment of the islands as well as the choice of locations for (temporary) monitoring instruments. Especially on Saba, which consists of multiple domes, knowledge of the eruption history is critical to ensure that the most recently active domes are monitored accurately.
1.3. Rationale for Monitoring
Volcanoes of the Lesser Antilles arc can erupt very violently. The fifth deadliest eruption in recorded history occurred in Martinique, where the eruption of Montagne Pelée killed around 29,000 inhabitants in 1902 [4]. Monitoring a suite of parameters is the only way to get a sense of the state of activity of the volcano and hence increase the chance to observe any changes in the volcanoes’ behaviour.
Even though some of the volcanoes of the chain seem rather calm or dormant, it is possible for them to re-awaken after extensive periods of quietness. The Soufrière Hills volcano of Montserrat, just 120 km SE of St. Eustatius, started to show signs of activity in 1995 after ~350 years of dormancy [5]. The lack of baseline data prior to the onset of the surficial expression of volcanic activity was recognised as a hindrance when interpreting the data [6], and additional equipment was installed in the early days of the eruption [5]. Even though the eruption culminated in extensive pyroclastic flows that killed 19 people in 1997 [5], many casualties were avoided thanks to the timely evacuation of threatened areas [7]. The knowledge gained during the Soufrière Hills volcanic crisis stresses the importance of continuous monitoring of all volcanoes of the Lesser Antilles. Currently the extent of volcano monitoring networks varies considerably between the islands, as illustrated by Table 1.
Pelean type activity was named by Lacroix [8] after the 1902 eruption of Montagne Pelée in Martinique. The main hazard at Saba comes from so called “Pelean” type pyroclastic flows generated from an active dome [2]. As such domes are scattered island wide, the whole island is at high risk for this type of activity. On St. Eustatius, ancient pyroclastic flows were generated by column collapse from open crater eruptions similar to those of the 1902 and 1979 eruptions of La Soufrière at St. Vincent [9]. The threat scores for each volcano, calculated by multiplying the hazard and exposure factors following the method by Ewert [10] rank Mt. Scenery in the very high threat group and The Quill in the high threat group. These threat scores justify the importance of high level monitoring in near real-time on these islands.
As of 1 January 2017, the population of the island of Saba reached 2010 people, and the population of St. Eustatius totalled 3250 people [11]. The expansion of the population at the islands observed over the past decade is expected to continue, implying that the number of people at risk, and the complexity of evacuation in case of volcanic unrest will also increase. The Royal Netherlands Meteorological Institute (KNMI) is responsible for the observations of geophysical phenomena at the islands. In acute potential hazardous situations, KNMI informs local authorities at the islands as well as the departmental crisis coordination center of the ministry as soon as possible. Responsible agencies on the islands can take further action if needed, assisted by the crisis coordination center. Apart from these potential urgent warnings, KNMI sends the local governments a status report 1–2 times a year.
2. Seismic Monitoring
The tectonic setting of the Northern and central parts of the Lesser Antilles arc is characterized by the convergence and subduction of the North and South American plates under the Caribbean plate at a rate of about 2 cm per year [12,13]. Seismic activity is mainly confined to a zone of a width of about 300 km that is parallel to the subduction arc with earthquake depths down to about 200 km (Figure 3). Both Saba and St. Eustatius are located in the seismic zone that is dominated by the occurrence of intermediate-depth (100–150 km) earthquakes. Just west of Saba and St. Eustatius is the Anegada Passage, a tectonic feature that is dominated by east–west extension [14,15].
Early seismic monitoring on the islands of Saba and St. Eustatius was carried out by the Lamont–Doherty Geological Observatory, U.S.A., who operated a single one-component seismometer on Saba from 1978 to 1983 [2]. From 1992 to 2004, the Seismic Research Center Trinidad acquired data with one seismometer on the summit of Mt. Scenery [2]. A swarm of 60 earthquakes, many of which were felt by the local population, occurred in the vicinity of Saba in June 1992. Their magnitude ranged from 1 to 4.5, and the bigger events were recorded by multiple instruments of the Eastern Caribbean Seismic network located on nearby islands. The epicenters of the 15 earthquakes which could be located have focal depths of 10–16 km and exhibit a SW–NE trend, parallel to a SW–NE fault underlying the island. A detailed study by Ambeh and Lynch [19] suggests a tectonic rather than volcanic origin of the swarm. In 1994, one magnitude 4.8 earthquake at a depth of 14 km and six aftershocks were detected and located at the extension of the SW–NE alignment of the 1992 swarm in the NE direction [2]. From May 1995 to April 1997, micro-seismicity increased with a peak in December 1996 when 64 earthquakes were recorded by the single seismometer on Saba. At the same time, the temperature of the hot springs at Ladder Bay and opposite Green Island, increased significantly by 7–12 degrees Celsius [2]. The 1995–1997 activity has been attributed to a mild volcano-seismic crisis [2].
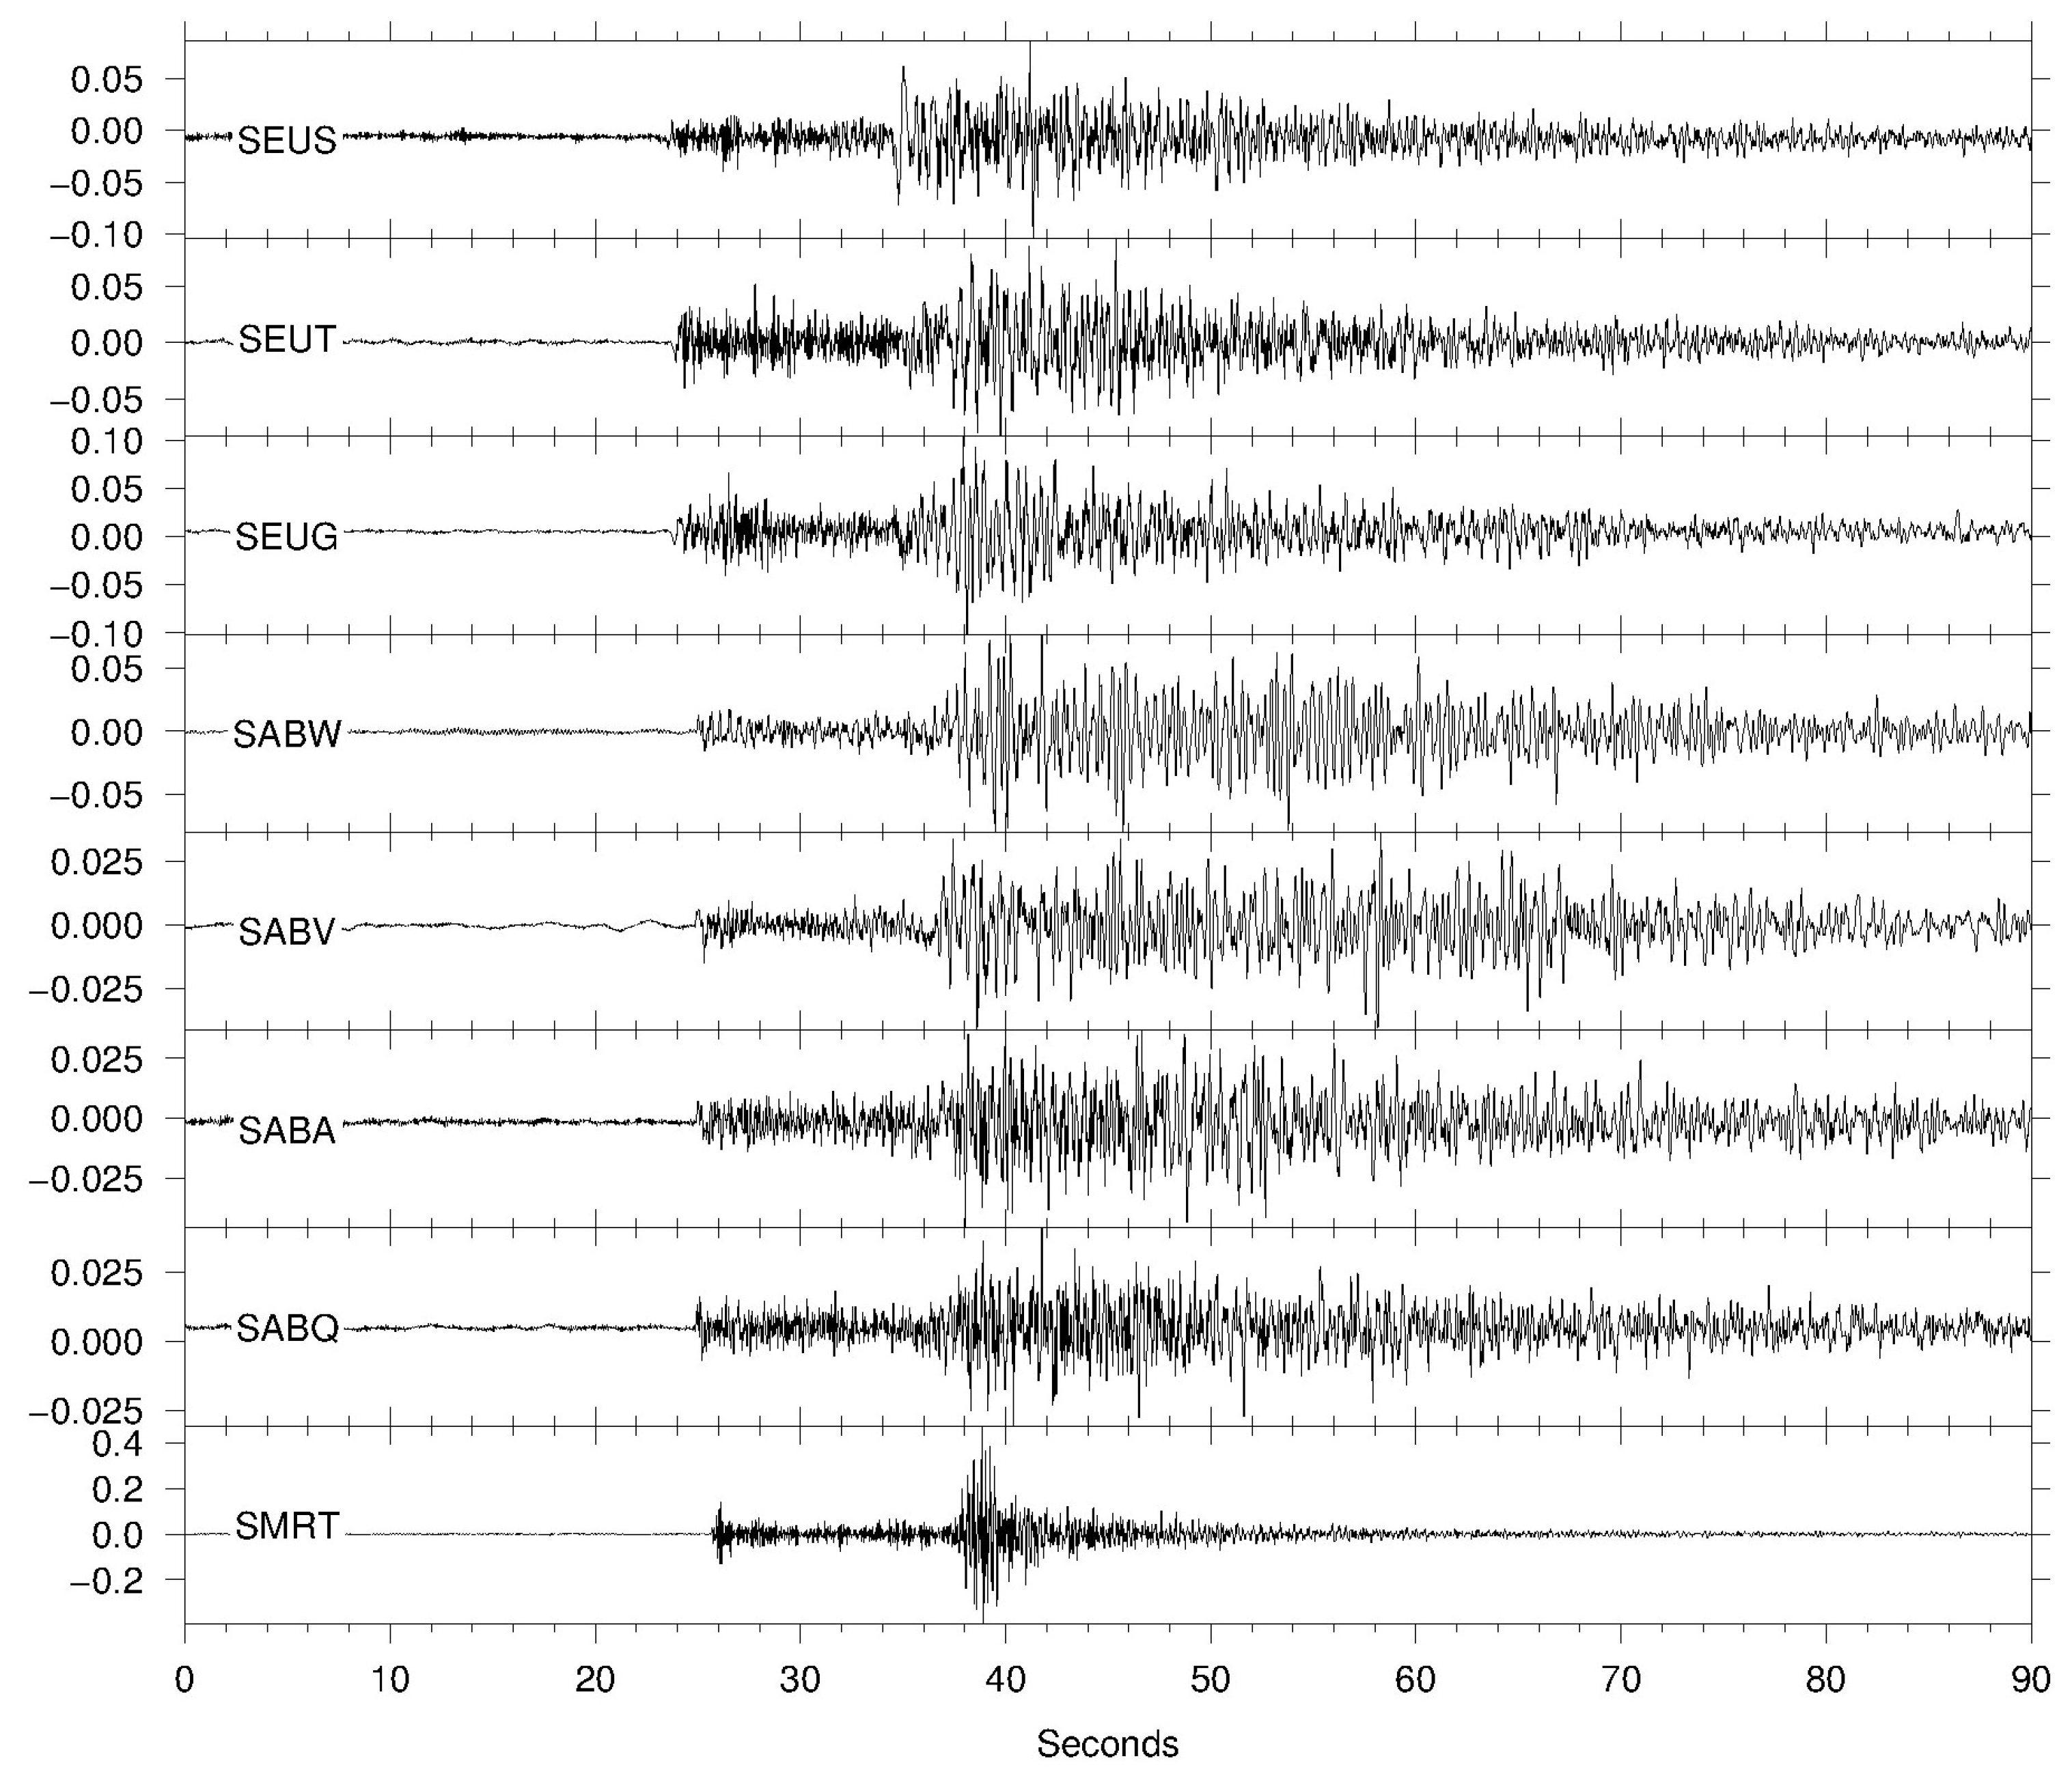
Since 2006, KNMI has operated the Caribbean Netherlands Seismic Network with the International Federation of Digital Seismograph Networks (FDSN) network code NA (www.fdsn.org/networks/detail/NA/ or doi.org/10.21944/dffa7a3f-7e3a-3b33-a436-516a01b6af3f), a permanent network of broadband seismometers on Saba, St. Eustatius and St. Maarten. The NA seismic network is designed to monitor both (a) seismicity in the Caribbean Netherlands region and (b) seismic signals preceding or accompanying the volcanic activity of Mt. Scenery and/or The Quill. Furthermore, the network fills the gap in seismic station coverage in the Northeastern Caribbean next to the Anegada Passage (Figure 4). Figure 5 shows an example of the recordings of a local earthquake near St. Eustatius. Typically, recordings of this type of earthquake correlate well around the P phase between the different NA stations, but their codas correlate poorly, which may be indicative of a complex velocity structure within/under the volcanoes.
2.1. Seismic Network NA: Caribbean Netherlands Seismic Network
The Caribbean Netherlands Seismic Network has been gradually expanded since 2006 and currently comprises four seismic monitoring stations on Saba (Figure 2), three on St. Eustatius (Figure 2) and one on St. Maarten. All seismic stations are equipped with a Streckeisen sensor that is characterised by a flat response to ground velocity from 120 s to about 10 Hz and a Quanterra datalogger (Table 2) that is configured to continuously record ground velocity at sample rates of 1, 40 and 100 samples per second (sps). The high (100 sps) sampling data streams are generated by the data logger with a minimum phase filter to optimize accurate seismic phase picking, while the lower sampling rate data streams are processed with a linear phase filter to provide undisturbed data for full waveform analysis [20,21]. Although each site has its own characteristics, the seismometers are installed in similar conditions: on the ground floor of buildings (owned by the local telecommunication company or the government) with concrete floor and walls, in a temperature controlled room without cisterns or open space underneath, and with access to power and Internet connections. Station SEUG, however, is located in a small concrete vault with a concrete plate base (2 × 2 m). The base plate is built upon a small gradient slope and is on private grounds. Both power supply and Internet are facilitated at this site, but there is no temperature regulator (e.g., air conditioning).
Each seismic station is connected to Internet and can be monitored, accessed and controlled remotely from the Netherlands. Each datalogger is configured (a) to transmit data in real-time to KNMI and the Tsunami Warning Center at Puerto Rico using the SeedLink protocol (www.seiscomp3.org/doc/applications/seedlink.html) and (b) to store data locally at the site to serve as a buffer to prevent data loss in case of long duration Internet failures. Data streams are synchronised in time by GPS time signals. All data streams are openly available to the research community through FDSN standardized webservices at KNMI (rdsa.knmi.nl/fdsnws/dataselect/1/), as well as through the standard data services provided by the Observatories and Research Facilities for European Seismology (ORFEUS) and by the European Integrated Data Archive (EIDA) (www.orfeus-eu.org).
2.2. Data Processing and Results
Monitoring the performance of a seismic network, in particular for volcano monitoring, is important to detect malfunctioning equipment at an early stage and to guarantee continuous recording of high quality data over time [22]. We used the technique of McNamara and Buland [23] to calculate the Power Spectral Density (PSD) of the noise level at each seismic station in terms of probabilities (Probability Density Function (PDF)), and applied this to the 40 sps continuous recordings. The results are presented (a) as the distribution of noise levels over the entire frequency range within a long time window (years) and compared with the standard low noise (NLNM) and high noise (NHNM) models by Peterson [24], and (b) as the temporal variation of the PSD for selected frequencies. The quantification of spatial and temporal fluctuations of seismic background noise enables the identification of significant changes in background noise levels or in data quality.
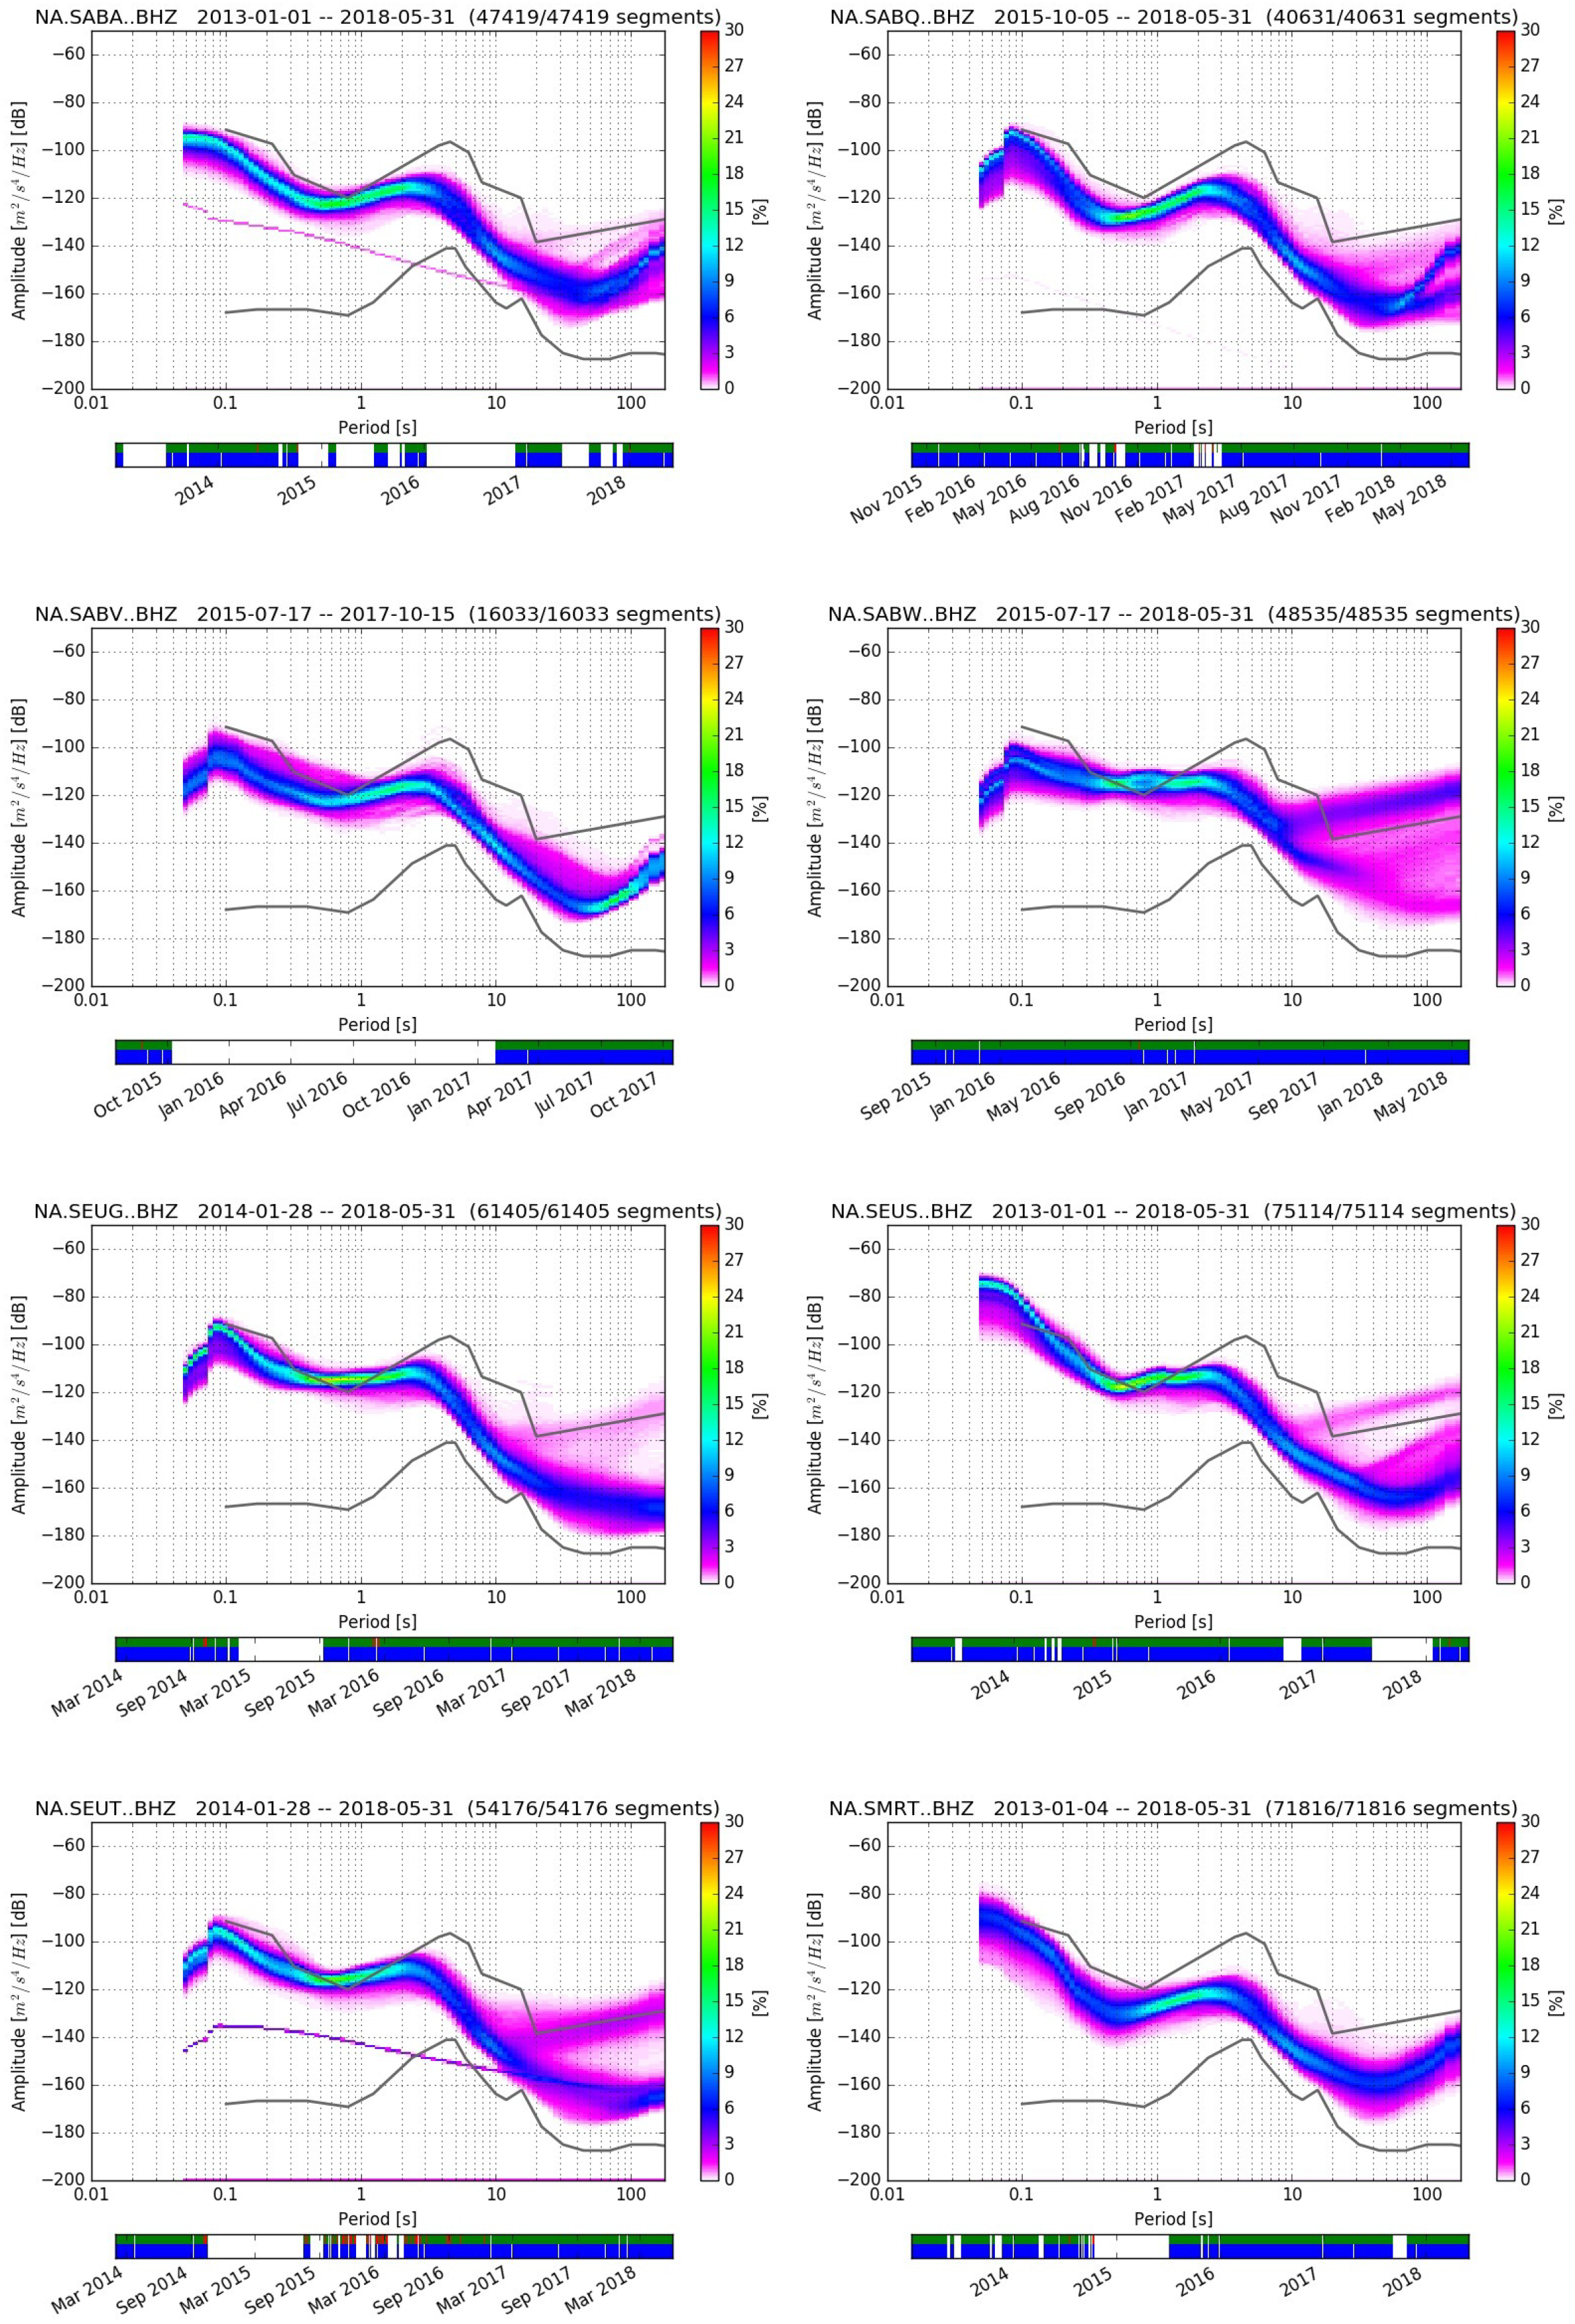
Raw data collected between 1 January 2013 and 1 June 2018 were deconvolved with the full seismometer response and processed using ObsPy [25]. The results of these analyses are presented in Figure 6 and Figure 7. Figure 6 shows the PDF of the background noise (vertical component, relative to acceleration) for each seismic station. All stations show similar characteristics, with high noise levels close to and equal to the NHNM above 0.5 Hz (as can be expected on small oceanic islands), while at lower frequencies, the background noise drops significantly to lower values. In Figure 7, the corresponding PSD variations over time are presented for two frequencies: at 0.01 and 1.0 Hz. These frequencies are selected to monitor (a) variations in long-period noise that are often affected by temperature changes and/or major tilting of the seismometer, and (b) variations in intermediate frequencies often related to anthropogenic noise and/or weather conditions.
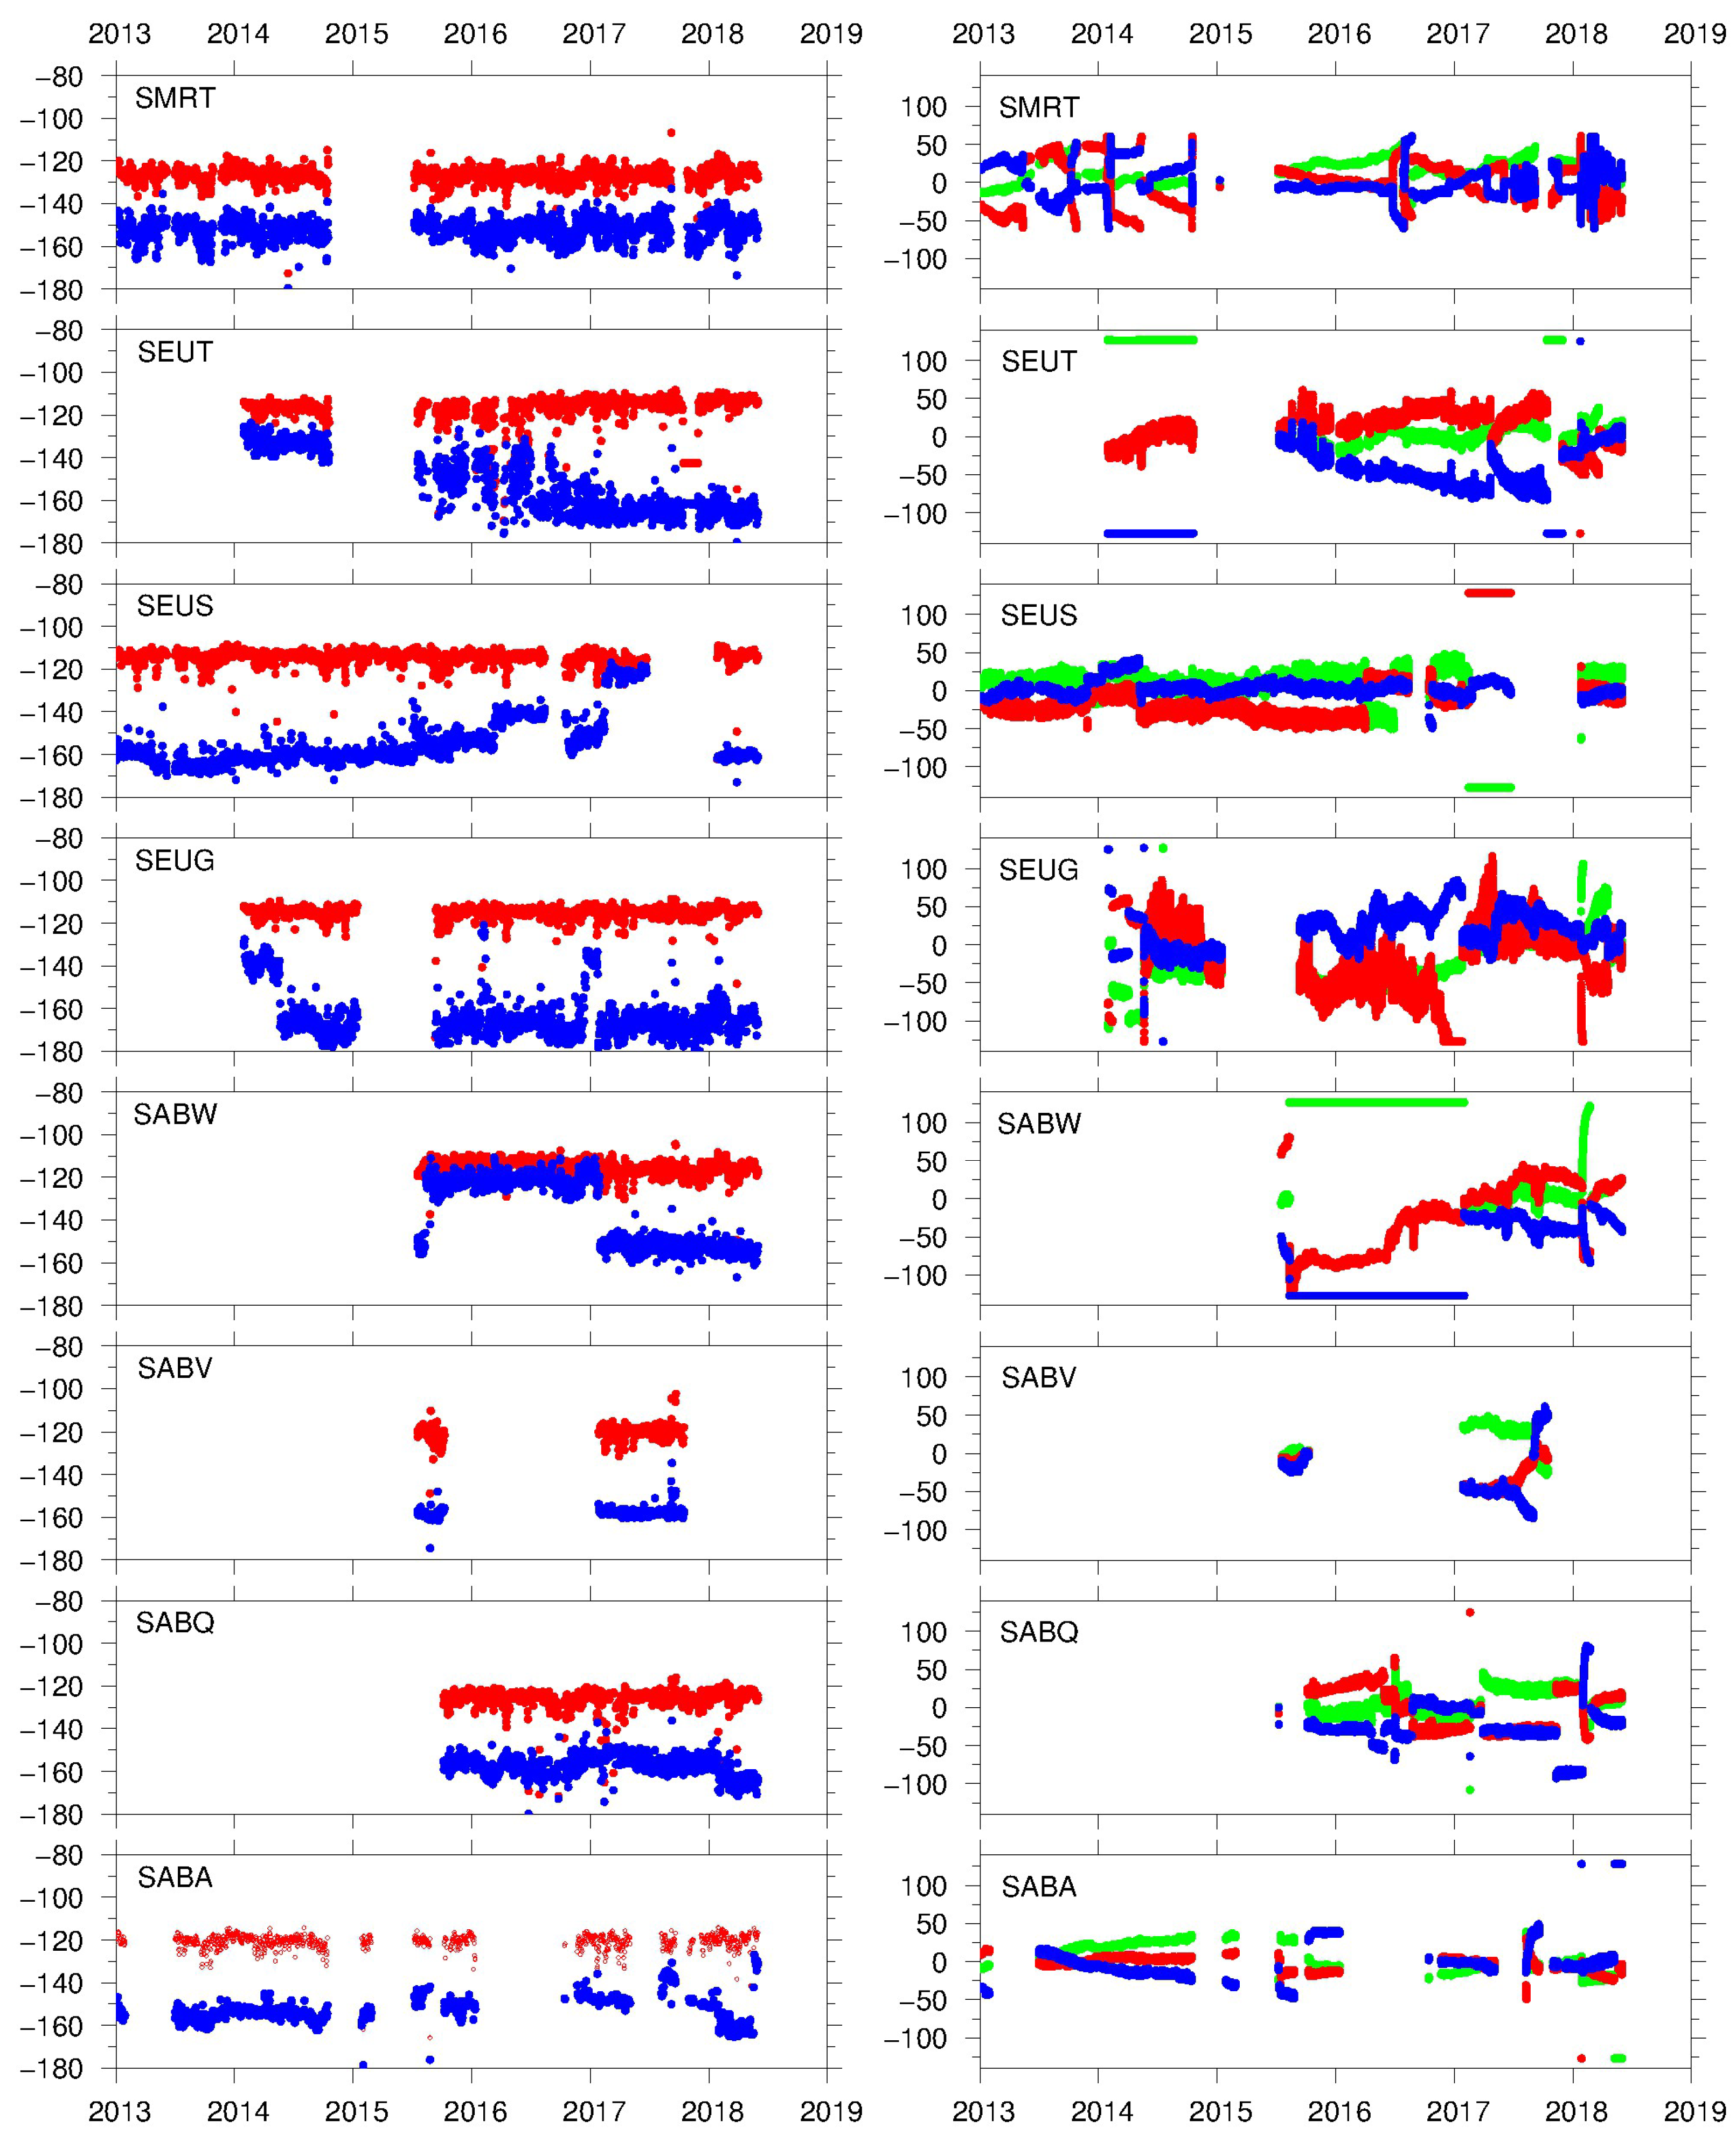
Except for stations SMRT and SABV, the long-period (>10 s) noise PSD at each station (Figure 6) has two distinct branches coinciding with a stepwise change of the long period noise in the time-domain, as shown in Figure 7a, which can be attributed to sudden changes in the seismometer mass positions (Figure 7b). This observation shows the importance of monitoring the mass positions of the seismometer and/or the long-period noise variations over time in order to detect data quality issues.
In general, variations in waveform data quality between seismic stations or over time are related to: (a) varying site conditions (e.g., building structure, soil composition, and environmental parameters); (b) communication and infrastructure issues (power, Internet); and (c) timing problems. All of these are observed in the seismic waveform data of our network. Many data gaps (Figure 7) are related to communication issues, such as network configuration changes, hardware failure, and power outages caused by a broken UPS or due to lightning damage. Another factor is the lack of timing caused by a damaged GPS antenna (e.g., during a hurricane) or deterioration of the antenna cable due to UV radiation.
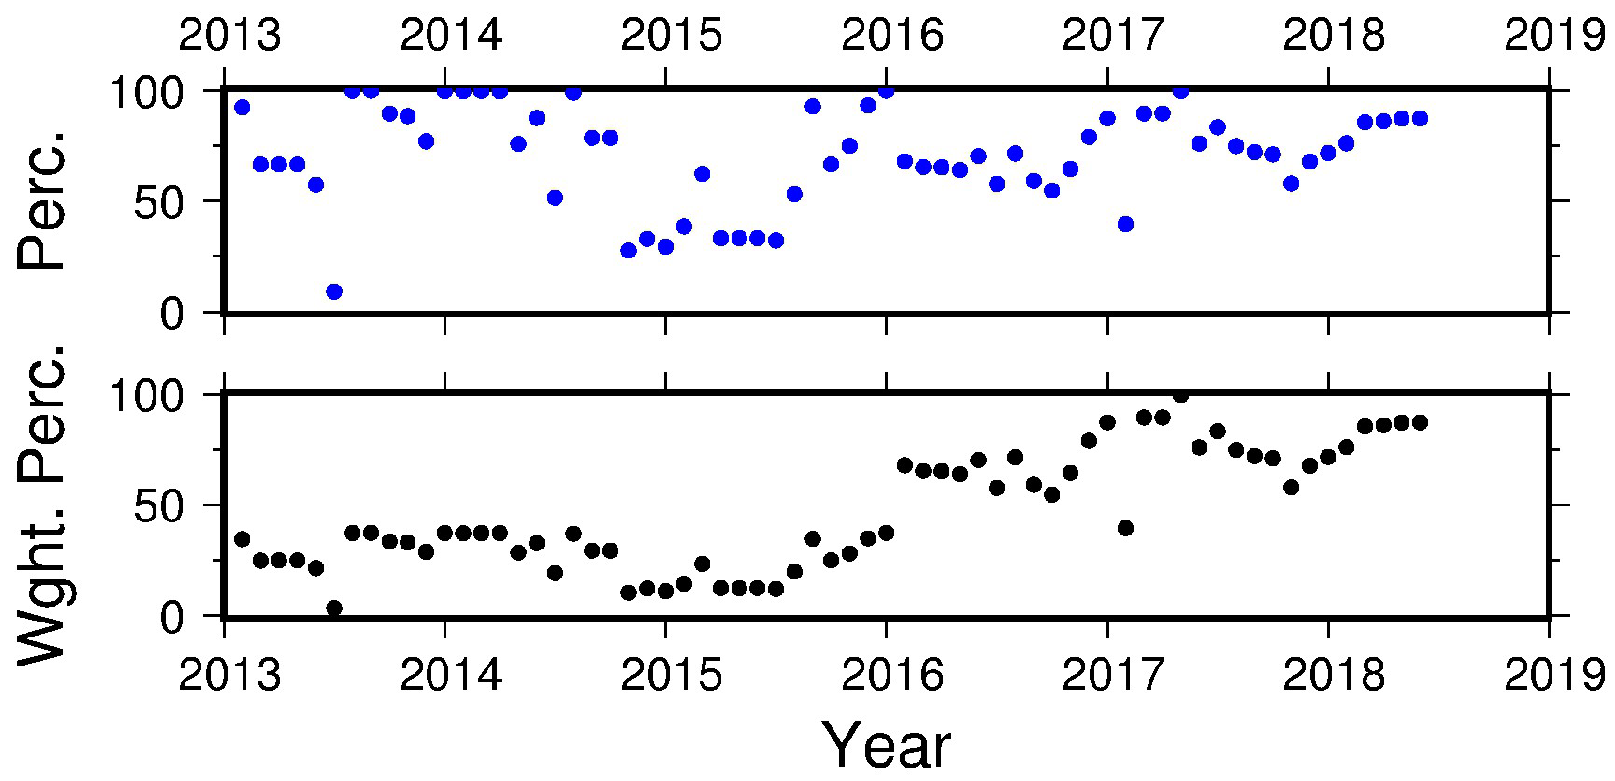
Over the years, we have managed to minimise data loss and succeeded in optimising the waveform data quality by implementing various improvements in the installation and the infrastructure at the sites. For example, the use of local data storage devices, the protection of cables against UV radiation, the use of controlled UPSs, and efforts towards local capacity building to increase local awareness and support, all decreased the overall data loss and improved the timing quality. Figure 8 shows the data availability percentages per month for the NA network since 2013, as well as its weighted percentage. The weight factor is used to value the impact of the network size and equals the number of deployed stations in the network for each year compared to the current configuration (eight stations). The percentage of network data availability has increased over time and reached a stable level of about 85% in the first 6 months in 2018, which is significantly higher than the percentage for the overall time window of 70.3% in the years before. Currently (July 2018), only station SABV is not operating (in repair after possible lightning damage), while the other stations show very high data availability percentages in 2018: SABA 99.7%, SABQ 99.8%, SABW 99.7%, SEUG 98.3%, SEUS 80.2% SEUT 98.6% and SMRT 99.4%.
Long data gaps, due to lightning damage, for example, have a severe impact on the data availability of the overall network and often require local support to solve. By putting efforts into local capacity building, we aim to further reduce data loss and prevent severe damage to the equipment. For example, during the passage of Hurricane Irma in September 2017 the power supply was pro-actively switched off at most sites to prevent possible damage by potential electrical breakdown. Only station SEUG operated throughout the passage of the hurricane and provided ground velocity data in real-time via a Satellite Internet connection. Also, simple maintenance tasks like the rebooting of the datalogger can be completed by local contacts.
The loss of data quality due to an out-of-balance mass position in the seismometer remains to be solved. In general, the seismometer performance is strongly influenced by tilt (mainly affecting the horizontal components), pressure variation (e.g., barometric-induced tilt and deformation of the suspension system), and temperature fluctuations (air convections, change of geometry of the suspension; [26]). In order to protect the seismometer against temperature changes and human-induced tilt, the sensors were packed with dry sand in early 2018 (Figure 9). Unfortunately, this did not prevent a new case in which the mass position (or boom position) went beyond the operational range. In other words, the large relative mass acceleration, with respect to the ground, could not be compensated by the feedback system to keep the mass centered. Although the dataloggers are configured to automatically recenter the mass, sudden large amplitude accelerations cannot be compensated for and result in an unbalanced mass. Such large accelerations are usually an effect of tilting of the sensing system or deformation of the suspension system. Tilting may have local causes, like heavy traffic or groundwater movement, or atmospheric pressure variations leading to (sub)surface tilt over a larger region. The mass position plots (Figure 7) seem to indicate unidirectional tilt in some cases (e.g., SABA, SEUS, SEUT) indicated by the gentle slope of the mass position levels over longer time periods, before the instrument becomes out-of-balance. In some cases (e.g., SABV, SABW), short term (order of months) tilt seems to be approximately transverse to one of the sensor components so that the other two drift away in opposite directions.
Figure 10 shows four examples of waveform data prior to and during the out-of-balance event, three (SEUS, SEUT, SABW) before insulation by sand and one after (SABA). The type of signals in Figure 10 are not of seismic origin but correlate with (relatively) large offsets in the mass positions in the seismometer. It is therefore evident that monitoring of the mass positions is required in any quality monitoring system. The four examples show different features in the signals at different scales prior to reaching the operational limits, indicating different causes. For SEUS and SABA, the waveforms show a disruption on all components, while at SEUT and SABW, mainly the horizontal components are affected. Note that both stations equipped with an STS-2 (SEUS, SABA) as well as stations with an STS-2.5 (SEUT, SABW) are affected (Table 2). We assume that local tilt may be responsible for the observations in SEUT and SABW, while for SEUS and SABA, the cause remains unclear. Deterioration issues of the sensors (e.g., corrosion of a spring) cannot be ruled out, as both sensors at SEUS and SABA are of the same type (STS-2) and have been in operation since 2006. Further simultaneous analysis of the mass positions and the broadband waveforms may help to exclude, or find, some explanations. Worth noting is that the passage of Hurricane Irma on 6 September 2017 (Julian day 249) across St. Maarten and of Hurricane Maria on 17 September 2017 (Julian day 260) in the region did not cause ground accelerations resulting in an out-balanced mass at any of the seismometers in our network. The impact of the hurricanes on the seismometer network was limited to two cases of broken GPS connections.
3. Expansion of the Monitoring Network
The earthquake detection and location performance of a seismic network strongly depends on the network configuration and the background noise levels affecting the seismic recordings. The ability to automatically detect and locate small- and medium-sized earthquakes requires a seismic network with a sufficient number (usually a minimum of 6) of geographically distributed seismic stations with relatively low noise seismic background levels. The NA network is an important contribution to the regional earthquake and tsunami warning monitoring systems. The small number and the geographical distribution of the sites at each island, however, are also challenging for the development of automatic volcano monitoring systems based on seismicity. Considering the relatively high noise levels at each site, the automatic detection and location capabilities for small, local earthquakes can only be improved by extending the seismic network. This serves the purpose of (a) redundancy by continuously acquiring data for earthquake detection during times of data drops or quality issues at some stations; and (b) to decrease the azimuthal gap of the current network to detect earthquakes on the islands. For example, the north-west of Saba and the south-east of St. Eustatius are poorly monitored by the current network configuration.
Volcanic eruptions do not always occur following typical seismic indicators. In 2016, Pavlof Volcano, Alaska, erupted a sustained ash plume, reaching 5–9 km in altitude for ~40 h without seismic precursors [27]. Also, it is not uncommon for the onset of an eruption to follow only hours after seismicity increases, as happened at Calbuco, Chile in 2015 [28] and at Hekla, Iceland in 2000 [29], allowing little time for precautionary measures. Similarly, not all volcanoes deform before erupting ([30] and references therein), or at least this precursory deformation remains undetected. The monitoring of a volcano is thus best done using multiple techniques to assess the state of activity. KNMI is, therefore, developing the monitoring system at Saba and St. Eustatius towards a multiparameter network with continuous Global Navigation Satellite System (GNSS) measurements and temperature measurements of the hot spring at Saba, both implemented in early 2018. Also, KNMI collects weather measurements at the airports of Saba, St. Eustatius, and St. Maarten. Such data are important to investigate and monitor correlations between environmental data (e.g., barometric pressure, air temperature, wind speed and direction, precipitation) and data from our volcano monitoring network.
Data collected by monitoring networks are often multi-purpose and can serve not only the initial goal of volcano monitoring and regional earthquake detection but can also be used outside the direct scope of that work. An example of this is the existing real-time data feed of seismic data to the Caribbean Tsunami Warning Program (CTWP; www.weather.gov/ctwp/), where the data are used for tsunami warning services. Furthermore, KNMI opted to install GNSS receivers, capable of ionospheric scintillation observations, which can be used for space weather monitoring. Space weather can influence everyday life, for example, by impacting the Earth’s climate and by disturbing GNSS observations and satellite communications, and the importance of space weather observations has been recognised worldwide [31].
4. Global Navigation Satellite System (GNSS) Measurements
GNSS measurements use ground stations to observe the 3D surface displacement field. Nowadays, continuous GNSS observations are widely applied for the (near) real-time monitoring of active volcanoes, for example, at Piton de la Fournaise, La Réunion [32] and in Central Africa (KivuGNet [33]). The more labor intensive campaign-style GNSS measurements are used to enable tracking of 3D surface deformation over a wider area, albeit with lower temporal resolution. Compared to GPS measurements, GNSS measurements take advantage of signals broadcast by a diversity of satellite navigation systems, such as the American GPS, Russian GLONASS, European Galileo, and Chinese BeiDou systems, thus improving their accuracy, redundancy, and availability.
In the framework of the Continuously Operating Caribbean GPS Observational Network (COCONet), 61 continuous GNSS stations were installed in the Caribbean by 2014. The aim of the project is to create a large-scale geodetic and atmospheric infrastructure to improve understanding of geohazards in the region, such as earthquakes, hurricanes, flooding, volcanoes, and landslides, but also, to improve the understanding of the kinematics of the regional tectonic plates [34].
In 1998, ten markers for campaign-style surveys were installed on Saba and St. Eustatius [35]. GPS campaign surveys were conducted at these sites in 1998, 2000, 2001, 2004, and 2009, and the data were used to study the complicated kinematics of the Caribbean subduction zone [35,36,37]. According to Turner [35], velocity azimuths with respect to a fixed Caribbean plate are NW for Saba and St. Eustatius, sub-parallel to the arc, supportive of a NW translation of a forearc sliver.
4.1. Installation of Continuous Global Navigation Satellite System Instruments
When planning to install a continuous GNSS instrument for volcano monitoring, several points have to be taken into consideration:
- The location with respect to the volcano and other monitoring equipment;
- The availability of bedrock and stability of the site to create a monument to mount the antenna;
- Access to power and data transmission (communication) facilities;
- An unobstructed clear view of the sky in all directions (360 when possible) considering human activity, buildings, and vegetation coverage;
- A convenient path and path length for running the cables;
- Protection against lightning strikes;
- The safety of the equipment (secured from vandalism).
Following these considerations, both islands were scouted in early 2017 to find suitable locations for two continuous GNSS instruments (one on each island). After thoughtful consideration, two locations were chosen co-located with already operating seismometers: “SABA” on Saba and “SEUT” on St. Eustatius (Figure 2). At both of these sites, a monument was constructed for the stable placement of the antenna. This monument consists of a concrete base and a stainless steel support anchored into bedrock (Figure 11). The coupling of the antenna to the bedrock is guaranteed by the use of a one piece, 1.7 m long stainless steel rod, drilled 70 cm into solid bedrock and epoxied in place, covering the full length of the monument. Four additional rebar rods improve the coupling to the bedrock of the concrete base of the monument, and rebar rings reinforce the base. The stainless steel support, covering the top end of the long rod, is screwed onto the concrete base and held in place by a bolt at the top. The long rod is topped with a SECO mount to allow precise leveling of the PolaNt choke ring B3/E6 antenna with spike and its precise orientation towards the north. The skyview at both sites is mostly unobstructed (Figure 12), although vegetation coverage will need to be controlled especially on St. Eustatius. The receiver, a Septentrio PolaRx5S, is placed inside the same building as the broadband seismometer (SABA), where access to power, using a wall outlet, and data transmission, using ethernet, is secured. To minimise disturbances from human activity and to prevent obstruction by buildings, the antennas were placed away from the building, necessitating a relatively long (35–40 m) cable to connect the antenna to the receiver. To limit data loss, a high quality flexible LMR-600 cable was used, covered with a protective conduit. To prevent damage from lightning strikes, the cable was protected by a Times Protect LP-GPX-05 lightning and surge protector upon entering the building. The receivers are configured to acquire three data streams with different frequencies: every 15 s in 24 h blocks (15s24h in RINEX format), at a frequency of 1 Hz in 1 h blocks (1hz1h in RINEX format), and at a frequency of 20 Hz in 1 h blocks (20hz1h in SBF format). Data are saved internally as well as sent to KNMI four times a day.
4.2. Data Processing and Results
At KNMI, data are automatically processed in 24 h batches, using the Bernese software version 5.2 [38], first using rapid, and later, final satellite orbits from the Center of Orbit Determination in Europe (CODE). We applied ocean-loading parameters using the FES2014b model [39], obtained from the Onsala ocean-loading provider (holt.oso.chalmers.se/loading), and S1 and S2 atmospheric tide loading values from the Global Geophysical Fluid Center (geophy.uni.lu/ggfc-atmosphere/tide-loading-calculator.html). We followed the “RNX2SNX” Bernese processing chain, which conducts a double difference-based analysis of RINEX GNSS observation data from a regional network.
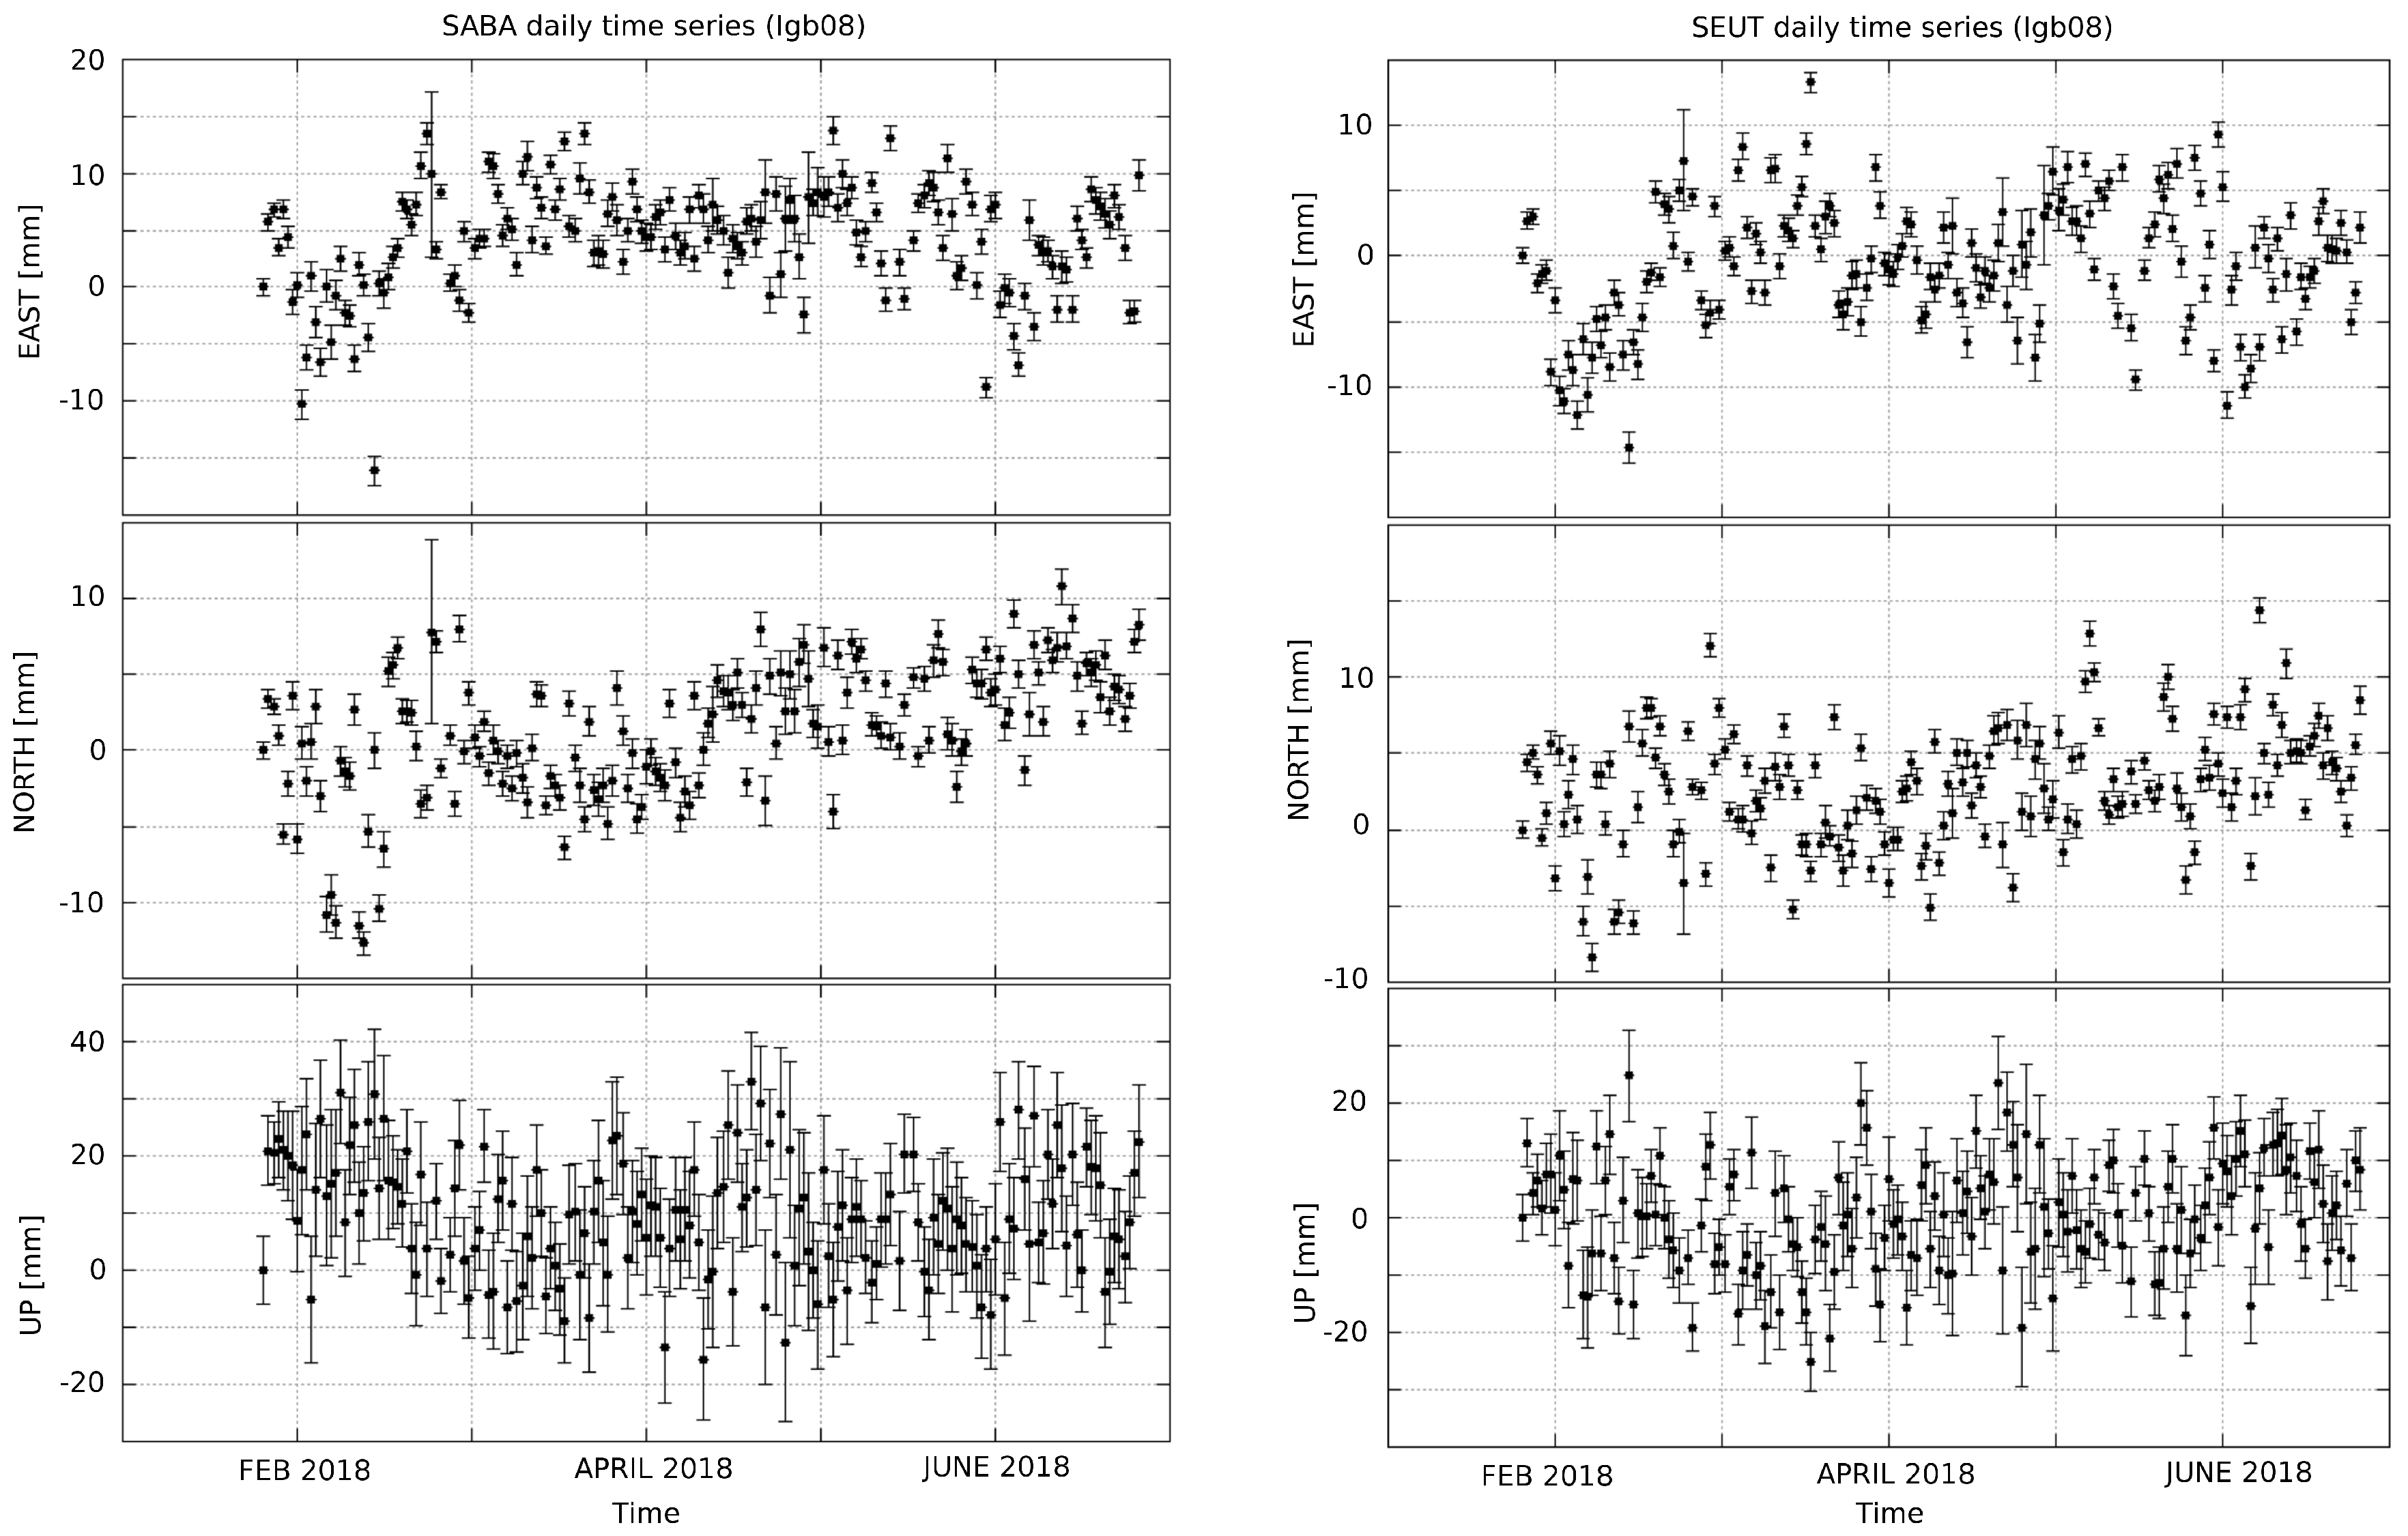
Daily solutions are tied to the ITRF2008 reference frame by processing a set of International GNSS Service (IGS) sites as references. Currently, 10 IGS stations are used as references: ABMF, RDSD, and CRO1 on the Caribbean Plate (CP), BRMU, GODE, and MDO1 on the North American Plate (NAP), and KOUR, POVE, RIOP, and SALU on the South American Plate (SAP). A variable seasonal signal can be detected in all GNSS time series [40], and when a sufficiently long time series exists, the parameters necessary to correct this signal can be estimated. As in the time series for GNSS stations SABA and SEUT only 4 months of data are present so far, no seasonal corrections are applied yet. Figure 13 shows the preliminary results of data processing for newly set-up stations.
5. Hot Spring Activity
Hot springs are manifestations of volcanic activity generated by the interaction of groundwater with magma or solidified, but still hot, igneous rocks at shallow depths. Changes in the temperature and/or in the chemical signature of hot springs may result from a change in volcanic activity [41]. Hot spring monitoring is therefore a valuable addition to any volcanic monitoring network.
5.1. Historic Accounts
The hot springs of Saba, which were first described in 1903 [42], are all located close to the shoreline and orientated along a NE–SW line crossing the island. Over time, four different hot spring locations have been reported: (i) Well Bay; (ii) between Ladder and Tent Bay; (iii) submarine; and (iv) opposite Green Island (Figure 2). According to Roobol et al. [43] and Roobol and Smith [2], the hot spring at Well Bay (i) was reported by Sapper [42] and was destroyed at some point thereafter. However, in the account of his visit to the islands, Sapper [42] reports the temperature of the hot spring (Table 3) between Ladder and Tent Bay (ii) and mentions another hot spring “at the north side of the island”. He never states this hot spring to be located at Well Bay, and therefore, we regard the existence of this spring as unproven. The temperature of the hot spring between Ladder and Tent Bay (ii) has been measured at irregular intervals since Sapper’s first visit in 1903. Until 1994, the average measured temperature was around 55 ± 4 C. Values measured after 1996 showed an increased average temperature of 63 ± 3 C. In 1999, the temperature was measured for the last time, and the site was covered by a landslide, preventing any further measurements. A submarine hot spring (iii) 150 m offshore of Ladder Bay was discovered by SCUBA divers around 1988. A second submarine hot spring was reported in 1994, south of Green Island. No temperature measurements exist for these sites. The hot spring opposite Green Island (iv) on the shoreline at the north side of the island is located below the sulfur mine. Access to the site is complicated by the high surf and vertical cliffs. Between 1979 and 1994, temperatures of 69 ± 3 C were measured. Between 1996 and 2008 temperatures of 82 ± 4 C were measured, an increase comparable to the increase at the hot spring between Ladder and Tent Bay (ii). When we visited this site in January 2018, the spring was submerged below 30 cm of seawater, and our temperature measurement of 69 C is, therefore, a minimum.
Beside the hot springs, the abandoned sulfur mine (v), right above the hot spring opposite Green Island, is a location where heat can be expelled from the volcano. The location of this mine coincides with the NE–SW alignment of the hot springs across the island. Together, these may be the surface expressions of a fault running through the submarine basement underneath Saba.
5.2. Long Term Temperature Observations
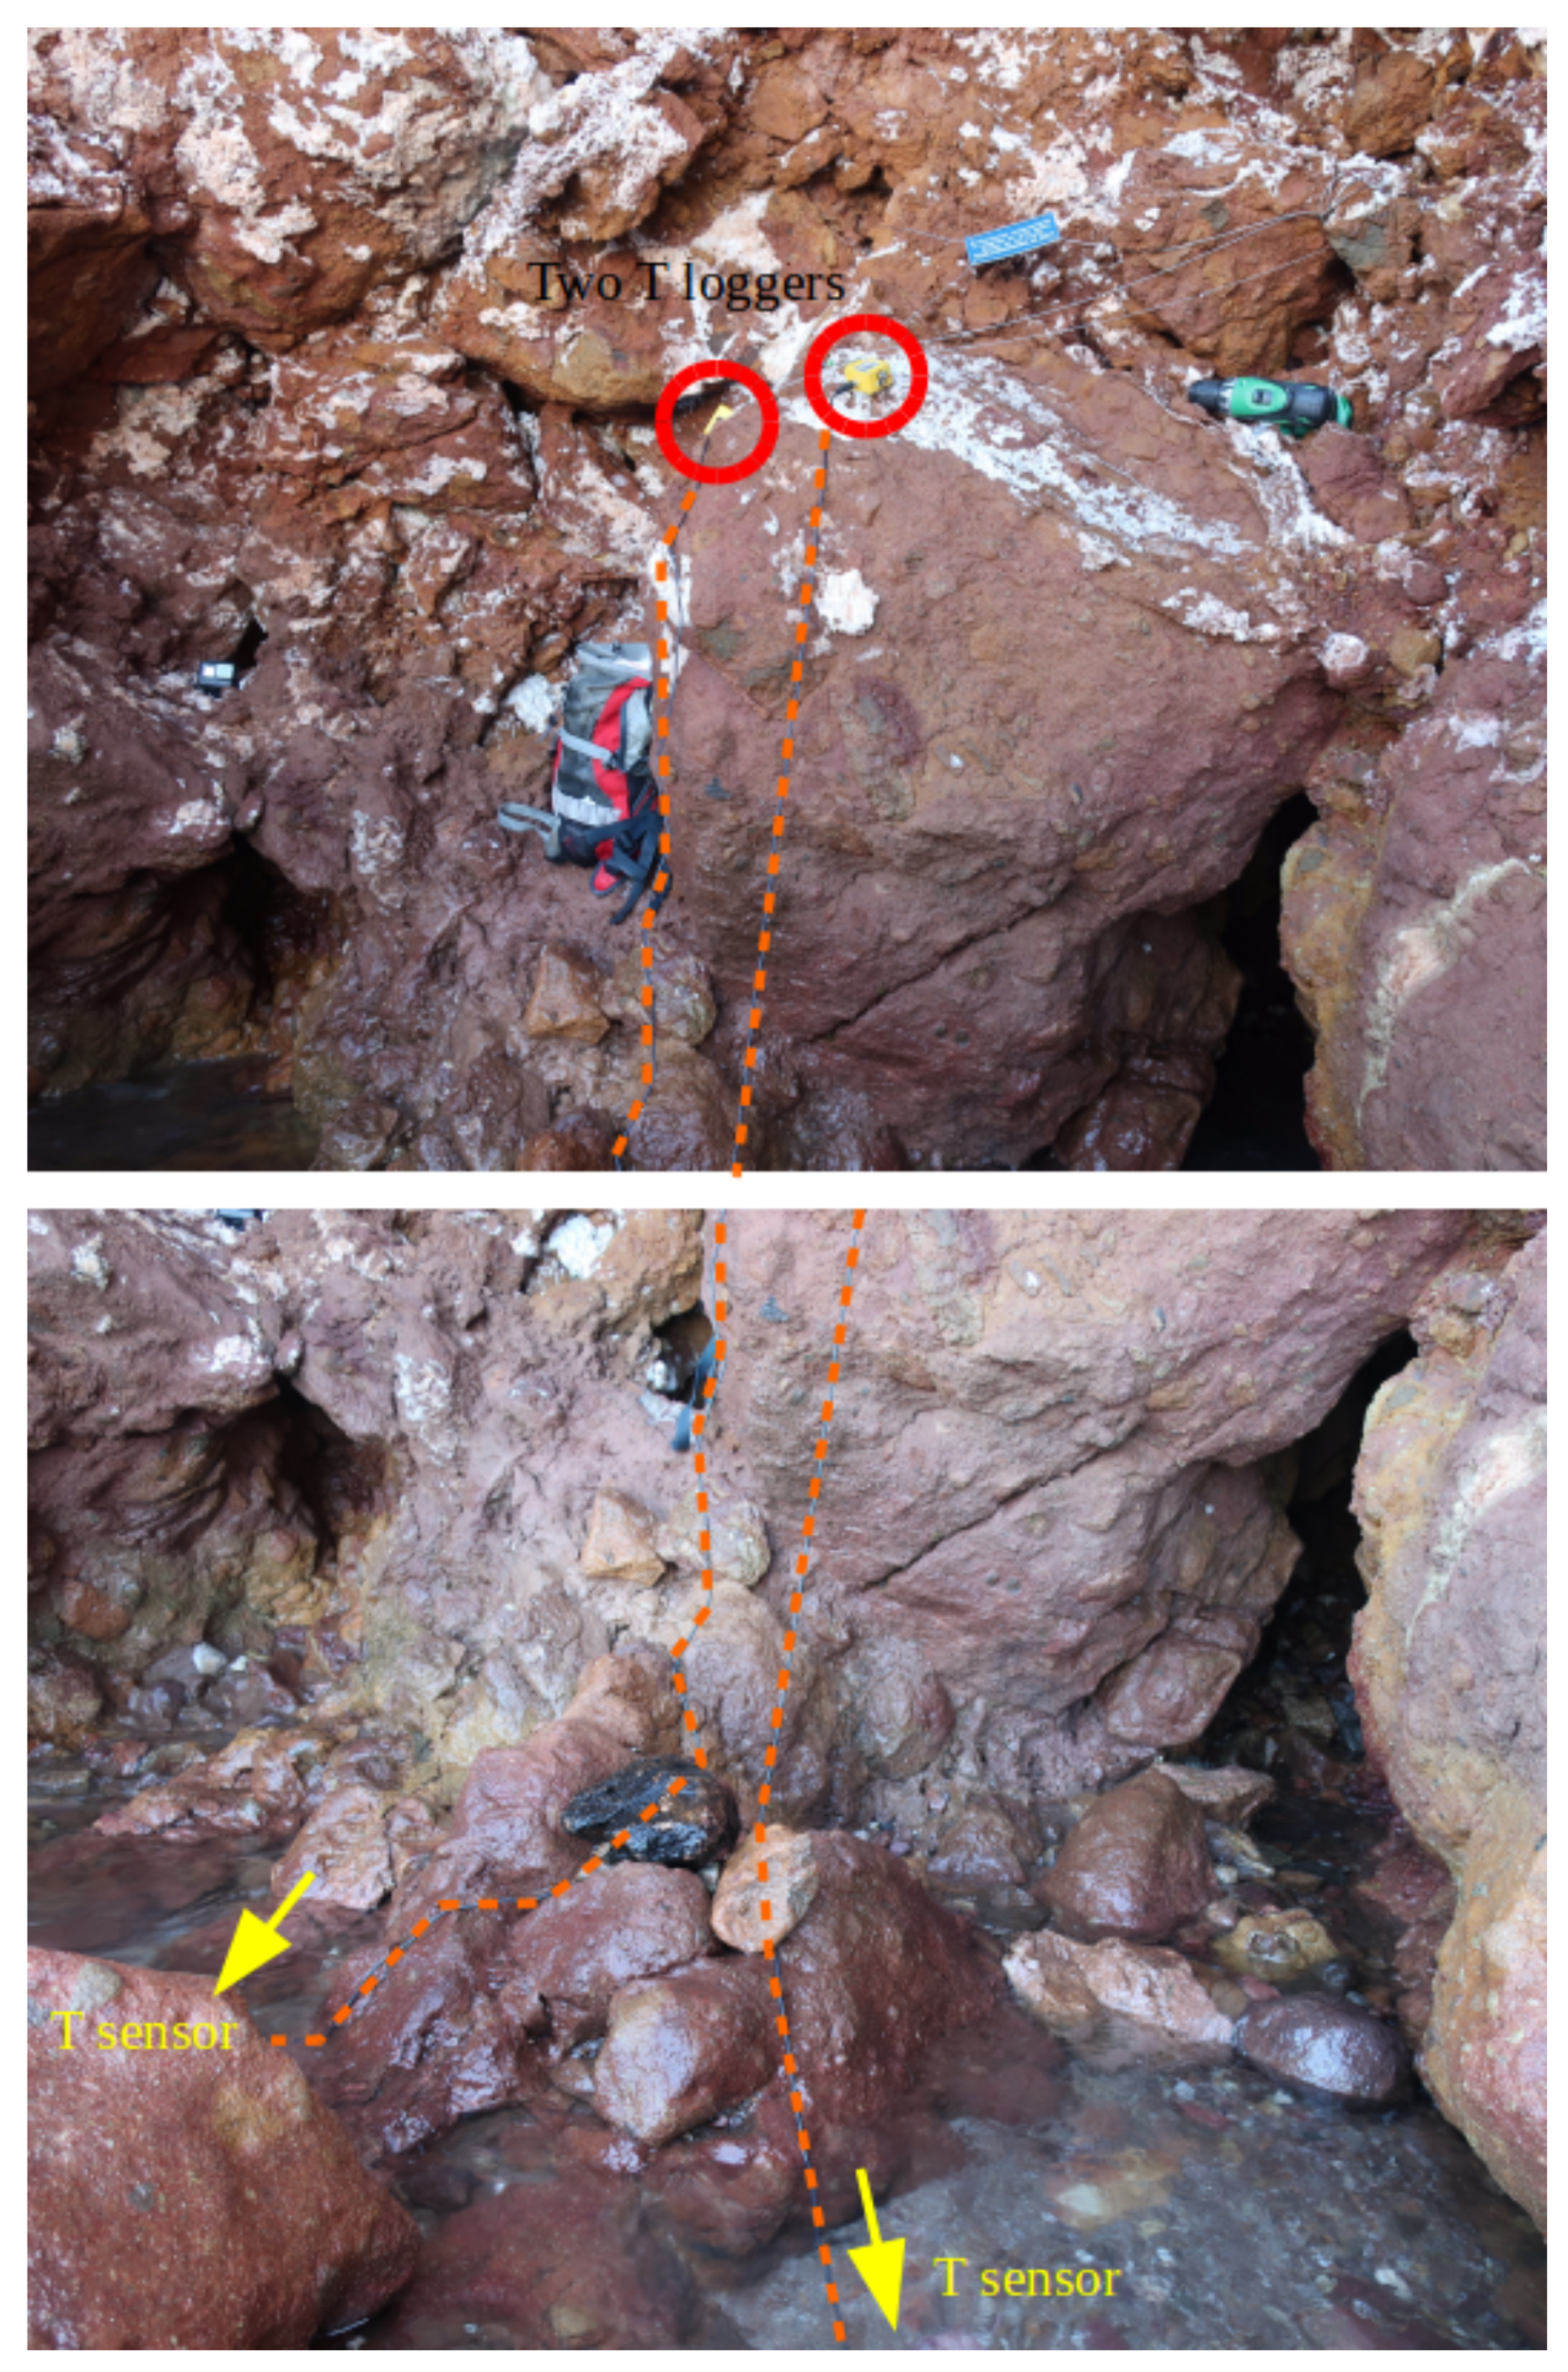
In January 2018, the hot spring opposite Green Island covered an area of 5 m2 where hot water seeps from the sea bottom. Because the area is submerged, it is impossible to see where the exact source is located. Therefore, a hand-held waterproof thermometer was used to find the hottest areas. We installed two “tinytag plus 2” data loggers with two PB-5001 thermistor probes (Figure 14) from Gemini Data Loggers in the two hottest areas. Every 20 min, the average temperature reading of the previous minute is stored, allowing data storage for at least one year. Due to the high surf activity, it remains to be seen how long the temperature probes and their cables will survive. A more rugged installation is planned for the future.
6. Discussion and Conclusions
The current monitoring network of Saba and St. Eustatius is in development. The goal is to enhance the monitoring capability in liaison with the volcanic threat. Future improvements include (i) the installation of a seismic station in the SE of St. Eustatius and the NW of Saba; (ii) two more GNSS stations on each island, with one station on each island co-located with the seismic equipment just mentioned if possible; (iii) a more durable temperature sensor which transmits data in real-time to monitor the hot spring on Saba; and (iv) investigations to better understand the mass out-of-balance of the seismometers. The first scouting for potential sites to fulfill point (i) was done in early 2018, and two potential sites, one on each island, were identified. Neither of them has power nor communication facilities available; therefore, the installation will be more complex and will require solar panels and a battery as well as a way to transmit data to KNMI. More investigations are needed to successfully complete this task in an affordable way.
Further expansion of the monitoring network, including observations with other techniques, remains possible. Campaign GPS/GNSS measurements would increase the deformation data coverage and when revisiting previously observed sites [35], changes through time could be evaluated. The Interferometric Synthetic Aperture Radar (InSAR) technique uses satellite images, covering the whole islands, to detect centimeter-scale surface deformation through time. Even though the technique is hampered by shadowing effects due to steep topography and by coherence loss in vegetated areas, the observations can be useful, as was shown by the example of the neighboring island of Montserrat [44]. InSAR observations may thus complement the existing measurements without requiring field visits or expensive equipment.
Setting up a monitoring network requires time, effort, and finances and can be complicated in areas that are not in close proximity to the monitoring agency (KNMI, in this case). Continued support, financially and scientifically, as well as from the local government and populace, is required to sustain such a network. To enable the observation of changes in geophysical parameters and to ensure timely warning, a monitoring network needs to be operational even when volcanic activity remains at background levels. More specifically, it is crucial to establish a monitoring network before any activity takes place. Despite the fact that sustaining such a network in tropical conditions remains a challenge, it is the only way to ensure that potential future volcanic activity is detected in advance, benefiting the safety of the local populations. This work helps to prepare for future hazards, while, at the same time, it provides value added to space weather, earthquake, and tsunami studies/warnings.
Author Contributions
R.S. started the network set-up in 2006 with contributions from KNMI colleagues. Progression towards a volcano monitoring network was initiated by E.d.Z.-v.D. and carried out by E.d.Z.-v.D. and R.S. with support of technicians from KNMI. R.S. maintained the seismic network over the years and performed all seismic data analysis. E.d.Z.-v.D. designed the GNSS benchmarks with contributions from KNMI technicians and conducted the GNSS data analysis. E.d.Z.-v.D. and R.S. equally contributed to the writing of the manuscript.
Funding
This research received no external funding.
Acknowledgments
We are very grateful to Rignald Eugenio, and his colleagues from the Meteo Service St. Maarten, who always selflessly supported the build up of the seismic network since 2006 in many ways. Also the continuous help from Tim van Oosteren and his colleagues from Satel, and from Fernando Simmons from Eutel, for more than 10 years, is very much appreciated and still is very important to make our monitoring network successful. We thank George and Sally Works for their technical advice and support to deploy seismic station SEUG. We thank in particular our KNMI colleagues Jan-Willem Schoonderwoerd and Hendrik-Jan Bosch for their technical support and logistics with the installation of both GNSS stations. This work would not have been possible without the continued support from the governments of Saba and St. Eustatius, especially Jonathan Johnson, Fanny de Swarte, Julian Woodley and Edris Bennett. Also the local support from Ryan Espersen, Kai Wulf and Ellis Schmidt is greatly appreciated. Our list would be incomplete without thanking, in no particular order: Leo Dogterom Verburg, Frits van de Peppel, Gert-Jan van den Hazel, Bernard Dost, Läslo Evers, Guy Lemmens, Yasmine Hunter, Billy McGill, Patricia Grollé, Robert Jan Wilde, Benni Ófeigsson and Nicolas d’Oreye. An earlier version of the manuscript benefited from suggestions offered by Mike Poland. Finally, we thank four anonymous reviewers for their insightful remarks.
Conflicts of Interest
The authors declare no conflict of interest.
Abbreviations
The following abbreviations are used in this manuscript:
| COCONet | Continuously Operating Caribbean GPS Observational Network |
| CODE | Center of Orbit Determination in Europe |
| CP | Caribbean Plate |
| EIDA | European Integrated Data Archive |
| FDSN | International Federation of Digital Seismograph Networks |
| GNSS | Global Navigation Satellite System |
| ISC | International Seismological Center |
| IPGP | Institute Physique de Globe de Paris |
| IRIS | Incorporated Research Institutions for Seismology |
| ITRF | International Terrestrial Reference Frame |
| KNMI | Koninklijk Nederlands Meteorologisch Instituut (Royal Netherlands Meteorological Institute) |
| MVO | Montserrat Volcano Observatry |
| NA | Nederlandse Antillen (Dutch Antilles) |
| NAP | North American Plate |
| NHNM | New High Noise Model |
| NLNM | New Low Noise Model |
| ORFEUS | Observatories and Research Facilities for European Seismology |
| Probability Density Function | |
| PSD | Power Spectral Density |
| RINEX | Receiver Independent Exchange Format |
| SAP | South American Plate |
| SCF | Saba Conservation Foundation |
| SRTM | Shuttle Radar Topography Mission |
| TRN (SRC) | Trinidad Seismic Research Centre |
| UNAVCO | University NAVSTAR Consortium |
| UPS | Uninterruptible Power Supply |
| USGS | United States Geological Survey |
| UTC | Universal Time Coordinated |
References
- Brown, S.; Sparks, R.; Mee, K.; Vye-Brown, C.; Ilyinskaya, E.; Jenkins, S.; Loughlin, S. Country and regional profiles of volcanic hazard and risk. In Global Volcanic Hazards and Risk; Loughlin, S., Sparks, R., Brown, S., Jenkins, F., Vye-Brown, C., Eds.; Cambridge University Press: Cambridge, UK, 2015. [Google Scholar]
- Roobol, M.; Smith, A. Volcanology of Saba and St. Eustatius, Northern Lesser Antilles; Koninklijke Nederlandse Akademie van Wetenschappen: Amsterdam, The Netherlands, 2004; ISBN 90-6984-384-6. [Google Scholar]
- Westerman, J.; Kiel, H. The Geology of Saba and St. Eustatius, with Notes on the Geology of St. Kitts, Nevis and Montserrat (Lesser Antilles); Natuurwetenschappelijke Studiekring voor Suriname en de Nederlandse Antillen: Utrecht, The Netherlands, 1961. [Google Scholar]
- Tanguy, J.C. The 1902–1905 eruptions of Montagne Pelée, Martinique: Anatomy and retrospection. J. Volcanol. Geotherm. Res. 1994, 60, 87–107. [Google Scholar] [CrossRef]
- Sparks, R.S.J.; Young, S.R. The eruption of Soufrière Hills Volcano, Montserrat (1995–1999): Overview of scientific results. Geol. Soc. Lond. Mem. 2002, 21, 45–69. [Google Scholar] [CrossRef]
- Jackson, P.; Shepherd, J.B.; Robertson, R.E.A.; Skerritt, G. Ground deformation studies at Soufrière Hills Volcano, Montserrat I: Electronic distance meter studies. Geophys. Res. Lett. 1998, 25, 3409–3412. [Google Scholar] [CrossRef]
- Kokelaar, B.P. Setting, chronology and consequences of the eruption of Soufrière Hills Volcano, Montserrat (1995–1999). Geol. Soc. Lond. Mem. 2002, 21, 1–43. [Google Scholar] [CrossRef]
- Lacroix, A. La Montagne Pelée et ses Éruptions; Masson: Paris, France, 1904. [Google Scholar]
- Shepherd, J.B.; Aspinall, W.P.; Rowley, K.C.; Pereira, J.; Sigurdsson, H.; Fiske, R.S.; Tomblin, J.F. The eruption of Soufrière volcano, St Vincent April–June 1979. Nature 1979, 282, 24–28. [Google Scholar] [CrossRef]
- Ewert, J. System for Ranking Relative Threats of U.S. Volcanoes. Nat. Hazards Rev. 2007, 8, 112–124. [Google Scholar] [CrossRef]
- CBS. Trends in the Caribbean Netherlands 2017; Technical Report; Statistics Netherlands: The Hague/Heerlen/Bonaire, The Netherlands, 2017; ISBN 978-9-03-572387-0.
- Ten Brink, U.S.; López-Venegas, A.M. Plate interaction in the NE Caribbean subduction zone from continuous GPS observations. Geophys. Res. Lett. 2012, 39. [Google Scholar] [CrossRef] [Green Version]
- Hayes, G.P.; McNamara, D.E.; Seidman, L.; Roger, J. Quantifying potential earthquake and tsunami hazard in the Lesser Antilles subduction zone of the Caribbean region. Geophys. J. Int. 2014, 196, 510–521. [Google Scholar] [CrossRef]
- Granja Bruña, J.; ten Brink, U.; Carbó-Gorosabel, A.; Muñoz-Martín, A.; Ballesteros, M.G. Morphotectonics of the central Muertos thrust belt and Muertos Trough (northeastern Caribbean). Mar. Geol. 2009, 263, 7–33. [Google Scholar] [CrossRef] [Green Version]
- Mason, D.G.; Scanlon, K.M. The neotectonic setting of Puerto Rico. GSA Bull. 1991, 103, 144–154. [Google Scholar] [CrossRef]
- Bird, P. An updated digital model of plate boundaries. Geochem. Geophys. Geosyst. 2003, 4, 1027. [Google Scholar] [CrossRef]
- French, C.; Schenk, C. Faults of the Caribbean Region (flt6bg); Technical Report; U.S. Geological Survey, Central Energy Resources Team: Denver, CO, USA, 2004.
- DeMets, C.; Gordon, R.G.; Argus, D.F. Geologically current plate motions. Geophys. J. Int. 2010, 181, 1–80. [Google Scholar] [CrossRef] [Green Version]
- Ambeh, W.B.; Lynch, L.L. The earthquake sequence of June 1992 near Saba, West Indies. Tectonophysics 1995, 246, 225–243. [Google Scholar] [CrossRef]
- Scherbaum, F. Of Poles and Zeros: Fundamentals of Digital Seismology; Springer: Dordrecht, The Netherlands, 2001. [Google Scholar]
- Sleeman, R.; van Wettum, A.; Trampert, J. Three-Channel Correlation Analysis: A new technique to measure instrumental noise of digitizers and seismic sensors. Bull. Seismol. Soc. Am. 2006, 96, 258–271. [Google Scholar] [CrossRef]
- García, A.; Vila, J.; Ortiz, R.; Macià, R.; Sleeman, R.; Marrero, J.M.; Sánchez, N.; Táárraga, M.; Correig, A.M. Monitoring the reawakening of Canary Islands’ Teide Volcano. Eos Trans. Am. Geophys. Union 2006, 87, 61–65. [Google Scholar] [CrossRef]
- McNamara, D.E.; Buland, R.P. Ambient Noise Levels in the Continental United States. Bull. Seismol. Soc. Am. 2004, 94, 1517–1527. [Google Scholar] [CrossRef]
- Peterson, J. Observations and Modelling of Background Seismic Noise; Open-File Report 93-322; U.S. Geological Survey: Albuquerque, NM, USA, 1993.
- Beyreuther, M.; Barsch, R.; Krischer, L.; Megies, T.; Behr, Y.; Wassermann, J. ObsPy: A Python Toolbox for Seismology. Seismol. Res. Lett. 2010, 81, 530–533. [Google Scholar] [CrossRef] [Green Version]
- Wielandt, E. 18 - Seismometry. In International Handbook of Earthquake and Engineering Seismology, Part A; Lee, W.H., Kanamori, H., Jennings, P.C., Kisslinger, C., Eds.; Academic Press: Cambridge, MA, USA, 2002; Volume 81, pp. 283–304. [Google Scholar]
- Fee, D.; Haney, M.M.; Matoza, R.S.; Van Eaton, A.R.; Cervelli, P.; Schneider, D.J.; Iezzi, A.M. Volcanic tremor and plume height hysteresis from Pavlof Volcano, Alaska. Science 2017, 355, 45–48. [Google Scholar] [CrossRef] [PubMed]
- Van Eaton, A.R.; Amigo, Á.; Bertin, D.; Mastin, L.G.; Giacosa, R.E.; González, J.; Valderrama, O.; Fontijn, K.; Behnke, S.A. Volcanic lightning and plume behavior reveal evolving hazards during the April 2015 eruption of Calbuco volcano, Chile. Geophys. Res. Lett. 2016, 43, 3563–3571. [Google Scholar] [CrossRef]
- Soosalu, H.; Einarsson, P.; Þorbjarnardóttir, B.S. Seismic activity related to the 2000 eruption of the Hekla volcano, Iceland. Bull. Volcanol. 2005, 68, 21–36. [Google Scholar] [CrossRef]
- Ebmeier, S.K.; Biggs, J.; Mather, T.A.; Amelung, F. On the lack of InSAR observations of magmatic deformation at Central American volcanoes. J. Geophys. Res. Solid Earth 2013, 118, 2571–2585. [Google Scholar] [CrossRef] [Green Version]
- Murray, S.A. Space weather: Importance of observations. Weather 2014, 69, 244. [Google Scholar]
- Peltier, A.; Got, J.; Villeneuve, N.; Boissier, P.; Staudacher, T.; Ferrazzini, V.; Walpersdorf, A. Long-term mass transfer at Piton de la Fournaise volcano evidenced by strain distribution derived from GNSS network. J. Geophys. Res. Solid Earth 2015, 120, 1874–1889. [Google Scholar] [CrossRef] [Green Version]
- Geirsson, H.; d’Oreye, N.; Mashagiro, N.; Syauswa, M.; Celli, G.; Kadufu, B.; Smets, B.; Kervyn, F. Volcano-tectonic deformation in the Kivu Region, Central Africa: Results from six years of continuous GNSS observations of the Kivu Geodetic Network (KivuGNet). J. Afr. Earth Sci. 2017, 134, 809–823. [Google Scholar] [CrossRef]
- Kobayashi, D.; LaFemina, P.; Geirsson, H.; Chichaco, E.; Abrego, A.A.; Mora, H.; Camacho, E. Kinematics of the western Caribbean: Collision of the Cocos Ridge and upper plate deformation. Geochem. Geophys. Geosyst. 2014, 15, 1671–1683. [Google Scholar] [CrossRef] [Green Version]
- Turner, H.L. Forearc Kinematics in Oblique Convergent Margins: Examples from Nicaragua and the Northern Lesser Antilles. Master’s Thesis, University of Arkansas, Fayetteville, AR, USA, 2010. [Google Scholar]
- Rodriguez Cesani, H.M. The Motion of the Northern Lesser Antilles Region with Respect to the Stable Caribbean from GPS Geodesy. Master’s Thesis, University of Puerto Rico, San Juan, Puerto Rico, 2002. [Google Scholar]
- Matson, S.E. Arc Kinematics of the Northern Lesser Antilles from GPS Geodesy. Master’s Thesis, University of Arkansas, Fayetteville, AR, USA, 2001. [Google Scholar]
- Dach, R.; Lutz, S.; Walser, P.; Fridez, P. Bernese GNSS Software Version 5.2. User Manual; Astronomical Institute, University of Bern, Bern Open Publishing: Bern, Switzerland, 2015; ISBN 978-3-90-681305-9. [Google Scholar]
- Carrere, L.; Lyard, F.; Cancet, M.; Guillot, A.; Picot, N. FES 2014, a new tidal model—Validation results and perspectives for improvements. In Proceedings of the ESA Living Planet Conference, Prague, Czech Republic, 9–13 May 2016. [Google Scholar]
- Davis, J.L.; Wernicke, B.P.; Tamisiea, M.E. On seasonal signals in geodetic time series. J. Geophys. Res. Solid Earth 2012, 117. [Google Scholar] [CrossRef] [Green Version]
- Crankshaw, I.; Archfield, S.; Newman, A.; Bergfeld, D.; Clor, L.; Spicer, K.; Kelly, P.; Evans, W.; Ingebritsen, S. Multi-year high-frequency hydrothermal monitoring of selected high-threat Cascade Range volcanoes. J. Volcanol. Geotherm. Res. 2018, 356, 24–35. [Google Scholar] [CrossRef]
- Sapper, K. Ein Besuch von S. Eustatatius und Saba. Centralblatt für Mineralogie, Geologie und Palaontologie 1903, 1, 314–318. [Google Scholar]
- Roobol, M.; Smith, A.; Tomblin, J. An Assessment of Volcanic Hazard on the Islands of Saba and St. Eustatius in the Northern Lesser Antilles; Technical Report; Department of Geology, University of Puerto Rico: San Juan, Puerto Rico, 1997; ISBN 90-72869-55-9. [Google Scholar]
- Wadge, G.; Mattioli, G.; Herd, R. Ground deformation at Soufriére Hills Volcano, Montserrat during 1998–2000 measured by radar interferometry and GPS. J. Volcanol. Geotherm. Res. 2006, 152, 157–173. [Google Scholar] [CrossRef]
Figure 1.
The active arc of the Lesser Antilles showing the islands of Saba and St. Eustatius in the far north, as well as the other islands of the chain. The red triangles depict the location of an active volcano, and their names shown on the left. Mt. Scenery and The Quill are highlighted.
Figure 1.
The active arc of the Lesser Antilles showing the islands of Saba and St. Eustatius in the far north, as well as the other islands of the chain. The red triangles depict the location of an active volcano, and their names shown on the left. Mt. Scenery and The Quill are highlighted.

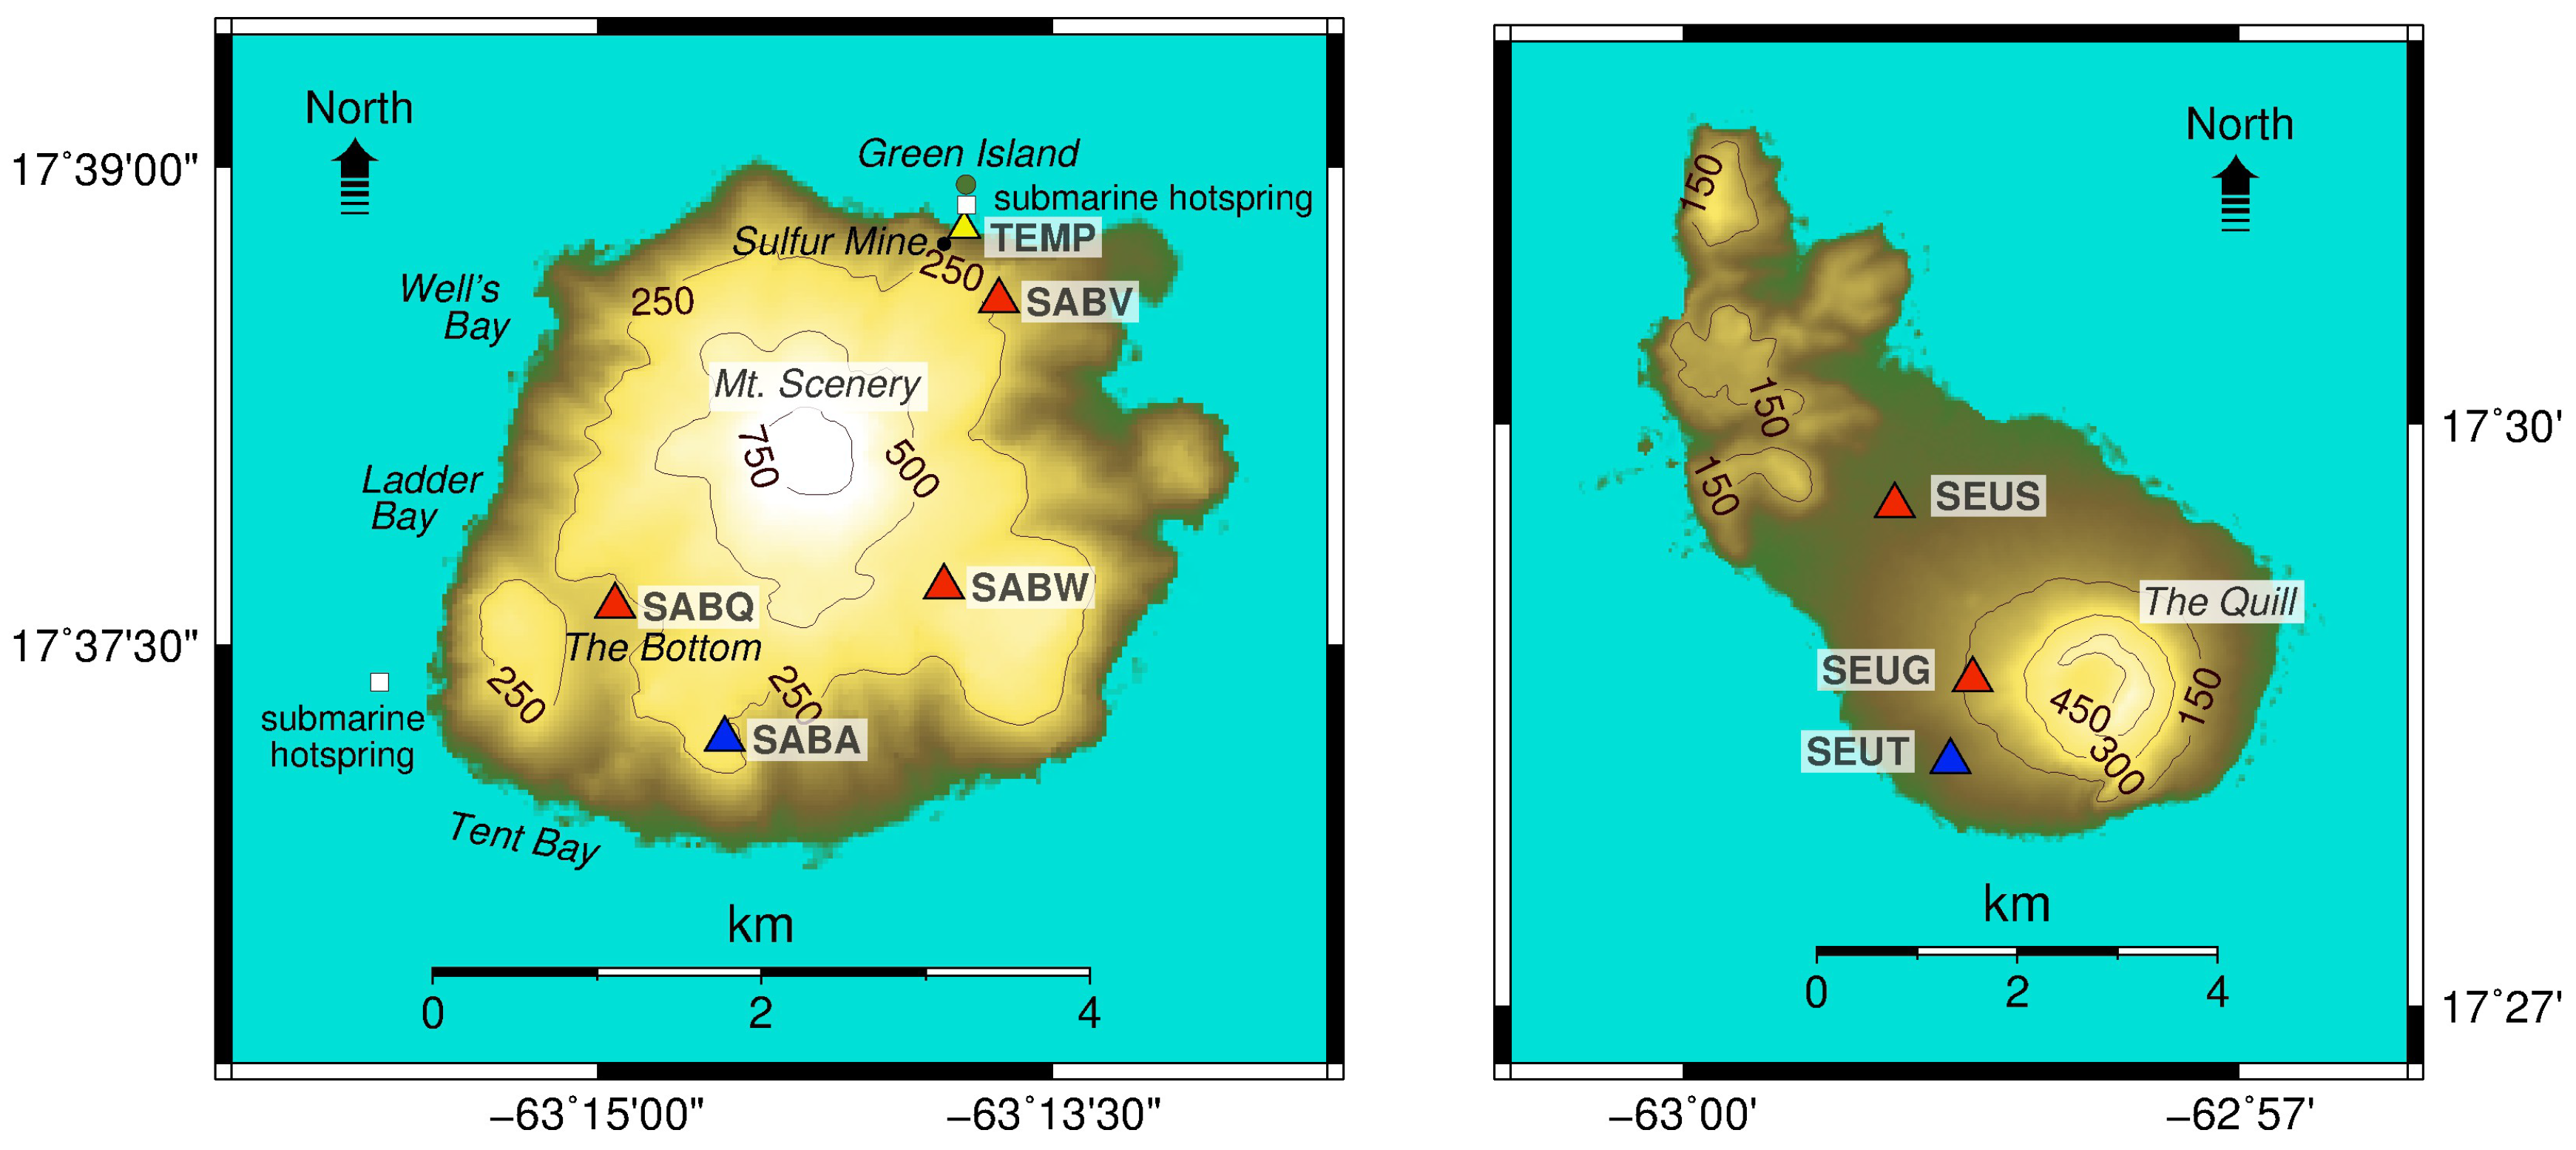
Figure 2.
Geophysical monitoring network of the Royal Netherlands Meteorological Institute (KNMI) at Saba (left) and St. Eustatius (right): permanent sites with colocated seismometer and GNSS sensor (blue triangle), seismometer sites (red triangles), submarine hotsprings (white squares), and a temporary site with two temperature sensors (yellow triangle). SRTM Digital Elevation Model in the background with elevation contours in meters.

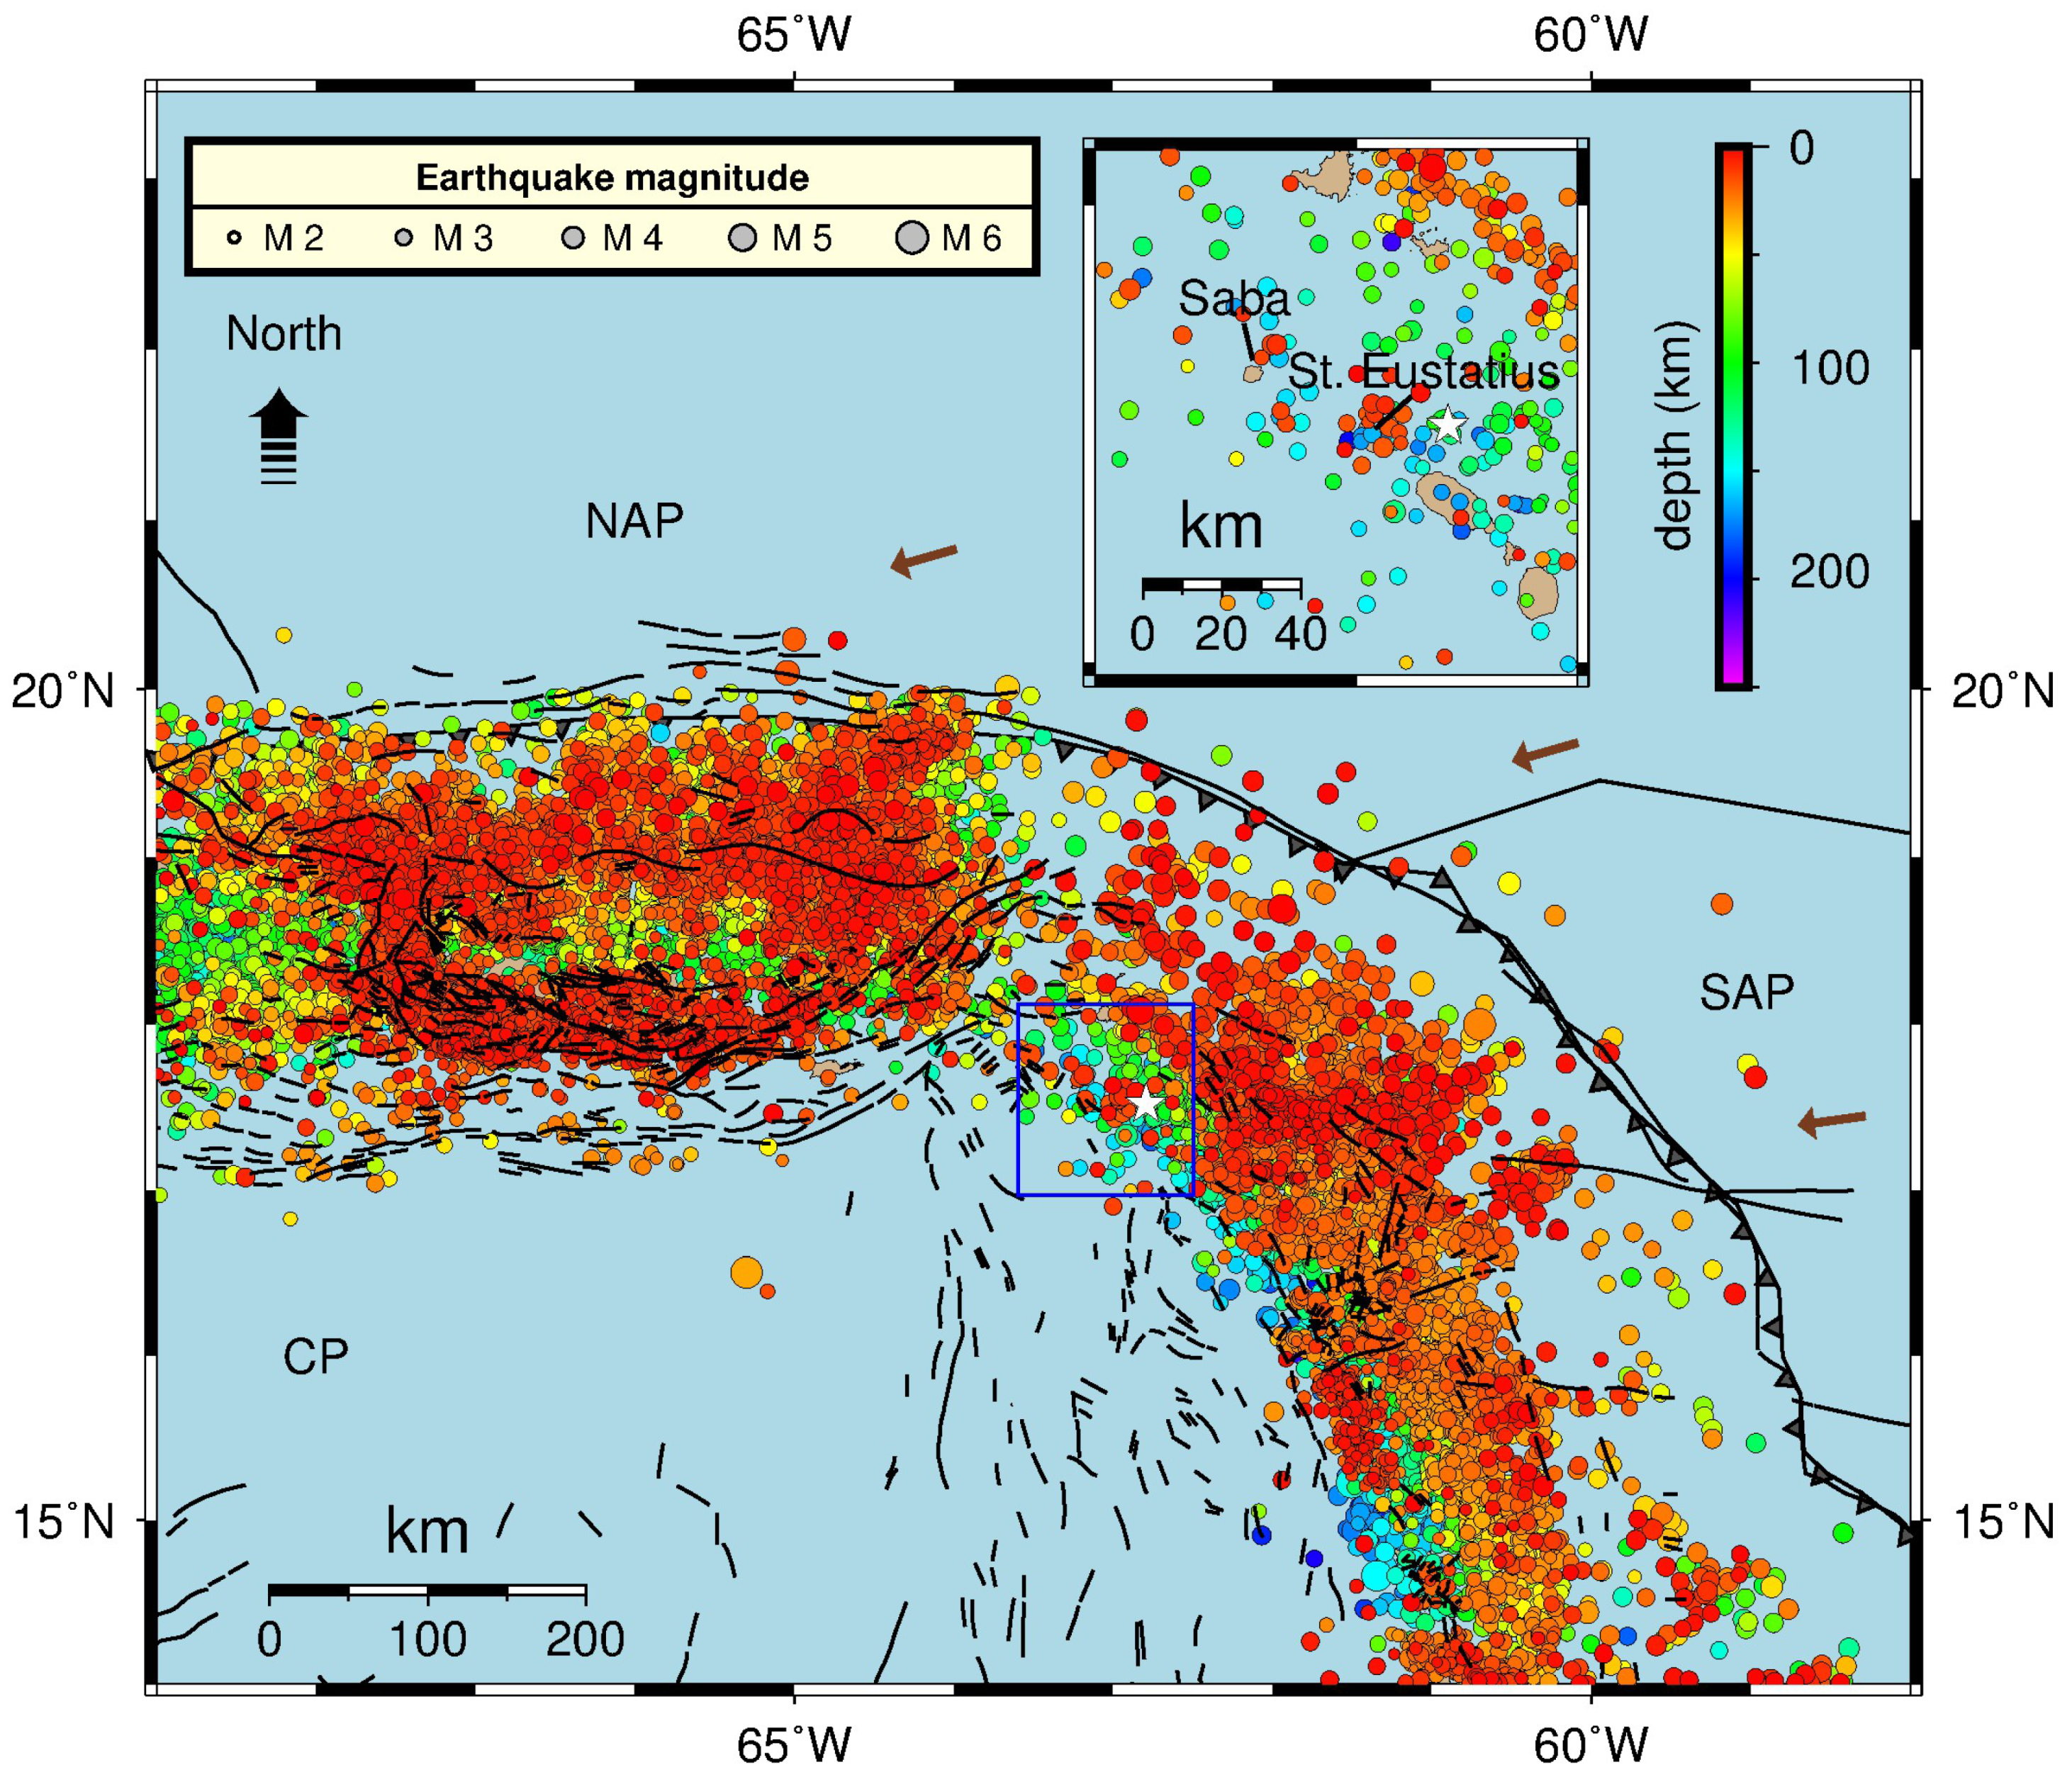
Figure 3.
Epicentres and depths of earthquakes (M 2.0–6.1) in the region around Saba and St. Eustatius between 1 January 2010 and 15 March 2018 (data from ISC). Plate boundaries for the North American plate (NAP), South American plate (SAP) and the Caribbean plate (CP) are taken from Bird [16]. Tectonic faults [17] are indicated in black. The brown arrows represent the motion of about 20 mm per year of the NAP relative to the CP [18]. The blue rectangle on the map is enlarged on top. The white star indicates the magnitude 4.3 earthquake on 14 March 2017 at 18:35 UTC at a depth of 87 km (USGS) just east of St. Eustatius for which the waveform data are presented in Section 2.1.

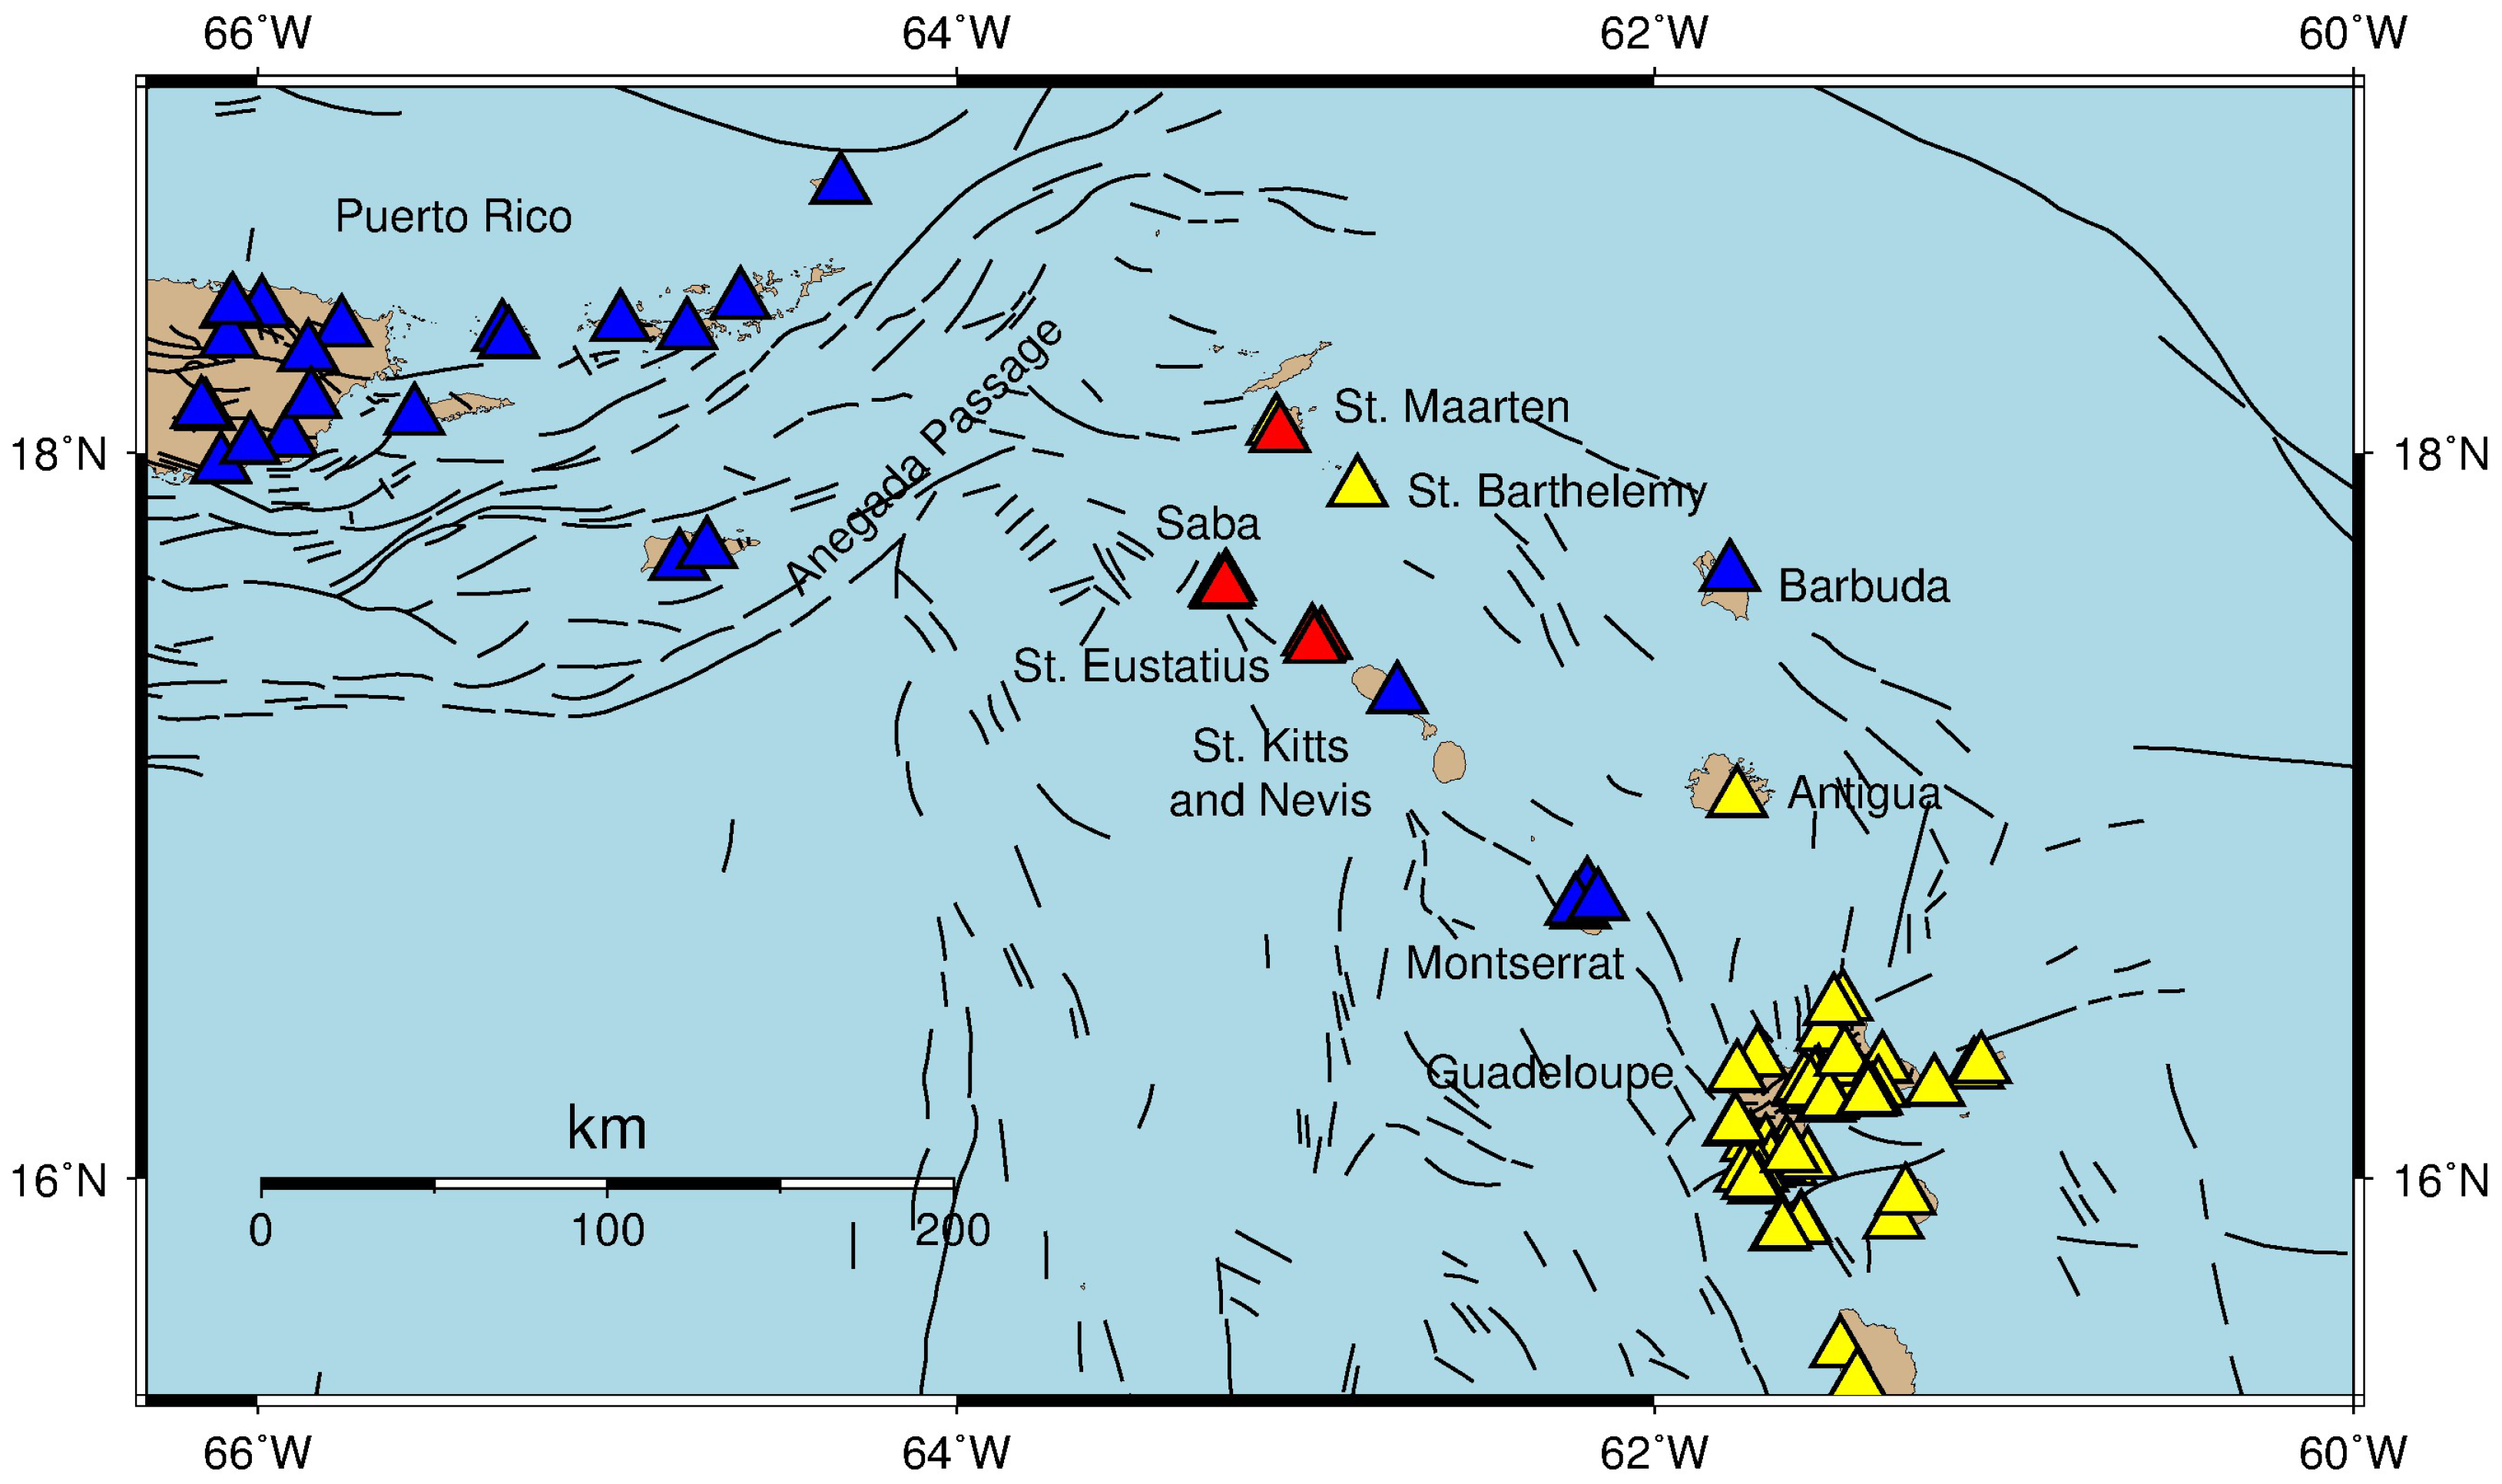
Figure 4.
Operating seismic stations around Saba and St. Eustatius. Station metadata provided by IRIS (blue; www.iris.edu) and by ORFEUS/EIDA (yellow: www.orfeus-eu.org/data/eida). NA stations are marked in red. Tectonic faults are as in Figure 3.
Figure 4.
Operating seismic stations around Saba and St. Eustatius. Station metadata provided by IRIS (blue; www.iris.edu) and by ORFEUS/EIDA (yellow: www.orfeus-eu.org/data/eida). NA stations are marked in red. Tectonic faults are as in Figure 3.

Figure 5.
Example recordings of the vertical ground velocity (mm/s) by all eight NA stations of the magnitude 4.3 earthquake on 14 March 2017 at 18:35 UTC at a depth of 87 km just east of St. Eustatius. Stations are ordered by epicentral distance.
Figure 5.
Example recordings of the vertical ground velocity (mm/s) by all eight NA stations of the magnitude 4.3 earthquake on 14 March 2017 at 18:35 UTC at a depth of 87 km just east of St. Eustatius. Stations are ordered by epicentral distance.

Figure 6.
Seismic noise Probability Density Function (PDF) from the vertical component 40 sps recordings of the NA seismic stations in dB relative to ground acceleration between 1 January 2013 and 1 June 2018. The black lines are Peterson’s high and low noise models [24]. The red lines in the figures for SABA and SEUT are related to recordings that are affected by out-of-balance boom positions. The horizontal bar below the PDF plots shows the data used from each station between 1 January 2013, or the starting date of the station hereafter, and 1 June 2018. Note: because of the different starting dates of the seismic stations, the horizontal bars differ in time span. The green color in the top row represents the available data, and the red color represents data with gaps that were used in the PSD calculations. The bottom row, in blue, shows data that were used in the PDF plot. Data gaps show up as empty segments, where segments have a length of 30 min [25].

Figure 7.
(a) Temporal variations of PSD (vertical component, dB rel. to m/s) for 0.01 Hz (blue) and 1.0 Hz (red); (b) seismometer mass position for each triaxial, oblique component: U (green), V (red) and W (blue) [26]. Data gaps are visible as interruptions of different time lengths in both PSD and mass position graphs.

Figure 8.
Data availability for the NA network, expressed as percentage (blue) and as weighted percentage (black) per month since 1 January 2013. The weight is the number of deployed stations in each year compared to the current number (eight) of deployed stations: three stations (SABA, SEUS, SMRT) from 2013 to 2016, and five additional stations (SABQ, SABV, SABW, SEUG, SEUT) from 2016 onwards.

Figure 9.
Seismic installation at station SABV. The seismometer rests on the tiles on the concrete floor and is completely surrounded by dry sand in a quasi-flexible container. Next to the sensor is the datalogger.
Figure 9.
Seismic installation at station SABV. The seismometer rests on the tiles on the concrete floor and is completely surrounded by dry sand in a quasi-flexible container. Next to the sensor is the datalogger.

Figure 10.
Four examples of the out-of-balance boom positions resulting in clipping of the recordings (different components). The amplitudes on the y-axis are given in counts.
Figure 10.
Four examples of the out-of-balance boom positions resulting in clipping of the recordings (different components). The amplitudes on the y-axis are given in counts.

Figure 11.
(a) Sketch of the monument design (J-W Schoonderwoerd, 2018); (b) A one piece stainless steel rod is drilled 70 cm into solid rock and epoxied in place. Four additional steel rods improve coupling to the bedrock of the concrete base; (c) Construction of the concrete base at SEUT; (d) A stainless steel support, screwed to the concrete base, is topped with the SECO mount to allow precise leveling of the antenna and orientation towards the north. A LMR-600 cable is cut to length and crimped on site.

Figure 12.
First continuous GNSS stations on St. Eustatius (left) with The Quill in the background and on Saba (right) in front of Mt. Scenery.
Figure 12.
First continuous GNSS stations on St. Eustatius (left) with The Quill in the background and on Saba (right) in front of Mt. Scenery.

Figure 13.
Time series showing the east, north, and vertical components of GNSS stations SABA (left) and SEUT (right).
Figure 13.
Time series showing the east, north, and vertical components of GNSS stations SABA (left) and SEUT (right).

Figure 14.
The hot spring opposite Green Island showing the attachment of two tinytag plus 2 data loggers to the cliff face and the cable path towards the submerged spring.
Figure 14.
The hot spring opposite Green Island showing the attachment of two tinytag plus 2 data loggers to the cliff face and the cable path towards the submerged spring.


Table 1.
Operational volcano monitoring equipment according to the responsible agencies as of June 2017. BB: Broad Band seismometer, SP: Short Period seismometer, SM: Strong Motion seismometer, aSM: analogue Strong Motion seismometer, aSP: analogue Short Period seismometer, cGNSS: continuous Global Navigation Satellite System. For other abbreviations see the list at the end of the document. The numbers in brackets refer to the number of sites measured. Another BB seismometer operated by the Royal Netherlands Meteorological Institute (KNMI) is located on the island of St. Maarten.
| Island | Volcano | Agency | Seismic | cGNSS | Hot Springs |
|---|---|---|---|---|---|
| Saba | Mt. Scenery | KNMI | 4 BB | 0 | Sporadic, ‘79–’08 (12) |
| St. Eustatius | The Quill | KNMI | 3 BB | 0 | no measurements |
| St. Maarten | KNMI | 1 BB | |||
| St. Kitts | Mt. Liamuiga | TRN (SRC) | 3 SP, 1 BB, 1 SM | 1 | N/A |
| Nevis | Nevis Peak | TRN (SRC) | 3 SP | 1 | N/A |
| Montserrat | Soufrière Hills | MVO | 4 SP, 8 BB | 14 | monthly (3) |
| Guadeloupe | La Soufrière | IPGP | 7 SP, 8 BB | 8 | 4 multi-gaz, monthly (3) |
| Dominica | Morne aux Diables | TRN (SRC) | 4 SP, 4 BB, 4 SM, 3 aSP | 4 | yearly |
| Morne Trois Piton | |||||
| Morne Watt | |||||
| Morne Plat Pays | |||||
| Martinique | Montagne Pelée | IPGP | 6 SP, 4 BB | 4 | 1 multi-gaz, monthly |
| St. Lucia | Qualibou | TRN (SRC)/UNAVCO | 4 SP, 3BB, 4 aSM | 5 | N/A |
| St. Vincent | The Soufrière Volcano | TRN (SRC) | 2 SP, 1 BB, 2 SM, 4 aSP | 2 | N/A |
| Grenada | Kick em Jenny | TRN (SRC)/UNAVCO | 1 SP, 5 BB, 4 SM | 1 | N/A |
| Mt. St. Catherine |
Table 2.
Instrumentation and recording start dates of the individual seismometers in network NA.
| Station Code | Sensor | Datalogger | Start Date | Latitude | Longitude |
|---|---|---|---|---|---|
| SABA | STS-2 | Q330 | 31 November 2006 | 17.62048 | −63.24323 |
| SABQ | STS-2.5 | Q330S+ | 5 October 2015 | 17.62652 | −63.24875 |
| SABV | STS-2.5 | Q330S+ | 17 July 2015 | 17.64263 | −63.22831 |
| SABW | STS-2.5 | Q330S+ | 17 July 2015 | 17.62800 | −63.23158 |
| SEUG | STS-2.5 | Q330S+ | 28 January 2014 | 17.47830 | −62.97390 |
| SEUS | STS-2 | Q330S+ | 29 November 2006 | 17.49280 | −62.98140 |
| SEUT | STS-2.5 | Q330 | 28 January 2014 | 17.47140 | −62.97570 |
| SMRT | STS-2 | Q330 | 30 November 2006 | 18.05050 | −63.07460 |
Table 3.
Temperatures measured at the hot spring between Ladder and Tent Bay, the the hot spring opposite Green Island and inside the Sulfur Mine. * denotes the minimum temperature due to submersion of the spring. More recent numbers collected by the Saba Conservation Foundation (SCF).
Table 3.
Temperatures measured at the hot spring between Ladder and Tent Bay, the the hot spring opposite Green Island and inside the Sulfur Mine. * denotes the minimum temperature due to submersion of the spring. More recent numbers collected by the Saba Conservation Foundation (SCF).
| Date Measured | (ii) Ladder Bay (C) | (iv) Green Island (C) | (v) Sulfur Mine (C) | Measured and Reported by |
|---|---|---|---|---|
| 1903 | 54.2 | Sapper (1903) | ||
| 15 March 1950 | 55–57 | Westerman and Kiel (1961) | ||
| 22 July 1979 | 31.5 | Roobol and Smith (2004) | ||
| 25 July 1979 | 51 | Roobol and Smith (2004) | ||
| 27 July 1979 | 55 | 72 | Roobol and Smith (2004) | |
| 26 August 1981 | 55 | 66.5 | Gunnlaugsson (in R and S 2004) | |
| 9 March 1994 | 54 * | 32.5 | Roobol and Smith (2004) | |
| 10 March 1994 | 54.2 | Roobol and Smith (2004) | ||
| 13 April 1996 | 80 | Johnson (in R and S, 2004) | ||
| 24 September 1996 | 82 | Buchan (in R and S, 2004) | ||
| 30 January 1997 | 62 | Roobol and Smith (2004) | ||
| 27 August 1997 | 62 | Smith (in R and S, 2004) | ||
| 17 March 1998 | 64 | Kooistra, Haak, Overmeeren (from SCF) (2004) | ||
| 9 April 1998 | 79 | Johnson (in R and S, 2004) | ||
| 5 May 1998 | 61 | Hutrrer (from SCF) | ||
| 6 May 1998 | 84.7 | Hutrrer (from SCF) | ||
| 30 May 1999 | 66 | 88 | Kooistra and Johnson (from SCF) | |
| 28 May 2005 | 84 | 36 | Johnson (from SCF) | |
| 7 August 2005 | 84 | 34 | Johnson (from SCF) | |
| 15 October 2007 | 86 | 47 | Johnson and Deheyn (from SCF) | |
| 28 October 2008 | 86 | 45 | Johnson (from SCF) | |
| 31 January 2018 | 69 * | This work (2018) |
© 2018 by the authors. Licensee MDPI, Basel, Switzerland. This article is an open access article distributed under the terms and conditions of the Creative Commons Attribution (CC BY) license (http://creativecommons.org/licenses/by/4.0/).
Share and Cite
MDPI and ACS Style
De Zeeuw-van Dalfsen, E.; Sleeman, R. A Permanent, Real-Time Monitoring Network for the Volcanoes Mount Scenery and The Quill in the Caribbean Netherlands. Geosciences 2018, 8, 320. https://doi.org/10.3390/geosciences8090320
AMA Style
De Zeeuw-van Dalfsen E, Sleeman R. A Permanent, Real-Time Monitoring Network for the Volcanoes Mount Scenery and The Quill in the Caribbean Netherlands. Geosciences. 2018; 8(9):320. https://doi.org/10.3390/geosciences8090320
Chicago/Turabian StyleDe Zeeuw-van Dalfsen, Elske, and Reinoud Sleeman. 2018. "A Permanent, Real-Time Monitoring Network for the Volcanoes Mount Scenery and The Quill in the Caribbean Netherlands" Geosciences 8, no. 9: 320. https://doi.org/10.3390/geosciences8090320
Note that from the first issue of 2016, this journal uses article numbers instead of page numbers. See further details here.