The ca. 2785–2805 Ma High Temperature Ilivertalik Intrusive Complex of Southern West Greenland


1
Department of Geology, Lund University, 223 62 Lund, Sweden
2
Geological Survey of Denmark and Greenland (GEUS), 1350 Copenhagen, Denmark
3
School of Earth Sciences, The University of Western Australia, Crawley 6009, Australia
*
Author to whom correspondence should be addressed.
Geosciences 2018, 8(9), 319; https://doi.org/10.3390/geosciences8090319
Submission received: 28 June 2018
/
Revised: 14 August 2018
/
Accepted: 16 August 2018
/
Published: 24 August 2018
(This article belongs to the Special Issue Geology of the Early Earth – Geodynamic Constraints from Cratons)
Abstract
:Ferroan granitoid intrusions are rare in the Archaean rock record, but have played a large role in the evolution of the Proterozoic crust, particular in relation to anorthosite-mangerite-charnockite-granite suites. Here we discuss the petrogenesis of the ca. 2785–2805 Ma ferroan Ilivertalik Intrusive Complex, which has many geochemical similarities to Proterozoic iron rich granitoids. We present major and trace element whole rock chemistry and combined in-situ zircon U-Pb, Hf and O isotope data. The intrusive complex divides into: (i) minor tabular units of mainly diorite-tonalite compositions, which are typically situated along contacts to the host basement and (ii) interior larger, bodies of mainly granite-granodiorite composition. Geochemically these two unites display continuous to semi-continuous trends in Haker-diagrams. Whole rock REE enrichment display increases from Yb to La, from 10–25 to 80–100 times chondrite, respectively. The diorite-tonalite samples are generally more enriched in REE compared to the granite-granodiorite samples. The complex has hafnium isotope compositions from around +1.5 to −2.5 epsilon units and δ18O compositions in the range of 6.3 to 6.6‰. The complex is interpreted to be derived from partial melting in a crustal source region during anomalously high crustal temperatures.
1. Introduction
Igneous intrusive rocks from intra-cratonic settings make up a prominent part of the Paleo- and Meso-proterozoic crust, e.g., [1,2]; these intrusive rocks are characterised by anorthosite massifs, mangerites, charnockites and ferroan granitoids, referred to as the anorthosite-mangerite-charnockite-granite (AMCG) suites, e.g., [1,2,3,4,5]. These rock types are, e.g., abundant in the major Mesoproterozoic belts running across North America through south Greenland to Scandinavia, that make-up one of the largest continental magmatic provinces on Earth, e.g., [1,5,6]. The charnockite and ferroan (A-type) granitoids represent high-temperature granites that are characteristic of intra-cratonic Proterozoic crust; no AMCG suites with Archean age are known which might suggest a temporal evolution of crustal magmatic systems on Earth [2].
Whereas AMCG suites with Archaean age are unknown, ferroan dioritic and charnockitic igneous rock of Archaean age are described from a number of places worldwide [7,8]. In southern West Greenland, an Eoarchaean (ca. 3630 Ma) iron-rich suite including ferro-diorites, ferro-gabbros and augen gneisses constitutes a large component (up to ca. 30%) of the Eoarchaean Amîtsoq Gneiss Complex, where it occurs as intrusive sheets and lenses up to 500 m wide within the felsic TTG basement [7,9]. Another recently described possibly ferroan granitoid is from the Acasta Gneiss Complex, the rock unit represents one of the oldest known on Earth and the ferroan affinity could have great implications for the geodynamic setting of the early Earth [10]. Younger Archaean examples are, e.g., known from southern Africa, where the Gaborone granite suite and the associated Kanye volcanic formation constitute a rapakivi association with a zircon U-Pb age of ca. 2783–2785 Ma [8].
The Ilivertalik Intrusive complex (IIC) crops out in the central part of the Tasiusarsuaq terrane, (Figure 1), the terrane is defined on the basis of a regionally occurring ca. 2800 Ma granulite facies overprinting that occurred together with the intrusion of IIC [11,12,13]. A younger event of metamorphic overprinting of the region, causing remelting of crustal rocks and intrusion of crustal derived granites occurred around 2750 to 2700 Ma, this event is related to terrane accretion and also deformed and metamorphosed the IIC [11,12] The Tasiusarsuaq terrane TTG orthogneisses have protolith ages range from ca. 2920 to 2820 Ma, where dioritic gneisses are generally older than ca. 2900 Ma [14,15,16,17,18,19]. Extensive age dating suggests that the gneisses basement display systematic age differences, with increasing protolith ages from north to south, generally with protolith ages ranging from 2820 to 2890 Ma north of IIC and 2860 to 2920 Ma south of IIC [20]. Zircon populations in migmatitic gneisses from around the Fiskenæsset complex suggest that older scattered crustal gneisses occur in the area, the best-preserved examples suggest protolith ages around 3200 to 3100 Ma [20]. It has further been emphasised that some rocks within the Færingehavn terrane (toward the north, Figure 1) record a very different P-T-t path, with higher pressure and lower temperature, compared to the P-T-t path recorded in Tasiusarsuaq terrane with higher temperatures and lower pressures [21]. The different P-T-t paths of the two terranes could indicate a geo-tectonic setting where Tasiusarsuaq terrane represents a relatively hot back-arc environment and the northern Færringehavn terrane represents a subduction terrane boundary [21].
In this study, we discuss the formation of the ca. 2785–2805 Ma IIC, which includes ferroan diorites, tonalites granodiorites and granites. We report whole rock major and trace element chemistry in conjunction with zircon U-Pb, Hf, O isotopes data.
2. Materials and Methods
The IIC is a meta-igneous complex that includes meta-granites, meta-granodiorites, meta-tonalites and meta-diorites. The complex can be grouped into two distinct units that can be mapped out in the field, these are here named Unit 1 and Unit 2. Most part of both units have experienced deformational and metamorphic overprinting and occur as banded-gneisses, augen-gneisses and mylonite, few areas are however relatively undeformed. Unit 2 is the main intrusive unit and consists of meta-granodioritic to meta-granitic rocks, mainly with gneissic texture and often with augen textures, (Figure 2B,D) in low strain regions augen gneisses transform into porphyritic units due to strain variations. Unit 1 consist of minor tabular and sheet-like units that are generally less than 1 km in structural thickness and up to 10 km in length (Figure 2C), it occurs mainly marginally and is often veined and agmatised by felsic melts. Both units of the complex are situated as sheet like intrusions [22,26] that are folded into upright isoclinal folds [22] where outcrop patterns reflect post- intrusive folding (Figure 1).
Rocks of Unit 1 and 2 contain hornblende, clinopyroxene, orthopyroxene, plagioclase and quartz; K-feldspar is mainly present in Unit 2 however also in minor quantities in Unit 1. Unit 1 includes fine to medium grained, equigranular and plagioclase porphyritic varieties. Unit 2 is alkali feldspar porphyritic in undeformed varieties and in gneissic varieties have K-feldspar augens. Ilmenite is the main oxide phase in both units but magnetite is also relatively abundant and also occurs as exolutions in ilmenite crystals. Apatite and zircon occur as accessory minerals with apatite being relatively abundant. Zircon occurs in a variety of textural settings and appears both as late precipitates (Figure 3A,B), as partly dissolved grains (Figure 3C,D) and as inclusions in pyroxene grains (Figure 3E,F). Pyroxene minerals are often heavily altered with a fractured appearance transected by iron veins (Figure 3E).
Detailed analytical descriptions can be found in the Supplementary Material, here we give a short overview of the different analytical procedures.
Whole rock geochemistry was obtained from two laboratories, 11 samples (512046, 508204, 484644, 468736, 515745, 468682, 468689, 468691, 468692, 468698) were analysed at the ACMELabs in Vancouver, Canada (www.acmelab.com), followed the analytical procedures termed “Group 4A and 4B—lithogeochemical whole rock fusion”. Three samples (515742, 515743, 515746) were analysed at the ACTLabs in Ontario, Canada (www.actlabs.com), following the analytical procedures termed “4Litho—Lithium Metaborate/Tetraborate Fusion—ICP and ICP/MS”.
U-Pb analyses were done by laser ablation inductively coupled plasma mass spectrometry (ICPMS) at the Geological Survey of Denmark and Greenland in Copenhagen (GEUS) using a Thermo Scientific Element2 mass spectrometer (ThermoFisher Scientific, Waltham, MA, USA) coupled to a NewWave UP213 laser ablation system (New Wave Research, Fremont, CA, USA). The U-Pb age dating following the procedures outlined in [27,28]. We use a 25 µm spot size and ablation results in a roughly 20 µm deep ablation crater.
Zircon Lu-Hf isotope analyses were done at two different laboratories. At the advanced Analytical Centre at James Cook University, Townsville, Australia and at the analytical facilities at the Goethe University, Frankfurt, Germany. At James Cook University, analyse were done by using a GeoLas 193-nm ArF laser (Coherent, Palo Alto, CA, USA) and a Thermo Scientific Neptune multicollector ICPMS. The method is outlined in [29]. At the Goethe University, analyses were done by using a Resonetics M50 193 nm excimer laser (Resonetics, Boston, MA, USA) and a Thermo Scientific Neptune multicollector ICPMS. The method is outlined in [27]. To ensure consistency between the methods, the data obtained from the laboratory at the Goethe University have also been reduced by the method applied for the data from the James Cook University (the only difference is that 172Yb was measured instead of 171Yb). The two reduction and analytical methods induce variations in the mean GJ1 and Temora2 that is less than 1 epsilon Hf unit. For CHUR, we use the isotope ratios 176Lu/177Hf = 0.0336 and 176Hf/177Hf = 0.282785 [30] and for the 176Lu decay constant we used the value reported in [31,32]. Spot size ranges between 31 to 60 µm and Hf spots have been placed above U-Pb spots or within the same textural domain. Like for the U-Pb analyses spot crater depth are around 20–30 µm.
Oxygen isotope ratios were measured using a CAMECA IMS1270 ion microprobe (CAMECA, Gennevilliers, France) at the NordSIMS laboratory (Swedish Museum of Natural History) using a method similar to that described in [33,34] with the exception that, for this study, only 16O and 18O were measured. Data were normalized to measurements of the Geostandard zircon 91500, assuming a δ18O value of 9.86‰ determined by laser fluorination [35]. Reproducibility of 91500 during the sessions was 0.21.
3. Results
3.1. Whole Rock Geochemistry
14 samples (Figure 1) were analysed for major- and trace elements, which are presented in the Supplementary Material. In addition, we present major element data (plus Rb, Sr, Zr and Y for some samples) from 67 additional samples of the Ilivertalik Intrusive Complex [26]. For plotting and discussion, data are recalculated on an anhydrous basis. The samples are discussed as two groups (Unit 1 and Unit 2) based on field relations as outlined in Section 2.
Samples from Unit 1 have SiO2 contents from 46 to 65 wt. % and samples from Unit 2 have SiO2 contents from 60 to 74 wt. % (Figure 3). Samples from both units display a relatively coherent chemistry for MgO (0.3–5.2 wt. %), Fe2O3 (20.3–1.4 wt. %), CaO (8.5–1.0 wt. %), TiO2 (3.4–0.04 wt. %), P2O5 (2.8–0.01 wt. %) and MnO (0.3–0.01 wt. %) that is negatively correlated with SiO2 (Figure 4). These oxides define tighter correlations for the Unit 2 samples compared with Unit 1 samples. K2O (0.07–6.6 wt. %) and Rb (9–231 ppm) is positively correlated with SiO2 and both display a steepening curve when going from Unit 1 samples into Unit 2 samples. For Al2O3 (11.9–16.2 wt. %), Na2O (2.9–4.5 wt. %) and Sr (113–772 ppm), Unit 1 samples show overall positive correlations, whereas unit 2 samples constitute better defined negative trends when plotted against SiO2 (Figure 4G).
Samples are rich in FeO relative to MgO generally plotting as ferroan (Figure 4K) and Unit 1 samples show quite a spread in the iron-magnesium ratios. Total alkali (Na2O + K2O) contents range between 4.2 and 9.9 wt. % and is positively correlated with SiO2 (Figure 4L), in the molecular (Na + K)/Al versus ASI (alumina saturation index [36]) diagram the majority of samples are metaluminous, trending toward peraluminious compositions for the highest ASI numbers.
In rare earth element (REE) spider diagrams samples 468698 display distinctly different patterns (Figure 5A,B) compare to the other samples. The main group of samples (n = 12) shows REE and Y enrichment, chondrite normalised (indicated by subscript C) YbC values range from 2.3 to 4.9 ppm and LaC/YbC values ranging from 6.6 to 14.4. There is an overall negative correlation between SiO2 and REE and samples of Unit 1 are generally more enriched in Y and HREEs compared to samples from Unit 2. Europium anomalies (Eu/Eu*) range from 0.4 to 1.3 and in Unit 2 samples Eu/Eu* display negative correlations with LREE, however, no convincing correlation with SiO2 or La/Yb. Unit 2 samples generally have the lowest Eu/Eu*.
In a Primitive Mantle (PM)-normalised spider-diagram the high field strength elements (Ti, Hf, Zr, Nb and Ta) are variably enriched compared to Primitive Mantle but display negative anomalies as the neighbouring trace elements of comparable incompatibility are relatively more enriched (Figure 5B). Nb and Ta display negative correlations with SiO2 (not shown), whereas Zr and Hf display a crude positive array for the samples of Unit 1 and a much better defined negative array for the samples of Unit 2. Th (0.4–2.4 ppm), U (0.2–0.6 ppm), Sr (112–772 ppm) and Cs (>0.1–0.5) display negative anomalies in a PM-normalised spider diagram, whereas K and Ba (643–1418 ppm) are as enriched like the REEs (Figure 5B). Rb (9.0–49.5) display relatively large scatter with both negative and positive anomalies and display a positive correlation with SiO2. Pb (0.7–10.7 ppm) concentrations are generally low and display negative anomalies for most samples.
The sample with striking different REE patterns (sample 468698, stippled line in Figure 5A,B) display steeper REE pattern, with low HREE contents and are the most silica-rich sample with La/YbC = 7.1 and slightly concave up HREE (Figure 5A). The sample display negative Ti, Nb and Ta anomalies, Nb/Ta ratios like the main group, low Zr and Hf contents and positive Th and Pb anomalies (Figure 5B).
3.2. Zircon Textures
Zircon grains from eleven samples were separated and analysed for U-Pb isotope compositions, five of these have been analysed for Hf isotopes and three for oxygen isotopes. Zircon textures were documented by Back-Scattered Electron (BSE) imaging prior to analysis. Overall the analysed grains all display similar internal textures, morphologies and sizes. Most zircon grains are subhedral and prismatic but some grains are more rounded or oblate, in some cases with irregular boundaries (Figure 6). The grains are relatively large, ranging from 200 to 400 µm but few are up to 600 µm long. Aspect ratios mainly range from 1:2 to 1:4. The majority of imaged grains are dominated by large homogeneous sub-domains, sometimes with a patchy appearance and with irregular boundaries between domains (Figure 6C,D,G). Some grains display more systematic patterns, which resemble diffuse and widely spaced igneous growth zones (Figure 6B,F,H). In some grains, the growth-zoned domains have relatively narrow banding (Figure 6A). Rim domains are often BSE bright and homogeneous. Alteration textures occur in cores or in internal zones that separate the core from the rim domain (Figure 6A,E,G). Alteration domains are sometimes inclusion rich and are often composed of intermingling zones with low and high BSE intensity. Altered domains are often related to radial fractures. Baddeleyite that is aligned with the crystal lattice and overprinted by zircon recrystallization and alteration textures is observed in grains from sample 468698 (Figure 6E).
Zircon has also been imaged in-situ in four samples and zircon appears in a number of different textural contexts (Figure 3). Some zircon grains or domains have crystallised late and appear as late interstadial melts, with irregular boundaries defined by surrounding grains (Figure 3A,B), other zircon grains appear to have been dissolved (Figure 3C,D).
3.3. Zircon U-Pb Isotope Data
Eleven samples were selected for zircon U-Pb-dating, which was done on zircon separates. Most dated samples display simple age distributions with one apparent age population (Figure 7) and no resolvable age difference between different textural domains or between grains of different size or shape (e.g., irregular morphology or prismatic). Th/U values mainly range between 0.1 and 1 (a few analyses rank up to 2) and analyses with youngest ages (down to ca. 2650) generally have Th/U values below 0.5. Dates for individual samples are calculated as weighted average 207Pb/206Pb dates using ISOPLOT [40] for analyses that are <10% discordant. Outliers are rejected at the 2σ-level. The youngest dates of 2778 ± 9 Ma (n = 19; MSWD = 1.15; sample 468691) and 2789 ± 10 Ma (n = 11; MSWD = 1.6; sample 468698) are based on relatively few analyses (n = 19 and 11, respectively) whereas the remaining samples are documented with > 40 and up to >100 analyses and have ages that range between 2790 ± 3 Ma and 2800 ± 4 Ma (Figure 7).
Of all U-Pb age data (n = 783) inheritance is only documented in one sample and only in very few grains (n ≈ 2): In sample 468682 one or two grains can be distinguished (oldest age at 2868 ± 38 Ma). Sample 484644 (2796 ± 4 Ma) and 484645 (2800 ± 4Ma) represents the same intrusive unit, 484644 is from the brownish weathered part and 484645 from the fresh looking grey part (Figure 2A).
3.4. Zircon Hf Isotope Data
Hafnium isotope data (Figure 8) are obtained from five samples that are sampled across the intrusive complex and cover almost the entire range in terms of U-Pb ages found (2791–2799 Ma) and SiO2 contents (51–71 wt. %). Except for sample 515745, the analysed samples all have similar initial zircon Hf isotope compositions with sample mean εHf(t) values ranging from −0.01 ± 0.65 to +0.31 ± 0.65. The variation in each of these samples is also small, maximum around 3 epsilon values (including uncertainties). Sample 515745 is the only that display larger spread with εHf values ranging from +0.5 ± 1.3 to −2.6 ± 1.3 and a mean of −1.2 ± 0.9 epsilon units.
3.5. Zircon O Isotope Data
Oxygen isotope data are obtained from 3 samples; these are all from the northern part of the intrusion. The samples have homogeneous oxygen isotope compositions and only two analyses from sample 468682 have distinctly lower values. These analyses are from low BSE intensity domains that are clearly altered like the core in the left grain in Figure 6A. Mean δ18O for the three samples: 6.29 ± 0.28‰ (468682); 6.49 ± 0.12‰ (468689) and 6.61 ± 0.16‰ (484644). These values are considered to reflect the δ18O composition of the intrusion.
4. Discussion
Unit 1 represents the minor marginal unit at the boundary to the country rock and Unit 2 is the major internal plutonic body. In some low strain areas, it has been observed that Unit 1 rocks have been partly assimilated or mixed by granitic melts [26]. In the zircon U-Pb data presented here, the main populations (more than 95%) of the analyses grains are interpreted to reflect the minimum age of the intrusion. A number of samples show a tailing off toward lower ages; these younger ages are interpreted as reflecting Pb-loss, either during regional 2750–2700 Ma metamorphic overprinting or by accident ablating metamict domains. There is no age difference (within uncertainty) between Unit 1 and Unit 2 of the intrusion (Figure 9) as documented in the here presented zircon U-Pb data, as such, Unit 1 likely reflects early magmatic cumulates.
4.1. Magma Source Considerations
The ferroan and metaluminous chemistry, with relatively high REE, HFSE and P2O5 content and with ilmenite as the main oxide, are characteristic of many “A-type” granites and also resemble jotunite-mangerite-charnockite rocks (iron diorites/monzonites and pyroxene bearing granites) of the anorthosite–mangerite–charnockite–granite (AMCG) magmatic suites [42]. Oxygen isotope compositions in zircon have δ18O values that range from 6.25 ± 0.3‰ to 6.61 ± 0.2‰ which is slightly higher than mantle values (δ18O ≈ 5.3 ± 0.6‰) however fall in the range of Archaean TTG gneisses and could thus be modelled by partial melting of hydrous basalts [43]. The δ18O values indicate little or no sedimentary component in the IIC as also evident in the metaluminous composition. Initial hafnium isotope composition has mean εHf(t) values ranging from +0.3 to −1.2 (Figure 8), the relatively homogeneous Hf isotope composition for both Unit 1 and Unit 2 samples (silica content between ca. 50 to 70 wt. % for analysed samples) point to a common and homogeneous source region. The near chondritic Hf isotope composition seemingly excludes any major importance of a depleted mantle (DM) reservoir in the source (Figure 8B).
HFSE and HREE are key elements in the classification of granites [44], where charnockites of AMCG suites and ferroan (A-type) granitoids mainly fall in the field of within plate granites (WPG) [45,46,47,48]. IIC is mildly enriched in REE and HFSE and plot close to the boundary between WPG and volcanic arc granites (VAG) (Figure 10). The enrichment in HREE (ca. 10 to 25 times enriched compared to chondrite) are more pronounced for Unit 1 compared to the Unit 2, which seemingly suggest that the enrichment is a source characteristic of the complex. A HREE enriched source likely excludes a source in a mantle region, which together with chondritic Hf isotope composition point toward a crustal source. The high HREE contend excludes garnet as a residual phase in the source, which point toward low pressures during melting. If for example melting occurred in an amphibole bearing basalt, garnet would be stable above ca. 10 kbar corresponding to around 35 km depth [49].
4.2. Magmatic Evolution and Differentiation
The well-correlated chemical trends in the granite unit suggest a system dominated by magma differentiation processes. In accordance with the mineralogy, Unit 1 samples reflect a relative enrichment in hornblende, pyroxene, apatite and ilmenite compared to Unit 2.
Unit 2 samples display less scatter of MgO, Fe2O3, CaO, TiO2 and P2O5 when plotted against SiO2, compared to Unit 1 samples (Figure 3). The larger scatter in Unit 1 could suggest a heterogeneous source, or that Unit 1 was variously mixed with other crustal components for example, assimilated basement rocks or assimilated by late intrusive granite melt of Unit 2. Besides this, the main difference in major element geochemistry is observed for Al2O3 and Na2O, where Unit 1 samples display positive correlations and Unit 2 samples display negative correlations when plotted against SiO2 (Figure 3G), which suggest that the two units had different mineral phases on the liquidus assemblage.
4.3. Magma Temperature
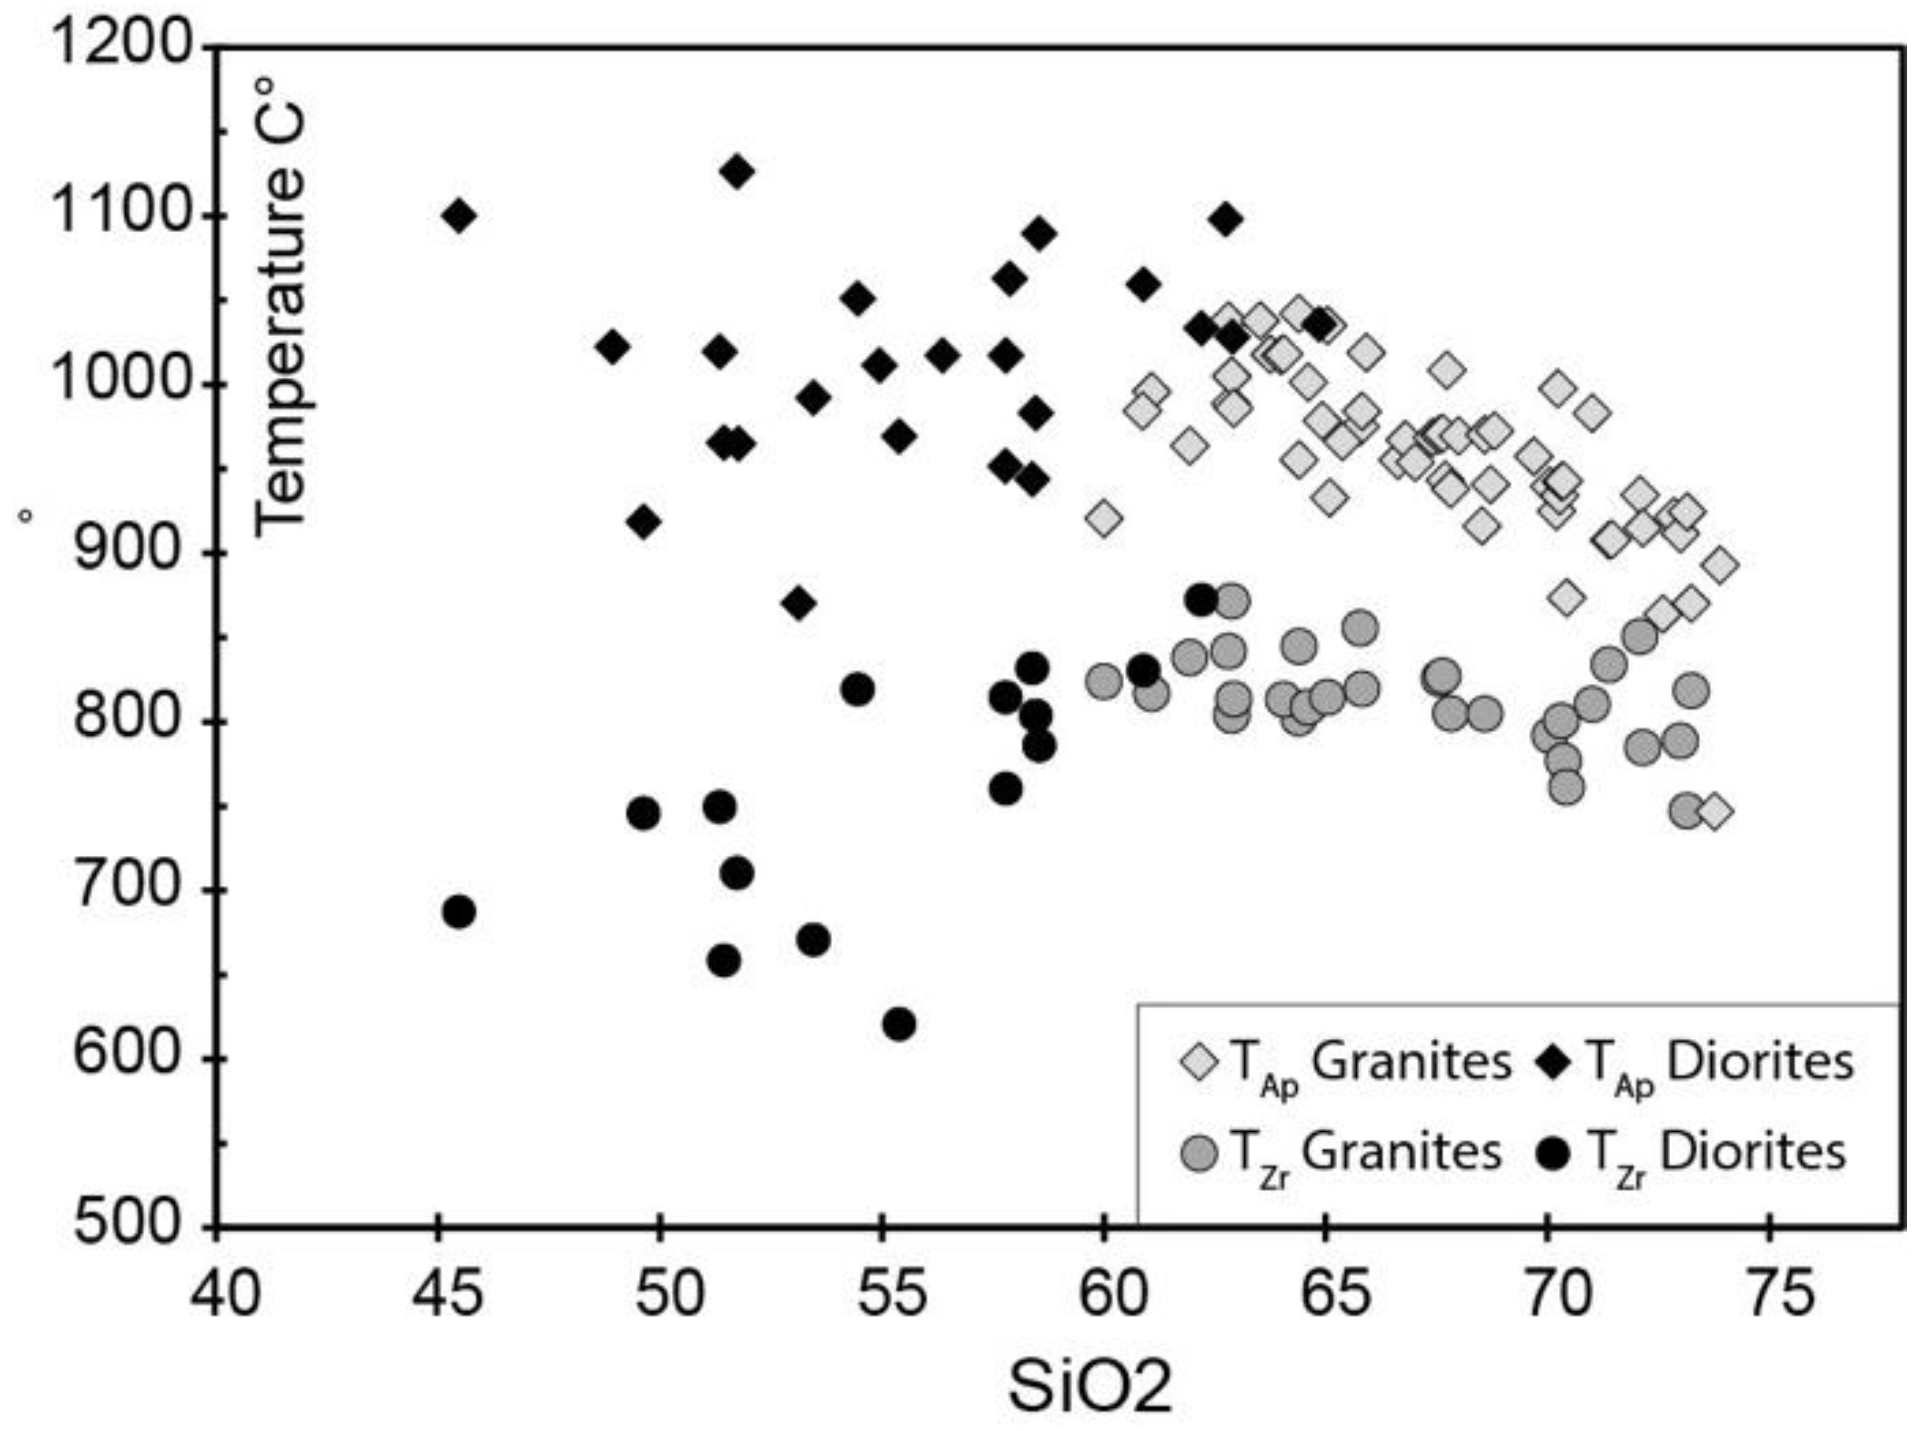
Zirconium saturation could be attained during magma evolution; however measured values in analysed rock samples might not represent magmatic compositions. Zirconium is mainly hosted in zircon in silica saturated- and baddeleyite in silica under-saturated rocks and as observed the rock textures (Figure 3) relatively late zirconium mobility occurred during late magmatic processes. Unit 1 samples display large scatter in Zr content but generally with the higher Zr concentrations in the more silica-rich samples, Unit 2 samples display a more coherent negative trend, highest Zr concentrations occur for intermediate compositions (Figure 11). This pattern is mirrored by zirconium saturation temperature (TZr) [50,51] with intermediate compositions displaying the highest temperatures at around 835 to 870 °C (Figure 11). Unit 1 samples display a scatter in TZr and some samples have TZr below 750 °C, the variation suggests an un-equilibrated Zr content in some of the samples or that samples do not represent magmatic rocks.
Apatite saturation temperatures (TAp) [52] display a similar trend as TZr when plotted against SiO2, however, Unit 1 samples do not show as large a scatter but might display a trend toward lower saturation temperatures for the more mafic samples (Figure 11). The highest TAp range between 1000 to 1100 °C which is higher by 200 to 300 °C compared to TZr at similar SiO2 content (Figure 10). The TZr and TAp converge toward high silica content but throughout TAp are higher than TZr. As such saturation temperatures are limited by the fact that liquid compositions are difficult to establish in differentiated plutonic intrusions. The decreasing Zr for SiO2 could be explained by fractionation of zircon or for example, assimilation of Zr poor leucocratic materials.
Temperature estimates from granulite facies rocks associated with the intrusion of the IIC are estimated to ca. 850 °C [25] and intimate relation between IIC and the regional granulite facies seems to exclude a temperature below ca. 850 °C for the source of the IIC.
4.4. Geodynamic Environment
A model that includes crustal heating and partial melting in crustal section due to increased heat flux from the mantle is consistent with high-temperature melts and a low-pressure source region (no garnet in the source). As such IIC could have formed in a back-arc setting as has been suggested by [21] however other means of suppling heat from the mantle cannot be excluded from our data.
5. Conclusions
The Ilivertalik intrusive complex is a high-temperature intrusion that includes ferroan (A-type) plutonic rocks, including granites, granodiorites, diorites and gabbro’s enriched in Fe, Ti and P. Zirconium and apatite saturation temperatures diverge by up to 200 °C which likely reflects that primary melts were never saturated in zirconium until at retrograde temperatures. Apatite saturation suggests magma temperatures of ca. 900–1050 °C.
Zircon age dating combined with textural observations suggests late Zr mobility with crystallization of interstitial zircon in vein like textures; this suggests that the obtained ages (2785–2805 Ma) reflect a minimum age of the intrusion. Hafnium isotope compositions of IIC suggest a crustal source region and the lack of inheritance and the relatively low δ18O values indicate little or no sedimentary component in the IIC as also evident in the metaluminous composition. The high magma temperatures indicate a lower crustal source region, heating could be related to a back-arc setting as suggested previously [21].
Supplementary Materials
The following are available online at https://www.mdpi.com/2076-3263/8/9/319/s1. Document S1: Detailed method descriptions; Table S2: Whole rock chemistry; Table S3: Zircon U-Pb age data; Table S4: Zircon Hf isotope data; Table S5: Zircon oxygen isotope data.
Author Contributions
The idea has been conceived and conceptualized by T.N., A.S. and T.F.K. Analytical work has been done by T.N., T.F.K. and A.P. Editing of the text has been done by all authors.
Funding
This work was financed through grants from the Geocenterbevilling (Geocenter Denmark) to T.N. and A.S. and from Willum Fonden to T.N. Field work was funded by the Geological Survey of Denmark and Greenland under the “Homogenization project” (2008–2010).
Acknowledgments
We would like to acknowledge the NORDSIM laboratory in Stockholm for helping with oxygen isotope analyses. We would like to thank Tony Kemp and Axel Gerdes for helping with hafnium isotope analyses. This is Nordsim contribution #569.
Conflicts of Interest
The authors declare no conflict of interest.
References
- Anderson, J.L.; Morrison, J. Ilmenite, magnetite, and peraluminous Mesoproterozoic anorogenic granites of Laurentia and Baltica. Lithos 2005, 80, 45–60. [Google Scholar] [CrossRef]
- Ashwal, L.D. The temporality of anorthosites. Can. Mineral. 2010, 48, 711–728. [Google Scholar] [CrossRef]
- Owens, B.E.; Rockow, M.W.; Dymek, R.F. Jotunites from the Grenville Province, Quebec: Petrological characteristics and implications for massif anorthosite petrogenesis. Lithos 1993, 30, 57–80. [Google Scholar] [CrossRef]
- Emslie, R.F.; Hamilton, M.A.; Thériault, R.J. Petrogenesis of a Mid-Proterozoic Anorthosite-Mangerite-Charnockite-Granite (AMCG) Complex: Isotopic and Chemical Evidence from the Nain Plutonic Suite. J. Geol. 1994, 102, 539–558. [Google Scholar] [CrossRef]
- Goodge, J.W.; Vervoort, J.D. Origin of Mesoproterozoic A-type granites in Laurentia: Hf isotope evidence. Earth Planet. Sci. Lett. 2006, 243, 711–731. [Google Scholar] [CrossRef]
- Andersen, L.J.; Bender, E. Nature and origin of Proterozoic A-type granitic magmatism in the southwestern United States of America. Lithos 1989, 23, 19–52. [Google Scholar] [CrossRef]
- Nutman, A.P.; Bridgwater, D.; Fryer, B.J. The iron-rich suite from the Amitsoq gneisses of southern West Greenland; early Archaean plutonic rocks of mixed crustal and mantle origin. Contrib. Mineral. Petrol. 1984, 87, 24–34. [Google Scholar] [CrossRef]
- Moore, M.; Davis, D.W.; Robb, L.J.; Jackson, M.C.; Grobler, D.F. Archean rapakivi granite–anorthosite–rhyolite complex in the Witwatersrand and basin hinterland, southern Africa. Geology 1993, 21, 1031–1034. [Google Scholar] [CrossRef]
- Nutman, A.P.; McGregor, V.R.; Friend, C.R.L.; Bennett, V.C.; Kinny, P.D. The Itsaq Gneiss Complex of southern West Greenland; the world’s most extensive record of early crustal evolution (3900–3600 Ma). Precambrian Res. 1996, 78, 1–39. [Google Scholar] [CrossRef]
- Reimink, J.R.; Chacko, T.; Stern, R.A.; Heaman, L.M. Earth’s earliest evolved crust generated in an Iceland-like setting. Nat. Geosci. 2014, 7, 529–533. [Google Scholar] [CrossRef]
- Friend, C.R.L.; Nutman, A.P.; McGregor, V.R. Late Archaean terrane accretion in the Godthåb region, southern West Greenland. Nature 1988, 335, 535–538. [Google Scholar] [CrossRef]
- McGregor, V.R.; Friend, C.R.L.; Nutman, A.P. The late Archean mobile belt through Godthåbsfjord, southern West Greenland: A continent-continent collision zone? Bull. Geol. Soc. Den. 1991, 39, 179–197. [Google Scholar]
- Crowley, J.L. Testing the model of late Archean terrane accretion in southern West Greenland: A comparison of timing of geological events across the Qarliit Nunaat fault, Buksefjorden region. Precambrian Res. 2002, 116, 57–79. [Google Scholar] [CrossRef]
- Schiøtte, L.; Compston, W.; Bridgwater, D. U-Pb single-zircon age for the Tinissaq gneiss of southern West Greenland: A controversy resolved. Chem. Geol. 1989, 79, 21–30. [Google Scholar] [CrossRef]
- Næraa, T.; Scherstén, A. New zircon ages from the Tasiusarsuaq terrane, southern West Greenland. Geol. Surv. Den. Greenl. Bull. 2008, 15, 77–80. [Google Scholar]
- Næraa, T.; Scherstén, A.; Rosing, M.T.; Kemp, A.I.S.; Hoffmann, J.E.; Kokfelt, T.F.; Whitehouse, M. Hafnium isotope evidence for a transition in the geodynamics of continental growth after 3.2 Ga. Nature 2012, 485, 627–631. [Google Scholar] [CrossRef] [PubMed]
- Huang, H.; Polat, A.; Fryer, B.J. Origin of Archean tonalite–trondhjemite–granodiorite (TTG) suites and granites in the Fiskenæsset region, southern West Greenland: Implications for continental growth. Gondwana Res. 2012, 23, 452–470. [Google Scholar] [CrossRef]
- Kolb, J.; Kokfelt, T.F.; Dziggel, A. Geodynamic setting and deformation history of an Archaean terrane at mid-crustal level: The Tasiusarsuaq terrane of southern West Greenland. Precambrian Res. 2012, 212–213, 34–56. [Google Scholar] [CrossRef]
- Keulen, N.; Schumacher, J.C.; Næraa, T.; Kokfelt, T.F.; Scherstén, A.; Szilas, K.; van Hinsberg, V.J.; Schlatter, D.M.; Windley, B.F. Meso- and Neoarchaean geological history of the Bjørnesund and Ravns Storø Supracrustal Belts, southern West Greenland: Settings for gold enrichment and corundum formation. Precambrian Res. 2014, 254, 36–58. [Google Scholar] [CrossRef]
- Kokfelt, T.F.; Keulen, N.; Heijboer, T.C.; Næraa, T.; Scherstén, A. Thematic age distribution maps of the Archaean basement of southern West Greenland. Rapp. Grønlands Geol. Unders. 2010, 58, 23–25. [Google Scholar]
- Dziggle, A.; Diener, J.F.A.; Kolb, J.; Kokfelt, T.F. Metamorphic record of accretionary processes during the Neoarchaean: The Nuuk region, southern West Greenland. Precambrian Res. 2014, 242, 22–38. [Google Scholar] [CrossRef]
- Myers, J.S. Granitoid sheets, thrusting, and Archean crustal thickening in West Greenland. Geology 1976, 4, 265–268. [Google Scholar] [CrossRef]
- Hoffmann, J.E.; Svahnberg, H.; Piazolo, S.; Scherstén, A.; Münker, C. The geodynamic evolution of Mesoarchean anorthosite complexes inferred from the Naajat Kuuat Complex, southern West Greenland. Precambrian Res. 2012, 196–197, 149–170. [Google Scholar] [CrossRef]
- Souders, A.K.; Sylvester, P.J.; Myers, J.S. Mantle and crustal sources of Archean anorthosite: A combined in situ isotopic study of Pb–Pb in plagioclase and Lu–Hf in zircon. Contrib. Mineral. Petrol. 2013, 165, 1–24. [Google Scholar] [CrossRef]
- Escher, J.C.; Pulvertaft, T.C.R. Geological Map of Greenland, 1:2,500,000; Geological Survey of Greenland: Copenhagen, Denmark, 1995. [Google Scholar]
- Hall, R.P. The Precambrian Geology of the Kangangup Tasia Area, Fiskenæsset, Southern West Greenland. Master’s Thesis, Council for National Academic Awards at Portsmouth Polytechnic, Portsmouth, UK, 1977. [Google Scholar]
- Gerdes, A.; Zeh, A. Combined U–Pb and Hf isotope LA-(MC)-ICP-MS analyses of detrital zircons: Comparison with SHRIMP and new constraints for the provenance and age of an Armorican metasediment in Central Germany. Earth Planet. Sci. Lett. 2006, 249, 47–61. [Google Scholar] [CrossRef]
- Frei, D.; Gerdes, A. Precise and accurate in situ U–Pb dating of zircon with high sample throughput by automated LA-SF-ICP-MS. Chem. Geol. 2009, 261, 261–270. [Google Scholar] [CrossRef]
- Kemp, A.I.S.; Foster, G.L.; Schersten, A.; Whitehouse, M.J.; Darling, J.; Storey, C. Concurrent Pb–Hf isotope analysis of zircon by laser ablation multi-collector ICP-MS, with implications for the crustal evolution of Greenland and the Himalayas. Chem. Geol. 2009, 261, 244–260. [Google Scholar] [CrossRef]
- Bouvier, A.; Vervoort, J.D.; Patchett, P.J. The Lu–Hf and Sm–Nd isotopic composition of CHUR: Constraints from unequilibrated chondrites and implications for the bulk composition of terrestrial planets. Earth Planet. Sci. Lett. 2008, 273, 48–57. [Google Scholar] [CrossRef]
- Scherer, E.; Munker, C.; Mezger, K. Calibration of the lutetium-hafnium clock. Science 2001, 293, 683–687. [Google Scholar] [CrossRef] [PubMed]
- Söderlund, U.; Patchett, J.P.; Vervoort, J.D.; Isachsen, C.E. The 176Lu decay constant determined by Lu-Hf and U-Pb isotope systematics of Precambrian mafic intrusions. Earth Planet. Sci. Lett. 2004, 219, 311–324. [Google Scholar] [CrossRef]
- Nemchin, A.A.; Whitehouse, M.J.; Pidgeon, R.T.; Meyer, C. Oxygen isotopic signature of 4.4–3.9 Ga zircons as a monitor of differentiation processes on the Moon. Geochim. Cosmochim. Acta 2006, 70, 1864–1872. [Google Scholar] [CrossRef]
- Whitehouse, M.J.; Nemchin, A.A. High precision, high accuracy measurement of oxygen isotopes in large lunar zircon by SIMS. Chem. Geol. 2009, 261, 32–42. [Google Scholar] [CrossRef]
- Wiedenbeck, M.; Hanchar, J.M.; Peck, W.H.; Sylvester, P.; Valley, J.; Whitehouse, M.; Kronz, A.; Morishita, Y.; Nasdala, L.; Fiebig, J. Further characterisation of the 91500 zircon crystal. Geostand. Geoanal. Res. 2007, 28, 9–39. [Google Scholar] [CrossRef]
- Frost, C.D.; Frost, B.R. On Ferroan (A-type) Granitoids: Their Compositional Variability and Modes of Origin. J. Petrol. 2011, 52, 39–53. [Google Scholar] [CrossRef]
- Sun, S.; McDonough, W.F. Chemical and isotopic systematics of oceanic basalts: Implications for mantle composition and processes. In Magmatism in the Ocean Basins; Saunders, A.D., Norry, M.J., Eds.; Geological Society of London: London, UK, 1989; Volume 42, pp. 313–345. [Google Scholar]
- Boynton, W.V. Cosmochemistry of the rare earth elements: Meteoritic studies. In Rare Earth Elements Geochemistry; Henderson, P., Ed.; Elsevier: Amsterdam, The Netherlands, 1984; pp. 63–114. [Google Scholar]
- Szilas, K.; Hoffmann, J.E.; Scherstén, A.; Rosing, M.T.; Windley, B.F.; Kokfelt, T.F.; Keulen, N.; van Hinsberg, V.J.; Næraa, T.; Frei, R.; et al. Complex calc-alkaline volcanism recorded in Mesoarchaean supracrustal belts north of Frederikshåb Isblink, southern West Greenland: Implications for subduction zone processes in the early Earth. Precambrian Res. 2012, 208–211, 90–123. [Google Scholar] [CrossRef]
- Ludwig, K.R. Isoplot/Ex Rev. 3.75; Berkeley Geochronology Centre: Berkeley, CA, USA, 2012; Volume 5. [Google Scholar]
- Szilas, K.; Hoffmann, J.E.; Scherstén, A.; Kokfelt, T.F.; Münker, C. Archaean andesite petrogenesis: Insights from the Grædefjord Supracrustal Belt, southern West Greenland. Precambrian Res. 2013, 236, 1–15. [Google Scholar] [CrossRef]
- Duchesne, J.-C.; Wilmart, E. Igneous charnockites and related rocks from the Bjerkreim–Sokndal layered intrusion (Southwest Norway): A jotunite (hypersthene monzodiorite)-derived A-type granitoid suite. J. Petrol. 1997, 38, 337–369. [Google Scholar] [CrossRef]
- Hoffmann, J.E.; Münker, C.; Næraa, T.; Rosing, M.T.; Herwartz, D.; Garbe-Schönberg, D.; Svahnberg, H. Mechanisms of Archean crust formation inferred from high precision HFSE systematics in TTGs. Geochim. Cosmochim. Acta 2011, 75, 4157–4178. [Google Scholar] [CrossRef]
- Pearce, J.A.; Nigel, B.W.; Tindle, A.G. Trace Element Discrimination Diagrams for the Tectonic Interpretation of Granitic Rocks. J. Petrol. 1984, 25, 956–983. [Google Scholar] [CrossRef] [Green Version]
- Collins, W.J.; Beams, D.; White, J.R.; Chappell, B.W. Nature and origin of A-type granites with particular reference to South-Eastern Australia. Contrib. Mineral. Petrol. 1982, 80, 189–200. [Google Scholar] [CrossRef]
- Whalen, J.B.; Currie, K.L.; Chappell, B.W. A-type granites: Geochemical characteristics, discrimination and petrogenesis. Contrib. Mineral. Petrol. 1987, 95, 407–419. [Google Scholar] [CrossRef]
- Creaser, R.A.; Price, R.C.; Wormald, R.J. A-type granites revisited: Assessment of a residual-source model. Geology 1991, 19, 163–166. [Google Scholar] [CrossRef]
- King, P.L.; Chappell, B.W.; Allen, C.M.; White, A.J.R. Are A-type granites the high-temperature felsic granites? Evidence from fractionated granites of the Wangrah suite. Aust. J. Earth Sci. 2001, 48, 501–514. [Google Scholar] [CrossRef]
- Moyen, J.-F.; Stevens, G. Experimental constraints in TTG petrogenesis: Implications for Archean geodynamics. In Archean Geodynamics and Environments; American Geophysical Union Monographs Series; Benn, K., Mareschal, J.-C., Condie, K.C., Eds.; American Geophysical Union (AGU): Washington, DC, USA, 2006; pp. 149–178. [Google Scholar]
- Watson, E.B.; Harrison, T.M. Zircon saturation revisited temperature and composition effects in a variety of crustal magma types. Earth Planet. Sci. Lett. 1983, 64, 295–304. [Google Scholar] [CrossRef]
- Ferry, J.M.; Watson, E.B. New thermodynamic models and revised calibrations for the Ti-in-zircon and Zr-in-rutile thermometers. Contrib. Mineral. Petrol. 2007, 154, 429–437. [Google Scholar] [CrossRef]
- Harrison, T.M.; Watson, E.B. The behavior of apatite during crustal anataxis: Equilibrium and kinetic considerations. Geochim. Cosmochim. Acta 1984, 48, 1467–1477. [Google Scholar] [CrossRef]
Figure 1.
Simplified geological map of a section of the Archaean basement in southern West Greenland, where Ilivertalik intrusive complex (IIC) outcrops within the Tasiusarsuaq terrane (TT). As seen in the insert, IIC outcrop as isoclinal folded [22]. Anorthosites of the Fiskenæsset Complex (FC) are situated just south of the main IIC intrusion. Another belt of anorthosites, found at the northern limit of TT, includes the Nunataarsuk (NU) and the Annjat Kuuat (AK) anorthosite complexes which are also of similar age as FC [23,24]. Map is modified from [25].

Figure 2.
Field images illustrating characteristic textures from the Ilivertalik Intrusive Complex. (A) Out-crop relation between sample 484645 (upper left part of image) and sample 484644 lower right part of image) the brown alteration colour is characteristic of pyroxene bearing units. The sharp crosscutting the S-L textures in the granite, suggest that retrogression into amphibolite facies occurred after ductile deformation overprinting. (B) Characteristic feldspar clastic granite unit. (C) Texture of a dioritic unit (equivalent to sample 508204). (D) Lineated granodiorite (equivalent to sample 468689).

Figure 3.
Textural relationships of zircon grains. (A,B) Zircon grain in relation to ilmenite, magnetite, apatite and hornblende (sample 468691). (C,D) partly dissolved zircon grain (sample 468691). (E,F) Zircon grain situated with strongly altered cpx grain. At the border zone toward the ilmenite, the zircon grain seems to be overgrown with a small rim (sample 484644).

Figure 4.
Major element chemistry plotted in Haker diagrams. It can be noticed that MgO, Fe2O3, CaO, TiO2, P2O5 and Al2O3 contents display larger scatter for samples with SiO2 < 60 wt. % (Unit 1) compared to samples with SiO2 > 60 wt. % (Unit 2) that define tighter trends.
Figure 4.
Major element chemistry plotted in Haker diagrams. It can be noticed that MgO, Fe2O3, CaO, TiO2, P2O5 and Al2O3 contents display larger scatter for samples with SiO2 < 60 wt. % (Unit 1) compared to samples with SiO2 > 60 wt. % (Unit 2) that define tighter trends.

Figure 5.
Normalized trace element spider diagrams. The IIC samples divide into two groups, the main group includes diorites and the main part of the granites and outlier samples are indicated with stippled lines and are considered to have a different petrogenesis. (A) Chondrite-normalized REE spider diagram [37]. (B) Primitive mantle normalized trace element spider diagram including REE, HFSE and LILE [38]. Average regional TTG compositions are shown for reference [39].

Figure 6.
Zircon BSE images of selected representative grains. (A) Grains with core-rim domains. The core in the left grain is growth zoned whereas the right grain has a strongly altered core. The rim in both grains is BSE bright and homogeneous. (B) Zircon grain dominated by diffuse growth zoning. (C,D) Grains with irregular homogeneous domains. (E) Grain with an altered core, the alteration is focused into a zone separating the core from the rim, very bright zones are ZrO2 (baddeleyite). (F) Grains mainly with diffuse growth zoning but the upper part of right grain also displays homogeneous domains with irregular boundaries. (G) Grain with core-rim domains. The left grain displays a diffuse boundary between core and rim. The right grains are divided into core and two rim domains with different BSE intensity, the inner core is strongly altered. (H,I) Diffuse growth zoning. (J) Homogeneous rim like domain is observed in the right site of the domain that also displays a wavy grain edge, diffuse zoning dominates the right part of the grain.

Figure 7.
Zircon U-Pb Concordia diagrams. Mean ages in Ma are calculated as the weighted mean 207Pb/206Pb age. All samples have one main age population at ca. 2790 to 2800 Ma. Few inherited grains are observed in sample 468682. Error ellipses are on a 2 sigma level. Plotting ad calculations has been bone by Isoplot [40].

Figure 8.
Zircon εHf versus age diagram. (A) Each sample display limited Hf isotope variations, only sample 515745 mix toward a less radiogenic Hf isotope composition. (B) IIC data are plotted together with zircon data from regional Mesoarchaean TTG gneisses (shaded triangles) and detrital zircon (white squared) [16] and zircon data from Fiskenæsset complex and whr. Lu-Hf data from meta-volcanic and supracrustal belts [24,41]. The shaded grey area represents the possible source region of IIC from a felsic and mafic crust, our preferred interpretation is a mafic source region.

Figure 9.
Age versus SiO2 for the dated samples that are presented in this study. Error bars are on a 2 sigma level. The shaded area reflects the interpreted minimum age of the intrusion, ca. 2785–2805 Ma.
Figure 9.
Age versus SiO2 for the dated samples that are presented in this study. Error bars are on a 2 sigma level. The shaded area reflects the interpreted minimum age of the intrusion, ca. 2785–2805 Ma.

Figure 10.
(A,B) Discrimination diagrams from [45]. IIC rocks plot close to the boundary between volcanic arc granites (VAG) and within-plate granites (WPG). ORG: oceanic ridge granites; syn-COLG: collision granites.
Figure 10.
(A,B) Discrimination diagrams from [45]. IIC rocks plot close to the boundary between volcanic arc granites (VAG) and within-plate granites (WPG). ORG: oceanic ridge granites; syn-COLG: collision granites.

Figure 11.
Zirconium and apatite saturation temperatures plotted against SiO2. There is a very clear temperature difference between the two saturation temperatures which suggests that zirconium was never saturated at high magma temperatures.
Figure 11.
Zirconium and apatite saturation temperatures plotted against SiO2. There is a very clear temperature difference between the two saturation temperatures which suggests that zirconium was never saturated at high magma temperatures.

© 2018 by the authors. Licensee MDPI, Basel, Switzerland. This article is an open access article distributed under the terms and conditions of the Creative Commons Attribution (CC BY) license (http://creativecommons.org/licenses/by/4.0/).
Share and Cite
MDPI and ACS Style
Næraa, T.; Kokfelt, T.F.; Scherstén, A.; Petersson, A. The ca. 2785–2805 Ma High Temperature Ilivertalik Intrusive Complex of Southern West Greenland. Geosciences 2018, 8, 319. https://doi.org/10.3390/geosciences8090319
AMA Style
Næraa T, Kokfelt TF, Scherstén A, Petersson A. The ca. 2785–2805 Ma High Temperature Ilivertalik Intrusive Complex of Southern West Greenland. Geosciences. 2018; 8(9):319. https://doi.org/10.3390/geosciences8090319
Chicago/Turabian StyleNæraa, Tomas, Thomas F. Kokfelt, Anders Scherstén, and Andreas Petersson. 2018. "The ca. 2785–2805 Ma High Temperature Ilivertalik Intrusive Complex of Southern West Greenland" Geosciences 8, no. 9: 319. https://doi.org/10.3390/geosciences8090319
Note that from the first issue of 2016, this journal uses article numbers instead of page numbers. See further details here.